pulmonary crackle characterization: approaches in the use of discrete wavelet ...€¦ · ·...
TRANSCRIPT
Original ArticleDOI: http://dx.doi.org/10.1590/2446-4740.0639
*e-mail: [email protected]: 13 August 2014 / Accepted: 11 May 2015
Pulmonary crackle characterization: approaches in the use of discrete wavelet transform regarding border effect, mother-wavelet selection, and subband reduction
Verônica Isabela Quandt*, Edras Reily Pacola, Sérgio Francisco Pichorim, Humberto Remigio Gamba, Miguel Antônio Sovierzoski
Abstract Introduction: Crackles are discontinuous, non-stationary respiratory sounds and can be characterized by their duration and frequency. In the literature, many techniques of filtering, feature extraction, and classification were presented. Although the discrete wavelet transform (DWT) is a well-known tool in this area, issues like signal border extension, mother-wavelet selection, and its subbands were not properly discussed. Methods: In this work, 30 different mother-wavelets 8 subbands were assessed, and 9 border extension modes were evaluated. The evaluations were done based on the energy representation of the crackle considering the mother-wavelet and the border extension, allowing a reduction of not representative subbands. Results: Tests revealed that the border extension mode considered during the DWT affects crackle characterization, whereas SP1 (Smooth-Padding of order 1) and ASYMW (Antisymmetric-Padding (whole-point)) modes shall not be used. After DWT, only 3 subbands (D3, D4, and D5) were needed to characterize crackles. Finally, from the group of mother-wavelets tested, Daubechies 7 and Symlet 7 were found to be the most adequate for crackle characterization. Discussion: DWT can be used to characterize crackles when proper border extension mode, mother-wavelet, and subbands are taken into account.Keywords: Crackles, Border extension, Discrete Wavelet Transform, Mother-wavelet.
IntroductionChest auscultation is used as an auxiliary method in
evaluating cardiorespiratory dysfunctions. It is a fast, efficient, non-invasive, and inexpensive examination. The conventional chest auscultation with a stethoscope to identify respiratory crackles is subjective, thus many physicians rely on other methods to evaluate the pulmonary status of their patients (Lehrer, 2002). Objective analysis of respiratory sounds is being done since the 1970’s with the development of capacitive microphones with low distortion amplifiers and accurate signal filtering techniques (Jones, 1995). Reichert et al. (2008) described most of the researchers that have been proposing methods to analyze, identify, detect, and characterize respiratory sounds using computational applications for digital signal processing with time and frequency domain tools.
Crackles are present in some cardiorespiratory diseases such as pulmonary fibrosis, chronic obstructive pulmonary disease (COPD), bronchiectasis, pneumonia, asbestosis, and asthma (Lehrer, 2002; Sovijarvi et al., 2000a). Crackles are classified as discontinuous adventitious respiratory sounds that are explosive and transient. They are assumed to be originating from the acoustic energy generated in the lungs
during pressure equalization or from a fast pressure equalization after a sudden opening of abnormally closed airways (Sovijarvi et al., 2000a). Crackles have a duration of less than 20 ms and their frequency ranges from 100 to 2,000 Hz. They can be classified as fine, medium, or coarse crackles, based on the parameters 2CD (two-cycle duration) and IDW (initial deflection width) initially introduced and defined by Murphy et al. (1977). Although this classification is used by many authors, there has been no agreement about the 2CD and IDW values, as presented in Table 1 (ACCP-ATS, 1977; Hoevers and Loudon, 1990; Munakata et al., 1991; Murphy et al., 1977; Sovijarvi et al., 2000a; Yeginer and Kahya, 2010). The CORSA (Computerized Respiratory Sound Analysis) project of the European Respiratory Society also established guidelines for the investigation of and clinical practice on respiratory sounds (Sovijarvi et al., 2000b).
Many authors have presented different respiratory crackles filtering (Hadjileontiadis and Panas, 1997; Mastorocostas et al., 2000; Sankur et al., 1996; Tolias et al., 1997), feature extraction (Charleston-Villalobos et al., 2007; Ponte et al., 2013; Yeginer and Kahya, 2009; Yeginer and Kahya, 2010),
Volume 31, Number 2, p. 148-159, 2015
DWT for crackle characterization
and classification techniques (Abbas and Fahim, 2010; Charleston-Villalobos et al., 2011; Chen and Chou, 2014; Dokur, 2009; Içer and Gengec, 2014; Kandaswamy et al., 2004; Lu and Bahoura, 2008; Pesu et al., 1998; Serbes et al., 2013; Xie et al., 2012; Yeginer and Kahya, 2005; Zhenzhen et al., 2012).
In the literature, related works show the diversity of techniques used in the analysis of respiratory sounds. For instance, Chen and Chou (2014) proposed a classifier combined with a back-propagation neural network and learning vector quantization (LVQ) in classifying six classes of respiratory sounds using 6 subbands of DWT. They selected Daubechies 8 as the most efficient mother-wavelet for this respiratory sound classification using the neural network results. Içer and Gengec (2014) came up with feature extraction and classification of crackles and rhonchi using the Welch method, the Hilbert Huang transform, the singular spectrum analysis method, and the support vector machine technique. Ponte et al. (2013) characterized crackles by obtaining their maximum frequency by applying discrete pseudo Wigner-Ville distribution. Serbes et al. (2013) extracted various feature sets and classified crackles using dual-tree complex wavelet transform, SVM, k-nearest neighbor (kNN), and multilayer perceptron (MLP). Zhenzhen et al. (2012) proposed a time-domain processing method to extract features of crackles based on the Fractional Hilbert Transform theories. Kandaswamy et al. (2004) proposed a respiratory sound classifier using MLP neural network with the DWT coefficients. They chose Daubechies 8 mother-wavelet by comparing the neural network performance in classifying the respiratory sounds.
Studies that performed crackles feature extraction or characterization using DWT did not comment or take into account the border effect. Moreover, an objective method for selecting the best mother-wavelet that fits crackles was not found in the literature. Furthermore, there is no agreement among authors on the number of DWT subbands that better characterizes crackles.
In this paper we propose a new method to characterize crackles using DWT. We present the results we obtained from studies that applied the
DWT on crackles, including analysis of 30 different mother-wavelets, 8 subbands, and the effect of 9 different border extension modes.
Methods
Signal database
Respiratory signal audio files containing crackles were obtained from 2 public repositories (Fraser, 1999; Lehrer, 2002). Initially, the audio files (originally sampled at 11,128 Hz and 44,100 Hz, respectively) were normalized and resampled at 8 kHz to avoid the results of the DWT from changing with different signals. From these 2 databases, 100 crackles were isolated using a custom-made signal processing software developed in Java. Considering that a respiratory crackle event lasts at most 20 ms (Sovijarvi et al., 2000b), segments of 40 ms, containing one respiratory crackle event each, as centered as possible, were selected. Ten crackles were visually selected as gold-standard and were used for crackle characterization and to assess the best mother-wavelet. The gold-standard selection was based on crackle structure measurements found in the literature (Hoevers and Loudon, 1990; Munakata et al., 1991), considering waveforms with reduced noise interference, and similarity to idealized and simulated crackle waveforms found in the literature (Du et al., 1997; Kiyokawa et al., 2001).
We used the idealized crackle waveform suggested by Du et al. (1997) to assess the Pearson’s correlation criteria. This waveform is ruled by Equation 1, with a1=0.5; a2=1.49; a3=0.78; and f0=2.0.
( ) ( )31 2 /0( ) sin 2 t aa ag t f t t e−= π ⋅ ⋅ ⋅ ⋅ (1)
Criteria for mother-wavelet selection
The DWT decomposes a signal into approximation and detail coefficients. Approximation coefficients are the low-frequency signal components. Detail coefficients are the high-frequency signal components (Mallat, 2009).
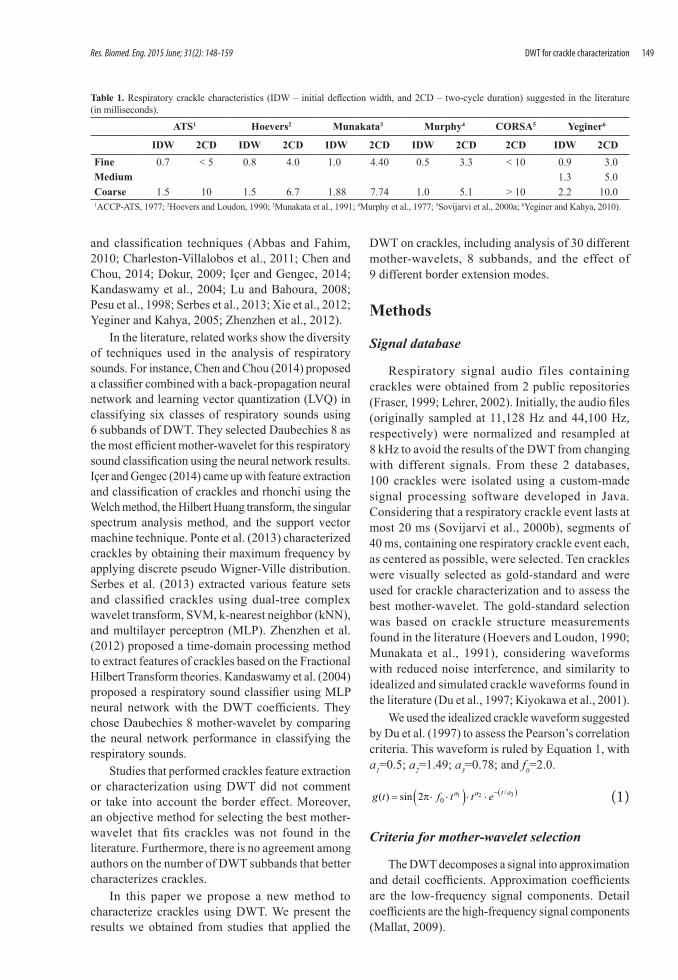
Table 1. Respiratory crackle characteristics (IDW – initial deflection width, and 2CD – two-cycle duration) suggested in the literature (in milliseconds).
ATS1 Hoevers2 Munakata3 Murphy4 CORSA5 Yeginer6
IDW 2CD IDW 2CD IDW 2CD IDW 2CD 2CD IDW 2CDFine 0.7 < 5 0.8 4.0 1.0 4.40 0.5 3.3 < 10 0.9 3.0Medium 1.3 5.0Coarse 1.5 10 1.5 6.7 1.88 7.74 1.0 5.1 > 10 2.2 10.01ACCP-ATS, 1977; 2Hoevers and Loudon, 1990; 3Munakata et al., 1991; 4Murphy et al., 1977; 5Sovijarvi et al., 2000a; 6Yeginer and Kahya, 2010).
149Res. Biomed. Eng. 2015 June; 31(2): 148-159
Quandt VI, Pacola ER, Pichorim SF, Gamba HR, Sovierzoski MA
The following 30 mother-wavelets were assessed:
• Biorthogonal 2.8, 6.8 (Bior28, Bior68);
• Coiflet 3 (Coif03);
• Daubechies 5, 6, 7, 8, 9, 10, 11, 12 (Daub05,...,Daub12);
• Reverse Biorthogonal 3.5, 3.7, 3.9, 5.5, 6.8 (RBior35, RBior37, RBior39, RBior55, RBior68); and
• Symlet 5, 7, 9, 10, 11, 12, 13, 14, 15, 16, 17, 18, 19, 20 (Sym05, Sym07, Sym09, ..., Sym20).
Details about these mother-wavelets are available in Misiti et al. (2013).
These mother-wavelets were selected based on visual similarity between the mother-wavelet function and the crackle signal. The selection also considered their use by other authors when applying DWT in crackles (Hadjileontiadis et al., 1998; Sankur et al., 1996) or in respiratory sounds containing crackles (Chen and Chou, 2014; Kandaswamy et al., 2004; Riella et al., 2009).
The number of subbands used was based on the dominant frequency components of the crackle (100 to 2,000 Hz), with the signal sampled at 8 kHz. Thus, crackle signals were decomposed in 8 subbands, as follows: D1 (2,000 to 4,000 Hz), D2 (1,000 to 2,000 Hz), D3 (500 to 1,000 Hz), D4 (250 to 500 Hz), D5 (125 to 250 Hz), D6 (62.5 to 125 Hz), D7 (31.25 to 62.5 Hz), and D8 (15.625 to 31.25 Hz).
To assess the resemblance between a crackle signal, X, and a specific mother-wavelet, Y, the Pearson’s correlation coefficient was used. This coefficient is presented by Equation 2.
,( , )
x yX Y
COV X Yρ =
σ σ (2)
The coefficient ρX,Y assesses the correlation between X and Y in the qualitative sub-division (Callegari-Jacques, 2007):
• if 0.00 < |ρ| < 0.30, there is a weak linear correlation;
• if 0.30 ≤ |ρ| <0.60, there is a moderate linear correlation;
• if 0.60 ≤ |ρ| <0.90, there is a strong linear correlation;
• if 0.90 ≤ |ρ| <1.00, there is a very strong linear correlation.
Variable X is the crackle model defined by Du et al. (1997), variable Y is the mother-wavelet function translated in time.
Border extension in crackle characterizationThe algorithm of the DWT is based on convolution
and downsampling. In practice, to avoid signal distortions during the convolution calculation, the signal must be extended outside the convolution window to minimize errors during the DWT decomposition. This extended signal (i.e., border extension) is produced by an algorithm that computes extra coefficients at each stage of the decomposition process. This procedure also ensures a perfect reconstruction of the signal, when needed (Misiti et al., 2013).
The 9 extension modes assessed in this work are the following:
• Zero-Padding (ZPD): This method assumes that the signal outside the original support is zero. It is a simple scheme, but discontinuities may be present at the border.
• Smooth-Padding of order 0 (SP0) – Simple constant extrapolation: For the signal extension, this is the repetition of the first value on the left and the last value on the right.
• Smooth-Padding of order 1 (SP1) – Simple first-order difference extrapolation: At the right border of the original support, the last value minus the value before the last is taken as the reference value. The first new value at the right border is the reference value plus the last value. The next value is the reference value plus the next value and so on, always taking the same support value. For the left side, the opposite process is done.
• Symmetric-Padding (half-point) (SYMH) – Symmetric half-point replication: The border value is repeated. At the right border of the original support, the last value is repeated, and the next values from the right to left are used. For the left side, the opposite process is done.
• Symmetric-Padding (whole-point) (SYMW) – Symmetric whole-point replication: The border value is not repeated. At the right border of the original support, the value before the last value is repeated, and the next values from the right to left are used. For the left side, the opposite process is done.
• Antisymmetric-Padding (half-point) (ASYMH): This is similar to Symmetric-Padding (half-
150 Res. Biomed. Eng. 2015 June; 31(2): 148-159
DWT for crackle characterization
point) but changing the signal of the border values.
• Antisymmetric-Padding (whole-point) (ASYMW): At the right border of the original support, the last value multiplied by 2 is taken as the reference value. The first new value at the right border is the reference value minus the value before the last value of the original support and so on, always taking the same support value. For the left side, the opposite process is done.
• Periodic-Padding 1 (PPD): This is the periodic extension of the original support and may create discontinuities at the border.
• Periodic-Padding 2 (PER): If the signal length is odd, the signal is first extended by adding a value equal to the last value at the right. In this case the resulting signal is one value longer than in the other extensions.
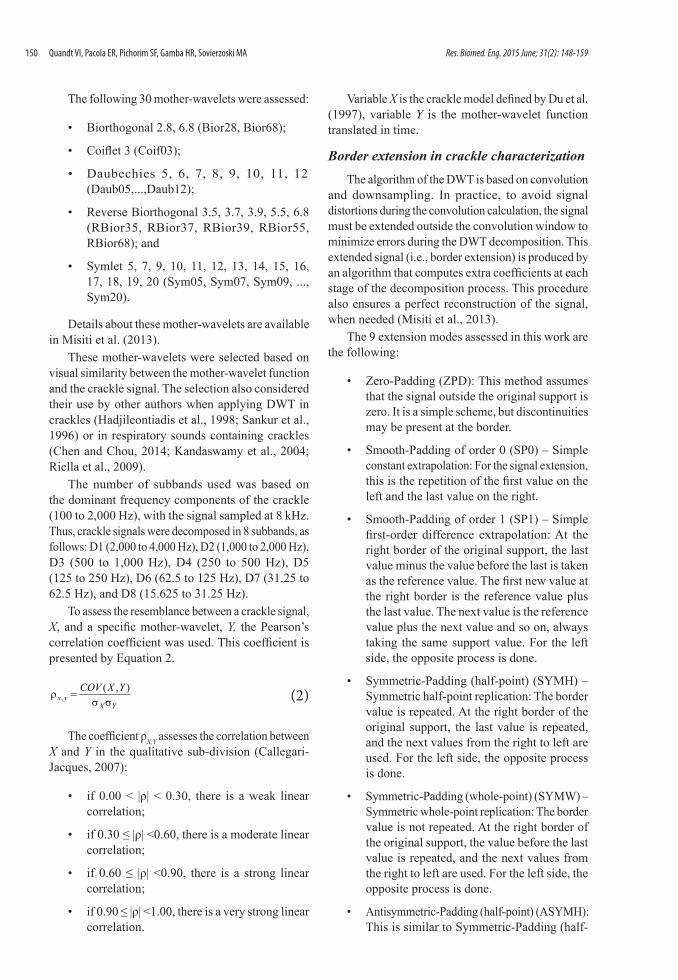
Figure 1 illustrates the border extension of a hypothetic signal. The hypothetic signal, Figure 1a, is formed by 33 samples, and extensions were made of 5 additional samples at each side of the signal.
According to Misiti et al. (2013), to deal with border distortion, it is necessary to take into account the method used to extend the decomposed signals.
Considering the extension mode in DWT applied to crackle feature extraction, to our knowledge, no work has been published yet.
Figure 1. Results of an (a) original signal extended with 9 different extension modes, (b) ZPD, (c) SP0, (d) SP1, (e) SYMH, (f) SYMW, (g) ASYMH, (h) ASYMW, (i) PPD, and (j) PER. Differences in the extended borders can be clearly noticed.
151Res. Biomed. Eng. 2015 June; 31(2): 148-159

Quandt VI, Pacola ER, Pichorim SF, Gamba HR, Sovierzoski MA
Crackle feature extractionIn this work, the total energy of each DWT subband
is considered as a feature for the crackle. However, in the process of energy calculation it is necessary to consider the number of samples of each subband. The number of samples in each DWT subband is approximately half of the preceding subband samples. The number of samples in each DWT subband is actually determined by the number of coefficients of the mother-wavelet and by the border extension mode used (Misiti et al., 2013).
The energy of each subband (E) is computed using Equation 3, where x[n] are the samples of the corresponding subband, and N is the number of samples of each subband.
2
0[ ]
N
nE x n
== ∑ (3)
The total energy on each subband is displayed as a percentage of the entire energy of all subbands.
Results
Distortions in wavelet decomposition due to border effect
To show the distortion caused by the use of a specific border extension mode during the feature extraction in crackle analysis, the gold-standard crackle
with 2CD = 6 ms was decomposed by Daubechies 6. Calculations were performed for all 9 signal extension modes. Figure 2 presents the 8 subbands used for each extension mode. These graphs show normalized energy values in each subband. Discrepancies in subband D8 can be observed in Figure 2f, where SP1 was used. Furthermore, it is noticeable that subband D4 concentrates the major part of the energy of a crackle.
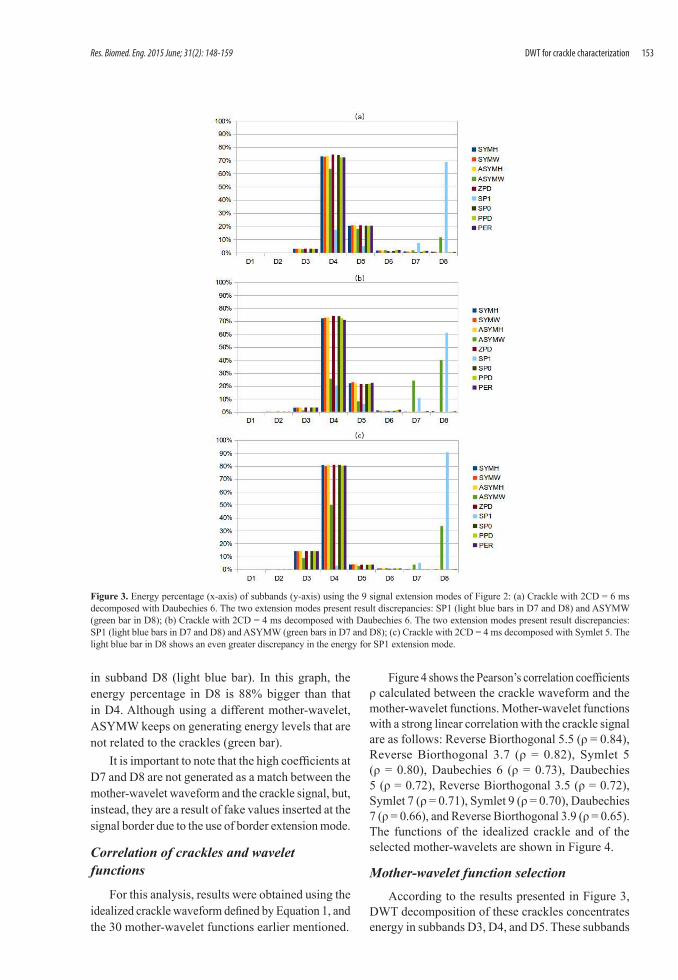
Figure 3a shows the total energy of the subbands of the crackle shown in Figure 2. In Figure 3, each bar color represents one of the nine extension modes. It can be seen that the use of SP1 extension mode created abnormal features in subbands D7 and D8 (light blue bars) that are not related to the crackle itself. The SP1 energy percentage in subband D8 is 51% bigger than that in subband D4. ASYMW also created abnormal energy in subband D8 (green bar). Other extension modes generated less than 1% of the total energy in subband D8.
Figure 3b shows the results using the gold-standard crackle with 2CD = 4 ms. In using the SP1 extension mode, the energy percentage in subband D8 is 41% bigger than that in subband D4 (light blue bar). Using ASYMW, the energy percentage in subband D8 is 14% bigger than that in subband D4. Finally, D7 and D4 have similar energy percentages (green bar).
Figure 3c was generated using Symlet 5, as the mother-wavelet, and the gold-standard crackle with 2CD = 4 ms. The same behavior is present for SP1
Figure 2. DWT decompositions of the 9 types of borders of a crackle with 2CD = 6 ms. Each graph shows the crackle and the 8 subbands (D1, …, D8) with Daubechies 6 and different border extension modes. The red points indicate the normalized energy of each sample. Observe that using (d) ASYMW and (f) SP1 border extension mode, subband D8 has high energies that can compromise the interpretation of results.
152 Res. Biomed. Eng. 2015 June; 31(2): 148-159
DWT for crackle characterization
in subband D8 (light blue bar). In this graph, the energy percentage in D8 is 88% bigger than that in D4. Although using a different mother-wavelet, ASYMW keeps on generating energy levels that are not related to the crackles (green bar).
It is important to note that the high coefficients at D7 and D8 are not generated as a match between the mother-wavelet waveform and the crackle signal, but, instead, they are a result of fake values inserted at the signal border due to the use of border extension mode.
Correlation of crackles and wavelet functions
For this analysis, results were obtained using the idealized crackle waveform defined by Equation 1, and the 30 mother-wavelet functions earlier mentioned.
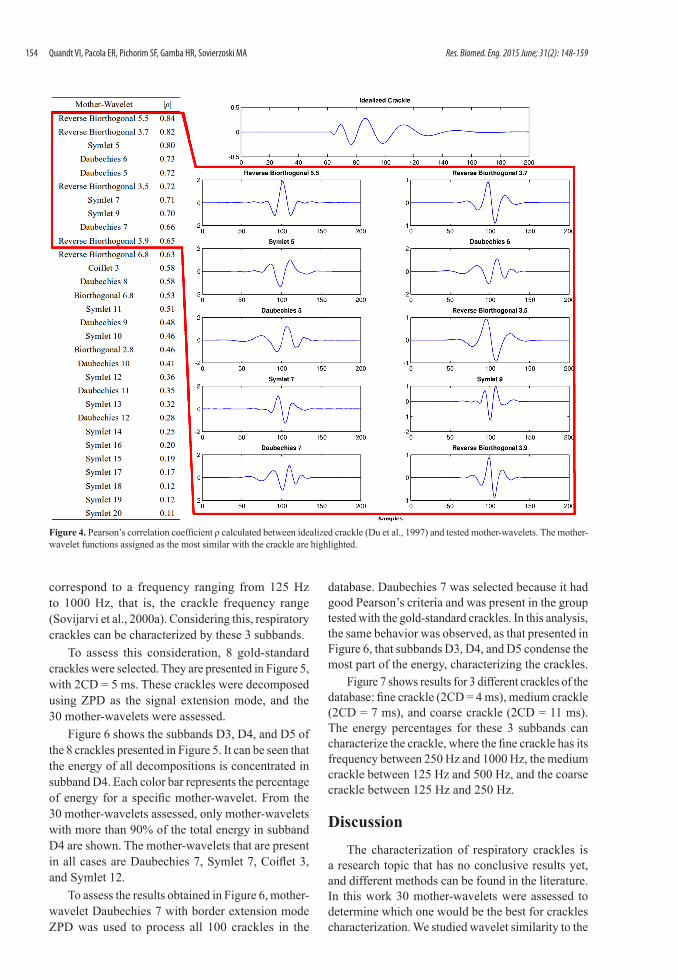
Figure 4 shows the Pearson’s correlation coefficients ρ calculated between the crackle waveform and the mother-wavelet functions. Mother-wavelet functions with a strong linear correlation with the crackle signal are as follows: Reverse Biorthogonal 5.5 (ρ = 0.84), Reverse Biorthogonal 3.7 (ρ = 0.82), Symlet 5 (ρ = 0.80), Daubechies 6 (ρ = 0.73), Daubechies 5 (ρ = 0.72), Reverse Biorthogonal 3.5 (ρ = 0.72), Symlet 7 (ρ = 0.71), Symlet 9 (ρ = 0.70), Daubechies 7 (ρ = 0.66), and Reverse Biorthogonal 3.9 (ρ = 0.65). The functions of the idealized crackle and of the selected mother-wavelets are shown in Figure 4.
Mother-wavelet function selectionAccording to the results presented in Figure 3,
DWT decomposition of these crackles concentrates energy in subbands D3, D4, and D5. These subbands
Figure 3. Energy percentage (x-axis) of subbands (y-axis) using the 9 signal extension modes of Figure 2: (a) Crackle with 2CD = 6 ms decomposed with Daubechies 6. The two extension modes present result discrepancies: SP1 (light blue bars in D7 and D8) and ASYMW (green bar in D8); (b) Crackle with 2CD = 4 ms decomposed with Daubechies 6. The two extension modes present result discrepancies: SP1 (light blue bars in D7 and D8) and ASYMW (green bars in D7 and D8); (c) Crackle with 2CD = 4 ms decomposed with Symlet 5. The light blue bar in D8 shows an even greater discrepancy in the energy for SP1 extension mode.
153Res. Biomed. Eng. 2015 June; 31(2): 148-159
Quandt VI, Pacola ER, Pichorim SF, Gamba HR, Sovierzoski MA
correspond to a frequency ranging from 125 Hz to 1000 Hz, that is, the crackle frequency range (Sovijarvi et al., 2000a). Considering this, respiratory crackles can be characterized by these 3 subbands.
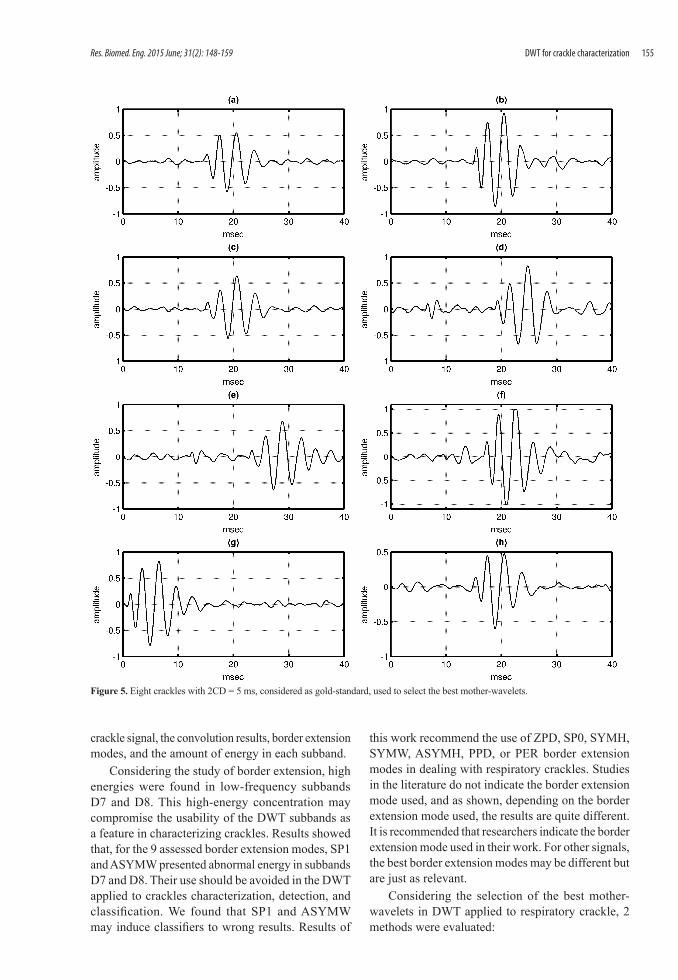
To assess this consideration, 8 gold-standard crackles were selected. They are presented in Figure 5, with 2CD = 5 ms. These crackles were decomposed using ZPD as the signal extension mode, and the 30 mother-wavelets were assessed.
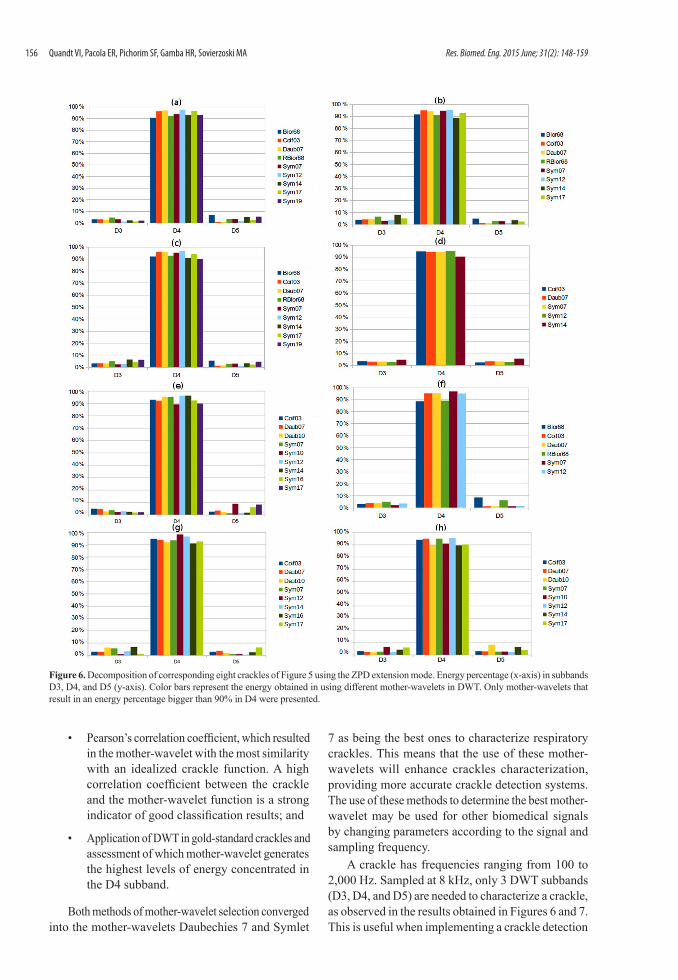
Figure 6 shows the subbands D3, D4, and D5 of the 8 crackles presented in Figure 5. It can be seen that the energy of all decompositions is concentrated in subband D4. Each color bar represents the percentage of energy for a specific mother-wavelet. From the 30 mother-wavelets assessed, only mother-wavelets with more than 90% of the total energy in subband D4 are shown. The mother-wavelets that are present in all cases are Daubechies 7, Symlet 7, Coiflet 3, and Symlet 12.
To assess the results obtained in Figure 6, mother-wavelet Daubechies 7 with border extension mode ZPD was used to process all 100 crackles in the
database. Daubechies 7 was selected because it had good Pearson’s criteria and was present in the group tested with the gold-standard crackles. In this analysis, the same behavior was observed, as that presented in Figure 6, that subbands D3, D4, and D5 condense the most part of the energy, characterizing the crackles.
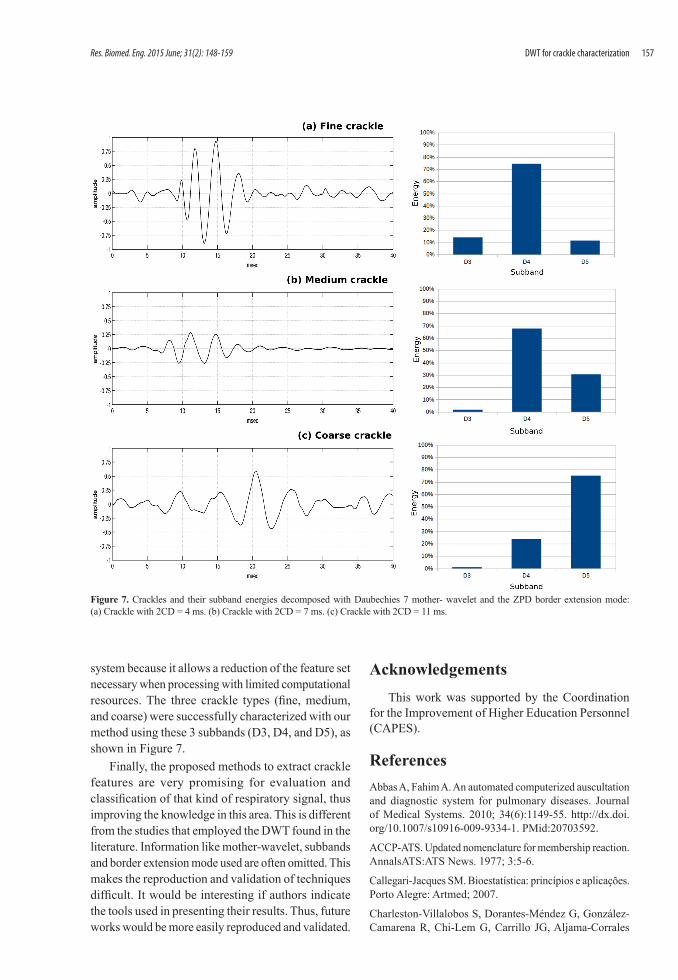
Figure 7 shows results for 3 different crackles of the database: fine crackle (2CD = 4 ms), medium crackle (2CD = 7 ms), and coarse crackle (2CD = 11 ms). The energy percentages for these 3 subbands can characterize the crackle, where the fine crackle has its frequency between 250 Hz and 1000 Hz, the medium crackle between 125 Hz and 500 Hz, and the coarse crackle between 125 Hz and 250 Hz.
DiscussionThe characterization of respiratory crackles is
a research topic that has no conclusive results yet, and different methods can be found in the literature. In this work 30 mother-wavelets were assessed to determine which one would be the best for crackles characterization. We studied wavelet similarity to the
Figure 4. Pearson’s correlation coefficient ρ calculated between idealized crackle (Du et al., 1997) and tested mother-wavelets. The mother-wavelet functions assigned as the most similar with the crackle are highlighted.
154 Res. Biomed. Eng. 2015 June; 31(2): 148-159
DWT for crackle characterization
crackle signal, the convolution results, border extension modes, and the amount of energy in each subband.
Considering the study of border extension, high energies were found in low-frequency subbands D7 and D8. This high-energy concentration may compromise the usability of the DWT subbands as a feature in characterizing crackles. Results showed that, for the 9 assessed border extension modes, SP1 and ASYMW presented abnormal energy in subbands D7 and D8. Their use should be avoided in the DWT applied to crackles characterization, detection, and classification. We found that SP1 and ASYMW may induce classifiers to wrong results. Results of
this work recommend the use of ZPD, SP0, SYMH, SYMW, ASYMH, PPD, or PER border extension modes in dealing with respiratory crackles. Studies in the literature do not indicate the border extension mode used, and as shown, depending on the border extension mode used, the results are quite different. It is recommended that researchers indicate the border extension mode used in their work. For other signals, the best border extension modes may be different but are just as relevant.
Considering the selection of the best mother-wavelets in DWT applied to respiratory crackle, 2 methods were evaluated:
Figure 5. Eight crackles with 2CD = 5 ms, considered as gold-standard, used to select the best mother-wavelets.
155Res. Biomed. Eng. 2015 June; 31(2): 148-159
Quandt VI, Pacola ER, Pichorim SF, Gamba HR, Sovierzoski MA
• Pearson’s correlation coefficient, which resulted in the mother-wavelet with the most similarity with an idealized crackle function. A high correlation coefficient between the crackle and the mother-wavelet function is a strong indicator of good classification results; and
• Application of DWT in gold-standard crackles and assessment of which mother-wavelet generates the highest levels of energy concentrated in the D4 subband.
Both methods of mother-wavelet selection converged into the mother-wavelets Daubechies 7 and Symlet
7 as being the best ones to characterize respiratory crackles. This means that the use of these mother-wavelets will enhance crackles characterization, providing more accurate crackle detection systems. The use of these methods to determine the best mother-wavelet may be used for other biomedical signals by changing parameters according to the signal and sampling frequency.
A crackle has frequencies ranging from 100 to 2,000 Hz. Sampled at 8 kHz, only 3 DWT subbands (D3, D4, and D5) are needed to characterize a crackle, as observed in the results obtained in Figures 6 and 7. This is useful when implementing a crackle detection
Figure 6. Decomposition of corresponding eight crackles of Figure 5 using the ZPD extension mode. Energy percentage (x-axis) in subbands D3, D4, and D5 (y-axis). Color bars represent the energy obtained in using different mother-wavelets in DWT. Only mother-wavelets that result in an energy percentage bigger than 90% in D4 were presented.
156 Res. Biomed. Eng. 2015 June; 31(2): 148-159
DWT for crackle characterization
system because it allows a reduction of the feature set necessary when processing with limited computational resources. The three crackle types (fine, medium, and coarse) were successfully characterized with our method using these 3 subbands (D3, D4, and D5), as shown in Figure 7.
Finally, the proposed methods to extract crackle features are very promising for evaluation and classification of that kind of respiratory signal, thus improving the knowledge in this area. This is different from the studies that employed the DWT found in the literature. Information like mother-wavelet, subbands and border extension mode used are often omitted. This makes the reproduction and validation of techniques difficult. It would be interesting if authors indicate the tools used in presenting their results. Thus, future works would be more easily reproduced and validated.
AcknowledgementsThis work was supported by the Coordination
for the Improvement of Higher Education Personnel (CAPES).
ReferencesAbbas A, Fahim A. An automated computerized auscultation and diagnostic system for pulmonary diseases. Journal of Medical Systems. 2010; 34(6):1149-55. http://dx.doi.org/10.1007/s10916-009-9334-1. PMid:20703592.
ACCP-ATS. Updated nomenclature for membership reaction. AnnalsATS:ATS News. 1977; 3:5-6.
Callegari-Jacques SM. Bioestatística: princípios e aplicações. Porto Alegre: Artmed; 2007.
Charleston-Villalobos S, Dorantes-Méndez G, González-Camarena R, Chi-Lem G, Carrillo JG, Aljama-Corrales
Figure 7. Crackles and their subband energies decomposed with Daubechies 7 mother- wavelet and the ZPD border extension mode: (a) Crackle with 2CD = 4 ms. (b) Crackle with 2CD = 7 ms. (c) Crackle with 2CD = 11 ms.
157Res. Biomed. Eng. 2015 June; 31(2): 148-159
Quandt VI, Pacola ER, Pichorim SF, Gamba HR, Sovierzoski MA
T. Acoustic thoracic image of crackle sounds using linear and nonlinear processing techniques. Medical & Biological Engineering & Computing. 2011; 49(1):15-24. http://dx.doi.org/10.1007/s11517-010-0663-5. PMid:20652429.
Charleston-Villalobos S, González-Camarena R, Chi-Lem G, Aljama-Corrales T. Crackle sounds analysis by empirical mode decomposition. Nonlinear and nonstationary signal analysis for distinction of crackles in lung sounds. Engineering in Medicine and Biology Magazine. 2007; 26(1):40-7. http://dx.doi.org/10.1109/MEMB.2007.289120. PMid:17278771.
Chen MY, Chou CH. Applying cybernetic technology to diagnose human pulmonary sounds. Journal of Medical Systems. 2014; 38(6):58. http://dx.doi.org/10.1007/s10916-014-0058-5. PMid:24878780.
Dokur Z. Respiratory sound classification by using an incremental supervised neural network. Pattern Analysis & Applications. 2009; 12(4):309-19. http://dx.doi.org/10.1007/s10044-008-0125-y.
Du M, Chan F, Lam F, Sun J. Crackle detection and classification based on matched wavelet analysis. In: Proceedings – 19th International Conference – IEEE/EMBS; 1997 Oct. 30-Nov. 2; Chicago, IL. Chicago: IEEE; 1997. p. 1638-41.
Fraser D. IMD 420-C Review of lung sounds. Davis: School of Medicine, University of California; 1999. [accessed 2014 May 01]. Avaiable from: http://ebooknitha.blogspot.com.br/2014/02/review-of-lung-sounds.html.
Hadjileontiadis LJ, Panas SM. Separation of discontinuous adventitious sounds from vesicular sounds using a wavelet-based filter. IEEE Transactions on Biomedical Engineering. 1997; 44(12):1269-81. http://dx.doi.org/10.1109/10.649999. PMid:9401227.
Hadjileontiadis LJ, Patakas DA, Margaris NJ, Panas SM. Separation of crackles and squawks from vesicular sounds using a wavelet-based filtering technique. COMPEL – The International Journal for Computation and Mathematics in Electrical and Electronic Engineering. 1998; 17:649-57.
Hoevers J, Loudon RG. Measuring crackles. Chest. 1990; 98(5):1240-3. http://dx.doi.org/10.1378/chest.98.5.1240. PMid:2225972.
Içer S, Gengec S. Classification and analysis of non-stationary characteristics of crackle and rhonchus lung adventitious sounds. Digital Signal Processing. 2014; 28:18-27. http://dx.doi.org/10.1016/j.dsp.2014.02.001.
Jones A. A brief overview of the analysis of lung sounds. Physiotherapy. 1995; 81(1):37-42. http://dx.doi.org/10.1016/S0031-9406(05)67034-4.
Kandaswamy A, Kumar CS, Ramanathan RP, Jayaraman S, Malmurugan N. Neural classification of lung sounds using wavelet coefficients. Computers in Biology and Medicine. 2004; 34(6):523-37. http://dx.doi.org/10.1016/S0010-4825(03)00092-1. PMid:15265722.
Kiyokawa H, Greenberg M, Shirota K, Pasterkamp H. Auditory detection of simulated crackles in breath sounds. Chest. 2001; 119(6):1886-92. http://dx.doi.org/10.1378/chest.119.6.1886. PMid:11399719.
Lehrer S. Understanding lung sounds. 3rd. ed. Philadelphia: Saunders; 2002.
Lu X, Bahoura M. An integrated automated system for crackles extraction and classification. Biomedical Signal Processing and Control. 2008; 3(3):244-54. http://dx.doi.org/10.1016/j.bspc.2008.04.003.
Mallat S. A Wavelet tour of signal processing. 3rd. ed. Burlington: Academic Press; 2009.
Mastorocostas PA, Tolias YA, Theocharis JB, Hadjileontiadis LJ, Panas SM. An orthogonal least squares-based fuzzy filter for real-time analysis of lung sounds. IEEE Transactions on Biomedical Engineering. 2000; 47(9):1165-76. http://dx.doi.org/10.1109/10.867921. PMid:11008417.
Misiti M, Misiti Y, Oppenheim G, Poggi J. Wavelet toolbox – user’s guide. Natick: MathWorks; 2013.
Munakata M, Ukita H, Doi I, Ohtsuka Y, Masaki Y, Homma Y, Kawakami Y. Spectral and waveform characteristics of fine and coarse crackles. Thorax. 1991; 46(9):651-7. http://dx.doi.org/10.1136/thx.46.9.651. PMid:1948794.
Murphy RL Jr, Holford SK, Knowler WC. Visual lung-sound characterization by time-expanded wave-form analysis. The New England Journal of Medicine. 1977; 296(17):968-71. http://dx.doi.org/10.1056/NEJM197704282961704. PMid:846543.
Pesu L, Helistö P, Ademovic E, Pesquet J-C, Saarinen A, Sovijärvi ARA. Classification of respiratory sounds based on wavelet packet decomposition and learning vector quantization. Technology and Health Care: Official Journal of the European Society for Engineering and Medicine. 1998; 6(1):65-74. PMid:9754685.
Ponte DF, Moraes R, Hizume DC, Alencar AM. Characterization of crackles from patients with fibrosis, heart failure and pneumonia. Medical Engineering & Physics. 2013; 35(4):448-56. http://dx.doi.org/10.1016/j.medengphy.2012.06.009. PMid:22789810.
Reichert S, Gass R, Brandt C, Andrès E. Analysis of respiratory sounds: state of the art. Clinical Medicine. Circulatory, Respiratory and Pulmonary Medicine. 2008; 2:45-58. PMid:21157521.
Riella R, Nohama P, Maia J. Methodology for automatic classification of adventitious lung sounds. In: IFMBE Proceedings of the World Congress on Medical Physics and Biomedical Engineering; 2009 Sept 7-12; Munich, Germany. Munich: Springer; 2009. p. 1392-5.
Sankur B, Güler EC, Kahya YP. Multiresolution biological transient extraction applied to respiratory crackles. Computers in Biology and Medicine. 1996; 26(1):25-39. http://dx.doi.org/10.1016/0010-4825(95)00025-9. PMid:8654051.
Serbes G, Sakar CO, Kahya YP, Aydin N. Pulmonary crackle detection using time–frequency and time–scale analysis. Digital Signal Processing. 2013; 23(3):1012-21. http://dx.doi.org/10.1016/j.dsp.2012.12.009.
Sovijarvi A, Dalmasso F, Vanderschoot J, Malmberg L, Righini G, Stoneman S. Definition of terms for applications of respiratory sounds. European Respiratory Review. 2000a; 10:597-610.
158 Res. Biomed. Eng. 2015 June; 31(2): 148-159
DWT for crackle characterization
Sovijarvi A, Malmberg L, Charbonneau G, Vanderschoot J, Dalmasso F, Sacco C, Rossi M, Earis J. Characteristics of breath sounds and adventitious respiratory sounds. European Respiratory Review. 2000b; 10:591-6.
Tolias YA, Hadjileontiadis LJ, Panas SM. A fuzzy rule-based system for real-time separation of crackles from vesicular sounds. In: Proceedings of the 19th Annual International Conference of Engineering in Medicine and Biology Society; 1997 Oct 30 - Nov 2; Chicago, Illinois. Chicago: IEEE; 1997. p. 1115-8.
Xie S, Jin F, Krishnan S, Sattar F. Signal feature extraction by multi-scale PCA and its application to respiratory sound classification. Medical & Biological Engineering & Computing. 2012; 50(7):759-68. http://dx.doi.org/10.1007/s11517-012-0903-y. PMid:22467314.
Yeginer M, Kahya Y. Modeling of pulmonary crackles using wavelet networks. In: Proceedings of the 27th Annual
International Conference of the Engineering in Medicine and Biology; 2005 Sept 1-4; Shanghai, China. Shanghai: IEEE; 2005. p. 7560-3.
Yeginer M, Kahya YP. Feature extraction for pulmonary crackle representation via wavelet networks. Computers in Biology and Medicine. 2009; 39(8):713-21. http://dx.doi.org/10.1016/j.compbiomed.2009.05.008. PMid:19539902.
Yeginer M, Kahya YP. Probing the existence of medium pulmonary crackles via model-based clustering. Computers in Biology and Medicine. 2010; 40(9):765-74. http://dx.doi.org/10.1016/j.compbiomed.2010.07.004. PMid:20728880.
Zhenzhen L, Xiaoming W, Minghui D. A novel method for feature extraction of crackles in lung sound. In: Proceedings of the 5th International Conference on BioMedical Engineering and Informatics; 2012 Oct 16-18; Chongqing, China. Chongqing: IEEE; 2012. p. 399-402.
Authors
Verônica Isabela Quandt1*, Edras Reily Pacola1, Sérgio Francisco Pichorim1, Humberto Remigio Gamba1, Miguel Antônio Sovierzoski2
1 Coordenação de Pós-Graduação Engenharia Elétrica e Informática Industrial – CPGEI, Universidade Tecnológica Federal do Paraná – UTFPR, Av. Sete de Setembro, 3165, Rebouças, CEP 80230-901, Curitiba, PR, Brazil.
2 Programa de Pós-Graduação em Engenharia Biomédica – PPGEB, Universidade Tecnológica Federal do Paraná – UTFPR, Curitiba, PR, Brazil.
159Res. Biomed. Eng. 2015 June; 31(2): 148-159