pulmonary acinus: understanding the computed tomography
TRANSCRIPT

Vol.:(0123456789)1 3
Lung (2019) 197:259–265 https://doi.org/10.1007/s00408-019-00214-7
STATE OF THE ART REVIEW
Pulmonary Acinus: Understanding the Computed Tomography Findings from an Acinar Perspective
Bruno Hochhegger1,2,7 · Felipe W. Langer3 · Klaus Irion4 · Arthur Souza5 · José Moreira1 · Matteo Baldisserotto2 · Yana Pallaoro1 · Enrico Muller2 · Tassia Machado Medeiros2 · Stephan Altmayer1 · Edson Marchiori6
Received: 13 November 2018 / Accepted: 5 March 2019 / Published online: 21 March 2019 © Springer Science+Business Media, LLC, part of Springer Nature 2019
AbstractThe lung acinus is the most distal portion of the airway responsible for the gas exchange. The normal acini are not visible on conventional computed tomography (CT), but the advent of micro-CT improved the understanding of the microarchitecture of healthy acini. The comprehension of the acinar architecture is pivotal for the understanding of CT findings of diseases that involve the acini. Centriacinar emphysema, for example, presents as round areas of low attenuation due to the destruction of the most central acini with compensatory enlargement of proximal acini due to alveolar wall destruction. In pulmonary fibrosis, intralobular septal fibrosis manifests as acinar wall thickening with an overlap of acinar collapse and compensatory dilation of surrounding acini constituting the cystic disease typical of the usual interstitial pneumonia pattern. This is a state-of-the-art review to describe the acinar structure from the micro-CT perspective and display how the comprehension of the acinar structure can aid in the interpretation of its microarchitecture disruption on conventional CT.
Keywords Micro-computed tomography · Pulmonary acinus · Secondary pulmonary lobule · Computerized tomography
AbbreviationsSPL Secondary pulmonary lobuleCT Computed tomographymicro-CT Micro-computed tomography
3D Three-dimensionalTIB Tree-in-budCOPD Chronic obstructive lung diseaseUIP Usual interstitial pneumonia
* Bruno Hochhegger [email protected]
Felipe W. Langer [email protected]
Klaus Irion [email protected]
Arthur Souza [email protected]
José Moreira [email protected]
Matteo Baldisserotto [email protected]
Yana Pallaoro [email protected]
Enrico Muller [email protected]
Tassia Machado Medeiros [email protected]
Stephan Altmayer [email protected]
Edson Marchiori [email protected]
1 Medical Imaging Research Laboratory, Federal University of Health Sciences of Porto Alegre, Porto Alegre, Rio Grande Do Sul, Brazil
2 Postgraduate program, Pontifical Catholic University of Rio Grande do Sul, Porto Alegre, Brazil
3 Department of Radiology and Imaging Diagnosis, Federal University of Santa Maria, Santa Maria, Brazil
4 Department of Radiology, Liverpool Heart and Chest Hospital, Thomas Dr, Liverpool L14 3PE, UK
5 Department of Radiology, Faculdade de Medicina de São José do Rio Preto, São José do Rio Preto, Brazil
6 Department of Radiology, Federal University of Rio de Janeiro, Rio de Janeiro, Brazil
7 LABIMED – Medical Imaging Research Lab, Department of Radiology, Pavilhão, Pereira Filho Hospital, Irmandade Santa Casa de Misericórdia de Porto Alegre, Av. Independência, 75, Porto Alegre 90020-160, Brazil

260 Lung (2019) 197:259–265
1 3
IPF Interstitial pulmonary fibrosisGGO Ground-glass opacitiesµm Micrometer
Introduction
The secondary pulmonary lobule (SPL) has been regarded as the fundamental anatomical and physiological unit of the lung, with a vast literature addressing its structure, function and pathological features [1–3]. However, less emphasis has historically been placed to the lung acinus [2–4]. Defined as the airway portion distal to a terminal bronchiole, it plays a pivotal role in the gas exchange function of the lungs. Addi-tionally, some diseases can individually affect the lung acini, so that knowledge of the acinar structure and function is paramount in understanding such pathologies [1–4].
Recently, new imaging modalities have allowed a more thorough appreciation of the lung acini [5, 6]. Due to its millimetric structure (measuring up to 10 mm in diameter) with even smaller constituent parts (e.g., intralobular sep-tae), the visualization of normal lung acini on conventional computed tomography (CT) scans is not possible—such structure may become visible at CT only when affected by specific pathologies [7, 8]. The advent of micro-computed tomography (micro-CT), though, has changed this para-digm: by displaying micrometric structures and allowing their three-dimensional (3D) reconstruction through imag-ing post-processing, micro-CT has emerged as a valuable imaging tool for the visualizing the lung microarchitecture, including healthy acini [2, 5]. Although the radiation doses in micro-CT limit its applicability in vivo, autopsy samples can be safely assessed through micro-CT, allowing morpho-metric analysis of the lung parenchyma at the level of alveoli and acini [5, 6, 9–15].
In this pictorial essay, we sought to describe the anatomi-cal structure of the pulmonary acinus through the analysis of a human lung sample on micro-CT. In addition, we aimed to illustrate how knowledge of acinar lung structure improves the comprehension of lung physiopathology in comparison with standard pulmonary imaging modalities. Last, a list of the pathologies involving the lung acini will be described and correlated to the corresponding CT findings from an acinar perspective.
The Pulmonary Acinus
The pulmonary acinus is anatomically defined as the lung portion distal to a terminal bronchiole, being the largest parenchymal structure in which all airway units participate in the gas exchange, given that respiratory bronchioles pre-sent alveolated walls [1, 3]. In the airway tree, the acinus
connects to the respiratory bronchioles and comprises all subsequent airway structures—the alveolar ducts, alveo-lar sacs, and alveoli [4]. Each acinus averages 6–10 mm in diameter. Contiguous acini are partially separated from each other by intralobular septae (which should not be con-founded with interlobular septae, which separate the SPLs), and up to a dozen acini constitute an SPL, although this number significantly varies between studies [1, 3, 8].
Besides the parenchymal structure, the lung acini also have an interstitium that provides nutritional and struc-tural support, the so-called intralobular interstitium [8]. As mentioned, each acinus is separated from the others by incomplete intralobular septae (also called interacinar septae). Once the radiodensity of such septae is below the lower limit of the conventional CT resolution, visualization of individual healthy acini is normally impossible on CT [1, 2]. Branches of the pulmonary arteries, veins, and lym-phatics also supply the acini; each acinar artery measures around 0.3–0.5 mm and, on conventional CT scans, such intralobular artery may be visualized as a linear, dot-like opacity either in the center of an SPL or within 1 cm of the pleural surface [8].
History
The first attempts to understand the lung structure have derived from anatomical analysis and post-mortem experi-ments. By observing “little lobes” after the introduction of mercury into the lung airways and vessels, the English anatomist Thomas Willis provided the first detailed descrip-tion of the lung microarchitecture; the earliest use of the term “secondary pulmonary lobule” (from the seventeenth century) is attributed to him [1]. In the nineteenth century, Georg Rindlefleisch further expanded the comprehension of the lung structure: he defined as acinus the sublobular lung units formed by “alveolar passages” not surrounded by visible connective tissue septae, unlike the secondary lob-ules. Such alveolar passages would be posteriorly renamed “alveolar ducts”, the term currently employed by anatomists and radiologists.
More recently, in 1947, William Miller would review the lung anatomy and provide new perspectives about the lung structure through his book entitled The Lung [16]. He defined the SPL as the smallest morphologic lung unit sur-rounded by connective tissue septae, with an average diam-eter of 1–2.5 cm. Additionally, every SPL would contain all interstitial elements present in the lung: both bronchioles, pulmonary arteries, veins, and lymphatic vessels should sup-ply the SPL, rendering it capable of fully reproducing the lung physiology. Conversely, the lung acinus was defined from an airway perspective as the lung portion distally to a terminal bronchiole, receiving airway supply from one
261Lung (2019) 197:259–265
1 3
or more respiratory bronchioles. Given the smaller size of such structure in comparison with SPL, as well as the higher emphasis to the SPL rather than to lung acini in publica-tions over time, most of the lung pathologies are currently described according to their degree of lobular involvement [1, 8].
Micro‑Computed Tomography
Assessment of lung microarchitecture is an important step in the comprehension of many lung pathologies. Before the introduction of advanced imaging modalities, such micro-structures have been traditionally assessed through tissue histological sectioning and staining [3, 4]. Nevertheless, this technique has the drawback of damaging the sample’s three-dimensional structure, which could provide relevant infor-mation about the topographic distribution of a given finding, for instance. Additionally, technical difficulties like adequate lung tissue fixation, infiltration, and slicing have underscored the need for complementary assessment techniques [5].
Micro-CT is a non-destructive, high-resolution imaging technique that has emerged as a valuable tool for biological research in the last decades [5, 6, 9–15, 17–21]. Given its ability to produce voxels up to 1 micrometer (µm), micro-CT offers significantly higher spatial resolution than con-ventional CT, ultrasound, or magnetic resonance imaging [22]. This higher spatial resolution of micro-CT allows morphometric analysis of the alveolar tissue and apprecia-tion of the lung microarchitecture, as well as quantitative analyses of vessels, connective tissue and alveoli within the acini and secondary pulmonary lobules [11]. Similarly to conventional CT, micro-CT scans provide two-dimensional images, but the post-processing 3D reconstructions allow better spatial visualization of the scanned structure (Fig. 1). Additionally, as the tissue samples remain preserved after each scan, micro-CT does not preclude subsequent histo-logical tissue analysis, which can provide complementary diagnostic information about the examined specimen [5, 11].
Currently, micro-CT has an established role in the evalu-ation of human boné microarchitecture, remodeling, and bone pathologies [6], and there is an increasing number of publications addressing its use to evaluate the microscopic structure of various organs and tissues, both in human and animal studies [5, 19–21]. An increasing body of evidence now supports micro-CT as a useful tool for assessing the pulmonary microarchitecture in both murine and human lung samples [5, 9–11, 19–21], as current chest imaging exams, such as conventional CT, are unable to depict paren-chymal structures distal to the respiratory bronchiole, for example. However, the significant radiation doses and long scanning time, typically higher than 5 min, still limit its wide applicability in vivo [5–8, 17, 22].
Computed Tomography and Acinar Pathology
Tree‑in‑Bud Nodule
The tree-in-bud (TIB) pattern has primarily been described in conventional lung CT scans. It comprises small, inter-connected, branching nodules of soft-tissue density that emerge from a proximal stalk, resembling buds germinat-ing from a tree (Fig. 2) [23]. Although TIB has been pri-marily described as a sign of endobronchial spreading of Mycobacterium tuberculosis, it is currently acknowledged as a possible disease pattern of many pathologies, including bacterial, fungal, viral, and parasitic infections, congenital lung diseases, aspiration, immunologic, and connective tis-sue disorders; additionally, some patients may display over-lapping causes for TIB opacities [24]. Therefore, assessment of the clinical history and concomitant imaging findings are paramount when addressing patient with TIB pattern on CT.
Regarding the lung microarchitecture, the TIB pattern comprises the centriacinar region of the SPL, mainly affect-ing the pulmonary acini situated close to the respiratory
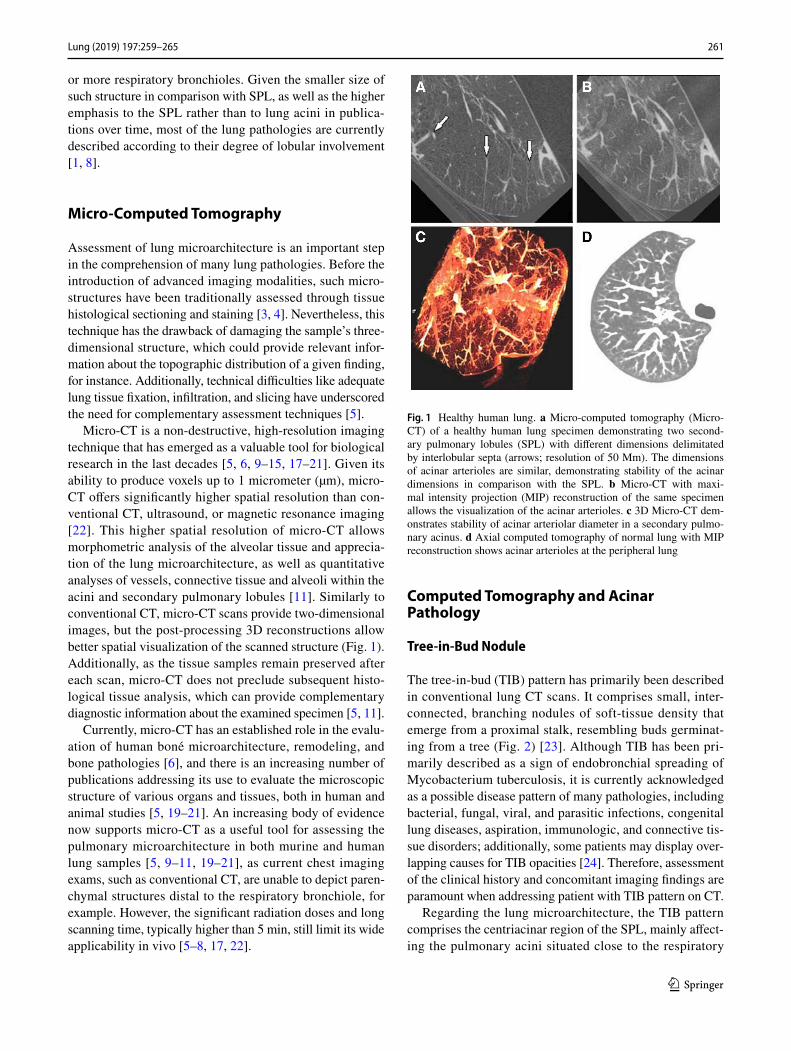
Fig. 1 Healthy human lung. a Micro-computed tomography (Micro-CT) of a healthy human lung specimen demonstrating two second-ary pulmonary lobules (SPL) with different dimensions delimitated by interlobular septa (arrows; resolution of 50 Mm). The dimensions of acinar arterioles are similar, demonstrating stability of the acinar dimensions in comparison with the SPL. b Micro-CT with maxi-mal intensity projection (MIP) reconstruction of the same specimen allows the visualization of the acinar arterioles. c 3D Micro-CT dem-onstrates stability of acinar arteriolar diameter in a secondary pulmo-nary acinus. d Axial computed tomography of normal lung with MIP reconstruction shows acinar arterioles at the peripheral lung

262 Lung (2019) 197:259–265
1 3
bronchioles [24]. By replacing the acinar air by radiodense contents (like mucus or inflammatory exudate), the under-lying disease produces the pivotal TIB branching nodules, which individually represent intra-acinar filling. Such appearance should be differentiated from centrilobular nod-ules adjacent to small arteries, which could resemble the radiologic appearance of TIB, but present completely differ-ent diagnostic and prognostic implications [25, 26].
Centriacinar Emphysema
Pulmonary emphysema is morphologically described as an abnormal irreversible enlargement of the airways distal to the terminal bronchioles. It results from the destruction of the gas-exchanging lung parenchyma, occurring mainly in the background of chronic inflammation induced by chronic obstructive lung disease (COPD) [27]. Several risk factors are known to predispose to pulmonary emphysema, such as cigarette smoking, inhalation of environmental pollutants and noxious particles, as well as alpha-1-antitrypsin enzyme deficiency. However, as only a minority of smokers develop significant emphysematous damage, recent studies have tried to unravel the molecular pathogenesis and the genetic fac-tor underlying emphysema development [27, 28]. Currently, chest imaging has an important role in the diagnosis of pul-monary emphysema and its distribution along the SPL, and high-resolution CT is considered the gold standard to display emphysematous changes.
Regarding the acinar destruction in emphysema, it can be further classified as centriacinar (or centrilobular), panacinar (or panlobular), and paraseptal (or distal acinar) [29–31]. Centriacinar emphysema is the commonest of emphysema types; the close relationship between cigarette smoking and centriacinar emphysema is regarded as one possible expla-nation for this predominance [28]. Centriacinar emphysema results from acinar disruption in the central region of the SPL, affecting the acini close to the terminal bronchiole and the first respiratory bronchioles, usually sparing the more distal acini. Centriacinar emphysema presents on CT as round areas of low attenuation not surrounded by vis-ible septae—such areas correspond to the enlargement of
proximal acini due to alveolar wall destruction (Fig. 3) [29]. On micro-CT scans, centrilobular emphysema can be appreciated as dilation and destruction of acini surrounding proximal respiratory bronchioles but sparing acini close to lobular septae (i.e., distal acini). This contrasts with panaci-nar emphysema, which compromises the entire SPL from proximal to distal acini, and with distal acinar emphysema (also named paraseptal emphysema), which affects only dis-tal acini, sparing the proximal ones, as micro-CT scans of lung samples managed to demonstrate. In both situations, destruction of acinar architecture produces round-shaped radiolucent areas without surrounding walls on CT [30, 31], as opposed to lung cysts, which are surrounded by epithelial or fibrous walls.
Nodular Ground‑Glass Opacities
The term ground-glass opacities (GGO) describes parenchy-mal lung regions with increased opacity, but which do not obscure the normal interstitial structures, including vessels and airways, as would occur in the case of a consolidation (Fig. 4) [32, 33]. In general, there are two main pathological mechanisms involved in GGO: it either represents interaci-nar interstitial thickening, in which fibrotic septae appear as a radiodense area on CT, or partial acinar filling with fluid, inflammatory exudate, hyperplastic cells, or neoplastic cells [32]. The differential diagnosis of GGO is usually wide, since any pathology capable of reducing the alveolar air con-tent without completely obliterating its lumen may originate such finding [32]. Ground-glass opacities can be appreci-ated on micro-CT as areas of acinar filling with pathologic materials or areas of thickened septae, allowing further dif-ferentiation between the underlying causes of ground-glass attenuation that would otherwise be impossible on conven-tional CT [19].
Honeycombing
Originally employed to describe the pathologic appearance of several cystic lung diseases, the term “honeycomb lung” currently has a more restricted scope. The pathological
Fig. 2 39-year-old male patient with cough and a diagnosis of pulmonary tuberculosis. a Axial computerized tomography (CT) of the lung demonstrat-ing tree-in-bud nodules in the anterior segment of right upper lobe that represent acinar filling by inflammatory cells (arrow). b Maximal intensity projection reconstruction demonstrates similar findings (arrow)

263Lung (2019) 197:259–265
1 3
definition of honeycomb lung regards it as the late stage of the fibrotic process involved in interstitial pneumonia [34]. Considered a marker of pulmonary fibrosis, identification of honeycombing changes is an important criterion for the diagnosis of usual interstitial pneumonia (UIP) in the con-text of idiopathic interstitial pulmonary fibrosis (IPF), and for differentiating IPF from other interstitial pneumonia [35, 36]. Given the poor prognosis associated with such diag-nosis, proper identification of honeycombing and careful distinction from similar but different findings is warranted.
Pathologically, the honeycombing lung usually displays clustered cysts of varying diameters (ranging from mil-limeters to a few centimeters) in a background of fibrosis, corresponding to enlarged airspaces surrounded by fibrotic
deposits [34]. Those cysts represent the destruction of nor-mal acinar architecture due to alveolar disruption, then replaced by scar tissue (Fig. 5) as demonstrated on micro-CT and histopathologic analysis [14]. Unlike emphysema, which does not have bounding walls, the cysts in honey-combing present thick surrounding fibrotic walls, which may serve as a differentiating feature [29]. Honeycombing can progressively increase in size and cysts may become conflu-ent, another common feature of end-stage lung fibrosis. On thin-section CT, it is possible to appreciate the subpleural, posterior, lower lobe predominance of honeycomb cysts in IPF [37].
Intralobular Interstitial Thickening
Inside every SPL, there is a network of thin, interconnected connective tissue fibers that sustain and separate the acinar structures that, together with acinar vessels and airways, constitute the intralobular interstitium [8]. These thin con-nective tissue septae that demarcate every acinus are called intralobular (or interacinar) septae, which collectively belong to the acinar (or parenchymal) interstitium, situated between alveolar and capillary basement membranes [38]. While it is possible to visualize the healthy interlobular septae around SPL on multislice CT, given that their thick-ness is about 0.1 mm, conventional CT scans cannot ade-quately display intralobular septae—only when they become pathologically thickened that their visualization as areas of increased attenuation on thin-slice CT becomes feasible (Fig. 6). Intralobular interstitial thickening is most com-monly found in fibrosing interstitial pneumonia (e.g., usual
Fig. 3 63-year-old asympto-matic male smoker. a Axial chest CT showing hypodense centriacinar opacities that are diagnostic of pulmonary emphysema. Note that the diameter of such lesions ranges between 6 and 10 mm (arrow), characterizing involvement of the lung acini. b Coronal chest CT with minimal intensity projection reconstruction dem-onstrates similar findings. c and d Coronal CT shows the mid to upper zone predominance of the emphysematous changes
Fig. 4 33-year-old male patient with hemoptysis. a Axial CT of the lung showing ground-glass nodules with 6–10 mm in the right lung secondary to acinar involvement (arrow)

264 Lung (2019) 197:259–265
1 3
interstitial pneumonia, non-specific interstitial pneumonia, hypersensitivity pneumonia), which affect the interacinar mesh of connective tissue fibers. Some pathologies may present both interlobular and interacinar septal thickening—one example is the pattern called “crazy paving” (classically described in alveolar proteinosis) [7].
Conclusion
The incorporation of acinar lung structure into lung diag-nostic imaging increase importance gives to the pulmonary acinus with a new emphasis regarding lung structure and diseases. Previously limited by the lower resolution of con-ventional CT scans, micro-CT now enables a non-invasive,
high-definition analysis of individual healthy acini. Such a novel possibility provides new insights into our under-standing of lung diseases and interpretation of routine CT findings.
Compliance with Ethical Standards
Conflict of interest The authors declare that they have no conflict of interest.
References
1. Webb WR (2006) Thin-section CT of the secondary pulmonary lobule: anatomy and the image—The 2004 Fleischner Lecture. Radiology 239(2):322–338
2. Tsuda A, Filipovic N, Haberthür D, Dickie R, Matsui Y, Stampa-noni M, Schittny JC (2008) Finite element 3D reconstruction of the pulmonary acinus imaged by synchrotron X-ray tomography. J Appl Physiol 105(3):964–976
3. Haefeli-bleuer B, Weibel ER (1988) Morphometry of the human pulmonary acinus. Anat Rec 220(4):401–414
4. Berend N, Rynell AC, Ward HE (1991) Structure of a human pulmonary acinus. Thorax 46:117–121
5. Ritman EL (2005) Micro-computed tomography of the lungs and pulmonary-vascular system. Proc Am Thorac Soc 2(6):477–480
6. Boerckel JD, Mason DE, Mcdermott AM, Alsberg E (2014) Microcomputed tomography: approaches and applications in bioengineering. Stem Cell Res Ther 5(6):144
7. Oikonomou A, Prassopoulos P (2013) Mimics in chest disease: interstitial opacities. Insights Imaging 4(1):9–27
8. Gotway MB, Reddy GP, Webb WR, Elicker BM, Leung JWT (2005) High-resolution CT of the lung: patterns of disease and differential diagnoses. Radiol Clin N Am 43(3):513–542
9. Watz H, Breithecker A, Rau WS, Kriete A (2005) Micro-CT of the human lung: imaging of alveoli and virtual endoscopy of an alveolar duct in a normal lung and in a lung with centrilobular emphysema—Initial observations. Radiology 236:1053–1058
Fig. 5 Schematic illustration of honeycombing formation. a Axial CT scan with circles representing normal pulmonary acini. b During the evolution of pulmonary fibrosis, intralobular septal fibrosis manifests as acinar wall thickening. c In a later stage, some acinus eventually collapse while others increase their dimensions. d With evolution of
fibrosis, those dilated acini constitute the cystic disease seen in pul-monary fibrosis. Due to such overlap of cysts and collapsed acini, we identify a paradoxal reduction of total lung volume despite the acinar dilation (i.e., cystic disease). e Honeycombing findings in a computed tomography shows a final stage of honeycombing evolution
Fig. 6 52-year-old female presenting with dyspnea and a diagnosis of non-specific interstitial pneumonia. Axial chest CT shows sep-tal thickening determining regions ranging between 6 and10 mm in diameter, illustrating its interacinar location (arrows). These findings are denominated intralobular septal thickening

265Lung (2019) 197:259–265
1 3
10. Vasilescu DM, Phillion AB, Tanabe N et al (2017) Nondestruc-tive cryomicro-CT imaging enables structural and molecular analysis of human lung tissue. J Appl Physiol Bethesda Md 1985 122:161–169
11. Kampschulte M, Schneider CR, Litzlbauer HD et al (2013) Quantitative 3D micro-CT imaging of human lung tissue. ROFO Fortschr Geb Rontgenstr Nuklearmed 185:869–876
12. Senter-Zapata M, Patel K, Bautista PA, Griffin M, Michaelson J, Yagi Y (2016) The role of micro-CT in 3D histology imaging. Pathobiol J Immunopathol Mol Cell Biol 83:140–147
13. Verleden SE, Vasilescu DM, Willems S et al (2014) The site and nature of airway obstruction after lung transplantation. Am J Respir Crit Care Med 189:292–300
14. Mai C, Verleden SE, McDonough JE et al (2017) Thin-section CT features of idiopathic pulmonary fibrosis correlated with micro-CT and histologic analysis. Radiology 283:252–263
15. Scott AE, Vasilescu DM, Seal KAD et al (2015) Three dimen-sional imaging of paraffin embedded human lung tissue samples by micro-computed tomography. PLoS ONE 10:e0126230
16. Miller W (1947) The lung. III. Thomas, Springfield 17. Mai C, Verleden SE, McDonough JE et al (2016) Thin-section CT
features of idiopathic pulmonary fibrosis correlated with micro-CT and histologic analysis. Radiology 283:252–263
18. Lynch DA, Austin JHM, Hogg JC et al (2015) CT-Definable sub-types of chronic obstructive pulmonary disease: a statement of the Fleischner Society. Radiology 277:192–205
19. Deng L, Xiao SM, Qiang JW, Li YA, Zhang Y (2017) Early Lung adenocarcinoma in mice: micro-computed tomography manifesta-tions and correlation with pathology. Transl Oncol 10:311–317
20. Sasaki M, Chubachi S, Kameyama N et al (2015) Evaluation of cigarette smoke-induced emphysema in mice using quantitative micro-computed tomography. Am J Physiol Lung Cell Mol Phys-iol 308:L1039–L1045
21. Tanabe N, Vasilescu DM, McDonough JE et al (2017) Micro-computed tomography comparison of preterminal bronchioles in centrilobular and panlobular emphysema. Am J Respir Crit Care Med 195:630–638
22. Li H, Zhang H, Tang Z, Hu G (2008) Micro-computed tomogra-phy for small animal imaging: Technological details. Prog Nat Sci 18(5):513–521
23. Rossi SE, Franquet T, Volpacchio M, Giménez A, Aguilar G (2005) Tree-in-bud pattern at thin-section CT of the lungs: radio-logic- pathologic overview. RadioGraphics 25(3):789–801
24. Miller WT Jr, Panosian JS (2013) Causes and imaging patterns of tree-in-bud opacities. Chest 144(6):1883–1892
25. Naidich DP, Bankier AA, MacMahon H, Schaefer-Prokop CM, Pistolesi M, Goo JM et al (2013) Recommendations for the man-agement of subsolid pulmonary nodules detected at CT: a state-ment from the Fleischner Society. Radiology 266(1):304–317
26. Macmahon H, Austin JHM, Gamsu G, Herold CJ, Jett JR, Naidich DP et al (2005) Guidelines for management of small pulmonary nodules detected on CT scans: a statement from the Fleischner Society. Radiology 237:395–400
27. Global strategy for the diagnosis, management, and prevention of chronic obstructive pulmonar disease (2015). GOLD. http://www.goldc opd.org/. Accessed 4 Sept 2015
28. Sharafkhaneh A, Hanania NA, Kim V (2008) Pathogenesis of emphysema: from the bench to the bedside. Proc Am Thorac Soc 5(4):475–477
29. Takahashi M, Fukuoka J, Nitta N, Takazakura R, Nagatani Y, Murakami Y et al (2008) Imaging of pulmonary emphysema: A pictorial review. Int J COPD 3(2):193–204
30. Foster WL, Gimenez EI, Roubidoux MA, Sherrier RH, Shannon RH, Roggli VL et al (1991) The emphysemas: radiologic-patho-logic correlations. RadioGraphics 13(2):311–328
31. Friedman PJ (2008) Imaging studies in emphysema. Proc Am Thorac Soc 5(4):494–500
32. Engeler CE, Tashjian JH, Trenkner SW, Walsh JW (1993) Ground-glass opacity of the lung parenchyma: analysis with high-resolu-tion CT. Am J Roentgenol 160(2):249–251
33. Chang B, Hwang JH, Choi YH, Chung MP, Kim H, Kwon OJ et al (2013) Natural history of pure ground- glass opacity lung nodules detected by low-dose CT scan. Chest 143(1):172–178
34. Arakawa H, Honma K (2011) Honeycomb lung: history and cur-rent concepts. Am J Roentgenol 196(4):773–782
35. Travis WD, Costabel U, Hansell DM, King TE, Lynch DA, Nicholson AG et al (2013) An official American Thoracic Society/European Respiratory Society statement: Update of the interna-tional multidisciplinary classification of the idiopathic interstitial pneumonias. Am J Respir Crit Care Med 188(6):733–748
36. Ferguson EC, Berkowitz EA (2012) Lung CT: part 2, The inter-stitial pneumonias—clinical, histologic, and CT manifestations. Am J Roentgenol 199(4):W464–W476
37. Mueller-Mang C, Grosse C, Schmid K, Stiebellehner L, Bankier A (2007) What every radiologist should know about idiopathic interstitial pneumonias. RadioGraphics 27(3):595–616
38. Hansell DM, Bankier AA, MacMahon H, McLoud TC, Müller NL, Remy J (2008) Fleischner Society: glossary of terms for tho-racic imaging. Radiology 246:697–722
Publisher’s Note Springer Nature remains neutral with regard to jurisdictional claims in published maps and institutional affiliations.