pull system · pdf filepull system workshop the goal: ... replenishment route. process for...
TRANSCRIPT
1
Pull System Pull System Pull System Pull System WorkshopWorkshopWorkshopWorkshop
THE GOAL: Directly link all processes - from the customer back to raw material suppliers - to improve responsiveness, shorten lead time, and reduce costs

Why Use Pull Systems to Manage Inventory Buffers?
2. Add in the variability of real world operations
3. And you create large inventories of what you don’t need and stock-outs of what you do need
$$
Forecast
1. Start with invariably inaccurate forecasts
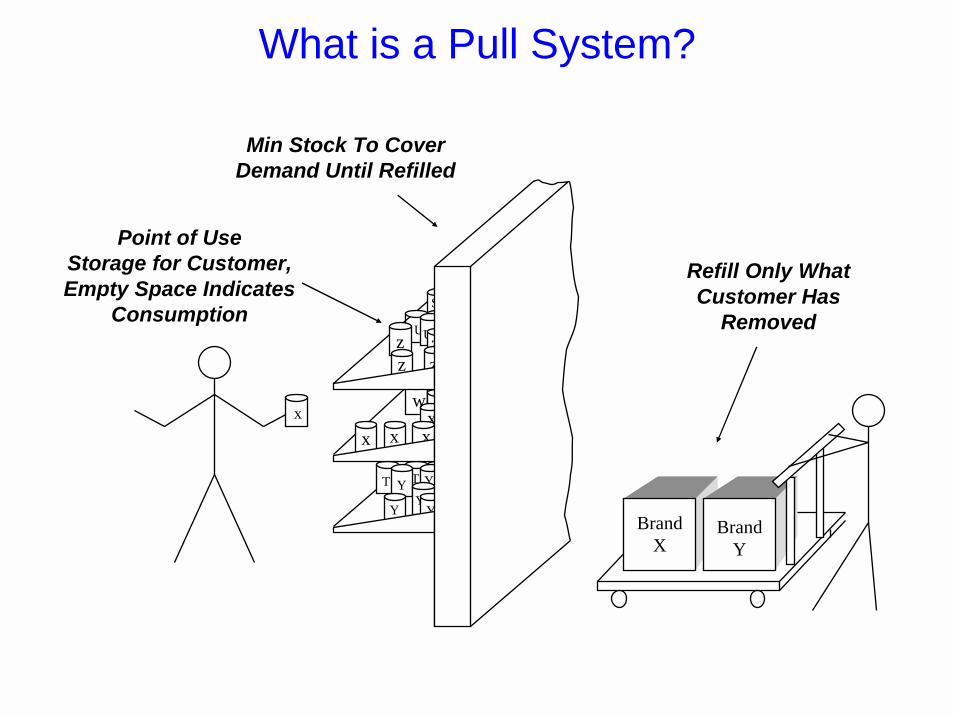
What is a Pull System?
x
x x
T
zz
U
w
S
YTYY
YY
xx
Uzz
Point of UseStorage for Customer,Empty Space Indicates
Consumption
Min Stock To Cover Demand Until Refilled
Brand X
Brand Y
Refill Only What Customer Has
Removed

Mfg. Example of a Pull System
Empty Bin is Signal to Replenish a Specific Part
Part #9031.A5Bin Qty: 25Address: Q22-671
Min # of Bins To Cover Demand Until Empty Bin is
[Seen + Removed + Refilled + Replaced]Point of Use
Storage for Customer
STORES
Standard Replenishment
Route

Process for Implementing a Pull System
1. Map the Current State
2. Address Barriers to Pull
3. Determine Customer Scheduling Strategy
4. Design a Communication System
5. Train People to Use the Pull System
6. Define Inventory Locations
7. Start at Customer and implement upstream
Daily

75% wrong FADECSchedule changes up to Paint
Lack Process FlowNo defined Target CT
Material ShortagesPoor 5S, Vis Control
WIP - 3rd shift
Long Setup TimeTest not commonSetup Person idle during test Inspection only
Low OEE & Long SetupsTooling IssuesNo std WIP
5 Models30 Engines/monthPaint to Install = 14 days
Daily
Customs(Capinas)
A-Trade(Miami)
Daily
Customer
Ship
C/T = 20 min Process all in/out mat’l
Supplier
Mnthly
Final Assembly
C/T = 30 hrs C/O = 0 hr3 shiftsCap = 2.0 eng/day
Test
C/T = 5 hrs (test)+3 hr (load)
RFT = 90%2 shiftsCap= 2 eng/day
Store
C/T = 4 hrs C/O = 0 min2 shiftsCap = 4 eng
7W
3
1W
Sub Assembly
C/T = 7 hrs C/O = 0 hr2 shiftsCap = 4.0 eng/day
2W
Turbine Machining
C/T = 5.hrs (Broach)C/O = 2.4 hr3 shifts OEE = 49% Cap = 4.5 eng/day
130 pcsWA-22B - 0C - 7 1
50 hrs 7 hrs25 days 12 hrs 30 hrs 6 days 5 hrs 3 days 4 hrs 2 day 20 min 1 day
38 day96 hrs
W
A- 15B - 60C - 35
SAP
SAPSales & Ops
Planning
5 yr forecast
14-month purchase order
60-Day FrozenSchedule
Volume Frozen
Ship Date
& Config.
Frozen
1. Map the Current State

WASTE REDUCTION
LEAD TIME
MATERIAL
Quick Setup
Lean Value Stream
One-Piece Flow
Pull System
PROCESSESPEOPLE
5S
Visual Control
Quality Practices
Total Prod. Maintenance
Standardized Work
Problem Solving Skills
Multi-Process Skills
Con
tinuo
us
Impr
ovem
ent Production
Teams
ORGANIZATIONAL COMMITMENT
2. Address Barriers
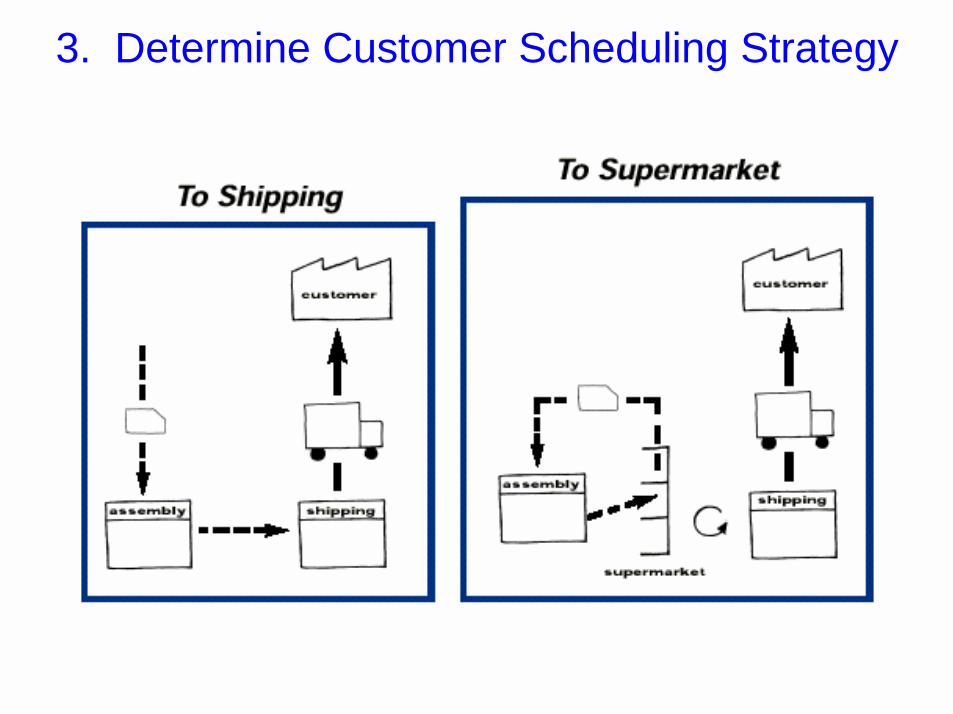
3. Determine Customer Scheduling Strategy

Communicating Customer Orders to the Plant Floor
• Send Customer Schedule to Only One Point in your Manufacturing Process • Select point furthest upstream that flows continuously to customer• Avoid including or correct processes that corrupt the customer order
sequence• Order-to-Delivery lead time will determine the customer’s inventory
requirements• Level the schedule to the Production Floor• Consider using a Sequence Pull versus a Conventional Pull System to
reduce buffer requirement

Leveling Production
Determine Demand for Each ProductModel A = 160/month Model B = 80/monthModel C = 40/ month
Level the Daily VolumeTotal Volume = 160+80+40 = 280Daily Volume = 280 / 20 day/month = 14
Level the Sequence Ratio (A:B:C) = 160:80:40 = 4:2:1Batch Size = 4 PartsSequence = 4A-4A-4B-4A-4A-4B-4C
PartsMonth
PartsDay
0
5
10
15
20
25
01/01/1900 02/01/1900 03/01/1900 04/01/1900 05/01/1900 06/01/1900
Uni
ts
Model A Model B Model C
0
2
4
6
8
10
12
14
16
01/01/1900 02/01/1900 03/01/1900 04/01/1900 05/01/1900 06/01/1900
Uni
ts
Model A Model B Model C

4. Design a Communication System
Kanban: Any signal used to directly communicate production or delivery information between those people performing the work
SupplierProcess
CustomerProcess
Withdrawal Kanban
Production Kanban
Inventory Marketplace
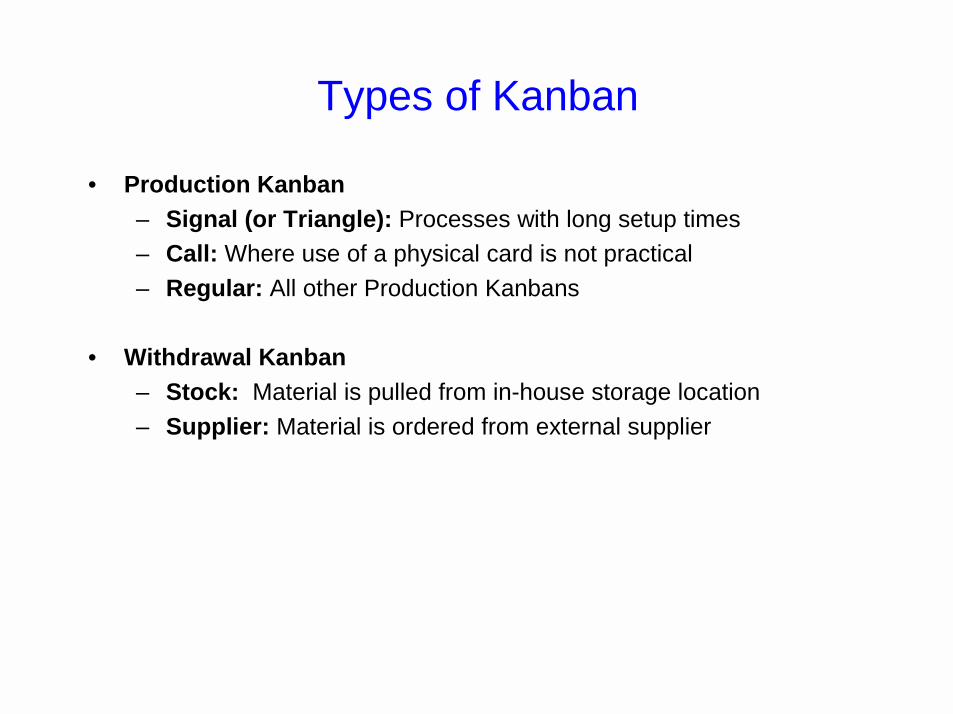
Types of Kanban
• Production Kanban– Signal (or Triangle): Processes with long setup times– Call: Where use of a physical card is not practical– Regular: All other Production Kanbans
• Withdrawal Kanban– Stock: Material is pulled from in-house storage location– Supplier: Material is ordered from external supplier
Production Kanban
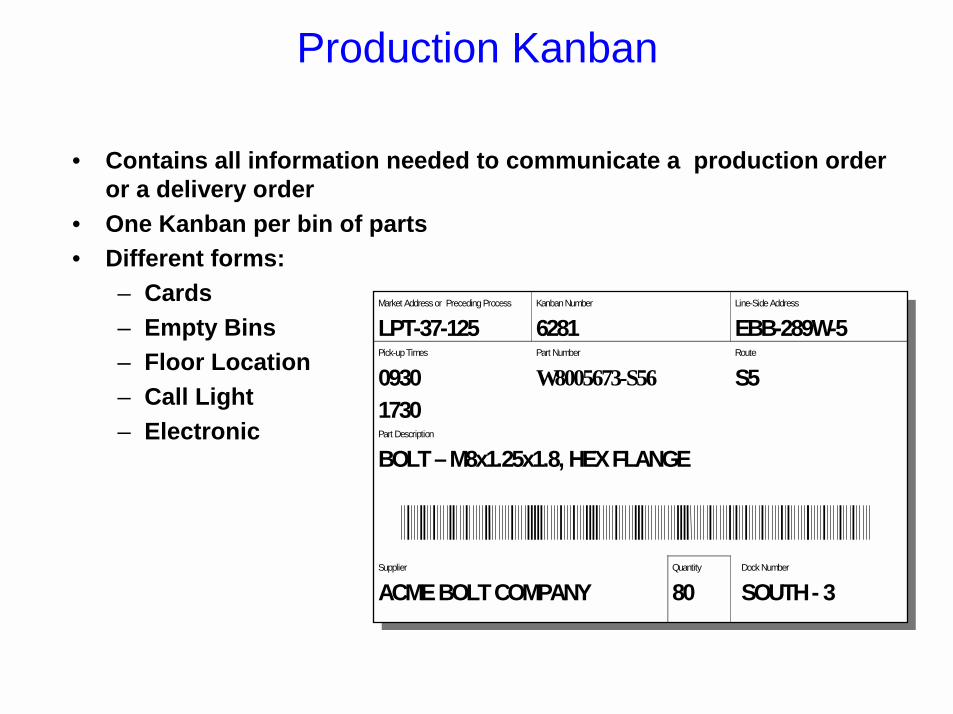
• Contains all information needed to communicate a production order or a delivery order
• One Kanban per bin of parts• Different forms:
– Cards– Empty Bins – Floor Location– Call Light– Electronic
Signal
Market Address or Preceding Process
LPT-37-125Kanban Number
6281Line-Side Address
EBB-289W-5Pick-up Times
09301730
Part Number
W8005673-S56Route
S5
Part Description
BOLT – M8x1.25x1.8, HEX FLANGE
Supplier
ACME BOLT COMPANYQuantity
80Dock Number
SOUTH - 3

How a Kanban Works
2. Retrieve WithdrawlKanbans at scheduled intervals.
4. TL Removes Prod. Kanbans from mailbox, places on board to communicate leveled schedule, line produces parts to replace those consumed by customer.
5. Transports needed parts (with Kanbans) to Line-side Address.
1. Starts new bin, removes Kanban, places in mailbox
3. Picks up parts listed on Kanban. Removes Prod. Kanban, places in mailbox. Attaches
Withdrawal Kanban.
KanbanPart #/DescriptionQty/Bin SizeMarket AddressLine-side Address

Kanban Calculations
Number of Kanban = Daily Output * Lead Time [Mfg + Kanban + Safety]
Parts per Bin
• Daily Output = Monthly Output / Workdays per Month
• Lead Time =
Time to Manufacture Part + Time to Process Kanban + Safety Factor
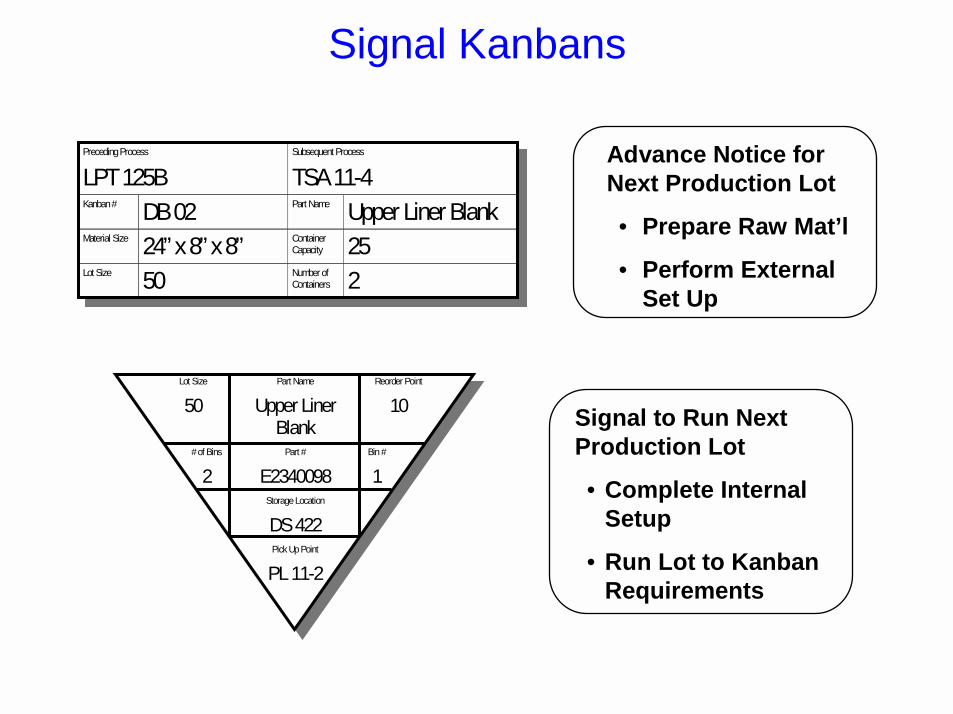
Signal Kanbans
Lot Size Part Name Reorder Point
50 Upper LinerBlank
10
# of Bins Part # Bin #
2 E2340098 1Storage Location
DS 422Pick Up Point
PL 11-2
Preceding Process Subsequent Process
LPT 125B TSA 11-4Kanban # DB 02 Part Name Upper Liner BlankMaterial Size 24” x 8” x 8” Container
Capacity 25Lot Size 50 Number of
Containers 2
Advance Notice for Next Production Lot
• Prepare Raw Mat’l
• Perform External Set Up
Signal to Run Next Production Lot
• Complete Internal Setup
• Run Lot to Kanban Requirements

How Signal Kanban Works
3. Rectangle Kanban.• Prepare for next job• Blank coil length• Perform external setup
4. Receive Triangle Kanban.• Perform internal setup• Run lot• Attach Kanban
TL “sees” status of stamping area by viewing Scheduling Board.
6. Transports parts w/Kanbans to customer.
1. Starts bin with Rectangle Kanban, removes Kanban and places in mailbox. Repeats when reaches bin with Triangle Kanban.
2. Retrieves Kanbans at set intervals. Places on
Kanban Board.
Set Up
Run

Signal Kanban Calculations
Reorder Point = (Rectangle)
Daily Output * Lead Time [Mfg + Prep + Kanban + Safety]Parts per Bin
• Prep is the critical-path time needed to prepare for the production run to include external setup and cutting of raw material
Reorder Point = (Triangle)
Daily Output * Lead Time [Mfg + Kanban + Safety]Parts per Bin

5. Train People to Use the Pull System
1. Never send defective products downstream.2. Downstream process draws from upstream processes only what is
required by the Kanban.3. Upstream process produces items in exact quantity and sequence
indicated by the Kanban.4. Never produce or convey parts without a Kanban.5. Attach Kanban to the actual container of parts.6. Use Kanban to fine tune the production system.

6. Define Inventory Locations
Before After
If you had only 30 seconds to find the unit…...which storage system would you choose?

7. Start at the Customer and Implement Upstream
• Initial buffers may be large to account for long lead times or unstable processes
• Reduce buffer sizes over time as implement improvements upstream and gain confidence in the system
• Avoid using your ERP system to communicate customer pull signal to the plant floor
– Streamline the communication/scheduling process connecting your customer to your plant floor
– Use ERP for capacity planning and long-lead suppliers• Implement Material-Information Loops starting at shipping dock and
working upstream

C/T = 7 hrs C/O = 0 hr2 shiftsCapacity = 2.0 eng/day
Sub Assembly
2W
Common TestSetup<15min
Cut 3rd shift 2-Bin A PartsKit B/C Parts
Flow Engine-6op5S Area
Volume
Final Assembly
C/T = 36 hrs C/O = 0 hr2 shiftsCapacity = 2.0 eng/day
C/T = 5 hrs (test)+0.5 hr (load)
RFT = 90%2 shiftsCapacity = 2 eng/day
4-3007A2-3007CW 1-A
1-C
Test
1-CW
TPMSetup<Ct+20min
C/T = 5.5hrs (Broach)C/O = 2.4 hr2 shifts OEE = 75% Capacity = 3 eng/day
Turbine Machining
20 pcsW
Future State Map
Add FadecDefine L/R
Box at Store
Sales & Ops Planning
SAP
Forecast & purchase order
60-Day FrozenVol. Schedule
14 Days Order to Delivery
Synchronized Pull
Mix
Customs(Capinas)
Daily
EMBRAER
T=0T=-14
C/T = 4 hrs C/O = 0 min2 shiftsCapacity = 4 eng
Ship in PairsF
Daily
Store/Ship
SAP
Supplier
Wkly
Forecast