public version of the staff report - renewable + law page ii third‐country market import...
TRANSCRIPT

Public Version of the Staff Report
_________________________________________________________________
UNITED STATES INTERNATIONAL TRADE COMMISSION
Washington, DC
_________________________________________________________________
CRYSTALLINE SILICON PHOTOVOLTAIC CELLS (WHETHER OR NOT PARTIALLY OR FULLY ASSEMBLED INTO OTHER PRODUCTS)
Staff Report Investigation No. TA-201-75


CONTENTS Page
i
Part I: Introduction ................................................................................................................ I‐1
Background ................................................................................................................................ I‐1
Statutory criteria and organization of the report ..................................................................... I‐2
Summary data ........................................................................................................................... I‐4
Previous and related investigations .......................................................................................... I‐8
Crystalline Silicon Photovoltaic Solar Cells and Modules from China
(Investigation Nos. 701‐TA‐481 and 731‐TA‐1190) (November 2012) ................................. I‐8
Certain Crystalline Silicon Photovoltaic Solar Cells and Modules from China and Taiwan
(Investigation Nos. 701‐TA‐511 and 731‐TA‐1246‐1247) (February 2015) ........................... I‐8
The product ............................................................................................................................. I‐10
The imported articles described in this investigation ......................................................... I‐10
Like or directly competitive articles .................................................................................... I‐12
Physical properties .............................................................................................................. I‐15
Manufacturing facilities and processes ............................................................................... I‐24
Uses ..................................................................................................................................... I‐33
Marketing channels ............................................................................................................. I‐37
Discussion of specific products ............................................................................................ I‐42
U.S. tariff treatment ............................................................................................................ I‐52
The U.S. market ....................................................................................................................... I‐53
U.S. producers ..................................................................................................................... I‐53
U.S. importers ...................................................................................................................... I‐56
U.S. purchasers .................................................................................................................... I‐59

CONTENTS Page
ii
Third‐country market import restraints .................................................................................. I‐60
The European Union ............................................................................................................ I‐61
India ..................................................................................................................................... I‐63
Australia ............................................................................................................................... I‐65
Canada ................................................................................................................................. I‐65
China .................................................................................................................................... I‐66
Turkey .................................................................................................................................. I‐67
Part II: Information relating to increased imports ................................................................. II‐1
U.S. imports .............................................................................................................................. II‐1
Country‐of‐origin based on cell manufacture location ........................................................ II‐1
Country‐of‐origin based on cell manufacture location except for NAFTA countries ........... II‐7
U.S. imports from China ..................................................................................................... II‐12
Forms of imported CSPV products ..................................................................................... II‐14
Importers' CSPV technology ............................................................................................... II‐16
U.S. importers’ imports subsequent to December 31, 2016 ................................................. II‐18
Imports by U.S. producers and related firms ......................................................................... II‐20
U.S. imports relative to production ....................................................................................... II‐28
U.S. imports from Canada, China, and Mexico ...................................................................... II‐17
Part III: Serious injury or threat of serious injury ................................................................. III‐1
Overview ................................................................................................................................. III‐1
U.S. producers’ ownership and related or affiliated firms .................................................. III‐1
Reported changes experienced and anticipated by the industry ....................................... III‐3
U.S. production, capacity, and capacity utilization ................................................................. III‐9
CSPV cells ............................................................................................................................. III‐9
CSPV modules .................................................................................................................... III‐23
U.S. producers’ shipments .................................................................................................... III‐27
CSPV cells ........................................................................................................................... III‐27
CONTENTS Page
iii
CSPV modules .................................................................................................................... III‐29
U.S. commercial shipments, by form of CSPV product ..................................................... III‐31
U.S.‐origin U.S. shipments for apparent consumption ..................................................... III‐33
Inventories maintained by U.S. producers and U.S. importers ............................................ III‐35
U.S. producers’ inventories ............................................................................................... III‐35
U.S. importers’ inventories ................................................................................................ III‐37
U.S. employment, hours, and wages .................................................................................... III‐38
CSPV cells ........................................................................................................................... III‐38
CSPV modules .................................................................................................................... III‐39
Financial condition of the U.S. industry ................................................................................ III‐40
Background ........................................................................................................................ III‐40
Operations on CSPV products ........................................................................................... III‐41
Capital expenditures, research and development expenses, and investment in
productive facilities ........................................................................................................... III‐56
Capital and investment ...................................................................................................... III‐59
Part IV: U.S. market and foreign industries .......................................................................... IV‐1
Apparent U.S. consumption and market shares ..................................................................... IV‐1
Country‐of‐origin based on cell manufacture location ....................................................... IV‐1
Alternative NAFTA country presentation ............................................................................ IV‐6
Foreign industries .................................................................................................................... IV‐9
Global installations and production .................................................................................... IV‐9
The industries in North America ....................................................................................... IV‐16
Canada .......................................................................................................................... IV‐16
Mexico ........................................................................................................................... IV‐25

CONTENTS Page
iv
The industries in Asia ......................................................................................................... IV‐33
China ............................................................................................................................. IV‐33
India............................................................................................................................... IV‐56
Indonesia ....................................................................................................................... IV‐67
Japan ............................................................................................................................. IV‐75
Korea ............................................................................................................................. IV‐84
Malaysia ........................................................................................................................ IV‐93
Philippines ................................................................................................................... IV‐102
Singapore .................................................................................................................... IV‐109
Taiwan ......................................................................................................................... IV‐115
Thailand ....................................................................................................................... IV‐125
Vietnam ....................................................................................................................... IV‐133
The industries in other countries with free trade agreements with the
United States ................................................................................................................... IV‐140
Australia ...................................................................................................................... IV‐141
CAFTA‐DR .................................................................................................................... IV‐142
Jordan .......................................................................................................................... IV‐143
Panama ....................................................................................................................... IV‐143
Other countries with FTAs .......................................................................................... IV‐144
The industries in other countries .................................................................................... IV‐144
Brazil ............................................................................................................................ IV‐144
Germany ...................................................................................................................... IV‐150
The Netherlands .......................................................................................................... IV‐161
The responding industries combined .............................................................................. IV‐164

CONTENTS Page
v
Part V: Other competitive dynamics of the U.S. market ........................................................ V‐1
Market overview .................................................................................................................. V‐1
U.S. supply ............................................................................................................................ V‐4
U.S. demand ....................................................................................................................... V‐10
Substitutability of domestic and imported CSPV products .................................................... V‐19
Lead times .......................................................................................................................... V‐19
Factors affecting purchasing decisions............................................................................... V‐20
Comparisons of domestic products and imported articles ................................................ V‐24
Elasticity estimates ................................................................................................................. V‐25
U.S. supply elasticity ........................................................................................................... V‐25
Import supply elasticity ...................................................................................................... V‐26
U.S. demand elasticity ........................................................................................................ V‐27
Substitution elasticity ......................................................................................................... V‐27
Factors affecting prices .......................................................................................................... V‐27
Raw material costs ............................................................................................................. V‐27
U.S. inland transportation costs ......................................................................................... V‐29
Pricing practices ..................................................................................................................... V‐30
Pricing methods .................................................................................................................. V‐30
Sales terms and discounts .................................................................................................. V‐31
Price data ................................................................................................................................ V‐32
Aggregate pricing trends .................................................................................................... V‐45
Price comparisons .............................................................................................................. V‐45
Published price data ........................................................................................................... V‐46
Lost sales and lost revenue ................................................................................................ V‐47
Other dynamics in the U.S. market ........................................................................................ V‐51
Incentive programs and regulations................................................................................... V‐51
Other sources of electricity ................................................................................................ V‐58

CONTENTS Page
vi
Appendixes
A. Federal Register notices .................................................................................................. A‐1
B. List of hearing witnesses ................................................................................................. B‐1
C. Summary data ................................................................................................................. C‐1
D. Competitive efforts and proposed adjustments ............................................................. D‐1
E. Effects of imports on U.S. producers and related information by firm .......................... E‐1
F. Comments on the effects of U.S. orders on crystalline silicon photovoltaic products ... F‐1
G. Price data by country source ........................................................................................... G‐1
Note.—Information that would reveal confidential operations of individual concerns may not
be published and therefore has been deleted. Such deletions are indicated by asterisks.
I‐1
PART I: INTRODUCTION
BACKGROUND
This safeguard investigation results from a petition, as amended, and properly filed on
May 17, 2017, under section 202(a) of the Trade Act of 1974 (“The Act”) (19 U.S.C. § 2552(a)) by
counsel for Suniva Inc. (“Suniva”). The petition alleges that certain crystalline silicon
photovoltaic cells, whether or not partially or fully assembled into other products (“CSPV
products”),1 are being imported into the United States in such increased quantities as to be a
substantial cause of serious injury, or threat thereof, to the domestic industry producing an
article like or directly competitive with the imported article.2 3
1 See the section entitled “The Imported Articles Described in this Investigation” in Part I of this report for a complete description of the merchandise subject to this investigation.
2 Suniva initially submitted a petition to the Commission on April 26, 2017. In a May 1, 2017 letter, the Commission requested that Suniva clarify the description of the imported articles, provide more details about petitioner’s representativeness of the industry within the meaning of section 201(a)(1) of the Trade Act (19 U.S.C. § 2252(a)(1)), and supply additional data on the domestic industry’s performance indicators. In an amended petition submitted on May 12, 2017, Suniva provided additional information, including an affidavit indicating that the petition was also supported by ***. In response to telephone conferences held with Commission staff on May 15, 2017 and May 17, 2017, Suniva further amended its petition on May 17, 2017 to provide a revised description of the imported articles. The Commission determined that the petition, as amended, was properly filed as of May 17, 2017.
3 On May 25, 2017, SolarWorld and Suniva notified the Commission that SolarWorld was joining Suniva as co‐petitioner in this investigation. Letter to Secretary Barton, Re: Petition for Global Safeguard Relief Pursuant to Sections 201‐202 of the Trade Act of 1974 ‐ Crystalline Silicon Photovoltaic Cells (Whether or Not Fully Assembled into Other Products) ‐ Adding Petitioner and Submission of Additional Data, May 25, 2017.

I‐2
The following tabulation presents information relating to the background and schedule
of this proceeding:4
Effective date Action
May 17, 2017 Petition properly filed with the Commission; institution of inv. No. TA‐201‐75 (82 FR 25331, June 1, 2017)
August 15, 2017 Commission’s hearing on injury
September 22, 2017 Scheduled date for the Commission’s vote on injury
October 3, 2017 Scheduled date for the Commission’s hearing on remedy (if needed)
October 31, 2017 Scheduled date for the Commission’s vote on remedy (suggested date) (if needed)
November 13, 2017 Commission’s findings and recommendations due to the President
STATUTORY CRITERIA AND ORGANIZATION OF THE REPORT
Under the statute, the Commission considers whether “an article is being imported into
the United States in such increased quantities as to be a substantial cause of serious injury, or
the threat thereof, to the domestic industry producing an article like or directly competitive
with the imported article.”5 Under section 202 of the Trade Act, imports have increased when
the increase is “either actual or relative to domestic production.”6 This information is addressed
in Part II of this report.
Section 202(c)( 1)(A) of the Act provides that in making its determination with respect to
serious injury the Commission shall take into account all economic factors which it considers
relevant, including (but not limited to) “(i) the significant idling of productive facilities in the
domestic industry, (ii) the inability of a significant number of firms to carry out domestic
4 The Commission’s notice of institution and scheduling are referenced in appendix A and may also be found at the Commission’s web site (internet address www.usitc.gov). The list of witnesses that appeared at the Commission’s injury hearing is presented in appendix B.
5 Section 202(b)(1)(A) of the Trade Act; 19 U.S.C. § 2252(b)(1)(A). 6 19 U.S.C. § 2252(c)(1)(C).

I‐3
production operations at a reasonable level of profit, and (iii) significant unemployment or
underemployment with the domestic industry.”7 Section 202(c)(1)(B) of the Act provides that in
making its determination with respect to threat of serious injury the Commission shall take into
account all economic factors which it considers relevant, including (but not limited to) “(i) a
decline in sales or market share, a higher and growing inventory (whether maintained by
domestic producers, importers, wholesalers, or retailers), and a downward trend in production,
profits, wages, productivity, or employment (or increasing underemployment) in the domestic
industry, (ii) the extent to which firms in the domestic industry are unable to generate
adequate capital to finance the modernization of their domestic plants and equipment, or are
unable to maintain existing levels of expenditures for research and development, {and} (iii) the
extent to which the United States market is the focal point for the diversion of exports of the
article concerned by reason of restraints on exports of such article to, or on imports of such
article into, third country markets.”8 These factors are addressed in Part III of this report,
except for restraints on imports in third‐country markets, which are addressed in Part I of the
report and information on market share declines, if any, which are addressed in Part IV of the
report.
With respect to substantial cause, the Commission shall consider an increase in imports
(either actual or relative to domestic production) and a decline in the proportion of the
domestic market supplied by domestic producers.9 The presence or absence of any factor that
7 19 U.S.C. § 2252(c)(1)(A). 8 19 U.S.C. § 2252(c)(1)(B). 9 Section 202(c)(1)(C); 19 U.S.C. § 2252(c)(1)(C).

I‐4
the Commission is required to consider is “not necessarily dispositive.”10 The statute also
directs the Commission to consider “the condition of the domestic industry over the course of
the relevant business cycle … ” and provides that the Commission shall consider “factors other
than imports which may be a cause of serious injury, or threat of serious injury, to the domestic
industry.”11 Information on apparent U.S. consumption and respective market shares is
provided in Part IV of this report, and available information on foreign industries and their
participation, if any, in the U.S. market during the period of investigation is also provided in Part
IV of this report. Information on other competitive dynamics in the U.S. market, including
information on any relevant business cycle, is provided in Part V of this report.
SUMMARY DATA
Information obtained during the course of the investigation that relates to the
applicable statutory criteria is presented throughout this report. Unless otherwise noted, data
concerning the U.S. industry are based on the questionnaire responses of 16 firms that are
estimated to have accounted for all known U.S. production of CSPV cells and 63.9 percent of
U.S. production of CSPV modules during 2015.12 U.S. import data are based on the
10 Section 202(c)(3); 19 U.S.C. § 2252(c)(3). 11 Section 202(c)(2); 19 U.S.C. § 2252(c)(2). 12 Based on a comparison of U.S. producers’ reported production of CSPV modules of *** kW in 2015
with total 2015 U.S. production of modules of 864,985 kW (latest available) as reported in Energy Information Administration (“EIA”), Solar Photovoltaic Cell/Module Shipments Report, September 2016, table 6. EIA’s reported production includes thin film products. Since EIA’s estimate of total U.S. production of modules includes thin film products and is likely somewhat overstated for purposes of a coverage calculation for U.S. module production in this investigation, the questionnaire responses received from U.S. module producers likely account for a higher percentage of U.S. CSPV module production.

I‐5
questionnaire responses of 56 firms that are estimated to have accounted for 82.6 percent of
U.S. imports of CSPV cells and CSPV modules during 2016.13
Foreign industry data are based on the questionnaire responses of 100
producers/exporters of CSPV products as follows:
Brazil: 1 firm accounting for less than *** percent of 2016 module production capacity in Brazil.14
Canada: 5 firms accounting for approximately 89 percent of 2016 module capacity in Canada.15
China: 35 firms accounting for approximately 57 percent of CSPV cell production and 67 percent of module production in 2016 in China.16
Germany: 6 firms accounting for all known CSPV cell capacity and 51 percent of module production capacity in Germany in 2016.17
India: 5 firms accounting for approximately *** percent of CSPV cell production capacity and *** percent of module production capacity in India.
13 Based on a comparison of the total value of 2016 U.S. imports of CSPV cells and modules from all countries reported in the responses to the Commission’s U.S. importer questionnaire ($7.06 million) with total landed‐duty paid value ($8.55 million) of 2016 U.S. imports of cells and modules as reported by official Commerce import statistics (HTS 8541.40.6030 and 8541.40.6020). Questionnaire data coverage presented may be imprecise because the official Commerce statistics may include other products not within the scope of this investigation, such as thin film solar products.
14 Based on announced and publicly reported capacity by firms in Brazil. 15 There is no known cell production in Canada. Bloomberg New Energy Finance database,
https://about.bnef.com/, accessed April 27, 2017; Poissant, Y. and P. Bateman, “National Survey Report of PV Power Applications in Canada,” IEA PVPS, p, 20, http://www.iea‐pvps.org/?id=93. One of the five responding firms in Canada (Hanwha Q Cells Canada Corp.) provided a questionnaire response with data on exports from Canada; however, the firm reported that it is not a producer of CSPV products in Canada.
16 LV Fang, Xu Honghua, and Wang Sicheng, National Survey Report of PV Power Applications in China 2015, IEA Photovoltaic Power Systems Programme (IEA PVPS), pp. 16–17.
17 The 100‐percent coverage for cells is based on responses provided by all cell producers in Germany in 2016. Photovoltaics–Made In Germany, Germany Trade & Invest, October 2016, https://www.powerhouse‐eastern‐germany.de/PEG/Content/DE/Zukunftsfelder/Cleantech‐Industrie/pdf_solar.pdf?v=2.

I‐6
Indonesia: 3 firms accounting for approximately *** percent of module production capacity in Indonesia.18
Japan: 1 firm accounting for approximately *** percent of CSPV cell production and *** percent of module production in Japan in 2016.
Korea: 4 firms accounting for approximately *** percent of CSPV cell production capacity and *** percent of module production capacity in Korea in 2016.19
Malaysia: 10 firms accounting for all known CSPV cell capacity and 93 percent of module capacity in 2015 in Malaysia.20
Mexico: 3 firms accounting for about *** percent of CSPV cell capacity in Mexico and approximately *** percent of module capacity in Mexico in 2016.21
Netherlands: 1 firm accounting for all known production in the Netherlands.22
Philippines: 1 firm accounting for all known production in the Philippines.23
18 Production and capacity data for Indonesia are not readily available, but there are reportedly additional producers that did not provide questionnaire responses. For a list of the six manufacturers as of 2014, see Global Business Guide, “Solar Panels in Indonesia: A Bright Future?” July 21, 2014, http://www.gbgindonesia.com/en/main/business_updates/2014/upd_solar_panels_in_indonesia_a_bright_future_.php. In addition, Canadian Solar subsequently opened a PV manufacturing plant in Indonesia. Canadian Solar, “Form 20‐F,” Annual Filing to the Securities and Exchange Commission, April 27, 2017, p. 63, http://investors.canadiansolar.com/phoenix.zhtml?c=196781&p=irol‐sec.
19 Chinho Park, Kang Won Kim, Jaehong Seo, Jaechon Song, and Deugyoung Jeong, National Survey Report of PV Power Applications in Korea 2015, IEA PVPS, September 2016, p. 21, http://www.iea‐pvps.org/?id=93.
20 The 100‐percent coverage for cells is based on the fact that all known producing firms responded to the questionnaire. Sustainable Energy Development Authority Malaysia, National Survey Report of PV Power Applications in Malaysia 2015, IEA PVPS, p. 19. An eleventh firm in Malaysia (Canadian Solar (Malaysia)) provided a questionnaire response with data concerning exports from Malaysia; however, the firm reported that it is not a producer of CSPV products in Malaysia. 21 IUSASOL Website, http://www.iusasol.mx/Home/why_us (accessed July 13, 2017); Manufacturer, “Desde México, Solartec se Abre Paso Por el Mundo,” August 10, 2016, http://www.manufactura.mx/industria/2016/08/10/desde‐mexico‐solartec‐se‐abre‐paso‐por‐el‐mundo; Solartec Website, http://solartec.mx/index.php (accessed July 13, 2017); Solarvatio Website, http://solarvatio.com/energy/proceso/ (accessed July 13, 2017); PV Magazine, “Mexico's Solartec Opens up Shop in Texas,” October 23, 2014, https://www.pvmagazine.com/2014/10/23/mexicossolartecopensupshopintexas_100016906/; Osborne, Mark, “Flex Confirms Solar Business with SunEdison Went From US$500 Million to Zero,” PV Tech, January 27, 2017, https://www.pv‐tech.org/news/flex‐confirms‐solar‐business‐with‐sunedison‐went‐from‐us500‐million‐to‐zero; Grajeda, Jose, “Ciudad Juarez Dominates Solar Panel Manufacturing in Mexico,” August 4, 2015, https://www.tecma.com/solar‐panel‐manufacturing‐in‐mexico‐is‐dominant‐in‐ciudad‐juarez/.
22 The 100‐percent coverage is based on the fact that all known producing firms responded to the questionnaire. Bloomberg New Energy Finance database, https://about.bnef.com/.
23 The 100‐percent coverage is based on the fact that all known producing firms responded to the questionnaire. Bloomberg New Energy Finance database, https://about.bnef.com/.

I‐7
Singapore: 1 firm accounting for all known production in Singapore.24
Taiwan: 15 firms accounting for approximately 82 percent of CSPV cell capacity and 31 percent of module capacity in Taiwan in 2016.25
Thailand: 4 firms accounting for approximately 52 percent of CSPV cell production capacity in 2016 and 44 percent of module capacity in Thailand in 2016.26
Vietnam: 5 firms accounting for approximately *** percent of CSPV cell capacity and *** percent of module capacity in Vietnam in 2016.27
A summary of data collected on CSPV products in this investigation is presented in
appendix C.28 Responses by firms to a series of questions concerning competitive efforts and
proposed adjustments are presented in appendix D. Responses by firms to a series of questions
concerning the effects of imports on U.S. producers’ existing development and production
efforts, growth, investment, research and development, and ability to raise capital are
presented in appendix E. Responses by firms to a series of questions concerning the significance
of existing antidumping and countervailing duty orders are presented in appendix F.
24 The 100‐percent coverage is based on the fact that all known producing firms responded to the questionnaire. Bloomberg New Energy Finance database, https://about.bnef.com/.
25 Percentage is based on commissioned capacity as of April 2017. Bloomberg New Energy Finance database, https://about.bnef.com/, accessed April 27, 2017.
26 Mints, Paula, “Seven Key Solar PV Industry Metrics and What they Mean to You,” Renewable Energy World, March 29, 2017, http://www.renewableenergyworld.com/articles/2017/03/four‐key‐solar‐pv‐industry‐metrics‐and‐what‐they‐mean‐to‐you.html.
27 Wu, Chung‐Han, “Vietnam: The New Powerhouse for Cell Manufacturing in Southeast Asia,” Boviet Solar, June 2, 2017, https://www.slideshare.net/Jupiter276/vietnam‐the‐new‐powerhouse‐for‐cell‐manufacturing‐in‐southeast‐asia.
28 Tables presented in appendix C include (1) summary data concerning the U.S. market (country‐of‐origin based on cell manufacture location, as well as that based on module manufacture location for modules assembled in NAFTA countries), (2) summary data concerning the merchant U.S. market for cells, (3) summary data concerning the U.S. market for CSPV modules (country‐of‐origin based on cell manufacture location, as well as that based on module manufacture location for modules assembled in NAFTA countries), (4) apparent consumption and market share data for modules by channel of distribution, (5) apparent consumption and market share data by 60‐cell vs. 70‐cell modules, (6) apparent consumption and market share data by mono‐crystalline vs. multi‐crystalline modules, and (7) U.S. imports compiled from official U.S. import statistics.

I‐8
PREVIOUS AND RELATED INVESTIGATIONS
Crystalline Silicon Photovoltaic Solar Cells and Modules from China (Investigation Nos. 701‐TA‐481 and 731‐TA‐1190) (November 2012)
In November 2012, the Commission determined that an industry in the United States
was materially injured by reason of imports of crystalline silicon photovoltaic solar cells and
modules from China that the U.S. Department of Commerce (“Commerce”) found were sold at
less than fair value (“LTFV”) in the U.S. market and subsidized by the Government of China
(“CSPV 1”).29 Those investigations resulted from antidumping and countervailing duty petitions
filed by SolarWorld on October 19, 2011. Effective December 7, 2012, Commerce issued
antidumping and countervailing duty orders on those imports.30 Commerce determined that
the country of origin of CSPV modules was the country of manufacture of the CSPV cells.
Therefore, the scope of the orders did not include U.S. imports of CSPV modules assembled in
China from CSPV cells made in a country other than China.31
Certain Crystalline Silicon Photovoltaic Solar Cells and Modules from China and Taiwan (Investigation Nos. 701‐TA‐511 and 731‐TA‐1246‐1247) (February 2015)
In February 2015, the Commission determined that an industry in the United States was
materially injured by reason of imports of certain crystalline silicon photovoltaic solar cells and
modules from Taiwan that Commerce found were sold in the U.S. market at LTFV and imports
29 Crystalline Silicon Photovoltaic Cells and Modules from China, Inv. Nos. 701‐TA‐481 and 731‐TA‐1190 (Final), USITC Publication 4360, November 2012 (all six Commissioners reached affirmative determinations).
30 Crystalline Silicon Photovoltaic Cells, Whether or Not Assembled Into Modules, From the People’s Republic of China: Countervailing Duty Order, 77 FR 73017, December 7, 2012; Crystalline Silicon Photovoltaic Cells, Whether or Not Assembled Into Modules, From the People’s Republic of China: Amended Final Determination of Sales at Less Than Fair Value, and Antidumping Duty Order, 77 FR 73018, December 7, 2012.
31 USITC Publication 4519 at 3‐4.
I‐9
from China that Commerce found were sold at LTFV and subsidized by the Government of
China (“CSPV 2”).32 Those investigations resulted from antidumping and countervailing duty
petitions filed by SolarWorld on December 31, 2013.33 Effective February 18, 2015, Commerce
issued antidumping and countervailing duty orders on those imports from China and an
antidumping duty order on those imports Taiwan.34
In its final CSPV 2 determinations, Commerce defined the subject merchandise from
China to include U.S. imports of the following: (1) CSPV modules assembled in China from CSPV
cells made in Taiwan and (2) CSPV modules assembled in China from CSPV cells made in third
countries. Commerce defined the subject merchandise from Taiwan to include U.S. imports of:
(1) CSPV cells made in Taiwan; (2) CSPV modules assembled in Taiwan from CSPV cells made in
Taiwan; and (3) CSPV modules assembled in third countries other than China from CSPV cells
made in Taiwan. Therefore, the module assembly location mostly determined the country of
origin for U.S. imports of modules (and laminates), except for modules covered by the prior
CSPV 1 orders (which were considered nonsubject merchandise from China), modules
32 Certain Crystalline Silicon Photovoltaic Cells and Modules from China and Taiwan, Inv. Nos. 701‐TA‐511 and 731‐TA‐1246‐1247 (Final), USITC Publication 4519, February 2015 (Chairman Schmidtlein, Vice Chairman Johanson, and Commissioners Williamson and Pinkert voted in the affirmative. Commissioner Broadbent voted in the affirmative with respect to CSPV modules from China and Taiwan and in the negative with respect to CSPV cells from Taiwan (CSPV cells from China were not included in the scope as they were already covered by the CSPV 1 orders). Commissioner Kieff did not participate in the CSPV 2 investigations).
33 Effective October 1, 2014, SolarWorld Industries America, Inc. changed its name to SolarWorld Americas, Inc. The petitions stated that they were also supported by the Coalition for American Solar Manufacturing, which included U.S. producers SolarWorld, ***.
34 Certain Crystalline Silicon Photovoltaic Products From the People’s Republic of China: Antidumping Duty Order; and Amended Final Affirmative Countervailing Duty Determination and Countervailing Duty Order, 80 FR 8592, February 18, 2015; Certain Crystalline Silicon Photovoltaic Products From Taiwan: Antidumping Duty Order, 80 FR 8596, February 18, 2015.

I‐10
assembled in Taiwan with CSPV cells made in nonsubject countries (which were excluded from
the scope of the Taiwan investigation and considered nonsubject merchandise from Taiwan),
and modules assembled in third countries with CSPV cells made in Taiwan (which were
considered subject merchandise from Taiwan). 35
THE PRODUCT
The imported articles described in this investigation
The imported articles covered by this safeguard investigation are CSPV cells, whether or
not partially or fully assembled into other products, including, but not limited to, modules,
laminates, panels, and building‐integrated materials. The investigation covers imports of CSPV
cells of a thickness equal to or greater than 20 micrometers, having a p/n junction (or variant
thereof) formed by any means, whether or not the CSPV cell has undergone other processing,
including, but not limited to cleaning, etching, coating, and/or addition of materials (including,
but not limited to, metallization and conductor patterns) to collect and forward the electricity
that is generated by the CSPV cell.
Included in the scope of the investigation are imports of photovoltaic cells that contain
crystalline silicon in addition to other photovoltaic materials. This includes, but is not limited
35 Countervailing Duty Investigation of Certain Crystalline Silicon Photovoltaic Products From the People’s Republic of China: Final Affirmative Countervailing Duty Determination, 79 FR 76962, December 23, 2014; and Certain Crystalline Silicon Photovoltaic Products From the People’s Republic of China: Final Determination of Sales at Less Than Fair Value, 79 FR 76970, December 23, 2014; see also USITC Publication 4519 at 3‐4, 6. The U.S. Court of International Trade affirmed Commerce’s scope determinations, as further explained by the agency on remand. See Sunpower Corp. v. United States, CIT Ct. No. 15‐00067, Slip Op. 17‐89 (Ct. Int’l Trade Jul. 21, 2017); Kyocera Solar, Inc. v. United States, CIT Ct. No. 15‐00081, Slip Op. 17‐90 (Ct. Int’l Trade Jul. 21, 2017).
I‐11
to, passivated emitter rear contact (“PERC”) cells, heterojunction with intrinsic thin‐layer
(“HIIT”) cells, and other so‐called “hybrid” cells.36
Articles under consideration also may be described at the time of importation as
components for final finished products that are assembled after importation, including, but not
limited to, modules, laminates, panels, and building‐integrated materials.
Excluded from the scope of investigation are imports of CSPV cells, whether or not
partially or fully assembled into other products, if the CSPV cells were manufactured in the
United States.
Also excluded from the scope of investigation are imports of thin film photovoltaic
products produced from amorphous silicon (a‐Si), cadmium telluride (CdTe), or copper indium
gallium selenide (CIGS).
Also excluded from the scope of the investigation are imports of CSPV cells, not
exceeding 10,000mm2 in surface area, that are permanently integrated into a consumer good
whose function is other than power generation and that consumes the electricity generated by
the integrated CSPV cell. Where more than one CSPV cell is permanently integrated into a
consumer good, the surface area for purposes of this exclusion is the total combined surface
area of all CSPV cells that are integrated into the consumer good.37
36 For a detailed description of these items, see the section in Part I of this report titled “Discussion of specific products.”
37 Crystalline Silicon Photovoltaic Cells (Whether or Not Partially or Fully Assembled into Other Products): Institution and scheduling of safeguard investigation and determination that the investigation is extraordinarily complicated, 82 FR 25331, June 1, 2017.

I‐12
Like or directly competitive articles
In determining whether an article is being imported into the United States in such
increased quantities as to be a substantial cause of serious injury or the threat thereof to the
domestic industry, Commission first defines “the domestic industry producing an article that is
like or directly competitive with the imported article.”38 In assessing what constitutes the
product(s) that is/are like or directly competitive with the imported article(s), the Commission
takes into account such factors as (1) the physical properties of the article, (2) its customs
treatment, (3) its manufacturing process (i.e., where and how it is made), (4) its uses, and (5)
the marketing channels through which the product is sold. Information relating to these factors
is presented in the sections that follow.
In the previous CSPV 1 and CSPV 2 antidumping and countervailing duty determinations,
where the imported products were similar in scope to the imported articles covered by the
current safeguard investigation, the Commission found one like domestic product consisting of
CSPV cells and CSPV modules but not including thin film products.39 In its CSPV 1 investigations,
38 19 U.S.C. § 2252(b)(1)(A). 39 In antidumping and countervailing duty investigations, the domestic like product is defined as “a
product which is like, or in the absence of like, most similar in characteristics and uses with, the article subject to an investigation.” 19 U.S.C. § 1677(10). The Commission generally considers a number of factors in antidumping and countervailing duty investigations, including (1) physical characteristics and uses, (2) interchangeability, (3) channels of distribution, (4) customer and producer perceptions, (5) manufacturing facilities, processes, and employees, and where appropriate, (6) price. Nippon Steel Corp. v. United States, 19 CIT 450, 455 n.4 (1995). The Commission found that due to differences in their underlying raw materials, manufacturing facilities, manufacturing processes, and production employees, CSPV and thin film products differ significantly in physical characteristics, conversion efficiency, output, and other capabilities. The Commission noted that these physical limitations affect their relative prices, limit their interchangeability, and limit any overlap in channels of distribution, particularly for non‐utility sales. Crystalline Silicon Photovoltaic Cells and Modules From China, Inv. Nos. 701‐TA‐481 and 731‐TA‐1190 (Final), USITC Publication 4360, November 2012, pp. 4‐12; Certain Crystalline Silicon Photovoltaic
(continued...)
I‐13
the Commission determined not to define CSPV cells and CSPV modules as separate domestic
like products, and no party argued otherwise.40
In the CSPV 2 investigations, the Taiwan respondents argued that the Commission
should define CSPV cells and CSPV modules as separate domestic like products based on a
“semi‐finished” domestic like product analysis.41 In its analysis under the “semi‐finished
products” factors in CSPV 2, the Commission found that (1) the upstream article (i.e., CSPV
cells) is dedicated for use in the production of the downstream article (i.e., CSPV modules), (2)
there are no separate markets for CSPV cells and CSPV modules, (3) CSPV cells and CSPV
modules share the same primary physical characteristics and functions, (4) CSPV cells undergo
only one major manufacturing step (assembly) to become CSPV modules and that process does
not change the essential characteristics of the CSPV cells, and (5) CSPV cells represent a
substantial portion of the total cost of finished CSPV modules.42
(…continued) Products from China and Taiwan, Inv. Nos. 701‐TA‐511 and 731‐TA‐1246‐1247 (Final), USITC Publication 4519, February 2015, pp. 8‐15.
40 USITC Publication 4360 at 6; USITC Publication 4295 at 10‐11. 41 Under the semi‐finished domestic like product analysis, the Commission considers whether the
upstream product is dedicated for use in the downstream product, whether the upstream and downstream products are sold in separate markets; differences in physical characteristics and functions of the upstream and downstream products; differences in value; and extent of the processes used to transform upstream into downstream articles. Live Cattle from Canada and Mexico, Inv. Nos. 701‐TA‐386 and 731‐TA‐812 and 813 (Preliminary), USITC Publication 3155, February 1999, p. 6.
42 The Commission concluded that CSPV cells are dedicated for use in CSPV modules, and the vast majority of the CSPV cells manufactured in the United States are consumed by the CSPV cell manufacturer in its own production of CSPV modules. It found further that the fraction of CSPV cells manufactured in the United States that are sold in the commercial market are used to manufacture CSPV modules, thereby indicating a lack of separate markets for the upstream and downstream products. The Commission noted that the processes used to manufacture CSPV modules from CSPV cells are technologically sophisticated, more labor intensive than manufacturing CSPV cells, and add value to the product, but they enhance rather than change the basic function of the CSPV cells, which is to convert sunlight into electricity. Certain Crystalline Silicon Photovoltaic Products from China and Taiwan,
(continued...)

I‐14
In its petition in the current safeguard investigation, Suniva asks the Commission to find
a “single” domestically produced article that is “the same as the imported articles subject to
{the} petition.”43 In its prehearing brief, Suniva argues that “there is a single domestic article—
CSPV cells and CSPV modules.”44 It notes that CSPV cells are dedicated for use in modules and
that most domestically produced CSPV cells are consumed in the production of modules by the
U.S. CSPV cell producers themselves. It adds that, although the manufacturing process for CSPV
modules is more technologically sophisticated and more labor intensive than that for CSPV
cells, the added value to the product does not change the basic function of the CSPV cell, but
enhances the CSPV product.45 SolarWorld similarly argues in its prehearing brief that “domestic
CSPV cells and modules are like the imported CSPV cells and modules that are the subject of
this investigation.”46 Both Suniva and SolarWorld argue that thin film products are distinct from
CSPV cells and modules and should not be considered part of the same domestic product.47 No
firm requested that the Commission collect data concerning other possible alternative products
in their comments on the Commission’s draft questionnaires48 and no respondent interested
(…continued) Inv. Nos. 701‐TA‐511 and 731‐TA‐1246‐1247 (Final), USITC Publication 4519, February 2015, pp. 8‐15 (Commissioner Broadbent dissenting and finding that CSPV cells and CSPV modules were separate domestic like products).
43 Petition for Global Safeguard Relief Pursuant to Sections 201‐202 of the Trade Act of 1974 ‐ Crystalline Silicon Photovoltaic Cells and Modules (“Petition”), April 26, 2017, pp. 5 and 9.
44 Suniva’s prehearing brief, p. 6. 45 Ibid., pp. 5‐6. 46 SolarWorld’s prehearing brief, exhibit 1, p. 7. 47 Suniva’s prehearing brief, p. 6.; SolarWorld’s prehearing brief, exhibit 1, p. 8. 48 Comments on the draft questionnaires were submitted on behalf of the following: (1) Canadian
Solar Inc. and Canadian Solar (USA) Inc., (2) Tesla, Inc. and its subsidiary, SolarCity Corporation, (3) the Government of Canada, (4) Goal Zero, LLC, (5) Korea Photovoltaic Industry Association, Hanwha Q CELLS Korea, LG Electronics, and Hyundai Green Energy, (6) Auxin Solar, Inc., (7) Suniva, Inc., (8) Sunrun Inc., (9) SolarWorld Americas, Inc., and (10) Solar Energy Industries Association (“SEIA”).

I‐15
party requested a different definition at the injury hearing or in their prehearing or posthearing
injury briefs.
Physical properties
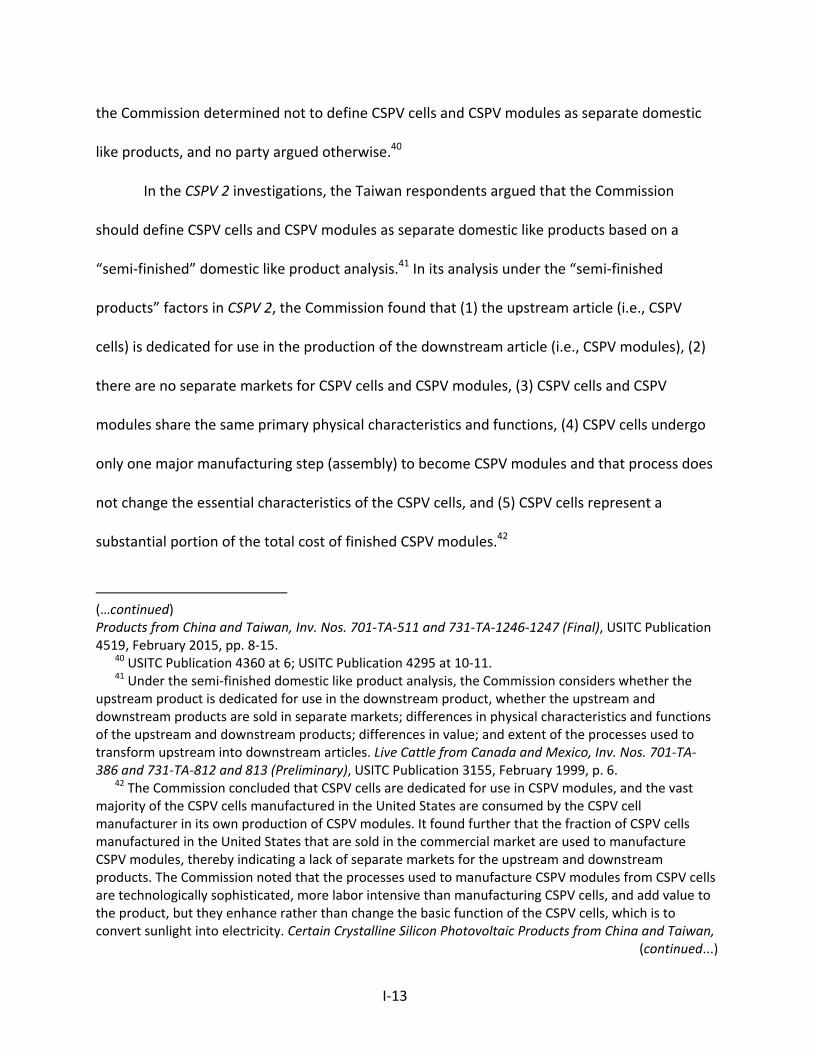
CSPV cells use crystalline silicon to convert sunlight to electricity and are the basic
elements of a module (figure I‐1). They have a positive layer, a negative layer and a positive‐
negative junction (p/n junction). Electricity is generated when sunlight strikes the CSPV cell,
knocking electrons loose that flow onto thin metal “fingers” that run across the CSPV cell and
conduct electricity to the busbars.49 Most CSPV cells, as of 2016, were 156.0 mm by 156.0 mm
(6.14 inches by 6.14 inches) or 156.75 mm by 156.75 mm (6.17 inches by 6.17 inches).50 As of
2017, CSPV cells typically have wattages51 ranging from 4 watts to more than 5 watts per CSPV
cell.52 Cells are the essential element in CSPV modules (also commonly referred to as panels),
which in turn are the main components of CSPV systems. Solar CSPV systems53 convert sunlight
into electricity for on‐site use or for distribution through the electric grid.
49 USITC Publication 4519, p. I‐19. 50 CSPV wafers are also referred to by nomenclature related to their size (e.g., M0, M1, and M2). M2
wafers have a larger diameter and more surface area than M0 and M1 wafers. International Technology Roadmap for Photovoltaic (“ITRPV”), 2016 Results, March 2017, pp. 32–33, http://www.itrpv.net/.cm4all/iproc.php/ITRPV%20Eighth%20Edition%202017.pdf?cdp=a; Atecom Technology, Company Introduction, n.d., p. 7, https://file01.itaiwantrade.com/7c4db5dd‐d9f6‐4dc4‐926f‐dcec9603a2e7/Atecom_Company_Introduction_‐_Solar_wafer_2016.pdf (accessed July 31, 2017).
51 This report will discuss data in terms of watts (W), kilowatts or kW (equal to 1,000 watts), megawatts or MW (1,000 kW), and gigawatts or GW (1,000 MW).
52 Compiled from company product data sheets. 53 In addition to CSPV products, there is commercial production of thin film photovoltaic products
(which are not included in the scope of the investigation). Thin film cells and modules use a several micron thick layer of a photosensitive semiconductor material such as amorphous silicon (a‐Si), cadmium telluride (CdTe), copper indium (gallium) (di)selenide (CIS or CIGS) to convert sunlight to electricity. USITC Publication 4360, p. I‐20.
I‐16
Figure I-1
CSPV cells
Source: SolarWorld Website, http://www.solarworld.de/en/group/from-sand-to-module/solar-cells/ (accessed July 6, 2017).
CSPV laminates consist of the CSPV cells that are connected, encapsulated in an ethyl
vinyl acetate (“EVA”) film,54 and covered with a glass front sheet and a back sheet (figure I‐2).55
The back sheet is most commonly a plastic film composite, though glass is also used in some
applications such as bifacial modules (see below for a discussion of bifacial technology).56
54 There are other encapsulation materials that are used, but EVA accounted for more than 90 percent of the market in 2016. ITRPV, 2016 Results, March 2017, p. 17, http://www.itrpv.net/.cm4all/iproc.php/ITRPV%20Eighth%20Edition%202017.pdf?cdp=a.
55 ITRPV, 2016 Results, March 2017, pp. 13, 17, http://www.itrpv.net/.cm4all/iproc.php/ITRPV%20Eighth%20Edition%202017.pdf?cdp=a; SolarWorld, “SolarWorld Quality,” brochure, May 2014, 10, https://www.solarworld‐usa.com/~/media/www/files/brochures/sw‐01‐7182us‐flyer‐solarworldquality.pdf.
56 ITRPV, 2016 Results, March 2017, pp. 17, 36, http://www.itrpv.net/.cm4all/iproc.php/ITRPV%20Eighth%20Edition%202017.pdf?cdp=a.

I‐17
Figure I-2
Layers of a typical CSPV laminate
Source: SolarWorld, “SolarWorld Quality,” brochure, May 2014, 10, https://www.solarworld-usa.com/~/media/www/files/brochures/sw-01-7182us-flyer-solarworldquality.pdf.
CSPV modules typically consist of the laminate that is typically “framed” in aluminum,
and then attached to a junction box. CSPV modules can be used in both ground‐mounted and
rooftop‐mounted systems and in both the off‐grid market segment and the three on‐grid
market segments—residential, nonresidential, and utility.57 The junction box can be connected
to other modules, an inverter (which converts the direct current generated by the system to
alternating current), or, in the case of off‐grid modules, a charge controller (which controls
battery charging) and battery.58 Typical on‐grid modules have 60, 72, or 96 CSPV cells, though
57 Photovoltaics (PV) do not include solar water heat and concentrated solar power (CSP). While PV uses a photosensitive semiconductor material to convert sunlight directly to electricity, solar water heat uses sunlight to heat water and CSP uses reflected sunlight to generate steam or a vapor that turns a turbine to generate electricity. USITC Publication 4519, p. I‐18.
58 USITC Publication 4519, p. I‐19.
I‐18
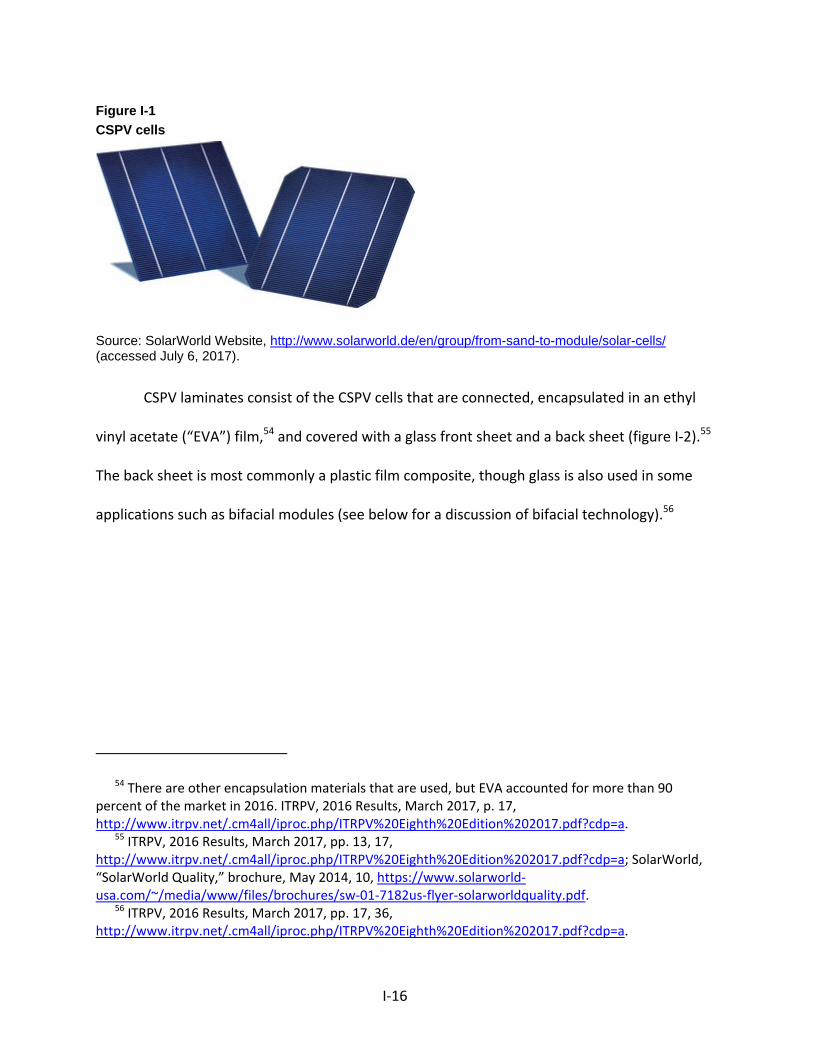
in some instances CSPV cells are cut in half resulting in 120 or 144 half‐cut CSPV cells (see the
discussion of specific products section) (figure I‐3).59 CSPV 60 cell modules are, on average 65
inches long and 39 inches wide, and are typically 1.5 to 2 inches in depth. CSPV 60 cell modules
commonly weigh between 33 to 51 pounds. CSPV 72 cell modules are generally around 78
inches long, 39 inches wide, and 1.5 to 2 inches thick.60 CSPV 72 cell modules generally weigh
from 45 to 61 pounds.61
Figure I-3
CSPV 60 cell module (left) and 72 cell module (right)
Source: Suniva, Suniva Optimus Series Monocrystalline Solar Modules, OPT Series: OPT 72 cell modules (silver frame), brochure, January 18, 2017, http://suniva.com/documents/[SAMD_0060]%20Suniva%20Optimus%2060%20Silver%20OCOF%20Rev%205%202017%2001%2018.pdf; Suniva, Suniva Optimus Series Monocrystalline Solar Modules, OPT Series: OPT 60 cell modules (silver frame), brochure, January 18, 2017, http://suniva.com/documents/[SAMD_0051]%20Suniva%20Optimus%2072%20cell%2038mmOCOF%20-%20Rev%209%20-%202017%2001%2018.pdf.
59 Schwartz, Joe, “High‐Power c‐Si PV Module Specifications,” SolarPro, Issue 10.3, May/June 2017, pp. 48–59, https://solarprofessional.com/articles/products‐equipment/modules/high‐power‐c‐si‐pv‐module‐specifications‐2017#.WV‐8AP6Wx‐A.
60 EnergySage, “What is the Average Solar Panel Size and Weight?” n.d., http://news.energysage.com/average‐solar‐panel‐size‐weight/ (accessed July 7, 2017).
61 Schwartz, Joe, “High‐Power c‐Si PV Module Specifications,” SolarPro, Issue 10.3, May/June 2017, 48–59, https://solarprofessional.com/articles/products‐equipment/modules/high‐power‐c‐si‐pv‐module‐specifications‐2017#.WV‐8AP6Wx‐A.

I‐19
The two main types of CSPV cells and modules are monocrystalline silicon and
multicrystalline (or polycrystalline) silicon, though there are various products within these two
categories (see the discussion of specific products section). Monocrystalline cells are made
from a single grown crystal and tend to convert sunlight into electricity more efficiently.
Multicrystalline cells have a random crystal structure and tend to have a lower conversion
efficiency.62
The conversion efficiency of CSPV modules has increased over time, with the median
efficiency of modules installed in U.S. residential systems, for example, increasing from 15.3
percent in 2012 to 16.7 percent in 2015 (figure I‐4).63 The median efficiency of multicrystalline
modules (the only type for which separate data were available) installed in U.S. residential
systems increased from 14.5 percent to 16.0 percent during 2012–15.64 There are a range of
conversion efficiencies for monocrystalline and multicrystalline modules. For example,
efficiencies for 72 cell or more multicrystalline modules listed in SolarPro’s 2017 module
specifications range from 15.2 to 17.8 percent, while efficiencies for monocrystalline modules
range from 15.5 to 21.5 percent (figure I‐5).65
62 Conversion efficiency is the percent of sunlight that is converted to electricity. USITC Publication 4519, p. I‐19.
63 These data may include some thin film products. Barbose, Galen and Naïm Darghouth, Tracking the Sun IX: The Installed Price of Residential and Non‐Residential Photovoltaic Systems in the United States, Data file, Lawrence Berkeley National Laboratory, 2016, https://emp.lbl.gov/publications/tracking‐sun‐ix‐installed‐price.
64 Barbose, Galen and Naïm Darghouth, Tracking the Sun IX: The Installed Price of Residential and Non‐Residential Photovoltaic Systems in the United States, Data file, Lawrence Berkeley National Laboratory, 2016, https://emp.lbl.gov/publications/tracking‐sun‐ix‐installed‐price.
65 Schwartz, Joe, “High‐Power c‐Si PV Module Specifications,” SolarPro, Issue 10.3, May/June 2017, pp. 48–59, https://solarprofessional.com/articles/products‐equipment/modules/high‐power‐c‐si‐pv‐module‐specifications‐2017#.WV‐8AP6Wx‐A.

I‐20
Figure I-4
CSPV: Median efficiency of modules installed in residential systems, by year of installation
Note: The “all modules” category may include some thin film products. Source: Barbose, Galen and Naïm Darghouth, Tracking the Sun IX: The Installed Price of Residential and Non-Residential Photovoltaic Systems in the United States, Data file, Lawrence Berkeley National Laboratory, 2016, https://emp.lbl.gov/publications/tracking-sun-ix-installed-price.
Figure I-5
CSPV: Efficiencies of modules (72 or more cells, 300 or more watts) listed in SolarPro’s 2017 module specifications
Note: According to SolarPro, its 2017 list of CSPV module specifications includes “232 models with rated outputs of 300 W STC and greater from 29 manufacturers. The included models are listed and available for deployment in US-based projects. This c-Si specifications table is not intended to be exhaustive or all-inclusive; rather, our goal is to present comparative information on a wide cross-section of high-power PV solutions for utility, commercial and select residential projects.” For comparison purposes, the data presented here include the models with 72 or more CSPV cells and for which a module efficiency was included. Source: Schwartz, Joe, “High-Power c-Si PV Module Specifications,” SolarPro, Issue 10.3, May/June 2017, pp. 48–59, https://solarprofessional.com/articles/products-equipment/modules/high-power-c-si-pv-module-specifications-2017#.WV-8AP6Wx-A.
13%
14%
15%
16%
17%
18%
2012 2013 2014 2015
Median m
odule efficiency
All modules
Multicrystalline modules
0%
10%
20%
30%
40%
50%
60%
70%
15.01 to 16 16.01 to 17 17.01 to 18 >18
Share of 72 or more cell
modules listed
Module efficiency (percent)
Multicrystalline
Monocrystalline

I‐21
Multicrystalline 60 cell modules commonly range from around 240 to 290 watts, while
monocrystalline 60 cell modules commonly range from around 260 to 320 watts.66 The average
output of 72 cell multicrystalline modules listed in SolarPro’s 2017 module specifications was
319 watts, while the average power output of 72 cell monocrystalline modules was 340 watts.67
In addition to standard size modules, CSPV cells can be used in building integrated PV
(“BIPV modules” or “BIPV products”). BIPV products are materials integrated into the building
envelope, such as the façade or roof, containing CSPV cells. These building integrated materials
replace conventional construction materials, such as glass or roof shingles, taking over the
function that conventional materials would otherwise perform while also producing electricity
(figure I‐6).68
66 Compiled from company module data sheets downloaded in 2017. 67 SolarPro’s module specifications only include modules of 300 watts or more. Data presented here
for 72 cell modules include those with 144 half‐cut cells. Schwartz, Joe, “High‐Power c‐Si PV Module Specifications,” SolarPro, Issue 10.3, May/June 2017, pp. 48–59, https://solarprofessional.com/articles/products‐equipment/modules/high‐power‐c‐si‐pv‐module‐specifications‐2017#.WV‐8AP6Wx‐A.
68 Steven Strong, “Building Integrated Photovoltaics,” Whole Building Design Guide, October 19, 2016, https://www.wbdg.org/resources/building‐integrated‐photovoltaics‐bipv; Polysolar Ltd., Guide to BIPV, 2015, p. 1, http://www.polysolar.co.uk/documents/2017%20Guide%20to%20BIPV.pdf.

I‐22
Figure I-6
Building integrated CSPV
Source: Photo courtesy of U.S. Department of Energy (DOE)/National Renewable Energy Lab (NREL), credit Atlantis Energy, Inc.; USITC Publication 4519, p. I-19.
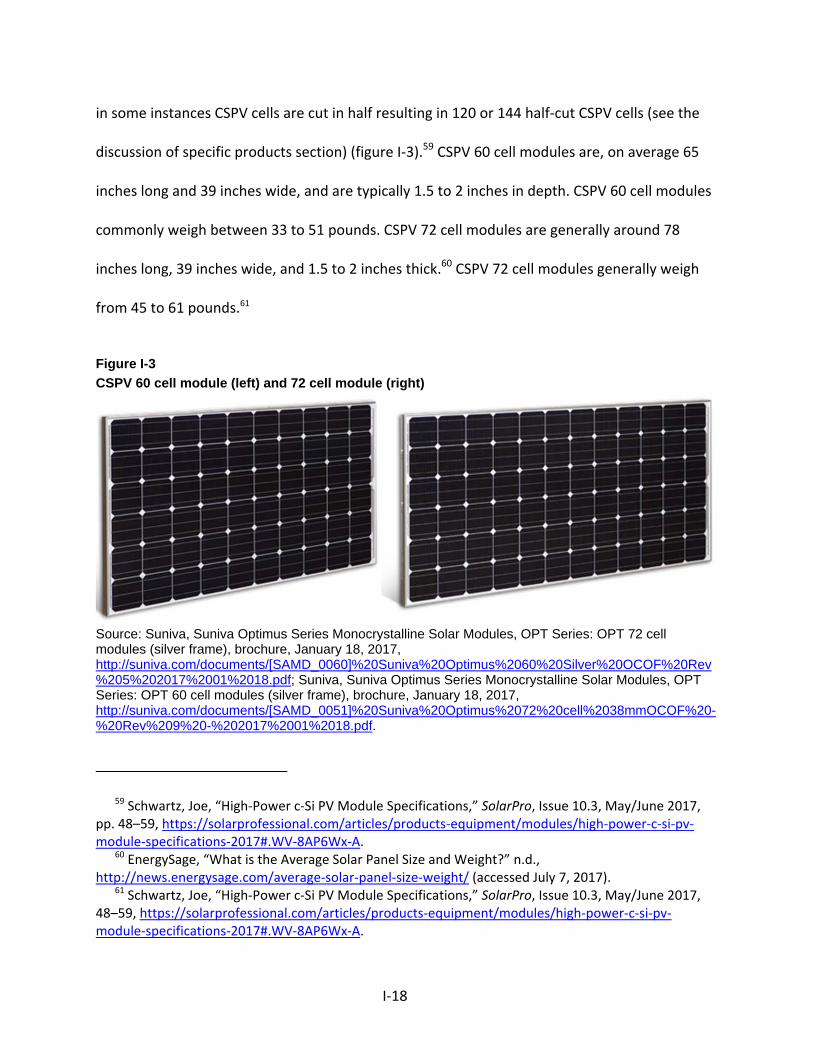
CSPV modules are also used in off‐grid applications. In many instances, modules
typically used in on‐grid applications may also be used in off‐grid applications. For example, a
house that is not connected to the grid could use the same modules as a house that is grid‐
connected.69 However, there are a broad range of off‐grid applications, such as power
generation in remote locations, mobile power solutions, telecommunications power and
lighting systems, and portable consumer goods (such as systems for recharging consumer
electronics like tablets and phones) (figure I‐7). The CSPV modules used in some of these
applications may be different from those typically used in on‐grid applications. For example,
69 USITC Publication 4519, pp. I‐20–21.
I‐23
these products are often designed for specific power and portability requirements, and some
modules have different wattages than modules used in grid‐connected applications.70
Figure I-7
CSPV: Off-grid solar lighting
Source: Photo courtesy of DOE/NREL.
70 Ameresco Solar Website, http://www.amerescosolar.com/solar‐power‐systems‐grid‐kits‐and‐battery‐backup (accessed July 9, 2017); Solar Electric Power Company Website, http://www.sepco‐solarlighting.com/systems/solarviper?hsCtaTracking=3ee71ee4‐b88f‐4b28‐a65e‐ca229920c533%7C33d1f599‐7389‐4913‐be23‐d083febf832e (accessed July 9, 2017); Solar Stik Website, http://www.solarstik.com/products/power‐generation/ (accessed July 9, 2017); Goal Zero Website, http://www.goalzero.com/solar‐panels (accessed July 9, 2017).

I‐24
Manufacturing facilities and processes71
There are five principal stages to manufacture CSPV products. First, polysilicon is
refined, then it is formed into ingots, which are sliced into wafers, converted to CSPV cells, and
assembled into the finished product, modules (figure I‐8). These are discrete production steps
that may be done in different plants or locations. Companies may source products at each stage
of the value chain or produce the products in‐house. CSPV cells and modules are tested and
inspected during the production process.72 The ingot and wafer production process differs for
monocrystalline and multicrystalline cells, as discussed below.
Figure I-8
CSPV production process
Note: For ingots, the top picture is a crystal used in monocrystalline wafers, while the bottom picture is an ingot used in making multicrystalline wafers.
Source: SolarWorld, “Energy for You and Me” brochure, pp. 6–7, 9; ingot photo courtesy of DOE/NREL, credit John Wohlgemuth, Solarex; USITC Publication 4519.
71 This section is primarily from USITC Publication 4519, pp. I‐25–29. References are to any additional sources used for changes to the write‐up as it appeared in publication 4519.
72 SolarWorld, “Real Value,” 2016, https://www.solarworld‐usa.com/why‐choose‐solarworld/the‐solarworld‐standard#Product_certifications.

I‐25
Silicon refining
The first step in the CSPV value chain is refining polysilicon. There are multiple
approaches to polysilicon refining. This discussion will focus on the Siemens method, which
accounted for more than 85 percent of global production in 2016, and fluidized bed reactor
(FBR) technology, which accounts for most of the remaining market.73
In the first step in the Siemens process, quartz (silicon dioxide) and carbon are heated to
around 1,800 degrees Celsius. The carbon reacts with the oxygen, resulting in carbon dioxide
and silicon with a purity of around 98 to 99 percent. The silicon is then combined with hydrogen
chloride gas at 300 to 350 degrees Celsius, with the reaction resulting in the liquid
trichlorosilane. Next, heated silicon rods are inserted into a Siemens reactor, where they are
further heated to 1,000 degrees Celsius or more. Hydrogen and trichlorosilane gas are fed into
the reactor. The silicon from the trichlorosilane is deposited onto the rods, which steadily
increase in size until they are removed from the reactor about a week later. The resulting
products are high purity polysilicon chunks or rocks.
Instead of inserting rods, “FBR uses seed granules of purified silicon. The seed granules
are fed into a chamber that has heated silane gas entering from below and exiting above. The
flow of gas ‘fluidizes’ the silicon granules, causing them to flow like a liquid, as the silane gas
breaks down and deposits silicon layers on them. The granules grow larger and heavier and exit
when they are sufficiently large. As they do so, new seed granules and gas are introduced into
73 ITRPV, 2016 Results, March 2017, p. 9, http://www.itrpv.net/.cm4all/iproc.php/ITRPV%20Eighth%20Edition%202017.pdf?cdp=a.
I‐26
the chamber and the process continues.”74 The FBR process, which is newer than the Siemens
process, uses 80 to 90 percent less energy, requires a smaller footprint, is a continuous process,
takes up less space in shipping, and can increase downstream production efficiency.75 However,
the process is difficult to scale and achieve high purity production at low cost.76
Ingots and wafers for monocrystalline cells
In the Czochralski process77 for producing crystals used in monocrystalline wafers,
polysilicon rocks are first placed into a quartz crucible along with a small amount of boron,
which is used to provide a positive electric orientation (figure I‐9). The crucible is then loaded
into a Czochralski furnace and heated to about 2,500 degree Fahrenheit. Once the polysilicon is
melted, a seed crystal is lowered into the material and rotated, with the crucible rotated in the
opposite direction. The melt starts to solidify on the seed and the seed is slowly raised out of
the melt—creating a single long crystal. The crystal is then cooled before it is moved onto the
next step. The process of growing the crystal takes about 2.5 days.78
74 REC Silicon website, http://www.recsilicon.com/technology/rec‐silicons‐fluidized‐bed‐reactor‐process (accessed June 12, 2017).
75 REC Silicon website, http://www.recsilicon.com/technology/rec‐silicons‐fluidized‐bed‐reactor‐process (accessed June 12, 2017); IHS Markit, “Fluidized Bed Reactor Technology Stakes Its Claim in Solar Polysilicon Manufacturing,” News release, May 7, 2014, http://news.ihsmarkit.com/press‐release/design‐supply‐chain‐media/fluidized‐bed‐reactor‐technology‐stakes‐its‐claim‐solar‐poly.
76 IHS Markit, “Fluidized Bed Reactor Technology Stakes Its Claim in Solar Polysilicon Manufacturing,” News release, May 7, 2014, http://news.ihsmarkit.com/press‐release/design‐supply‐chain‐media/fluidized‐bed‐reactor‐technology‐stakes‐its‐claim‐solar‐poly.
77 This discussion will focus on the Czochralski process, which accounted for more than 95 percent of production in 2016. ITRPV, 2016 Results, March 2017, p. 19, http://www.itrpv.net/.cm4all/iproc.php/ITRPV%20Eighth%20Edition%202017.pdf?cdp=a.
78 SolarWorld Website, https://www.solarworld‐usa.com/solar‐101/making‐solar‐panels (accessed July 15, 2017).

I‐27
Figure I-9
Czochralski process, crucible loading/charging (left), seed crystal (second from left), crystal growing (second from right), and finished crystal (right)
Source: SolarWorld Website, https://www.solarworld-usa.com/solar-101/making-solar-panels (accessed July 15, 2017).
Once the crystal has cooled, it is processed into wafers. The top and tail (each end of the
cylindrical crystal) are cut off (figure I‐10).79 The remaining portion of the crystal (or ingot) is
cut into equal length pieces and squared. In squaring, the rounded sides of the ingot are cut
into four flat sides, leaving only rounded corners. A wire saw then slices the ingots into wafers.
A majority of global manufacturers have switched to diamond wire saws for monocrystalline
wafer slicing, which has several benefits including increasing the speed of the production
process.80 The wafers are then cleaned, dried, and inspected.81
79 These tops and tails can be re‐used. Yingli Solar, Form 20‐F, Annual Filing to the Securities and Exchange Commission, May 16, 2017, p. 64, http://ir.yinglisolar.com/phoenix.zhtml?c=213018&p=irol‐sec.
80 ITRPV, 2016 Results, March 2017, pp. 8–9, http://www.itrpv.net/.cm4all/iproc.php/ITRPV%20Eighth%20Edition%202017.pdf?cdp=a; Meyer Burger Website, https://www.meyerburger.com/gb/en/technologies/photovoltaics/high‐efficiency‐technologies/diamond‐wire/ (accessed July 15, 2017); Roselund, Christian, “SolarWorld Invests in Diamond Wire Saws for German Wafering,” PV Magazine, January 16, 2017, https://www.pv‐magazine.com/2017/01/16/solarworld‐to‐invest‐in‐diamond‐wire‐saws‐for‐german‐wafer‐production/.

I‐28
Figure I-10
Wafer production: Cutting off the top and tail (left), squaring (middle), and slicing into wafers (right)
Source: SolarWorld Website, https://www.solarworld-usa.com/solar-101/making-solar-panels (accessed July 15, 2017).
Ingots and wafers for multicrystalline cells
For multicrystalline ingots, the first step is also loading polysilicon into a crucible. This
crucible is then loaded into a directional solidification systems (“DSS”) furnace, where it is cast
into ingots. The ingot is then cut into blocks. These blocks are tested and any parts of the block
that do not pass these tests are cropped off. The blocks are sliced into wafers using a wire saw.
Finally, the wafers are cleaned, dried, and inspected.82 This process results in square wafers,
while the monocrystalline process results in wafers with rounded corners.
CSPV cells83
The monocrystalline and multicrystalline wafers, which are 180 to 200 micrometers
thick, are next processed into CSPV cells. CSPV cell production is capital intensive and requires a
skilled workforce. Some firms use a highly automated manufacturing process, while others mix
(…continued)
81 JA Solar, “Form 20‐F,” Annual Filing to the Securities and Exchange Commission,” April 26, 2017, p. 43, http://investors.jasolar.com/phoenix.zhtml?c=208005&p=irol‐sec.
82 JA Solar, “Form 20‐F,” Annual Filing to the Securities and Exchange Commission,” April 26, 2017, p. 43, http://investors.jasolar.com/phoenix.zhtml?c=208005&p=irol‐sec.
83 The cell manufacturing process varies by company and technology.

I‐29
automation and manual labor in their production processes.84 The main steps85 in CSPV cell
production are as follows:
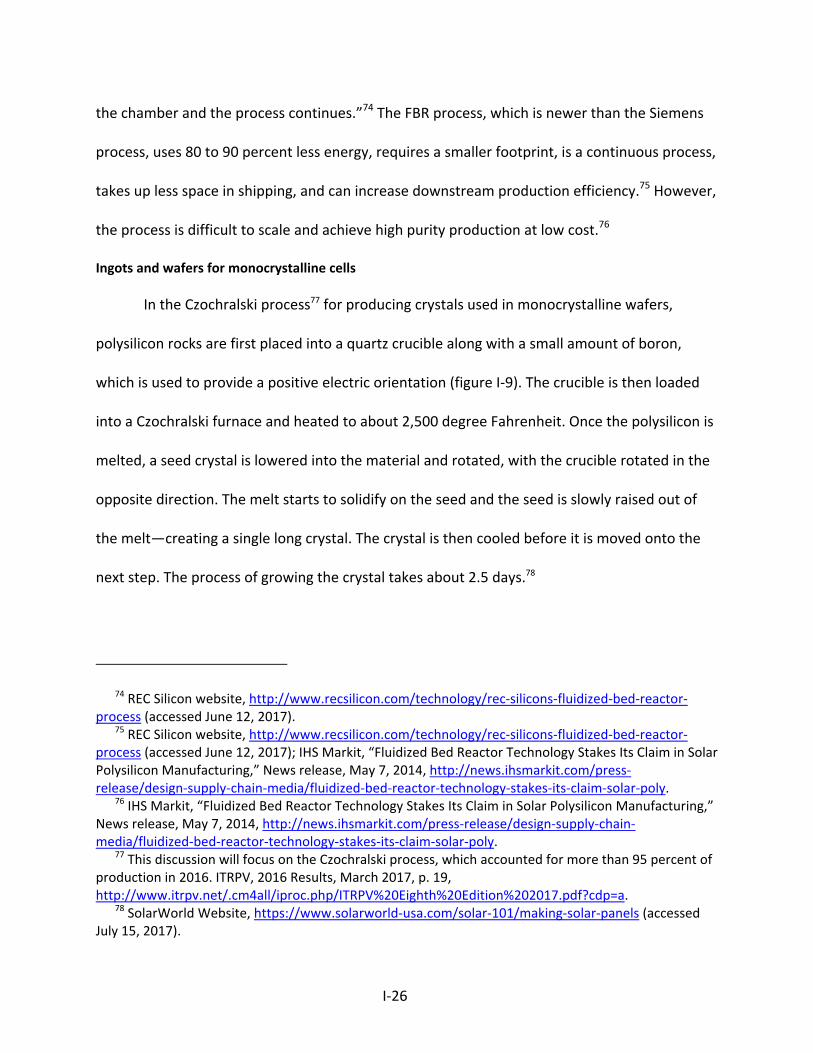
Cleaning and texturing: First, the wafers are cleaned, then the surface of the wafer
undergoes a chemical treatment that reduces the reflection of sunlight and increases
light absorption (figure I‐11).
Diffusion: In the next step, “phosphorus is diffused into a thin layer of the wafer
surface. The molecular‐level impregnation occurs as the wafer surface is exposed to
phosphorus gas at a high heat, a step that gives the surface a negative potential
electrical orientation. The combination of that layer and the boron‐doped layer below
creates a positive‐negative, or P/N, junction–a critical partition in the functioning of a PV
cell.”86
Edge isolation: A thin layer of silicon is then removed from the edge of the CSPV cell to
separate the positive and negative layers.
Coating: Next, a silicon nitride antireflective coating is added to the PV cells to increase
the absorption of sunlight.
Printing: Metals are then printed on the solar CSPV cell to collect the electricity. On the
front of the CSPV cell these metals are printed in thin metal strips called fingers, which
84 JA Solar, “Form 20‐F,” Annual Filing to the Securities and Exchange Commission,” April 26, 2017, p. 42, http://investors.jasolar.com/phoenix.zhtml?c=208005&p=irol‐sec.
85 This section will discuss the general manufacturing process. There may be additional steps for some of the specific technologies discussed below.
86 SolarWorld, “Energy for You and Me” brochure, p. 12.

I‐30
are connected to the rest of the module via busbars. A metal layer, typically aluminum,
is also printed on the back of the CSPV cell.87
Co‐firing: The CSPV cells then enter a furnace, where the “high temperature causes the
silver paste to become imbedded in the surface of the silicon layer, forming a reliable
electrical contact.”88
Testing and sorting: The final step in the process is the testing and sorting of the CSPV
cells based on their characteristics and efficiency.
87 JA Solar, “Form 20‐F,” Annual Filing to the Securities and Exchange Commission,” April 26, 2017, p. 42, http://investors.jasolar.com/phoenix.zhtml?c=208005&p=irol‐sec; E‐Ton Solar Website, http://www.e‐tonsolar.com.tw/Technology.asp?le=english&fid=63 (accessed June 9, 2017).
88 JA Solar, “Form 20‐F,” April 16, 2013, p. 41.
I‐31
Figure I-11
CSPV cell production: Texturing (top) and screen printing (bottom)
Source: SolarWorld, “Energy for You and Me” brochure, pp. 12–13.
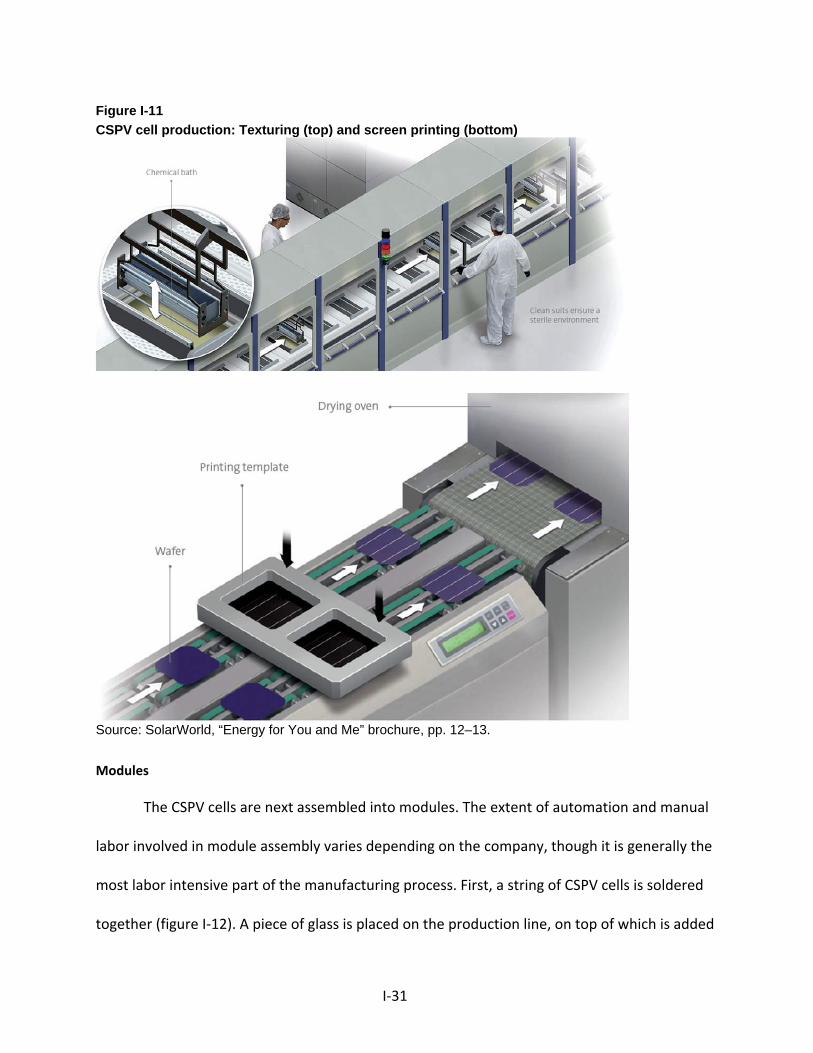
Modules
The CSPV cells are next assembled into modules. The extent of automation and manual
labor involved in module assembly varies depending on the company, though it is generally the
most labor intensive part of the manufacturing process. First, a string of CSPV cells is soldered
together (figure I‐12). A piece of glass is placed on the production line, on top of which is added

I‐32
a piece of ethyl vinyl acetate (“EVA”). The CSPV cells are laid out in a rectangular matrix that will
provide the appropriate wattage and power requirements. Typically a sealant is added, often
EVA, and a back sheet is added. The CSPV cells are then laminated in a vacuum and are cured.
At this stage the CSPV cells are referred to as a “laminate.” Frames are then usually attached to
the laminate, and a junction box is attached to the back. In the final step, modules are cleaned
and inspected.
Figure I-12
Soldering CSPV cells together into strings
Source: SolarWorld, “Energy for You and Me” brochure, pp. 12–13.

I‐33
Uses89
There are four primary market segments for CSPV products. There are three grid‐
connected market segments–residential, nonresidential, and utility–and an off‐grid market. In
the grid‐connected market, installations are usually either ground‐mounted or roof‐mounted.
In addition to the module, there are a number of other components of the installation called
the balance of system (“BOS”). The BOS includes components such as the inverter, and the
racking on which the system is installed.90
Residential grid‐connected systems are installed at individual homes. CSPV modules are
typically installed on the roof, though they can also be ground‐mounted, and connected to an
inverter. The system can use a central inverter, which converts the power from multiple
modules, or each module can have its own microinverter attached. In residential installations,
the electricity generated by the system is used for power in the individual home (figure I‐13).
Homeowners use grid energy when solar electricity generation is not sufficient to meet demand
and often feed energy back into the grid when solar electricity generation exceeds home use. In
the United States, the median size of a residential PV installation increased from 5.5 kilowatts
(“kW”) in 2012 to 6.1 kW in 2015.91 92
89 This section is primarily from USITC Publication 4519, pp. I‐21–25. References are to any additional sources used for changes to the analysis as it appeared in publication 4519.
90 In addition to equipment, there are a number of services associated with installing a PV system such as site assessment and design, permitting, financing, and the system installations, as well as operations and maintenance services after the installation is completed.
91 Barbose, Galen and Naïm Darghouth, Tracking the Sun IX: The Installed Price of Residential and Non‐Residential Photovoltaic Systems in the United States, Data file, Lawrence Berkeley National Laboratory, 2016, https://emp.lbl.gov/publications/tracking‐sun‐ix‐installed‐price.

I‐34
Figure I-13
Residential grid-connected CSPV system
Source: DOE, Office of Energy Efficiency and Renewable Energy (EERE) Website, http://www.energysavers.gov/your_home/electricity/index.cfm/mytopic=10720 (accessed November 9, 2011); USITC Publication 4519, p. I-22.
Nonresidential systems are installed at commercial, industrial, government, and similar
buildings and sites (figure I‐14). Nonresidential installations are typically larger than residential
installations—for nonresidential systems 500 kW or less, the median size in 2015 was 31 kW,
though systems can be substantially larger.93 However, they function similarly to residential
(…continued)
92 1,000 watts equals 1kW; 1,000 kW equals 1 MW; 1,000 MW equals 1 GW; and 1,000 GW equals 1 TW.
93 Nonresidential systems can also be substantially larger. The Tracking the Sun report also includes the median size of systems 500 kW or larger, which was 1.1 GW in 2015. However, their definition of system size likely includes systems that would be classified as utility projects in other definitions. Barbose, Galen and Naïm Darghouth, Tracking the Sun IX: The Installed Price of Residential and Non‐Residential Photovoltaic Systems in the United States, Data file and report, Lawrence Berkeley National Laboratory, 2016, pp. 7, 11, https://emp.lbl.gov/publications/tracking‐sun‐ix‐installed‐price.
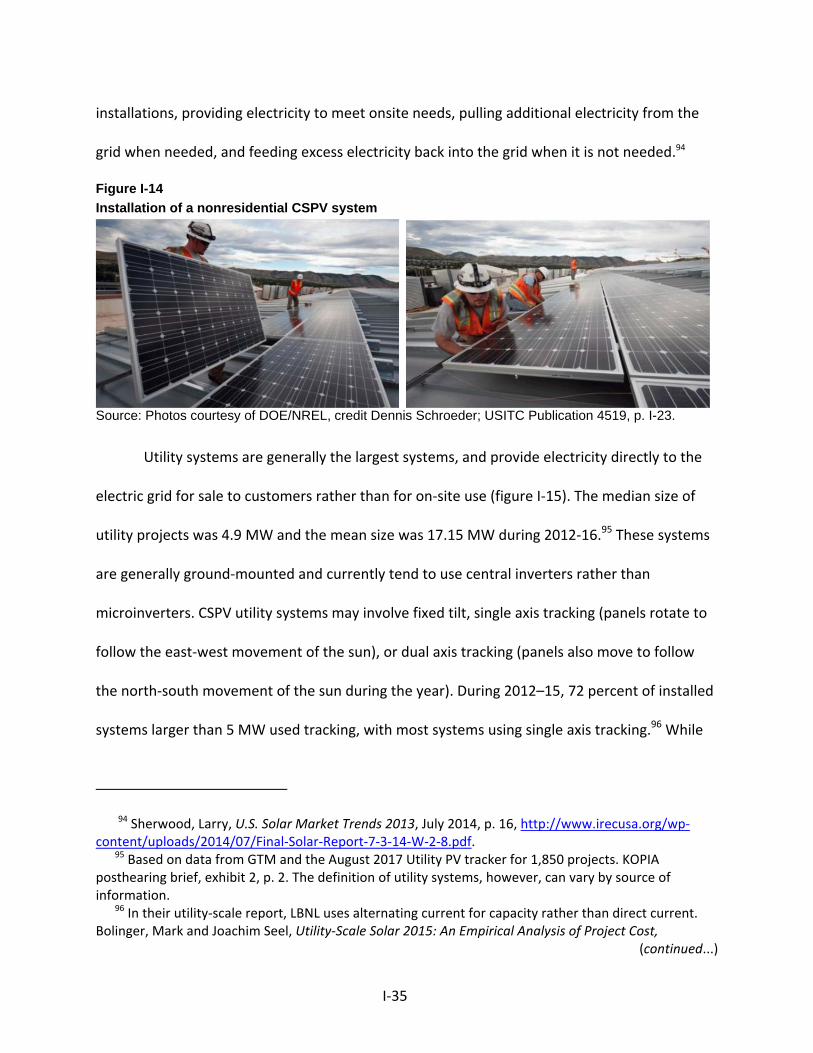
I‐35
installations, providing electricity to meet onsite needs, pulling additional electricity from the
grid when needed, and feeding excess electricity back into the grid when it is not needed.94
Figure I-14
Installation of a nonresidential CSPV system
Source: Photos courtesy of DOE/NREL, credit Dennis Schroeder; USITC Publication 4519, p. I-23.
Utility systems are generally the largest systems, and provide electricity directly to the
electric grid for sale to customers rather than for on‐site use (figure I‐15). The median size of
utility projects was 4.9 MW and the mean size was 17.15 MW during 2012‐16.95 These systems
are generally ground‐mounted and currently tend to use central inverters rather than
microinverters. CSPV utility systems may involve fixed tilt, single axis tracking (panels rotate to
follow the east‐west movement of the sun), or dual axis tracking (panels also move to follow
the north‐south movement of the sun during the year). During 2012–15, 72 percent of installed
systems larger than 5 MW used tracking, with most systems using single axis tracking.96 While
94 Sherwood, Larry, U.S. Solar Market Trends 2013, July 2014, p. 16, http://www.irecusa.org/wp‐content/uploads/2014/07/Final‐Solar‐Report‐7‐3‐14‐W‐2‐8.pdf.
95 Based on data from GTM and the August 2017 Utility PV tracker for 1,850 projects. KOPIA posthearing brief, exhibit 2, p. 2. The definition of utility systems, however, can vary by source of information.
96 In their utility‐scale report, LBNL uses alternating current for capacity rather than direct current. Bolinger, Mark and Joachim Seel, Utility‐Scale Solar 2015: An Empirical Analysis of Project Cost,
(continued...)

I‐36
prior to 2012 most utility systems installed in the United States were 600 volts, higher 1,000
volt utility systems became increasingly common during 2012‐16 and toward the end of this
time period 1,500 volt systems were introduced in the U.S. market. These higher voltage
systems use fewer balance of system components, require less installation time, reduce
electricity losses, and lead to higher inverter efficiencies. This results in lower energy costs.97
Figure I-15
La Ola PV plant, a utility CSPV system on Lanai, Hawaii
Source: Photo courtesy of DOE/NREL, credit Jamie Keller; USITC Publication 4519, p. I-24.
As noted above, there are a broad range of off‐grid applications, such as power
generation in remote locations, mobile power solutions, telecommunications power and
lighting systems, and portable consumer goods (such as systems for recharging consumer
electronics like tablets and phones). These systems often have additional balance of system
(…continued) Performance, and Pricing Trends in the United States, LBNL‐1006037, August 2016, report , pp. 5–6 and Data File, https://emp.lbl.gov/publications/utility‐scale‐solar‐2015‐empirical.
97 One thousand volt systems are also used in some commercial installations. UL Website, http://www.ul.com/newsroom/featured/ul‐provides‐1500‐volt‐pv‐module‐certification/ (accessed July 10, 2017); Roselund, Christian, “1500‐volt Systems to Account for 9% of Utility‐scale PV Installations in 2016,” PV Magazine, January 11, 2016, https://www.pv‐magazine.com/2016/01/11/1500‐volt‐systems‐to‐account‐for‐9‐of‐utility‐scale‐pv‐installations‐in‐2016_100022732/; Moskowitz, Scott, “The Next Opportunity for Utility PV Cost Reductions: 1,500 Volts DC,” Greentech Media, May 14, 2015, https://www.greentechmedia.com/articles/read/The‐Next‐Opportunity‐for‐Utility‐PV‐Cost‐Reductions‐1500‐Volts‐DC; Morgenson, Jim, “Choose 1,000 Volts for Commercial PV Applications,” Solar Builder, January 20, 2014, http://solarbuildermag.com/featured/1000‐volts‐inverters‐sma‐america/.

I‐37
components, such as a battery and charge controller, though inverters are not needed for all
off‐grid applications.
Marketing channels
Channels of distribution
U.S. producers’ and importers’ commercial U.S. shipments, by channels of distribution,
are presented in table I‐1. CSPV products are generally sold in the United States to
distributors,98 residential and commercial installers,99 and utility/developers. Domestic
producers sold CSPV products to all channels of distribution during the period of investigation,
but sold a majority of their products to distributors (a majority of which were then sold to
residential installers)100 and a substantial amount to commercial installers. U.S. producers
reported that a minor amount of their U.S. commercial shipments consist of CSPV cells to
98 Solar distributors typically sell CSPV products into the residential and nonresidential market, including to the installers that operate in these market segments. DiFrangia, Michelle, “How Distributors Do Solar,” Solar Power World, April 30, 2014, https://www.solarpowerworldonline.com/2014/04/distributors‐solar/.
99 Installers are firms that are responsible for the CSPV system installation; however, they may subcontract some parts of the installation to other firms such as electrical contractors. Installers may sell the system themselves or be contracted by other system sellers, such as third‐party owners, to install the system. Certain Crystalline Silicon Photovoltaic Products from China and Taiwan, Inv. Nos. 701‐TA‐511 and 731‐TA‐1246‐1247 (Final), USITC Publication 4519, February 2015, p. II‐3.
100 A substantial portion of U.S. producers’ total U.S. commercial shipments of modules were originally identified as shipments to distributors in their questionnaire responses (***). Domestic producers were subsequently asked to re‐categorize the distributor data according to sales to the likely end user. The data presented in table I‐1 reflect two of the responding domestic producers’ re‐assignment of the U.S. producers’ U.S. commercial shipments of modules to distributors according to the most likely end user. ***. SolarWorld’s posthearing brief, exhibit 1, p. 94; Suniva’s posthearing brief, exhibit 1.

I‐38
module assemblers.101 Domestic producers reported that *** percent or less of their total
commercial U.S. shipments were to utilities or developers during 2012‐16. U.S. importers
commercially shipped CSPV products to all channels of distribution during 2012‐16, except for
module assemblers. A majority of sales of imported products by U.S. importers were to
utility/developers, with a substantial amount going to commercial and residential installers.
Table I-1 CSPV products: U.S. producers’ and importers’ commercial U.S. shipments, by channels of distribution, 2012-16
Item Calendar year
2012 2013 2014 2015 2016 Share of commercial U.S. shipments (percent)
U.S. producers: to Module assemblers *** *** *** *** ***
to Distributors1 *** *** *** *** ***to Residential installers *** *** *** *** ***to Commercial installers *** *** *** *** ***to Utilities or developers *** *** *** *** ***
U.S. importers: to Module assemblers *** *** *** *** ***
to Distributors *** *** *** *** ***to Residential installers *** *** *** *** ***to Commercial installers *** *** *** *** ***to Utilities or developers *** *** *** *** ***
1 A substantial portion of U.S. producers’ total U.S. commercial shipments of modules were originally identified as shipments to distributors (***). Domestic producers were subsequently asked to re-categorize the distributor data according to sales to the likely end user and the data in this table reflect the re-assignment by two of the domestic producers that submitted questionnaire data in this investigation. ***. Note.--Shares shown as "0.0" represent values greater than zero but less than 0.05 percent. Source: Compiled from data submitted in response to Commission questionnaires; SolarWorld’s posthearing brief, exhibit 1, p. 94; Suniva’s posthearing brief, exhibit 1.
101 CSPV cells are typically internally consumed to produce solar modules by U.S. producers, but may also be sold to companies that fabricate modules or panels. Certain Crystalline Silicon Photovoltaic Products from China and Taiwan, Inv. Nos. 701‐TA‐511 and 731‐TA‐1246‐1247 (Final), USITC Publication 4519, February 2015, p. II‐3.
I‐39
Market segments
The largest grid‐connected market segment in 2016 was the utility segment, with 10.6
GW in 2016 installations (including thin film products). This was followed by the residential
sector with 2.6 GW and the nonresidential sector with 1.6 GW. The residential market
exceeded the nonresidential market in size during 2014–16, but was smaller during 2012–13.102
Public information on the size of the off‐grid market was not readily available. The remainder of
this section provides a brief description of each of the industries in these market segments,
though in many cases the industries overlap. For example, many nonresidential installers also
install residential CSPV systems.
There were several thousand residential solar installers in the United States in 2015
(latest available), most of which are relatively small firms.103 According to one installer survey,
the median volume installed by residential installers in 2016 was 500 kW.104 However, there are
also larger firms operating in multiple states, and the top three installers accounted for 48
percent of the market in the second quarter of 2016.105 Many installers offer financing options
to customers, and some installers also offer customers the option to lease or purchase the
power from the system (known as third party ownership or TPO) rather than buy the system
102 GTM Research and the Solar Energy Industries Association (SEIA), U.S. Solar Market Insight: 2016 Year in Review, Executive Summary, 2017, pp. 6, 10–11.
103 Tracking the Sun Public Data File, The Open PV Project, National Renewable Energy Laboratory, https://openpv.nrel.gov/search (accessed July 11, 2017).
104 EnergySage, Solar Installer 2016 Survey Results, January 2017, 2. 105 The top ten installers combined accounted for 58 percent of the market. Allison Mond, “The Rise
of the Regional Solar Installer,” June 22, 2016, https://www.greentechmedia.com/articles/read/the‐rise‐of‐the‐regional‐solar‐installer; EnergySage, Solar Installer 2016 Survey Results, January 2017, 2.

I‐40
itself.106 While TPO accounted for the majority of installations during 2012–16, the share of the
market accounted for by TPO systems peaked in 2014.107
There were over 1,000 nonresidential installers in 2015, many of which also installed
residential systems.108 As with residential installers, the majority of nonresidential installers are
small—the median installation volume in one installer survey was 285 kW.109 The largest
nonresidential installers account for a smaller share of the market than the largest residential
installers. In 2015, the top three nonresidential installers accounted for about 26 percent of the
market.110 As with residential installers, many commercial installers offer financing and TPO
options, though these account for a smaller share of nonresidential installations than
residential.111
PV installations and other PV activities are the primary business lines for most
residential and nonresidential solar installers, though the primary business lines for some firms
that install PV systems are related activities such as electrical contracting, general contracting,
106 EnergySage, Solar Installer 2016 Survey Results, January 2017, 4–5; USITC, Renewable Energy and Related Services: Recent Developments, Investigation No. 332‐534, USITC Publication 4421, August 2013, pp. 3‐2–3, 3‐8–9.
107 Litvak, Nicole, “U.S. Residential Solar Financing 2016‐2021,” November 2016, Greentech Media, https://www.greentechmedia.com/research/report/us‐residential‐solar‐financing‐2016‐2021.
108 Tracking the Sun Public Data File, The Open PV Project, National Renewable Energy Laboratory, https://openpv.nrel.gov/search (accessed July 11, 2017).
109 EnergySage, Solar Installer 2016 Survey Results, January 2017, 2. 110 Cory Honeyman, “U.S. Solar Market Outlook: Market Drivers and Competitive Landscape Trends
Shaping U.S. Solar Demand,” GTM Research, July 2016, 18, http://sunspec.org/wp‐content/uploads/2016/07/HoneymanGTMResearchSunSpecIntersolarPVFinance.pdf.
111 USITC, Renewable Energy and Related Services: Recent Developments, Investigation No. 332‐534, USITC Publication 4421, August 2013, pp. 3‐2–3, 3‐8–9; Barbose, Galen and Naïm Darghouth, Tracking the Sun IX: The Installed Price of Residential and Non‐Residential Photovoltaic Systems in the United States, Data file, Lawrence Berkeley National Laboratory, 2016, pp. 12–13, https://emp.lbl.gov/publications/tracking‐sun‐ix‐installed‐price.
I‐41
and roofing.112 Firms often compete with a large number of other installers, with 47 percent of
firms reporting 20 or more competitors.113
The utility segment is the most concentrated in terms of the number of active project
developers and engineering, procurement, and construction (“EPC”) firms. 114 The top nine
utility project developers in 2016 accounted for a combined 70 percent of the market in 2016,
and the top nine EPC firms accounted for 69 percent of the market.115 This is the largest
market segment so many of these firms also installed a much larger volume of products in 2016
than firms in the other market segments.116 The types of firms that develop utility projects are
diverse and the industry is composed of (1) firms whose primary business is project
development; (2) firms that are engaged in both producing equipment (e.g., modules) and
developing projects; (3) unregulated entities related to major utility companies; (4) other
independent power producers (IPPs); (5) utilities; and (6) other firms.117 Project developers may
perform EPC services, or large contractors often handle these services.118
112 EnergySage, Solar Installer 2016 Survey Results, January 2017, 2. 113 EnergySage, Solar Installer 2016 Survey Results, January 2017, 8. 114 USITC Publication 4519, pp. II‐5–6; Solar Power World, “2016 Top Solar Utility Contractors,
https://www.solarpowerworldonline.com/2016‐top‐solar‐utility‐contractors/ (accessed July 11, 2017); Energy Acuity, 2016 Solar Report: Utility Scale, March 2017, pp. 7, 11, https://www.energyacuity.com/energy‐acuity‐reports.
115 Excludes projects where First Solar, the largest global thin film producer, was listed as the developer or the EPC provider. However, the data likely still contain some thin film products. Energy Acuity, 2016 Solar Report: Utility Scale, March 2017, pp. 7, 11, https://www.energyacuity.com/energy‐acuity‐reports; Finlay Colville, “Top‐10 Solar Cell Producers in 2016,” PV Tech, January 30, 2017, https://www.pv‐tech.org/editors‐blog/top‐10‐solar‐cell‐producers‐in‐2016.
116 Solar Power World, “2016 Top Solar Utility Contractors,” https://www.solarpowerworldonline.com/2016‐top‐solar‐utility‐contractors/ (accessed July 11, 2017).
117 An IPP is an entity that primarily produces electricity for sale on the wholesale market. It is not a utility, does not own electricity transmission, and does not have a designated service area. This is based on the Energy Information Administration definition as summarized in USITC Publication 4421. USITC,
(continued...)

I‐42
The off‐grid market segment is diverse, and within it there are a number of very
different market segments. For example, some CSPV off‐grid products, such as solar chargers
and solar generators, are sold directly to consumers or through retail channels.119 Other CSPV
off‐grid products—such as solar street lighting and off‐grid power systems—are sold, either
directly or through entities such as installers and contractors, to users such as industrial,
commercial, and government entities.120
Discussion of specific products
There are a number of different CSPV cell and module technologies currently produced
by CSPV manufacturers. This section will describe some of those technologies, as well as some
of the companies producing these products globally. The extent to which each technology is
used by U.S. producers and importers is discussed in Part II and Part III. During 2013–16,
standard multicrystalline silicon and standard monocrystalline silicon accounted for most global
(…continued) Renewable Energy and Related Services: Recent Developments, Investigation No. 332‐534, USITC Publication 4421, August 2013, pp. 3‐14–15.
118 USITC, Renewable Energy and Related Services: Recent Developments, Investigation No. 332‐534, USITC Publication 4421, August 2013, pp. 3‐15–16.
119 Costco Website, https://www.costco.com/Goal‐Zero‐Sherpa‐50‐Solar‐Kit‐‐Power‐on‐the‐Go.product.100145834.html (accessed July 9, 2017); Academy Sports and Outdoors Website, http://www.academy.com/shop/browse/hunting/wildlife‐feed‐‐feeders/feeder‐accessories/solar‐panel‐chargers (accessed July 15, 2017); Goal Zero Website, http://www.goalzero.com/p/12/nomad‐13‐solar‐panel (accessed July 15, 2017).
120 Ameresco Solar Website, http://www.amerescosolar.com/about‐ameresco‐solar‐what‐we‐do (accessed July 15, 2017); Solar Stik Website, http://www.solarstik.com/photo‐gallery/ (accessed July 15, 2017); Sol Website, http://solarlighting.com/contractors/ (accessed July 16, 2017); EnGo Planet Website, https://www.engoplanet.com/projects (accessed July 15, 2017).

I‐43
production. Advanced process technologies increased their share of the market in 2016,
primarily due to increasing production of passive emitter rear contact (PERC) cells.121
Figure I-16
Global CSPV module shipments by technology type
Source: Solar Media, "PV Module Supply in 2017: Leading Global Suppliers, Performance Benchmarks and Maximizing Investor Returns,” August 30, 2017, p. 10; Colville, Finlay, “China and OEM Cell Production in 2016 Delays Shift to p-type Mono,” PV Tech and Solar Media, January 26, 2017, https://www.pv-tech.org/editors-blog/china-and-oem-cell-production-in-2016-delays-shift-to-p-type-mono.
Notes: Advanced process in 2016 was primarily PERC cells. n-type mono includes all types of n-type production.
n‐Type Mono
In the production of most types of monocrystalline CSPV wafers, the silicon is doped
with boron (as described above) to create a positive electrical orientation. In the production of
n‐type mono wafers, the silicon is doped with phosphorous to create a negative electrical
orientation. In the cell production process, a positive layer is added to create the p/n junction.
121 Solar Media, "PV Module Supply in 2017: Leading Global Suppliers, Performance Benchmarks and Maximizing Investor Returns,” August 30, 2017, p. 10; Colville, Finlay, “China and OEM cell production in 2016 delays shift to p‐type mono,” PV Tech and Solar Media, January 26, 2017, https://www.pv‐tech.org/editors‐blog/china‐and‐oem‐cell‐production‐in‐2016‐delays‐shift‐to‐p‐type‐mono.
0%
25%
50%
75%
100%
2013 2014 2015 2016 2017(Projected)
Share of CSPV m
odule supply
mono, n‐type
mono, p‐type, advanced process
mono, p‐type, standard process
multi, advanced process
multi, standard process

I‐44
n‐type cells can be more expensive to produce, but have a number of benefits, such as higher
conversion efficiencies, no light induced degradation, and they can be made using less pure
wafers.122
In 2016, n‐type mono accounted for less than 5 percent of global CSPV cell
production.123 As of 2012, there were a relatively small number of producers of n‐type mono
products, including LG, Panasonic, SunPower, and Yingli. These companies remained among the
leading suppliers of these products in 2016.124
Passive Emitter Rear Contact (PERC)
Passive Emitter Rear Contact (PERC)125 cells incorporate an additional rear dielectric
layer that reflects light that did not generate electricity as it initially passed through the CSPV
cell back into the CSPV cell. There is, therefore, another opportunity for the CSPV cell to absorb
122 American Chemical Society Website, https://www.acs.org/content/acs/en/education/resources/highschool/chemmatters/past‐issues/archive‐2013‐2014/how‐a‐solar‐cell‐works.html?cq_ck=1%E2%80%A6 (accessed August 24, 2017); Radovan Kopecek and Joris Libal, “Switch from p to n,” PV Magazine, June 5, 2012, https://www.pv‐magazine.com/magazine‐archive/switch‐from‐p‐to‐n_10007072/; EnergyTrend, “Solar Manufacturers Vie for Control of Nascent N‐type Mono Cell Market,” October 27, 2014, http://pv.energytrend.com/price/20141027‐7645.html; Roselund, Christian, “N‐type Mono is Coming, but When?” PV Magazine, July 14, 2014, https://www.pv‐magazine.com/2014/07/14/n‐type‐mono‐is‐coming‐but‐when_100015728/.
123 Solar Media, “PV Module Supply in 2017: Leading Global Suppliers, Performance Benchmarks and Maximizing Investor Returns,” August 30, 2017, p. 10.
124 Radovan Kopecek and Joris Libal, “Switch from p to n,” PV Magazine, June 5, 2012, https://www.pv‐magazine.com/magazine‐archive/switch‐from‐p‐to‐n_10007072/; LG Electronics, “LG Electronics Introduces High‐Performance, Lightweight Mono‐X Neon Solar Modules,” News release, September 3, 2012, http://www.lg.com/us/business/about/press‐release/lg‐electronics‐introduces‐high‐performance‐lightweight‐mono‐x‐neon‐solar‐modules; Colville, Finlay, “China and OEM Cell Production in 2016 Delays Shift to p‐type Mono,” PV Tech and Solar Media, January 26, 2017, https://www.pv‐tech.org/editors‐blog/china‐and‐oem‐cell‐production‐in‐2016‐delays‐shift‐to‐p‐type‐mono.
125 This section will focus on PERC technology, but there are a range of related technologies such as Passivated Emitter Rear Totally Diffused (PERT) and Passivated Emitter Rear Locally Diffused (PERL). Aleo website, http://www.aleo‐solar.com/perc‐cell‐technology‐explained/ (accessed June 9, 2017).

I‐45
this light. PERC cells have a higher efficiency, and improved performance in certain conditions,
such as low light and high heat conditions. Existing CSPV cell production lines can be
reconfigured to produce PERC cells with the addition of two steps. Therefore, the changeover
to PERC technology is relatively straightforward, though there are some challenges with PERC
technology such as the potential for more rapid cell degradation.126
PERC and related technologies accounted for more than 10 percent of the global market
in 2016, and their production (particularly of monocrystalline PERC) is expected to significantly
increase in the next few years, with one estimate projecting more than 15 GW of global PERC
production in 2017.127 SolarWorld was the first company to commercialize PERC production,
with Sunrise Global, Hanwha QCells, and REC also starting commercial production relatively
early.128 Among module suppliers listed by Taiyang News, SolarWorld has the highest
monocrystalline PERC production efficiency (at 21.6 percent), followed by Trina (21.12 percent)
and Tainergy and Talesun (21.1 percent), though a number of suppliers have only slightly lower
126 Aleo website, http://www.aleo‐solar.com/perc‐cell‐technology‐explained/ (accessed June 9, 2017); Gustin, Gena, “What is PERC? Why Should you Care?” July 5, 2016, Solar Power World, June 9, 2017, http://www.solarpowerworldonline.com/2016/07/what‐is‐perc‐why‐should‐you‐care/; Schmid Group, “PERC Cells: Production Costs Down, Efficiency Up,” News release, May 18, 2016, http://schmid‐group.com/en/schmid‐group/news‐events/press‐releases/perc‐cells‐production‐costs‐down‐efficiency‐up/.
127 ITRPV, 2016 Results, March 2017, pp. 34‐35, http://www.itrpv.net/.cm4all/iproc.php/ITRPV%20Eighth%20Edition%202017.pdf?cdp=a; Colville, Finlay, “PERC Solar Cell Production to Exceed 15GW in 2017,” PVTech, July 27, 2017, https://www.pv‐tech.org/editors‐blog/perc‐solar‐cell‐production‐to‐exceed‐15gw‐in‐2017.
128 Chunduri, Shravan K. and Michael Schmela, PERC Solar Cell Technology 2016: Background, Status and Outlook, Taiyang News, 2016, pp. 21–22, http://taiyangnews.info/TaiyangNews%20PERC%20Report%202016%20FINAL.pdf; Chunduri, Shravan K. and Michael Schmela, “PERC Solar Cell Technology, 2017 Edition,” 2017, http://taiyangnews.info/reports/, p. 41; Hearing transcript (Stein), p. 220.

I‐46
efficiencies.129 Trina has the highest multicrystalline production efficiency among module
suppliers listed by Taiyang News (19.86 percent), followed by HT‐SAAE (19.8 percent), and
Astronergy and Suntech (19.7 percent). REC Group, which is not listed by Taiyang, also reports
production of high efficiency multicrystalline PERC cells.130
Heterojunction
Heterojunction cells, which include heterojunction with intrinsic thin layer (HIT), add
thin layers of photosensitive semiconductor materials (typically amorphous silicon) on top of a
monocrystalline wafer. These additional layers increase the absorption of sunlight, and the
overall efficiencies of the CSPV cells. They also perform better in hot climates than typical
monocrystalline cells. They are more expensive to produce and are difficult to scale up to
commercial production, however, so only a few companies currently produce this
technology.131
129 Two equipment suppliers, Meyer Burger and Centrotherm, report production efficiencies between SolarWorld and Trina. Chunduri, Shravan K. and Michael Schmela, “PERC Solar Cell Technology, 2017 Edition,” 2017, http://taiyangnews.info/reports/, p. 39.
130 Equipment supplier Meyer Burger lists a production efficiency of 20.5 percent. Clover, Ian, “REC achieves +20% efficiency for mass production of multicrystalline solar cells,” PV Magazine, October 5, 2016, https://www.pv‐magazine.com/2016/10/05/rec‐achieves‐20‐efficiency‐for‐mass‐production‐of‐multicrystalline‐solar‐cells_100026368/; Chunduri, Shravan K. and Michael Schmela, “PERC Solar Cell Technology, 2017 Edition,” 2017, http://taiyangnews.info/reports/, p. 39.
131 Roselund, Christian, “The Uncertain Future of Silicon Heterojunction Solar,” PV Magazine, March 15, 2016, https://www.pv‐magazine.com/magazine‐archive/the‐uncertain‐future‐of‐silicon‐heterojunction‐solar_100023725/; Roselund, Christian, “The Best of the Best: Innovative High Efficiency PV Module Designs,” PV Magazine, March 15, 2016, https://www.pv‐magazine.com/magazine‐archive/the‐best‐of‐the‐best‐innovative‐high‐efficiency‐pv‐module‐designs_100023720/.
I‐47
Panasonic was the first large‐scale producer of heterojunction cells globally, and held
many of the key patents related to heterojunction technology until they expired in 2010.132
Other companies with production of heterojunction cells include BenQ Solar, Ecosolifer, Hevel,
Kaneka, Sunpreme, and Tesla. Solartech Universal assembles modules from heterojunction
cells. Meyer Burger also offers a turnkey production line for heterojunction cells.133
Heterojunction cells account for less than 5 percent of the global market.134
Bifacial
Bifacial cells convert light that hits both the front and back of the CSPV cell into
electricity (figure I‐16). Whereas most CSPV cells have a metalized back layer, bifacial cells allow
light through to the back side of the CSPV cell. They often incorporate either the PERC or
heterojunction technologies discussed above. When incorporated into modules, they use a
transparent back sheet or rear glass layer to allow sunlight to pass through to the rear of the
CSPV cell. Bifacial cells increase energy production, but are also more expensive to produce.
132 EU PVSEC Website, https://www.photovoltaic‐conference.com/images/News/EU_PVSEC‐2017‐NewsNo5/eu_pvsec‐2017‐newsno5.html (accessed August 23, 2017).
133 Roselund, Christian, “The Uncertain Future of Silicon Heterojunction Solar,” PV Magazine, March 15, 2016, https://www.pv‐magazine.com/magazine‐archive/the‐uncertain‐future‐of‐silicon‐heterojunction‐solar_100023725/; Sunpreme Website, http://sunpreme.com/symmetric‐bifacial‐architecture/ and http://sunpreme.com/about‐us/ (accessed August 23, 2017). Veschetti, Y. “Cell Session Introduction,” BIFIPV Workshop, September 2016, p. 9, http://bifipv‐workshop.com/fileadmin/images/bifi/miyazaki/presentations/4_1_1_‐_VESCHETTI_‐bifacial_cells.pdf; Kaneka Website, http://www.kaneka‐solar.jp/products/gransola.html (accessed August 23, 2017); Hevel Producing Heterojunction Solar Cells with Singulus Technology,” March 29, 2017, https://www.pv‐magazine.com/2017/03/29/hevel‐producing‐heterojunction‐solar‐cells‐with‐singulus‐technology/.
134 ITRPV, 2016 Results, March 2017, p. 35, http://www.itrpv.net/.cm4all/iproc.php/ITRPV%20Eighth%20Edition%202017.pdf?cdp=a; Solartech Universal Website, http://www.solartechuniversal.com/quantum‐series.html (accessed August 23, 2017).

I‐48
The extent to which energy production increases depends in part on the characteristics of the
surface below the installed modules.135
Figure I-16
Bifacial PV modules absorb sunlight on both sides of the module
Source: SolarWorld AG Website, http://www.solarworld.de/en/products/products/solar-modules/sunmodule-bisun-protect/ (accessed July 15, 2017).
As of early 2017, bifacial modules were commercially available in the U.S. market from
about eight companies, including LG, Lumos Solar, Mission Solar, Prism Solar, Silfab,
SolarWorld, Sunpreme, and Yingli Solar.136 Despite the relatively limited number of current
suppliers, ***
135 Roselund, Christian, “Two Sides of the Same Coin,” PV Magazine, February 6, 2017, https://www.pv‐magazine.com/magazine‐archive/two‐sides‐of‐the‐same‐coin/; Brearley, David, “Bifacial PV Systems,” SolarPro, March/April 2017, issue no. 10.2, https://solarprofessional.com/articles/design‐installation/bifacial‐pv‐systems#.WTmljv7rsuZ.
136 Brearley, David, “Bifacial PV Systems,” SolarPro, March/April 2017, issue no. 10.2, pp. 24–25, https://solarprofessional.com/articles/design‐installation/bifacial‐pv‐systems#.WTmljv7rsuZ.

I‐49
***.137 Globally, bifacial modules accounted for 1‐2 percent of the global module market in
2015, but the market share is projected to grow in the next five years.138
Other
Some manufacturers have switched to modules with half‐cut cells. These are standard
cells that are cut in half, such that a standard 60 cell module would instead have 120 half cells.
Half cut cells result in lower cell currents and, therefore, reduce power losses and increase cell
efficiency and overall module output.139 Half‐cut cells accounted for 2 percent of the global
market in 2016, though this share is forecast to increase.140
Many manufacturers are increasing the number of busbars in PV cells,141 which results
in higher efficiency and greater power output (figure I‐17). Three‐busbar cells accounted for
slightly more than half of the global market in 2016, down from more than 80 percent in 2014.
Four or more busbar cells accounted for more than 40 percent of the market in 2016 and are
forecast to account for close to 60 percent of the global market in 2017. Five busbar cells
accounted for less than 10 percent of the global market in 2016, but are also forecast to gain
137 SEIA, Posthearing brief, Exhibit 13 (Bloomberg New Energy Finance, 3Q 2017 Global PV Market Outlook, August 18, 2017, pp. 9–10).
138 Roselund, Christian, “Two Sides of the Same Coin,” PV Magazine, February 6, 2017, https://www.pv‐magazine.com/magazine‐archive/two‐sides‐of‐the‐same‐coin/; Brearley, David, “Bifacial PV Systems,” SolarPro, March/April 2017, issue no. 10.2, https://solarprofessional.com/articles/design‐installation/bifacial‐pv‐systems#.WTmljv7rsuZ.
139 REC Solar, “The New REC TwinPeak Series,” n.d., http://www.recgroup.com/sites/default/files/documents/whitepaper_twinpeak_technology.pdf (accessed July 15, 2017).
140 ITRPV, 2016 Results, March 2017, pp. 36–37, http://www.itrpv.net/.cm4all/iproc.php/ITRPV%20Eighth%20Edition%202017.pdf?cdp=a.
141 Electricity is carried from the thin metal strips on solar cells to wider metal strips known as busbars. These busbars are interconnected during the manufacturing process so that electricity is carried from the cell to the junction box. Ulbrich Website, https://www.pvribbon.com/press/glossary‐of‐pv‐terms/ (accessed September 4, 2017).
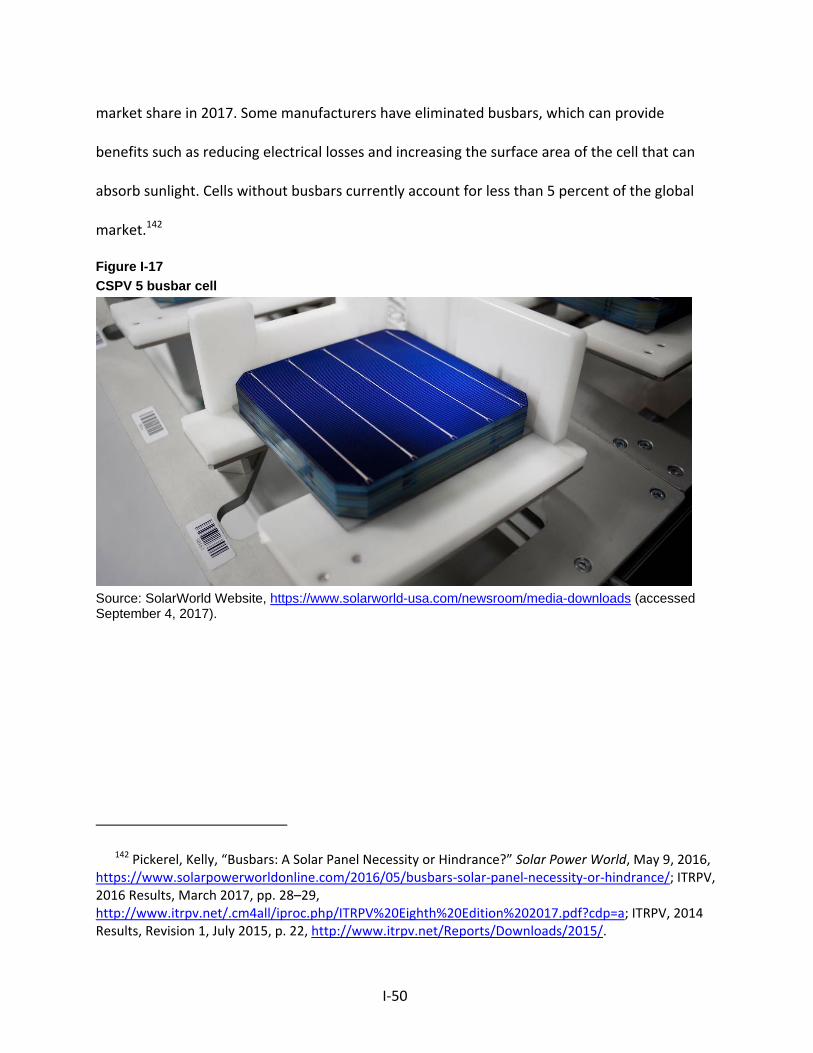
I‐50
market share in 2017. Some manufacturers have eliminated busbars, which can provide
benefits such as reducing electrical losses and increasing the surface area of the cell that can
absorb sunlight. Cells without busbars currently account for less than 5 percent of the global
market.142
Figure I-17
CSPV 5 busbar cell
Source: SolarWorld Website, https://www.solarworld-usa.com/newsroom/media-downloads (accessed September 4, 2017).
142 Pickerel, Kelly, “Busbars: A Solar Panel Necessity or Hindrance?” Solar Power World, May 9, 2016, https://www.solarpowerworldonline.com/2016/05/busbars‐solar‐panel‐necessity‐or‐hindrance/; ITRPV, 2016 Results, March 2017, pp. 28–29, http://www.itrpv.net/.cm4all/iproc.php/ITRPV%20Eighth%20Edition%202017.pdf?cdp=a; ITRPV, 2014 Results, Revision 1, July 2015, p. 22, http://www.itrpv.net/Reports/Downloads/2015/.

I‐51
Some manufacturers have also placed metal contacts onto the rear side of the cell,
creating back (or rear contact) cells. This provides several advantages such as reduced shading,
improved cell interconnection, and better aesthetics.143
Some PV modules do not use a frame, which reduces costs. These modules typically use
a glass as the rear layer to ensure mechanical stability. Frameless modules account for less than
5 percent of the global market.144
143 SunPower, “SunPower Module Degradation Rate,” n.d., pp.10– 11, https://us.sunpower.com/sites/sunpower/files/media‐library/white‐papers/wp‐sunpower‐module‐degradation‐rate.pdf (accessed August 24, 2017); PV Education Website, http://www.pveducation.org/pvcdrom/manufacturing/rear‐contact (accessed August 24, 2017); M.K.Mat Desa et al, “Silicon Back Contact Solar Cell Configuration: A Pathway Towards Higher Efficiency,” Renewable and Sustainable Energy Reviews, Volume 60, July 2016, Abstract, http://www.sciencedirect.com/science/article/pii/S1364032116002392.
144 ITRPV, 2016 Results, March 2017, pp. 37–40, http://www.itrpv.net/.cm4all/iproc.php/ITRPV%20Eighth%20Edition%202017.pdf?cdp=a.

I‐52
U.S. tariff treatment
The imported articles are provided for in subheading 8541.40.60 (statistical reporting
numbers 8541.40.6020 (“solar cells, assembled into modules or made up into panels”) and
8541.40.6030 (“solar cells, other”)) of the Harmonized Tariff Schedule of the United States
(“HTS”), and have been free of duty under the general duty rate since at least 1987. These
articles may also be imported as parts or subassemblies of goods provided for in subheadings
8501.31.80, 8501.61.00, and 8507.20.80. Inverters or batteries with CSPV cells attached are
provided for under HTSUS subheadings 8501.61.00 and 8507.20.80, respectively. In addition,
CSPV cells covered by the investigation may also be classifiable as DC generators of subheading
8501.31.80, when such generators are imported with CSPV cells attached. Goods classified in
subheadings 8501.31.80 and 8501.61.00 have general duty rates of 2.5 percent, and goods
classified in subheading 8507.20.80 have a general duty rate of 3.5 percent ad valorem. As
stated in the Commission’s notice of investigation, the HTS subheadings and reporting numbers
are provided for convenience and the written description of the imported article is
dispositive.145 Decisions on the tariff classification and treatment of imported articles are within
the authority of U.S. Customs and Border Protection.
145 Crystalline Silicon Photovoltaic Cells (Whether or Not Partially or Fully Assembled into Other Products): Institution and scheduling of safeguard investigation and determination that the investigation is extraordinarily complicated, 82 FR 25331, June 1, 2017.

I‐53
THE U.S. MARKET
U.S. producers146
The Commission sent U.S. producers’ questionnaires to 188 firms identified by the
Commission as possible U.S. producers or U.S. importers of CSPV cells and/or modules. The
Commission received responses from 13 firms reporting domestic production since January 1,
2012.147 During the previous CSPV 2 investigations, three additional firms (Motech, Silicon
Energy, and tenKsolar) that have since ceased CSPV operations supplied the Commission with
information on their U.S. operations.148 Where applicable, the aggregate U.S. industry data
presented in this report also include the data provided to the Commission by these three
146 In the prior CSPV 1 and CSPV 2 investigations, the Commission found that U.S. module assemblers engaged in sufficient production‐related activities to include them in the domestic industry as domestic producers of the domestic like product. Consequently, the Commission treated their resulting CSPV products as shipments by the domestic industry, even if those modules were assembled in the United States from inputs that were imported. No party in those prior investigations argued that module assemblers should not be included in the domestic industry. Based on her finding that CSPV cells and CSPV modules were separate domestic like products, however, Commissioner Broadbent defined two corresponding domestic industries. Certain Crystalline Silicon Photovoltaic Cells and Modules from China and Taiwan, Inv. Nos. 701‐TA‐511 and 731‐TA‐1246‐1247 (Final), USITC Publication 4519, February 2015, p. 16.
147 One of the 12 firms providing responses to the U.S. producer questionnaire (***) provided responses to certain narrative questions in the U.S. producer questionnaire but did not provide any data concerning its production operations. The following companies reported that they have not produced CSPV products in the United States since January 1, 2012: ***.
148 Another firm, Suntech, submitted data in the CSPV 1 investigations but did not submit data in the CSPV 2 investigations; Suntech, an opponent of the prior petitions, accounted for a small and declining share of domestic production, imported sizeable volumes from China and Taiwan, and closed its production facility in March 2013. The Commission determined that appropriate circumstances existed to exclude Suntech from the domestic industry as a related party. USITC Publication 4519 at 16‐20; USITC Publication 4360 at 13‐16; Why a Chinese Firm’s Factory in Arizona Failed, (Sept. 18, 2014) available on Bloomberg.com.

I‐54
domestic producers in the CSPV 2 investigations. In total, these 16 firms are believed to have
accounted for all known U.S. production of CSPV cells and 63.9 percent of U.S. production of
CSPV modules during 2015.149 Presented in table I‐2 is a list of responding domestic producers
and each company’s position on the petition, production locations, and share of reported
production of CSPV products during 2012‐16.
149 Based on a comparison of U.S. producers’ reported production of CSPV modules of *** kW in 2015 with total 2015 U.S. production of modules of 864,985 kW as reported in EIA, Solar Photovoltaic Cell/Module Shipments Report, September 2016, table 6. EIA data also include thin film products that are not within the scope of this investigation. Since EIA’s estimate of total U.S. production of modules includes thin film products and is likely somewhat overstated for purposes of a coverage calculation for U.S. module production in this investigation, the questionnaire responses received from U.S. module producers likely account for a higher percentage of U.S. CSPV module production.

I‐55
Table I-2 CSPV products: U.S. producers, their position on the petition, location of production, and share of reported production, January 2012 through December 2016
Firm Position on
petition Production location Share of CSPV cell
production (percent) Share of module
assembly (percent)Itek *** Bellingham WA *** ***Kyocera *** San Diego, CA *** ***Mission Solar *** San Antonio, TX *** ***Motech Americas (1) New Castle, DE *** ***SBM *** Concord, NC *** ***Seraphim *** Jackson, MS *** ***Sharp *** Memphis, TN *** ***
Silicon Energy (1) Marysville, WA Mountain Iron, MN *** ***
Solaria *** Fremont, CA *** ***Solartech *** Riviera Beach, FL *** ***SolarWorld *** Hillsboro, OR *** ***
Suniva *** Norcross, GA Saginaw, MI *** ***
SunStream *** Westminster, CO Gilbert, AZ *** ***
tenKsolar (1) Bloomington, MN *** ***
Tesla *** Fremont, CA Buffalo, NY *** ***
Wanxiang *** Rockford, IL *** ***Total 100.0 100.0
1 Did not provide a response to the Commission’s questionnaire in this proceeding. Motech closed in late 2013, Silicon Energy shut down in 2017 but had been operating at diminished capacity since 2014, and tenKsolar announced in May 2017 that it had discontinued its operations. In the prior CSPV 2 investigations, ***. Note.--Shares shown as "0.0" represent values greater than zero but less than "0.05" percent. Source: Compiled from data submitted in response to Commission questionnaires; “Newark solar facility has closed, official says,” Delaware Online, The News Journal, September 8, 2014, http://www.delawareonline.com/story/money/business/2014/09/08/newark-solar-facility-closed-official-says/15290473/, accessed July 18, 2017; Myers, John, “Mountain Iron solar company among last in Minnesota,” Prairie Business, Forum News Service, June 12, 2017, http://www.prairiebusinessmagazine.com/energy/4281984-mountain-iron-solar-company-among-last-minnesota, accessed July 18, 2017; Hughlett, Mike, “Ten K Solar 'discontinuing' current operation,” Star Tribune, May 10, 2017, http://www.startribune.com/ten-k-solar-discontinuing-current-operation/421917033/, accessed July 18, 2017.

I‐56
U.S. importers
The Commission sent U.S. importers’ questionnaires to 188 firms identified by the
Commission as possible U.S. producers or U.S. importers of CSPV cells and/or modules.150
Questionnaire responses containing usable data were received from 56 firms and are believed
to have accounted for approximately 83 percent of U.S. imports of CSPV products from all
sources during 2016.151 Although separate U.S. import data were requested in the
Commission’s questionnaires for U.S. imports from Australia, Brazil, Colombia, Israel, Jordan,
Mexico, Panama, Peru, and the Dominican Republic‐Central America Free Trade Agreement
(“CAFTA‐DR”) countries (i.e., Costa Rica, Dominican Republic, El Salvador, Guatemala,
Honduras, and Nicaragua),152 no U.S. import data were reported by U.S. importers in their
questionnaire responses for these countries for 2012‐16.
150 The following firms reported that they have not imported CSPV products since January 1, 2012: ***.
151 Based on a comparison of the total value of 2016 U.S. imports of CSPV cells and modules from all countries reported in the responses to the Commission’s U.S. importer questionnaire ($7.06 billion) with total landed‐duty paid value ($8.5 billion) of 2016 U.S. imports of cells and modules as reported by official Commerce import statistics (HTS 8541.40.6030 and 8541.40.6020). Questionnaire data coverage presented may be imprecise because the official Commerce statistics may include other products not within the scope of this investigation, such as thin film solar products.
152 Data were requested separately for the listed countries consistent with statutory provisions regarding separate findings for imports from these countries.

I‐57
Table I‐3 lists all responding U.S. importers of CSPV products, their U.S. locations, and
their share of the quantity of total U.S. imports from January 2012 to December 2016.
Table I-3 CSPV products: U.S. importers, their headquarters, and share of total U.S. imports, January 2012 through December 2016
Firm Headquarters Share of total U.S. imports (percent)
Academy, Ltd. Katy, TX ***Ameresco Framingham, MA ***Astro Solartech Irwindale, CA ***AUO Green Energy America Milpitas, CA ***Boviet Solar USA San Jose, CA ***BYD America Los Angeles, CA ***Canadian Solar (USA) Walnut Creek, CA ***Carmanah Technologies Victoria, BC ***Celestica Merrimack, NH ***Centrosolar America Scottsdale, AZ ***DMEGC USA Torrance, CA ***First Solar Tempe, AZ ***Goal Zero Bluffdale, UT ***Grape Solar Eugene, OR ***Hanwha International Teaneck, NJ ***Hanwha Q Cells America Irvine, CA ***Hanwha Q Cells USA. Irvine, CA ***Hareon Solar USA San Jose, CA ***Heliene Sault Ste. Marie, ON ***IES Residential Stafford, TX ***Itek Energy Bellingham, WA ***JA Solar USA San Jose, CA ***Jiawei Hayward, CA ***JinkoSolar (U.S.) San Francisco, CA ***Kyocera International San Diego, CA ***Table continued on following page.

I‐58
Table I-3--Continued CSPV products: U.S. importers, their headquarters, and share of total U.S. imports, January 2012 through December 2016
Firm Headquarters Share of total U.S. imports (percent)
Lerri Solar San Ramon, CA ***LG Electronics USA Englewood Cliffs, NJ ***Mission Solar Energy San Antonio, TX ***NextEra Energy Resources Juno Beach, FL ***Panasonic Eco Solutions Newark, NJ ***Pitsco Pittsburg, KS ***Posco-Daewoo America Teaneck, NJ ***Prism Solar Technologies Highland, NY ***REC Americas San Mateo, CA ***SBM Solar Concord,, NC ***Seraphim Solar USA Sugar Land, TX ***Sharp (constructed from CNIF) Memphis, TN ***Silfab Solar Mississauga, ON ***Solarland USA Ontario, CA ***Solartech Power Ontario, CA ***SolarTech Universal Riviera Beach, FL ***SolarWorld Americas Hillsboro, OR ***Solatube International Vista, CA ***Sumec North America Chatsworth, CA ***Suniva Norcross, GA ***SunPower San Jose, CA ***SunPower Corporation Systems Richmond, CA ***SunPower North America San Jose, CA ***Sunpreme Sunnyvale, CA ***SunStream Technology Westminster, CO ***Tesla Palo Alto, CA ***The Chamberlain Group Oak Brook, IL ***The Solaria Corp. Fremont, CA ***Trina Solar (U.S.) San Jose, CA ***Upsolar America San Francisco, CA ***Wanziang (constructed from CNIF) Rockford, IL ***Winaico Delaware Southampton, PA ***Yingli Green Energy Americas San Francisco, CA *** Total ***1 BYD America ***. Note.—Shares shown as "0.0" represent values greater than zero but less than "0.05" percent. Source: Compiled from data submitted in response to Commission questionnaires.

I‐59
U.S. purchasers
The Commission sent U.S. purchasers’ questionnaires to 65 firms identified as possible
U.S. purchasers of CSPV products and received 106 usable questionnaire responses from firms
that purchased CSPV products during January 2012‐December 2016.153 Fifty‐eight responding
purchasers are commercial installers, 39 are residential installers, 38 are utility companies or
developers, 19 are module distributors, 8 are module assemblers, 7 are distributors of off‐grid
portable consumer goods, 4 are utility scale EPC contractors, 2 are retailers, 1 is an original
equipment manufacturer (“OEM”), and 1 is a community solar provider.
Ten firms reported their purchase quantities of CSPV cells during 2012‐16. The largest
purchasers of CSPV cells were ***, which accounted for 99 percent of total reported purchases
of CSPV cells. Ninety‐six purchasers reported their purchase quantities of CSPV modules during
2012‐16. The largest purchasers of CSPV modules were ***; these six purchasers accounted for
58 percent of total reported purchases of CSPV modules during 2012‐16.
153 The Commission sent U.S. purchaser questionnaires to the industry’s largest purchasers. However, due to the large number of firms that purchase CSPV products in the U.S. market and the industry’s awareness of the investigation, the Commission received additional U.S. purchaser questionnaire responses from firms that had purchased CSPV products during the period of investigation and volunteered their participation in the ongoing investigation.

I‐60
THIRD‐COUNTRY MARKET IMPORT RESTRAINTS
Several countries have imposed antidumping and/or countervailing duties on imports of
CSPV products from one or more sources. Such restraints are discussed in detail in the sections
that follow, organized by the specific country that has undertaken such measures. A summary
of import restraint measures taken by third countries is presented in table I‐4.
Table I-4
CSPV products: Third country market import restraints in effect1
Importing country Product Measure Date
Exporting country
European Union
CSPV cells and modules
Provisional antidumping duties (37.3% – 67.9%) June 2013
China
Price Undertaking Agreement August 2013
Final antidumping and anti-subsidy determination (4.7% – 64.9%) applies to companies in China that are not part of the Price Undertaking Agreement
December 2013
Final affirmative circumvention finding – duties in force for China extended to modules manufactured in Malaysia and Taiwan from cells produced in China
February 2016
Malaysia
Taiwan
18-month extension of measures March 2017
China
Malaysia Taiwan
Canada CSPV modules
Antidumping duties (124.4%)
Subsidy rate (6.2%) July 2015 China
China Solar-grade polysilicon
Provisional antidumping duties (up to 57%)
and subsidy rate (2.1%) January 2014
United States
Korea
Final antidumping duties (42%) and subsidy rate (1.2%) May 2014
European Union
Turkey CSPV modules Antidumping duties (27%)
February 2017 China
1 Investigations conducted by India during 2012-14 on CSPV cells and modules originating in China, Taiwan, Malaysia, and the United States and investigations conducted by Australia during 2014-16 on CSPV cells and modules originating in China did not result in antidumping duties or subsidy rates. However, India is currently conducting an antidumping investigation initiated in July 2017 on imports of “Solar Cells whether or not assembled partially or fully in Modules or Panels or on glass or some other suitable substrates” originating in or exported from China, Malaysia, and Taiwan.
Source: Cited public articles in sections that follow.

I‐61
The European Union
In July 2012, EU ProSun filed an antidumping duty petition with the European
Commission (“EC”) regarding imports of CSPV cells and modules from China, and on September
6, 2012, the EC announced its initiation of an antidumping duty investigation on these
imports.154 In response to a countervailing duty complaint filed on September 26, 2012 by EU
ProSun, on November 8, 2012 the EC announced its initiation of an antisubsidy investigation
concerning imports of crystalline silicon photovoltaic modules and key components (i.e., cells
and wafers) originating in China.155
In June 2013, the EC announced the imposition of provisional antidumping duties
ranging from 37.3 percent to 67.9 percent.156 Thereafter, the EC and a group of Chinese solar
manufacturers, which represented approximately 70 percent of total Chinese exports to the EU,
entered into a “price undertaking” agreement, which went into effect in August 2013.157
Certain named CSPV product manufacturers agreed to volume quotas and minimum prices
pursuant to the undertaking, and in return for selling at or above the Minimum Import Price
154 Notice of initiation of an antidumping duty proceeding concerning imports of crystalline silicon photovoltaic modules and key components (i.e. cells and wafers) originating in the People’s Republic of China, Official Journal of the European Union, C/269/5, September 6, 2012.
155 Notice of initiation of an anti‐subsidy proceeding concerning imports of crystalline silicon photovoltaic modules and key components (i.e. cells and wafers) originating in the People's Republic of China, Official Journal of the European Union, C/340/6, November 8, 2012.
156 Imposing a provisional anti‐dumping duty on imports of crystalline silicon photovoltaic modules and key components (i.e. cells and wafers) originating in or consigned from the People's Republic of China and amending Regulation (EU) No 18212013 making these imports originating in or consigned from the People's Republic of China subject to registration, Commission Regulation (EU) No 513/2013, (June 4, 2013).
157 European Commission Directorate‐General for Trade, EU imposes definitive measures on Chinese solar panels, confirms undertaking with Chinese solar panel exporters, Press Release (December 2, 2013).

I‐62
(“MIP”), the antidumping and anti‐subsidy duties do not apply to imports of their products into
the EU. The EC reports that it constantly monitors the implementation of the price undertaking
and occasionally adjusts the MIP to account for market price developments. All imports into the
EU from China that are above the quota, as well as those imports of solar cells and solar panels
from Chinese producers that are not named in the undertaking, are subject to the final
antidumping and countervailing duty rates that the EC imposed on December 5, 2013 ranging
from 47.7 percent to 64.9 percent.158
On May 29, 2015, the EC initiated investigations into claims that the duties in force
concerning imports from China were being circumvented by shipments through Taiwan and
Malaysia. On February 11, 2016, the EC determined that circumvention had occurred and
extended the duties in force against China to solar panels and solar cells consigned from Taiwan
and Malaysia. However, the EC’s circumvention finding (and the extended duties) do not apply
to approximately twenty companies in Taiwan and five companies in Malaysia that the EC
found were “genuine producers” that had not engaged in any circumvention activities.159
158 Certain Crystalline Silicon Photovoltaic Cells and Modules from China and Taiwan, Inv. Nos. 701‐TA‐511 and 731‐TA‐1246‐1247 (Final), USITC Publication 4519, February 2015, p. VII‐29; Council Implementing Regulation (EU) No 1239/2013 of 2 December 2013 imposing a definitive countervailing duty on imports of crystalline silicon photovoltaic modules and key components (i.e. cells) originating in or consigned from the People's Republic of China, Official Journal of the European Union, December 5, 2013; Council Implementing Regulation (EU) No 1238/2013 of 2 December 2013 imposing a definitive anti‐dumping duty and collecting definitively the provisional duty imposed on imports of crystalline silicon photovoltaic modules and key components (i.e. cells) originating in or consigned from the People's Republic of China, Official Journal of the European Union, December 5, 2013.
159 Commission Implementing Regulation (EU) 2016/184 of 11 February 2016 extending the definitive countervailing duty imposed by Council Implementing Regulation (EU) No 1239/2013 on imports of crystalline silicon photovoltaic modules and key components (i.e. cells) originating in or consigned from the People's Republic of China to imports of crystalline silicon photovoltaic modules and key components
(continued...)

I‐63
On March 3, 2017, the EU published an 18‐month extension of antidumping and anti‐
subsidy duties on CSPV products from China, and notified its intention to conduct a partial
interim review of the gradual mitigation of the measures over the next 18 months. The EC
expected to complete its interim review within six to nine months. In its review, the EC intends
to examine if the measures are still applicable and of relevance in light of the fact that several
manufacturers in China have withdrawn from the MIP undertaking or have been excluded by
the EC for various violations. Antidumping duty margins, which range from 27.3 percent to 64.9
percent, and anti‐subsidy duties, which range from 3.5 percent to 11.5 percent, apply to those
companies that were excluded or withdrew from the MIP undertaking. The duties apply to
imports of CSPV modules and CSPV cells manufactured in China and to modules assembled in
third countries from CSPV cells produced in China.160
India
In October 2012, solar manufacturers in India filed a complaint alleging that solar cells
and modules from China, Taiwan, Malaysia, and the United States are being sold at LTFV and
unfairly subsidized by the respective governments. On November 23, 2012, India initiated its
investigation. After extending the duration of the investigation, in May 2014, the Indian
Directorate General of Anti‐Dumping and Allied Duties (“DGAD”) recommended imposing
(…continued) (i.e. cells) consigned from Malaysia and Taiwan, whether declared as originating in Malaysia and in Taiwan or not, Official Journal of the European Union, February 11, 2016.
160 Notice of initiation of a partial interim review of the anti‐dumping and countervailing measures applicable to imports of crystalline silicon photovoltaic modules and key components (i.e. cells) originating in or consigned from the People’s Republic of China (2017/C 67/10), Official Journal of the European Union, March 3, 2017; “Extension of EU duties on Chinese solar products is now official,” PV Magazine, March 3, 2017, https://www.pv‐magazine.com/2017/03/03/extension‐of‐eu‐duties‐on‐chinese‐solar‐products‐is‐now‐official/, accessed on July 9, 2017.

I‐64
duties ranging from $0.11 to $0.81 per watt on solar cells imported from the United States,
China, Malaysia and Taiwan. However, the Indian Ministry of Commerce announced in
September 2014 that the government would not impose the duties and had let the
recommendation lapse.161
In June 2017, an antidumping petition concerning solar cells and modules imported into
India from China, Malaysia, and Taiwan was filed by the Indian Solar Manufacturers Association
(on behalf of Indosolar Ltd., Jupitar Solar Power Ltd., Jupitar International Ltd., and Websol
Energy Systems Ltd.). DGAD issued notification on July 21, 2017 of the initiation of an
antidumping investigation on imports of “Solar Cells whether or not assembled partially or fully
in Modules or Panels or on glass or some other suitable substrates” originating in or exported
from China, Malaysia, and Taiwan. The scope of the product under investigation covers cells,
modules, and thin films. While it investigates the antidumping allegations, which can take 12‐18
months, India is also reportedly considering in the context of a possible safeguard investigation
whether or not there has been a sudden surge in imports of solar cells and modules from China
and certain other countries that may be causing harm to manufacturers in India.162
161 “India Not to Impose Anti‐Dumping Duty on Solar Panels: Nirmala,” Outlook India, September 10, 2014, http://www.outlookindia.com/news/article/India‐Not‐to‐Impose‐AntiDumping‐Duty‐on‐Solar‐Panels‐Nirmala/859279 accessed July 9, 2017; Certain Crystalline Silicon Photovoltaic Cells and Modules from China and Taiwan, Inv. Nos. 701‐TA‐511 and 731‐TA‐1246‐1247 (Final), USITC Publication 4519, February 2015, p. VII‐30.
162 Kenning, Tom, “India mulling safeguard duties on solar imports with China in sights,” PV‐Tech, July 21, 2017, https://www.pv‐tech.org/news/india‐considers‐safeguard‐duties‐on‐solar‐imports‐with‐dumping‐investigatio, accessed July 23, 2017; Initiation Notification, Case No. OI‐33/2017, F. No. 6/30/2017‐DGAD, Government of India, Department of Commerce, Ministry of Commerce & Industry, Directorate General of Anti‐Dumping & Allied Duties, July 21, 2017.
I‐65
Australia
On May 14, 2014, the Government of Australia initiated an antidumping duty
investigation on CSPV modules or panels from China. The proposed dumping margins ranged
from 21.6 percent to 60.3 percent.163 On October 17, 2016, the Government of Australia
terminated the investigation on the grounds that any injury to the Australian industry that had
been or may be caused by the exports of dumped CSPV panels from China was “negligible.”164
Canada
On December 8, 2014, the Canadian International Trade Tribunal (“CITT”) initiated
antidumping and countervailing duty investigations on CSPV products from China.165 On July 3,
2015, the CITT determined that the dumping and subsidizing of the CSPV products from China
163 The investigation excluded CSPV cells and wafers. Antidumping Commission, Government of Australia, http://www.adcommission.gov.au/cases/documents/031‐ADN‐201438‐Initiationofaninvestigationintoallegeddumping.pdf; http://www.adcommission.gov.au/cases/documents/094‐Notice‐Anti‐DumpingNotice2014‐06ExtentionoftimetoissueSEF.pdf .
164 Certain crystalline silicon photovoltaic modules or panels exported from the People’s Republic of China: Termination of Investigation, Anti‐Dumping Notice No. 2016/110, Antidumping Commission, Government of Australia, October 17, 2016, http://www.adcommission.gov.au/cases/EPR%20193%20%20250/EPR%20239%20‐%20archived%2013%20December%202016/182%20‐%20Notice%20‐%20ADN%202016‐110%20‐%20Termination%20of%20Investigation.pdf, accessed on July 9, 2017.
165 Notice of Commencement of Preliminary Injury Inquiry, Certain Photovoltaic Modules and Laminates, Canadian International Trade Tribunal, Inquiry No. PI‐2014‐003. Canadian solar producers, Eclipsall Energy Corp., Heliene, Inc., Silfab Ontario Inc., and Solgate, Inc. filed the petition on October 1, 2014. The investigation covered photovoltaic modules and laminates consisting of crystalline silicon photovoltaic cells, including laminates shipped or packaged with other components of photovoltaic modules, and thin film photovoltaic products produced from amorphous silicon (a‐Si), cadmium telluride (CdTe), or copper indium gallium selenide (CIGS), originating in or exported from China, excluding modules, laminates or thin film products with a power output not exceeding 100 W, and also excluding modules, laminates or thin film products incorporated into electrical goods where the function of the electrical goods is other than power generation and these electrical goods consume the electricity generated by the photovoltaic product. Excluded are 195 W monocrystalline photovoltaic modules made of 72 monocrystalline cells, each cell being no more than 5 inches in width and height.
I‐66
did not cause injury, but threatened to cause injury to the Canadian industry. The Canada
Border Services Agency (“CBSA”) determined that 100 percent of the subject goods imported
into Canada from China had been dumped at a weighted average margin of 124.4 percent,
when expressed as a percentage of the export price. The CBSA also determined that 100
percent of the subject goods imported into Canada from China had been subsidized at a
weighted average amount of subsidy of 6.2 percent, when expressed as a percentage of the
export price.166
China
On July 20, 2012, the Government of China announced the commencement of an
antidumping and countervailing duty investigation of “solar‐grade polysilicon,” a raw material
used in the manufacturing of solar panels, from the United States and Korea.167 In January
2014, China imposed provisional antidumping duties on U.S. and Korean polysilicon as high as
57 percent and provisional countervailing duties of 2.1 percent. On January 20, 2014, the
Government of China imposed definitive antidumping duties that ranged from 53.3 to 57
percent on imports from the United States and 2.4 to 48.7 percent for imports from Korea; on
the same date, the Government of China announced that it found zero or de minimis subsidy
rates on imports from U.S. firms REC Solar Grade Silicon LLC, REC Advanced Silicon Materials
LLC, and MEMC Pasadena, Inc., but that it was imposing a countervailing duty rate of 2.1
166 Photovoltaic Modules and Laminates, Inquiry No. NQ‐2014‐003, Canadian International Trade Tribunal, July 3, 2015, http://www.citt.gc.ca/en/node/7411#_Toc426546520, accessed on July 10, 2017.
167 Ministry of Commerce, People’s Republic of China website: http://english.mofcom.gov.cn/aarticle/newsrelease/significantnews/201207/20120708245225.html
accessed August 30, 2012.

I‐67
percent on imports from Hemlock Semiconductor Corp., AE Polysilicon Corp., and all other U.S.
exporters.
Separately, the Government of China launched an antidumping and subsidy
investigation on solar‐grade polysilicon originating in the European Union in November 2012.168
Following the investigation, in May 2014, the Government of China confirmed final
antidumping duties of 42 percent and anti‐subsidy duties of 1.2 percent on imports of solar‐
grade polysilicon from the EU.169
Turkey
The Government of Turkey completed an antidumping investigation of imported
modules from China in February 2017, in which it found a dumping rate of 27 percent. On April
1, 2017, the Government of Turkey published a list of China‐based CSPV manufacturers that are
the subject of antidumping duty fees.170
168 “China moves forward with duties on EU polysilicon,” International Centre for Trade and Sustainable Development, May 8, 2014, https://www.ictsd.org/bridges‐news/biores/news/china‐moves‐forward‐with‐duties‐on‐eu‐polysilicon, accessed on July 20, 2017.
169 “China hits EU with final duties on polysilicon,” REUTERS, 30 April 2014, https://www.ajot.com/news/china‐hits‐eu‐with‐final‐duties‐on‐polysilicon, accessed on July 10, 2017.
170 “Turkey publishes antidumping fee and list for China‐based PV manufacturers,” PV Magazine, April 3, 2017, https://www.pv‐magazine.com/2017/04/03/turkey‐publishes‐antidumping‐fee‐and‐list‐for‐china‐based‐pv‐manufacturers/, accessed on July 10, 2017.


II‐1
PART II: INFORMATION RELATING TO INCREASED IMPORTS
U.S. IMPORTS
The import data presented in this part of the report are compiled from data submitted
in response to Commission questionnaires. Import data compiled from official U.S. import
statistics using HTS statistical reporting numbers 8541.40.6020 and 8541.40.6030 are presented
in appendix C, table C‐4.1
Country‐of‐origin based on cell manufacture location
Total U.S. imports of certain crystalline silicon photovoltaic cells, whether or not
partially or fully assembled into other products (“CSPV products”),2 were more than five times
higher in 2016 than reported in 2012 based on quantity (kW) (table II‐1 and figure II‐1).3 A
similar upward trend is observed for U.S. imports based on value. However, the average unit
value of U.S. imports of CSPV products declined from a high of $881 per kW in 2012 to a low of
$551 per kW in 2016. The largest increases in U.S. imports of CSPV products were observed for
Malaysia (*** kW higher in 2016 than in 2012), China (2.4 million kW higher in 2016 than in
2012), and Korea (*** kW higher in 2016 than in 2012). The leading suppliers of foreign CSPV
products to the United States during 2012 were Taiwan, China, and the Philippines,
representing 49.3 percent, 15.1 percent, and *** percent of all imports by
1 Official U.S. import statistics may be overstated by certain items that are outside the scope of this investigation, such as thin film photovoltaic products. In addition, only import value data are presented in table C‐4 because quantity data are not collected on the basis of kW.
2 See the section entitled “The Imported Articles Described in this Investigation” in Part I of this report for a complete description of the merchandise subject to this investigation.
3 The data presented in table II‐1 and figure II‐1 represent CSPV cells and modules with a country‐of‐origin based on cell manufacture location.
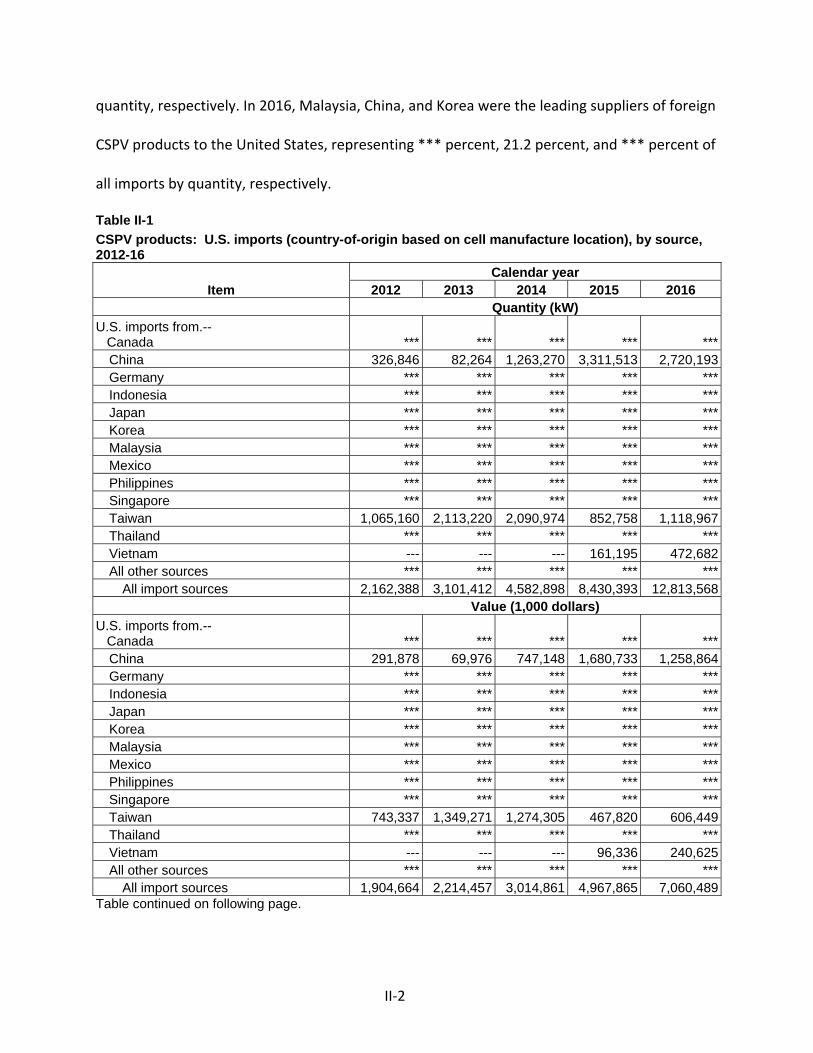
II‐2
quantity, respectively. In 2016, Malaysia, China, and Korea were the leading suppliers of foreign
CSPV products to the United States, representing *** percent, 21.2 percent, and *** percent of
all imports by quantity, respectively.
Table II-1
CSPV products: U.S. imports (country-of-origin based on cell manufacture location), by source, 2012-16
Item Calendar year
2012 2013 2014 2015 2016 Quantity (kW)
U.S. imports from.-- Canada *** *** *** *** ***
China 326,846 82,264 1,263,270 3,311,513 2,720,193Germany *** *** *** *** ***Indonesia *** *** *** *** ***Japan *** *** *** *** ***Korea *** *** *** *** ***Malaysia *** *** *** *** ***Mexico *** *** *** *** ***Philippines *** *** *** *** ***Singapore *** *** *** *** ***Taiwan 1,065,160 2,113,220 2,090,974 852,758 1,118,967Thailand *** *** *** *** ***Vietnam --- --- --- 161,195 472,682All other sources *** *** *** *** ***
All import sources 2,162,388 3,101,412 4,582,898 8,430,393 12,813,568 Value (1,000 dollars)
U.S. imports from.-- Canada *** *** *** *** ***
China 291,878 69,976 747,148 1,680,733 1,258,864Germany *** *** *** *** ***Indonesia *** *** *** *** ***Japan *** *** *** *** ***Korea *** *** *** *** ***Malaysia *** *** *** *** ***Mexico *** *** *** *** ***Philippines *** *** *** *** ***Singapore *** *** *** *** ***Taiwan 743,337 1,349,271 1,274,305 467,820 606,449Thailand *** *** *** *** ***Vietnam --- --- --- 96,336 240,625All other sources *** *** *** *** ***
All import sources 1,904,664 2,214,457 3,014,861 4,967,865 7,060,489Table continued on following page.
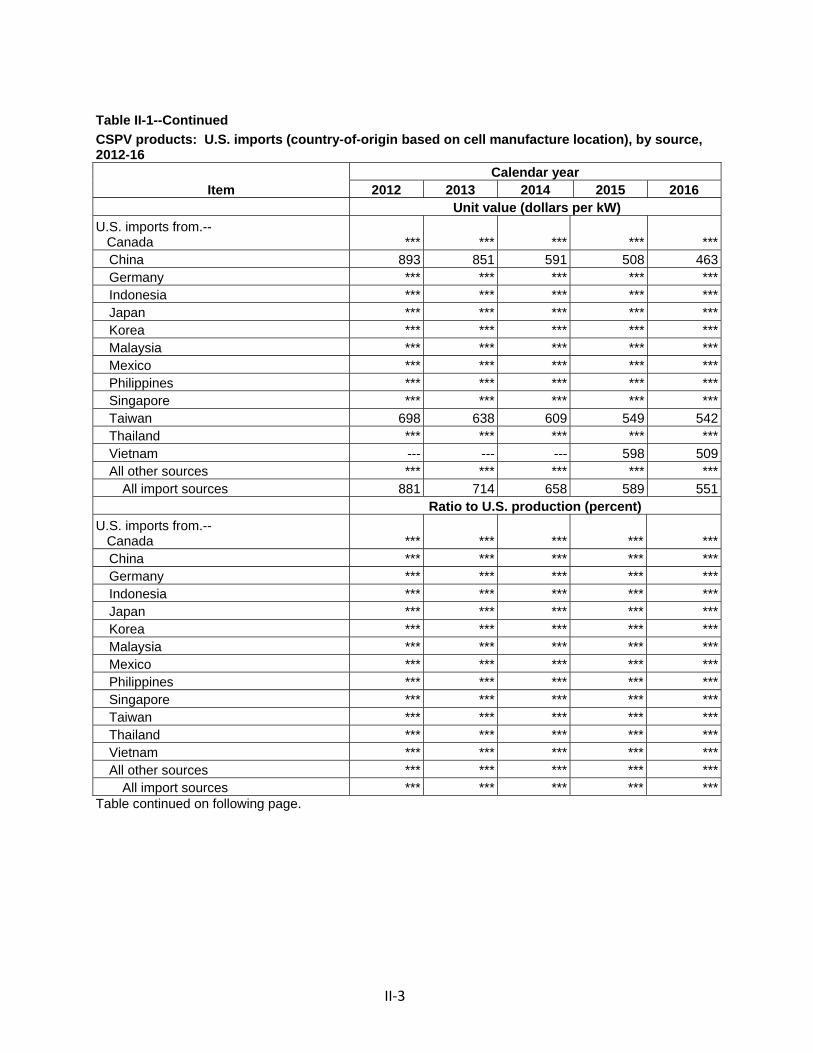
II‐3
Table II-1--Continued
CSPV products: U.S. imports (country-of-origin based on cell manufacture location), by source, 2012-16
Item Calendar year
2012 2013 2014 2015 2016 Unit value (dollars per kW)
U.S. imports from.-- Canada *** *** *** *** ***
China 893 851 591 508 463Germany *** *** *** *** ***Indonesia *** *** *** *** ***Japan *** *** *** *** ***Korea *** *** *** *** ***Malaysia *** *** *** *** ***Mexico *** *** *** *** ***Philippines *** *** *** *** ***Singapore *** *** *** *** ***Taiwan 698 638 609 549 542Thailand *** *** *** *** ***Vietnam --- --- --- 598 509All other sources *** *** *** *** ***
All import sources 881 714 658 589 551 Ratio to U.S. production (percent)
U.S. imports from.-- Canada *** *** *** *** ***
China *** *** *** *** ***Germany *** *** *** *** ***Indonesia *** *** *** *** ***Japan *** *** *** *** ***Korea *** *** *** *** ***Malaysia *** *** *** *** ***Mexico *** *** *** *** ***Philippines *** *** *** *** ***Singapore *** *** *** *** ***Taiwan *** *** *** *** ***Thailand *** *** *** *** ***Vietnam *** *** *** *** ***All other sources *** *** *** *** ***
All import sources *** *** *** *** ***Table continued on following page.
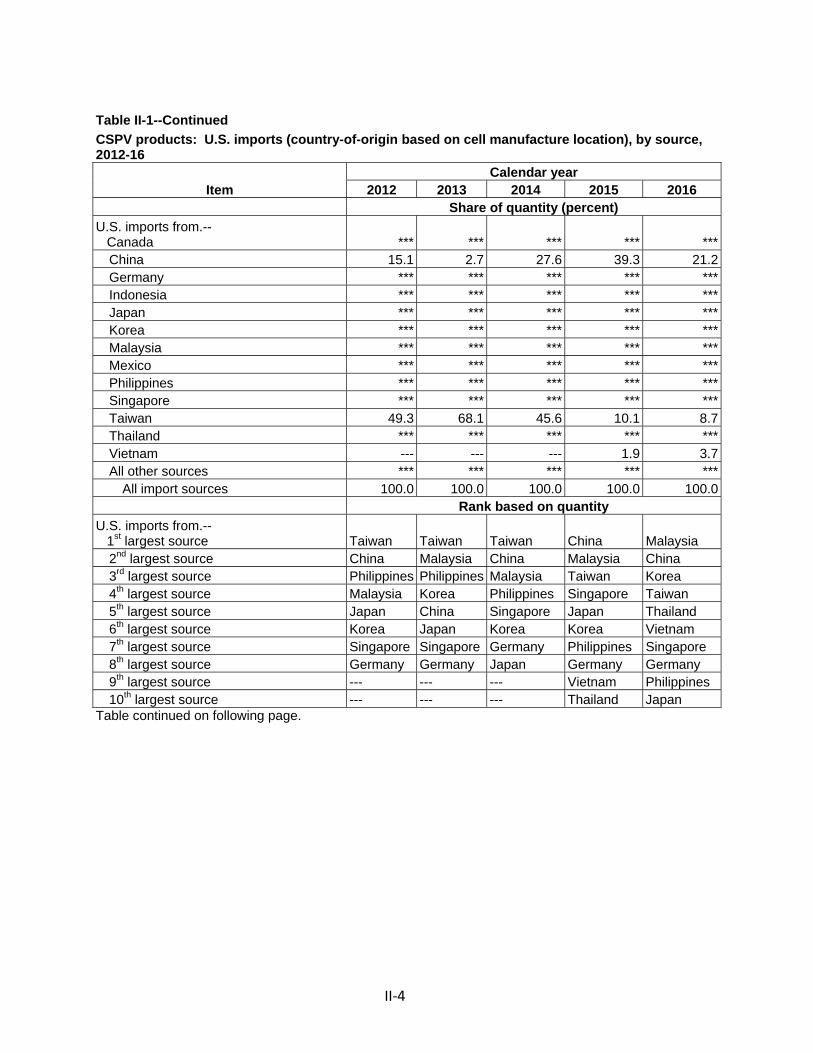
II‐4
Table II-1--Continued
CSPV products: U.S. imports (country-of-origin based on cell manufacture location), by source, 2012-16
Item Calendar year
2012 2013 2014 2015 2016 Share of quantity (percent)
U.S. imports from.-- Canada *** *** *** *** ***
China 15.1 2.7 27.6 39.3 21.2Germany *** *** *** *** ***Indonesia *** *** *** *** ***Japan *** *** *** *** ***Korea *** *** *** *** ***Malaysia *** *** *** *** ***Mexico *** *** *** *** ***Philippines *** *** *** *** ***Singapore *** *** *** *** ***Taiwan 49.3 68.1 45.6 10.1 8.7Thailand *** *** *** *** ***Vietnam --- --- --- 1.9 3.7All other sources *** *** *** *** ***
All import sources 100.0 100.0 100.0 100.0 100.0 Rank based on quantity
U.S. imports from.-- 1st largest source Taiwan Taiwan Taiwan China Malaysia
2nd largest source China Malaysia China Malaysia China 3rd largest source Philippines Philippines Malaysia Taiwan Korea 4th largest source Malaysia Korea Philippines Singapore Taiwan 5th largest source Japan China Singapore Japan Thailand 6th largest source Korea Japan Korea Korea Vietnam 7th largest source Singapore Singapore Germany Philippines Singapore 8th largest source Germany Germany Japan Germany Germany 9th largest source --- --- --- Vietnam Philippines 10th largest source --- --- --- Thailand Japan
Table continued on following page.
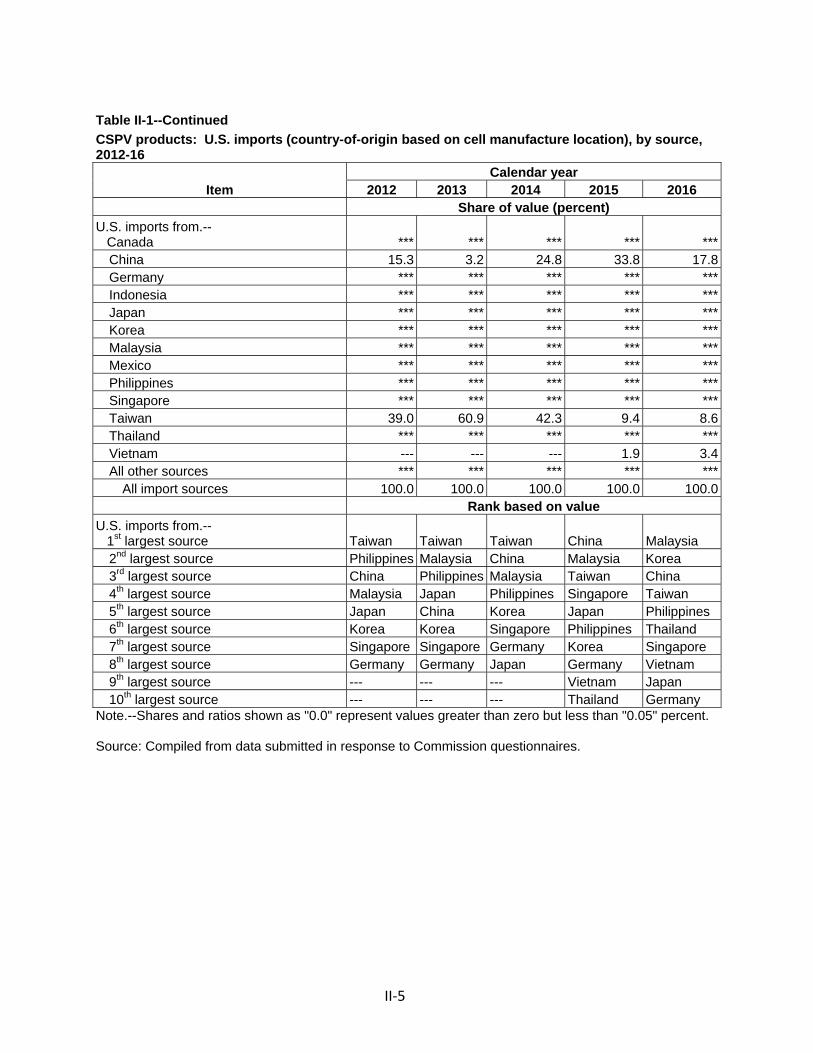
II‐5
Table II-1--Continued
CSPV products: U.S. imports (country-of-origin based on cell manufacture location), by source, 2012-16
Item Calendar year
2012 2013 2014 2015 2016 Share of value (percent)
U.S. imports from.-- Canada *** *** *** *** ***
China 15.3 3.2 24.8 33.8 17.8Germany *** *** *** *** ***Indonesia *** *** *** *** ***Japan *** *** *** *** ***Korea *** *** *** *** ***Malaysia *** *** *** *** ***Mexico *** *** *** *** ***Philippines *** *** *** *** ***Singapore *** *** *** *** ***Taiwan 39.0 60.9 42.3 9.4 8.6Thailand *** *** *** *** ***Vietnam --- --- --- 1.9 3.4All other sources *** *** *** *** ***
All import sources 100.0 100.0 100.0 100.0 100.0 Rank based on value
U.S. imports from.-- 1st largest source Taiwan Taiwan Taiwan China Malaysia
2nd largest source Philippines Malaysia China Malaysia Korea 3rd largest source China Philippines Malaysia Taiwan China 4th largest source Malaysia Japan Philippines Singapore Taiwan 5th largest source Japan China Korea Japan Philippines 6th largest source Korea Korea Singapore Philippines Thailand 7th largest source Singapore Singapore Germany Korea Singapore 8th largest source Germany Germany Japan Germany Vietnam 9th largest source --- --- --- Vietnam Japan 10th largest source --- --- --- Thailand Germany
Note.--Shares and ratios shown as "0.0" represent values greater than zero but less than "0.05" percent. Source: Compiled from data submitted in response to Commission questionnaires.

II‐6
Figure II-1
CSPV products: U.S. import volumes and average unit values, 2012-16
Source: Compiled from data submitted in response to Commission questionnaires.

II‐7
Country‐of‐origin based on cell manufacture location except for NAFTA countries
Total U.S. imports of CSPV products with a country‐of‐origin for NAFTA countries based
on module manufacture location and a country‐of‐origin for all other sources based on the cell
manufacture location are presented in table II‐2.
According to these data, U.S. imports of CSPV modules from Canada increased from ***
kW ($***) in 2012 to *** kW ($***) in 2016. However, the average unit value of U.S. imports of
modules from Canada declined from a high of $*** per kW in 2012 to a low of $*** per kW in
2015, before increasing to $*** per kW in 2016. The share of the total quantity of U.S. imports
held by Canadian imports increased from *** percent of total U.S. imports in 2012 to ***
percent in 2015, before declining to *** percent in 2016. Canada was the tenth largest source
of U.S. imports of CSPV products during 2012, 2013, and 2016. It was the ninth largest source
during 2014 and the seventh largest source during 2015.
The quantity of U.S. imports of CSPV modules from Mexico were *** higher in 2016
than reported in 2012, increasing from *** kW in 2012 to *** kW in 2016. However, the
average unit value of U.S. imports of modules from Mexico declined from a high of $*** per kW
in 2012 to a low of $*** per kW in 2016. The share of the total quantity of U.S. imports held by
Mexican imports increased from *** percent of total U.S. imports in 2012 to *** percent in
2013, before declining to *** percent in 2016. Based on quantity, Mexico was the second
largest source of U.S. imports of CSPV products during 2013, the third largest source during
2012, 2014, and 2015, and the fourth largest source during 2016. Based on value, the share of
total U.S. imports held by Mexican imports increased from *** percent of total U.S. imports in
2012 to *** percent in 2013, before declining to

II‐8
*** percent in 2016. Based on value, Mexico was the second leading source of U.S. imports of
CSPV products during 2012‐13, the third leading source during 2014‐15, and the fourth leading
source in 2016.
Table II-2
CSPV products: Alternative U.S. imports (country-of-origin based on cell manufacture location, except for NAFTA countries), by source, 2012-16
Item Calendar year
2012 2013 2014 2015 2016 Quantity (kW)
U.S. imports from.-- Canada *** *** *** *** ***
China *** *** *** *** ***Germany *** *** *** *** ***Indonesia *** *** *** *** ***Japan *** *** *** *** ***Korea *** *** *** *** ***Malaysia *** *** *** *** ***Mexico *** *** *** *** ***Philippines *** *** *** *** ***Singapore *** *** *** *** ***Taiwan *** *** *** *** ***Thailand *** *** *** *** ***Vietnam *** *** *** *** ***All other sources *** *** *** *** ***
All import sources 2,163,073 3,100,220 4,583,141 8,415,542 12,815,100 Value (1,000 dollars)
U.S. imports from.-- Canada *** *** *** *** ***
China *** *** *** *** ***Germany *** *** *** *** ***Indonesia *** *** *** *** ***Japan *** *** *** *** ***Korea *** *** *** *** ***Malaysia *** *** *** *** ***Mexico *** *** *** *** ***Philippines *** *** *** *** ***Singapore *** *** *** *** ***Taiwan *** *** *** *** ***Thailand *** *** *** *** ***Vietnam *** *** *** *** ***All other sources *** *** *** *** ***
All import sources 1,907,405 2,212,042 3,015,041 4,955,829 7,061,435Table continued on following page.

II‐9
Table II-2--Continued
CSPV products: Alternative U.S. imports (country-of-origin based on cell manufacture location, except for NAFTA countries), by source, 2012-16
Item Calendar year
2012 2013 2014 2015 2016 Unit value (dollars per kW)
U.S. imports from.-- Canada *** *** *** *** ***
China *** *** *** *** ***Germany *** *** *** *** ***Indonesia *** *** *** *** ***Japan *** *** *** *** ***Korea *** *** *** *** ***Malaysia *** *** *** *** ***Mexico *** *** *** *** ***Philippines *** *** *** *** ***Singapore *** *** *** *** ***Taiwan *** *** *** *** ***Thailand *** *** *** *** ***Vietnam *** *** *** *** ***All other sources *** *** *** *** ***
All import sources 882 714 658 589 551 Ratio to U.S. production (percent)
U.S. imports from.-- Canada *** *** *** *** ***
China *** *** *** *** ***Germany *** *** *** *** ***Indonesia *** *** *** *** ***Japan *** *** *** *** ***Korea *** *** *** *** ***Malaysia *** *** *** *** ***Mexico *** *** *** *** ***Philippines *** *** *** *** ***Singapore *** *** *** *** ***Taiwan *** *** *** *** ***Thailand *** *** *** *** ***Vietnam *** *** *** *** ***All other sources *** *** *** *** ***
All import sources 733.9 948.4 1,141.0 1,593.5 2,276.2Table continued on following page.

II‐10
Table II-2--Continued
CSPV products: Alternative U.S. imports (country-of-origin based on cell manufacture location, except for NAFTA countries), by source, 2012-16
Item Calendar year
2012 2013 2014 2015 2016 Share of quantity (percent)
U.S. imports from.-- Canada *** *** *** *** ***
China *** *** *** *** ***Germany *** *** *** *** ***Indonesia *** *** *** *** ***Japan *** *** *** *** ***Korea *** *** *** *** ***Malaysia *** *** *** *** ***Mexico *** *** *** *** ***Philippines *** *** *** *** ***Singapore *** *** *** *** ***Taiwan *** *** *** *** ***Thailand *** *** *** *** ***Vietnam *** *** *** *** ***All other sources *** *** *** *** ***
All import sources 100.0 100.0 100.0 100.0 100.0 Rank based on quantity
U.S. imports from.-- 1st largest source Taiwan Taiwan Taiwan China Malaysia
2nd largest source China Mexico China Malaysia China 3rd largest source Mexico Malaysia Mexico Mexico Korea 4th largest source Philippines Korea Malaysia Singapore Mexico 5th largest source Malaysia China Singapore Taiwan Taiwan 6th largest source Korea Singapore Korea Korea Thailand 7th largest source Singapore Philippines Germany Canada Vietnam 8th largest source Japan Germany Philippines Japan Singapore 9th largest source Germany Japan Canada Germany Germany 10th largest source Canada Canada Japan Vietnam Canada
Table continued on following page.

II‐11
Table II-2--Continued
CSPV products: Alternative U.S. imports (country-of-origin based on cell manufacture location, except for NAFTA countries), by source, 2012-16
Item Calendar year
2012 2013 2014 2015 2016 Share of value (percent)
U.S. imports from.-- Canada *** *** *** *** ***
China *** *** *** *** ***Germany *** *** *** *** ***Indonesia *** *** *** *** ***Japan *** *** *** *** ***Korea *** *** *** *** ***Malaysia *** *** *** *** ***Mexico *** *** *** *** ***Philippines *** *** *** *** ***Singapore *** *** *** *** ***Taiwan *** *** *** *** ***Thailand *** *** *** *** ***Vietnam *** *** *** *** ***All other sources *** *** *** *** ***
All import sources 100.0 100.0 100.0 100.0 100.0 Rank based on value
U.S. imports from.-- 1st largest source Taiwan Taiwan Taiwan China Malaysia
2nd largest source Mexico Mexico China Malaysia Korea 3rd largest source China Malaysia Mexico Mexico China 4th largest source Philippines China Malaysia Singapore Mexico 5th largest source Malaysia Korea Korea Taiwan Taiwan 6th largest source Korea Singapore Singapore Korea Thailand 7th largest source Singapore Philippines Germany Canada Singapore 8th largest source Japan Germany Philippines Japan Vietnam 9th largest source Germany Japan Canada Germany Germany 10th largest source Canada Canada Japan Vietnam Canada
Note.--Shares and ratios shown as "0.0" represent values greater than zero but less than "0.05" percent. The adjustments made to reclassify the country-of-origin for modules assembled in Canada or Mexico resulted in small immaterial differences in the total import values (never exceeding a margin of 0.2 percent difference). Data for Canada do not include U.S.-origin cells assembled into modules or laminates in Canada. Source: Compiled from data submitted in response to Commission questionnaires.

II‐12
U.S. imports from China
The Commission requested that importing firms also separately report their U.S. imports
of CSPV products from China using the assembly location of the modules to determine the
country of origin (table II‐3).4 According to these data, U.S. imports of CSPV products from
China fluctuated upward from 1.7 million kW ($518.9 million) in 2012 to 2.4 million kW ($1.2
billion) in 2016. The average unit value of these U.S. imports of CSPV products from China
increased from $299 per kW in 2012 to $659 per kW in 2013, before falling overall to $521 per
kW in 2016. The share of the total quantity of U.S. imports held by Chinese imports based on
country‐of‐origin of module manufacture fell from 80.3 percent of total U.S. imports in 2012 to
18.4 percent in 2016. Based on value, the share of total U.S. imports held by these Chinese
imports increased from 27.2 percent of total U.S. imports in 2012 to 44.7 percent in 2013,
before declining to 17.4 percent in 2016.
4 Import data for Canada and Mexico for country‐of‐origin based on assembly location of the modules are incorporated into table II‐2. Antidumping and countervailing duty orders associated with the CSPV 1 investigations concerning China became effective December 7, 2012. In the CSPV 1 investigations, Commerce determined that the country of origin of CSPV modules was the country of manufacture of the CSPV cells. Antidumping and countervailing duty orders associated with the CSPV 2 investigations concerning China became effective February 18, 2015. In its final CSPV 2 determinations, Commerce defined the subject merchandise from China to include U.S. imports of CSPV modules assembled in China from CSPV cells made in other countries.

II‐13
Table II-3
CSPV products: Alternative U.S. imports from China (country-of-origin based on module manufacture location), 2012-16
Item Calendar year
2012 2013 2014 2015 2016 Quantity (kW)
U.S. imports from China.-- Quantity (kW) 1,735,955 1,501,817 2,178,727 1,993,901 2,360,823
Value (1,000 dollars) 518,856 989,576 1,292,582 1,007,159 1,230,110Unit value (dollars per kW) 299 659 593 505 521Share of quantity of total imports (percent) 80.3 48.4 47.5 23.7 18.4Share of value of total imports (percent) 27.2 44.7 42.9 20.3 17.4Ratio to U.S. production (percent) *** *** *** *** ***
Note.-- Antidumping and countervailing duty orders associated with the CSPV 1 investigations concerning China became effective December 7, 2012. Antidumping and countervailing duty orders associated with the CSPV 2 investigations concerning China became effective February 18, 2015. Shares and ratios shown as "0.0" represent values greater than zero but less than 0.05 percent. Source: Compiled from data submitted in response to Commission questionnaires.

II‐14
Forms of imported CSPV products
The Commission collected U.S. import data for CSPV products by the following forms in
which they entered the United States: cell form, laminate form, off‐grid portable consumer
goods, module/panel form, and integrated building materials form. During 2012, *** percent of
U.S. imports of CSPV products entered the United States as modules/panels, whereas ***
percent were in cell form, *** percent were off‐grid portable consumer goods, and *** percent
were in laminate form (table II‐4). By 2016, *** percent of U.S. imports of CSPV products
entered the United States as modules/panels and *** percent were in cell form. Imports of off‐
grid portable consumer goods and laminate forms remained at *** percent during 2016. ***
U.S. imports for CSPV products in building integrated forms were reported during the period of
investigation.
All categories/types of CSPV imports were higher in 2016 than in 2012, except for U.S.
imports of laminates, which declined by *** percent from 2012 to 2016. U.S. imports of CSPV
cells declined from 2012 to 2014, before increasing in 2016 to a level that was *** percent
higher than reported in 2012. U.S. imports of module/panel forms were *** higher in 2016
than in 2012 and off‐grid portable consumer goods were *** percent higher. The largest
absolute quantity increase in forms of U.S. imports of CSPV products was observed for
module/panel forms at *** kW higher in 2016 than in 2012. The average unit values of all forms
of CSPV imports declined from 2012 to 2016. The average unit values of module/panel forms
fell by $*** per kW from a high of $*** per kW in 2012 to a low of $*** per kW in 2016.

II‐15
Table II-4
CSPV products: U.S. imports, by form, 2012-16
Item Calendar year
2012 2013 2014 2015 2016 Quantity (kW)
U.S. imports in.-- Cell form *** *** *** *** ***
Laminate form *** *** *** *** ***Off-grid portable consumer goods *** *** *** *** ***Module / panel form *** *** *** *** ***Integrated building materials form *** *** *** *** ***
All forms 2,162,388 3,101,412 4,582,898 8,430,393 12,813,568 Value (1,000 dollars)
U.S. imports in.-- Cell form *** *** *** *** ***
Laminate form *** *** *** *** ***Off-grid portable consumer goods *** *** *** *** ***Module / panel form *** *** *** *** ***Integrated building materials form *** *** *** *** ***
All forms 1,904,664 2,214,457 3,014,861 4,967,865 7,060,489 Unit value (dollars per kW)
U.S. imports in.-- Cell form *** *** *** *** ***
Laminate form *** *** *** *** ***Off-grid portable consumer goods *** *** *** *** ***Module / panel form *** *** *** *** ***Integrated building materials form *** *** *** *** ***
All forms 881 714 658 589 551 Share of quantity (percent)
U.S. imports in.-- Cell form *** *** *** *** ***
Laminate form *** *** *** *** ***Off-grid portable consumer goods *** *** *** *** ***Module / panel form *** *** *** *** ***Integrated building materials form *** *** *** *** ***
All forms 100.0 100.0 100.0 100.0 100.0Source: Compiled from data submitted in response to Commission questionnaires.
II‐16
Importers’ CSPV technology
A majority of the 56 responding U.S. importers reported imports of CSPV products
containing multicrystalline cells (40 out of 56) and monocrystalline cells (36 out of 56) since
January 1, 2012, whereas slightly more than one‐fourth of responding U.S. importers (15 out of
56) reported imports of CSPV products containing PERC cells (table II‐5). A minority of U.S.
importers reported imports of CSPV products containing bifacial cells (7 out of 56), hybrid cells
(5 out of 56), and HIT cells (2 out of 56).
The largest importing firms are ***, which together accounted for *** of reported total
U.S. CSPV imports during the period of investigation (see table I‐3).5 ***, which accounted for
***, reported imports of monocrystalline and multicrystalline cells. ***, which accounted for
*** percent of total U.S. CSPV product imports, also reported imports of mono and multi cells,
as well as hybrid cells. ***, which accounted for *** percent of total U.S. CSPV product imports,
reported imports of mono and multi cells, as well as PERC cells.
5 *** reported CSPV imports from ***. *** reported imports from ***. *** reported imports from ***. *** reported imports from ***. *** reported imports from ***.
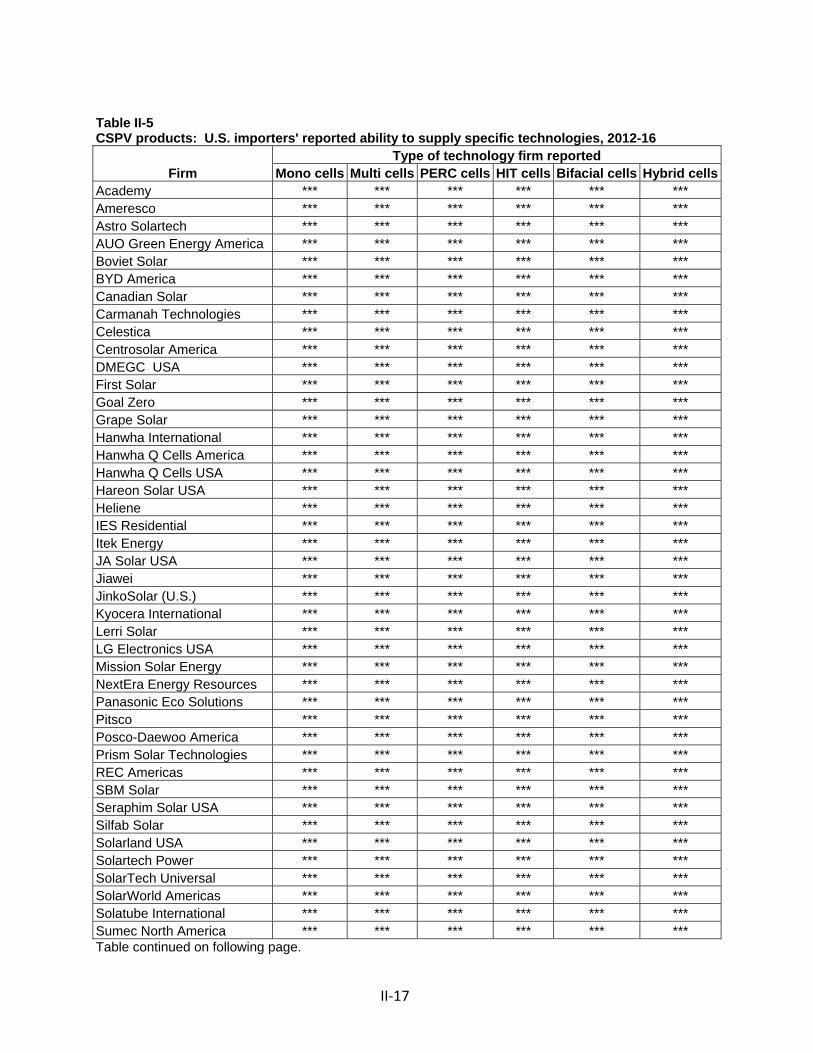
II‐17
Table II-5 CSPV products: U.S. importers' reported ability to supply specific technologies, 2012-16
Firm Type of technology firm reported
Mono cells Multi cells PERC cells HIT cells Bifacial cells Hybrid cellsAcademy *** *** *** *** *** *** Ameresco *** *** *** *** *** *** Astro Solartech *** *** *** *** *** *** AUO Green Energy America *** *** *** *** *** *** Boviet Solar *** *** *** *** *** *** BYD America *** *** *** *** *** *** Canadian Solar *** *** *** *** *** *** Carmanah Technologies *** *** *** *** *** *** Celestica *** *** *** *** *** *** Centrosolar America *** *** *** *** *** *** DMEGC USA *** *** *** *** *** *** First Solar *** *** *** *** *** *** Goal Zero *** *** *** *** *** *** Grape Solar *** *** *** *** *** *** Hanwha International *** *** *** *** *** *** Hanwha Q Cells America *** *** *** *** *** *** Hanwha Q Cells USA *** *** *** *** *** *** Hareon Solar USA *** *** *** *** *** *** Heliene *** *** *** *** *** *** IES Residential *** *** *** *** *** *** Itek Energy *** *** *** *** *** *** JA Solar USA *** *** *** *** *** *** Jiawei *** *** *** *** *** *** JinkoSolar (U.S.) *** *** *** *** *** *** Kyocera International *** *** *** *** *** *** Lerri Solar *** *** *** *** *** *** LG Electronics USA *** *** *** *** *** *** Mission Solar Energy *** *** *** *** *** *** NextEra Energy Resources *** *** *** *** *** *** Panasonic Eco Solutions *** *** *** *** *** *** Pitsco *** *** *** *** *** *** Posco-Daewoo America *** *** *** *** *** *** Prism Solar Technologies *** *** *** *** *** *** REC Americas *** *** *** *** *** *** SBM Solar *** *** *** *** *** *** Seraphim Solar USA *** *** *** *** *** *** Silfab Solar *** *** *** *** *** *** Solarland USA *** *** *** *** *** *** Solartech Power *** *** *** *** *** *** SolarTech Universal *** *** *** *** *** *** SolarWorld Americas *** *** *** *** *** *** Solatube International *** *** *** *** *** *** Sumec North America *** *** *** *** *** *** Table continued on following page.

II‐18
Table II-5--Continued CSPV products: U.S. importers' reported ability to supply specific technologies, 2012-16
Firm Type of technology firm reported
Mono cells Multi cells PERC cells HIT cells Bifacial cells Hybrid cellsSuniva *** *** *** *** *** *** SunPower *** *** *** *** *** *** SunPower Corp., Systems *** *** *** *** *** *** SunPower North America *** *** *** *** *** *** Sunpreme *** *** *** *** *** *** SunStream Technology *** *** *** *** *** *** Tesla *** *** *** *** *** *** The Chamberlain Group *** *** *** *** *** *** The Solaria Corp. *** *** *** *** *** *** Trina Solar (U.S.) *** *** *** *** *** *** Upsolar America *** *** *** *** *** *** Winaico Delaware *** *** *** *** *** *** Yingli Green Energy *** *** *** *** *** ***
Total 36 40 15 2 7 5 Source: Compiled from data submitted in response to Commission questionnaires.
U.S. IMPORTERS’ IMPORTS SUBSEQUENT TO DECEMBER 31, 2016
The Commission requested importers to indicate whether they had imported or
arranged for the importation of CSPV products for delivery after December 31, 2016. The
quarterly data reported for 2017 by responding importers are presented in table II‐6.6 The
leading suppliers of arranged foreign CSPV products to the United States during 2017 are
Malaysia, Korea, the Philippines, and Vietnam, representing *** percent, *** percent, ***
percent, and 10.0 percent of all imports by quantity, respectively. The total quantity of 10.2
million kW of arranged U.S. imports for calendar year 2017 is 20.7 percent lower than the
annual import level of 12.8 million kW reported for calendar year 2016, but 20.5 percent higher
than the annual import level of 8.4 million kW reported during calendar year 2015 (compare
table II‐1 and table II‐6).
6 These data were reported as of June 29, 2017.
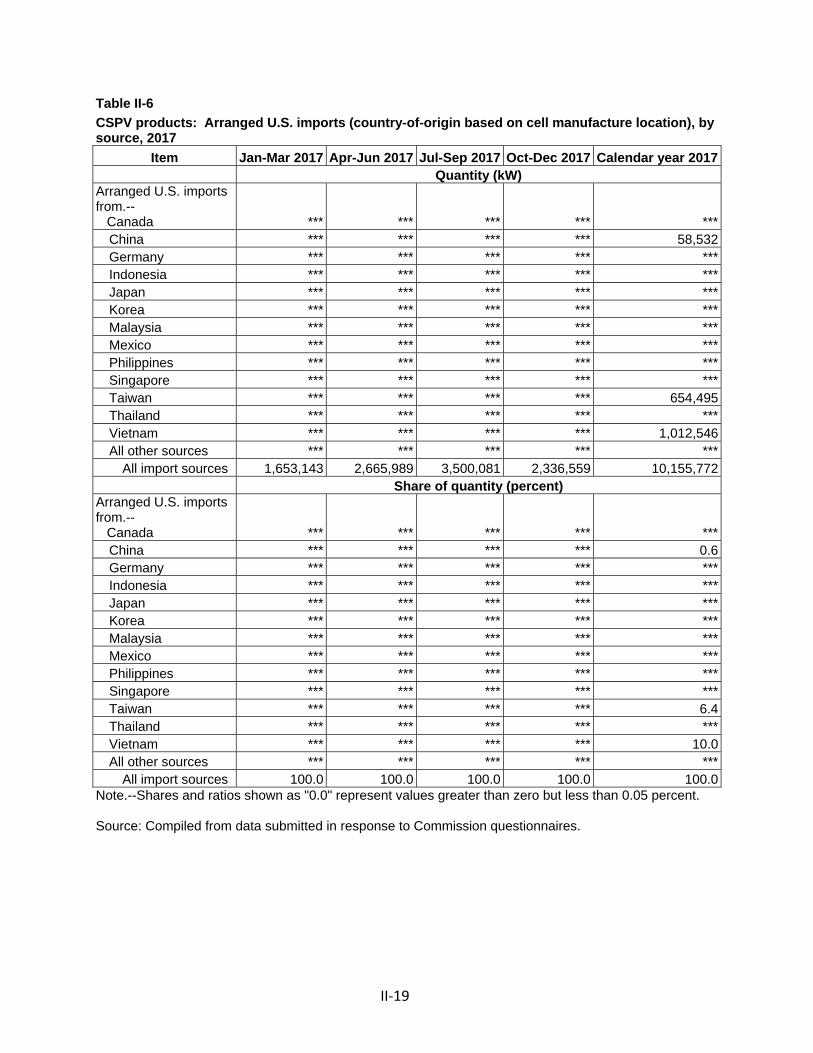
II‐19
Table II-6
CSPV products: Arranged U.S. imports (country-of-origin based on cell manufacture location), by source, 2017
Item Jan-Mar 2017 Apr-Jun 2017 Jul-Sep 2017 Oct-Dec 2017 Calendar year 2017 Quantity (kW) Arranged U.S. imports from.-- Canada *** *** *** *** ***
China *** *** *** *** 58,532Germany *** *** *** *** ***Indonesia *** *** *** *** ***Japan *** *** *** *** ***Korea *** *** *** *** ***Malaysia *** *** *** *** ***Mexico *** *** *** *** ***Philippines *** *** *** *** ***Singapore *** *** *** *** ***Taiwan *** *** *** *** 654,495Thailand *** *** *** *** ***Vietnam *** *** *** *** 1,012,546All other sources *** *** *** *** ***
All import sources 1,653,143 2,665,989 3,500,081 2,336,559 10,155,772 Share of quantity (percent)
Arranged U.S. imports from.-- Canada *** *** *** *** ***
China *** *** *** *** 0.6Germany *** *** *** *** ***Indonesia *** *** *** *** ***Japan *** *** *** *** ***Korea *** *** *** *** ***Malaysia *** *** *** *** ***Mexico *** *** *** *** ***Philippines *** *** *** *** ***Singapore *** *** *** *** ***Taiwan *** *** *** *** 6.4Thailand *** *** *** *** ***Vietnam *** *** *** *** 10.0All other sources *** *** *** *** ***
All import sources 100.0 100.0 100.0 100.0 100.0Note.--Shares and ratios shown as "0.0" represent values greater than zero but less than 0.05 percent. Source: Compiled from data submitted in response to Commission questionnaires.

II‐20
IMPORTS BY U.S. PRODUCERS AND RELATED FIRMS
Thirteen U.S. producers of CSPV products reported direct imports since January 1, 2012.
Eight of the 13 reported direct imports of exclusively CSPV cells, one reported direct imports of
CSPV laminates, and four reported direct imports of a combination of CSPV cells, modules, and
off‐grid portable consumer goods. The most common reasons cited for imports by U.S.
producers include the following: ***. Table II‐7 presents data on individual U.S. producers’ U.S.
production and U.S imports of CSPV products and the reasons each cited for such imports.
The *** domestic producer *** reported that its ratio of U.S. imports to U.S. production
increased from *** percent in 2012 to *** percent in 2016. *** of ***’s U.S. imports in 2012
were CSPV products in module form. However, *** began importing increasing amounts of ***.
By 2016, *** percent of ***’s direct imports of CSPV products were in cell form, *** percent
were in module form, and ***.
The *** domestic producer *** reported that its ratio of U.S. imports to U.S. production
was *** percent in 2012, *** percent in 2013, and *** percent in 2014. *** reported that its

II‐21
direct imports of CSPV products during 2012‐14 were from Taiwan and were in laminate form.
The producer did not import CSPV products during 2015 and 2016.
Table II-7 CSPV products: U.S. producers’ U.S. production, imports, import ratios to U.S. production, and reasons for importing, 2012-16
Item/firm Calendar year
2012 2013 2014 2015 2016 *** Quantity (kW) ***'s U.S. production *** *** *** *** ******'s U.S. imports: Cell form: *** *** *** *** *** *** Ratio (percent) Ratio to U.S. production of imports *** *** *** *** *** Narrative Reason for importing *** *** Quantity (kW) ***'s U.S. production *** *** *** *** ******'s U.S. imports: Cell form: *** *** *** *** *** *** *** *** *** *** *** *** Subtotal, cell form *** *** *** *** *** Module/panel form: *** *** *** *** *** *** *** *** *** *** *** *** Subtotal, modules *** *** *** *** *** Total, imports *** *** *** *** *** Ratio (percent) Ratio of imports to U.S. production *** *** *** *** *** Narrative Reason for importing *** Table continued on following page.

II‐22
Table II-7--Continued CSPV products: U.S. producers’ U.S. production, imports, import ratios to U.S. production, and reasons for importing, 2012-16
Item Calendar year
2012 2013 2014 2015 2016 *** Quantity (kW) ***'s U.S. production *** *** *** *** ******'s U.S. imports: Cell form: *** *** *** *** *** *** *** *** *** *** *** *** *** *** *** *** *** *** Total, all sources *** *** *** *** *** Ratio (percent) Ratio of imports to U.S. production *** *** *** *** *** Narrative
Reason for importing *** *** Quantity (kW) ***'s U.S. production *** *** *** *** ******'s U.S. imports (all cell form): *** *** *** *** *** *** *** *** *** *** *** *** *** *** *** *** *** *** Total, all sources *** *** *** *** *** Ratio (percent) Ratio to U.S. production of imports *** *** *** *** *** Narrative Reason for importing *** Table continued on following page.

II‐23
Table II-7--Continued CSPV products: U.S. producers’ U.S. production, imports, import ratios to U.S. production, and reasons for importing, 2012-16
Item Calendar year
2012 2013 2014 2015 2016 *** Quantity (kW) ***'s U.S. production *** *** *** *** ******'s U.S. imports: Cell form: *** *** *** *** *** *** Ratio (percent) Ratio to U.S. production of imports *** *** *** *** *** Narrative Reason for importing *** *** Quantity (kW) ***'s U.S. production *** *** *** *** ******'s U.S. imports: Cell form: *** *** *** *** *** *** Ratio (percent) Ratio to U.S. production of imports *** *** *** *** *** Narrative Reason for importing *** *** Quantity (kW) ***'s U.S. production *** *** *** *** ******'s U.S. imports: Cell form: *** *** *** *** *** *** Ratio (percent) Ratio to U.S. production of imports *** *** *** *** *** Narrative Reason for importing *** Table continued on following page.
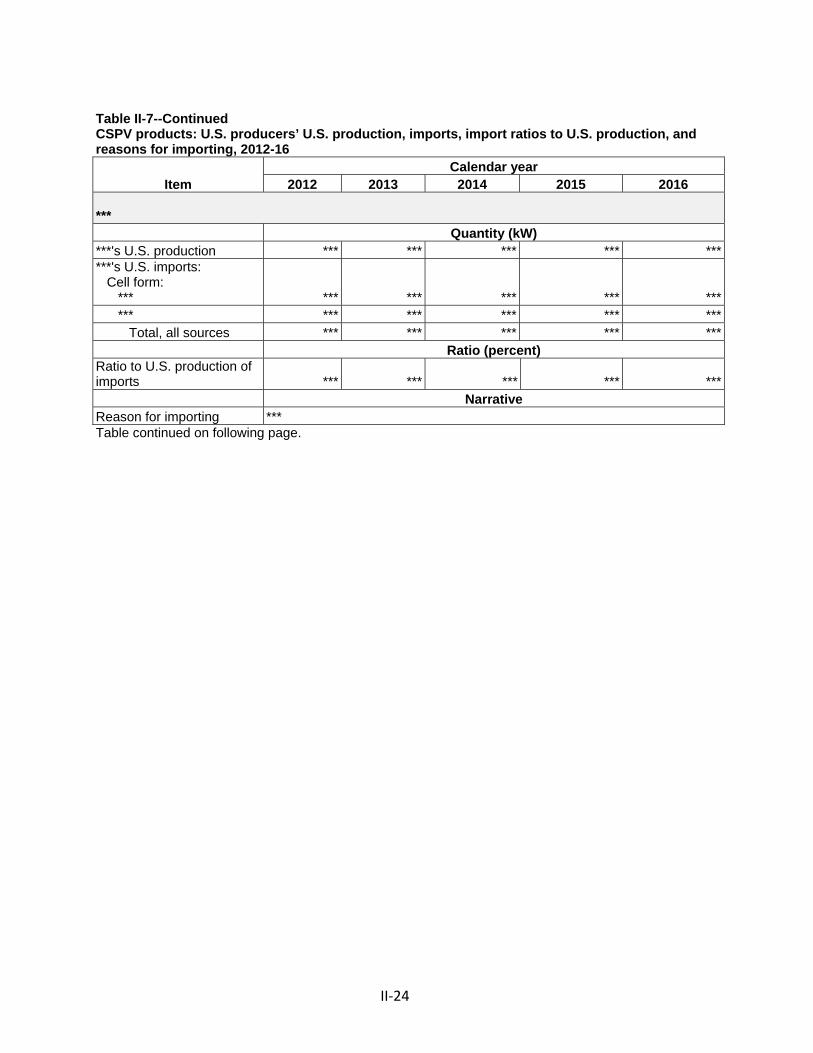
II‐24
Table II-7--Continued CSPV products: U.S. producers’ U.S. production, imports, import ratios to U.S. production, and reasons for importing, 2012-16
Item Calendar year
2012 2013 2014 2015 2016 *** Quantity (kW) ***'s U.S. production *** *** *** *** ******'s U.S. imports: Cell form: *** *** *** *** *** *** *** *** *** *** *** *** Total, all sources *** *** *** *** *** Ratio (percent) Ratio to U.S. production of imports *** *** *** *** *** Narrative Reason for importing *** Table continued on following page.

II‐25
Table II-7--Continued CSPV products: U.S. producers’ U.S. production, imports, import ratios to U.S. production, and reasons for importing, 2012-16
Item Calendar year
2012 2013 2014 2015 2016 *** Quantity (kW) ***'s U.S. production1 *** *** *** *** ******'s U.S. imports: ***: Cell form *** *** *** *** *** Module/panel form *** *** *** *** *** *** *** *** *** *** *** *** Total, U.S. imports *** *** *** *** *** Ratio (percent) Ratio of imports to U.S. production: ***: Cell form *** *** *** *** *** Module/panel form *** *** *** *** *** *** *** *** *** *** *** *** Total, U.S. imports *** *** *** *** *** Narrative Reason for importing *** Table continued on following page.

II‐26
Table II-7--Continued CSPV products: U.S. producers’ U.S. production, imports, import ratios to U.S. production, and reasons for importing, 2012-16
Item Calendar year
2012 2013 2014 2015 2016 *** Quantity (kW) ***'s U.S. production1 *** *** *** *** ******'s U.S. imports: Laminate form: *** *** *** *** *** *** Ratio (percent) Ratio to U.S. production of imports *** *** *** *** *** Narrative
Reason for importing *** *** Quantity (kW) ***'s U.S. production *** *** *** *** ******'s U.S. imports: Cell form: *** *** *** *** *** *** *** *** *** *** *** *** Subtotal, cell form *** *** *** *** *** *** ***: *** *** *** *** *** *** Total, all imports *** *** *** *** *** Ratio (percent) Ratio to U.S. production of imports *** *** *** *** *** Narrative Reason for importing *** Table continued on following page.

II‐27
Table II-7--Continued CSPV products: U.S. producers’ U.S. production, imports, import ratios to U.S. production, and reasons for importing, 2012-16
Item Calendar year
2012 2013 2014 2015 2016 *** Quantity (kW) ***'s U.S. production *** *** *** *** ******'s U.S. imports: Cell form: *** *** *** *** *** *** Module/panel form: *** *** 827 *** *** *** *** *** *** *** *** *** Subtotal, modules *** *** *** *** *** Total, U.S. imports *** *** *** *** *** Ratio (percent) Ratio to U.S. production of imports *** *** *** *** *** Narrative Reason for importing *** *** Quantity (kW) ***'s U.S. production *** *** *** *** ******'s U.S. imports: Cell form: *** *** *** *** *** *** Ratio (percent) Ratio to U.S. production of imports *** *** *** *** *** Narrative Reason for importing *** 1 Production for *** is based on their module operations plus a portion of their cell operations not used for internal consumption. Note.--Shares and ratios shown as "0.0" represent values greater than zero but less than 0.05 percent. Source: Compiled from data submitted in response to Commission questionnaires.

II‐28
U.S. IMPORTS RELATIVE TO PRODUCTION
The ratio of U.S. imports to U.S. production increased from a low of *** percent in 2012
to a high of *** percent in 2016 (table II‐1). The largest increases in U.S. imports relative to U.S.
production were reported for Malaysia, Korea, and China. U.S. imports remained greater than
U.S. production during the period of investigation.

III‐1
PART III: SERIOUS INJURY OR THREAT OF SERIOUS INJURY
OVERVIEW
The term “domestic industry” is defined in section 202(c)(6)(A)(i) of the Trade Act as
“the domestic producers as a whole of the like or directly competitive article or those
producers whose collective production of the like or directly competitive article constitutes a
major proportion of the total domestic production of such article.”1 The list of firms that
reported domestic production of certain crystalline silicon photovoltaic cells, whether or not
partially or fully assembled into other products (“CSPV products”)2 in response to the
Commission’s U.S. producer questionnaire in this proceeding is presented in Part I of this report
at table I‐2. Also presented in table I‐2 are each company’s position on the petition, production
locations, and share of reported production of CSPV products during 2012‐16.
U.S. producers’ ownership and related or affiliated firms
The Commission asked firms responding to the U.S. producer questionnaire to identify
their owners and any related or affiliated firms involved in the production or import of CSPV
products. Responses to the Commission’s request for information are presented in table III‐1.
Information on U.S. imports of CSPV products by U.S. producers and their affiliates are
discussed in Part II of the report and summarized in table II‐7.
1 19 U.S.C. § 2252(c)(6)(A)(i). 2 See the section entitled “The Imported Articles Described in the Petition” in Part I of this report for
a complete description of the merchandise subject to this investigation.

III‐2
Table III-1
CSPV products: U.S. producers' ownership, related and/or affiliated firms
U.S. producer Related firm name Affiliated/ownership Ownership: *** *** *** *** *** *** *** *** *** *** *** ***
*** *** *** *** ***
*** *** *** *** *** *** *** *** ***1
*** ***2 *** Related importers/exporters:
*** *** *** *** ***
*** *** ***
***
*** *** *** *** *** ***
*** *** ***
***3
*** *** *** *** *** ***
Related producers:
*** *** *** *** ***
***
*** *** *** *** *** ***
*** *** *** *** *** ***
*** *** *** *** ***
*** *** *** 1 ***. 2 ***. 3 ***.
Source: Compiled from data submitted in response to Commission questionnaires.

III‐3
Reported changes experienced and anticipated by the industry
In the U.S. producers’ questionnaire, firms were asked to indicate whether they had
experienced any plant openings, relocations, expansions, acquisitions, consolidations, closures,
or prolonged shutdowns because of strikes or equipment failure; curtailment of production
because of shortages of materials or other reasons, including revision of labor agreements; or
any other change in the character of their operations or organization relating to the production
of CSPV products since January 1, 2012. Fourteen firms providing responses to the U.S.
producers’ questionnaire in this proceeding indicated that they had experienced such changes
in the character of their operations; their responses are presented in table III‐2.
Table III-2 CSPV products: Changes in the character of U.S. operations since January 1, 2012
Item/firm Reported changes in operations Plant openings: *** *** *** *** *** *** *** *** *** *** *** *** Table continued on following page.

III‐4
Table III-2—Continued CSPV products: Changes in the character of U.S. operations since January 1, 2012
Item/firm Reported changes in operations Plant closings: *** *** *** *** *** *** *** *** Relocations: *** *** *** *** *** *** Expansions: *** *** *** *** *** *** *** *** *** *** Acquisitions: *** *** *** *** Consolidations: *** *** Table continued on following page.

III‐5
Table III-2—Continued CSPV products: Changes in the character of U.S. operations since January 1, 2012
Item/firm Reported changes in operations Prolonged shutdowns or curtailments: *** ***
***
*** *** *** *** *** *** *** *** ***
*** *** *** *** *** *** *** *** *** *** *** *** Revised labor agreements: *** *** Technology: *** ***1
*** *** *** *** *** *** *** *** *** *** Table continued on following page.

III‐6
Table III-2—Continued CSPV products: Changes in the character of U.S. operations since January 1, 2012
Item/firm Reported changes in operations Other: *** *** *** *** 1 ***. 2 ***.
Source: Compiled from data submitted in response to Commission questionnaires.
As previously noted in table III‐2, numerous firms providing a U.S. producers’
questionnaire response in this safeguard investigation reported events that affected total U.S.
capacity and production. Table III‐3 shows a time line of when U.S. producers of CSPV cells or
modules either entered or exited the U.S. market during the period of investigation.

III‐7
Table III‐3
CSPV products: Listing of U.S. firms with CSPV production facilities opening and/or closing, 2012‐17
Prior 2012
2012
2013
2014
2015
2016
2017 YTD
1Soltech TX Modules Open Closed Closed
Advanced Solar Photonics FL Modules Open Closed Closed Plant opening
Alternative Energies Kentucky KY Modules Open Closed Closed Plant closing
Amerisolar CA Modules Not available Open Open
Auxin Solar CA Modules Open Open Open
CBS Solar MI Modules Open Open
Colored Solar CA Modules Open Open Open
Flextronics/SunPower CA Modules Open Closed Closed
Heliene MN Modules Open Open
Helios WI Modules Open Closed Closed
Isofoton OH Modules Closed Closed
MN Modules Open Closed
WA Modules Open Open Open
Kyocera CA Modules Open Closed Closed
Lumos Solar CO Modules Open Open
Mage Solar GA Modules Open Closed Closed
TX Cells Closed Closed
TX Modules Open Open
Motech DE Modules Open Closed Closed
MX Solar NJ Modules Open Closed Closed
Navajo Universal AZ Modules Not available Closed
Nu‐Cell LA Modules Open Open Open
NuSun IN Modules Closed Closed
Prism Solar NY Modules Open Open Open
SBM Solar NC Modules Open Open Open
Schott Solar NJ Modules Open Closed Closed
Seraphim Solar MS Modules Open Open
Sharp TN Modules Open Closed Closed
MN Modules Open Open Closed
WA Modules Open Closed Closed
PA Cells Open Closed Closed
PA Modules Open Closed Closed
CA Cells Not available Not available Open
CA Modules Open Open Open
Solartec Energia TX Modules Open Open
Solartech Renewables NY Modules Open Closed Closed
SolarTech Universal FL Modules Open Open
CA Modules Open Closed Closed
WA Cells Open Open Open
WA Modules Open Open Open
Sunergy America CA Modules Announced
GA Cells Open Open See notes
GA Modules Open Closed Closed
MI Modules Open See notes
SunPower CA Cells Open
SunSpark Technology CA Modules Open Open
Suntech AZ Modules Open Closed Closed
tenKsolar MN Modules Open Open Closed
CA Cells Open Open
CA Modules Open Open
NY Cells Announced
NY Modules Announced
Transform Solar ID Cells Open Closed Closed
Twin Creeks Technologies MS Cells Open Closed Closed
Wanxiang New Energy IL Cells Open Open Open
Legend
Opening date not available
Opening/closing date
Itek Energy
Silicon Energy
Opening date not available
Tesla
Mission Solar
Solar Power Industries
Solaria
SolarWorld
Suniva
Status,
July 2017
ProductStateCompany Status,
January 1,
2012
Status,
December
31, 2016

III‐8
Notes continued on following page. Notes.—This table is based on publicly available information. Information on producers of off-grid products such as consumer electronic products or solar generators is not included. In addition, it does not include changes in production capacity at existing plants. 2017 YTD is to July 18, 2017. Three companies, CertainTeed, German Solar USA, and Upsolar indicate that their products are made in the United States, but they are not included in the table above since a U.S. production location for these products could not be identified. In addition, Perlight previously indicated that some of its modules were made in Texas, but this is not currently listed on their website as a manufacturing location. Beamreach had a pilot PV production line in California, with equipment from 2014-2015, but it is not clear whether it had any commercial production as it initially sourced modules from another company. BP Solar closed its Maryland location between the end of 2011 and early 2012, but had stopped manufacturing at this location prior to this time. Heliene initially started production at a plant owned by SimpleRay in Minnesota, with this production lasting less than one year. From mid-2016, Silicon Energy produced modules for Heliene at its Minnesota plant. Following the closure of Silicon Energy's plant in 2017, Heliene took over the lease and began manufacturing its modules in Minnesota. The exact date that the Mage Solar plant closed is not readily available, but as of the first quarter of 2015 the firm was reportedly no longer producing modules. Siliken filed for bankruptcy in 2013, but moved its manufacturing to Mexico in 2011 and is therefore not included in this table. Navajo Solar was closed as of February 2017, but information on whether it was in operation in 2016 is not readily available. For Solartec, opening is based on the announcement date. The date on which it began production is not readily available. SunPower partnered with contract manufacturer Flextronics to produce modules. SunPower purchased the equipment, while Flextronics manufactured the modules. The exact date when this manufacturing ended is not available, but it was no longer listed among SunPower's manufacturing locations in its financial report for the year ending January 1, 2017. SunPower started production of cells in California in 2017. Although SunPower testified at the Commission’s hearing and submitted briefs in this proceeding, it did not submit a response to the Commission’s U.S. producer questionnaire. Sunpreme is considering building a solar cell and module manufacturing facility in Nevada. Source: Compiled from publicly available information, and USITC Publications 4519 and 4360.

III‐9
U.S. PRODUCTION, CAPACITY, AND CAPACITY UTILIZATION
CSPV cells
Four firms that reported U.S. production of CSPV cells in response to the Commission’s
U.S. producer questionnaire are profiled below, inclusive of their module assembly operations,
as applicable.
U.S. producer profiles3
Mission Solar Energy
Mission Solar Energy (“Mission Solar”) is headquartered in San Antonio, Texas and is a
fully‐owned subsidiary of OCI Solar Power.4 Mission Solar produced n‐type monocrystalline
(including bifacial) CSPV solar cells *** and assembled modules with mono and mono‐PERC
cells in both 60‐cell and 72‐cell formats for residential, commercial, and utility markets ***.
3 SunPower Corporation (“SunPower”), headquartered in San Jose, California, did not respond to the Commission’s producer questionnaire. However, the firm reported investing approximately $25 million in a San Jose, California facility to produce its SignatureTM Black solar panels. The facility started production around May 2017 and will ultimately produce CSPV cells and panels for residential and commercial applications. By yearend 2018, SunPower expects this facility to produce 5‐7 MW of volume. SunPower is also a partner with Flextronics in the production of CSPV modules in Milpitas, California. CSPV module output at this facility during 2012‐16 totaled ***, with output *** SunPower moved module production from the Milpitas, California facility to its other manufacturing facilities, stating that the shift of production occurred because the plant was not adequately scaled. SunPower‘s posthearing brief, August 22, 2017.
4 OCI Solar Power is a subsidiary of OCI Enterprises, the North American subsidiary of OCI Company, Ltd. (Korea). Mission Solar was formerly known as Nexolon America when it was a joint venture of OCI Solar Power and Texas‐based CPS Energy. Osborne, Mark, “Mission Solar closing N‐type mono cell line with 87 job losses – reports,” PV Tech, July 18, 2017, https://www.pv‐tech.org/news/mission‐solar‐closing‐n‐type‐mono‐cell‐line‐with‐87‐job‐losses‐reports.

III‐10
The company opened its manufacturing plant in San Antonio, Texas in 2014 with cell
and module capacity of 100 MW and doubled capacity to 200 MW in 2015.5 In September 2016,
however, Mission Solar closed its n‐type mono PV cell production lines and then ***. Mission
Solar stated that it closed its cell line because “***.” Other reports noted that Mission Solar
faced technical challenges producing n‐type cells, and had difficulty ramping up production.6
Following the closure of cell production, Mission Solar has continued module assembly with PV
cells imported from Asia (***).7 Mission Solar projects its calendar year 2017 production of
modules to reach ***.8 These modules incorporate newer technology, including ***. Its current
business model “***,” and its 200 MW cell manufacturing lines are currently offered for sale.9
SolarWorld Americas Inc.
SolarWorld Americas Inc. (“SolarWorld”), headquartered in Hillsboro, Oregon, produced
*** CSPV cells and CSPV modules during
5 Osborne, Mark, “Mission Solar closing N‐type mono cell line with 87 job losses – reports,” PV Tech, July 18, 2017, https://www.pv‐tech.org/news/mission‐solar‐closing‐n‐type‐mono‐cell‐line‐with‐87‐job‐losses‐reports.
6 Osborne, Mark, “Mission Solar closing N‐type mono cell line with 87 job losses – reports,” PV Tech, July 18, 2017, https://www.pv‐tech.org/news/mission‐solar‐closing‐n‐type‐mono‐cell‐line‐with‐87‐job‐losses‐reports.
7 Osborne, Mark, “Mission Solar closing N‐type mono cell line with 87 job losses – reports,” PV Tech, July 18, 2017, https://www.pv‐tech.org/news/mission‐solar‐closing‐n‐type‐mono‐cell‐line‐with‐87‐job‐losses‐reports; Mission’s U.S. producer questionnaire response, II‐16.
8 Email to Commission staff from Mission Solar, August 29, 2017. 9 Silicon Valley Disposition, Negotiated Sale (Buy Now), State of the Art 200 MW Solar PV Cell
Manufacturing Lines, http://www.svdisposition.com/?r=site/auction‐detail&id=149 (accessed August 22, 2017).

III‐11
2012‐16.10 SolarWorld has stated that it was the first producer of mono‐PERC products and that
it considers its ***.11
SolarWorld started production in the United States via its acquisition of Camarillo,
California‐based Shell Solar, a CSPV module producer with output of 80 MW, in 2006.12 In
October 2011, module production ceased at this facility and the work was transferred to its
Hillsboro location.13 SolarWorld *** (see table III‐2).
SolarWorld’s Hillsboro, Oregon plant opened in 2008 with operations dedicated to
growing crystals and producing wafers and CSPV cells. In 2010, SolarWorld added 350 MW of
module production to become the first fully integrated monocrystalline plant in the Americas.14
In addition to the transfer of its Camarillo, California work in 2011, SolarWorld ***
10 SolarWorld AG, parent of SolarWorld Americas, Inc., is headquartered in Bonn, Germany. SolarWorld AG and its German subsidiaries are currently undertaking insolvency proceedings in Germany. SolarWorld, “SolarWorld Americas Inc. Maintainers Full Operations Amid Parent’s Insolvency,” May 13, 2017, http://www.solarworld‐usa.com/newsroom/news‐releases/news/2017/solarworld‐americas‐maintains‐full‐operations; SolarWorld U.S. producer questionnaire response, II‐6.
11 SolarWorld posthearing brief, August 22, 2017, p. 10; SolarWorld U.S. producer questionnaire response, II‐4.
12 “SolarWorld Acquires Shell's Solar Business,” February 2, 2006, Reneweable Energy World, http://www.renewableenergyworld.com/articles/2006/02/solarworld‐acquires‐shells‐solar‐business‐42840.html
13 Read, Richard, “SolarWorld, its California Plant Gone Dark, Prepares in Oregon for Industry Shakeout While Battling China,” The Oregonian, November 19, 2011, http://www.oregonlive.com/business/index.ssf/2011/11/solarworld_its_california_plan.html.
14 An additional 150 MW of module capacity was in place at its Camarillo plant, for a total of 500 MW. SolarWorld, “SolarWorld to add module assembly in Hillsboro,” October 4, 2009, http://www.solarworld‐usa.com/newsroom/news‐releases/news/2009/solarworld‐to‐add‐module‐assembly‐in‐hillsboro.

III‐12
***, and expanded cell capacity to 435 MW and module assembly to 530 MW in 2014.15 In
2016, SolarWorld added a 150 MW assembly line to produce 72‐cell format modules to supply
the utility market.16 The firm reported that production at this line *** (see table III‐2).
SolarWorld has stated that it “has maintained all production‐related plant and
equipment, and could easily and quickly return to a production rate closer to the nameplate
capacities if safeguard relief is granted.”17 SolarWorld reported nameplate production capacity
of *** for modules and *** for cells.18 However, SolarWorld projects cell production of *** and
module production of *** in 2017.19 Although SolarWorld ***, SolarWorld has noted that ***
(see table III‐2). As part of its parent SolarWorld AG’s bankruptcy proceedings, a buyer is
currently being sought for SolarWorld and other SolarWorld AG subsidiaries. Because
SolarWorld is a subsidiary of the bankrupt SolarWorld AG, it is under the jurisdiction of the
insolvency administrator.
15 SolarWorld, “SolarWorld Announces Expansions of Solar Panel and Advanced Cell Production in Oregon,” October 30, 2014, http://www.solarworld‐usa.com/newsroom/news‐releases/news/2014/solarworld‐announces‐expansions‐in‐oregon.
16 SolarWorld posthearing brief, August 22, 2017, p. 10; Roselund , Christian,“SolarWorld ramps 72‐cell module production in Oregon,” PV Magazine, June 14, 2016, https://www.pv‐magazine.com/2016/06/14/solarworld‐ramps‐72‐cell‐module‐production‐in‐oregon_100024984/.
17 SolarWorld posthearing brief, August 22, 2017, p. 83. 18 SolarWorld posthearing brief, August 22, 2017, p. 83. 19 SolarWorld posthearing brief, August 22, 2017, p. 94.
III‐13
SolarWorld is reportedly the “key outstanding asset up for grabs” in this process in part because
of its PERC cell technology.20
Suniva
Suniva, headquartered in Norcross, Georgia, produced *** CSPV cells and CSPV modules
during 2012‐16. Suniva was founded in 2007 as a producer of CSPV cells based on the work of
the Georgia Institute of Technology’s University Center of Excellence in Photovoltaics. In 2015,
Shungfeng International Clean Energy acquired approximately 63 percent of Suniva.21
Suniva started CSPV cell production in Norcross, Georgia, in November 2008 with
capacity of 32 MW. An additional 64 MW line was added in 2009. In July 2010, Suniva further
expanded capacity to 170 MW by adding a third cell line.22
In July 2011, Suniva announced its expansion of CSPV module R&D and assembly
capabilities by September 2011, with an initial capacity of 25‐30 MW at the Georgia plant.23
Suniva further expanded module assembly capacity in 2013 to produce Buy American Act
20 Osborne, Mark, “SolarWorld AG’s Insolvency Administrator Starts Sale Process for SolarWorld Americas,” August 16, 2017, https://www.pv‐tech.org/news/solarworld‐ags‐insolvency‐administrator‐starts‐sale‐process‐for‐solarworld; Roselund, Christian, “SolarWorld Americas is Up for Sale,” August 17, 2017, https://pv‐magazine‐usa.com/2017/08/17/solarworld‐america‐is‐up‐for‐sale/.
21 Suniva, “Suniva to Increase U.S. Manufacturing Capacity to Over 400MW,” August 13, 2015, http://www.suniva.com/documents/Suniva%20Expands%20Manufacturing%20final.pdf. Shungfeng also owns CSPV cell and module producer Wuxi Suntech.
22 Suniva, “Suniva Increases Manufacturing Capacity to 170 Megawatts,” July 7, 2010, http://www.suniva.com/documents/Expanded%20Capacity_070310Final2.pdf.
23 Suniva, “Suniva Expands U.S. Module Assembly and Research Facility,” July 12, 2011, http://www.suniva.com/documents/Module%20Assembly%207%208%2011.pdf.

III‐14
compliant modules.24 In 2014, Suniva expanded production by 240 MW with the opening of a
second module assembly facility in Saginaw, Michigan.25
In July 2016, Suniva expanded production for cells and modules with power ratings up
to 300W (60‐cell format) and 350W (72‐cell format) at its Norcross facility.26 Suniva completed
an additional expansion in December 2016 to bring the Norcross, Georgia plant capacity for
cells and modules up to 450 MW.27
Suniva ***, citing *** that “***.” Suniva has indicated that it has no ability to supply any
CSPV cells or modules for the remainder of 2017 as it has ceased operations under Chapter 11
bankruptcy reorganization. Suniva states that, going forward, it would have the capacity to
produce a total of *** of modules made with U.S.‐manufactured cells, with *** of modules
supplied from its own operations and an additional *** supplied through contract
manufacturing. Suniva indicates that its cell
24 Suniva, “Suniva Announces Manufacturing Capacity Expansion and New Jobs at Norcross HQ” May 9, 2013, http://www.suniva.com/documents/Suniva%20Expansion%20Release%202013%2005%2009%20Final.pdf.
25 Suniva, “Suniva Begins Construction on Second Solar Facility,” August 12, 2014, http://www.suniva.com/documents/Suniva%20Begins%20Construction%20on%20Second%20Solar%20Facility%202014%2008%2012.pdf.
26 Suniva, “Suniva Celebrates Nine Years as America’s Leading Solar Manufacturer,” July 12, 2016, http://suniva.com/documents/Suniva%20Celebrates%20Nine%20Years%202016%2007%2012%20Final.pdf.
27 “Suniva Announces Expansion Completion at U.S. Manufacturing Headquarters,” December 15, 2016, http://www.suniva.com/documents/Suniva%20Announces%20Expansion%20Completion%20at%20Headquarters%202016%2012%2015.pdf.

III‐15
manufacturing capacity would total ***. Suniva believes that its cell manufacturing could be
brought back up in a few months.28 Suniva shut down its operations in a way that would
facilitate rapid restart of output and has maintained a maintenance staff during its
bankruptcy.29 Suniva also reports contact with several potential clients and prior suppliers who
are interested in working with Suniva when it restarts its U.S. operations.30
Tesla
Tesla is a U.S. producer of electric vehicles and alternative energy solutions, such as
solar modules and battery‐powered back‐up storage units. Tesla is currently in the process of
opening a manufacturing facility in Buffalo, New York to produce ***. Tesla has a build‐to‐suit
lease arrangement with the Research Foundation for the State University of New York
(Foundation).31 As part of this arrangement, the Foundation constructed the solar cell and
panel manufacturing facility and will own the facility and any manufacturing equipment
purchased by the Foundation. Tesla will lease the manufacturing facility and equipment for an
initial 10‐year period, with an option to
28 Suniva posthearing brief, August 22, 2017, exhibit no. 9, p. 3. 29 Suniva posthearing brief, August 22, 2017, exhibit no. 9, p. 3. 30 Suniva posthearing brief, August 22, 2017, exhibit no. 9, p. 3. 31 As part of this arrangement Tesla is required to meet certain operational milestones during the 10‐
year lease period, including meeting employment level requirements and spending or incurring $5 billion in capital, operational expenses, and other costs in New York State. Failure to meet these requirements would lead to a $41.2 million “program payment” to the Foundation for each year that Tesla failed to meet the specified milestones. Tesla 10‐Q Quarterly Report, August 4, 2017, p. 24, http://ir.tesla.com/sec.cfm?view=all.
III‐16
renew.32 Tesla also has a Fremont, California facility, which opened in 2014, where PV cell and
module R&D and pilot production are performed.
In December 2016, Tesla entered into an agreement with Panasonic to manufacture
custom CSPV cells and modules at the Buffalo, New York plant while Tesla manages factory
operations and produces solar roof tiles.33 Tesla has reported that it will purchase certain
quantities of PV cells and modules from Panasonic during the 10‐year term of the agreement,
with the intent to produce approximately 1 GW of CSPV cells and modules annually beginning
in 2019.34
Initial production will reportedly focus on solar modules to be used in residential
rooftop applications by Tesla’s SolarCity business.35 Tesla also plans to manufacture its solar
roof tiles at the Buffalo plant by yearend 2017, following pilot production at its Fremont plant in
second quarter 2017.36 Tesla’s solar roof production at its Fremont, California plant ***.37 Tesla
expects to produce ***; Panasonic intends to ***
32 Tesla will pay the Foundation $2.00 annually plus utilities for the lease of the plant. Tesla 10‐Q Quarterly Report, August 4, 2017, p. 24, http://ir.tesla.com/sec.cfm?view=all.
33 Robinson, David, “Column: Panasonic will play big role at Buffalo's SolarCity factory,” Buffalo News, March 8, 2017, http://buffalonews.com/2017/03/07/robinson‐panasonics‐role‐reflects‐deep‐changes‐solarcitys‐buffalo‐factory/; Geuss, Megan, “Panasonic will spend $256 million on Tesla solar panel factory in Buffalo, NY,” Ars Technica, December 27, 2016, https://arstechnica.com/information‐technology/2016/12/panasonic‐will‐spend‐256‐million‐on‐tesla‐solar‐panel‐factory‐in‐buffalo‐ny/.
34 Tesla 10‐Q Quarterly Report, August 4, 2017, p. 4, http://ir.tesla.com/sec.cfm?view=all. 35 SolarCity, which was acquired by Tesla in 2016, had previously purchased PV cell manufacturer
Silevo in 2014. Cunningham, Bill, “Tesla, SolarCity, And The Silevo Acquisition, “ Seeking Alpha, April 10, 2017, https://seekingalpha.com/article/4061589‐tesla‐solarcity‐silevo‐acquisition.
36 Tesla 10‐Q Quarterly Report, August 4, 2017, p. 30, http://ir.tesla.com/sec.cfm?view=all. 37 Email to Commission staff from Tesla, August 24, 2017.

III‐17
***. 38 Cell production at Fremont totaled ***. Although cell production ***.39 Tesla’s
production capacity in 2016 was reported as *** each for cells and modules. Production of cells
*** and modules *** in 2016 was solely for ***.
U.S. CSPV cell production
Reported data40 show that, from 2012 to 2016, total U.S. production of CSPV cells
increased by *** percent from *** kW to *** kW, with *** largely driving the trend (table III‐4
and figure III‐1). Total U.S. capacity, which was *** percent higher in 2016 than in 2012,
increased by *** percent from *** kW in 2012 to *** kW in 2013, but fell to *** kW in 2014 as
***. Total domestic CSPV cell capacity then increased by *** percent from *** kW in 2014 to
*** kW in 2016 as Mission Solar ***, as SolarWorld ***, as Suniva ***, and as Tesla/SolarCity
***
38 Emails to Commission staff from Tesla, August 24, 2017 and August 29, 2017. 39 Emails to Commission staff from Tesla, August 24, 2017 and August 29, 2017. 40 Four U.S. firms reported capacity and production data for CSPV cells.

III‐18
***. Average capacity utilization of domestic CSPV cell producers increased from *** percent in
2012 to *** percent in 2015, before declining to *** percent in 2016.
Table III-4 CSPV cells: U.S. producers’ production, capacity, and capacity utilization, 2012-16
Item Calendar year
2012 2013 2014 2015 2016 Capacity (kW) Mission Solar1 *** *** *** *** ***SolarWorld *** *** *** *** ***Suniva *** *** *** *** ***Tesla2 *** *** *** *** ***
Total capacity for CSPV cells *** *** *** *** *** Production (kW) Mission Solar1 *** *** *** *** ***SolarWorld *** *** *** *** ***Suniva *** *** *** *** ***Tesla2 *** *** *** *** ***
Total production for CSPV cells *** *** *** *** *** Capacity utilization (percent) Mission Solar1 *** *** *** *** ***SolarWorld *** *** *** *** ***Suniva *** *** *** *** ***Tesla2 *** *** *** *** ***
Average capacity utilization for CSPV cells *** *** *** *** ***
1 Mission Solar reported that it ***. 2 Tesla reported that it ***. SolarCity reportedly opened its facility in Fremont, California in the fourth quarter of 2015. Source: Compiled from data submitted in response to Commission questionnaires; and Cunningham, Bill, “Tesla, SolarCity, And The Silevo Acquisition,” Seeking Alpha, April 10, 2017, https://seekingalpha.com/article/4061589-tesla-solarcity-silevo-acquisition.

III‐19
Figure III-1 CSPV cells: U.S. producers’ production, capacity, and capacity utilization, 2012-16 * * * * * * *

III‐20
U.S. cell producers’ 2017 quarterly production
The Commission requested the four responding U.S. producers of CSPV cells to provide
quarterly production data for their cell and module operations for the first two quarters of 2017
and projections for the final two quarters of 2017 (table III‐5).41 Aggregate quarterly data reflect
an expected decline in CSPV cell and module production throughout 2017 as Suniva closed its
facilities as part of a Chapter 11 bankruptcy filing42 and as SolarWorld reduced its production
levels commensurate with mass employment reductions in 2017 in response to “an
overwhelming surge of global imports into the United States, and with it, the collapse in
prices.”43 Mission Solar reported *** cell production during 2017 with the shutdown of its cell
operations in ***, and it projected that the production levels of CSPV modules at its facility are
expected to *** throughout 2017. It noted in its questionnaire response that its “***.”
41 SunPower did not submit a response to the U.S. producer questionnaire in this proceeding and, in its importer questionnaire response dated July 13, 2017, SunPower indicated that it “***.” However, SunPower testified at the hearing that it began cell production in the United States “within the last 6 months.” Hearing transcript, p. 409 (Werner). In its posthearing brief, the firm indicated that it began production of CSPV panels in the United States in May 2017 and will ultimately produce domestic CSPV cells and panels for residential and commercial applications. By yearend 2018, SunPower expects to produce 5‐7 MW of volume in the United States. SunPower‘s posthearing brief, August 22, 2017, appendix, p. i.
42 Hearing transcript, p. 80 (Brightbill). 43 Hearing transcript, pp. 89, 92‐93, and 236‐237 (Stein).

III‐21
Table III-5
CSPV products: Quarterly U.S. production, 2017
Item
Actual Projected Jan-Mar
2017 Apr-Jun
2017 Jul-Sep
2017 Oct-Dec
2017 Calendar year 2017
Production (kW) Cell production: Mission Solar1 *** *** *** *** *** SolarWorld *** *** *** *** *** Suniva *** *** *** *** *** Tesla *** *** *** *** ***
Total, cells *** *** *** *** ***Module production: Mission Solar *** *** *** *** *** SolarWorld *** *** *** *** *** Suniva *** *** *** *** *** Tesla2 *** *** *** *** ***
Total, modules *** *** *** *** *** Share of reported quantity (percent)
Cell production: Mission Solar1 *** *** *** *** *** SolarWorld *** *** *** *** *** Suniva *** *** *** *** *** Tesla *** *** *** *** ***
Total 100.0 100.0 100.0 100.0 100.0Module production: Mission Solar *** *** *** *** *** SolarWorld *** *** *** *** *** Suniva *** *** *** *** *** Tesla *** *** *** *** ***
Total 100.0 100.0 100.0 100.0 100.01 Mission Solar shut down its cell operations in ***. 2 Module production data presented for Tesla include ***. Source: Email from Mission Solar, August 29, 2017; SolarWorld’s posthearing brief, exhibit 1, p. 94; Suniva’s Response to Request for Additional Data, p. 2; emails from Tesla, August 22, 2017 and August 29, 2017.

III‐22
CSPV cell technology
The *** domestic CSPV cell producers are SolarWorld and Suniva, which together
accounted for *** percent of U.S. CSPV cell production by kW in 2016. The largest U.S. CSPV cell
producer, ***, which accounted for *** percent of U.S. CSPV cell production in 2016, reported
that since January 1, 2012, it has produced *** (table III‐6). It also noted that over the past five
years it has transitioned from *** and has developed the capability to produce ***. The second
largest U.S. CSPV cell producer, ***, which accounted for *** percent of U.S. CSPV cell
production in 2016, reported that since January 1, 2012, it produced ***, but indicated that it
completed *** and began producing ***. ***, which accounted for *** percent of U.S. CSPV
cell production during 2016, reported that since January 1, 2012, it produced *** and that it
conducts ongoing research and development on ***. ***, which accounted for *** percent of
U.S. production during 2016, reported that it produces ***.
Table III-6
CSPV products: U.S. producers’ reported ability to produce specific technology, 2012-16
* * * * * * *

III‐23
CSPV modules
Reported data show that, from 2012 to 2016, total U.S. assembly of CSPV modules fell
from 538,633 kW in 2012 to 440,259 kW in 2014, but increased to 669,089 kW in 2016 to a
level that was 24.2 percent higher than that reported in 2012 (table III‐7 and figure III‐2).
Domestic producers’ capacity to assemble modules in the United States also declined from
929,827 kW in 2012 to 716,900 kW in 2014, but increased to 1.2 million kW in 2016 to a level
that was 34.0 percent higher than that reported in 2012. Average capacity utilization of
domestic CSPV module assembly declined from 57.9 percent in 2012 to 48.9 percent in 2013,
increased to 63.4 percent in 2016, but declined again to 53.7 percent in 2016. These data are
based on the responses of 15 firms44 for their U.S. production, capacity, and capacity utilization
for CSPV modules. The largest U.S. assemblers of CSPV modules are ***, accounting for ***,
***, and *** percent of U.S. module assembly, respectively, during 2012‐16.
44 Twelve U.S. firms reported capacity and production data for CSPV modules in this proceeding. An additional firm, ***, provided a response to the Commission’s producer questionnaire, but did not provide any requested data. Also, certain information supplied by three additional firms (Motech, Silicon Energy, and tenKsolar) that responded to the Commission’s producer questionnaire during the previous CSPV 2 investigations, but have since ceased CSPV operations, is included in select presentations in this report.

III‐24
Table III-7 CSPV modules: U.S. producers’ production, capacity, and capacity utilization, 2012-16
Item Calendar year
2012 2013 2014 2015 2016 Capacity (kW) Itek *** *** *** *** ***Kyocera *** *** *** *** ***Mission Solar *** *** *** *** ***Motech *** *** *** *** ***SBM *** *** *** *** ***Seraphim *** *** *** *** ***Sharp *** *** *** *** ***Silicon *** *** *** *** ***Solaria *** *** *** *** ***Solartech *** *** *** *** ***SolarWorld *** *** *** *** ***Suniva *** *** *** *** ***SunStream *** *** *** *** ***TenKsolar *** *** *** *** ***Tesla *** *** *** *** ***Wanxiang *** *** *** *** ***
Total capacity for modules 929,827 913,452 716,900 871,603 1,245,807 Production (kW) Itek *** *** *** *** ***Kyocera *** *** *** *** ***Mission Solar *** *** *** *** ***Motech *** *** *** *** ***SBM *** *** *** *** ***Seraphim *** *** *** *** ***Sharp *** *** *** *** ***Silicon *** *** *** *** ***Solaria *** *** *** *** ***Solartech *** *** *** *** ***SolarWorld *** *** *** *** ***Suniva *** *** *** *** ***SunStream *** *** *** *** ***TenKsolar *** *** *** *** ***Tesla *** *** *** *** ***Wanxiang *** *** *** *** ***
Total module assembly 538,633 447,129 440,259 552,968 669,089Table continued on following page.

III‐25
Table III-7--Continued CSPV modules: U.S. producers’ production, capacity, and capacity utilization, 2012-16
Item Calendar year
2012 2013 2014 2015 2016 Capacity utilization (percent) Itek *** *** *** *** ***Kyocera *** *** *** *** ***Mission Solar *** *** *** *** ***Motech *** *** *** *** ***SBM *** *** *** *** ***Seraphim *** *** *** *** ***Sharp *** *** *** *** ***Silicon *** *** *** *** ***Solaria *** *** *** *** ***Solartech *** *** *** *** ***SolarWorld *** *** *** *** ***Suniva *** *** *** *** ***SunStream *** *** *** *** ***TenKsolar *** *** *** *** ***Tesla *** *** *** *** ***Wanxiang *** *** *** *** ***
Average capacity utilization for CSPV modules 57.9 48.9 61.4 63.4 53.7
Source: Compiled from data submitted in response to Commission questionnaires.
Figure III-2 CSPV modules: U.S. producers’ production, capacity, and capacity utilization, 2012-16
Source: Compiled from data submitted in response to Commission questionnaires.

III‐26
The Commission requested that domestic CSPV module producers provide data
concerning the source of the CSPV cells from which their modules were produced. These data
show that during the period of investigation, the domestic cell content for U.S.‐produced
modules increased from *** percent in 2012 to *** percent in 2015, but declined to ***
percent in 2016 (table III‐8).
Table III-8
CSPV products: U.S. producers' module assembly by source of CSPV cell, 2012-16
Item Calendar year
2012 2013 2014 2015 2016 Production (kW)
U.S. producers' module assembly using.-- U.S.-origin cells *** *** *** *** ***
of which petitioners *** *** *** *** ***of which other firms *** *** *** *** ***
Foreign-origin cells *** *** *** *** ***of which petitioners *** *** *** *** ***of which other firms *** *** *** *** ***
Total 538,633 447,129 440,260 552,968 669,090 Share of quantity (percent)
U.S. producers' module assembly using.-- U.S.-origin cells *** *** *** *** ***
of which petitioners *** *** *** *** ***of which other firms *** *** *** *** ***
Foreign-origin cells *** *** *** *** ***of which petitioners *** *** *** *** ***of which other firms *** *** *** *** ***
Total 100.0 100.0 100.0 100.0 100.0Note—The total for U.S. module assembly reported here matches data reported in table III-7 but for differences due to rounding.
Source: Compiled from data submitted in response to Commission questionnaires.

III‐27
U.S. PRODUCERS’ SHIPMENTS
CSPV cells
The quantity and value of U.S. producers’ total CSPV cell shipments increased overall by
*** percent and *** percent from 2012 to 2016, respectively (table III‐9). The unit value of
total U.S. shipments fluctuated downward from a high of $*** per kW reported in 2012 to a
low of $*** per kW reported in 2016, a net decline of *** percent. Most (*** percent in 2016)
of the U.S. producers’ shipments of CSPV cells are internally consumed in the United States,
with the majority of the balance (*** percent in 2016) being consumed by related firms outside
the United States. Relatively few CSPV cells produced in the United States are sold
commercially. In fact, during 2016, *** percent of U.S. producers’ total shipments were
commercially shipped in the United States and *** percent were exported to unrelated firms.

III‐28
Table III-9 CSPV cells: U.S. producers’ U.S. shipments, exports shipments, and total shipments, 2012-16
Item Calendar year
2012 2013 2014 2015 2016 Quantity (kW) Commercial U.S. shipments *** *** *** *** ***Internal consumption *** *** *** *** ***
U.S. shipments *** *** *** *** ***Exports to related firms *** *** *** *** ***Exports to unrelated firms *** *** *** *** ***
Export shipments *** *** *** *** ***Total shipments *** *** *** *** ***
Value (1,000 dollars) Commercial U.S. shipments *** *** *** *** ***Internal consumption *** *** *** *** ***
U.S. shipments *** *** *** *** ***Exports to related firms *** *** *** *** ***Exports to unrelated firms *** *** *** *** ***
Export shipments *** *** *** *** ***Total shipments *** *** *** *** ***
Unit value (dollars per kW) Commercial U.S. shipments *** *** *** *** ***Internal consumption *** *** *** *** ***
U.S. shipments *** *** *** *** ***Exports to related firms *** *** *** *** ***Exports to unrelated firms *** *** *** *** ***
Export shipments *** *** *** *** ***Total shipments *** *** *** *** ***
Share of quantity (percent) Commercial U.S. shipments *** *** *** *** ***Internal consumption *** *** *** *** ***
U.S. shipments *** *** *** *** ***Exports to related firms *** *** *** *** ***Exports to unrelated firms *** *** *** *** ***
Export shipments *** *** *** *** ***Total shipments *** *** *** *** ***
Source: Compiled from data submitted in response to Commission questionnaires.
III‐29
CSPV modules
The total shipment quantity of CSPV modules assembled in the United States declined
from 598,155 kW in 2012 to 442,960 kW in 2013, but increased each year thereafter, reaching
633,504 kW in 2016, a level that was 5.9 percent higher than that reported in 2012 (table III‐
10). The value of total module shipments declined from 620,486 kW in 2012 to 380,035 kW in
2013, but increased thereafter to 513,266 kW during 2016, a level that was 17.3 percent lower
than that reported in 2012. The average unit value of total shipments fluctuated downward
from a high of $1,037 per kW reported in 2012 to a low of $810 per kW reported in 2016,
representing a 21.9 percent decline in average unit values. Most U.S. producers’ shipments (***
percent in 2016) of CSPV modules are commercially shipped in the United States, with a
relatively minor amount that are internally consumed in other products or exported outside the
United States. Transfers to related firms in the United States, which accounted for *** percent
of aggregate total shipments in 2016, largely represented ***.

III‐30
Table III-10 CSPV modules: U.S. producers’ U.S. shipments, exports shipments, and total shipments, 2012-16
Item Calendar year
2012 2013 2014 2015 2016 Quantity (kW) Commercial U.S. shipments *** *** *** *** ***Internal consumption *** *** *** *** ***Transfers to related firms *** *** *** *** ***
U.S. shipments *** *** *** *** ***Exports to related firms *** *** *** *** ***Exports to unrelated firms *** *** *** *** ***
Export shipments *** *** *** *** ***Total shipments 598,155 442,960 472,367 528,599 633,504
Value (1,000 dollars) Commercial U.S. shipments *** *** *** *** ***Internal consumption *** *** *** *** ***Transfers to related firms *** *** *** *** ***
U.S. shipments *** *** *** *** ***Exports to related firms *** *** *** *** ***Exports to unrelated firms *** *** *** *** ***
Export shipments *** *** *** *** ***Total shipments 620,486 380,035 420,560 477,422 513,266
Unit value (dollars per kW) Commercial U.S. shipments *** *** *** *** ***Internal consumption *** *** *** *** ***Transfers to related firms *** *** *** *** ***
U.S. shipments *** *** *** *** ***Exports to related firms *** *** *** *** ***Exports to unrelated firms *** *** *** *** ***
Export shipments *** *** *** *** ***Total shipments 1,037 858 890 903 810
Share of quantity (percent) Commercial U.S. shipments *** *** *** *** ***Internal consumption *** *** *** *** ***Transfers to related firms *** *** *** *** ***
U.S. shipments *** *** *** *** ***Exports to related firms *** *** *** *** ***Exports to unrelated firms *** *** *** *** ***
Export shipments *** *** *** *** ***Total shipments 100.0 100.0 100.0 100.0 100.0
Note.—Includes imported CSPV cells assembled in the United States into modules. Share shown as "0.0" represent values greater than zero but less than 0.05 percent. Source: Compiled from data submitted in response to Commission questionnaires.

III‐31
U.S. commercial shipments, by form of CSPV product
Reported data show that *** (i.e., *** percent in 2016) commercial U.S. shipments of
CSPV products made by U.S. producers are in module or panel form, whereas *** commercial
shipments of CSPV products are in cell and laminate forms (table III‐11). There were *** U.S.
commercial shipments reported by U.S. producers of CSPV products in the forms of off‐grid
portable consumer goods or integrated building materials.

III‐32
Table III-11 CSPV products: U.S. producers’ commercial U.S. shipments, by form, 2012-16
Item Calendar year
2012 2013 2014 2015 2016 Quantity (kW) U.S. producers' commercial U.S. shipments in.-- Cell form *** *** *** *** ***
Laminate form *** *** *** *** ***Off grid portable consumer goods form *** *** *** *** ***Module / panel form *** *** *** *** ***Integrated building materials form *** *** *** *** ***
All forms *** *** *** *** *** Value (1,000 dollars) U.S. producers' commercial U.S. shipments in.-- Cell form *** *** *** *** ***
Laminate form *** *** *** *** ***Off grid portable consumer goods form *** *** *** *** ***Module / panel form *** *** *** *** ***Integrated building materials form *** *** *** *** ***
All forms *** *** *** *** *** Unit value (dollars per kW) U.S. producers' commercial U.S. shipments in.-- Cell form *** *** *** *** ***
Laminate form *** *** *** *** ***Off grid portable consumer goods form *** *** *** *** ***Module / panel form *** *** *** *** ***Integrated building materials form *** *** *** *** ***
All forms *** *** *** *** *** Share of quantity (percent) U.S. producers' commercial U.S. shipments in.-- Cell form *** *** *** *** ***
Laminate form *** *** *** *** ***Off grid portable consumer goods form *** *** *** *** ***Module / panel form *** *** *** *** ***Integrated building materials form *** *** *** *** ***
All forms *** *** *** *** ***Note.--Includes imported CSPV cells assembled in the United States into modules. Share shown as "0.0" represent values greater than zero but less than 0.05 percent. Source: Compiled from data submitted in response to Commission questionnaires.

III‐33
U.S.‐origin U.S. shipments for apparent consumption
Apparent U.S. consumption of CSPV products increased by *** percent from *** kW in
2012 to *** kW in 2016 (see Part IV, table IV‐1). Apparent U.S. consumption consists of the sum
of U.S. producers’ U.S. shipments of CSPV products and U.S. imports of CSPV products. As
shown in table III‐12, the U.S. shipments component of apparent U.S. consumption by quantity
(in kW) reflects U.S. producers’ U.S. shipments of (1) modules that contain U.S.‐produced CSPV
cells, (2) U.S.‐produced CSPV cells that are otherwise not reported by module assemblers, and
(3) re‐imports of U.S.‐origin CSPV cells. This quantity measure excludes any CSPV modules
produced in the United States from imported CSPV cells, as those are reported for the purposes
of apparent U.S. consumption as imports. However, the U.S. component for value does include
the incremental value added in the United States for the module assembly of foreign‐origin
CSPV cells. The apparent U.S. consumption data that incorporate this U.S. component are
presented separately in Part IV of this report.

III‐34
Table III-12
CSPV products: U.S.-origin U.S. shipments for apparent consumption, 2012-16
Item Calendar year
2012 2013 2014 2015 2016 Quantity (kW)
U.S. producers' U.S. shipments.-- Modules with US-origin CSPV cells *** *** *** *** ***
U.S.-origin CSPV cells not reported by module assemblers *** *** *** *** ***Re-imports of U.S.-origin CSPV cells1 *** *** *** *** ***
Total *** *** *** *** *** Value (1,000 dollars)
U.S. producers' U.S. shipments.-- Modules with US-origin CSPV cells *** *** *** *** ***
U.S.-origin CSPV cells not reported by module assemblers *** *** *** *** ***Re-imports of U.S.-origin CSPV cells1 *** *** *** *** ***Value added to foreign-origin CSPV cells *** *** *** *** ***
Total *** *** *** *** *** Unit value (dollars per kW)
U.S. producers' U.S. shipments.-- Modules with US-origin CSPV cells *** *** *** *** ***
U.S.-origin CSPV cells not reported by module assemblers *** *** *** *** ***Re-imports of U.S.-origin CSPV cells1 *** *** *** *** ***
Total2 *** *** *** *** ***1 The vast majority of these data represent ***. 2 The average unit values for the totals exclude the value added to foreign-origin CSPV cells by U.S. module assemblers. Source: Compiled from data submitted in response to Commission questionnaires.

III‐35
INVENTORIES MAINTAINED BY U.S. PRODUCERS AND U.S. IMPORTERS
U.S. producers’ inventories
CSPV cells
Three of the four firms that reported production of CSPV cells indicated in their
questionnaire responses that they maintained inventories at yearend; the ratio of these
inventories to shipment and production levels declined from 2012 to 2016, equaling ***
percent of production, *** percent of U.S. shipments, and *** percent of total shipments in
2016 (table III‐13).45
Table III-13 CSPV cells: U.S. producers’ inventories, 2012-16
Item Calendar year
2012 2013 2014 2015 2016 Quantity (kW) U.S. producers' end-of-period inventories *** *** *** *** *** Ratio (percent)
Ratio of inventories to.-- U.S. production *** *** *** *** ***
U.S. shipments *** *** *** *** ***Total shipments *** *** *** *** ***
Source: Compiled from data submitted in response to Commission questionnaires.
45 End‐of‐period inventories of CSPV cells held by U.S. producers of CSPV cells and ratios of these inventories to U.S. producers’ production, U.S. shipments, and total shipments.

III‐36
CSPV modules
All but one firm that reported assembly of CSPV modules in the United States indicated
in their questionnaire responses that they maintained inventories during at least part of the
period from 2012 to 2016; the ratios of inventories to shipment and production amounts
declined from 2012 to 2014 but increased in 2015 and 2016. The ratio of inventories to U.S.
assembly operations equaled *** percent in 2016 (table III‐14).46
Table III-14 CSPV modules: U.S. producers’ inventories, 2012-16
Item Calendar year
2012 2013 2014 2015 2016 Quantity (kW) U.S. producers' end-of-period inventories *** *** *** *** *** Ratio (percent)
Ratio of inventories to.-- U.S. production *** *** *** *** ***
U.S. shipments *** *** *** *** ***Total shipments *** *** *** *** ***
Source: Compiled from data submitted in response to Commission questionnaires.
46 End‐of‐period inventories of CSPV modules held by U.S. producers of CSPV modules and the ratios of these inventories to U.S. producers’ production, U.S. shipments, and total shipments.

III‐37
U.S. importers’ inventories
More than one‐half of the responding U.S. importers of CSPV products indicated in their
questionnaire responses that they maintained inventories at some point during 2012‐16 (table
III‐15).47 Inventories held by U.S. importers in the aggregate increased by 308.2 percent from
2012 to 2016, but declined overall as a ratio of imports and shipments.
Table III-15 CSPV products: U.S. importers’ inventories, 2012-16
Item Calendar year
2012 2013 2014 2015 2016 Quantity (kW) U.S. importers' end-of-period inventories 303,409 327,638 560,211 1,107,536 1,238,641 Ratio (percent)
Ratio of inventories to.-- U.S. imports 14.0 10.6 12.2 13.1 9.7
U.S. shipments of imports 13.3 10.2 12.2 13.9 9.6Total shipments of imports 13.0 9.7 12.1 13.8 9.6
Source: Compiled from data submitted in response to Commission questionnaires.
47 End‐of‐period inventories of CSPV products held by U.S. importers and the ratios of these inventories to U.S. imports, U.S. shipments of imports, and total shipments of imports.

III‐38
U.S. EMPLOYMENT, HOURS, AND WAGES
CSPV cells
The overall number of production and related workers (“PRWs”) employed by firms
reporting CSPV cell operations in Commission producer questionnaire responses declined from
*** PRWs in 2012 to *** PRWs in 2014, but increased thereafter to *** PRWs in 2016, which
was *** percent higher than the level reported in 2012 (table III‐16). Although the general
increases in employment during the period of investigation are consistent with the *** percent
increase in U.S. production of CSPV cells from 2012 to 2016, the increase in certain employment
indicators during 2016 is primarily explained by *** in 2016. Similar to the level of PRWs
employed by the domestic industry producing CSPV cells, the total number of hours worked
and wages paid declined from 2012 to 2014, but increased thereafter. Hourly wages, unit labor
costs, and productivity were higher during 2016 than reported in 2012 by *** percent, ***
percent, and *** percent, respectively, whereas the numbers of hours worked per employee
was lower by *** percent.
Table III-16 CSPV cells: Average number of production and related workers, hours worked, wages paid to such employees, hourly wages, productivity, and unit labor costs, 2012-16
Item Calendar year
2012 2013 2014 2015 2016 PRWs (number) *** *** *** *** ***Total hours worked (1,000 hours) *** *** *** *** ***Hours worked per PRW (hours) *** *** *** *** ***Wages paid ($1,000) *** *** *** *** ***Hourly wages (dollars per hour) *** *** *** *** ***Productivity (watts per hour) *** *** *** *** ***Unit labor costs (dollars per kW) *** *** *** *** ***Source: Compiled from data submitted in response to Commission questionnaires.

III‐39
CSPV modules
The employment‐related indicators for U.S. producers of modules fluctuated during the
period of investigation. The overall number of PRWs employed by domestic CSPV module
producers as reported in Commission questionnaire responses declined from 1,293 in 2012 to
956 in 2014, but increased thereafter to 1,253 in 2016, a level that was 3.1 percent lower than
that reported in 2012 (table III‐17). The number of hours worked and wages paid followed the
same general trend, declining from 3,041 to 1,781 and $*** to $***, respectively, during 2012
to 2014, and increasing to 2,364 and $*** in 2016, respectively. Hourly wages fluctuated
upward throughout the period examined, while unit labor costs fluctuated downward.
Productivity continually increased from *** watts per hour in 2012 to *** watts per hour in
2016.
Table III-17 CSPV modules: Average number of production and related workers, hours worked, wages paid to such employees, hourly wages, productivity, and unit labor costs, 2012-16
Item Calendar year
2012 2013 2014 2015 2016 PRWs (number) 1,293 1,080 956 1,038 1,253Total hours worked (1,000 hours) 3,041 2,335 1,781 2,095 2,364Hours worked per PRW (hours) 2,352 2,162 1,863 2,018 1,887Wages paid ($1,000) *** *** *** *** ***Hourly wages (dollars per hour) *** *** *** *** ***Productivity (watts per hour) *** *** *** *** ***Unit labor costs (dollars per kW) *** *** *** *** ***Source: Compiled from data submitted in response to Commission questionnaires. Also included in this table are the data for three firms that provided questionnaire responses in CSPV 2. For more information, see “The U.S. Market” in Part I of this report.
III‐40
FINANCIAL CONDITION OF THE U.S. INDUSTRY
Background
CSPV products financial results, as presented in this section of the report, are divided
into two primary categories: CSPV cell operations and CSPV module operations. The financial
results on U.S.‐produced cell operations, which include only commercial sales and transfers,
reflect ***.48 The financial results on U.S.‐produced module operations reflect ***.49 50
48 *** did not have commercial sales or transfers of cells during the period examined: *** used all of its internally‐produced cells in the production of modules and *** cell production reflects R&D activity (see also footnote 49). The majority of cells produced by *** are internally consumed in the production of modules and are therefore reflected as part of module cost of goods sold (COGS); e.g., ***. July 10, 2017 e‐mail with attachments from *** in response to USITC staff follow‐up questions.
49 ***. USITC auditor notes. ***. July 13, 2017 e‐mail from counsel on behalf of *** to USITC auditor. ***. USITC auditor notes.
The financial results of *** are included in this report based on information reported to the Commission in the most recently completed CSPV investigations. Certain Crystalline Silicon Photovoltaic Cells and Modules from China and Taiwan, Inv. Nos. 701‐TA‐511 and 731‐TA‐1246‐1247 (Final), USITC Pub. 4519, February 2015. The period covered in those investigations was 2011 through first half 2014.
50 The majority of U.S. producers reported their financial results for calendar year periods and on the basis of U.S. generally accepted accounting principles. The exceptions were ***, which both reported financial results for fiscal years ending March 31, and SolarWorld, which reported its financial results according to International Financial Reporting Standards (IFRS).

III‐41
As described earlier in this report, several U.S. producers effectively began their cell and
module operations during the period examined, while several others exited and/or substantially
modified their operations. During the period Suniva *** and SolarWorld ***, as discussed in
table III‐2.
Operations on CSPV products
Table III‐18 and table III‐19, respectively, present income‐and‐loss data for cell
operations (commercial sales and transfers) and corresponding changes in average cell per
kilowatt values. Table III‐20 presents a separate variance analysis of cell financial results.51
Income‐and‐loss data for module operations are presented in table III‐19. Table III‐22 presents
corresponding changes in module average per kilowatt values. Table III‐23 presents a separate
variance analysis of module financial results. Appendix E presents company‐specific financial
results for cells and modules in table E‐2 and table E‐3, respectively.
51 The Commission’s variance analysis is calculated in three parts: sales variance, COGS variance, and SG&A expenses variance. Each part consists of a price variance (in the case of the sales variance) or a cost or expense variance (in the case of the COGS and SG&A expenses variance), and a volume variance. The sales or cost/expense variance is calculated as the change in unit price or per‐unit cost/expense times the new volume, while the volume variance is calculated as the change in volume times the old unit price or per‐unit cost/expense. As summarized at the bottom of table III‐20 and III‐23, the price variance is from sales, the cost/expense variance is the sum of those items from the COGS and SG&A variances, respectively, and the volume variance is the sum of the volume components of the net sales, COGS, and SG&A expenses variances. In general, the utility of the Commission’s variance analysis is enhanced when product mix remains the same throughout the period.

III‐42
Net sales
Total commercial sales and transfer volume of cells fluctuated during the period with
the highest level achieved in 2013 (see table III‐18). Following declines in 2014 and 2015, sales
volume of cells increased in 2016 to its second highest level of the period. While both ***
reported higher cell sales volume in 2016, the higher absolute level is attributable primarily to
***.52
Module sales volume, as reported in table III‐21, reflects a somewhat different pattern
compared to cells. Total module sales volume, which primarily reflects a mix of commercial
sales and transfers, declined to its lowest level in 2013 and then subsequently increased in each
year and reached its highest level in 2016.53 While the absolute volume of module sales
increased during 2014‐16, the net amount includes the reduction and/or exit of module
operations by several U.S. producers.54 As shown in table E‐3, various U.S. producers
52 ***. 53 While internal consumption was reported by several U.S. producers, it was determined that the
activity represented costs supporting module operations. Accordingly, U.S. producer module internal consumption is generally excluded from the financial results presented in this report. USITC auditor notes. The small amount of module internal consumption presented in table III‐21 was reported by ***, which exited the market in 2014.
***. July 7, 2017 e‐mail with attachment from *** to USITC auditor. 54 ***. July 7, 2017 e‐mail with attachment from counsel on behalf of *** to USITC auditor. ***. July 6, 2017 e‐mail with attachment from *** to USITC auditor.

III‐43
contributed to the pattern of higher module sales volume; e.g., most notably *** in 2014, ***
in 2015, and *** in 2016.
The average sales value of cells declined in 2013, increased in 2014, and then declined
during 2015‐16 (see table III‐18). With regard to the increase in cell average sales value in
2014, *** contributed to this pattern (see table E‐2).
On an overall basis and as compared to cells, average module sales value followed a
somewhat different pattern: declining in 2013, increasing in 2014 and 2015, and then declining
in 2016. For U.S. module operations as a whole, the pattern of marginally higher average
module sales values in 2014 and 2015 is primarily attributable to higher company‐specific
average sales values reported by *** in 2014 and *** in 2015; i.e., most U.S. producers
reported lower average module sales values in 2013 and 2014 (see table E‐3). In 2015, the
directional pattern of module average sales value was mixed. In 2016, most U.S. producers
reported lower average module sales values.55
55 In 2016, *** reported the only increase in average module sales value. The company’s large increase appears to reflect *** (see footnote 54). Table E‐3 shows that U.S. module producers reported a range of average sales values. ***. July 8, 2017 e‐mail with attachments from *** to USITC auditor.

III‐44
Table III-18 CSPV products: U.S. producers’ financial results on cells (commercial sales and transfers), 2012-16
* * * * * *
Table continued on next page.

III‐45
Table III-18--Continued CSPV products: U.S. producers’ financial results on cells (commercial sales and transfers), 2012-16
* * * * * *

III‐46
Table III-19 CSPV products: Changes in average cell per kilowatt values, between fiscal years, 2012-16
* * * * * *
Table III-20 CSPV products: Variance analysis of U.S. producers’ financial results on cells (commercial sales and transfers), 2012-16
* * * * * *

III‐47
Table III-21 CSPV products: U.S. producers’ financial results on modules, 2012-16
Item Fiscal year
2012 2013 2014 2015 2016 Quantity (kilowatts) Commercial sales *** *** *** *** ***Internal consumption *** *** *** *** ***Transfers to related firms *** *** *** *** ***
Total net sales 581,762 464,771 472,355 527,683 623,846 Value (1,000 dollars) Commercial sales *** *** *** *** ***Internal consumption *** *** *** *** ***Transfers to related firms *** *** *** *** ***
Total net sales 607,615 410,608 420,661 476,920 484,359
Cost of goods sold.-- Raw materials 499,847 318,171 334,276 379,190 414,603
Direct labor 41,444 34,098 16,441 27,196 33,991 Other factory costs 317,456 193,579 71,857 26,538 39,983
Total COGS 858,747 545,848 422,574 432,924 488,577 Gross profit or (loss) (251,132) (135,240) (1,913) 43,996 (4,218)SG&A expense 125,946 68,803 56,642 54,526 210,773 Operating income or (loss) (377,078) (204,043) (58,555) (10,530) (214,991)Interest expense 14,773 10,539 10,738 12,767 9,774 All other expenses 175,984 13,308 2,336 1,825 2,247 All other income 16,665 10,755 17,126 4,051 2,139 Net income or (loss) (551,170) (217,135) (54,503) (21,071) (224,873)Depreciation/amortization 172,017 13,823 18,652 23,555 21,260 Cash flow (379,153) (203,312) (35,851) 2,484 (203,613) Ratio to net sales (percent)
Cost of goods sold.-- Raw materials 82.3 77.5 79.5 79.5 85.6
Direct labor 6.8 8.3 3.9 5.7 7.0 Other factory costs 52.2 47.1 17.1 5.6 8.3
Average COGS 141.3 132.9 100.5 90.8 100.9 Gross profit or (loss) (41.3) (32.9) (0.5) 9.2 (0.9)SG&A expense 20.7 16.8 13.5 11.4 43.5 Operating income or (loss) (62.1) (49.7) (13.9) (2.2) (44.4)Net income or (loss) (90.7) (52.9) (13.0) (4.4) (46.4)Table continued on next page.

III‐48
Table III-21--Continued CSPV products: U.S. producers’ financial results on modules, 2012-16
Item Fiscal year
2012 2013 2014 2015 2016 Ratio to total COGS (percent)
Cost of goods sold.-- Raw materials 58.2 58.3 79.1 87.6 84.9
Direct labor 4.8 6.2 3.9 6.3 7.0 Other factory costs 37.0 35.5 17.0 6.1 8.2
Average COGS 100.0 100.0 100.0 100.0 100.0 Unit value (dollars per kilowatt)
Commercial sales *** *** *** *** ***Internal consumption *** *** *** *** ***Transfers to related firms *** *** *** *** ***
Total net sales 1,044 883 891 904 776
Cost of goods sold.-- Raw materials 859 685 708 719 665
Direct labor 71 73 35 52 54 Other factory costs 546 417 152 50 64
Average COGS 1,476 1,174 895 820 783 Gross profit or (loss) (432) (291) (4) 83 (7)SG&A expense 216 148 120 103 338 Operating income or (loss) (648) (439) (124) (20) (345)Net income or (loss) (947) (467) (115) (40) (360) Number of firms reporting Operating losses 8 9 10 4 7 Net losses 8 10 9 4 6 Data 11 12 11 7 8
Source: Compiled from data submitted in response to Commission questionnaires.
Table III-22 CSPV products: Changes in average module per kilowatt values, between fiscal years, 2012-16
Item Between fiscal years
2012-16 2012-13 2013-14 2014-15 2015-16 Total net sales (268) (161) 7 13 (127)
Cost of goods sold.-- Raw materials (195) (175) 23 11 (54)
Direct labor (17) 2 (39) 17 3 Other factory costs (482) (129) (264) (102) 14
Average COGS (693) (302) (280) (74) (37)Gross profit 425 141 287 87 (90)SG&A expense 121 (68) (28) (17) 235 Operating income or (loss) 304 209 315 104 (325)Net income or (loss) 587 480 352 75 (321)
Source: Compiled from data submitted in response to Commission questionnaires.

III‐49
Table III-23 CSPV products: Variance analysis of U.S. producers’ financial results on modules, 2012-16
Item Between fiscal years
2012-16 2012-13 2013-14 2014-15 2015-16
Net sales: Price variance (167,210) (74,817) 3,353 6,986 (79,473)
Volume variance 43,954 (122,190) 6,700 49,273 86,912 Net sales variance (123,256) (197,007) 10,053 56,259 7,439
COGS: Cost variance 432,291 140,207 132,181 39,147 23,241
Volume variance (62,121) 172,692 (8,907) (49,497) (78,894)COGS variance 370,170 312,899 123,274 (10,350) (55,653)
Gross profit variance 246,914 115,892 133,327 45,909 (48,214)
SG&A expenses: Cost/expense variance (75,716) 31,816 13,284 8,751 (146,310)
Volume variance (9,111) 25,327 (1,123) (6,635) (9,937)Total SG&A expense variance (84,827) 57,143 12,161 2,116 (156,247)
Operating income variance 162,087 173,035 145,488 48,025 (204,461)
Summarized as: Price variance (167,210) (74,817) 3,353 6,986 (79,473)
Net cost/expense variance 356,575 172,023 145,465 47,898 (123,069)Net volume variance (27,277) 75,830 (3,330) (6,859) (1,919)
Source: Compiled from data submitted in response to Commission questionnaires.
Cost of goods sold and gross profit
For both cells and modules, total raw material cost is the most substantial component of
total COGS. For cells total raw material cost reflects a combination of polysilicon, wafers, and
all other raw material costs.56 As shown in table III‐18, ***
56 The share of total COGS accounted for by cell all other raw material costs declined in 2014, in conjunction with higher average wafer costs, and then increased in 2015‐16, in conjunction with lower average wafer cost. ***. July 10, 2017 e‐mail with attachments from *** in response to USITC staff follow‐up questions. ***. July 11, 2017 e‐mail from counsel on behalf of *** to USITC auditor.

III‐50
***.57 Total cell raw material costs reported for commercial sales and transfer of cells
increased from *** percent of total COGS in 2012 to *** percent in 2016. To the extent that
average raw material costs declined during the period, the increasing share of COGS accounted
for by raw material costs is generally attributable to declines in corresponding cell conversion
costs (direct labor and other factory costs).58
Total raw material costs for modules reflect internally‐produced cells, cells purchased
from related and unrelated firms, and all other raw material costs.59 Company‐specific module
cost structures varied with the following producers reporting consumption of internally‐
produced cells: ***.60 Notwithstanding internal cell
57 ***. *** U.S. producer questionnaire, response to III‐9d. ***. August 28, 2017 e‐mail with from counsel on behalf of *** to USITC auditor. ***. July 10, 2017 e‐mail with attachment from counsel on behalf of *** to USITC auditor.
58 ***. July 10, 2017 e‐mail with attachments from *** in response to USITC staff follow‐up questions.
59 ***. July 10, 2017 e‐mail with attachments from *** in response to USITC staff follow‐up questions. ***. July 11, 2017 e‐mail from counsel on behalf of *** to USITC auditor.
60 ***. July 7, 2017 e‐mail with attachment from *** to USITC auditor.
III‐51
production, these companies also purchased cells during the period.61 The remaining
companies produce modules using purchased finished cells from related and/or unrelated
suppliers. Similar to the pattern reported for commercial sales and transfers of cells, the
overall share of total module COGS accounted for by module raw material costs increased from
58.2 percent in 2012 to 84.9 percent in 2016.62 Module conversion costs declined on an
average basis and as a share of total module COGS.
With respect to cell and module COGS, *** U.S. producer to include non‐recurring items
identified as ***. In addition to changes in underlying operations, impairments recognized by
61 The cost of internally‐produced cells as a share of total module raw material costs was marginally lower in 2016 (*** percent) compared to 2012 (*** percent) while the share accounted for by purchased cells was marginally higher in 2016 (*** percent) compared to 2012 (*** percent). (Note: These percentages reflect revised information submitted by ***. July 21, 2017 e‐mail with attachment from *** to USITC auditor.) USITC auditor notes. ***. July 10, 2017 e‐mail with attachments from *** in response to USITC staff follow‐up questions.
62 With regard to module COGS, costs associated with internally produced cells and purchased cells were classified as part of total raw material cost and increased from *** percent of module COGS in 2012 to *** percent in 2016. USITC auditor notes.

III‐52
*** at the beginning of the period also impacted COGS, specifically conversion costs, by
reducing subsequent levels of depreciation included in cell and module other factory costs.63
As noted below, *** impairments were recognized in other expenses, as opposed to COGS.
Gross profit was generated on cell operations in 2014 and 2015 and on module
operations in 2015. For both cells and modules the positive spread between average sales
values and COGS was at its highest level in 2015 and subsequently declined to negative spread
in 2016. During the period, U.S. module producers reported a wide range of negative and
positive gross profit ratios (see table E‐3).
SG&A expenses and operating income or loss
With the exception of 2016, SG&A expense ratios (total SG&A expenses divided by total
revenue) calculated for cell operations were higher compared to module operations. The
higher level of SG&A expenses for cell operations reflects, in part, non‐recurring items reported
by ***. *** also reported higher absolute SG&A expenses compared to *** throughout the
period (see table E‐2).64
63 In part, the pattern of the U.S. industry’s declining average conversion costs reflects the exit of several U.S. producers from the market. With regard to U.S. producers with module operations throughout the period, *** reported the most notable decline in average module conversion costs. ***. July 10, 2017 e‐mail with attachments from *** in response to USITC staff follow‐up questions.
64 ***. *** U.S. producer questionnaire, III‐10. ***. July 10, 2017 e‐mail with attachment from counsel on behalf of *** to USITC auditor.

III‐53
Total SG&A expenses assigned to module operations, as well as corresponding SG&A
expense ratios, declined in 2013 through 2015 and then increased notably in 2016 (see table III‐
21). The 2016 increase in total module SG&A expenses primarily reflects impairments reported
by ***.65 66 On a company‐specific basis, module SG&A ratios cover a relatively wide range (see
table E‐3). What appear to be unusually high SG&A expense ratios reflect, in part, operations
which were in an entry, transition, or exit phase.67
With regard to cell operations and in conjunction with gross losses in 2012, 2013, and
2016 and relatively low gross profit ratios in 2014 and 2015, the U.S. industry reported cell
operating losses of varying magnitude throughout the period. Company‐specific operating
income on cell operations was *** (see table E‐2).
65 ***. July 7, 2017 e‐mail with attachment from *** to USITC auditor. 66 In its 2016 annual financial results, Suniva’s parent company, Shunfeng, recognized an impairment
of its investment in Suniva. Shunfeng 2016 Annual Report, p. 55. ***. July 10, 2017 e‐mail with attachment from counsel on behalf of *** to USITC auditor.
67 ***. July 7, 2017 e‐mail with attachments from *** to USITC auditor.

III‐54
The pattern of overall module gross losses in 2012, 2013, 2014, and 2016 and relatively
low gross profit, when generated, in 2015 yielded module operating losses of varying
magnitudes throughout the period. The majority of U.S. module producers reported operating
losses throughout all or most of the period for which they had operations (see table E‐3). ***
U.S. module producer in terms of reported sales volume, reported operating income on its
module operations in 2015 only.68 *** reported operating losses of varying amounts
throughout the period.69 ***, an exception to the general pattern of persistent operating
losses, reported operating income throughout the period.70
68 ***. July 10, 2017 e‐mail with attachments from *** in response to USITC staff follow‐up questions.
69 ***. July 10, 2017 e‐mail with attachment from counsel on behalf of *** to USITC auditor. 70 ***.
III‐55
Interest expense, other expenses, and net income or loss
Interest expense was reported for cell and module operations throughout the period.
For cell operations, interest expense declined irregularly during 2012‐15 and then increased
notably in 2016. For module operations, interest expense also fluctuated and ended the period
somewhat lower.71 In 2012, *** reported asset impairments related to its cell and module
operations which account for the majority of total other expenses reported in that year for cell
and module operations.72 Other expenses did not have a notable impact on net results after
2012. Other income, which reached its highest level in 2014, primarily reflects amounts
reported by ***.73
The U.S. industry’s net losses were consistently greater than corresponding operating
losses throughout the period due to the inclusion of interest expense and other expenses. The
71 ***. 72 ***. USITC auditor notes. ***. July 7, 2017 e‐mail with attachment from counsel on behalf of ***
to USITC auditor. 73 ***. USITC auditor notes.
III‐56
more pronounced difference between net losses and operating losses in 2012 reflects the
impairments noted above.
Capital expenditures, research and development expenses, and investment in productive facilities
Table III‐24 presents total capital expenditures, research and development (R&D)
expenses, and total investment in productive facilities related to U.S. cell and module
operations.74
Capital expenditures
The level of overall capital expenditures assigned to cell operations fluctuated and
increased to its highest level in 2015 (see table III‐24), which primarily reflects amounts
reported by *** (see table E‐4).75 *** accounted for the largest share of the period’s total
capital expenditures assigned to cell operations (*** percent), followed by *** (*** percent),
*** (***) percent, and *** (*** percent).76
74 For the reasons described in footnote 49, *** are not included in the cell and module financial results presented in table III‐18 and table III‐21, respectively. However, financial information reported by *** related to cell and module capital expenditures, R&D expenses, and total assets are included in table III‐24 and table E‐4.
75 ***. *** U.S. producer questionnaire, response to III‐13 (note 1). ***. July 24, 2017 e‐mail from counsel on behalf of *** to USITC auditor.
76 ***. *** U.S. producer questionnaire, response to III‐13 (note 1).

III‐57
Table III-24 CSPV products: U.S. producers’ capital expenditures, research and development (R&D) expenses, and investment in productive assets related to cells and modules, 2012-16
* * * * * *
Capital expenditures assigned to module operations fluctuated and were at their highest
level in 2016. ***, which began production in 2014, accounted for the largest share of the
period’s total module capital expenditures (*** percent), followed by *** (*** percent), ***
(*** percent), and *** (*** percent).77 78 The remaining module producers reporting capital
expenditures accounted for shares ranging from *** percent (***) to *** percent (***).79
77 ***. *** U.S. producer questionnaire, response to III‐13 (note 3). 78 ***. July 7, 2017 e‐mail with attachment from counsel on behalf of *** to USITC auditor. 79 *** did not report capital expenditures.

III‐58
R&D expenses
The level of R&D expenses assigned to cell operations declined throughout the period.
*** accounted for the largest share (*** percent), followed by *** (*** percent) and *** (***
percent).80 *** did not report cell‐related R&D expenses.
R&D expenses assigned to module operations declined from 2013 through 2015 and
then increased in 2016, largely due to ***.81 *** accounted for the largest share (*** percent),
followed by ***, which exited the market in 2014, (*** percent), *** (*** percent), and ***
(*** percent). The remaining U.S. producers reporting R&D expenses accounted for shares
ranging from *** percent (***) to *** percent (***).82
80 ***. *** U.S. producer questionnaire, response to III‐13 (note 2). ***. July 10, 2017 e‐mail with attachment from counsel on behalf of *** to USITC auditor. 81 ***. *** U.S. producer questionnaire, response to III‐13 (note 4). 82 *** did not report R&D expenses.

III‐59
Investment in productive facilities
Total assets assigned to cell operations increased throughout most of the period with
the large increase in 2015 due to ***.83 As noted previously, the decline in *** assets in 2016
reflects asset impairments in that year.
Total assets assigned to module operations declined in 2013 and then increased during
the rest of the period. While most U.S. module producers reported lower total asset values in
2016, the U.S. industry’s total module assets increased due to *** (see table E‐4).
Capital and investment
The Commission requested the U.S. producers of cells and modules to describe any
actual or potential negative effects on their return on investment or their growth, investment,
ability to raise capital, existing development and production efforts (including efforts to
develop a derivative or more advanced version of the product), or the scale of capital
investments as a result of imports of cells (whether or not partially or fully assembled into other
products). Table III‐25 tabulates the responses of U.S. producers regarding actual negative
effects on investment, growth and development, as well as anticipated negative effects of
imports of CSPV products.84 U.S. producers’ narrative responses regarding actual and
83 With respect to a company’s overall operations, staff notes that a total asset value (i.e., the bottom line value on the asset side of a company’s balance sheet) reflects an aggregation of a number of assets which, in some instances, are not product specific. With respect to U.S. producers that have multiple operations, allocation was presumably necessary to report a total asset amount specific to cell and/or module operations.
84 *** are not included in the U.S. industry’s financial results on cells or modules (see footnote 49). However and to the extent reported, their responses regarding actual and anticipated negative effects of imports are included in table III‐25 and table E‐1. *** are included in the module financial results based on information reported in the most recently completed Solar investigation (see footnote 49). These companies, which are no longer in operation, are not reflected in table III‐25 or table E‐1.

III‐60
anticipated negative effects on investment, growth and development are presented in table E‐1
in Appendix E.
Table III-25 CSPV products: Actual and anticipated negative effects of imports on investment and growth and development
Item No Yes Negative effects on investment 3 10
Cancellation, postponement, or rejection of expansion projects
5 Denial or rejection of investment proposal 2 Reduction in the size of capital investments 4 Return on specific investments negatively impacted 4 Ability to generate capital for modernization efforts 4 Ability to maintain existing expenditures 4 Other 3 Negative effects on investments differ by category 10 2
Negative effects on growth and development 3 9 Rejection of bank loans
4 Lowering of credit rating 3 Problem related to the issue of stocks or bonds 2 Ability to service debt 3 Harmed bankability 4 Other 6 Effects of imports on growth differ by category 10 2
Anticipated negative effects of imports 3 8 Anticipated effects differ by category 8 3
Source: Compiled from data submitted in response to Commission questionnaires.

IV‐1
PART IV: U.S. MARKET AND FOREIGN INDUSTRIES
This part of the report provides information from questionnaires and public sources on
the U.S. market and foreign industries for CSPV products.
APPARENT U.S. CONSUMPTION AND MARKET SHARES
Country‐of‐origin based on cell manufacture location
Apparent U.S. consumption of certain crystalline silicon photovoltaic cells, whether or
not partially or fully assembled into other products (“CSPV products”),1 by quantity, increased
by *** percent from *** kW in 2012 to *** kW in 2016 (table IV‐1). By value, apparent U.S.
consumption of CSPV products increased by *** percent from $*** in 2012 to $*** in 2016.
The U.S. producers’ component of apparent U.S. consumption increased overall by *** percent
from *** kW in 2012 to *** kW in 2016. The U.S. import component of apparent U.S.
consumption increased by 492.6 percent from 2.2 million kW in 2012 to 12.8 million kW in
2016.
1 See the section entitled “The Imported Articles Described in this Investigation” in Part I of this report for a complete description of the merchandise subject to this investigation.

IV‐2
Table IV-1 CSPV products: U.S. shipments of domestic product, U.S. imports, and apparent U.S. consumption (country-of-origin based on cell manufacture location), 2012-16
Item Calendar year
2012 2013 2014 2015 2016 Quantity (kW) U.S. producers' U.S. shipments *** *** *** *** ***
U.S. imports from.-- Canada *** *** *** *** ***
China 326,846 82,264 1,263,270 3,311,513 2,720,193Germany *** *** *** *** ***Indonesia *** *** *** *** ***Japan *** *** *** *** ***Korea *** *** *** *** ***Malaysia *** *** *** *** ***Mexico *** *** *** *** ***Philippines *** *** *** *** ***Singapore *** *** *** *** ***Taiwan 1,065,160 2,113,220 2,090,974 852,758 1,118,967Thailand *** *** *** *** ***Vietnam --- --- --- 161,195 472,682All other sources *** *** *** *** ***
All import sources 2,162,388 3,101,412 4,582,898 8,430,393 12,813,568Apparent U.S. consumption *** *** *** *** *** Value (1,000 dollars) U.S. producers' U.S. shipments *** *** *** *** ***
U.S. imports from.-- Canada *** *** *** *** ***
China 291,878 69,976 747,148 1,680,733 1,258,864Germany *** *** *** *** ***Indonesia *** *** *** *** ***Japan *** *** *** *** ***Korea *** *** *** *** ***Malaysia *** *** *** *** ***Mexico *** *** *** *** ***Philippines *** *** *** *** ***Singapore *** *** *** *** ***Taiwan 743,337 1,349,271 1,274,305 467,820 606,449Thailand *** *** *** *** ***Vietnam --- --- --- 96,336 240,625All other sources *** *** *** *** ***
All import sources 1,904,664 2,214,457 3,014,861 4,967,865 7,060,489Apparent U.S. consumption *** *** *** *** ***Source: Compiled from data submitted in response to Commission questionnaires.

IV‐3
The U.S. producers accounted for a relatively small and declining share of the U.S.
market for CSPV products during the period of investigation (table IV‐2 and figure IV‐1). During
2012, the U.S. producers accounted for *** percent of total apparent U.S. consumption by
quantity and *** percent by value. By 2016, however, the share of apparent U.S. consumption
held by domestic producers fell to *** percent by quantity and *** percent by value. Even as
U.S. demand for CSPV products increased from 2012 to 2016, foreign suppliers, primarily
Malaysia, China, and Korea, captured a larger share of the U.S. market. The market share held
by Malaysian imports, on the basis of quantity, increased by *** percentage points from ***
percent in 2012 to *** percent in 2016; whereas that held by Chinese imports (for which there
are currently two sets of antidumping and countervailing duty orders in place, as indicated in
Part I of the report) increased by *** percentage points from *** percent in 2012 to ***
percent in 2016, and that held by Korean imports increased by *** percentage points from ***
percent in 2012 to *** percent in 2016. On the other hand, the market share held by Taiwan
(for which there is currently an antidumping duty order in place) declined by *** percentage
points from *** percent of the U.S. market in 2012 to *** percent in 2016.
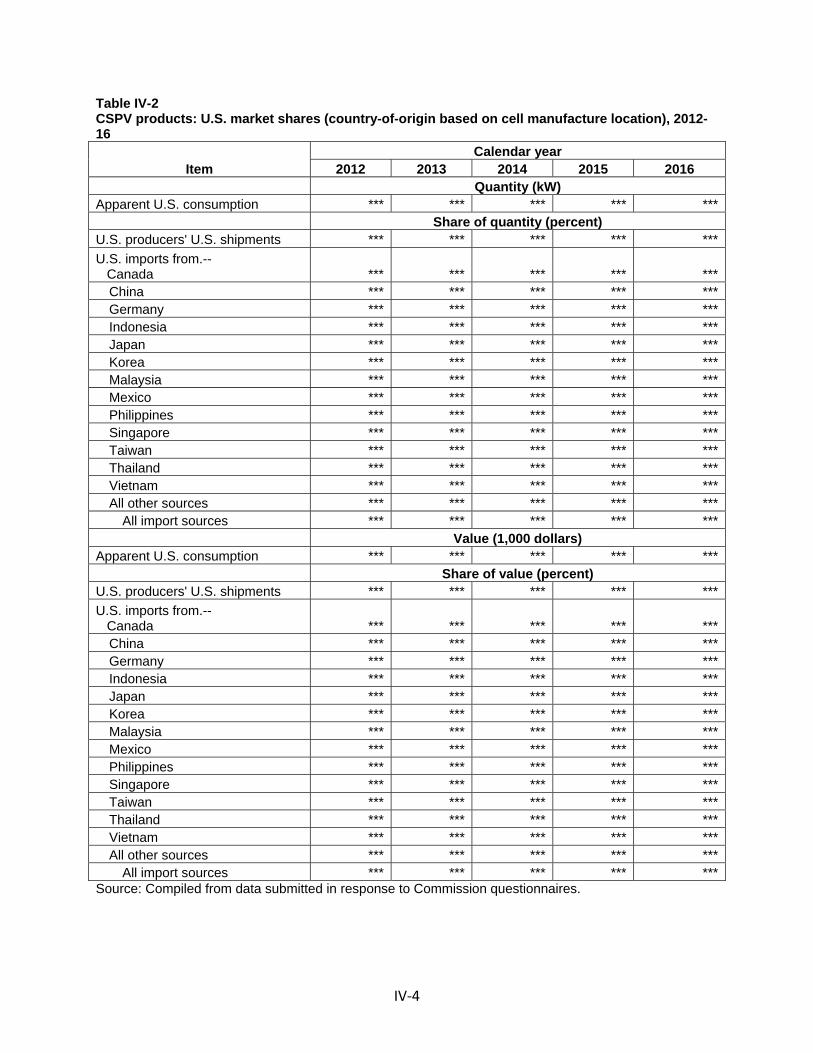
IV‐4
Table IV-2 CSPV products: U.S. market shares (country-of-origin based on cell manufacture location), 2012-16
Item Calendar year
2012 2013 2014 2015 2016 Quantity (kW) Apparent U.S. consumption *** *** *** *** *** Share of quantity (percent) U.S. producers' U.S. shipments *** *** *** *** ***
U.S. imports from.-- Canada *** *** *** *** ***
China *** *** *** *** ***Germany *** *** *** *** ***Indonesia *** *** *** *** ***Japan *** *** *** *** ***Korea *** *** *** *** ***Malaysia *** *** *** *** ***Mexico *** *** *** *** ***Philippines *** *** *** *** ***Singapore *** *** *** *** ***Taiwan *** *** *** *** ***Thailand *** *** *** *** ***Vietnam *** *** *** *** ***All other sources *** *** *** *** ***
All import sources *** *** *** *** *** Value (1,000 dollars)
Apparent U.S. consumption *** *** *** *** *** Share of value (percent) U.S. producers' U.S. shipments *** *** *** *** ***
U.S. imports from.-- Canada *** *** *** *** ***
China *** *** *** *** ***Germany *** *** *** *** ***Indonesia *** *** *** *** ***Japan *** *** *** *** ***Korea *** *** *** *** ***Malaysia *** *** *** *** ***Mexico *** *** *** *** ***Philippines *** *** *** *** ***Singapore *** *** *** *** ***Taiwan *** *** *** *** ***Thailand *** *** *** *** ***Vietnam *** *** *** *** ***All other sources *** *** *** *** ***
All import sources *** *** *** *** ***Source: Compiled from data submitted in response to Commission questionnaires.

IV‐5
Figure IV-1 CSPV products: U.S. market shares, 2012-16
Source: Compiled from data submitted in response to Commission questionnaires.
2012 2013 2014 2015 2016
Calendar year
Qu
anti
ty(k
W)
U.S. producers U.S. imports

IV‐6
Alternative NAFTA country presentation
The alternative calculations for apparent U.S. consumption of CSPV products in this
section consider the country‐of‐origin for Canada and Mexico to be the location of the module
manufacture and the country‐of‐origin for all other sources to be the location of the cell
manufacture (table IV‐3). Therefore, the U.S. component and total import source component
(as well as total apparent consumption) remain largely unchanged from the earlier
presentations in tables IV‐1 and IV‐2.2 Based on this alternative calculation, U.S. imports from
Canada increased from *** kW ($***) in 2012 to *** kW ($***) in 2015, before declining to
*** kW ($***) in 2016. Reported U.S. imports of CSPV modules assembled in Canada included
cells believed to be manufactured in the following countries: ***. U.S. imports from Mexico
increased from *** kW ($***) in 2012 to *** kW ($***) in 2016. Reported U.S. imports of CSPV
modules assembled in Mexico included cells believed to be manufactured in the following
countries: ***. The market share held by Canadian imports, on the basis of quantity, increased
from *** percent in 2012 to *** percent in 2015, before declining to *** percent in 2016 (table
IV‐4). The share of the U.S. market held by U.S. imports from Mexico, on the basis of quantity,
increased from *** percent in 2012 to *** percent in 2013, before declining to *** percent in
2016.
2 The adjustments made to reclassify the country‐of‐origin for modules assembled in Canada or Mexico resulted in small immaterial differences in the total import values (never exceeding a margin of 0.2 percent difference). Data for Canada do not include U.S.‐origin cells assembled into modules or laminates in Canada (those data are counted as part of U.S. producers’ U.S. shipments).

IV‐7
Table IV-3 CSPV products: U.S. shipments of domestic product, U.S. imports, and apparent U.S. consumption (country-of-origin for NAFTA countries based on module manufacture location and all other based on cell manufacture location), 2012-16
Item Calendar year
2012 2013 2014 2015 2016 Quantity (kW) U.S. producers' U.S. shipments *** *** *** *** ***
U.S. imports from.-- Canada *** *** *** *** ***
China *** *** *** *** ***Germany *** *** *** *** ***Indonesia *** *** *** *** ***Japan *** *** *** *** ***Korea *** *** *** *** ***Malaysia *** *** *** *** ***Mexico *** *** *** *** ***Philippines *** *** *** *** ***Singapore *** *** *** *** ***Taiwan *** *** *** *** ***Thailand *** *** *** *** ***Vietnam *** *** *** *** ***All other sources *** *** *** *** ***
All import sources *** *** *** *** ***Apparent U.S. consumption *** *** *** *** *** Value (1,000 dollars) U.S. producers' U.S. shipments *** *** *** *** ***
U.S. imports from.-- Canada *** *** *** *** ***
China *** *** *** *** ***Germany *** *** *** *** ***Indonesia *** *** *** *** ***Japan *** *** *** *** ***Korea *** *** *** *** ***Malaysia *** *** *** *** ***Mexico *** *** *** *** ***Philippines *** *** *** *** ***Singapore *** *** *** *** ***Taiwan *** *** *** *** ***Thailand *** *** *** *** ***Vietnam *** *** *** *** ***All other sources *** *** *** *** ***
All import sources *** *** *** *** ***Apparent U.S. consumption *** *** *** *** ***Note.—The adjustments made to reclassify the country-of-origin for modules assembled in Canada or Mexico resulted in small immaterial differences in the total import values (not exceeding a 0.2 percent difference in any calendar year). Data for Canada do not include U.S.-origin cells assembled into modules or laminates in Canada (those data are counted as part of U.S. producers’ U.S. shipments). Source: Compiled from data submitted in response to Commission questionnaires.

IV‐8
Table IV-4 CSPV products: U.S. market shares (country-of-origin for NAFTA countries based on module manufacture location and all other sources based on cell manufacture location), 2012-16
Item Calendar year
2012 2013 2014 2015 2016 Quantity (kW) Apparent U.S. consumption *** *** *** *** *** Share of quantity (percent) U.S. producers' U.S. shipments *** *** *** *** ***
U.S. imports from.-- Canada *** *** *** *** ***
China *** *** *** *** ***Germany *** *** *** *** ***Indonesia *** *** *** *** ***Japan *** *** *** *** ***Korea *** *** *** *** ***Malaysia *** *** *** *** ***Mexico *** *** *** *** ***Philippines *** *** *** *** ***Singapore *** *** *** *** ***Taiwan *** *** *** *** ***Thailand *** *** *** *** ***Vietnam *** *** *** *** ***All other sources *** *** *** *** ***
All import sources *** *** *** *** *** Value (1,000 dollars)
Apparent U.S. consumption *** *** *** *** *** Share of value (percent) U.S. producers' U.S. shipments *** *** *** *** ***
U.S. imports from.-- Canada *** *** *** *** ***
China *** *** *** *** ***Germany *** *** *** *** ***Indonesia *** *** *** *** ***Japan *** *** *** *** ***Korea *** *** *** *** ***Malaysia *** *** *** *** ***Mexico *** *** *** *** ***Philippines *** *** *** *** ***Singapore *** *** *** *** ***Taiwan *** *** *** *** ***Thailand *** *** *** *** ***Vietnam *** *** *** *** ***All other sources *** *** *** *** ***
All import sources *** *** *** *** ***Source: Compiled from data submitted in response to Commission questionnaires.

IV‐9
FOREIGN INDUSTRIES
Global installations and production
Global installations
Global PV system installations (including thin film) increased from 29 GW in 2012 to
about 75 GW in 2016 (figure IV‐2).3 In 2016, installations were highest in the second quarter,
primarily due to the deadline to complete projects in China to receive the higher feed‐in tariff
(FIT) rate (discussed below).4 The leading global markets have changed over time. Germany was
the largest market in 2012 (accounting for 26 percent of installations), followed by Italy (13
percent), China (12 percent), and the United States (11 percent).5 The largest markets in 2016
were China (34.5 GW, 46 percent of installations), the United States (14.7 GW, 20 percent),
Japan (8.6 GW, 11 percent), and India (4 GW, 5 percent).6
3 International Energy Agency (IEA) Photovoltaic Power Systems Programme (PVPS), 2016 Snapshot of Global Photovoltaic Markets, Report IEA PVPS T1‐31:2017, 2017, 4, http://www.iea‐pvps.org/fileadmin/dam/public/report/statistics/IEA‐PVPS_‐_A_Snapshot_of_Global_PV_‐_1992‐2016__1_.pdf; IEA PVPS, Trends 2013 in Photovoltaic Power Applications, Report IEA‐PVPS T1‐23:2013, 2013, p. 11, http://www.iea‐pvps.org/fileadmin/dam/public/report/statistics/FINAL_TRENDS_v1.02.pdf.
4 Global installations totaled 18.4 GW in the first quarter of 2016, 24.1 GW in the second quarter, 15.9 GW in the third quarter, and 19.5 GW in the fourth quarter. These installation estimates are based on GTM data, and the annual total is slightly higher than the estimate from the IEA. GTM Research, Global Solar Demand Monitor, Q1 2017 Market Trends Update, March 2017, p. 4, http://www.ourenergypolicy.org/wp‐content/uploads/2017/06/Global_Solar_Demand_Monitor_Q1_2017_Executive_Summary.pdf.
5 IEA PVPS, Trends 2013 in Photovoltaic Power Applications, Report IEA‐PVPS T1‐23:2013, 2013, p. 12, http://www.iea‐pvps.org/fileadmin/dam/public/report/statistics/FINAL_TRENDS_v1.02.pdf.
6 IEA, PVPS, 2016 Snapshot of Global Photovoltaic Markets, Report IEA PVPS T1‐31:2017, 2017, 4, 10, http://www.iea‐pvps.org/fileadmin/dam/public/report/statistics/IEA‐PVPS_‐_A_Snapshot_of_Global_PV_‐_1992‐2016__1_.pdf.
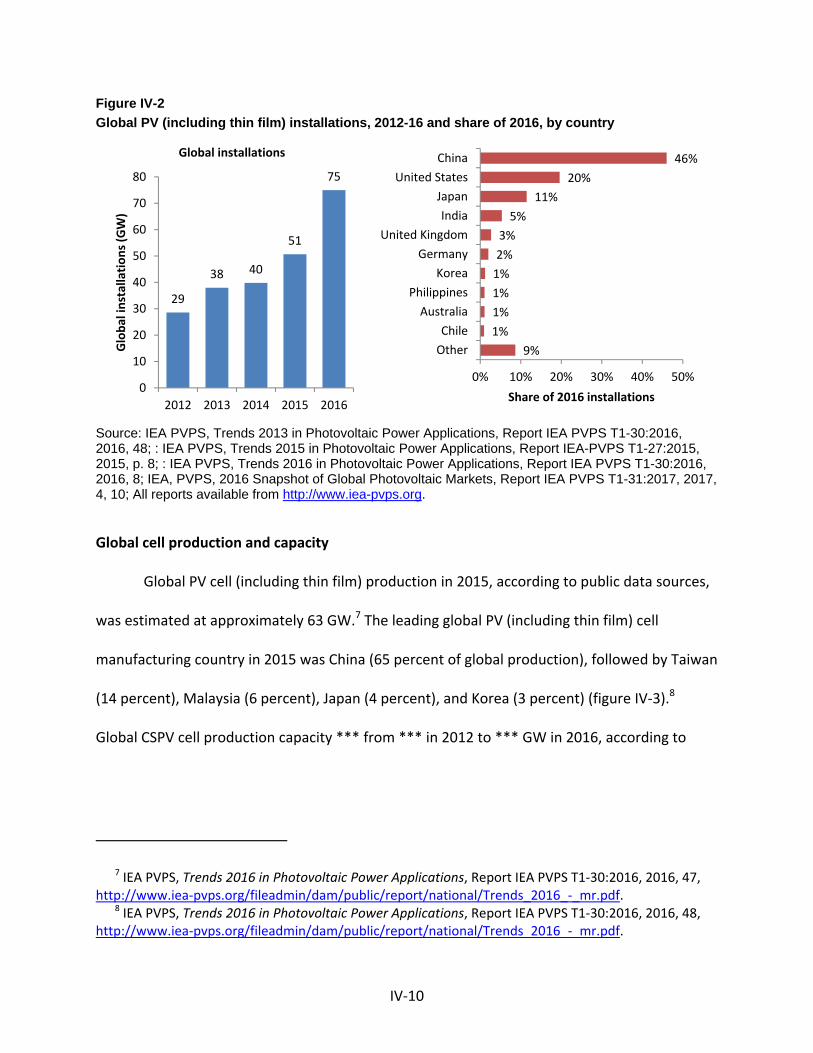
IV‐10
Figure IV-2
Global PV (including thin film) installations, 2012-16 and share of 2016, by country
Source: IEA PVPS, Trends 2013 in Photovoltaic Power Applications, Report IEA PVPS T1-30:2016, 2016, 48; : IEA PVPS, Trends 2015 in Photovoltaic Power Applications, Report IEA-PVPS T1-27:2015, 2015, p. 8; : IEA PVPS, Trends 2016 in Photovoltaic Power Applications, Report IEA PVPS T1-30:2016, 2016, 8; IEA, PVPS, 2016 Snapshot of Global Photovoltaic Markets, Report IEA PVPS T1-31:2017, 2017, 4, 10; All reports available from http://www.iea-pvps.org. Global cell production and capacity
Global PV cell (including thin film) production in 2015, according to public data sources,
was estimated at approximately 63 GW.7 The leading global PV (including thin film) cell
manufacturing country in 2015 was China (65 percent of global production), followed by Taiwan
(14 percent), Malaysia (6 percent), Japan (4 percent), and Korea (3 percent) (figure IV‐3).8
Global CSPV cell production capacity *** from *** in 2012 to *** GW in 2016, according to
7 IEA PVPS, Trends 2016 in Photovoltaic Power Applications, Report IEA PVPS T1‐30:2016, 2016, 47, http://www.iea‐pvps.org/fileadmin/dam/public/report/national/Trends_2016_‐_mr.pdf.
8 IEA PVPS, Trends 2016 in Photovoltaic Power Applications, Report IEA PVPS T1‐30:2016, 2016, 48, http://www.iea‐pvps.org/fileadmin/dam/public/report/national/Trends_2016_‐_mr.pdf.
29
38 40
51
75
0
10
20
30
40
50
60
70
80
2012 2013 2014 2015 2016
Global installations (GW)
Global installations
9%
1%
1%
1%
1%
2%
3%
5%
11%
20%
46%
0% 10% 20% 30% 40% 50%
Other
Chile
Australia
Philippines
Korea
Germany
United Kingdom
India
Japan
United States
China
Share of 2016 installations
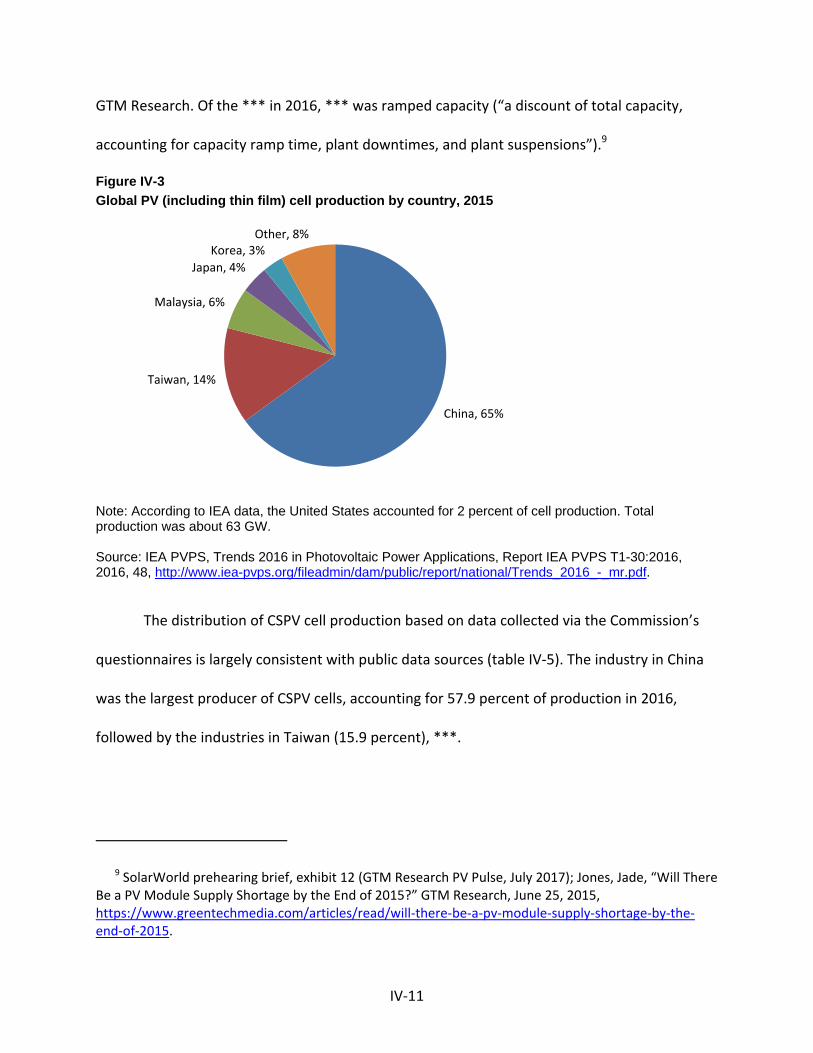
IV‐11
GTM Research. Of the *** in 2016, *** was ramped capacity (“a discount of total capacity,
accounting for capacity ramp time, plant downtimes, and plant suspensions”).9
Figure IV-3
Global PV (including thin film) cell production by country, 2015
Note: According to IEA data, the United States accounted for 2 percent of cell production. Total production was about 63 GW. Source: IEA PVPS, Trends 2016 in Photovoltaic Power Applications, Report IEA PVPS T1-30:2016, 2016, 48, http://www.iea-pvps.org/fileadmin/dam/public/report/national/Trends_2016_-_mr.pdf.
The distribution of CSPV cell production based on data collected via the Commission’s
questionnaires is largely consistent with public data sources (table IV‐5). The industry in China
was the largest producer of CSPV cells, accounting for 57.9 percent of production in 2016,
followed by the industries in Taiwan (15.9 percent), ***.
9 SolarWorld prehearing brief, exhibit 12 (GTM Research PV Pulse, July 2017); Jones, Jade, “Will There Be a PV Module Supply Shortage by the End of 2015?” GTM Research, June 25, 2015, https://www.greentechmedia.com/articles/read/will‐there‐be‐a‐pv‐module‐supply‐shortage‐by‐the‐end‐of‐2015.
China, 65%
Taiwan, 14%
Malaysia, 6%
Japan, 4%
Korea, 3%Other, 8%

IV‐12
Table IV-5
CSPV products: Cell production by country, 2012-16
Item Calendar year
2012 2013 2014 2015 2016 Quantity (kW)
Production of cells in.-- China 11,124,972 14,027,686 18,537,642 22,720,444 27,779,992
Germany *** *** *** *** ***India *** *** *** *** ***Indonesia *** *** *** *** ***Japan *** *** *** *** ***Korea *** *** *** *** ***Malaysia *** *** *** *** ***Netherlands *** *** *** *** ***Philippines *** *** *** *** ***Singapore *** *** *** *** ***Taiwan 3,806,669 5,165,941 6,313,934 7,544,196 7,638,180Thailand *** *** *** *** ***Vietnam *** *** *** *** ***
Total cell production 18,401,207 23,968,755 31,231,437 37,959,187 47,958,366 Share of quantity (percent)
Production of cells in.-- China 60.5 58.5 59.4 59.9 57.9
Germany *** *** *** *** ***India *** *** *** *** ***Indonesia *** *** *** *** ***Japan *** *** *** *** ***Korea *** *** *** *** ***Malaysia *** *** *** *** ***Netherlands *** *** *** *** ***Philippines *** *** *** *** ***Singapore *** *** *** *** ***Taiwan 20.7 21.6 20.2 19.9 15.9Thailand *** *** *** *** ***Vietnam *** *** *** *** ***
Total cell production 100.0 100.0 100.0 100.0 100.0Note.--Shares and ratios shown as "0.0" represent values greater than zero but less than 0.05 percent. Source: Compiled from data submitted in response to Commission questionnaires.

IV‐13
The leading CSPV cell manufacturing companies in 2016, in order from largest to
smallest, were Hanwha Q‐Cells (headquartered in Korea), JA Solar (China), Trina Solar (China),
Jinko Solar (China), Motech (Taiwan), Tongwei Solar (China), Yingli (China), Canadian Solar
(China), and Shunfeng (China). These firms all have production in China, though most also have
production in other locations as well.10 The top ten PV cell (including thin film) suppliers in 2016
accounted for less than 40 percent of global production.11
Global module production and capacity
Global PV module (including thin film) production in 2015 was estimated at
approximately 63 GW.12 The leading global PV (including thin film) module manufacturing
country in 2015 was China (69 percent of production), followed by Malaysia (6 percent), Korea
and Japan (5 percent each), and Germany (4 percent) (figure IV‐4).13 Global CSPV module
production capacity *** from *** in 2012 to *** in 2016. Of the *** in PV capacity at the end
of 2016 (including thin film products), *** was ramped production capacity.14
10 Colville, Finlay, “Top‐10 Solar Cell Producers in 2016,”PV tech, January 30, 2017, https://www.pv‐tech.org/editors‐blog/top‐10‐solar‐cell‐producers‐in‐2016.
11 Colville, Finlay, “Top‐10 Solar Cell Producers in 2016,”PV tech, January 30, 2017, https://www.pv‐tech.org/editors‐blog/top‐10‐solar‐cell‐producers‐in‐2016.
12 IEA PVPS, Trends 2016 in Photovoltaic Power Applications, Report IEA PVPS T1‐30:2016, 2016, 48, http://www.iea‐pvps.org/fileadmin/dam/public/report/national/Trends_2016_‐_mr.pdf.
13 IEA PVPS, Trends 2016 in Photovoltaic Power Applications, Report IEA PVPS T1‐30:2016, 2016, 48, http://www.iea‐pvps.org/fileadmin/dam/public/report/national/Trends_2016_‐_mr.pdf.
14 SolarWorld prehearing brief, exhibit 12 (GTM Research PV Pulse, July 2017).

IV‐14
Figure IV-4
Global PV (including thin film) module production by country, 2015
Note: According to IEA data, the United States accounted for 2 percent of module production. 2015 production was approximately 63 GW. Source: IEA PVPS, Trends 2016 in Photovoltaic Power Applications, Report IEA PVPS T1-30:2016, 2016, 48, http://www.iea-pvps.org/fileadmin/dam/public/report/national/Trends_2016_-_mr.pdf.
Data provided in response to the Commission’s questionnaire also show that the
industry in China was the largest global producer of CSPV modules, accounting for 69.0 percent
of global module assembly in 2016 (table IV‐6). The industry in *** was the second largest
producer of modules, accounting for *** of module assembly, followed by the industries in ***.
China, 69%
Malaysia, 6%
Japan, 5%
Korea, 5%
Germany, 4%
Other, 11%

IV‐15
Table IV-6
CSPV products: Module assembly by country, 2012-16
Item Calendar year
2012 2013 2014 2015 2016 Quantity (kW)
Assembly of modules in.-- Brazil *** *** *** *** ***
Canada 296,019 423,493 648,114 725,151 517,719China 12,462,092 16,326,264 22,071,981 28,792,042 35,470,622Germany *** *** *** *** ***India *** *** *** *** ***Indonesia *** *** *** *** ***Japan *** *** *** *** ***Korea *** *** *** *** ***Malaysia *** *** *** *** ***Mexico *** *** *** *** ***Philippines *** *** *** *** ***Singapore *** *** *** *** ***Taiwan 210,415 370,057 663,285 831,700 597,078Thailand *** *** *** *** ***Vietnam *** *** *** *** ***
Total module assembly 15,789,716 20,848,784 28,619,986 38,441,620 51,430,556 Share of quantity (percent)
Assembly of modules in.-- Brazil *** *** *** *** ***
Canada 1.9 2.0 2.3 1.9 1.0China 78.9 78.3 77.1 74.9 69.0Germany *** *** *** *** ***India *** *** *** *** ***Indonesia *** *** *** *** ***Japan *** *** *** *** ***Korea *** *** *** *** ***Malaysia *** *** *** *** ***Mexico *** *** *** *** ***Philippines *** *** *** *** ***Singapore *** *** *** *** ***Taiwan 1.3 1.8 2.3 2.2 1.2Thailand *** *** *** *** ***Vietnam *** *** *** *** ***
Total module assembly 100.0 100.0 100.0 100.0 100.0Note.--Shares and ratios shown as "0.0" represent values greater than zero but less than 0.05 percent. Source: Compiled from data submitted in response to Commission questionnaires.
IV‐16
The leading CSPV module suppliers in 2016, in order from largest to smallest, were Jinko
Solar (headquartered in China), Trina Solar (China), Canadian Solar (China), JA Solar (China),
Hanwha Q‐Cells (Korea), GCL (China), Longi Solar (China), Yingli (China), and Shunfeng (China).
The leading suppliers to markets outside of China in 2016 were Trina, Hanwha, Canadian Solar,
Jinko, JA Solar, SunPower (United States), SolarWorld (Germany), REC Solar (Singapore), and
Shunfeng.15
The industries in North America
Canada
Overview
The Commission issued foreign producer questionnaires to 12 firms believed to produce
CSPV products in Canada. Four CSPV module producers in Canada responded to the
Commission’s questionnaire with useable information, accounting for approximately 89 percent
of 2016 module capacity in Canada.16 The four responding Canadian producers reported that
they are currently the only known producers of CSPV products in Canada.
15 Colville, Finlay, “100GW of PV Modules to Ship During 2018, but is Quality Matching Quantity? (Part 2),” PV Tech, August 17, 2017, https://www.pv‐tech.org/editors‐blog/100gw‐of‐pv‐modules‐to‐ship‐during‐2018‐but‐is‐quality‐matching‐quanti.
16 A fifth firm in Canada (***) provided a questionnaire response ***. There was no reported Canadian production of CSPV cells during the period of investigation. Bloomberg New Energy Finance database, https://about.bnef.com/, accessed April 27, 2017; Poissant, Y. and P. Bateman, “National Survey Report of PV Power Applications in Canada,” IEA PVPS, p, 20, http://www.iea‐pvps.org/?id=93.

IV‐17
Table IV‐7 lists the Canadian producers of CSPV modules that responded to the
Commission’s questionnaire and certain summary data for the period January 2012 through
December 2016 reported in those responses.
Table IV-7 CSPV cells: Summary data on responding firms in Canada, January 2012 through December 2016
Firm Production
(kW)
Share of reported
production (percent)
Exports to the United
States (kW)
Share of reported exports to the United States
(percent)
Total shipments
(kW)
Share of firm's total shipments exported to the United
States (percent)
CSPV modules: Canadian Solar *** *** *** *** *** ***Celestica *** *** *** *** *** ***Heliene *** *** *** *** *** ***Silfab *** *** *** *** *** ***
Total 2,610,496 100.0 *** 100.0 2,584,951 ***Note.--Foreign producer data on module assembly does not necessarily equate to the country-of-origin classification used for U.S. import statistics. ***.
Source: Compiled from data submitted in response to Commission questionnaires.
Changes in operations
All four responding producers in Canada reported operational and organizational
changes since January 1, 2012. Details concerning the changes reported are presented in table
IV‐8.

IV‐18
Table IV-8 CSPV products: Reported changes in operations by producers in Canada, since January 1, 2012 Item/firm Reported changed in operations
Plant closings: *** *** Expansions: *** *** *** *** Prolonged shutdowns or curtailments: *** *** Technology: *** *** Other: *** *** Source: Compiled from data submitted in response to Commission questionnaires.
Anticipated changes in operations
Canadian producers were asked whether they anticipated changes in the character of
their operations relating to CSPV products in the future. Two producers in Canada (***)
reported that they do not anticipate any changes in the character of their CSPV operations,
whereas two firms reported the following details presented in table IV‐9 concerning the
anticipated changes.

IV‐19
Table IV-9 CSPV products: Canadian producers’ anticipated changes in operations
Firm Details concerning anticipated changes *** *** *** *** Source: Compiled from data submitted in response to Commission questionnaires.
Operations on CSPV cells
There was no reported production of CSPV cells in Canada.
Operations on CSPV modules
Canadian capacity, production, and total shipments for CSPV module operations
generally increased from 2012 to 2016 (table IV‐10). Capacity and production increased by 69.1
and 74.9 percent, respectively, from 2012 to 2016, and the capacity utilization for firms
producing CSPV modules in Canada ranged from 53.5 to 82.9 percent during 2012‐16. Firm
projections indicate that capacity, production, and capacity utilization in Canada are expected
to decline from 2016 to 2018. Inventories of CSPV modules declined during 2012‐16 and a
further decline is projected during 2017‐18. Home market shipments, which accounted for ***
percent of total shipments by the Canadian producers in 2016, increased during 2012‐14, but
declined in 2015 and 2016 to a level that was *** percent below that reported in 2012. Firms’
projections indicate that home market shipments are expected to decline further in 2017 and
2018. Conversely, exports of CSPV modules to the United States, which accounted for
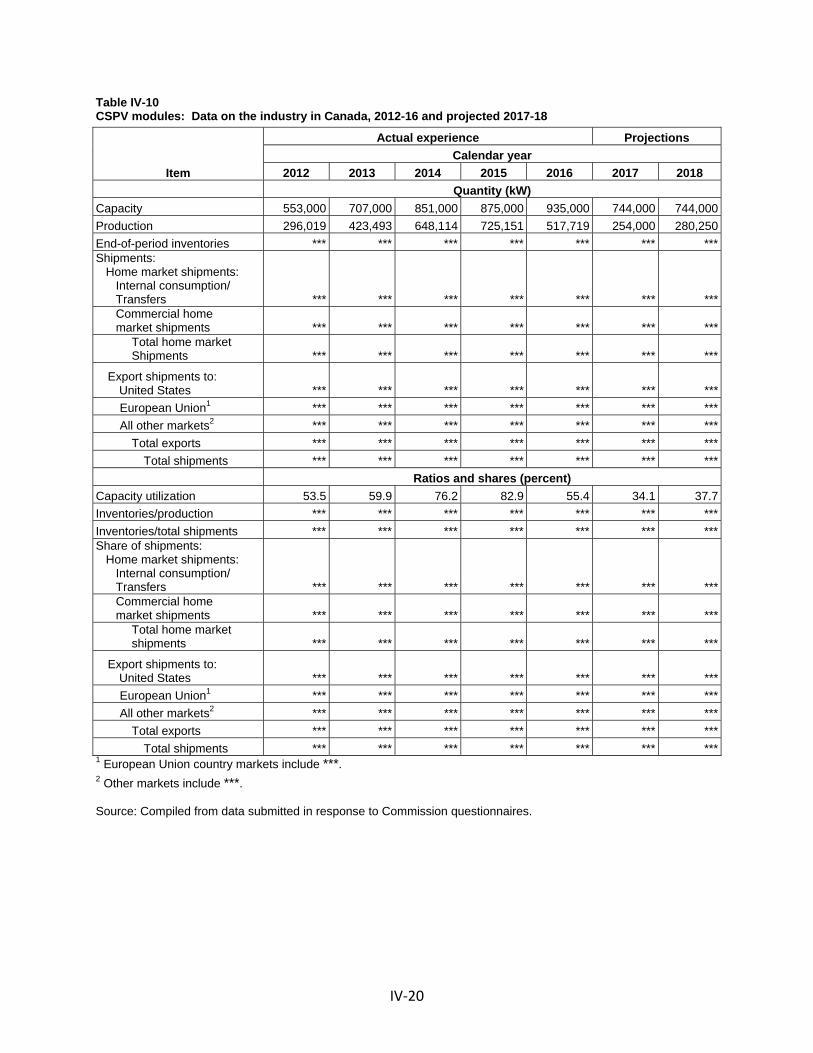
IV‐20
Table IV-10 CSPV modules: Data on the industry in Canada, 2012-16 and projected 2017-18
Item
Actual experience Projections
Calendar year
2012 2013 2014 2015 2016 2017 2018
Quantity (kW)
Capacity 553,000 707,000 851,000 875,000 935,000 744,000 744,000
Production 296,019 423,493 648,114 725,151 517,719 254,000 280,250
End-of-period inventories *** *** *** *** *** *** ***Shipments: Home market shipments: Internal consumption/ Transfers *** *** *** *** *** *** *** Commercial home market shipments *** *** *** *** *** *** ***
Total home market Shipments *** *** *** *** *** *** ***
Export shipments to: United States *** *** *** *** *** *** ***
European Union1 *** *** *** *** *** *** ***
All other markets2 *** *** *** *** *** *** ***
Total exports *** *** *** *** *** *** ***
Total shipments *** *** *** *** *** *** ***
Ratios and shares (percent)
Capacity utilization 53.5 59.9 76.2 82.9 55.4 34.1 37.7
Inventories/production *** *** *** *** *** *** ***
Inventories/total shipments *** *** *** *** *** *** ***Share of shipments: Home market shipments: Internal consumption/ Transfers *** *** *** *** *** *** *** Commercial home market shipments *** *** *** *** *** *** ***
Total home market shipments *** *** *** *** *** *** ***
Export shipments to: United States *** *** *** *** *** *** ***
European Union1 *** *** *** *** *** *** ***
All other markets2 *** *** *** *** *** *** ***
Total exports *** *** *** *** *** *** ***
Total shipments *** *** *** *** *** *** ***1 European Union country markets include ***. 2 Other markets include ***. Source: Compiled from data submitted in response to Commission questionnaires.

IV‐21
*** percent of total shipments by the Canadian producers in 2016, fluctuated upward from
2012 to *** kW in 2016, higher than reported in 2012. Firms project that exports to the United
States in 2017 and 2018 will decline. Export markets other than the United States for CSPV
modules produced in Canada accounted for *** percent of the responding Canadian producers’
total shipments in 2016. Other major export markets identified by producers in Canada for
CSPV modules include ***.
Home market
All four responding module producers in Canada indicated that they compete with
imports in the home market and noted that the trend in home market competition with
imports has either fluctuated or increased since January 1, 2012. Explanations for the trend in
home market competition with imports include the following:
***: “***.”
***: “***.”
***: “***.”

IV‐22
Export markets
Producers of CSPV modules in Canada were asked to identify export markets other than
the United States that they have developed or where they have increased sales since January 1,
2012. These other major export markets include the following: ***. There were no trade
barriers identified in this proceeding with respect to certain CSPV products originating in
Canada.17 Export data compiled by the Global Trade Atlas (“GTA”) for Canada are not presented
in this report because data specific to PV products are not available.
Global relationships
Canadian CSPV module manufacturers maintain corporate and other arms‐length supply
chain relationships in several other countries (table IV‐11). Although there is no CSPV cell
manufacturing conducted in Canada, according to data collected in this investigation, ***
percent of total global CSPV cell production was conducted by firms that share a corporate or
arms‐length supplier relationship with the Canadian module assemblers in 2016. In addition,
*** percent of total global CSPV module assembly was conducted by Canadian module
assemblers together with companies in other countries that share a corporate or arms‐length
supplier relationship with the Canadian firms.
17 For further information on trade barriers in third‐country markets, see section titled “Restraints on Exports to, or on Imports into, Third‐Country Markets” in Part I of this report.

IV‐23
Table IV-11
CSPV products: Canadian module assemblers’ global connections, 2012-16
Item Calendar year
2012 2013 2014 2015 2016 Quantity (kW) Module assembly in Canada *** *** *** *** ***Modules exported to the US from Canada *** *** *** *** ***
Parent or related companies'.1-- Global cell production *** *** *** *** ***
Global module assembly (excluding Canada) *** *** *** *** ***Modules exported to US (excluding from Canada) *** *** *** *** ***
Other existing arms-length suppliers'.2-- Global cell production *** *** *** *** ***
Global module assembly (excluding Canada) *** *** *** *** ***Modules exported to US (excluding from Canada) *** *** *** *** ***
Combined.3-- Global cell production *** *** *** *** ***
Global module assembly (excluding Canada) *** *** *** *** ***Modules exported to US (excluding from Canada) *** *** *** *** ***
Table continued on following page.

IV‐24
Table IV-11--Continued
CSPV products: Canadian module assemblers’ global connections, 2012-16
Item Calendar year
2012 2013 2014 2015 2016 Ratios (percent) Ratio to module assembly in Canada of.-- Parent or related companies:1 global cell production *** *** *** *** ***
Parent or related companies:1 global module assembly *** *** *** *** ***
Arms length suppliers:2 global cell production *** *** *** *** ***Arms length suppliers:2 global module assembly *** *** *** *** ***
Combined:3 global cell production *** *** *** *** ***
Combined:3 global module assembly *** *** *** *** ***Ratio to exports to the United States from Canada of.-- Parent or related companies:1 global exports to the US *** *** *** *** ***
Arms length suppliers:2 global exports to the US *** *** *** *** ***
Combined:3 global exports to the US *** *** *** *** ***
Share of total global cell production.-- In Canada *** *** *** *** ***
In other countries by parent or related companies1 of Canadian assemblers *** *** *** *** ***
In other countries by arms length suppliers2 of Canadian assemblers *** *** *** *** ***In other countries by parent or related companies and arms length suppliers combined3 of Canadian assemblers *** *** *** *** ***
Subtotal *** *** *** *** ***
Share of total global module assembly.-- In Canada *** *** *** *** ***
In other countries by parent or related companies1 of Canadian assemblers *** *** *** *** ***
In other countries by arms length suppliers2 of Canadian assemblers *** *** *** *** ***In other countries by parent or related companies and arms’ length suppliers combined3 of Canadian assemblers *** *** *** *** ***
Subtotal *** *** *** *** ***1 Data for Canadian Solar, Celestica, and Hanwha in all foreign locations. 2 Data for Aleo Solar (Germany), Aleo Sunrise (Germany), Inventec Energy (Taiwan), JA Solar (Malaysia), Motech (Taiwan), Neo Solar (China) Neo Solar Power (Taiwan), Shanghai JA Solar (China, Solartech (Taiwan), SolarWorld (Germany) and TSEC (Taiwan). 3 Data for all related companies and arms' length suppliers’ global operations.
Source: Compiled from data submitted in response to Commission questionnaires.

IV‐25
Mexico
Overview
The Commission issued foreign producer questionnaires to 13 firms believed to produce
CSPV products in Mexico. Three firms in Mexico responded to the Commission’s questionnaire
with useable information, accounting for approximately *** percent of module capacity in
Mexico in 2016. No producers of CSPV cells in Mexico provided a response to the Commission’s
questionnaire. Table IV‐12 lists the Mexican producers of CSPV modules that responded to the
Commission’s questionnaire and certain summary data for the period January 2012 through
December 2016 reported in those responses.

IV‐26
Table IV-12 CSPV products: Summary data on firms in Mexico, January 2012 through December 2016
Firm Production
(kW)
Share of reported
production (percent)
Exports to the United States (kW)
Share of reported
exports to the United
States (percent)
Total shipments
(kW)
Share of firm's total shipments exported to the United
States (percent)
CSPV modules: ERDM Solar (Mexico) *** *** *** *** *** ***Kyocera (Mexico) *** *** *** *** *** ***SunPower (Mexico) *** *** *** *** *** ***
Total *** *** *** *** *** ***Note.--Foreign producer data on module assembly does not necessarily equate to the country-of-origin classification used for U.S. import statistics. Mexican module assemblers indicated that they used *** CSPV cells. Source: Compiled from data submitted in response to Commission questionnaires.
Changes in operations
The responding producers in Mexico reported operational and organizational changes
since January 1, 2012. Details concerning the changes reported are presented in table IV‐13.
Table IV-13 CSPV products: Mexican producers’ reported changes in operations, since January 1, 2012
Item/firm Description of change Plant openings: *** *** Plant closings: *** *** Expansions: *** *** Consolidations: *** *** Prolonged shutdowns or curtailments:*** *** Technology: *** *** Source: Compiled from data submitted in response to Commission questionnaires.

IV‐27
Anticipated changes in operations
The Commission also asked the Mexican producers to report anticipated changes in the
character of their operations relating to CSPV products in the future. Two producers in Mexico
reported that they do not anticipate any changes in the character of their CSPV operations,
whereas one firm reported the following details presented in table IV‐14 concerning the
anticipated changes.
Table IV-14 CSPV products: Mexican producers’ anticipated changes in operations
Firm Details concerning anticipated changes *** *** Source: Compiled from data submitted in response to Commission questionnaires.
Operations on CSPV cells
The three responding producers/exporters of CSPV modules in Mexico did not report
any production of CSPV cells. Publicly available information indicates that i3 Group, a holding
company, is the only manufacturer of CSPV cells in Mexico, which are produced via its
subsidiaries. The firm’s production has expanded over time with the acquisition and
importation of PV production lines previously owned by European producers. One subsidiary
reported production capacity of 250 MW, though it is not clear if this is for CSPV cells, modules,
or both and if it only includes production in Mexico. The combined cell production capacity of
the two plants acquired in 2013 and 2014 was likely greater than 150 MW at that time.18
18 Manufacturer, “Desde México, Solartec se Abre Paso Por el Mundo,” August 10, 2016, http://www.manufactura.mx/industria/2016/08/10/desde‐mexico‐solartec‐se‐abre‐paso‐por‐el‐mundo; Solartec Website, http://solartec.mx/index.php, accessed July 13, 2017; Fredrick, James, “Mexican Solar Manufacturer Looks to Compete Abroad,” BN Americas, March 22, 2013, https://www.bnamericas.com/en/interviews/electricpower/miguel‐medina‐aguilar‐
(continued...)

IV‐28
Operations on CSPV modules
Publicly available information indicates that there were at least five producers of CSPV
modules in Mexico as of the end of 2016. Total production capacity at these plants is more than
1,500 MW. The largest producer is SunPower with an annual capacity greater than 1,000 MW,
but at least three other producers have more than 100 MW of annual production capacity.19 In
August 2016, SunPower announced that it would close its module assembly plant in the
Philippines and move production tools to Mexico, which would increase annual capacity in
Mexico to 2 GW.20
(…continued) solartec?position=1&aut=true&idioma=en; El Fianciero, “Solartec Adquiere Activos de Bosch Solar,” July 21, 2014, http://www.elfinanciero.com.mx/empresas/solartec‐adquiere‐activos‐de‐bosch‐solar.html; Fredrick, James, “Mexico's Solarcell to Produce 75MW Cells Annually,” BN Americas, March 21, 2013, https://www.bnamericas.com/en/news/electricpower/mexicos‐solarcell‐to‐produce‐75mw‐cells‐annually; Fredrick, James, “Mexico's First Solar Cell Plant Delays Startup, Decreases Capacity,” BN America, October 15, 2013, https://www.bnamericas.com/en/news/electricpower/mexicos‐first‐solar‐cell‐plant‐delays‐startup‐decreases‐capacity.
19 These data do not include plants that closed during 2016. IUSASOL Website, http://www.iusasol.mx/Home/why_us, accessed July 13, 2017; Manufacturer, “Desde México, Solartec se Abre Paso Por el Mundo,” August 10, 2016, http://www.manufactura.mx/industria/2016/08/10/desde‐mexico‐solartec‐se‐abre‐paso‐por‐el‐mundo; Solartec Website, http://solartec.mx/index.php (accessed July 13, 2017); Solarvatio Website, http://solarvatio.com/energy/proceso/, accessed July 13, 2017; ERDM Website, http://stores.erdm‐solar.com/About‐Us.html (accessed July 13, 2017); SunPower, “SunPower Awarded Approximately 500 Megawatts of Solar in Mexico's First Electricity Auction,” News release, April 1, 2016, http://newsroom.sunpower.com/2016‐04‐01‐SunPower‐Awarded‐Approximately‐500‐Megawatts‐of‐Solar‐in‐Mexicos‐First‐Electricity‐Auction.
20 Osborne, Mark, “SunPower Streamlining Project Development Focus and Closing Module Assembly Plant,” PV Tech, August 9, 2016, https://www.pv‐tech.org/news/sunpower‐streamlining‐project‐development‐focus‐and‐closing‐module‐assembly.

IV‐29
Three companies closed module plants in Mexico during 2012‐16. Panasonic closed its
50 MW module plant in 2012, Siliken closed its 75 MW module plant in 2012, and Kyocera
closed its 300 MW module plant in 2016.21
Several other firms produced modules in Mexico on a contract basis during 2012‐16, but
have closed or the status of their manufacturing operations is unclear. Flex Limited started
production of modules in Mexico in 2015 for SunEdison, but the subsequent bankruptcy of
SunEdison led to the end of manufacturing for this partner.22 Information is not available on
whether the firm manufactures in Mexico for any other companies. Production capacity at the
plant was approximately 400 MW.23 Other contract manufacturers that announced production
plants in Mexico but may no longer actively produce CSPV products include Jabil Circuit and
Foxconn subsidiary Fox Energy.24
21 USITC Publication 4519, p. VII‐35; USITC Publication 4360, p. VII‐17; Dennis, William, “Panasonic Consolidates Solar Panel Production,” Engineering and Technology, August 23, 2012, https://prod‐eandt.theiet.org/content/articles/2012/08/panasonic‐consolidates‐solar‐panel‐production/; Stromsta, Karl‐Erik, “Siliken Shuts Doors at Mexican PV Plant After Just 16 Months,” Recharge, September 6, 2012, http://www.rechargenews.com/solar/840385/siliken‐shuts‐doors‐at‐mexican‐pv‐plant‐after‐just‐16‐months; Nikkei Asian Review, “Kyocera Profit Seen Slumping 18% for Fiscal 2016,” January 18, 2017, http://asia.nikkei.com/Markets/Tokyo‐Market/Kyocera‐profit‐seen‐slumping‐18‐for‐fiscal‐2016; Romero‐Hernandez, Sergio et al., “Solar Energy Potential in Mexico’s Northern Border States,” Woodrow Wilson International Center, July 2012, p. 8.
22 Osborne, Mark, “Flextronics to Produce Solar Modules for SunEdison in Mexico,” PV Tech, April 7, 2015, https://www.pv‐tech.org/news/flextronics_to_produce_solar_modules_for_sunedison_in_mexico; Osborne, Mark, “Flex Confirms Solar Business with SunEdison Went From US$500 Million to Zero,” PV Tech, January 27, 2017, https://www.pv‐tech.org/news/flex‐confirms‐solar‐business‐with‐sunedison‐went‐from‐us500‐million‐to‐zero.
23 Grajeda, Jose, “Ciudad Juarez Dominates Solar Panel Manufacturing in Mexico,” August 4, 2015, https://www.tecma.com/solar‐panel‐manufacturing‐in‐mexico‐is‐dominant‐in‐ciudad‐juarez/.
24 USITC Publication 4519, p. VII‐35.

IV‐30
The three responding Mexican producers’ reported capacity, production, capacity
utilization, and shipments generally increased from 2012 to 2016 (table IV‐15).25 Capacity and
production increased by *** percent and *** percent, respectively, from 2012 to 2016, and the
capacity utilization for firms producing CSPV modules in Mexico ranged from *** percent to
*** percent during 2012‐16. The responding Mexican producers project capacity, production,
and capacity utilization to increase in 2017‐18. Inventories of CSPV modules held by these three
firms in Mexico have fluctuated over the period, but were *** percent higher in 2016 compared
with 2012. Aggregate home market sales, which accounted for *** percent of total shipments
by the Mexican producers in 2016, increased by *** percent during 2012‐16. Meanwhile,
exports of CSPV modules to the United States, which accounted for *** percent of total
shipments by the Mexican producers in 2016, increased by *** percent from *** kW in 2012 to
*** kW in 2016. Responding firms project further increases in exports to the United States
during 2017 and 2018, although they project that the exports to the United States will account
for a smaller share of total shipments, declining from *** percent of total shipments in 2016 to
*** percent in 2018. Export markets other than the United States for CSPV modules produced
in Mexico accounted for between *** percent and *** percent of the responding Mexican
producers’ total shipments since 2012, although responding firms project that these exports
will account for a larger share of their total shipments during 2017‐18. Other major export
markets identified by producers in Mexico for CSPV modules include ***.
25 Two producers/exporters in Mexico responded to the Commission’s questionnaire in this proceeding.

IV‐31
Table IV-15 CSPV modules: Data on the industry in Mexico, 2012-16 and projected 2017-18
Item
Actual experience Projections
Calendar year
2012 2013 2014 2015 2016 2017 2018
Quantity (kW)
Capacity *** *** *** *** *** *** ***
Production *** *** *** *** *** *** ***End-of-period inventories *** *** *** *** *** *** ***Shipments: Home market: Internal consumption/ transfers *** *** *** *** *** *** *** Commercial Shipments *** *** *** *** *** *** *** Subtotal, home market shipments *** *** *** *** *** *** ***
Export shipments to: United States *** *** *** *** *** *** ***
European Union1 *** *** *** *** *** *** ***
All other markets2 *** *** *** *** *** *** ***
Total exports *** *** *** *** *** *** ***
Total shipments *** *** *** *** *** *** ***
Ratios and shares (percent)
Capacity utilization *** *** *** *** *** *** ***
Inventories/production *** *** *** *** *** *** ***Inventories/total shipments *** *** *** *** *** *** ***Share of shipments: Home market: Internal consumption/ transfers *** *** *** *** *** *** *** Commercial Shipments *** *** *** *** *** *** *** Subtotal, home market shipments *** *** *** *** *** *** ***
Export shipments to: United States *** *** *** *** *** *** ***
European Union1 *** *** *** *** *** *** ***
All other markets2 *** *** *** *** *** *** ***
Total exports *** *** *** *** *** *** ***
Total shipments *** *** *** *** *** *** ***1 European Union country markets include ***. 2 Other markets include ***. Source: Compiled from data submitted in response to Commission questionnaires.
IV‐32
Home market
Producers of CSPV products in Mexico were asked whether they compete with imports
of CSPV products in their home market. ***, which reported *** shipments of CSPV products to
the home market during the period of investigation, and ***, which reported ***, indicated
that they do not compete with imports in the home market. ***, which reported *** shipments
of CSPV products were to the home market during the period of investigation, indicated that it
competes with imports in the home market and commented on “unfair competition from
China,” although it noted that the trend in home market competition with imports has
decreased since January 1, 2012.
Export markets
Producers of CSPV products in Mexico were asked to identify export markets other than
the United States that they have developed or where they increased sales since January 1,
2012. *** reported that it has not developed any other export market other than the United
States. *** reported that their other major export markets include the following: ***. There
were no trade barriers identified in this investigation with respect to certain CSPV products
originating in Mexico.26 Export data compiled by GTA for Mexico are not presented in this
report because the PV‐specific data do not appear to capture all exports of PV products.
26 For further information on trade barriers in third‐country markets, see section titled “Restraints on Exports to, or on Imports into, Third‐Country Markets” in Part I of this report.

IV‐33
The industries in Asia
China
Market
China was the largest PV global market in 2016, with installations increasing from 3.2
GW in 2012 to 34.5 GW in 2016.27 China’s feed‐in tariff (“FIT”) is one of the main policies that
the government has used to encourage domestic solar installations. China’s FIT establishes a
rate for PV‐generated electricity, with this rate varying by region and type of installation
(distributed and ground mounted). FIT rates have been revised downward several times since
the start of 2012, including in 2013, 2016, and 2017.28
Downward revisions in the FIT rates (which did not always occur at the same time of
year during 2012‐16) have periodically led to a spike in installations as developers seek to
complete projects in time to receive the higher rates. In 2013, for example, installations
increased in the second half of the year as developers sought to complete projects before the
27 Lv Fang, Xu Honghua, Wang Sicheng, “National Survey Report of PV Power Applications in China 2015,” IEA PVPS, n.d., p. 4, http://www.iea‐pvps.org/?id=93; IEA, PVPS, 2016 Snapshot of Global Photovoltaic Markets, Report IEA PVPS T1‐31:2017, 2017, 4, 10, http://www.iea‐pvps.org/fileadmin/dam/public/report/statistics/IEA‐PVPS_‐_A_Snapshot_of_Global_PV_‐_1992‐2016__1_.pdf.
28 The FIT for distributed systems was implemented in 2013. Zhu, Joseph, “China Feed‐In Tariff Brings Solar Shares Higher,” Seeking Alpha, September 11, 2013, https://seekingalpha.com/article/1686722‐china‐feed‐in‐tariff‐brings‐solar‐shares‐higher; EnergyTrend, “China’s 2016 FiT Rates Lower than Expectation,” December 17, 2015, http://pv.energytrend.com/news/China_2016_FiT_Rates_Lower_than_Expectation.html; Frank Xie and Josefin Berg, “China Confirms 2017 PV FiT Rates ‐ Growing concerns Over 2016 PV Installations,” IHS Markit, January 10, 2017, https://www.pv‐tech.org/news/china‐trials‐wind‐and‐solar‐certificate‐scheme‐in‐move‐away‐from‐feed‐in‐ta.

IV‐34
end of the year in order to receive the higher FIT rate.29 According to Bloomberg New Energy
Finance, *** percent of large‐scale projects installed during 2013 were completed in the ***.30
In December 2015, China announced lower FIT rates for 2016. However, projects
approved by regional governments in 2015 or meeting certain other criteria were eligible for
the higher 2015 rate as long as they were completed by the end of June 2016.31 This led to
higher installations in the first half of the year as developers sought to complete projects in
time to receive the higher FIT rate.32 Of China’s 34.5 GW installed in 2016, more than 20 GW
was completed in the first half of the year (figure IV‐5).33 China also revised the FIT downward
in 2017, but approved projects could receive the higher prior year rate if completed by June
29 Haugwitz, Frank, “Will China’s Next Five‐year Plan be the Initial Phase of its Energy Transition?” PV Tech, December 17, 2015, https://www.pv‐tech.org/guest‐blog/will‐chinas‐next‐five‐year‐plan‐be‐the‐initial‐phase‐of‐its‐energy‐transiti.
30 ***. Bloomberg New Energy Finance database, https://www.bnef.com (accessed August 22, 2017). 31 EnergyTrend, “China’s 2016 FiT Rates Lower than Expectation,” December 17, 2015,
http://pv.energytrend.com/news/China_2016_FiT_Rates_Lower_than_Expectation.html. 32 Reuters, “China Installed 20 GW of Solar Power in First‐half; Triple from a Year Ago,” July 22, 2016,
http://www.reuters.com/article/us‐china‐solar‐idUSKCN1020P7; Deign, Jason, “Why China’s Solar Market Won’t Have Another Year Like 2016,” Greentech Media, June 5, 2017, https://www.greentechmedia.com/articles/read/why‐chinas‐solar‐market‐wont‐have‐another‐year‐like‐2016.
33 China’s National Energy Administration (NEA) reported that the total was 22 GW, but various contemporaneous media reports indicated that the total might have been lower. ***. Parnell, John, “China’s PV grid connections hit 22GW in H1 2016,” PV Tech, July 26, 2016, https://www.pv‐tech.org/news/44394; IEA, PVPS, 2016 Snapshot of Global Photovoltaic Markets, Report IEA PVPS T1‐31:2017, 2017, 4, 10, http://www.iea‐pvps.org/fileadmin/dam/public/report/statistics/IEA‐PVPS_‐_A_Snapshot_of_Global_PV_‐_1992‐2016__1_.pdf; Bloomberg New Energy Finance database, https://www.bnef.com (accessed August 22, 2017).

IV‐35
30.34 China installed 24.4 GW in the first half of 2017 and another 10.5 GW in July 2017, but is
forecast to install only 5 to 10 GW in the remainder of 2017.35
Figure IV-5
Chinese PV installations, 2014 to 1st half 2017
Source: Bloomberg News, “China Adds Australia-Sized Solar Capacity in Energy Push,” August 7, 2014, https://www.bloomberg.com/news/print/2014-08-07/china-add-australia-sized-solar-capacity-in-energy-push.html; Meza, Edgar, “China Increases Solar Installation Target for 2015,” PV Magazine, October 9, 2015, https://www.pv-magazine.com/2015/10/09/china-increases-solar-installation-target-for-2015_100021478/; Parnell, John, “China’s PV grid connections hit 22GW in H1 2016,” PV Tech, July 26, 2016, https://www.pv-tech.org/news/44394; Clover, Ian “China Installed 24.4 GW of Solar in First Half of 2017, Shows Official NEA Data,” PV Magazine, August 7, 2017, https://www.pv-magazine.com/2017/08/07/china-installed-24-4-gw-of-solar-in-first-half-of-2017-shows-official-nea-data/; IEA, PVPS, 2016 Snapshot of Global Photovoltaic Markets, Report IEA PVPS T1-31:2017, 2017, 4, 10, http://www.iea-pvps.org/fileadmin/dam/public/report/statistics/IEA-PVPS_-_A_Snapshot_of_Global_PV_-_1992-2016__1_.pdf; Lv Fang, Xu Honghua, Wang Sicheng, “National Survey Report of PV Power Applications in China 2015,” IEA PVPS, n.d., p. 4, http://www.iea-pvps.org/?id=93. Note: H1: 1st half of the year; H2: 2nd half of the year. Data start from 2014 as first and second half installation data for 2013 were not readily available.
China has implemented a number of other policies to encourage PV installations. For
example, the Solar Poverty Alleviation program provides financial support for low‐income
34 Xie, Frank and Josefin Berg, “China Confirms 2017 PV FiT Rates ‐ Growing concerns Over 2016 PV Installations,” IHS Markit, January 10, 2017, https://www.pv‐tech.org/news/china‐trials‐wind‐and‐solar‐certificate‐scheme‐in‐move‐away‐from‐feed‐in‐ta.
35 Hutchins, Mark, “AECEA: China Installations to Surpass 40 GW in 2017,” PV Magazine, August 22, 2017, https://www.pv‐magazine.com/2017/08/22/aecea‐china‐installations‐to‐surpass‐40‐gw‐in‐2017/.
3
7 8 7
22
13
24
0
5
10
15
20
25
30
H1 H2 H1 H2 H1 H2 H1
2014 2015 2016 2017
PV installations in China (GW)

IV‐36
households to purchase solar modules and guarantees a set rate for excess electricity sent to
the electric grid.36 The Top Runner Program, which was introduced in 2015, is a reverse auction
designed to support the installation, and therefore the development and production, of more
advanced solar technologies. Modules installed as part of the program must met certain
minimum energy efficiency levels.37
Overview of data collection
The Commission issued foreign producer questionnaires to 274 firms believed to
produce CSPV products in China. Thirty‐five firms in China responded to the Commission’s
questionnaire with useable information, accounting for approximately 57 percent of total CSPV
cell production and 67 percent of total CSPV module production in China in 2016. Table IV‐16
lists the Chinese producers of CSPV products that responded to the Commission’s questionnaire
and certain summary data reported in those responses.
36 Deign, Jason, “Why China’s Solar Market Won’t Have Another Year Like 2016,” Greentech Media, June 5, 2017, https://www.greentechmedia.com/articles/read/why‐chinas‐solar‐market‐wont‐have‐another‐year‐like‐2016; EnergyTrend, “PV Poverty Alleviation Projects will Boom in China,” June 20, 2016, http://pv.energytrend.com/news/PV_Poverty_Alleviation_Projects_will_Boom_in_China.html.
37 Longi, “Assisted by the Top Runner Program, the Mono‐crystalline Market Share in China Rising to 25%,” News release, September 30, 2016, http://en.longigroup.com/content/details53_1303.html; GCL, “GCL System Received CQC's ‘TOP Runner’ Program Level‐One Energy Efficiency Certification in China,” News release, April 25, 2016, http://www.prnewswire.com/news‐releases/gcl‐system‐received‐cqcs‐top‐runner‐program‐level‐one‐energy‐efficiency‐certification‐in‐china‐300256475.html; EnergyTrend, “Analysis on China’s Top Runner Program: Mono‐si Products Obtain Advantage, Company Brand Image Enhanced,” July 8, 2017, http://pv.energytrend.com/research/Analysis_on_China_Top_Runner_Program.html; Benjamin Attia and Yongyong Ji, “The Top Runner Program as a Driver of Competitive, High‐Efficiency Utility‐Scale Demand in China,” GTM Research, July 2017, https://www.greentechmedia.com/research/report/the‐top‐runner‐program‐as‐a‐driver‐of‐demand‐in‐china.

IV‐37
Table IV-16 CSPV products: Summary data on firms in China, January 2012 through December 2016, by product type
Firm Production
(kW)
Share of reported
production (percent)
Exports to the United States (kW)
Share of reported exports to the United States
(percent)
Total shipments
(kW)
Share of firm's total
shipments exported
to the United States
(percent) CSPV cells:
Anji DaSol *** *** *** *** *** ***Canadian Solar *** *** *** *** *** ***Changzhou Trina *** *** *** *** *** ***Chint Zheijiang *** *** *** *** *** ***Cixi Rixing *** *** *** *** *** ***Delsolar WuJiang *** *** *** *** *** ***ET Solar *** *** *** *** *** ***GCL System *** *** *** *** *** ***Hanwha Qidong *** *** *** *** *** ***Hengdian DMEGC *** *** *** *** *** ***Jiawei Solar *** *** *** *** *** ***Jinizhou Huachang *** *** *** *** *** ***Jinko Solar *** *** *** *** *** ***Jolywood Suzhou *** *** *** *** *** ***Lightway Green *** *** *** *** *** ***Longi Solar *** *** *** *** *** ***Neo Solar *** *** *** *** *** ***Ningbo Komaes *** *** *** *** *** ***Risen Energy *** *** *** *** *** ***Shanghai BYD *** *** *** *** *** ***Shanghai JA Solar *** *** *** *** *** ***ShenZhen Jiawei *** *** *** *** *** ***Shenzhen Sungold *** *** *** *** *** ***Shenzhen Topray *** *** *** *** *** ***Star Power *** *** *** *** *** ***Sumec Hardware *** *** *** *** *** ***Suzhou Talesun *** *** *** *** *** ***Wanxiang Solar *** *** *** *** *** ***Wuhan FYY *** *** *** *** *** ***Wuxi Suntech *** *** *** *** *** ***Wuxi Tianran *** *** *** *** *** ***Yingli Green *** *** *** *** *** ***Zhejiang Era *** *** *** *** *** ***
Total 94,190,736 100.0 *** *** *** ***Table continued on following page.

IV‐38
Table IV-16—Continued CSPV products: Summary data on firms in China, January 2012 to December 2016, by product type
Firm Production
(kW)
Share of reported
production (percent)
Exports to the United States (kW)
Share of reported exports to the United States
(percent)
Total shipments
(kW)
Share of firm's total
shipments exported
to the U.S.(percent)
CSPV modules: Anji DaSol *** *** *** *** *** ***Canadian Solar *** *** *** *** *** ***Changzhou Trina *** *** *** *** *** ***Chint Zheijiang *** *** *** *** *** ***Cixi Rixing *** *** *** *** *** ***Delsolar WuJiang *** *** *** *** *** ***ET Solar *** *** *** *** *** ***GCL System *** *** *** *** *** ***Hanwha Qidong *** *** *** *** *** ***Hengdian DMEGC *** *** *** *** *** ***Jiawei Solar *** *** *** *** *** ***Jinizhou Huachang *** *** *** *** *** ***Jinko Solar *** *** *** *** *** ***Jolywood Suzhou *** *** *** *** *** ***Lightway Green *** *** *** *** *** ***Longi Solar *** *** *** *** *** ***Neo Solar *** *** *** *** *** ***Ningbo Komaes *** *** *** *** *** ***Risen Energy *** *** *** *** *** ***Shanghai BYD *** *** *** *** *** ***Shanghai JA Solar *** *** *** *** *** ***ShenZhen Jiawei *** *** *** *** *** ***Shenzhen Sungold *** *** *** *** *** ***Shenzhen Topray *** *** *** *** *** ***Star Power *** *** *** *** *** ***Sumec Hardware *** *** *** *** *** ***Suzhou Talesun *** *** *** *** *** ***Wanxiang Solar *** *** *** *** *** ***Wuhan FYY *** *** *** *** *** ***Wuxi Suntech *** *** *** *** *** ***Wuxi Tianran *** *** *** *** *** ***Yingli Green *** *** *** *** *** ***Zhejiang Era *** *** *** *** *** ***
Total 115,123,001 100.0 *** *** 112,885,289 ***Note.--Foreign producer data on module assembly does not necessarily equate to the country-of-origin classification used for U.S. import statistics. Most China module assemblers use Chinese or Taiwanese-origin CSPV cells. Source: Compiled from data submitted in response to Commission questionnaires.

IV‐39
Foreign capacity expansions by leading Chinese firms
Based on questionnaire responses, the six largest firms38 producing CSPV cells and
modules in China increased their global capacity to produce CSPV cells by *** percent over the
period to *** kW in 2016 (table IV‐17). These six firms accounted for *** percent of reported
global cell capacity in 2016, up from *** percent in 2012. Capacity increased in China by ***
percent for these six firms during 2012‐16 to *** kW. Four of the six firms added cell
manufacturing capacity in one or more of the following five countries during the period of
investigation: Korea, Malaysia, the Netherlands, Thailand, and Vietnam. Cell capacity in these
five countries grew by *** percent during the period, from *** kW to *** kW.
38 Canadian Solar, Hanwha, JA Solar, Jinko, Trina, and Yingli Green. Hanwha is based in Korea, but *** of its cell and module production occurred in China. Hanwha’s first large scale entry into the solar business was via its 2010 acquisition of 49.99 percent of Solarfun, a Chinese firm that was at the time the fourth largest module producer in China. In 2012, Hanwha acquired bankrupt German manufacturer QCells, which had production in Germany and Malaysia. Reuters, “Hanwha Chem to buy 50 percent of Solarfun for $370 million,” August 3, 2010, http://www.reuters.com/article/us‐hanwha‐solarfun‐idUSTRE6724RS20100803; Hanwha, “Hanwha Chemical Acquires 49.99% Stake in Solarfun Power,” News release, August 3, 2010, http://www.hanwha.com/en/news_and_media/press_release/hanwha_chemical_acquires_49_99_stake_in_solarfun_power.html; Hanwha, “Hanwha Acquires Q.CELLS, One of the World's Leading Photovoltaics Companies,” News release, August 30, 2012, http://www.hanwha.com/en/news_and_media/press_release/hanwha_acquires_q_cells_one_of_the_worlds_leading_photovoltaics_companies.html.

IV‐40
Table IV-17
CSPV products: Cell capacity for largest Chinese producers regardless of global location, 2012-16
Item Calendar year
2012 2013 2014 2015 2016 Quantity (kW)
Global capacity to produce cells by.-- Canadian solar *** *** *** *** ***
Canadian Solar (China) *** *** *** *** ***Canadian Solar (Canada) *** *** *** *** ***Canadian Solar (Malaysia) *** *** *** *** ***Canadian Solar (Thailand) *** *** *** *** ***Canadian Solar (Vietnam) *** *** *** *** ***Canadian Solar (Indonesia) *** *** *** *** ***
Hanwha *** *** *** *** ***Hanwha (Korea) *** *** *** *** ***Hanwha (Germany) *** *** *** *** ***Hanwha Qidong (China) *** *** *** *** ***Hanwha (Canada) *** *** *** *** ***Hanwha HongKong (China) *** *** *** *** ***Hanwha (Malaysia) *** *** *** *** ***
JA Solar *** *** *** *** ***Shanghai JA Solar (China) *** *** *** *** ***JA Solar (Malaysia) *** *** *** *** ***
Jinko *** *** *** *** ***Jinko Solar (China) *** *** *** *** ***Jinko Solar (Malaysia) *** *** *** *** ***
Trina *** *** *** *** ***Changzhou Trina (China) *** *** *** *** ***Trina Solar (Netherlands) *** *** *** *** ***Trina Solar (Thailand) *** *** *** *** ***Trina Solar (Vietnam) *** *** *** *** ***
Yingli Green *** *** *** *** ***Subtotal *** *** *** *** ***All other firms *** *** *** *** ***
Total cell capacity 27,337,286 31,220,500 36,439,876 43,341,003 56,877,024 Share of quantity (percent)
Global capacity to produce cells by.-- Canadian solar *** *** *** *** ***
Hanwha *** *** *** *** ***JA Solar *** *** *** *** ***Jinko *** *** *** *** ***Trina *** *** *** *** ***Yingli Green *** *** *** *** ***
Subtotal *** *** *** *** ***All other firms *** *** *** *** ***
Total cell capacity 100.0 100.0 100.0 100.0 100.0Source: Compiled from data submitted in response to Commission questionnaires.

IV‐41
With respect to modules, these same six firms reported a ***‐percent increase in global
capacity to produce CSPV modules over the period to *** kW in 2016 (table IV‐18). Their
capacity increased in China by *** percent during 2012‐16 to *** kW. Four of the six firms
added module production capacity in one or more of the following six countries during the
period of investigation: Canada, Indonesia, Korea, Malaysia, Thailand, and Vietnam.39 Module
capacity in these six countries grew from *** kW in 2012 to *** kW in 2016. Except for a ***,
none of the six largest module manufacturers in China had established any module production
capacity in any of these six countries prior to 2015.
39 The data presented here only include internal production capacity added in these countries. These firms have also expanded production capacity in foreign countries through the use of contract manufacturers. For example, Flex Ltd opened a 360 MW module plant in Brazil to make modules for Canadian Solar. Trina Solar opened a cell plant in Vietnam, but reportedly contracted with Vina Solar for module assembly. Kenning, Tom, “Canadian Solar and Flextronics Partner on 360MW Module Factory in Brazil,” PV Tech, June 20, 2016, https://www.pv‐tech.org/news/canadian‐solar‐and‐flextronics‐partner‐on‐360mw‐module‐factory‐in‐brazil; EnergyTrend, “Vina Solar Wins Cooperations with GCL‐SI and Trina Solar for 1.6GW of Solar Cell Capacity,” January 19, 2017, http://pv.energytrend.com/news/Vina_Solar_Wins_Cooperations_with_GCL_SI_and_Trina_Solar.html.

IV‐42
Table IV-18
CSPV products: Module assembly capacity for largest Chinese producers regardless of global location, 2012-16
Item Calendar year
2012 2013 2014 2015 2016 Quantity (kW) Global capacity to assemble modules by.-- Canadian solar *** *** *** *** ***
Canadian Solar (China) *** *** *** *** ***Canadian Solar (Canada) *** *** *** *** ***Canadian Solar (Malaysia) *** *** *** *** ***Canadian Solar (Thailand) *** *** *** *** ***Canadian Solar (Vietnam) *** *** *** *** ***Canadian Solar (Indonesia) *** *** *** *** ***
Hanwha *** *** *** *** ***Hanwha (Korea) *** *** *** *** ***Hanwha (Germany) *** *** *** *** ***Hanwha Qidong (China) *** *** *** *** ***Hanwha (Canada) *** *** *** *** ***Hanwha HongKong (China) *** *** *** *** ***Hanwha (Malaysia) *** *** *** *** ***
JA Solar *** *** *** *** ***Shanghai JA Solar (China) *** *** *** *** ***JA Solar (Malaysia) *** *** *** *** ***
Jinko *** *** *** *** ***Jinko Solar (China) *** *** *** *** ***Jinko Solar (Malaysia) *** *** *** *** ***
Trina *** *** *** *** ***Changzhou Trina (China) *** *** *** *** ***Trina Solar (Netherlands) *** *** *** *** ***Trina Solar (Thailand) *** *** *** *** ***Trina Solar (Vietnam) *** *** *** *** ***
Yingli Green *** *** *** *** ***Subtotal *** *** *** *** ***All other firms *** *** *** *** ***
Total module assembly capacity 25,220,429 29,175,177 36,411,804 47,912,657 66,611,870
Share of quantity (percent) Global capacity to assemble modules by.-- Canadian solar *** *** *** *** ***
Hanwha *** *** *** *** ***JA Solar *** *** *** *** ***Jinko *** *** *** *** ***Trina *** *** *** *** ***Yingli Green *** *** *** *** ***
Subtotal *** *** *** *** ***All other firms *** *** *** *** ***
Total module assembly capacity 100.0 100.0 100.0 100.0 100.0
Source: Compiled from data submitted in response to Commission questionnaires.
IV‐43
Changes in operations
Of the responding 35 producers in China, 27 firms reported operational or
organizational changes since January 1, 2012. Details concerning the changes reported are
presented in table IV‐19.
Table IV-19 CSPV products: Reported changes in operations by producers in China, since January 1, 2012
Item/firm Reported changed in operations Plant openings: *** *** *** *** *** *** *** *** *** *** *** *** *** *** *** *** *** *** *** *** *** *** *** *** Plant closings: *** *** *** *** *** *** *** *** *** *** Table continued on following page.

IV‐44
Table IV-19—Continued CSPV products: Reported changes in operations by producers in China, since January 1, 2012
Item/firm Reported changed in operations Relocations: *** *** *** *** Expansions: *** *** *** *** *** *** *** *** *** *** *** *** *** *** *** *** *** *** *** *** *** *** Table continued on following page.
IV‐45
Table IV-19—Continued CSPV products: Reported changes in operations by producers in China, since January 1, 2012
Item/firm Reported changed in operations Acquisitions/mergers/buyouts: *** *** *** *** *** *** *** *** *** *** *** *** Consolidations: *** *** Prolonged shutdowns or curtailments: *** *** Revised labor agreements: *** *** Technology: *** *** *** *** *** *** *** *** Table continued on following page.

IV‐46
Table IV-19—Continued CSPV products: Reported changes in operations by producers in China, since January 1, 2012
Item/firm Reported changed in operations Other:
*** *** *** *** *** *** *** *** Source: Compiled from data submitted in response to Commission questionnaires.
Anticipated changes in operations
Regarding anticipated changes in the character of their operations relating to CSPV
products, 27 firms reported that they do not anticipate any changes, whereas 8 firms reported
the following details presented in table IV‐20 concerning the anticipated changes.

IV‐47
Table IV-20 CSPV products: Chinese producers’ anticipated changes in operations
Firm Details concerning anticipated changes *** *** *** *** *** *** *** *** *** *** *** *** *** *** *** *** Source: Compiled from data submitted in response to Commission questionnaires.
Operations on CSPV cells
According to publicly available information, China’s production of CSPV cells increased
from 21 GW in 2012 to 49 GW in 2016. CSPV cell production capacity totaled 53 GW in 2015
(the latest year available), up from more than 40 GW in 2012.40 CSPV cell capacity, production,
capacity utilization, inventories, and shipments as reported by Chinese firms responding to the
Commission’s questionnaire in this investigation generally increased from 2012 to 2016 (table
IV‐21). Capacity and production increased by 98.4 and 149.7 percent, respectively, from 2012 to
2016, and the capacity utilization for firms producing CSPV cells in China increased from 66.6
percent in 2012 to 83.8 percent in 2016. Likewise, inventories of CSPV cells increased by 301.5
40 National Survey Report of PV Power Applications in China 2012, International Energy Agency Co‐Operative Programme on Photovoltaic Power Systems, July 16, 2013, http://www.iea‐pvps.org/?id=93; National Survey Report of PV Power Applications in China 2015, International Energy Agency, Photovoltaic Power Systems Programme, http://www.iea‐pvps.org/?id=93; Liu Yuanyuan, “China’s Solar PV Industry Saw Continued Recovery in 2016,” Renewable Energy World, March 31, 2017, http://www.renewableenergyworld.com/articles/2017/03/china‐s‐solar‐pv‐industry‐saw‐continued‐recovery‐in‐2016.html.

IV‐48
Table IV-21 CSPV cells: Data on industry in China, 2012-16 and projected 2017 and 2018
Item
Actual experience Projections
Calendar year
2012 2013 2014 2015 2016 2017 2018
Quantity (kW)
Capacity 16,698,039 19,299,708 22,186,285 26,457,091 33,133,986 39,838,953 42,936,065
Production 11,124,972 14,027,686 18,537,642 22,720,444 27,779,992 33,929,420 37,287,607
End-of-period inventories 337,542 515,034 889,532 792,602 1,355,270 1,436,005 1,560,587Shipments: Home market shipments: Internal consumption/ transfers 9,674,468 11,896,126 16,131,422 18,760,718 24,213,257 29,589,168 32,215,243 Commercial home market shipments 1,003,794 1,162,736 1,175,209 3,502,607 2,551,812 3,136,876 3,245,012
Total home market shipments 10,678,262 13,058,862 17,306,631 22,263,325 26,765,069 32,726,044 35,460,255
Export shipments to: United States1 *** *** *** *** *** *** ***
European Union2 *** *** *** *** *** *** ***
All other markets3 *** *** *** *** *** *** ***
Total exports 404,262 810,543 871,646 519,073 504,106 1,153,448 1,735,693Total Shipments 11,082,524 13,869,405 18,178,277 22,782,398 27,269,175 33,879,492 37,195,948
Ratios and shares (percent)
Capacity utilization 66.6 72.7 83.6 85.9 83.8 85.2 86.8
Inventories/production 3.0 3.7 4.8 3.5 4.9 4.2 4.2Inventories/total shipments 3.0 3.7 4.9 3.5 5.0 4.2 4.2Share of shipments: Home market shipments: Internal consumption/ transfers 87.3 85.8 88.7 82.3 88.8 87.3 86.6 Commercial home market shipments 9.1 8.4 6.5 15.4 9.4 9.3 8.7
Total home market shipments 96.4 94.2 95.2 97.7 98.2 96.6 95.3
Export shipments to: United States1 *** *** *** *** *** *** ***
European Union2 *** *** *** *** *** *** ***
All other markets3 *** *** *** *** *** *** ***
Total exports 3.6 5.8 4.8 2.3 1.8 3.4 4.7Total shipments 100.0 100.0 100.0 100.0 100.0 100.0 100.0
1 Antidumping and countervailing duty orders associated with the CSPV 1 investigations became effective December 7, 2012. Antidumping and countervailing duty orders associated with the CSPV 2 investigations became effective February 18, 2015. 2 European Union country markets include ***. 3 Other markets include ***.
Source: Compiled from data submitted in response to Commission questionnaires.

IV‐49
percent during 2012‐16. Further increases in these indicators are projected during 2017 and
2018.
Home market shipments of CSPV cells (including internal consumption and commercial
home market sales), which accounted for 98.2 percent of total shipments by the Chinese
producers in 2016, increased by 150.7 percent during the period. Conversely, exports of CSPV
cells to the United States, which accounted for *** percent of total shipments by the Chinese
producers in 2016, declined from *** kW to *** kW (or by *** percent) during 2012‐16.
Responding firms project that there will be *** exports of CSPV cells from China to the United
States during 2017 and 2018. Export markets other than the United States for CSPV cells
produced in China accounted for *** percent of the responding Chinese producers’ total
shipments in 2016. Other major export markets identified by producers in China for CSPV cells
include ***.

IV‐50
Operations on CSPV modules
Publicly available information indicates that total production of CSPV modules in China
reached 53 GW in 2016, more than double the 2012 production total of 23 GW.41 Module
production was relatively evenly divided between the first and second half of the year, with 27
GW produced in the first six months.42 Maximum production capacity for CSPV modules totaled
71 GW in 2015 (the latest year available) compared to more than 40 GW of maximum capacity
available to produce modules in 2012.43
CSPV module capacity, production, capacity utilization, inventories, and shipments as
reported by Chinese producers responding to the Commission’s questionnaire in this
investigation generally increased from 2012 to 2016 (table IV‐22). Capacity and production
increased by 130.5 and 184.6 percent, respectively, from 2012 to 2016, and the capacity
utilization for firms producing CSPV modules in China increased from 61.9 percent in 2012 to
82.9 percent in 2015, before declining somewhat to 76.4 percent in 2016. Likewise, inventories
of CSPV modules increased by 142.2 percent during the same period. Further increases in
production, capacity, and inventories of CSPV modules in China are expected during 2017 and
2018.
41 National Survey Report of PV Power Applications in China 2012, International Energy Agency Co‐Operative Programme on Photovoltaic Power Systems, July 16, 2013, http://www.iea‐pvps.org/?id=93 ; Liu Yuanyuan, “China’s Solar PV Industry Saw Continued Recovery in 2016,” Renewable Energy World, March 31, 2017, http://www.renewableenergyworld.com/articles/2017/03/china‐s‐solar‐pv‐industry‐saw‐continued‐recovery‐in‐2016.html.
42 Reuters, “China Installed 20 GW of Solar Power in First‐half; Triple from a Year Ago,” July 22, 2016, http://www.reuters.com/article/us‐china‐solar‐idUSKCN1020P7.
43 National Survey Report of PV Power Applications in China 2012, International Energy Agency Co‐Operative Programme on Photovoltaic Power Systems, July 16, 2013, http://www.iea‐pvps.org/?id=93; National Survey Report of PV Power Applications in China 2015, International Energy Agency, Photovoltaic Power Systems Programme, http://www.iea‐pvps.org/?id=93.
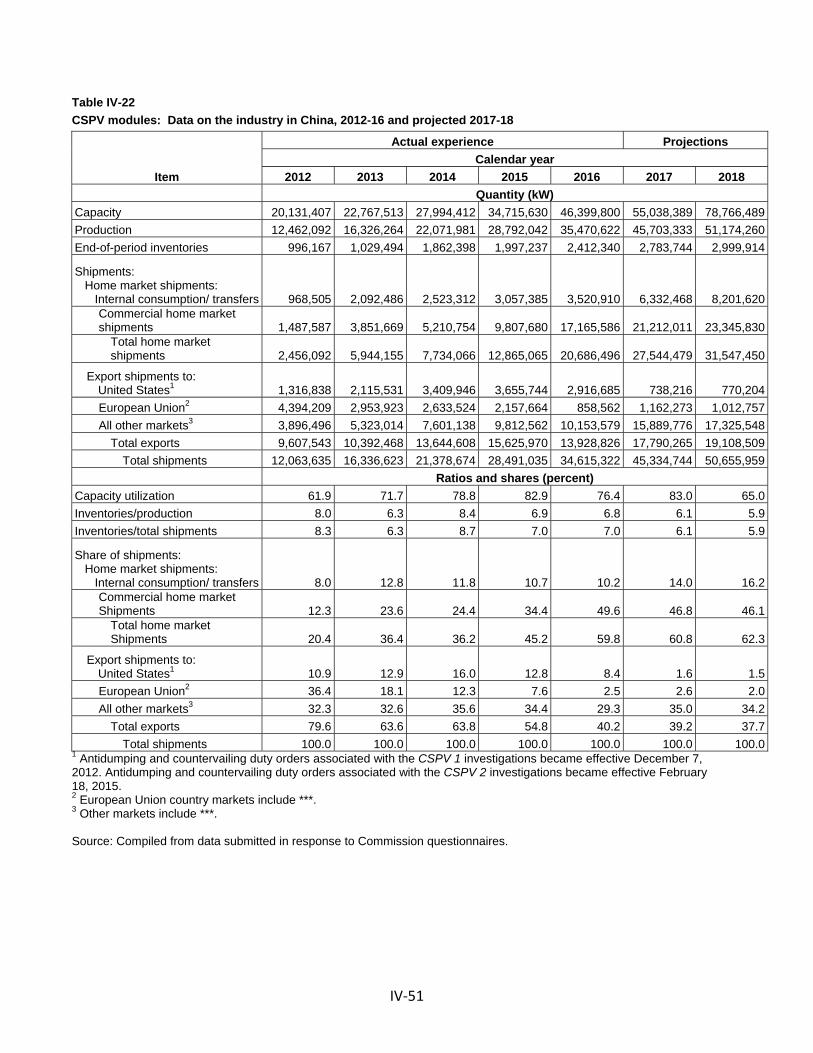
IV‐51
Table IV-22
CSPV modules: Data on the industry in China, 2012-16 and projected 2017-18
Item
Actual experience Projections
Calendar year
2012 2013 2014 2015 2016 2017 2018
Quantity (kW)
Capacity 20,131,407 22,767,513 27,994,412 34,715,630 46,399,800 55,038,389 78,766,489
Production 12,462,092 16,326,264 22,071,981 28,792,042 35,470,622 45,703,333 51,174,260
End-of-period inventories 996,167 1,029,494 1,862,398 1,997,237 2,412,340 2,783,744 2,999,914
Shipments: Home market shipments: Internal consumption/ transfers 968,505 2,092,486 2,523,312 3,057,385 3,520,910 6,332,468 8,201,620
Commercial home market shipments 1,487,587 3,851,669 5,210,754 9,807,680 17,165,586 21,212,011 23,345,830
Total home market shipments 2,456,092 5,944,155 7,734,066 12,865,065 20,686,496 27,544,479 31,547,450
Export shipments to: United States1 1,316,838 2,115,531 3,409,946 3,655,744 2,916,685 738,216 770,204
European Union2 4,394,209 2,953,923 2,633,524 2,157,664 858,562 1,162,273 1,012,757
All other markets3 3,896,496 5,323,014 7,601,138 9,812,562 10,153,579 15,889,776 17,325,548
Total exports 9,607,543 10,392,468 13,644,608 15,625,970 13,928,826 17,790,265 19,108,509
Total shipments 12,063,635 16,336,623 21,378,674 28,491,035 34,615,322 45,334,744 50,655,959
Ratios and shares (percent)
Capacity utilization 61.9 71.7 78.8 82.9 76.4 83.0 65.0
Inventories/production 8.0 6.3 8.4 6.9 6.8 6.1 5.9
Inventories/total shipments 8.3 6.3 8.7 7.0 7.0 6.1 5.9
Share of shipments: Home market shipments: Internal consumption/ transfers 8.0 12.8 11.8 10.7 10.2 14.0 16.2
Commercial home market Shipments 12.3 23.6 24.4 34.4 49.6 46.8 46.1
Total home market Shipments 20.4 36.4 36.2 45.2 59.8 60.8 62.3
Export shipments to: United States1 10.9 12.9 16.0 12.8 8.4 1.6 1.5
European Union2 36.4 18.1 12.3 7.6 2.5 2.6 2.0
All other markets3 32.3 32.6 35.6 34.4 29.3 35.0 34.2
Total exports 79.6 63.6 63.8 54.8 40.2 39.2 37.7
Total shipments 100.0 100.0 100.0 100.0 100.0 100.0 100.01 Antidumping and countervailing duty orders associated with the CSPV 1 investigations became effective December 7, 2012. Antidumping and countervailing duty orders associated with the CSPV 2 investigations became effective February 18, 2015. 2 European Union country markets include ***. 3 Other markets include ***.
Source: Compiled from data submitted in response to Commission questionnaires.
IV‐52
Home market shipments of CSPV modules (including internal consumption and
commercial home market sales), which accounted for 59.8 percent of total shipments of
modules by the Chinese producers in 2016, increased by 742.3 percent during 2012‐16. Exports
of CSPV modules to the United States, which accounted for 8.4 percent of total shipments by
the Chinese producers in 2016, increased from 1,316,838 kW to 3,655,744 kW between 2012
and 2015, but declined in 2016 to 2,916,685 kW, 121.5 percent higher than that reported for
2012. Firms project that their exports of CSPV modules from China to the United States during
2017 and 2018 will decline. Export markets other than the United States for CSPV modules
produced in China, which accounted for 31.8 percent of the responding Chinese producers’
total shipments in 2016, represented a declining share of total shipments from 2012 to 2016.
Other major export markets identified by producers in China for CSPV modules include
European Union country markets (***) and other markets (***).

IV‐53
Home market
Regarding competition in the home market, twenty‐eight responding producers in China
indicated that they do not compete with imports in the home market; whereas six producers in
China indicated that they do compete with imports in the home market. Five Chinese producers
noted that the trend in home market competition with imports has remained constant, one
indicated that it has increased, and one indicated that it has fluctuated since January 1, 2012.
Explanations for the trends in home market competition in China with imports provided by
Chinese producers include the following:
***: “***.”
***: “***.”
***: “***.”
Export markets
Producers of CSPV products in China were asked to identify export markets other than
the United States that they have developed or where they have increased sales since January 1,
2012. These other major export markets include the following: ***. Chinese producer ***
explained that the “***.” *** noted that, ***. It also noted that “***.” As noted in detail in
Part I of this report, trade barriers exist in the United States and several other countries for
certain CSPV products originating in China.44
44 For further information on trade barriers in third‐country markets, see section titled “Restraints on Exports to, or on Imports into, Third‐Country Markets” in Part I of this report.
IV‐54
According to official export statistics,45 the leading export markets for CSPV products
from China are Japan, India, and the United States, which accounted for 22.6, 21.6, and 11.8
percent, respectively, of the total exports of CSPV products from China during 2016 (table IV‐
23).
45 Official exports statistics under China‐specific HS numbers 8541.40.20 as reported by China's statistical authority in the GTA database, accessed July 14, 2017.

IV‐55
Table IV-23 CSPV products: China exports by destination market, 2012-16
Destination market Calendar year
2012 2013 2014 2015 2016 Value (1,000 dollars) China exports to the United States 1,402,183 1,206,397 1,816,973 1,634,309 1,342,504 China exports to other major destination markets.-- Japan 892,923 2,794,321 4,395,596 3,341,568 2,558,643
India 193,756 510,191 488,652 1,356,333 2,448,109 Netherlands 3,829,267 1,496,753 1,037,245 945,463 576,655 Korea 109,257 234,524 416,780 378,369 357,115 Australia 732,282 427,169 397,404 366,473 354,404 Brazil 2,628 4,465 4,969 34,309 341,121 Pakistan 8,489 56,056 188,939 366,794 328,211 Turkey 6,712 41,974 80,542 256,953 321,683 All other destination markets 5,597,675 3,378,370 3,493,044 4,218,518 2,708,604
Total China exports 12,775,173 10,150,221 12,320,143 12,899,089 11,337,050 Share of value (percent) China exports to the United States 11.0 11.9 14.7 12.7 11.8 China exports to other major destination markets.-- Japan 7.0 27.5 35.7 25.9 22.6
India 1.5 5.0 4.0 10.5 21.6 Netherlands 30.0 14.7 8.4 7.3 5.1 Korea 0.9 2.3 3.4 2.9 3.1 Australia 5.7 4.2 3.2 2.8 3.1 Brazil 0.0 0.0 0.0 0.3 3.0 Pakistan 0.1 0.6 1.5 2.8 2.9 Turkey 0.1 0.4 0.7 2.0 2.8 All other destination markets 43.8 33.3 28.4 32.7 23.9
Total China exports 100.0 100.0 100.0 100.0 100.0 Source: Official exports statistics under China-specific HS number 8541.40.20 as reported by China's statistical authority in the GTA database, accessed July 14, 2017.

IV‐56
India
Overview
The Commission issued foreign producer questionnaires to 113 firms believed to
produce CSPV products in India. Five firms in India responded to the Commission’s
questionnaire with useable information, accounting for approximately *** percent of cell
production capacity and *** percent of module production capacity in India. Table IV‐24 lists
the Indian producers of CSPV cells that responded to the Commission’s questionnaire and
certain summary data reported in those responses.
Table IV-24 CSPV products: Summary data on responding firms in India, January 2012 to December 2016
Firm Production
(kW)
Share of reported
production (percent)
Exports to the United States (kW)
Share of reported exports to the United States
(percent)
Total shipments
(kW)
Share of firm's total
shipments exported
to the United States
(percent) CSPV cells:
Indosolar *** *** *** *** *** ***Renewsys *** *** *** *** *** ***Sonali Energees *** *** *** *** *** ***Sova Solar *** *** *** *** *** ***Udhaya Energy *** *** *** *** *** ***
Total *** *** *** *** *** ***CSPV modules:
Indosolar *** *** *** *** *** ***Renewsys *** *** *** *** *** ***Sonali Energees *** *** *** *** *** ***Sova Solar *** *** *** *** *** ***Udhaya Energy *** *** *** *** *** ***
Total *** *** *** *** *** ***Note.--Foreign producer data on module assembly does not necessarily equate to the country-of-origin classification used for U.S. import statistics. ***.
Source: Compiled from data submitted in response to Commission questionnaires.

IV‐57
Changes in operations
Three of the five responding producers in India reported operational or organizational
changes since January 1, 2012 (table IV‐25).
Table IV-25 CSPV products: Indian producers’ reported changes in operations, since January 1, 2012
Item / Firm Reported changed in operations Plant openings: *** *** Plant closings: *** *** Expansions: *** *** *** *** Acquisitions/mergers/buyouts: *** *** Prolonged shutdowns or curtailments: *** *** Revised labor agreements: *** *** Technology: *** *** Other: *** *** Source: Compiled from data submitted in response to Commission questionnaires.
IV‐58
Anticipated changes in operations
Regarding anticipated changes in the character of their operations relating to CSPV
products, four producers in India reported that they do not anticipate any changes in the
character of their CSPV operations. One firm (***) reported that it anticipates “***.”
Operations on CSPV cells
According to publicly available information, India’s solar cell manufacturing capacity
increased from 848 MW at the end of 2012 to 1,753 MW at the end of 2016.46 Of the 1,753
MW in installed capacity, 1,448 MW was operational at the end of 2016.47 India had 16
producers of CSPV cells at the end of 2016, with an average production capacity of 110 MW.
Capacity at the largest producer was 300 MW.48 The Adani Group, as of the second half of 2016,
was building a 1,200 MW plant that was expected to be commissioned by the end of the year.
The company indicated that it plans to expand this plant to 2,000 MW in 2017.49
Two firms (Indosolar and Renewsys) provided a response to the Commission’s
questionnaire in this proceeding concerning production of CSPV cells in India. Table IV‐26
46 Intersolar, “Status of PV Manufacturing in India,” http://www.intersolar.in/en/news‐press/news/industry‐news/status‐of‐pv‐manufacturing‐in‐india.html (accessed July 13, 2017); Ministry of New & Renewable Energy, National Solar Mission Division, Solar Cell and Module Capacities, January 31, 2017, p. 2, http://mnre.gov.in/file‐manager/UserFiles/information‐sought‐from‐all‐Solar‐Cell‐&‐Module‐manufacturers‐31012017.pdf.
47 Ministry of New & Renewable Energy, National Solar Mission Division, Solar Cell and Module Capacities, January 31, 2017, p. 2, http://mnre.gov.in/file‐manager/UserFiles/information‐sought‐from‐all‐Solar‐Cell‐&‐Module‐manufacturers‐31012017.pdf.
48 Ministry of New & Renewable Energy, National Solar Mission Division, Solar Cell and Module Capacities, January 31, 2017, p. 2, http://mnre.gov.in/file‐manager/UserFiles/information‐sought‐from‐all‐Solar‐Cell‐&‐Module‐manufacturers‐31012017.pdf.
49 The Indian Express, “Adani’s Solar Equipment Mfg Facility May Commence by Year‐end,” The Indian Express, August 30, 2016, http://indianexpress.com/article/business/companies/adanis‐solar‐equipment‐mfg‐facility‐may‐commence‐by‐year‐end‐3004201/.

IV‐59
presents information on the CSPV cell operations of the responding producers/exporters in
India.
Capacity, production, and capacity utilization for CSPV cells produced by the responding
Indian firms generally increased during 2012‐16. Capacity reported by the responding Indian
producers increased by *** percent from 2012 to 2016, whereas production increased by ***
in 2012. Capacity utilization for firms producing CSPV cells in India increased from *** percent
in 2012 to *** percent in 2016. The firms project these upward trends to continue into 2017
and 2018. Inventories of CSPV cells held by producers in India fluctuated during the period of
investigation, although the ratio of inventories to production and shipments reveal steady
declines from 2012 to 2016. Inventories accounted for *** percent of responding Indian
producers’ production and total shipments during 2016.
Home market shipments, all of which were commercial sales, accounted for *** percent
of total shipments by the responding Indian producers in 2016. These home market shipments
in 2016 were *** higher than the level reported in 2012. Conversely, exports of CSPV cells to
the United States, were *** during 2012‐16, with *** shipments reported during 2014‐16.
Responding firms in India reported that they expect exports of CSPV cells to the United States
to increase to *** kW by 2018. Export markets other than the United States for CSPV cells
produced in India accounted for *** percent of the responding Indian producers’ total
shipments in 2016. Other major export markets identified by producers in India for CSPV cells
include ***.

IV‐60
Table IV-26 CSPV cells: Data on the industry in India, 2012-16 and projected 2017-18
Item
Actual experience Projections
Calendar year
2012 2013 2014 2015 2016 2017 2018
Quantity (kW)
Capacity *** *** *** *** *** *** ***
Production *** *** *** *** *** *** ***
End-of-period inventories *** *** *** *** *** *** ***Shipments: Home market shipments: Internal consumption/ transfers *** *** *** *** *** *** ***
Commercial home market shipments *** *** *** *** *** *** ***
Total home market shipments *** *** *** *** *** *** ***
Export shipments to: United States *** *** *** *** *** *** ***
European Union1 *** *** *** *** *** *** ***
All other markets2 *** *** *** *** *** *** ***
Total exports *** *** *** *** *** *** ***
Total shipments *** *** *** *** *** *** ***
Ratios and shares (percent)
Capacity utilization *** *** *** *** *** *** ***
Inventories/production *** *** *** *** *** *** ***
Inventories/total shipments *** *** *** *** *** *** ***Share of shipments: Home market shipments: Internal consumption/ transfers *** *** *** *** *** *** ***
Commercial home market shipments *** *** *** *** *** *** ***
Total home market shipments *** *** *** *** *** *** ***
Export shipments to: United States *** *** *** *** *** *** ***
European Union1 *** *** *** *** *** *** ***
All other markets2 *** *** *** *** *** *** ***
Total exports *** *** *** *** *** *** ***
Total shipments *** *** *** *** *** *** ***1 European Union country markets include ***. 2 Other markets include ***. Source: Compiled from data submitted in response to Commission questionnaires.

IV‐61
Operations on CSPV modules
According to publicly available information, India’s PV module capacity increased from
2,000 MW at the end of 2012 to 6,913 MW at the end of 2016.50 Of this 2016 capacity, 5,287
MW was operational. India had 103 module producers at the end of 2016, with an average
capacity of 67 MW. The three largest plants were 500 MW each.51 The Adani Group was also
planning 1,200 MW of module production by the end of 2016, with plans to expand production
to 2,000 MW in 2017.52
Four firms (Renewsys, Sonali Energees, Sova Solar, and Udhaya Energy) provided a
response to the Commission’s questionnaire in this proceeding concerning production of CSPV
modules in India (table IV‐27).
50 Intersolar, “Status of PV Manufacturing in India,” http://www.intersolar.in/en/news‐press/news/industry‐news/status‐of‐pv‐manufacturing‐in‐india.html (accessed July 13, 2017); Ministry of New & Renewable Energy, National Solar Mission Division, Solar Cell and Module Capacities, January 31, 2017, p. 2, http://mnre.gov.in/file‐manager/UserFiles/information‐sought‐from‐all‐Solar‐Cell‐&‐Module‐manufacturers‐31012017.pdf.
51 Ministry of New & Renewable Energy, National Solar Mission Division, Solar Cell and Module Capacities, January 31, 2017, p. 2, http://mnre.gov.in/file‐manager/UserFiles/information‐sought‐from‐all‐Solar‐Cell‐&‐Module‐manufacturers‐31012017.pdf.
52 The Indian Express, “Adani’s Solar Equipment Mfg Facility May Commence by Year‐end,” The Indian Express, August 30, 2016, http://indianexpress.com/article/business/companies/adanis‐solar‐equipment‐mfg‐facility‐may‐commence‐by‐year‐end‐3004201/.

IV‐62
Table IV-27 CSPV modules: Data on the industry in India, 2012-16 and projected 2017-18
Item
Actual experience Projections
Calendar year
2012 2013 2014 2015 2016 2017 2018
Quantity (kW)
Capacity *** *** *** *** *** *** ***
Production *** *** *** *** *** *** ***
End-of-period inventories *** *** *** *** *** *** ***Shipments: Home market shipments: Internal consumption/ Transfers *** *** *** *** *** *** ***
Commercial home market Shipments *** *** *** *** *** *** ***
Total home market Shipments *** *** *** *** *** *** ***
Export shipments to: United States *** *** *** *** *** *** ***
European Union1 *** *** *** *** *** *** ***
All other markets2 *** *** *** *** *** *** ***
Total exports *** *** *** *** *** *** ***
Total shipments *** *** *** *** *** *** ***
Ratios and shares (percent)
Capacity utilization *** *** *** *** *** *** ***
Inventories/production *** *** *** *** *** *** ***
Inventories/total shipments *** *** *** *** *** *** ***Share of shipments: Home market shipments: Internal consumption/ Transfers *** *** *** *** *** *** ***
Commercial home market Shipments *** *** *** *** *** *** ***
Total home market Shipments *** *** *** *** *** *** ***
Export shipments to: United States *** *** *** *** *** *** ***
European Union1 *** *** *** *** *** *** ***
All other markets2 *** *** *** *** *** *** ***
Total exports *** *** *** *** *** *** ***
Total shipments *** *** *** *** *** *** ***1 European Union country markets include ***. 2 Other markets include ***. Source: Compiled from data submitted in response to Commission questionnaires.

IV‐63
Indian capacity, production, capacity utilization, inventories, and shipments CSPV
modules generally increased during the period. Capacity increased from *** kW in 2012 to ***
kW in 2016 and production increased from *** kW in 2012 to *** kW in 2016. Capacity
utilization for responding firms producing CSPV modules in India increased from *** percent in
2012 to *** percent in 2016. Although inventories of CSPV modules held by the responding
module producers in India increased from *** kW in 2012 to *** kW in 2016, they fluctuated
downward to *** percent of total shipments by 2016. The responding producers project
substantial increases in these indicators in 2017 and 2018.
Home market sales, which accounted for *** percent of total shipments by the Indian
producers in 2016, declined during 2012‐14, but increased substantially in 2015 and 2016.
Conversely, exports of CSPV modules to the United States, which accounted for *** percent of
total shipments of modules by the responding Indian producers in 2016, increased from *** in
2012 and 2013 to *** kW in 2016. These Indian producers project their exports of CSPV
modules to the United States will increase further to *** kW by 2018. Export markets other
than the United States for CSPV modules produced in India by the responding producers
increased between 2012 and 2016, both in absolute quantity and as a share of total shipments.
Exports to markets other than the United States accounted for *** percent of the responding
Indian producers’ total shipments of modules during 2016. Other major export markets
identified by producers in India for CSPV modules include ***.
IV‐64
Home market
According to publicly available information, Indian manufacturers supplied less than 15
percent of the Indian module market during April 2016 to March 2017 (including nonsubject
thin film products). The largest Indian supplier, ***, accounted for 3.3 percent of the market,
and the second largest, ***, accounted for 2.0 percent of the market.53
Regarding competition with imports of CSPV products in their home market, one
producer in India indicated that it does not compete with imports in the home market, whereas
the remaining responding producers in India indicated that they do compete with imports in
the home market. Two firms noted that the trend in home market competition with imports
has decreased, two firms indicated that it has increased, and one noted that it has fluctuated
since January 1, 2012. Comments concerning the trend in home market competition with
imports include the following:
***: “***.”
***: “***.”
***: “***.”
***: “***.”
53 Bridge to India, India Solar Map, March 2017, http://www.bridgetoindia.com/reports/india‐solar‐map‐march‐2017‐edition/.

IV‐65
Export markets
Responding producers of CSPV products in India identified export markets other than
the United States that they have developed or where they have increased sales since January 1,
2012. These other major export markets include the following: ***. There were no trade
barriers identified in this proceeding with respect to certain CSPV products originating in
India.54
According to official exports statistics55 of CSPV products from India, the leading export
market for CSPV products from India is the United Kingdom, which accounted for 47.1 percent
of the total exports of CSPV products from India during 2016 (table IV‐28).
54 For further information on trade barriers in third‐country markets, see section titled “Restraints on Exports to, or on Imports into, Third‐Country Markets” in Part I of this report.
55 Official exports statistics under India‐specific HS number 8541.40.11 as reported by India's statistical authority in the GTA database, accessed July 14, 2017.

IV‐66
Table IV-28 CSPV products: Exports from India, 2012-16
Destination market Calendar year
2012 2013 2014 2015 2016 Value (1,000 dollars) India exports to the United States 5,102 1,324 57,310 10,201 5,358 India exports to other major destination markets.-- United Kingdom 461 36,096 75,485 74,327 53,889
Belgium 766 6,044 6,407 7,737 8,320 Italy 8,927 3,204 4,752 1,830 5,558 Nepal 600 1,310 1,559 1,352 5,047 China 1,993 3,239 497 5,222 4,867 Spain 190 4,555 1,383 2,104 4,217 Canada 512 169 669 1,553 3,632 Germany 10,925 78,949 28,350 2,156 2,918 All other destination markets 73,275 101,939 36,574 27,766 20,530
Total India exports 102,752 236,828 212,986 134,248 114,337 Share of value (percent) India exports to the United States 5.0 0.6 26.9 7.6 4.7 India exports to other major destination markets.-- United Kingdom 0.4 15.2 35.4 55.4 47.1
Belgium 0.7 2.6 3.0 5.8 7.3 Italy 8.7 1.4 2.2 1.4 4.9 Nepal 0.6 0.6 0.7 1.0 4.4 China 1.9 1.4 0.2 3.9 4.3 Spain 0.2 1.9 0.6 1.6 3.7 Canada 0.5 0.1 0.3 1.2 3.2 Germany 10.6 33.3 13.3 1.6 2.6 All other destination markets 71.3 43.0 17.2 20.7 18.0
Total India exports 100.0 100.0 100.0 100.0 100.0 Source: Official exports statistics under India-specific HS number 8541.40.11 as reported by India's statistical authority in the GTA database, accessed July 14, 2017.

IV‐67
Indonesia
Overview
The Commission issued foreign producer questionnaires to one major firm (PT Len
Industri Persero (“Persero”)) that was believed to be a relatively large producer of CSPV
products in Indonesia and otherwise made the questionnaire available on the Commission’s
website for additional firms in Indonesia to download and complete. Persero and two
additional firms in Indonesia (Canadian Solar and Sky Industry) responded to the Commission’s
questionnaire with useable information, accounting for an estimated *** percent of CSPV
capacity in Indonesia.56 Table IV‐29 lists the Indonesian producers of CSPV products that
responded to the Commission’s questionnaire and certain summary data reported in those
responses.
56 Production and capacity data for Indonesia are not readily available and it is difficult to estimate the coverage of total Indonesia production attributable to the responding three firms, but there are believed to be at least five additional manufacturers of CSPV products in Indonesia. The five additional firms include PT Adyawinsa Electrical & Power, PT Surya Utama Putra, PT Swadaya Prima Utama, PT Azet Surya Lestari, and PT Wijaya Karya Inatrade Energi. These five firms and Persero comprise the Indonesian Solar Module Manufacturer Association (“APAMSI”). Firms in the APAMSI are reported to have a combined annual production capacity of 90 mw. Global Business Guide, “Solar Panels in Indonesia: A Bright Future?” July 21, 2014, http://www.gbgindonesia.com/en/main/business_updates/2014/upd_solar_panels_in_indonesia_a_bright_future_.php.

IV‐68
Table IV-29 CSPV products: Summary data on responding firms in Indonesia, January 2012 to December 2016, by product type
Firm Production
(kW)
Share of reported
production (percent)
Exports to the United
States (kW)
Share of reported exports to the United States
(percent)
Total shipments
(kW)
Share of firm's total
shipments exported
to the United States
(percent) CSPV cells:
Canadian Solar *** *** *** *** *** ***Persero *** *** *** *** *** ***Sky Energy *** *** *** *** *** ***
Total *** *** *** *** *** ***CSPV modules:
Canadian Solar *** *** *** *** *** ***Persero *** *** *** *** *** ***Sky Energy *** *** *** *** *** ***
Total *** *** *** *** *** ***Note.--Foreign producer data on module assembly does not necessarily equate to the country-of-origin classification used for U.S. import statistics. ***. Source: Compiled from data submitted in response to Commission questionnaires.
Changes in operations
One producer in Indonesia reported operational and organizational changes since
January 1, 2012 (table IV‐30).
Table IV-30 CSPV products: Indonesian producers’ reported changes in operations, since January 1, 2012
Item/firm Description of change Plant openings: *** *** Source: Compiled from data submitted in response to Commission questionnaires.

IV‐69
Anticipated changes in operations
Regarding anticipated changes in the character of their operations relating to CSPV
products in the future, three responding producers in Indonesia reported that they do not
anticipate any changes in the character of their CSPV operations.
Operations on CSPV cells
The only responding producer of CSPV cells in Indonesia (Sky Energy) reported that it
began production of CSPV cells in 2016 and that its capacity, production, capacity utilization,
and shipments are projected to increase in 2017 compared with 2016 (table IV‐31). The firm’s
capacity utilization for CSPV cells in Indonesia was *** percent in 2016 as it ramped up
capacity. Sky Energy ***. Sky Energy reported that all of its production of cells in Indonesia ***.
The firm indicated that it ***.

IV‐70
Table IV-31 CSPV cells: Data on the industry in Indonesia, 2012-16 and projected 2017-18
Item
Actual experience Projections
Calendar year
2012 2013 2014 2015 2016 2017 2018
Quantity (kW)
Capacity *** *** *** *** *** *** ***
Production *** *** *** *** *** *** ***
End-of-period inventories *** *** *** *** *** *** ***Shipments: Home market: Internal consumption/ transfers *** *** *** *** *** *** *** Commercial shipments *** *** *** *** *** *** *** Subtotal, home market shipments *** *** *** *** *** *** ***
Export shipments to: United States *** *** *** *** *** *** ***
European Union *** *** *** *** *** *** ***
All other markets *** *** *** *** *** *** ***
Total exports *** *** *** *** *** *** ***
Total shipments *** *** *** *** *** *** ***
Ratios and shares (percent)
Capacity utilization *** *** *** *** *** *** ***
Inventories/production *** *** *** *** *** *** ***Inventories/total shipments *** *** *** *** *** *** ***Share of shipments: Home market: Internal consumption/ transfers *** *** *** *** *** *** *** Commercial shipments *** *** *** *** *** *** *** Subtotal, home market shipments *** *** *** *** *** *** ***
Export shipments to: United States *** *** *** *** *** *** ***
European Union *** *** *** *** *** *** ***
All other markets *** *** *** *** *** *** ***
Total exports *** *** *** *** *** *** ***
Total shipments *** *** *** *** *** *** ***Source: Compiled from data submitted in response to Commission questionnaires.

IV‐71
Operations on CSPV modules
Indonesian capacity, production, inventories, and shipments for CSPV module
operations generally increased during 2012‐16 (table IV‐32). Capacity and production were ***
larger, respectively, in 2016 compared with 2012, and the capacity utilization for responding
firms producing CSPV modules in Indonesia ranged from *** percent to *** percent during
2012‐16. Likewise, inventories of CSPV modules increased during the same period. Production,
inventories, and capacity utilization are projected to increase in 2017 and 2018. Home market
sales, which accounted for *** percent of total shipments by the Indonesian producers in 2016,
declined from *** percent in 2012‐14. Exports of CSPV modules to the United States began in
2015 and reached *** kW in 2016, accounting for *** percent of total shipments by the
Indonesian producers in 2016. Export markets other than the United States for CSPV modules
produced in Indonesia accounted for between *** percent and *** percent of the responding
Indonesian producers’ total shipments since 2015. Other major export markets identified by
producers in Indonesia for CSPV modules include ***.

IV‐72
Table IV-32 CSPV modules: Data on the industry in Indonesia, 2012-16 and projected 2017-18
Item
Actual experience Projections
Calendar year
2012 2013 2014 2015 2016 2017 2018
Quantity (kW)
Capacity *** *** *** *** *** *** ***
Production *** *** *** *** *** *** ***
End-of-period inventories *** *** *** *** *** *** ***Shipments: Home market: Internal consumption/ transfers *** *** *** *** *** *** *** Commercial shipments *** *** *** *** *** *** *** Subtotal, home market shipments *** *** *** *** *** *** ***
Export shipments to: United States *** *** *** *** *** *** ***
European Union1 *** *** *** *** *** *** ***
All other markets2 *** *** *** *** *** *** ***
Total exports *** *** *** *** *** *** ***
Total shipments *** *** *** *** *** *** ***
Ratios and shares (percent)
Capacity utilization *** *** *** *** *** *** ***
Inventories/production *** *** *** *** *** *** ***Inventories/total shipments *** *** *** *** *** *** ***Share of shipments: Home market: Internal consumption/ transfers *** *** *** *** *** *** *** Commercial shipments *** *** *** *** *** *** *** Subtotal, home market shipments *** *** *** *** *** *** ***
Export shipments to: United States *** *** *** *** *** *** ***
European Union1 *** *** *** *** *** *** ***
All other markets2 *** *** *** *** *** *** ***
Total exports *** *** *** *** *** *** ***
Total shipments *** *** *** *** *** *** ***1 European Union country markets include ***. 2 Other markets include ***. Source: Compiled from data submitted in response to Commission questionnaires.
IV‐73
Home market
Regarding competition with imports of CSPV products in their home market, two
producers in Indonesia indicated that they do not compete with imports in the home market.
The one producer in Indonesia that indicated that it competes with imports in the home market
noted that the trend in home market competition with imports has increased since January 1,
2012.
Export markets
Responding producers of CSPV products in Indonesia identified export markets other
than the United States that they have developed or where they have increased sales since
January 1, 2012. These other major export markets include the following: ***. There were no
trade barriers identified in this proceeding with respect to certain CSPV products originating in
Indonesia.57
According to official exports statistics,58 the leading export markets for CSPV products
from Indonesia are the United States and Canada (table IV‐33). During 2016, the United States
was the top export market for CSPV products from Indonesia, accounting for 66.6 percent,
followed by Canada, accounting for 14.8 percent of total Indonesian exports.
57 For further information on trade barriers in third‐country markets, see section titled “Restraints on Exports to, or on Imports into, Third‐Country Markets” in Part I of this report.
58 Official exports statistics under Indonesia‐specific HS numbers 8541.40.2100 and 8541.40.2200 as reported by Indonesia's statistical authority in the GTA database, accessed July 14, 2017.
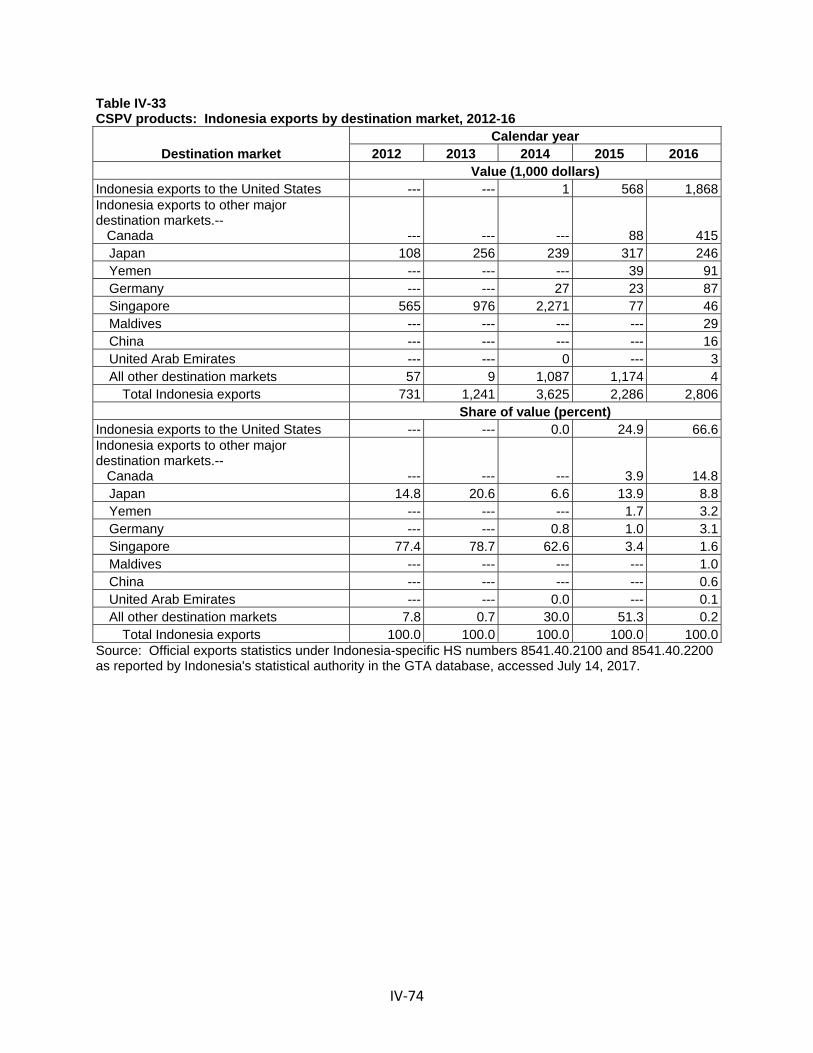
IV‐74
Table IV-33 CSPV products: Indonesia exports by destination market, 2012-16
Destination market Calendar year
2012 2013 2014 2015 2016 Value (1,000 dollars) Indonesia exports to the United States --- --- 1 568 1,868 Indonesia exports to other major destination markets.-- Canada --- --- --- 88 415
Japan 108 256 239 317 246 Yemen --- --- --- 39 91 Germany --- --- 27 23 87 Singapore 565 976 2,271 77 46 Maldives --- --- --- --- 29 China --- --- --- --- 16 United Arab Emirates --- --- 0 --- 3 All other destination markets 57 9 1,087 1,174 4
Total Indonesia exports 731 1,241 3,625 2,286 2,806 Share of value (percent) Indonesia exports to the United States --- --- 0.0 24.9 66.6 Indonesia exports to other major destination markets.-- Canada --- --- --- 3.9 14.8
Japan 14.8 20.6 6.6 13.9 8.8 Yemen --- --- --- 1.7 3.2 Germany --- --- 0.8 1.0 3.1 Singapore 77.4 78.7 62.6 3.4 1.6 Maldives --- --- --- --- 1.0 China --- --- --- --- 0.6 United Arab Emirates --- --- 0.0 --- 0.1 All other destination markets 7.8 0.7 30.0 51.3 0.2
Total Indonesia exports 100.0 100.0 100.0 100.0 100.0 Source: Official exports statistics under Indonesia-specific HS numbers 8541.40.2100 and 8541.40.2200 as reported by Indonesia's statistical authority in the GTA database, accessed July 14, 2017.

IV‐75
Japan
Market
According to publicly available information, approximately 12 firms manufactured CSPV
cells and/or modules in Japan in 2015, the largest of which was Kyocera. Shipments of all CSPV
cells by the industry in Japan declined by 20 percent during 2014‐16 to 1.5 GW. Multicrystalline
cells represented 56 percent of these shipments in 2014, growing to 65 percent in 2016 (table
IV‐34). During the same period, shipments of CSPV modules by the industry in Japan fell by 38
percent to 1.7 GW (table IV‐35). Monocrystalline modules accounted for the larger share of the
industry’s shipments until 2016, when multicrystalline modules gained the larger share.
Exports of cells from Japan, on the other hand, grew by 161 percent to nearly 250 MW
during 2014‐16, whereas exports of modules declined by 42 percent during the period to 58
MW.59 The share of total shipments for the industry in Japan represented by exports of cells
rose over the period, from 5 percent in 2014 to 17 percent in 2016. Exports of modules,
however, accounted for a more stable share of total shipments for the industry in Japan during
the period, ranging between 3 and 4 percent.
59 Export data presented for Japan are from the Japan Photovoltaic Energy Association. Export data compiled by the GTA for Japan are not presented in this report because data specific to PV products are not available.
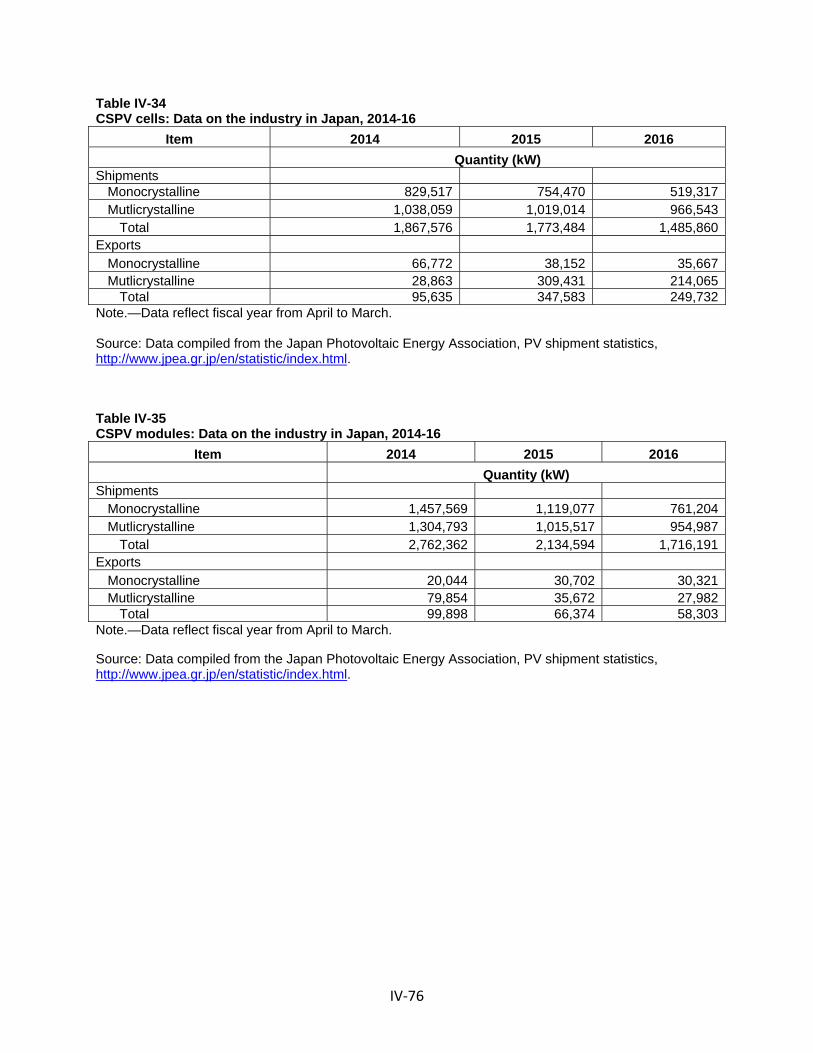
IV‐76
Table IV-34 CSPV cells: Data on the industry in Japan, 2014-16
Item 2014 2015 2016
Quantity (kW) Shipments
Monocrystalline 829,517 754,470 519,317Mutlicrystalline 1,038,059 1,019,014 966,543
Total 1,867,576 1,773,484 1,485,860Exports
Monocrystalline 66,772 38,152 35,667Mutlicrystalline 28,863 309,431 214,065
Total 95,635 347,583 249,732Note.—Data reflect fiscal year from April to March. Source: Data compiled from the Japan Photovoltaic Energy Association, PV shipment statistics, http://www.jpea.gr.jp/en/statistic/index.html. Table IV-35 CSPV modules: Data on the industry in Japan, 2014-16
Item 2014 2015 2016
Quantity (kW) Shipments
Monocrystalline 1,457,569 1,119,077 761,204Mutlicrystalline 1,304,793 1,015,517 954,987
Total 2,762,362 2,134,594 1,716,191Exports
Monocrystalline 20,044 30,702 30,321Mutlicrystalline 79,854 35,672 27,982
Total 99,898 66,374 58,303Note.—Data reflect fiscal year from April to March. Source: Data compiled from the Japan Photovoltaic Energy Association, PV shipment statistics, http://www.jpea.gr.jp/en/statistic/index.html.

IV‐77
During the period of investigation, several companies reported changes in operations.
New entrants to CSPV manufacturing include Denka Shinki and INFINI (Japan Solar), which
started operating new PV module factories in 2015.60 E‐Solar KK opened an 80 MW CSPV
module plant in Matsuyama in 2015.61 Its Taiwan parent company, Eversol Corporation, is a
leading producer of wafers, which E‐Solar indicates helps to cut costs.62 Kyocera added 200 MW
of capacity to its Yasu CSPV cell manufacturing plant in 2013. The firm also added 200 MW of
capacity to its Shiga Prefecture cell manufacturing facility in 2012.63
Overview of data collection
The Commission issued foreign producer questionnaires to 25 firms believed to produce
CSPV products in Japan and otherwise made the questionnaire available on the Commission
website for additional firms in Japan to download and complete. One firm in Japan responded
to the Commission’s questionnaire with useable information, accounting for approximately ***
percent of total CSPV cell production and *** percent of total CSPV module production in Japan
in 2016. Table IV‐36 presents the Japanese producer of CSPV products that responded to the
Commission’s questionnaire and certain summary data reported in that response.
60 National Survey Report of PV Power Applications in Japan 2015, http://www.iea‐pvps.org/?id=93. 61 Bloomberg New Energy Finance database, https://about.bnef.com/, accessed April 27, 2017. 62 About E‐Solar, E‐Solar company website, http://www.esolar.co.jp/corp_en.html#corp, accessed
July 13, 2017. 63 Bloomberg New Energy Finance database, https://about.bnef.com/, accessed April 27, 2017.

IV‐78
Table IV-36 CSPV products: Summary data on firm in Japan, January 2012 through December 2016, by product type
Firm Production
(kW)
Share of reported
production (percent)
Exports to the United States (kW)
Share of reported exports to the United States
(percent)
Total shipments
(kW)
Share of firm's total
shipments exported
to the United States
(percent)CSPV cells: Kyocera (Japan) *** *** *** *** *** ***Total *** *** *** *** *** ***CSPV modules: Kyocera (Japan) *** *** *** *** *** ***Total *** *** *** *** *** ***Note.--Foreign producer data on module assembly does not necessarily equate to the country-of-origin classification used for U.S. import statistics. Source: Compiled from data submitted in response to Commission questionnaires.
Changes in operations
The producer in Japan reported operational or organizational changes since January 1,
2012 (table IV‐37).
Table IV-37 CSPV products: Reported changes in operations by the producer in Japan since January 1, 2012
Item/Firm Description of change Plant closings: *** *** Source: Compiled from data submitted in response to Commission questionnaires.
Anticipated changes in operations
Kyocera reported that it *** changes in the future concerning the character of its
operations in Japan relating to CSPV products.

IV‐79
Operations on CSPV cells
Based on questionnaire data from the one responding producer in Japan (Kyocera),
production, capacity utilization, and shipments generally increased from 2012 to 2015, but fell
somewhat in 2016 (table IV‐38). Production and shipments increased overall by *** percent
from 2012 to 2016 and the capacity utilization for the firm producing CSPV cells in Japan ranged
from *** percent to *** percent during 2012‐16.64 Kyocera (Japan) reported that ***.65 The
firm projects an overall decrease in CSPV cell production and shipments in 2017 and 2018.
64 Kyocera (Japan) incorrectly reported ***. 65 Staff requested that Kyocera (Japan) confirm that ***.

IV‐80
Table IV-38 CSPV cells: Data on the industry in Japan, 2012-16 and projected 2017-18
Item
Actual experience Projections
Calendar year
2012 2013 2014 2015 2016 2017 2018
Quantity (kW)
Capacity1 *** *** *** *** *** *** ***
Production *** *** *** *** *** *** ***
End-of-period inventories *** *** *** *** *** *** ***Shipments: Home market: Internal consumption/ transfers2 *** *** *** *** *** *** *** Commercial shipments *** *** *** *** *** *** *** Subtotal, home market shipments *** *** *** *** *** *** ***
Export shipments to: United States *** *** *** *** *** *** ***
European Union *** *** *** *** *** *** ***
All other markets *** *** *** *** *** *** ***
Total exports *** *** *** *** *** *** ***
Total shipments *** *** *** *** *** *** ***
Ratios and shares (percent)
Capacity utilization1 *** *** *** *** *** *** ***
Inventories/production *** *** *** *** *** *** ***
Inventories/total shipments *** *** *** *** *** *** ***Share of shipments: Home market: Internal consumption/transfers2 *** *** *** *** *** *** *** Commercial shipments *** *** *** *** *** *** *** Subtotal, home market shipments *** *** *** *** *** *** ***
Export shipments to: United States *** *** *** *** *** *** ***
European Union *** *** *** *** *** *** ***
All other markets *** *** *** *** *** *** ***
Total exports *** *** *** *** *** *** ***
Total shipments *** *** *** *** *** *** ***1 Kyocera (Japan) incorrectly reported ***. 2 Staff notes that the firm’s reported home market internal consumption/transfers of cells ***. Source: Compiled from data submitted in response to Commission questionnaires.
IV‐81
Operations on CSPV modules
According to questionnaire data, production of CSPV modules by Kyocera in Japan
increased by *** percent from *** kW in 2012 to *** kW in 2014, before falling to *** kW in
2016. Capacity utilization for the firm producing CSPV modules in Japan ranged from ***
percent to *** percent during 2012‐16 (table IV‐39).66 Inventories of CSPV modules increased
from *** kW in 2012 to *** kW in 2014, but declined thereafter to a level in 2016 that was ***
percent higher than reported in 2012. The ratio of inventories to total shipments was ***
percent in 2016 compared with *** percent in 2012. Home market sales accounted for ***
percent of Kyocera’s total shipments in Japan during 2016, whereas exports of CSPV modules to
markets in the European Union accounted for the remaining *** percent of total shipments.
*** exports of CSPV modules to the United States were reported by Kyocera (Japan) during
2012‐16, the firm projected that exports to the United States will account for *** percent of its
total shipments of CSPV modules by 2018.
66 Kyocera (Japan) incorrectly reported ***.

IV‐82
Table IV-39 CSPV modules: Data on the industry in Japan, 2012-16 and projected 2017-18
Item
Actual experience Projections
Calendar year
2012 2013 2014 2015 2016 2017 2018
Quantity (kW)
Capacity1 *** *** *** *** *** *** ***
Production *** *** *** *** *** *** ***
End-of-period inventories *** *** *** *** *** *** ***Shipments: Home market: Internal consumption/ transfers *** *** *** *** *** *** *** Commercial Shipments *** *** *** *** *** *** *** Subtotal, home market shipments *** *** *** *** *** *** ***
Export shipments to: United States *** *** *** *** *** *** ***
European Union *** *** *** *** *** *** ***
All other markets *** *** *** *** *** *** ***
Total exports *** *** *** *** *** *** ***
Total shipments *** *** *** *** *** *** ***
Ratios and shares (percent)
Capacity utilization1 *** *** *** *** *** *** ***
Inventories/production *** *** *** *** *** *** ***Inventories/total shipments *** *** *** *** *** *** ***Share of shipments: Home market: Internal consumption/ transfers *** *** *** *** *** *** *** Commercial Shipments *** *** *** *** *** *** *** Subtotal, home market shipments *** *** *** *** *** *** ***
Export shipments to: United States *** *** *** *** *** *** ***
European Union *** *** *** *** *** *** ***
All other markets *** *** *** *** *** *** ***
Total exports *** *** *** *** *** *** ***
Total shipments *** *** *** *** *** *** ***1 Kyocera (Japan) incorrectly reported ***.
Source: Compiled from data submitted in response to Commission questionnaires.

IV‐83
Home market
Regarding competition with imports of CSPV products in its home market, the producer
in Japan, which reported *** of its shipments were to the home market during the period of
investigation, indicated that it does not compete with imports in the home market.
Export markets
The producer of CSPV products in Japan indicated that it has not developed any export
markets other than the United States since January 1, 2012. There were no trade barriers
identified in this proceeding with respect to certain CSPV products originating in Japan.67 Export
data compiled by GTA for Japan are not presented in this report because the PV‐specific data
do not appear to accurately capture exports of PV products.
67 For further information on trade barriers in third‐country markets, see section titled “Restraints on Exports to, or on Imports into, Third‐Country Markets” in Part I of this report.

IV‐84
Korea
Overview
The Commission issued foreign producer questionnaires to 27 firms believed to produce
CSPV products in Korea. Four firms in Korea responded to the Commission’s questionnaire with
useable information, accounting for approximately *** percent of cell production capacity and
*** percent of module production capacity in Korea in 2016. Table IV‐40 lists the Korean
producers of CSPV products that responded to the Commission’s questionnaire and certain
summary data reported in those responses.

IV‐85
Table IV-40 CSPV products: Summary data on responding firms in Korea, January 2012 to December 2016, by product type
Firm Production
(kW)
Share of reported
production (percent)
Exports to the United
States (kW)
Share of reported exports to the United States
(percent)
Total shipments
(kW)
Share of firm's total
shipments exported
to the United States
(percent) CSPV cells:
DCT *** *** *** *** *** ***Hanwha *** *** *** *** *** ***HHI Green *** *** *** *** *** ***LG Electronics *** *** *** *** *** ***
Total *** *** *** *** *** ***CSPV modules:
DCT *** *** *** *** *** ***Hanwha *** *** *** *** *** ***HHI Green *** *** *** *** *** ***LG Electronics *** *** *** *** *** ***
Total *** *** *** *** *** ***Note.--Foreign producer data on module assembly does not necessarily equate to the country-of-origin classification used for U.S. import statistics. Responding Korean module assemblers indicated that ***. Source: Compiled from data submitted in response to Commission questionnaires.

IV‐86
Changes in operations
Four producers in Korea reported operational or organizational changes since January 1,
2012 (table IV‐41).
Table IV-41 CSPV products: Korean producers’ reported changes in operations, since January 1, 2012
Item/Firm Description of change Plant openings: *** *** *** *** Expansions: *** *** Acquisitions/mergers/buyouts: *** *** Technology: *** *** *** *** *** *** Other: *** *** Source: Compiled from data submitted in response to Commission questionnaires.

IV‐87
Anticipated changes in operations
Regarding anticipated changes in the character of their operations relating to CSPV
products in the future, three producers in Korea reported that they do not anticipate any
changes in the character of their CSPV operations. One firm reported the following details
concerning anticipated changes (table IV‐42).
Table IV-42 CSPV products: Korean producers’ anticipated changes in operations
Firm Details concerning anticipated changes *** *** Source: Compiled from data submitted in response to Commission questionnaires.
Operations on CSPV cells
Reported Korean capacity, production, capacity utilization, inventories, and shipments
generally increased from 2012 to 2016 (table IV‐43). Capacity and production were *** and ***
times larger, respectively, in 2016 compared with 2012, and the capacity utilization for firms
producing CSPV cells in Korea ranged from *** percent to *** percent during 2012‐16.
Reported inventories of CSPV cells were *** larger in 2016 compared with 2012. Responding
firms project capacity and production to increase by *** percent and *** percent, respectively,
and product inventory to remain constant.

IV‐88
Table IV-43 CSPV cells: Data on the industry in Korea, 2012-16 and projected 2017-18
Item
Actual experience Projections
Calendar year
2012 2013 2014 2015 2016 2017 2018
Quantity (kW)
Capacity *** *** *** *** *** *** ***
Production *** *** *** *** *** *** ***End-of-period inventories *** *** *** *** *** *** ***Shipments: Home market: Internal consumption/ transfers *** *** *** *** *** *** *** Commercial shipments *** *** *** *** *** *** *** Subtotal, home market shipments *** *** *** *** *** *** ***
Export shipments to: United States *** *** *** *** *** *** ***
European Union1 *** *** *** *** *** *** ***
All other markets2 *** *** *** *** *** *** ***
Total exports *** *** *** *** *** *** ***
Total shipments *** *** *** *** *** *** ***
Ratios and shares (percent)
Capacity utilization *** *** *** *** *** *** ***
Inventories/production *** *** *** *** *** *** ***Inventories/total shipments *** *** *** *** *** *** ***Share of shipments: Home market: Internal consumption/ transfers *** *** *** *** *** *** *** Commercial shipments *** *** *** *** *** *** *** Subtotal, home market shipments *** *** *** *** *** *** ***
Export shipments to: United States *** *** *** *** *** *** ***
European Union1 *** *** *** *** *** *** ***
All other markets2 *** *** *** *** *** *** ***
Total exports *** *** *** *** *** *** ***
Total shipments *** *** *** *** *** *** ***1 European Union country markets include ***. 2 Other markets include ***. Source: Compiled from data submitted in response to Commission questionnaires.

IV‐89
Home market sales, which accounted for *** percent of total shipments by the
responding Korean cell producers in 2016, remained relatively stable from 2012 to 2016.
Exports of CSPV cells to the United States were *** percent of total shipments in 2016. Export
markets other than the United States68 for CSPV cells produced in Korea accounted for between
*** percent and *** percent of the responding Korean producers’ total shipments since 2012.
Other major export markets identified by producers in Korea for CSPV cells include ***.
Operations on CSPV modules
Reported Korean capacity, production, inventories, and shipments generally increased
from 2012 to 2016 (table IV‐44). Capacity and production were *** and *** times larger,
respectively, in 2016 compared with 2012, and the capacity utilization for firms producing CSPV
modules in Korea ranged from *** to *** percent during 2012‐16. Inventories of CSPV modules
were *** higher in 2016 compared with 2012. Reporting firms project capacity, production,
capacity utilization, inventories, and shipments to increase in 2017 and 2018. Home market
sales, which accounted for *** percent of total shipments by the Korean producers in 2016, are
at their lowest share since 2012. Conversely, exports of CSPV modules to the United States,
which accounted for *** percent of total shipments by the Korean producers in 2016,
increased ten‐fold, from *** kW to *** kW during the period. Export markets other than the
United States for CSPV modules produced in Korea accounted for between *** percent and ***
percent of the responding Korean producers’ total shipments since 2012. Other major export
markets identified by responding producers in Korea for CSPV modules include ***.
68 Exports of Korean CSPV cells to U.S. *** percent of total exports in 2016.

IV‐90
Table IV-44 CSPV modules: Data on the industry in Korea, 2012-16 and projected 2017-18
Item
Actual experience Projections
Calendar year
2012 2013 2014 2015 2016 2017 2018
Quantity (kW)
Capacity *** *** *** *** *** *** ***
Production *** *** *** *** *** *** ***
End-of-period inventories *** *** *** *** *** *** ***Shipments: Home market: Internal consumption/ transfers *** *** *** *** *** *** *** Commercial shipments *** *** *** *** *** *** *** Subtotal, home market shipments *** *** *** *** *** *** ***
Export shipments to: United States *** *** *** *** *** *** ***
European Union1 *** *** *** *** *** *** ***
All other markets2 *** *** *** *** *** *** ***
Total exports *** *** *** *** *** *** ***
Total shipments *** *** *** *** *** *** ***
Ratios and shares (percent)
Capacity utilization *** *** *** *** *** *** ***
Inventories/production *** *** *** *** *** *** ***
Inventories/total shipments *** *** *** *** *** *** ***Share of shipments: Home market: Internal consumption/ transfers *** *** *** *** *** *** *** Commercial shipments *** *** *** *** *** *** *** Subtotal, home market shipments *** *** *** *** *** *** ***
Export shipments to: United States *** *** *** *** *** *** ***
European Union1 *** *** *** *** *** *** ***
All other markets2 *** *** *** *** *** *** ***
Total exports *** *** *** *** *** *** ***
Total shipments *** *** *** *** *** *** ***1 European Union country markets include ***. 2 Other markets include ***. Source: Compiled from data submitted in response to Commission questionnaires.

IV‐91
Home market
Regarding competition with imports of CSPV products in their home market, two
producers in Korea indicated that they do not compete with imports in the home market. One
producer in Korea that indicated that it competes with imports in the home market noted that
the trend in home market competition with imports has remained constant since January 1,
2012, while the fourth producer in Korea that indicated that it competes with imports in the
home market but noted a decrease in competition.
Export markets
Producers of CSPV products in Korea identified export markets other than the United
States that they have developed or where they have increased sales since January 1, 2012
including: ***. There were no trade barriers identified in this proceeding with respect to certain
CSPV products originating in Korea.69
According to official exports statistics,70 the leading export markets for CSPV products
from Korea are the United States and Japan (table IV‐45). During 2016, the United States was
the top export market for CSPV products from Korea, accounting for 67.9 percent, followed by
Japan, accounting for 12.3 percent of total exports from Korea.
69 For further information on trade barriers in third‐country markets, see section titled “Restraints on Exports to, or on Imports into, Third‐Country Markets” in Part I of this report.
70 Official exports statistics under Korea‐specific HS numbers 8541.40.9010 and 8541.40.9020 as reported by Korea's statistical authority in the GTA database, accessed July 14, 2017.

IV‐92
Table IV-45 CSPV products: Korea exports by destination market, 2012-16
Destination market Calendar year
2012 2013 2014 2015 2016 Value (1,000 dollars) Korea exports to the United States 299,274 134,495 238,900 634,051 1,288,914 Korea exports to other major destination markets.-- Japan 133,827 503,062 384,736 323,211 234,338
Malaysia 10,724 5,830 20,101 61,512 76,880 Netherlands 1,430 49,285 88,490 59,112 68,876 Germany 119,037 58,273 49,233 15,109 56,941 China 16,860 40,969 22,160 29,887 31,555 Thailand 6,474 2,993 3,211 3,398 21,673 Hong Kong 12,165 12,667 20,103 17,586 19,242 Australia 19,031 11,271 15,110 11,543 18,014 All other destination markets 129,411 87,795 132,177 167,690 81,091
Total Korea exports 748,233 906,640 974,222 1,323,097 1,897,523 Share of value (percent) Korea exports to the United States 40.0 14.8 24.5 47.9 67.9 Korea exports to other major destination markets.-- Japan 17.9 55.5 39.5 24.4 12.3
Malaysia 1.4 0.6 2.1 4.6 4.1 Netherlands 0.2 5.4 9.1 4.5 3.6 Germany 15.9 6.4 5.1 1.1 3.0 China 2.3 4.5 2.3 2.3 1.7 Thailand 0.9 0.3 0.3 0.3 1.1 Hong Kong 1.6 1.4 2.1 1.3 1.0 Australia 2.5 1.2 1.6 0.9 0.9 All other destination markets 17.3 9.7 13.6 12.7 4.3
Total Korea exports 100.0 100.0 100.0 100.0 100.0 Source: Official exports statistics under Korea-specific HS numbers 8541.40.9010 and 8541.40.9020 as reported by Korea's statistical authority in the GTA database, accessed July 14, 2017.

IV‐93
Malaysia
Overview
The Commission issued foreign producer questionnaires to 19 firms believed to produce
CSPV products in Malaysia. Ten firms in Malaysia responded to the Commission’s questionnaire
with useable information, accounting for all known cell capacity and 93 percent of module
capacity in 2015 in Malaysia.71 Table IV‐46 lists the Malaysian producers of CSPV products that
responded to the Commission’s questionnaire and certain summary data reported in those
responses.
71 An eleventh firm in Malaysia (Canadian Solar (Malaysia)) provided a questionnaire response with data concerning exports from Malaysia; ***.

IV‐94
Table IV-46 CSPV products: Summary data on responding firms in Malaysia, January 2012 to December 2016, by product type
Firm Production
(kW)
Share of reported
production (percent)
Exports to the United
States (kW)
Share of reported
exports to the U.S. (percent)
Total shipments
(kW)
Share of firm's total shipments exported to the U.S. (percent)
CSPV cells: First Solar *** *** *** *** *** ***Flextronics *** *** *** *** *** ***Hanwha *** *** *** *** *** ***JA Solar *** *** *** *** *** ***Jinko Solar *** *** *** *** *** ***Longi Kuching1 *** *** *** *** *** ***Panasonic *** *** *** *** *** ***Promelight *** *** *** *** *** ***SunPower Solar *** *** *** *** *** ***TS Solartech *** *** *** *** *** ***
Total *** *** *** *** *** ***CSPV modules:
First Solar *** *** *** *** *** ***Flextronics *** *** *** *** *** ***Hanwha *** *** *** *** *** ***JA Solar *** *** *** *** *** ***Jinko Solar *** *** *** *** *** ***Longi Kuching1 *** *** *** *** *** ***Panasonic *** *** *** *** *** ***Promelight *** *** *** *** *** ***SunPower Solar *** *** *** *** *** ***TS Solartech *** *** *** *** *** ***
Total *** *** *** *** *** ***1 ***.
Source: Compiled from data submitted in response to Commission questionnaires.
IV‐95
Changes in operations
Ten producers and one exporter in Malaysia reported operational or organizational
changes since January 1, 2012 (table IV‐43).
Table IV-47 CSPV products: Malaysian producers’/exporters’ reported changes in operations, since January 1, 2012
Item / Firm Reported changed in operations Plant openings: *** *** *** *** *** *** *** *** *** *** *** *** Plant closings: *** *** Expansions: *** *** *** *** *** *** *** *** *** *** *** *** Acquisitions/mergers/buyouts: *** *** *** *** *** *** Table continued on following page.

IV‐96
Table IV-47—Continued CSPV products: Malaysian producers’/exporters’ reported changes in operations, since January 1, 2012
Item / Firm Reported changed in operations Prolonged shutdowns or curtailments: *** *** *** *** Technology: *** *** Other: *** *** *** *** Source: Compiled from data submitted in response to Commission questionnaires.
Anticipated changes in operations
The Commission also asked Malaysian producers to report anticipated changes in the
character of their operations relating to CSPV products in the future. Eight firms in Malaysia
reported that they do not anticipate any changes in the character of their CSPV operations,
whereas three firms anticipated changes (table IV‐48).
Table IV-48 CSPV products: Malaysian producers’ anticipated changes in operations
Firm Details concerning anticipated changes *** *** *** *** *** *** Source: Compiled from data submitted in response to Commission questionnaires.

IV‐97
Operations on CSPV cells
Based on questionnaire responses, capacity, production, capacity utilization,
inventories, and shipments of the industry in Malaysia increased from 2012 to 2016 (table IV‐
49). Capacity and production increased by *** and *** percent, respectively, from 2012 to
2016, and the capacity utilization for firms producing CSPV cells in Malaysia fluctuated upward
from *** percent in 2012 to *** percent in 2016. Future increases are projected for these
indicators in 2017 and 2018.
Home market sales, which accounted for *** percent of total shipments by the
Malaysian producers in 2016, increased from *** kW in 2012 to *** kW in 2016. Exports of
CSPV cells to the United States were non‐existent until 2016, when *** kW were exported to
the United States, and are expected to increase further in 2017 and 2018. Export markets other
than the United States for CSPV cells produced in Malaysia accounted for *** percent of the
responding Malaysian producers’ total shipments in 2016. Other major export markets
identified by producers in Malaysia for CSPV cells include ***.

IV‐98
Table IV-49 CSPV cells: Data on the industry in Malaysia, 2012-16 and projected 2017-18
Item
Actual experience Projections
Calendar year
2012 2013 2014 2015 2016 2017 2018
Quantity (kW)
Capacity *** *** *** *** *** *** ***
Production *** *** *** *** *** *** ***
End-of-period inventories *** *** *** *** *** *** ***Shipments: Home market: Internal consumption/ transfers *** *** *** *** *** *** *** Commercial shipments *** *** *** *** *** *** *** Subtotal, home market shipments *** *** *** *** *** *** ***
Export shipments to: United States *** *** *** *** *** *** ***
European Union1 *** *** *** *** *** *** ***
All other markets2 *** *** *** *** *** *** ***
Total exports *** *** *** *** *** *** ***
Total shipments *** *** *** *** *** *** ***
Ratios and shares (percent)
Capacity utilization *** *** *** *** *** *** ***
Inventories/production *** *** *** *** *** *** ***
Inventories/total shipments *** *** *** *** *** *** ***Share of shipments: Home market: Internal consumption/ transfers *** *** *** *** *** *** *** Commercial shipments *** *** *** *** *** *** *** Subtotal, home market shipments *** *** *** *** *** *** ***
Export shipments to: United States *** *** *** *** *** *** ***
European Union1 *** *** *** *** *** *** ***
All other markets2 *** *** *** *** *** *** ***
Total exports *** *** *** *** *** *** ***
Total shipments *** *** *** *** *** *** ***1 European Union country markets include ***. 2 Other markets include ***. Source: Compiled from data submitted in response to Commission questionnaires.

IV‐99
Operations on CSPV modules
Based on questionnaire responses, capacity, production, capacity utilization,
inventories, and shipments of the industry in Malaysia increased from 2012 to 2016 (table IV‐
50). Capacity and production in 2016 were *** higher than reported in 2012, respectively.
Capacity utilization for firms producing CSPV modules in Malaysia ranged from a low of ***
percent in 2012 to a high of *** percent during 2014. Inventories of CSPV modules increased
during 2012‐16 to a level in 2016 that was *** higher than the level reported in 2012.
Home market sales, which accounted for *** percent of total shipments by the
Malaysian producers in 2016, increased from *** in 2012 to *** kW in 2016. Future increases
in 2017 and 2018 are expected by the firms. Exports of CSPV modules to the United States,
which accounted for *** percent of total shipments by the Malaysian producers in 2016,
increased to *** kW. Export markets other than the United States for CSPV modules produced
in Malaysia accounted for *** percent of the total shipments in 2016. Other major export
markets identified by producers in Malaysia for CSPV modules include ***.
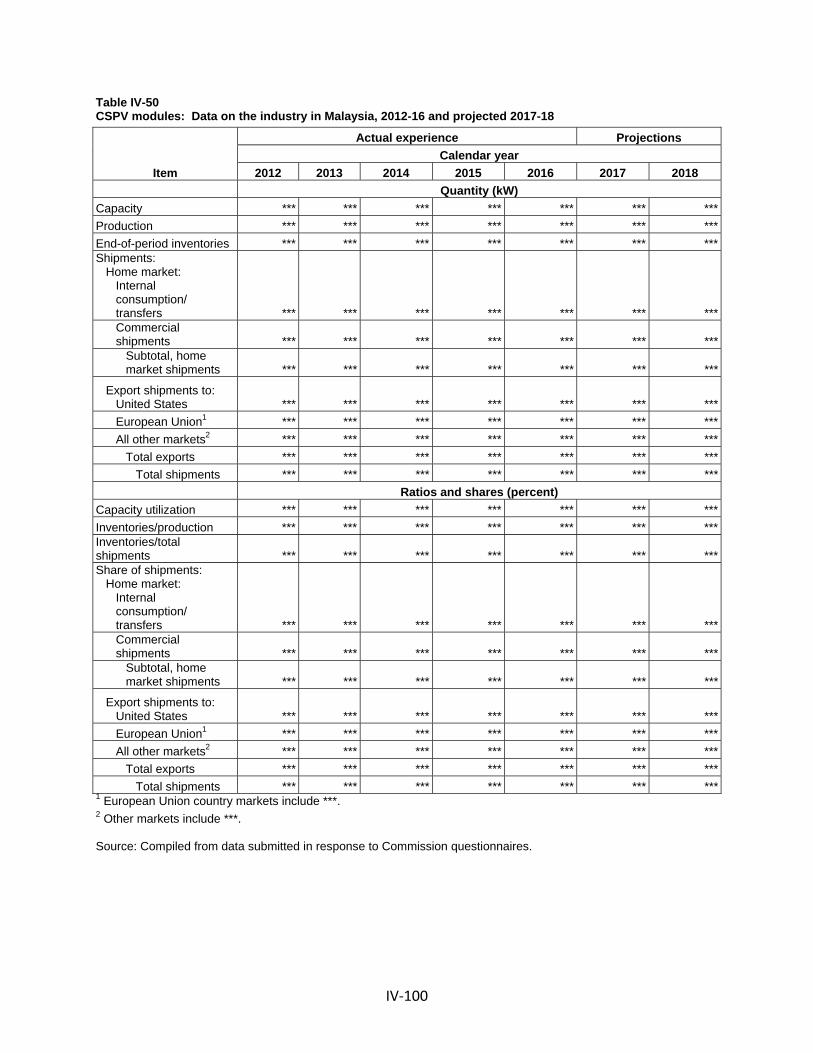
IV‐100
Table IV-50 CSPV modules: Data on the industry in Malaysia, 2012-16 and projected 2017-18
Item
Actual experience Projections
Calendar year
2012 2013 2014 2015 2016 2017 2018
Quantity (kW)
Capacity *** *** *** *** *** *** ***
Production *** *** *** *** *** *** ***
End-of-period inventories *** *** *** *** *** *** ***Shipments: Home market: Internal consumption/ transfers *** *** *** *** *** *** *** Commercial shipments *** *** *** *** *** *** *** Subtotal, home market shipments *** *** *** *** *** *** ***
Export shipments to: United States *** *** *** *** *** *** ***
European Union1 *** *** *** *** *** *** ***
All other markets2 *** *** *** *** *** *** ***
Total exports *** *** *** *** *** *** ***
Total shipments *** *** *** *** *** *** ***
Ratios and shares (percent)
Capacity utilization *** *** *** *** *** *** ***
Inventories/production *** *** *** *** *** *** ***Inventories/total shipments *** *** *** *** *** *** ***Share of shipments: Home market: Internal consumption/ transfers *** *** *** *** *** *** *** Commercial shipments *** *** *** *** *** *** *** Subtotal, home market shipments *** *** *** *** *** *** ***
Export shipments to: United States *** *** *** *** *** *** ***
European Union1 *** *** *** *** *** *** ***
All other markets2 *** *** *** *** *** *** ***
Total exports *** *** *** *** *** *** ***
Total shipments *** *** *** *** *** *** ***1 European Union country markets include ***. 2 Other markets include ***. Source: Compiled from data submitted in response to Commission questionnaires.

IV‐101
Home market
Regarding competition with imports of CSPV products in their home market, seven firms
in Malaysia indicated that they do not compete with imports in the home market. Four firms
indicated that they do compete with imports in the home market. Two firms noted that the
trend in home market competition with imports has decreased since January 1, 2012, one firm
reported that the trend was constant, and the fourth firm indicated that the trend fluctuated.
Company explanations for the trend in home market competition with imports include the
following:
***: “***”
***: “***”
***: “***”
Export markets
Producers of CSPV products in Malaysia identified export markets other than the United
States that they have developed or where they have increased sales since January 1, 2012 for
Malaysian CSPV products including: ***. As noted in detail in Part I of this report, trade barriers
exist in the European Union and India for certain CSPV products originating in Malaysia.72
Export data compiled by the GTA for Malaysia are not presented in this report because data
specific to PV products are not available.
72 For further information on trade barriers in third‐country markets, see section titled “Restraints on Exports to, or on Imports into, Third‐Country Markets” in Part I of this report.
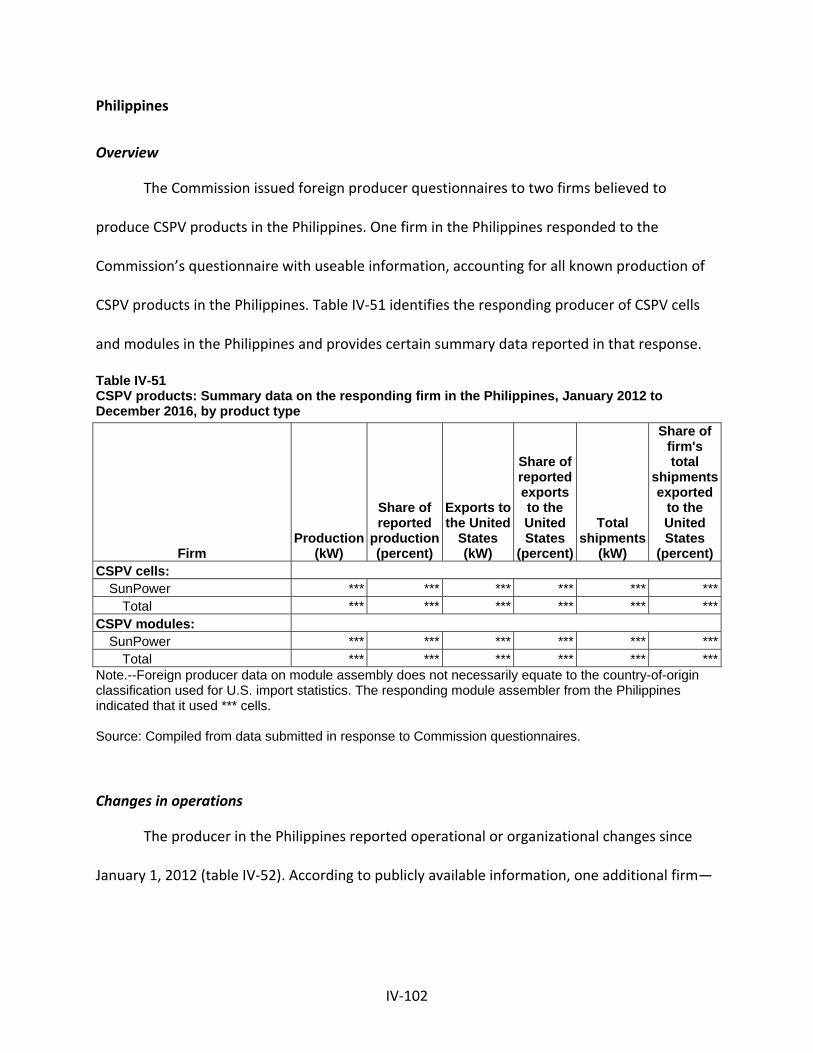
IV‐102
Philippines
Overview
The Commission issued foreign producer questionnaires to two firms believed to
produce CSPV products in the Philippines. One firm in the Philippines responded to the
Commission’s questionnaire with useable information, accounting for all known production of
CSPV products in the Philippines. Table IV‐51 identifies the responding producer of CSPV cells
and modules in the Philippines and provides certain summary data reported in that response.
Table IV-51 CSPV products: Summary data on the responding firm in the Philippines, January 2012 to December 2016, by product type
Firm Production
(kW)
Share of reported
production (percent)
Exports to the United
States (kW)
Share of reported exports to the United States
(percent)
Total shipments
(kW)
Share of firm's total
shipments exported
to the United States
(percent) CSPV cells:
SunPower *** *** *** *** *** ***Total *** *** *** *** *** ***
CSPV modules: SunPower *** *** *** *** *** ***
Total *** *** *** *** *** ***Note.--Foreign producer data on module assembly does not necessarily equate to the country-of-origin classification used for U.S. import statistics. The responding module assembler from the Philippines indicated that it used *** cells. Source: Compiled from data submitted in response to Commission questionnaires.
Changes in operations
The producer in the Philippines reported operational or organizational changes since
January 1, 2012 (table IV‐52). According to publicly available information, one additional firm—
IV‐103
Solar Philippines—opened its first module plant in the Philippines in March 2017. The plant’s
initial production capacity is 200 MW, and is expected to increase to 800 MW in 2018.73
Table IV-52 CSPV products: Reported changes in operations by the producer in the Philippines, since January 1, 2012
Item/Firm Description of change Plant openings: *** *** Plant closings: *** *** Consolidations: *** *** Source: Compiled from data submitted in response to Commission questionnaires.
Anticipated changes in operations
Reported anticipated changes in the character of the sole responding firm’s operations
relating to CSPV products in the future are presented in table IV‐53.
Table IV-53 CSPV products: Anticipated changes in operations by the producer in the Philippines
Firm Details concerning anticipated changes *** *** Source: Compiled from data submitted in response to Commission questionnaires.
73 Publicover, Brian, “Solar Philippines Inaugurates Country’s First PV Panel Factory,” PV Magazine, August 25, 2017, https://www.pv‐magazine.com/2017/08/25/solar‐philippines‐inaugurates‐countrys‐first‐pv‐panel‐factory/.

IV‐104
Operations on CSPV cells
Based on questionnaire data from the one responding producer in the Philippines,
production, capacity utilization, inventories and shipments generally increased from 2012 to
2016 (table IV‐54). Production increased by *** percent from 2012 to 2016, and the capacity
utilization for the firm producing CSPV cells in the Philippines ranged from *** percent to ***
percent during 2012‐16. The firm’s capacity remained constant from 2012 to 2016. The firm
projects a decrease in capacity, production, and shipments in 2017 and 2018. Reported
inventory levels of CSPV cells were *** larger in 2016 compared with 2012.
Home market sales accounted for *** percent of total shipments by the producer in the
Philippines during 2016. The firm reported *** exports of CSPV cells to the United States during
2016. Export markets other than the United States for CSPV cells produced in the Philippines
accounted for between *** percent and *** percent of the responding producers’ total
shipments since 2012. Major export markets identified by the producer in the Philippines for
CSPV cells include ***.

IV‐105
Table IV-54 CSPV cells: Data on the industry in the Philippines, 2012-16 and projected 2017-18
Item
Actual experience Projections
Calendar year
2012 2013 2014 2015 2016 2017 2018
Quantity (kW)
Capacity1 *** *** *** *** *** *** ***
Production *** *** *** *** *** *** ***End-of-period inventories *** *** *** *** *** *** ***Shipments: Home market: Internal consumption/ transfers *** *** *** *** *** *** *** Commercial shipments *** *** *** *** *** *** *** Subtotal, home market shipments *** *** *** *** *** *** ***
Export shipments to: United States *** *** *** *** *** *** ***
European Union *** *** *** *** *** *** ***
All other markets2 *** *** *** *** *** *** ***
Total exports *** *** *** *** *** *** ***
Total shipments *** *** *** *** *** *** ***
Ratios and shares (percent)
Capacity utilization *** *** *** *** *** *** ***
Inventories/production *** *** *** *** *** *** ***Inventories/total shipments *** *** *** *** *** *** ***Share of shipments: Home market: Internal consumption/ transfers *** *** *** *** *** *** *** Commercial Shipments *** *** *** *** *** *** *** Subtotal, home market shipments *** *** *** *** *** *** ***
Export shipments to: United States *** *** *** *** *** *** ***
European Union *** *** *** *** *** *** ***
All other markets2 *** *** *** *** *** *** ***
Total exports *** *** *** *** *** *** ***
Total shipments *** *** *** *** *** *** ***1 The changes in reported capacity reported by SunPower are due to ***. 2 Other markets include ***.
Source: Compiled from data submitted in response to Commission questionnaires.

IV‐106
Operations on CSPV modules
According to questionnaire data, capacity and production for CSPV modules in the
Philippines decreased by *** percent and *** percent, respectively, from 2012 to 2016, and the
capacity utilization for the firm producing CSPV modules in the Philippines ranged from ***
percent to *** percent during 2012‐16 (table IV‐55). Inventories of CSPV modules decreased by
*** percent from 2012 to 2016. Home market sales accounted for *** percent of total
shipments by the producer in the Philippines during 2016. Exports of CSPV modules to the
United States, which accounted for *** percent of total shipments by the producer in the
Philippines during 2016, decreased by *** percent from 2012 to 2016. Export markets other
than the United States for CSPV modules produced in the Philippines accounted for between
*** percent and *** percent of the responding producers’ total shipments since 2012. Other
major export markets identified by the producer in the Philippines for CSPV modules include
***. ***. Therefore, it projected ***.

IV‐107
Table IV-55 CSPV modules: Data on the industry in the Philippines, 2012-16 and projected 2017-18
Item
Actual experience Projections
Calendar year
2012 2013 2014 2015 2016 2017 2018
Quantity (kW)
Capacity1 *** *** *** *** *** *** ***
Production *** *** *** *** *** *** ***
End-of-period inventories *** *** *** *** *** *** ***Shipments: Home market: Internal consumption/ Transfers *** *** *** *** *** *** *** Commercial Shipments *** *** *** *** *** *** *** Subtotal, home market shipments *** *** *** *** *** *** ***
Export shipments to: United States *** *** *** *** *** *** ***
European Union2 *** *** *** *** *** *** ***
All other markets3 *** *** *** *** *** *** ***
Total exports *** *** *** *** *** *** ***
Total shipments *** *** *** *** *** *** ***
Ratios and shares (percent)
Capacity utilization *** *** *** *** *** *** ***
Inventories/production *** *** *** *** *** *** ***Inventories/total shipments *** *** *** *** *** *** ***Share of shipments: Home market: Internal consumption/ transfers *** *** *** *** *** *** *** Commercial Shipments *** *** *** *** *** *** *** Subtotal, home market shipments *** *** *** *** *** *** ***
Export shipments to: United States *** *** *** *** *** *** ***
European Union2 *** *** *** *** *** *** ***
All other markets3 *** *** *** *** *** *** ***
Total exports *** *** *** *** *** *** ***
Total shipments *** *** *** *** *** *** ***1 The changes in reported capacity reported by SunPower are due to ***. 2 European Union country markets include ***. 3 Other markets include ***. Source: Compiled from data submitted in response to Commission questionnaires.

IV‐108
Home market
Regarding competition with imports of CSPV products in its home market, the producer
in the Philippines, which reported *** shipments to the home market during the period of
investigation, indicated that it does not compete with imports in the home market.
Export markets
The producer of CSPV products in the Philippines identified export markets other than
the United States that it developed or where it increased sales since January 1, 2012. These
export markets include the following: ***. There were no trade barriers identified in this
proceeding with respect to certain CSPV products originating in the Philippines.74 Export data
compiled by GTA for the Philippines are not presented in this report because the PV‐specific
data do not appear to accurately capture exports of PV products.
74 For further information on trade barriers in third‐country markets, see section titled “Restraints on Exports to, or on Imports into, Third‐Country Markets” in Part I of this report.

IV‐109
Singapore
Overview
The Commission issued foreign producer questionnaires to two firms believed to
produce CSPV products in Singapore. One firm in Singapore responded to the Commission’s
questionnaire with useable information, accounting for all known production of CSPV products
in Singapore. Table IV‐56 identifies the responding producer of CSPV cells and modules in
Singapore and provides certain summary data reported in that response.
Table IV-56 CSPV products: Summary data on firms in Singapore, January 2012 through December 2016, by product type
Firm Production
(kW)
Share of reported
production (percent)
Exports to the United
States (kW)
Share of reported exports to the United States
(percent)
Total shipments
(kW)
Share of firm's total
shipments exported
to the United States
(percent) CSPV cells:
REC Solar *** *** *** *** *** ***Total *** *** *** *** *** ***
CSPV modules: REC Solar *** *** *** *** *** ***
Total *** *** *** *** *** ***Note.--Foreign producer data on module assembly does not necessarily equate to the country-of-origin classification used for U.S. import statistics. The responding module assembler in Singapore indicated that it used *** cells. Source: Compiled from data submitted in response to Commission questionnaires.

IV‐110
Changes in operations
One producer in Singapore reported operational and organizational changes since
January 1, 2012 (table IV‐57).
Table IV-57 CSPV products: Singaporean producer’s reported changes in operations, since January 1, 2012
Item/Firm Description of change Expansions: *** *** Technology: *** *** Source: Compiled from data submitted in response to Commission questionnaires.
Anticipated changes in operations
The sole responding producer in Singapore indicated that it does not anticipate any
changes in the character of its CSPV operations.
Operations on CSPV cells
According to questionnaire data, capacity, production, capacity utilization, and
shipments in Singapore generally increased from 2012 to 2016 (table IV‐58). Capacity and
production increased by *** percent and *** percent, respectively, from 2012 to 2016, and
capacity utilization for the firm producing CSPV cells in Singapore ranged from *** percent to
*** percent during 2012‐16. The firm projects capacity and production to *** percent and ***
percent, respectively, in 2017 and constant levels of capacity and production in 2018. The firm
*** of CSPV cells from 2012 to 2016 and projects no growth in inventory in 2017 and 2018.

IV‐111
Table IV-58 CSPV cells: Data on the industry in Singapore, 2012-16 and projected 2017-18
Item
Actual experience Projections
Calendar year
2012 2013 2014 2015 2016 2017 2018
Quantity (kW)
Capacity *** *** *** *** *** *** ***
Production *** *** *** *** *** *** ***
End-of-period inventories *** *** *** *** *** *** ***Shipments: Home market: Internal consumption/ transfers *** *** *** *** *** *** *** Commercial shipments *** *** *** *** *** *** *** Subtotal, home market shipments *** *** *** *** *** *** ***
Export shipments to: United States *** *** *** *** *** *** ***
European Union *** *** *** *** *** *** ***
All other markets1 *** *** *** *** *** *** ***
Total exports *** *** *** *** *** *** ***
Total shipments *** *** *** *** *** *** ***
Ratios and shares (percent)
Capacity utilization *** *** *** *** *** *** ***
Inventories/production *** *** *** *** *** *** ***Inventories/total shipments *** *** *** *** *** *** ***Share of shipments: Home market: Internal consumption/ transfers *** *** *** *** *** *** *** Commercial shipments *** *** *** *** *** *** *** Subtotal, home market shipments *** *** *** *** *** *** ***
Export shipments to: United States *** *** *** *** *** *** ***
European Union *** *** *** *** *** *** ***
All other markets1 *** *** *** *** *** *** ***
Total exports *** *** *** *** *** *** ***
Total shipments *** *** *** *** *** *** ***1 Other markets include ***. Source: Compiled from data submitted in response to Commission questionnaires.

IV‐112
Home market sales, which accounted for *** percent of total shipments by the
Singaporean cell producer in 2016, increased by *** percent from 2012 to 2016. The firm ***
export CSPV cells to the United States from 2012 to 2016 and does not expect growth in
exports to the United States in 2017 or 2018. Export markets other than the United States for
CSPV cells produced in Singapore accounted for between *** percent and *** percent of the
responding Singaporean producer’s total shipments since 2012. Other major export markets
identified by producers in Singapore for CSPV cells include ***.
Operations on CSPV modules
Based on questionnaire data, capacity, production, capacity utilization, inventories, and
shipments of the producer in Singapore generally increased from 2012 to 2016 (table IV‐59).
Capacity and production increased by *** percent and *** percent, respectively, from 2012 to
2016, and the capacity utilization for the firm producing CSPV modules in Singapore ranged
from *** percent to *** percent during 2012‐16. The firm projects capacity and production to
decline by *** percent and *** percent, respectively, in 2017 and then increase by *** percent
and *** percent, respectively, in 2018. Likewise, inventory of CSPV modules increased by ***
percent from 2012 to 2016. The firm expects inventory to decrease by *** percent from 2016
to 2018.

IV‐113
Table IV-59 CSPV modules: Data on the industry in Singapore, 2012-16 and projected 2017-18
Item
Actual experience Projections
Calendar year
2012 2013 2014 2015 2016 2017 2018
Quantity (kW)
Capacity *** *** *** *** *** *** ***
Production *** *** *** *** *** *** ***End-of-period inventories *** *** *** *** *** *** ***Shipments: Home market: Internal consumption/ transfers *** *** *** *** *** *** *** Commercial Shipments *** *** *** *** *** *** *** Subtotal, home market shipments *** *** *** *** *** *** ***
Export shipments to: United States *** *** *** *** *** *** ***
European Union1 *** *** *** *** *** *** ***
All other markets2 *** *** *** *** *** *** ***
Total exports *** *** *** *** *** *** ***
Total shipments *** *** *** *** *** *** ***
Ratios and shares (percent)
Capacity utilization *** *** *** *** *** *** ***
Inventories/production *** *** *** *** *** *** ***Inventories/total shipments *** *** *** *** *** *** ***Share of shipments: Home market: Internal consumption/ transfers *** *** *** *** *** *** *** Commercial Shipments *** *** *** *** *** *** *** Subtotal, home market shipments *** *** *** *** *** *** ***
Export shipments to: United States *** *** *** *** *** *** ***
European Union1 *** *** *** *** *** *** ***
All other markets2 *** *** *** *** *** *** ***
Total exports *** *** *** *** *** *** ***
Total shipments *** *** *** *** *** *** ***1 European Union country markets include shipments into ***. 2 Other markets include ***.
Source: Compiled from data submitted in response to Commission questionnaires.

IV‐114
Home market sales, which accounted for *** percent of total shipments by the
Singaporean producer in 2016, declined by *** percent from 2012 to 2016. Exports of CSPV
modules to the United States, which accounted for *** percent of total shipments by the
producer in Singapore during 2016, increased by *** percent during 2012‐16. Export markets
other than the United States for CSPV modules produced in Singapore accounted for between
*** percent and *** percent of the responding Singaporean producer’s total shipments since
2012. Other major export markets identified by producers in Singapore for CSPV modules
include ***.
Home market
Regarding competition with imports of CSPV products in the home market, the producer
in Singapore indicated that it competes with imports in the home market and commented that
“***.” It also noted, however, that the trend in home market competition with imports has
decreased since January 1, 2012.

IV‐115
Export markets
The producer of CSPV products in Singapore was asked to identify export markets other
than the United States that it has developed or where it has increased sales since January 1,
2012, and it reported several export markets, including: ***. There were no trade barriers
identified in these proceedings with respect to certain CSPV products originating in Singapore.75
Export data compiled by GTA for Singapore are not presented in this report because the PV‐
specific data do not appear to accurately capture exports of PV products.
Taiwan
Overview
The Commission issued foreign producer questionnaires to 43 firms believed to produce
CSPV products in Taiwan. Fifteen firms in Taiwan responded to the Commission’s questionnaire
with useable information, accounting for approximately 82 percent of cell capacity and 31
percent of module capacity in Taiwan in 2016. Table IV‐60 lists the Taiwanese producers of
CSPV products that responded to the Commission’s questionnaire and certain summary data
reported in those responses.
75 For further information on trade barriers in third‐country markets, see section titled “Restraints on Exports to, or on Imports into, Third‐Country Markets” in Part I of this report.
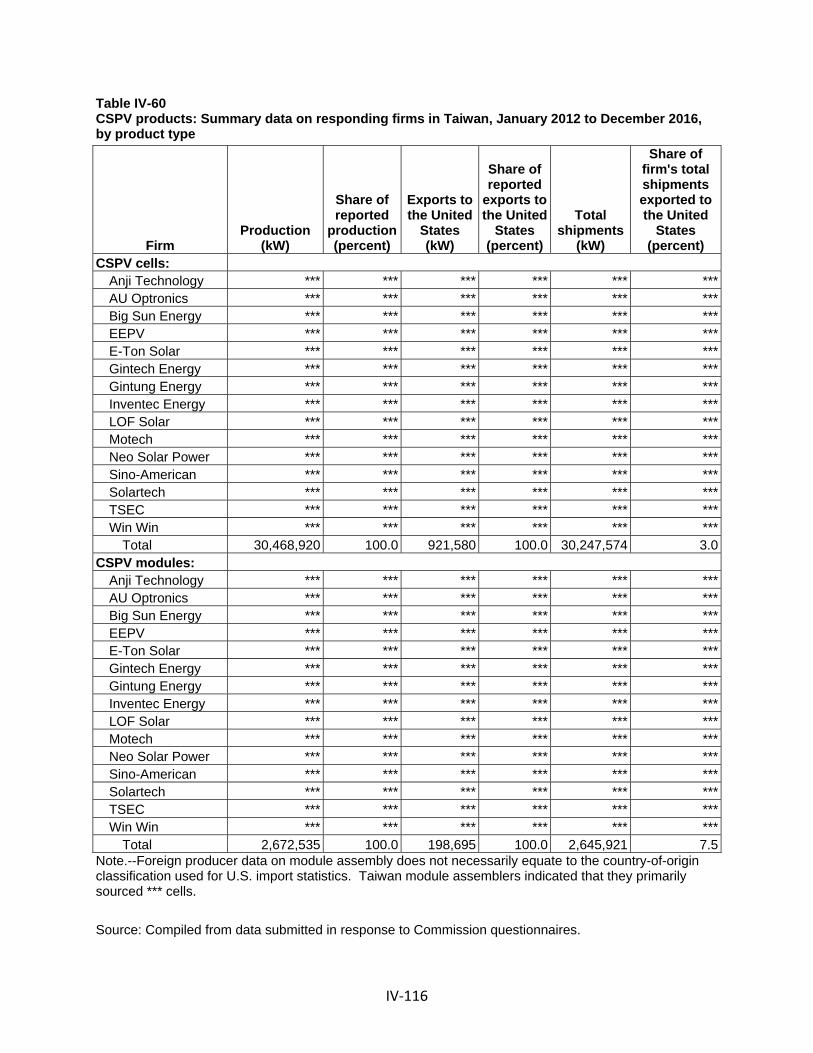
IV‐116
Table IV-60 CSPV products: Summary data on responding firms in Taiwan, January 2012 to December 2016, by product type
Firm Production
(kW)
Share of reported
production (percent)
Exports to the United
States (kW)
Share of reported
exports to the United
States (percent)
Total shipments
(kW)
Share of firm's total shipments exported to the United
States (percent)
CSPV cells: Anji Technology *** *** *** *** *** ***AU Optronics *** *** *** *** *** ***Big Sun Energy *** *** *** *** *** ***EEPV *** *** *** *** *** ***E-Ton Solar *** *** *** *** *** ***Gintech Energy *** *** *** *** *** ***Gintung Energy *** *** *** *** *** ***Inventec Energy *** *** *** *** *** ***LOF Solar *** *** *** *** *** ***Motech *** *** *** *** *** ***Neo Solar Power *** *** *** *** *** ***Sino-American *** *** *** *** *** ***Solartech *** *** *** *** *** ***TSEC *** *** *** *** *** ***Win Win *** *** *** *** *** ***
Total 30,468,920 100.0 921,580 100.0 30,247,574 3.0CSPV modules:
Anji Technology *** *** *** *** *** ***AU Optronics *** *** *** *** *** ***Big Sun Energy *** *** *** *** *** ***EEPV *** *** *** *** *** ***E-Ton Solar *** *** *** *** *** ***Gintech Energy *** *** *** *** *** ***Gintung Energy *** *** *** *** *** ***Inventec Energy *** *** *** *** *** ***LOF Solar *** *** *** *** *** ***Motech *** *** *** *** *** ***Neo Solar Power *** *** *** *** *** ***Sino-American *** *** *** *** *** ***Solartech *** *** *** *** *** ***TSEC *** *** *** *** *** ***Win Win *** *** *** *** *** ***
Total 2,672,535 100.0 198,695 100.0 2,645,921 7.5Note.--Foreign producer data on module assembly does not necessarily equate to the country-of-origin classification used for U.S. import statistics. Taiwan module assemblers indicated that they primarily sourced *** cells.
Source: Compiled from data submitted in response to Commission questionnaires.

IV‐117
Changes in operations
Eleven producers in Taiwan reported operational or organizational changes since
January 1, 2012 (table IV‐61).
Table IV-61 CSPV products: Taiwanese producers’ reported changes in operations, since January 1, 2012 Item/firm Reported changes in operations Plant openings: *** *** Plant closings: *** *** *** *** *** *** *** *** *** *** Relocations: *** *** *** *** *** *** Expansions: *** *** *** *** *** *** *** *** *** *** *** *** *** *** *** *** Source: Compiled from data submitted in response to Commission questionnaires.

IV‐118
Anticipated changes in operations
Taiwanese producers were asked whether they anticipated changes in the character of
their operations relating to CSPV products in the future, with twelve producers indicating that
they do not anticipate any changes in the character of their CSPV operations. Conversely, three
firms anticipated several changes (table IV‐62).
Table IV-62 CSPV products: Taiwanese producers’ anticipated changes in operations
Firm Details concerning anticipated changes *** *** *** *** *** *** Source: Compiled from data submitted in response to Commission questionnaires.
Operations on CSPV cells
According to questionnaire data, capacity, production, capacity utilization, inventories,
and shipments of the industry in Taiwan generally increased from 2012 to 2016 (table IV‐63).
Capacity and production increased by *** and *** percent, respectively, from 2012 to 2016,
and the capacity utilization for firms producing CSPV cells in Taiwan fluctuated upward from
*** percent in 2012 to *** percent in 2016. Inventories of CSPV cells increased by *** percent
from 2012 to 2016. The industry in Taiwan, however, projects declines in these indicators in
2017 and 2018.
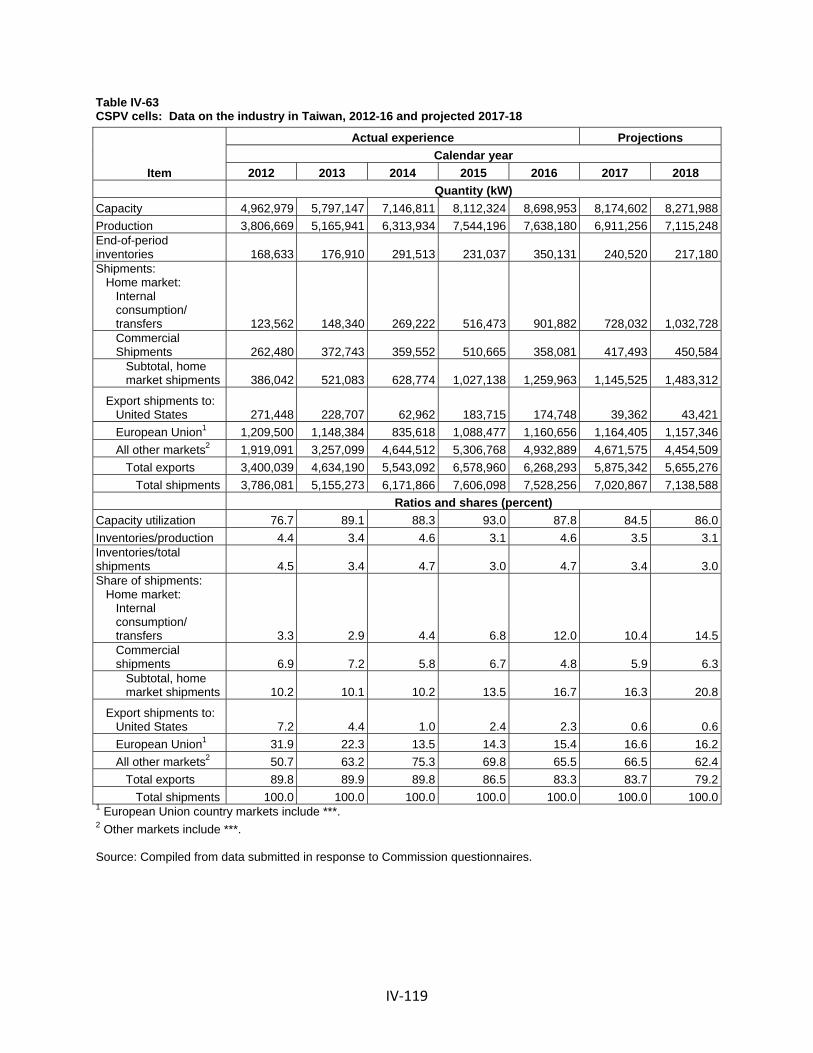
IV‐119
Table IV-63 CSPV cells: Data on the industry in Taiwan, 2012-16 and projected 2017-18
Item
Actual experience Projections
Calendar year
2012 2013 2014 2015 2016 2017 2018
Quantity (kW)
Capacity 4,962,979 5,797,147 7,146,811 8,112,324 8,698,953 8,174,602 8,271,988
Production 3,806,669 5,165,941 6,313,934 7,544,196 7,638,180 6,911,256 7,115,248End-of-period inventories 168,633 176,910 291,513 231,037 350,131 240,520 217,180Shipments: Home market: Internal consumption/ transfers 123,562 148,340 269,222 516,473 901,882 728,032 1,032,728 Commercial Shipments 262,480 372,743 359,552 510,665 358,081 417,493 450,584 Subtotal, home market shipments 386,042 521,083 628,774 1,027,138 1,259,963 1,145,525 1,483,312
Export shipments to: United States 271,448 228,707 62,962 183,715 174,748 39,362 43,421
European Union1 1,209,500 1,148,384 835,618 1,088,477 1,160,656 1,164,405 1,157,346
All other markets2 1,919,091 3,257,099 4,644,512 5,306,768 4,932,889 4,671,575 4,454,509
Total exports 3,400,039 4,634,190 5,543,092 6,578,960 6,268,293 5,875,342 5,655,276
Total shipments 3,786,081 5,155,273 6,171,866 7,606,098 7,528,256 7,020,867 7,138,588
Ratios and shares (percent)
Capacity utilization 76.7 89.1 88.3 93.0 87.8 84.5 86.0
Inventories/production 4.4 3.4 4.6 3.1 4.6 3.5 3.1Inventories/total shipments 4.5 3.4 4.7 3.0 4.7 3.4 3.0Share of shipments: Home market: Internal consumption/ transfers 3.3 2.9 4.4 6.8 12.0 10.4 14.5 Commercial shipments 6.9 7.2 5.8 6.7 4.8 5.9 6.3 Subtotal, home market shipments 10.2 10.1 10.2 13.5 16.7 16.3 20.8
Export shipments to: United States 7.2 4.4 1.0 2.4 2.3 0.6 0.6
European Union1 31.9 22.3 13.5 14.3 15.4 16.6 16.2
All other markets2 50.7 63.2 75.3 69.8 65.5 66.5 62.4
Total exports 89.8 89.9 89.8 86.5 83.3 83.7 79.2
Total shipments 100.0 100.0 100.0 100.0 100.0 100.0 100.01 European Union country markets include ***. 2 Other markets include ***. Source: Compiled from data submitted in response to Commission questionnaires.

IV‐120
Home market shipments, which accounted for *** percent of total shipments by the
responding Taiwanese producers in 2016, were largely internal consumption. These home
market shipments were *** higher in 2016 than the level reported in 2012. Exports of CSPV
cells to the United States, which accounted for a declining share of total shipments by
producers in Taiwan, fluctuated downward from *** kW to *** kW during 2012‐16. A
noticeable decline in exports was observed in 2014, which was the year in which the
Commission conducted the CSPV 2 investigations that included CSPV products from Taiwan.
Exports to the United States accounted for *** percent of total shipments by the Taiwanese
producers in 2016. Export markets other than the United States for CSPV cells produced in
Taiwan accounted for *** percent of the responding Taiwanese producers’ total shipments in
2016. Other major export markets identified by producers in Taiwan for CSPV cells include
countries within ***.
Operations on CSPV modules
According to questionnaire data, capacity, production, capacity utilization, inventories,
and shipments of the industry in Taiwan generally increased from 2012 to 2016 (table IV‐64).
Capacity and production increased from 2012 to 2015, but declined in 2016 to levels that were
*** percent higher, respectively, than reported in 2012. The capacity utilization for responding
firms producing CSPV modules in Taiwan increased from *** percent in 2012 to *** percent in
2015, but declined to *** percent in 2016. Increases in capacity, production, and capacity
utilization over the 2016 levels are projected by firms in Taiwan for 2017 and 2018. Inventories
of CSPV modules increased by *** percent from 2012 to 2016.

IV‐121
Table IV-64 CSPV modules: Data on the industry in Taiwan, 2012-16 and projected 2017-18
Item
Actual experience Projections
Calendar year
2012 2013 2014 2015 2016 2017 2018
Quantity (kW)
Capacity 559,900 714,850 1,003,184 1,188,644 938,177 1,071,972 1,498,820
Production 210,415 370,057 663,285 831,700 597,078 754,793 1,192,080
End-of-period inventories 17,090 17,659 41,363 45,920 49,195 33,193 36,584Shipments: Home market: Internal consumption/ transfers 7,899 13,155 42,477 56,509 61,793 91,113 185,281 Commercial shipments 60,560 151,480 226,006 311,639 221,359 371,393 616,310 Subtotal, home market shipments 68,459 164,635 268,483 368,148 283,152 462,506 801,591
Export shipments to: United States 74,901 26,817 22,349 56,069 18,559 24,303 42,633
European Union1 40,140 52,233 150,211 247,766 204,911 193,367 220,022
All other markets2 20,369 129,584 198,538 163,415 87,182 90,619 122,443
Total exports 135,410 208,634 371,098 467,250 310,652 308,289 385,098
Total shipments 203,869 373,269 639,581 835,398 593,804 770,795 1,186,689
Ratios and shares (percent)
Capacity utilization 37.6 51.8 66.1 70.0 63.6 70.4 79.5
Inventories/production 8.1 4.8 6.2 5.5 8.2 4.4 3.1
Inventories/total shipments 8.4 4.7 6.5 5.5 8.3 4.3 3.1Share of shipments: Home market: Internal consumption/ transfers 3.9 3.5 6.6 6.8 10.4 11.8 15.6 Commercial Shipments 29.7 40.6 35.3 37.3 37.3 48.2 51.9 Subtotal, home market shipments 33.6 44.1 42.0 44.1 47.7 60.0 67.5
Export shipments to: United States 36.7 7.2 3.5 6.7 3.1 3.2 3.6
European Union1 19.7 14.0 23.5 29.7 34.5 25.1 18.5
All other markets2 10.0 34.7 31.0 19.6 14.7 11.8 10.3
Total exports 66.4 55.9 58.0 55.9 52.3 40.0 32.5
Total shipments 100.0 100.0 100.0 100.0 100.0 100.0 100.01 European Union country markets include ***. 2 Other markets include ***. Source: Compiled from data submitted in response to Commission questionnaires.

IV‐122
Home market sales, which accounted for *** percent of total shipments by the
responding Taiwanese producers in 2016, were *** higher in 2016 than in 2012. Exports of
CSPV modules to the United States, which accounted for a declining share of total shipments by
producers in Taiwan, fluctuated downward from 2012 to 2016. Exports to the United States
accounting for *** percent of total shipments by the Taiwanese producers in 2016. Export
markets other than the United States for CSPV modules produced in Taiwan accounted for ***
percent of the responding Taiwanese producers’ total shipments in 2016. Other major export
markets identified by responding producers in Taiwan for CSPV modules include ***.
Home market
Regarding competition with imports of CSPV products in their home market, twelve
producers in Taiwan indicated that they do not compete with imports in the home market.
Conversely, three producers in Taiwan that indicated that they compete with imports in the
home market noted that the trend in home market competition with imports has remained
constant or increased since January 1, 2012. Comments made by individual firms on the trend
in home market competition with imports include the following:
***: “***.”
***: “***.”
***: “***.”

IV‐123
Export markets
Producers of CSPV products in Taiwan identified export markets other than the United
States that they have developed or where they have increased sales since January 1, 2012
including: ***. *** noted that “***.” Trade barriers exist in the United States and in the
European Union and India for certain CSPV products originating in Taiwan.76
According to GTA, the leading export markets for CSPV products from Taiwan are China
and Vietnam, accounting for 31.3 percent and 20.8 percent, respectively, of total exports from
Taiwan in 2016 (table IV‐65). During 2016, the United States was the seventh largest export
market for CSPV products from Taiwan, accounting for 2.8 percent of total exports.
76 For further information on trade barriers in third‐country markets, see section titled “Restraints on Exports to, or on Imports into, Third‐Country Markets” in Part I of this report.

IV‐124
Table IV-65 CSPV products: Exports from Taiwan, 2012-16
Destination market Calendar year
2012 2013 2014 2015 2016 Value (1,000 dollars) Taiwan exports to the United States 265,142 183,913 85,618 109,040 79,458 Taiwan exports to other major destination markets.-- China 651,109 1,144,906 1,383,605 1,071,635 884,957
Vietnam 416 668 8,802 261,710 587,722 Germany 323,687 307,377 263,494 283,046 238,848 Japan 235,414 617,010 725,597 329,629 176,934 Netherlands 81,637 43,784 127,532 160,349 128,016 Singapore 23,283 58,129 95,666 148,394 111,374 Canada 147,162 52,917 135,500 178,836 64,217 Turkey 2,770 11,056 58,456 57,249 59,995 All other destination markets 790,428 602,509 807,832 705,822 497,203
Total Taiwan exports 2,521,047 3,022,270 3,692,102 3,305,709 2,828,722 Share of value (percent) Taiwan exports to the United States 10.5 6.1 2.3 3.3 2.8 Taiwan exports to other major destination markets.-- China 25.8 37.9 37.5 32.4 31.3
Vietnam 0.0 0.0 0.2 7.9 20.8 Germany 12.8 10.2 7.1 8.6 8.4 Japan 9.3 20.4 19.7 10.0 6.3 Netherlands 3.2 1.4 3.5 4.9 4.5 Singapore 0.9 1.9 2.6 4.5 3.9 Canada 5.8 1.8 3.7 5.4 2.3 Turkey 0.1 0.4 1.6 1.7 2.1 All other destination markets 31.4 19.9 21.9 21.4 17.6
Total Taiwan exports 100.0 100.0 100.0 100.0 100.0 Source: Official exports statistics under Taiwan-specific HS numbers 8541.40.21 and 8541.40.22 as reported by Taiwan's statistical authority in the GTA database, accessed July 14, 2017.

IV‐125
Thailand
Overview
The Commission issued foreign producer questionnaires to 12 firms believed to produce
CSPV products in Thailand. Four firms in Thailand responded to the Commission’s questionnaire
with useable information, accounting for approximately 52 percent of cell production capacity
in 2016 and 44 percent of module capacity in Thailand in 2016. Table IV‐66 lists the Thai
producers of CSPV cells and modules that responded to the Commission’s questionnaire and
certain summary data reported in those responses.
Table IV-66 CSPV products: Summary data on responding firms in Thailand, January 2012 to December 2016, by product type
Firm Production
(kW)
Share of reported
production (percent)
Exports to the United
States (kW)
Share of reported exports to the United States
(percent)
Total shipments
(kW)
Share of firm's total
shipments exported
to the United States
(percent) CSPV cells:
Canadian Solar (Thailand) *** *** *** *** *** ***Celestica (Thailand) *** *** *** *** *** ***MLT Solar (Thailand) *** *** *** *** *** ***Trina Solar (Thailand) *** *** *** *** *** ***
Total *** *** *** *** *** ***CSPV modules:
Canadian Solar (Thailand) *** *** *** *** *** ***Celestica (Thailand) *** *** *** *** *** ***MLT Solar (Thailand) *** *** *** *** *** ***Trina Solar (Thailand) *** *** *** *** *** ***
Total *** *** *** *** *** ***Note.--Foreign producer data on module assembly does not necessarily equate to the country-of-origin classification used for U.S. import statistics. Thailand module assemblers indicated ***. Source: Compiled from data submitted in response to Commission questionnaires.

IV‐126
Changes in operations
Since January 2012, there have been several firms in Thailand that have experienced
changes in the character of their operations. Near year‐end 2015, Zhongli Talesun Solar Co. fully
commissioned a manufacturing plant with capacity for 500 MW of crystalline silicon cells and
modules. Gintech Energy announced the construction of a 350 MW cell and module plant in
2015.77 Trina Solar Ltd. started production at its new Rayong facility in early 2016, with 700 MW
of cell capacity and 500 MW of module capacity.78
Regarding operational or organizational changes since January 1, 2012, four producers
in Thailand provided details concerning such changes (table IV‐67).
Table IV-67 CSPV products: Thai producers’ reported changes in operations, since January 1, 2012
Item/firm Description of change Plant openings: *** *** *** *** *** *** Plant closings: *** *** Source: Compiled from data submitted in response to Commission questionnaires.
77 Bloomberg New Energy Finance database, https://about.bnef.com/, accessed April 27, 2017. 78 Trina Solar Launches Operations at Thailand Manufacturing Facility and Signs a US$143 million
Syndicated Financing Facilities Agreement, March 28, 2016, http://ir.trinasolar.com/phoenix.zhtml?c=206405&p=irol‐newsArticle&ID=2151042.
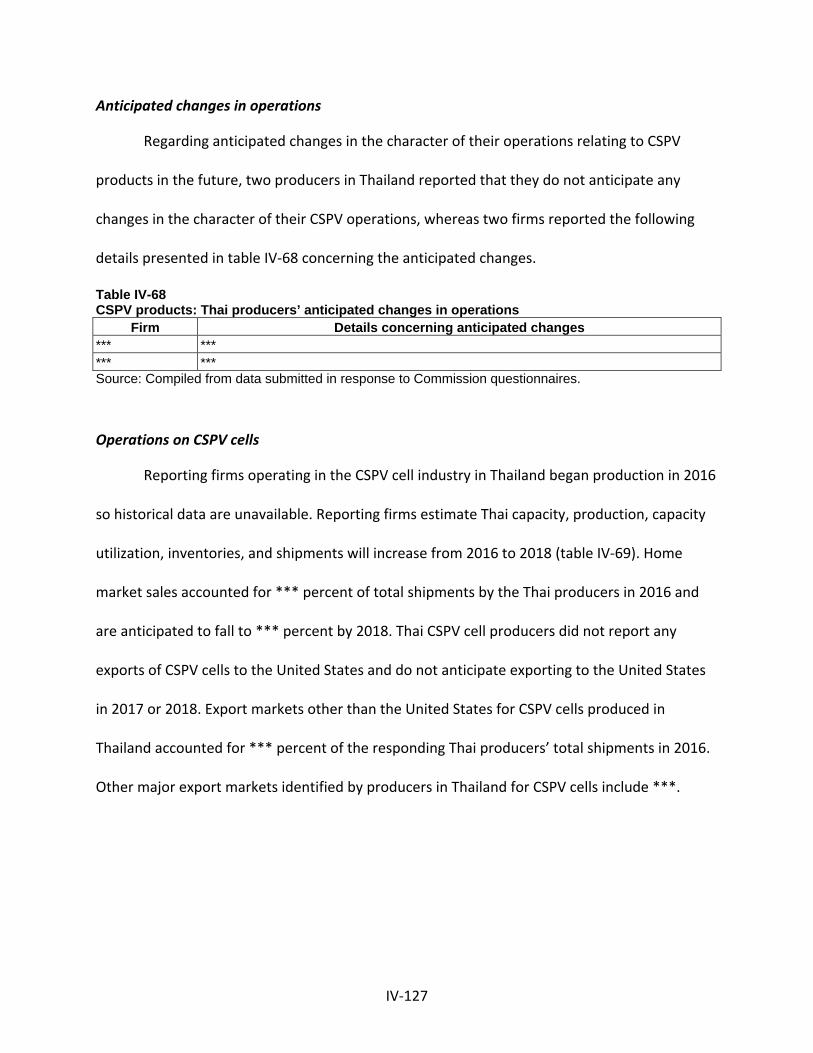
IV‐127
Anticipated changes in operations
Regarding anticipated changes in the character of their operations relating to CSPV
products in the future, two producers in Thailand reported that they do not anticipate any
changes in the character of their CSPV operations, whereas two firms reported the following
details presented in table IV‐68 concerning the anticipated changes.
Table IV-68 CSPV products: Thai producers’ anticipated changes in operations
Firm Details concerning anticipated changes *** *** *** *** Source: Compiled from data submitted in response to Commission questionnaires.
Operations on CSPV cells
Reporting firms operating in the CSPV cell industry in Thailand began production in 2016
so historical data are unavailable. Reporting firms estimate Thai capacity, production, capacity
utilization, inventories, and shipments will increase from 2016 to 2018 (table IV‐69). Home
market sales accounted for *** percent of total shipments by the Thai producers in 2016 and
are anticipated to fall to *** percent by 2018. Thai CSPV cell producers did not report any
exports of CSPV cells to the United States and do not anticipate exporting to the United States
in 2017 or 2018. Export markets other than the United States for CSPV cells produced in
Thailand accounted for *** percent of the responding Thai producers’ total shipments in 2016.
Other major export markets identified by producers in Thailand for CSPV cells include ***.

IV‐128
Table IV-69 CSPV cells: Data on the industry in Thailand, 2012-16 and projected 2017-18
Item
Actual experience Projections
Calendar year
2012 2013 2014 2015 2016 2017 2018
Quantity (kW)
Capacity *** *** *** *** *** *** ***
Production *** *** *** *** *** *** ***End-of-period inventories *** *** *** *** *** *** ***Shipments: Home market: Internal consumption/ transfers *** *** *** *** *** *** *** Commercial shipments *** *** *** *** *** *** *** Subtotal, home market shipments *** *** *** *** *** *** ***
Export shipments to: United States *** *** *** *** *** *** ***
European Union1 *** *** *** *** *** *** ***
All other markets2 *** *** *** *** *** *** ***
Total exports *** *** *** *** *** *** ***
Total shipments *** *** *** *** *** *** ***
Ratios and shares (percent)
Capacity utilization *** *** *** *** *** *** ***
Inventories/production *** *** *** *** *** *** ***Inventories/total shipments *** *** *** *** *** *** ***Share of shipments: Home market: Internal consumption/ transfers *** *** *** *** *** *** *** Commercial shipments *** *** *** *** *** *** *** Subtotal, home market shipments *** *** *** *** *** *** ***
Export shipments to: United States *** *** *** *** *** *** ***
European Union1 *** *** *** *** *** *** ***
All other markets2 *** *** *** *** *** *** ***
Total exports *** *** *** *** *** *** ***
Total shipments *** *** *** *** *** *** ***1 European Union country markets include ***. 2 Other markets include ***.
Source: Compiled from data submitted in response to Commission questionnaires.
IV‐129
Operations on CSPV modules
Responding firms operating in the CSPV module industry in Thailand reported
production only for 2015 and 2016 so historical data are limited. Reporting firms estimate Thai
capacity, production, and shipments will increase from 2016 to 2018 (table IV‐70). The capacity
utilization for firms producing CSPV modules in Thailand increased from *** percent in 2015 to
*** percent in 2016. Likewise, inventories of CSPV modules increased from 2015 to 2016.
Home market sales accounted for *** percent of total shipments by the Thai producers in 2016.
Exports of CSPV modules to the United States accounted for *** percent of total shipments by
the Thai producers in 2016. Reporting firms project an overall decline in exports to the United
States and an increase to non‐U.S., non‐EU markets in 2018 over 2016 levels. Export markets
other than the United States for CSPV modules produced in Thailand accounted for *** percent
of the responding Thai producers’ total shipments in 2016. Other major export markets
identified by producers in Thailand for CSPV modules include ***.

IV‐130
Table IV-70 CSPV modules: Data on the industry in Thailand, 2012-16 and projected 2017-18
Item
Actual experience Projections
Calendar year
2012 2013 2014 2015 2016 2017 2018
Quantity (kW)
Capacity *** *** *** *** *** *** ***
Production *** *** *** *** *** *** ***End-of-period inventories *** *** *** *** *** *** ***Shipments: Home market: Internal consumption/ transfers *** *** *** *** *** *** *** Commercial Shipments *** *** *** *** *** *** *** Subtotal, home market shipments *** *** *** *** *** *** ***
Export shipments to: United States *** *** *** *** *** *** ***
European Union1 *** *** *** *** *** *** ***
All other markets2 *** *** *** *** *** *** ***
Total exports *** *** *** *** *** *** ***
Total shipments *** *** *** *** *** *** ***
Ratios and shares (percent)
Capacity utilization *** *** *** *** *** *** ***
Inventories/production *** *** *** *** *** *** ***Inventories/total shipments *** *** *** *** *** *** ***Share of shipments: Home market: Internal consumption/ transfers *** *** *** *** *** *** *** Commercial Shipments *** *** *** *** *** *** *** Subtotal, home market shipments *** *** *** *** *** *** ***
Export shipments to: United States *** *** *** *** *** *** ***
European Union1 *** *** *** *** *** *** ***
All other markets2 *** *** *** *** *** *** ***
Total exports *** *** *** *** *** *** ***
Total shipments *** *** *** *** *** *** ***1 European Union country markets include ***. 2 Other markets include ***.
Source: Compiled from data submitted in response to Commission questionnaires.

IV‐131
Home market
Regarding competition with imports of CSPV products in their home market, three of
the responding producers in Thailand indicated that they do not compete with imports in the
home market. The one producer in Thailand that indicated that it competes with imports in the
home market noted that the trend in home market competition with imports has *** since
January 1, 2012, commenting that there are “***.”
Export markets
Responding producers of CSPV products in Thailand identified export markets other
than the United States that they have developed or where they have increased sales since
January 1, 2012 including: ***. There were no trade barriers identified in this proceeding with
respect to certain CSPV products originating in Thailand.79
According to GTA, the leading export market for CSPV products from Thailand is the
United States, which accounted for 62.0 percent of total exports from Thailand in 2016 (table
IV‐71). The Netherlands and Malaysia accounted for another 12.6 percent and 6.6 percent,
respectively, of CSPV product exports from Thailand in 2016.
79 For further information on trade barriers in third‐country markets, see section titled “Restraints on Exports to, or on Imports into, Third‐Country Markets” in Part I of this report.

IV‐132
Table IV-71 CSPV products: Exports from Thailand, 2012-16
Destination market Calendar year
2012 2013 2014 2015 2016 Value (1,000 dollars) Thailand exports to the United States 360 224 7 44,617 442,073 Thailand exports to other major destination markets.-- Netherlands 68 681 833 41 89,794
Malaysia 312 45 125 1,624 47,350 Vietnam 0 0 0 323 37,953 Turkey --- --- --- 1 25,925 Korea South 212 --- --- 14 19,080 Switzerland 0 7 16 4 10,247 Germany 89 201 114 152 10,105 South Africa --- 1 2 2,400 9,499 All other destination markets 4,465 2,731 3,245 12,173 20,672
Total Thailand exports 5,506 3,889 4,341 61,349 712,698 Share of value (percent) Thailand exports to the United States 6.5 5.8 0.2 72.7 62.0 Thailand exports to other major destination markets.-- Netherlands 1.2 17.5 19.2 0.1 12.6
Malaysia 5.7 1.2 2.9 2.6 6.6 Vietnam 0.0 0.0 0.0 0.5 5.3 Turkey --- --- --- 0.0 3.6 Korea South 3.8 --- --- 0.0 2.7 Switzerland 0.0 0.2 0.4 0.0 1.4 Germany 1.6 5.2 2.6 0.2 1.4 South Africa --- 0.0 0.0 3.9 1.3 All other destination markets 81.1 70.2 74.8 19.8 2.9
Total Thailand exports 100.0 100.0 100.0 100.0 100.0 Source: Official exports statistics under Thailand-specific HS numbers 8541.40.1000, 8541.40.2000 and 8541.40.9001 as reported by Thailand's statistical authority in the GTA database, accessed July 14, 2017.

IV‐133
Vietnam
Overview
The Commission issued foreign producer questionnaires to 14 firms believed to produce
CSPV products in Vietnam. Five firms in Vietnam responded to the Commission’s questionnaire
with useable information, accounting for approximately *** percent of cell capacity and ***
percent of module capacity in Vietnam in 2016. Table IV‐72 lists the Vietnamese producers of
CSPV cells and modules that responded to the Commission’s questionnaire and certain
summary data reported in those responses.
Table IV-72 CSPV cells: Summary data on responding firms in Vietnam, January 2012 to December 2016, by product type
Firm Production
(kW)
Share of reported
production (percent)
Exports to the United
States (kW)
Share of reported
exports to the U.S. (percent)
Total shipments
(kW)
Share of firm's total shipments exported to the U.S. (percent)
CSPV cells: Red Sun *** *** *** *** *** ***Canadian Solar *** *** *** *** *** ***Trina Solar *** *** *** *** *** ***Vina Solar *** *** *** *** *** ***Boviet Solar *** *** *** *** *** ***Total *** *** *** *** *** ***CSPV modules: Red Sun *** *** *** *** *** ***Canadian Solar *** *** *** *** *** ***Trina Solar *** *** *** *** *** ***Vina Solar *** *** *** *** *** ***Boviet Solar *** *** *** *** *** ***Total *** *** *** *** *** ***Note.--Foreign producer data on module assembly does not necessarily equate to the country-of-origin classification used for U.S. import statistics. Vietnam module assemblers indicated ***. Source: Compiled from data submitted in response to Commission questionnaires.

IV‐134
Changes in operations
All five responding producers in Vietnam reported operational or organizational changes
since January 1, 2012. Four firms provided details concerning plant openings and three firms
provided details concerning plant expansions (table IV‐73).
Table IV-73 CSPV products: Vietnamese producers’ reported changes in operations, since January 1, 2012
Item/firm Reported changed in operations Plant openings: *** *** *** *** *** *** *** *** Expansions: *** *** *** *** *** *** Source: Compiled from data submitted in response to Commission questionnaires.
Anticipated changes in operations
Regarding anticipated changes in the character of their operations relating to CSPV
products in the future, four producers in Vietnam reported that they do not anticipate any
changes in the character of their CSPV operations, whereas one firm indicated that it
anticipates increases in the capacity to produce CSPV cells and modules (table IV‐74).
Table IV-74 CSPV products: Vietnamese producers’ anticipated changes in operations
Firm Details concerning anticipated changes *** *** Source: Compiled from data submitted in response to Commission questionnaires.

IV‐135
Operations on CSPV cells
There was no reported capacity or production of CSPV cells in Vietnam in 2012 or 2013.
Two of the responding firms in Vietnam (***) opened CSPV cell manufacturing facilities in ***
and one firm (***) began cell manufacturing in Vietnam in *** (table IV‐75). Since 2014,
reporting Vietnamese firms’ capacity, production, capacity utilization, inventories, and
shipments increased as production ramped up at the three cell facilities. Vietnamese
production was reported at *** percent of the *** kW of capacity during 2016. Further
increases in capacity, production, and capacity utilization are projected by the three firms into
2017 and 2018. Reported year‐end inventories of CSPV cells increased from 2014 to 2016, but
are projected to decline in 2017 and 2018.

IV‐136
Table IV-75 CSPV cells: Data on the industry in Vietnam, 2012-16 and projected 2017-18
Item
Actual experience ProjectionsCalendar year
2012 2013 2014 2015 2016 2017 2018 Quantity (kW)
Capacity *** *** *** *** *** *** ***Production *** *** *** *** *** *** ***End-of-period inventories *** *** *** *** *** *** ***Shipments: Home market: Internal consumption/ transfers *** *** *** *** *** *** *** Commercial Shipments *** *** *** *** *** *** *** Subtotal, home market shipments *** *** *** *** *** *** *** Export shipments to: United States *** *** *** *** *** *** *** European Union1 *** *** *** *** *** *** *** All other markets2 *** *** *** *** *** *** *** Total exports *** *** *** *** *** *** *** Total shipments *** *** *** *** *** *** *** Ratios and shares (percent)Capacity utilization *** *** *** *** *** *** ***Inventories/production *** *** *** *** *** *** ***Inventories/total shipments *** *** *** *** *** *** ***Share of shipments: Home market: Internal consumption/ transfers *** *** *** *** *** *** *** Commercial shipments *** *** *** *** *** *** *** Subtotal, home market shipments *** *** *** *** *** *** *** Export shipments to: United States *** *** *** *** *** *** *** European Union1 *** *** *** *** *** *** *** All other markets2 *** *** *** *** *** *** *** Total exports *** *** *** *** *** *** *** Total shipments *** *** *** *** *** *** ***1 European Union country markets include ***. 2 Other markets include ***. Source: Compiled from data submitted in response to Commission questionnaires.

IV‐137
Home market shipments, all of which are reported as internal consumption, accounted
for *** percent of total shipments by the responding Vietnamese producers in 2016. These
shipments are expected to decline as a share of total shipments in 2017 and 2018, as exports to
non‐U.S. markets and non‐European markets are projected to grow. These other major export
markets identified by *** responding producers of cells in Vietnam include ***. There were no
exports of CSPV cells to the United States reported during the period of investigation and no
exports to the United States are projected for 2017 and 2018. Exports of CSPV cells to the EU
were reported by *** only during 2016 and accounted for *** percent of total shipments by
the Vietnamese producers in that year. Exports to the EU are projected to be *** in 2017 and
2018. European Union country markets identified by *** for CSPV cells include ***.
Operations on CSPV modules
According to questionnaire data, capacity, production, inventories, and shipments of the
industry in Vietnam increased overall from 2012 to 2016 as three of the four reporting firms in
Vietnam reported opening and ramping up module assembly operations during that period.
Vietnamese production was reported at *** percent of the more than *** kW of capacity
during 2016 (table IV‐76). Further increases in capacity, production, and capacity utilization are
projected by the four module assemblers into 2017 and 2018. Reported year‐end inventories of
CSPV modules increased from 2012 to 2016, but are projected to decline in 2017 and 2018.

IV‐138
Table IV-76 CSPV modules: Data on the industry in Vietnam, 2012-16 and projected 2017-18
Item
Actual experience ProjectionsCalendar year
2012 2013 2014 2015 2016 2017 2018 Quantity (kW)
Capacity *** *** *** *** *** *** ***Production *** *** *** *** *** *** ***End-of-period inventories *** *** *** *** *** *** ***Shipments: Home market: Internal consumption/ transfers *** *** *** *** *** *** *** Commercial shipments *** *** *** *** *** *** *** Subtotal, home market shipments *** *** *** *** *** *** *** Export shipments to: United States *** *** *** *** *** *** *** European Union1 *** *** *** *** *** *** *** All other markets2 *** *** *** *** *** *** *** Total exports *** *** *** *** *** *** *** Total shipments *** *** *** *** *** *** *** Ratios and shares (percent)Capacity utilization *** *** *** *** *** *** ***Inventories/production *** *** *** *** *** *** ***Inventories/total shipments *** *** *** *** *** *** ***Share of shipments: Home market: Internal consumption/ transfers *** *** *** *** *** *** *** Commercial shipments *** *** *** *** *** *** *** Subtotal, home market shipments *** *** *** *** *** *** *** Export shipments to: United States *** *** *** *** *** *** *** European Union1 *** *** *** *** *** *** *** All other markets2 *** *** *** *** *** *** *** Total exports *** *** *** *** *** *** *** Total shipments *** *** *** *** *** *** ***1 European Union country markets include ***. 2 Other markets include ***.
Source: Compiled from data submitted in response to Commission questionnaires.

IV‐139
Home market shipments of modules, all of which are reported as commercial sales,
accounted for a declining share of the responding Vietnamese producers’ total shipments since
2013. During 2016, home market shipments of CSPV modules by producers in Vietnam
accounted for less than *** percent of total shipments. However, the responding firms project
increasing home market sales to *** percent of total shipments by 2018. Exports of CSPV
modules to the United States, which accounted for *** percent of total shipments by the
responding Vietnamese producers in 2016, increased from *** kW in 2012 to almost *** kW in
2016. They project further increases in their exports to the United States in 2017 and 2018,
although they expect U.S. exports will account for a declining share of total shipments as they
expect greater increases for exports to non‐U.S. and non‐EU markets. The EU export market for
CSPV modules produced in Vietnam accounted for *** percent of the responding Vietnamese
producers’ total shipments in 2016 and other non‐U.S. export markets accounted for ***
percent of total shipments. Major export markets identified by producers in Vietnam for CSPV
modules include ***.
Home market
Regarding competition with imports of CSPV products in their home market, four firms
in Vietnam indicated that they do not compete with imports in the home market, whereas one
firm (***) indicated that it has competed with imports in the home market since January 1,
2012. Concerning the import competition in its home market, *** noted “***.”

IV‐140
Export markets
Producers of CSPV products in Vietnam identified export markets other than the United
States that they have developed or where they have increased sales since January 1, 2012
including ***. There were no trade barriers identified in this investigation with respect to
certain CSPV products originating in Vietnam.80 Export data compiled by the GTA for Vietnam
are not presented in this report because data specific to PV products are not available.
The industries in other countries with free trade agreements with the United States
Although the foreign producer questionnaire was available on the Commission’s website
for download and completion by firms, the Commission did not receive any responses to its
questionnaire in this proceeding from firms in Australia, CAFTA‐DR countries, Colombia, Israel,
Jordan, Panama, or Peru.
80 For further information on trade barriers in third‐country markets, see section titled “Restraints on Exports to, or on Imports into, Third‐Country Markets” in Part I of this report.

IV‐141
Australia
Overview
Tindo Solar, which is wholly Australian owned, is the sole known CSPV producer in
Australia. The firm started production in 2012 at its plant in Adelaide, with a maximum
production capacity for multicrystalline silicon (mc‐Si) modules of 60 MW throughout the
period of investigation. Tindo produces both DC and AC panels with 250W output that are sold
to both wholesale and retail PV markets.81 Production data are not available.
Exports
Export data compiled by GTA for Australia are not presented because data specific to PV
products are not available.
81 IEA, National Survey Report of PV Power Applications in AUSTRALIA 2015, http://www.iea‐pvps.org/?id=93.

IV‐142
CAFTA‐DR
Overview
Of the CAFTA‐DR member countries, only the Dominican Republic and El Salvador are
known to have had capacity to produce CSPV modules during the period of investigation. In the
Dominican Republic, Fluitecnik SA (Spain) opened a 12 MW CSPV module production facility in
2008.82 In El Salvador, Alba Petróleos and Speedtech Energy (Taiwan) operate a 15 MW capacity
CSPV module plant that started production in 2015.83
Exports
Export data compiled by GTA for the Dominican Republic and El Salvador are not
presented because data specific to PV products are not available.
82 Bloomberg New Energy Finance database, https://about.bnef.com/, accessed April 27, 2017. 83 Bloomberg New Energy Finance database, https://about.bnef.com/, accessed April 27, 2017;
Inaugurada primera fábrica de módulos solares de Centroamérica, March 2, 2015, https://www.pv‐magazine‐latam.com/2015/03/02/inaugurada‐primera‐fbrica‐de‐mdulos‐solares‐de‐centroamrica/.

IV‐143
Jordan
Overview
Philadelphia Solar is the only known CSPV producer in Jordan. It produces both
monocrystalline and multicrystalline modules, and has an annual production capacity of 120
MW.84
Exports
Export data compiled by GTA for Jordan are not presented because data specific to PV
products are not available.
Panama
Overview
Visel Group is the only producer identified in Panama. The firm produces PV modules,
and has a production capacity of 15 MW at its plant in Panama. The firm produces
monocrystalline and multicrystalline modules from 80 to 340 watts for grid‐connected and off‐
grid applications, though it is not clear whether all of these products are produced at their plant
in Panama.85
Exports
Export data compiled by GTA for Panama are not presented because data specific to PV
products are not available.
84 LinkedIn Website, https://www.linkedin.com/company/philadelphia‐solar (accessed July 21, 2017). 85 The firm also has 35 MW of production capacity in China. Visel Group, “Moving the Sun Light to the
World,” pp. 14, 17–18, http://viselpaneles.com/sites/default/files/viselpaneles.pdf (accessed July 21, 2017).

IV‐144
Other countries with FTAs
No production of CSPV cells or modules was identified for other FTA partner countries
not otherwise separately presented in this part of the report, including Colombia, Israel, and
Peru or in countries benefitting from the Caribbean Basin Economic Recovery Act preferential
trade act program.
The industries in other countries
Brazil
Overview
The foreign producer questionnaire was available on the Commission’s website for
download and completion by firms in Brazil. One firm in Brazil responded to the Commission’s
questionnaire with useable information, accounting for less than *** percent of 2016 module
production capacity in Brazil. Table IV‐77 identifies the Brazilian producer of CSPV modules that
responded to the Commission’s questionnaire and certain summary data reported in that
response.
Table IV-77
CSPV products: Summary data on firms in Brazil, January 2012 through December 2016
Firm Production
(kW)
Share of reported
production (percent)
Exports to the United
States (kW)
Share of reported exports to the United States
(percent)
Total shipments
(kW)
Share of firm's total
shipments exported
to the United States
(percent) CSPV modules:
Flextronics *** *** *** *** *** ***Total *** *** *** *** *** ***
Note.--Foreign producer data on module assembly does not necessarily equate to the country-of-origin classification used for U.S. import statistics. Source: Compiled from data submitted in response to Commission questionnaires.

IV‐145
Changes in operations
One producer in Brazil reported operational and organizational changes since January 1,
2012 (table IV‐78).
Table IV-78 CSPV products: Brazilian producers’ reported changes in operations, since January 1, 2012
Firm Description of change *** *** Source: Compiled from data submitted in response to Commission questionnaires.
Anticipated changes in operations
Regarding anticipated changes in the character of their operations relating to CSPV
products in the future, the producer in Brazil reported that it does not anticipate any changes in
the character of its CSPV operations.
Operations on CSPV cells
There was no capacity to produce CSPV cells reported by the sole responding firm in
Brazil.
Operations on CSPV modules
The sole responding firm in Brazil began production in 2016 so there are no historic data
to compare. The producer projects higher capacity, production, and shipments in 2017 and
2018 compared with 2016 levels (Table IV‐79). The capacity utilization for the firm producing
CSPV modules in Brazil was *** percent during 2016 and the firm ***. Home market sales
accounted for *** percent of total shipments by the Brazilian producer in 2016 and the
producer projects this will continue in 2017 and 2018. The producer *** CSPV modules in 2016
and *** in 2017 or 2018.

IV‐146
Table IV-79 CSPV modules: Data on the industry in Brazil, 2012-16 and projected 2017-18
Item
Actual experience Projections
Calendar year
2012 2013 2014 2015 2016 2017 2018
Quantity (kW)
Capacity *** *** *** *** *** *** ***
Production *** *** *** *** *** *** ***
End-of-period inventories *** *** *** *** *** *** ***Shipments: Home market: Internal consumption/ transfers *** *** *** *** *** *** *** Commercial Shipments *** *** *** *** *** *** *** Subtotal, home market shipments *** *** *** *** *** *** ***
Export shipments to: United States *** *** *** *** *** *** ***
European Union *** *** *** *** *** *** ***
All other markets *** *** *** *** *** *** ***
Total exports *** *** *** *** *** *** ***
Total shipments *** *** *** *** *** *** ***
Ratios and shares (percent)
Capacity utilization *** *** *** *** *** *** ***
Inventories/production *** *** *** *** *** *** ***Inventories/total shipments *** *** *** *** *** *** ***Share of shipments: Home market: Internal consumption/ transfers *** *** *** *** *** *** *** Commercial Shipments *** *** *** *** *** *** *** Subtotal, home market shipments *** *** *** *** *** *** ***
Export shipments to: United States *** *** *** *** *** *** ***
European Union *** *** *** *** *** *** ***
All other markets *** *** *** *** *** *** ***
Total exports *** *** *** *** *** *** ***
Total shipments *** *** *** *** *** *** ***Source: Compiled from data submitted in response to Commission questionnaires.

IV‐147
According to publicly available information, the number of PV module producers in
Brazil increased from one prior to 2015 to at least nine as of July 2017. Production capacity
during this time period increased from 25 MW to more than 1 GW.86 In order to qualify for
financing by the National Bank for Economic and Social Development (“BNDES”), the Brazilian
Development bank for Brazilian projects, companies are required to assemble modules in
Brazil.87
Home market
Regarding competition with imports of CSPV products in the home market, the producer
in Brazil that indicated that it competes with imports in the home market noted that the trend
in home market competition with imports has increased since January 1, 2012 because the
firm’s production began in 2016.
86 BYD, “BYD Launches R$150 Million Solar Panel Factory in Brazil,” News release, April 9, 2017, http://www.byd.com/news/news‐391.html; Canadian Solar, “Canadian Solar Opens Brazil's Largest Capacity Solar Module Manufacturing Facility,” News release, December 12, 2016, http://investors.canadiansolar.com/phoenix.zhtml?c=196781&p=irol‐newsArticle&ID=2228908; Globo Brasil Website, http://www.paineisglobobrasil.com.br/globobrasil (accessed July 23, 2017); Lopez, Blanca Diaz and Edgar Meza, “Brazil: Pure Energy Secures $10 Million for New Module Fab,” PV Magazine, January 7, 2015, https://www.pv‐magazine.com/2015/01/07/brazil‐pure‐energy‐secures‐10‐million‐for‐new‐module‐fab_100017679/; Photon.info, “Soliker to Build PV Module Factory in Brazilian State of Tocantins,” March 4, 2015, https://www.photon.info/en/news/soliker‐build‐pv‐module‐factory‐brazilian‐state‐tocantins; Osborne, Mark, “S4 Solar do Brazil Readies Module Production in Brazil,” PV tech, June 3, 2016, https://www.pv‐tech.org/news/s4‐solar‐do‐brazil‐readies‐module‐production‐in‐brazil; Associação Brasileira de Distribuidores e Processadores de Vidros Planos (Abravidro) Website, http://abravidro.org.br/en/uma‐luz‐para‐o‐nosso‐setor/ (accessed July 23, 2017); Ministry of Economic Affairs of The Netherlands, Market Study: PV Energy in Brazil,” April 23, 2015, p. 15, https://www.rvo.nl/sites/default/files/2015/04/Final%20‐%20Solar%20PV%20Study%20Brazil%2024%20April%202015.v2.pdf.
87 Starting in 2020, BNDES will also require domestic cell production. Kenning, Tom, “Brazil Solar Policy Needed to Support Domestic Manufacturing – Absolar,” PV Tech, September 7, 2015, https://www.pv‐tech.org/news/specific_policy_needed_for_brazilian_solar_manufacturing_absolar.

IV‐148
Export markets
The responding producer of CSPV products in Brazil did not identify any major export
markets other than the United States that it had developed or where it had increased sales
since January 1, 2012. There were no trade barriers identified in this proceeding with respect to
certain CSPV products originating in Brazil.88
According to GTA, the leading export markets for CSPV cells and modules from Brazil are
Colombia, Paraguay, the United States, and Germany (table IV‐80). The leading export market
for CSPV products from Brazil during 2016 was Colombia, which accounted for 36.3 percent of
total exports. Paraguay, the United States, and Germany accounted for 12.5, 12.1, and 10.9
percent of total exports from Brazil during 2016, respectively.
88 For further information on trade barriers in third‐country markets, see section titled “Restraints on Exports to, or on Imports into, Third‐Country Markets” in Part I of this report.

IV‐149
Table IV-80 CSPV products: Brazil exports by destination market, 2012-16
Destination market Calendar year
2012 2013 2014 2015 2016 Value (1,000 dollars) Brazil exports to the United States 1 1 10 1 9 Brazil exports to other major destination markets.-- Colombia 2 8 1 0 26
Paraguay 0 6 2 8 9 Germany 2 10 17 0 8 Chile 7 --- 1 1 4 Argentina 5 2 13 15 4 Ecuador 4 1 1 1 3 Uruguay 4 1 1 2 3 Bolivia 2 0 --- 3 2All other destination markets 61 34 73 118 4
Total Brazil exports 89 63 117 149 71 Share of value (percent) Brazil exports to the United States 1.3 1.5 8.4 0.8 12.1 Brazil exports to other major destination markets.-- Colombia 2.0 12.8 1.0 0.3 36.3
Paraguay 0.4 9.8 1.3 5.2 12.5 Germany 2.7 15.3 14.3 0.0 10.9 Chile 8.2 --- 0.4 0.9 5.7 Argentina 5.6 3.4 10.9 9.8 5.3 Ecuador 4.3 0.8 0.6 0.9 4.1 Uruguay 4.0 1.1 0.9 1.3 3.9 Bolivia 2.5 0.4 --- 1.8 3.3 All other destination markets 69.0 54.8 62.1 79.1 6.0
Total Brazil exports 100.0 100.0 100.0 100.0 100.0 Source: Official exports statistics under Brazil-specific HS numbers 8541.40.16, 8541.40.32 and 8541.40.39 as reported by Brazil's statistical authority in the GTA database, accessed July 14, 2017.

IV‐150
Germany
Overview
The Commission issued foreign producer questionnaires to 35 firms believed to produce
CSPV products in Germany. Five firms in Germany responded to the Commission’s
questionnaire with useable information, accounting for all known cell capacity and 51 percent
of module production capacity in Germany in 2016. Table IV‐81 lists the German producers of
CSPV cells and modules that responded to the Commission’s questionnaire and certain
summary data reported in those responses. *** producer, accounting for *** percent of
reported CSPV cell production and *** percent of reported CSPV module production in
Germany during 2012‐16.
Table IV-81 CSPV cells: Summary data on responding firms in Germany, January 2012 to December 2016, by product type
Firm Production
(kW)
Share of reported
production (percent)
Exports to the United States (kW)
Share of reported
exports to the United
States (percent)
Total shipments
(kW)
Share of firm's total shipments exported to the United
States (percent)
CSPV cells: Aleo Solar *** *** *** *** *** ***Aleo Sunrise *** *** *** *** *** ***Astroenergy *** *** *** *** *** ***Hanwha *** *** *** *** *** ***SolarWorld *** *** *** *** *** ***Total *** *** *** *** *** ***CSPV modules: Aleo Solar *** *** *** *** *** ***Aleo Sunrise *** *** *** *** *** ***Astroenergy *** *** *** *** *** ***Hanwha *** *** *** *** *** ***SolarWorld *** *** *** *** *** ***Total *** *** *** *** *** ***Note.--Foreign producer data on module assembly does not necessarily equate to the country-of-origin classification used for U.S. import statistics. The module assemblers in Germany reported ***.
Source: Compiled from data submitted in response to Commission questionnaires.

IV‐151
Changes in operations
Three of the responding producers in Germany reported operational or organizational
changes since January 1, 2012 (table IV‐82).
Table IV-82 CSPV products: German producers’ reported changes in operations, since January 1, 2012
Item/firm Reported changes in operations Plant closings: *** *** Expansions: *** *** Acquisitions/mergers/buyouts: *** *** *** *** *** *** Consolidations: *** *** Prolonged shutdowns or curtailments: *** *** *** *** Table continued on following page.
IV‐152
Table IV-82—Continued CSPV products: German producers’ reported changes in operations, since January 1, 2012
Item/firm Reported changes in operations Technology: *** *** *** *** *** *** Other: *** *** *** *** Source: Compiled from data submitted in response to Commission questionnaires.

IV‐153
Anticipated changes in operations
Regarding anticipated changes in the character of their operations relating to CSPV
products in the future, four producers in Germany reported that they did not anticipate any
changes in the character of their CSPV operations, whereas one firm (***) reported the
following concerning changes it anticipated (table IV‐83).
Table IV-83 CSPV products: German producers’ anticipated changes in operations
Firm Details concerning anticipated changes *** *** Source: Compiled from data submitted in response to Commission questionnaires.
Operations on CSPV cells
German capacity, production, inventories, and shipments increased from 2012 to 2016
(table IV‐84). Aggregate capacity and production were *** greater in 2016 than the level
reported in 2012, while capacity utilization for firms producing CSPV cells in Germany
fluctuated between *** and *** percent during 2012‐16. Year‐end inventories of CSPV cells
fluctuated somewhat but increased overall by *** percent at year‐end 2016 over the level
reported at year‐end 2012.
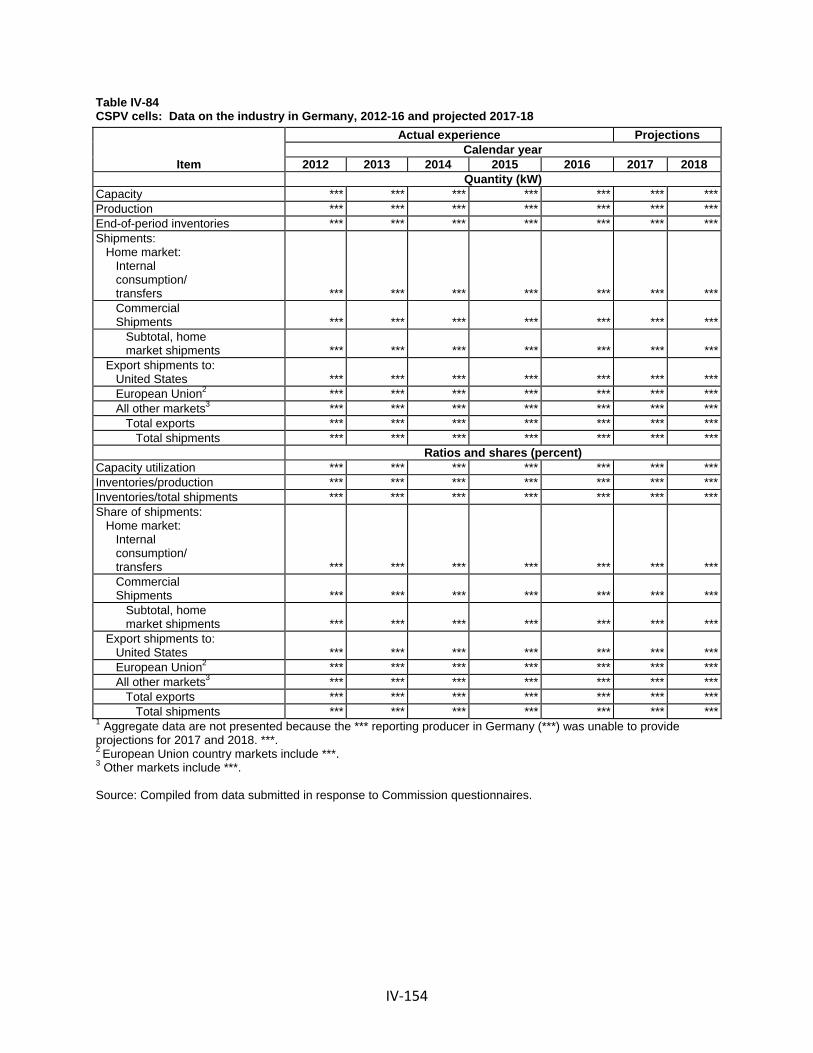
IV‐154
Table IV-84 CSPV cells: Data on the industry in Germany, 2012-16 and projected 2017-18
Item
Actual experience ProjectionsCalendar year
2012 2013 2014 2015 2016 2017 2018 Quantity (kW)
Capacity *** *** *** *** *** *** ***Production *** *** *** *** *** *** ***End-of-period inventories *** *** *** *** *** *** ***Shipments: Home market: Internal consumption/ transfers *** *** *** *** *** *** *** Commercial Shipments *** *** *** *** *** *** *** Subtotal, home market shipments *** *** *** *** *** *** *** Export shipments to: United States *** *** *** *** *** *** *** European Union2 *** *** *** *** *** *** *** All other markets3 *** *** *** *** *** *** *** Total exports *** *** *** *** *** *** *** Total shipments *** *** *** *** *** *** *** Ratios and shares (percent) Capacity utilization *** *** *** *** *** *** ***Inventories/production *** *** *** *** *** *** ***Inventories/total shipments *** *** *** *** *** *** ***Share of shipments: Home market: Internal consumption/ transfers *** *** *** *** *** *** *** Commercial Shipments *** *** *** *** *** *** *** Subtotal, home market shipments *** *** *** *** *** *** *** Export shipments to: United States *** *** *** *** *** *** *** European Union2 *** *** *** *** *** *** *** All other markets3 *** *** *** *** *** *** *** Total exports *** *** *** *** *** *** *** Total shipments *** *** *** *** *** *** ***1 Aggregate data are not presented because the *** reporting producer in Germany (***) was unable to provide projections for 2017 and 2018. ***. 2 European Union country markets include ***. 3 Other markets include ***. Source: Compiled from data submitted in response to Commission questionnaires.
IV‐155
Home market shipments, which were virtually all internal consumption of cells in the
production of modules, accounted for *** percent of total cell shipments by the responding
German producers in 2016. These home market shipments in 2016 were *** home market
shipments reported in 2012. Exports of CSPV cells to the United States, which accounted for
*** percent of total shipments by the responding German producers in 2016, increased from
*** kW in 2012 to *** kW in 2016. Other export markets for CSPV cells produced in Germany,
which accounted for *** percent of the responding German producers’ total shipments since
2012, include ***.

IV‐156
Operations on CSPV modules
Publicly available data for Germany indicated that module production capacity totaled
2,795 MW in 2016, down from 3,472 MW in 2011.89 SolarWorld AG,90 a fully integrated
manufacturer, is Germany’s largest PV firm. Manufacturing capacity at its two German locations
totaled 860 MW for modules in 2016. At least 18 other firms produce only modules, with a
combined production capacity of more than 1,935 MW.91
Reported questionnaire data show that German capacity, production, and total
shipments generally increased from 2012 to 2016 (table IV‐85). Capacity and production
increased by *** and *** percent, respectively, from 2012 to 2016, as one firm (***) opened
module assembly facilities and another (***) increased capacity in 2014. Capacity utilization for
firms producing CSPV modules in Germany fluctuated within the range of *** and *** percent
during 2012‐16. Likewise, inventories of CSPV modules, which were *** and *** percent of
production and total shipments, respectively, in 2016, fluctuated from 2012 to 2016.
89 Photovoltaics–Made In Germany, Germany Trade & Invest, October 2016. https://www.powerhouse‐eastern‐germany.de/PEG/Content/DE/Zukunftsfelder/Cleantech‐Industrie/pdf_solar.pdf?v=2; Lothar Wissing, National Survey Report of PV Power Applications in Germany 2011, p. 21, http://www.iea‐pvps.org/?id=93.
90 SolarWorld AG Filed for Bankruptcy in May 2017. Jonathan Gifford, “Breaking: SolarWorld Insolvent,” PV Magazine, May 10, 2017, https://www.pv‐magazine.com/2017/05/10/breaking‐solarworld‐insolvent/.
91 Photovoltaics–Made In Germany, Germany Trade & Invest, October 2016. https://www.powerhouse‐eastern‐germany.de/PEG/Content/DE/Zukunftsfelder/Cleantech‐Industrie/pdf_solar.pdf?v=2.

IV‐157
Table IV-85 CSPV modules: Data on the industry in Germany, 2012-16 and projected 2017-18
Item
Actual experience ProjectionsCalendar year
2012 2013 2014 2015 2016 2017 2018 Quantity (kW)
Capacity *** *** *** *** *** *** ***Production *** *** *** *** *** *** ***End-of-period inventories *** *** *** *** *** *** ***Shipments: Home market: Internal consumption/ transfers *** *** *** *** *** *** *** Commercial Shipments *** *** *** *** *** *** *** Subtotal, home market shipments *** *** *** *** *** *** *** Export shipments to: United States *** *** *** *** *** *** *** European Union2 *** *** *** *** *** *** *** All other markets3 *** *** *** *** *** *** *** Total exports *** *** *** *** *** *** *** Total shipments *** *** *** *** *** *** *** Ratios and shares (percent)Capacity utilization *** *** *** *** *** *** ***Inventories/production *** *** *** *** *** *** ***Inventories/total shipments *** *** *** *** *** *** ***Share of shipments: Home market: Internal consumption/ transfers *** *** *** *** *** *** *** Commercial Shipments *** *** *** *** *** *** *** Subtotal, home market shipments *** *** *** *** *** *** *** Export shipments to: United States *** *** *** *** *** *** *** European Union2 *** *** *** *** *** *** *** All other markets3 *** *** *** *** *** *** *** Total exports *** *** *** *** *** *** *** Total shipments *** *** *** *** *** *** ***1 Aggregate data are not presented because the *** reporting producer in Germany (***) was unable to provide projections for 2017 and 2018. SolarWorld explained ***. 2 European Union country markets include ***. 3 Other markets include ***. 4 ***. Source: Compiled from data submitted in response to Commission questionnaires.

IV‐158
Home market shipments, which were virtually all commercial sales during 2012‐16,
accounted for *** percent of total CSPV module shipments by the responding German
producers in 2016. These home market shipments declined by *** percent from 2012 to 2014,
before increasing in 2015 and 2016 to a level in 2016 that was *** percent below that reported
in 2012. Exports of CSPV modules to the United States, which accounted for *** percent of
total shipments by the German producers in 2016, increased from *** kW in 2012 to *** kW in
2016. Other export markets for CSPV modules produced in Germany accounted for a relatively
large and increasing share of the German producers’ total shipments. Exports of CSPV modules
to other countries in the European Union accounted for *** percent of total shipments by
German producers in 2016. European Union export markets identified by producers in Germany
for CSPV modules include ***. Exports to other third market countries accounted for ***
percent of total shipments by German producers in 2016. These third market countries
identified by responding producers in Germany include ***.
Home market
Regarding competition with imports of CSPV products in their home market, one
producer in Germany indicated that it did not compete with imports in the home market. Three
of the remaining responding producers in Germany that indicated that they compete with
imports in the home market noted that the trend in home market competition with imports has
increased since January 1, 2012, whereas the others noted that competition with imports has
either been constant or fluctuated over time. Individual company explanations for trends in
home market competition with imports include the following:
***: “***.”

IV‐159
***: “***.”
***: “***.”
IV‐160
Export markets
Responding producers of CSPV products in Germany identified export markets other
than the United States that they have developed or where they have increased sales since
January 1, 2012 including ***. SolarWorld noted that “***.”
There were no trade barriers identified in these proceedings with respect to certain
CSPV products originating in Germany.92 Export data compiled by the GTA for Germany are not
presented in this report because data specific to PV products are not available.
92 For further information on trade barriers in third‐country markets, see section titled “Restraints on Exports to, or on Imports into, Third‐Country Markets” in Part I of this report.

IV‐161
The Netherlands
Overview
The foreign producer questionnaire was available on the Commission’s website for
download and completion by firms in the Netherlands. One firm in the Netherlands responded
to the Commission’s questionnaire with useable information, accounting for all known
production of CSPV products in the Netherlands. Table IV‐86 lists the producer of CSPV cells in
the Netherlands that responded to the Commission’s questionnaire and certain summary data
reported in the response.
Table IV-86 CSPV cells: Summary data on responding firms in the Netherlands, January 2012 to December 2016
Firm Production
(kW)
Share of reported
production (percent)
Exports to the United
States (kW)
Share of reported exports to the United States
(percent)
Total shipments
(kW)
Share of firm's total
shipments exported
to the United States
(percent) CSPV cells:
Trina Solar *** *** *** *** *** ***Total *** *** *** *** *** ***
Note.--Foreign producer data on module assembly does not necessarily equate to the country-of-origin classification used for U.S. import statistics. Source: Compiled from data submitted in response to Commission questionnaires.
Changes in operations
The responding producer in the Netherlands reported operational or organizational
changes since January 1, 2012 (table IV‐87).

IV‐162
Table IV-87 CSPV products: Reported changes in operations by the producer in the Netherlands, since January 1, 2012
Firm Description of change *** *** Source: Compiled from data submitted in response to Commission questionnaires.
Anticipated changes in operations
Regarding anticipated changes in the character of their operations relating to CSPV
products in the future, the producer in the Netherlands reported ***.
Operations on CSPV cells
The only responding firm in the Netherlands began production in 2016 so there are no
historic data to compare. The producer projects significantly lower capacity, production, and
shipments in 2017 and 2018 compared with 2016 levels (table IV‐88). The capacity utilization
for the firm producing CSPV cells in the Netherlands was *** percent in 2016. Home market
sales accounted for *** percent of total shipments by producers in the Netherlands and the
producer *** in 2016. Export markets other than the United States for CSPV cells produced in
the Netherlands accounted for *** percent of the responding Dutch producer’s total shipments
in 2016 and the company projects future production will be *** in 2017 and 2018. Other major
export markets identified by the producer in the Netherlands for CSPV cells include ***.

IV‐163
Table IV-88 CSPV cells: Data on the industry in the Netherlands, 2012-16 and projected 2017-18
Item
Actual experience Projections
Calendar year
2012 2013 2014 2015 2016 2017 2018
Quantity (kW)
Capacity *** *** *** *** *** *** ***
Production *** *** *** *** *** *** ***
End-of-period inventories *** *** *** *** *** *** ***Shipments: Home market: Internal consumption/ transfers *** *** *** *** *** *** *** Commercial shipments *** *** *** *** *** *** *** Subtotal, home market shipments *** *** *** *** *** *** ***
Export shipments to: United States *** *** *** *** *** *** ***
European Union *** *** *** *** *** *** ***
All other markets1 *** *** *** *** *** *** ***
Total exports *** *** *** *** *** *** ***
Total shipments *** *** *** *** *** *** ***
Ratios and shares (percent)
Capacity utilization *** *** *** *** *** *** ***
Inventories/production *** *** *** *** *** *** ***Inventories/total shipments *** *** *** *** *** *** ***Share of shipments: Home market: Internal consumption/ transfers *** *** *** *** *** *** *** Commercial shipments *** *** *** *** *** *** *** Subtotal, home market shipments *** *** *** *** *** *** ***
Export shipments to: United States *** *** *** *** *** *** ***
European Union *** *** *** *** *** *** ***
All other markets1 *** *** *** *** *** *** ***
Total exports *** *** *** *** *** *** ***
Total shipments *** *** *** *** *** *** ***1 Other markets include ***. Source: Compiled from data submitted in response to Commission questionnaires.

IV‐164
Operations on CSPV modules
The responding producer/exporter in the Netherlands did not report any production or
exports of CSPV modules in 2016, nor did it project any future production for 2017 and 2018.
Home market
Regarding competing with imports of CSPV products in its home market, the only firm
the Netherlands that responded to the questionnaire indicated that it does not compete with
imports in the home market.
Export markets
The producer of CSPV products in the Netherlands did not identify any export markets
that it has developed or where it increased sales because 2016 was its first year in operation.
There were no trade barriers identified in these proceedings with respect to certain CSPV
products originating in the Netherlands.93 Export data compiled by the GTA for the Netherlands
are not presented in this report because data specific to PV products are not available.
The responding industries combined
Combined information on the CSPV product operations of the 101 producers/exporters
in all 16 countries that provided responses to the Commission’s foreign producer/exporter
questionnaire in this investigation for calendar years 2012‐16, as well as their combined
projections for 2017‐18, is presented in table VII‐89 (CSPV cells) and table VI‐90 (CSPV
modules).
93 For further information on trade barriers in third‐country markets, see section titled “Restraints on Exports to, or on Imports into, Third‐Country Markets” in Part I of this report.

IV‐165
Table IV-89
CSPV cells: Data on industry in all sources, 2012-16 and projected calendar years 2017 and 2018
Item
Actual experience Projections
Calendar year
2012 2013 2014 2015 2016 2017 2018
Quantity (kW)
Capacity 27,337,286 31,220,500 36,439,876 43,341,003 56,877,024 65,476,392 70,185,416
Production 18,401,207 23,968,755 31,231,437 37,959,187 47,958,366 56,741,719 62,510,568End-of-period inventories 664,204 858,421 1,422,907 1,451,376 2,438,250 2,208,907 2,351,748Shipments: Home market: Internal consumption/ transfers 11,957,204 14,842,865 20,201,636 23,910,251 34,087,283 41,816,479 46,324,708 Commercial shipments 1,299,882 1,577,769 1,607,903 4,146,612 3,113,585 4,228,746 4,496,413 Subtotal, home market shipments 13,257,086 16,420,634 21,809,539 28,056,863 37,200,868 46,045,225 50,821,121 Export shipments to: United States 274,108 247,001 117,695 252,896 607,797 439,855 536,685
European Union 1,689,294 1,721,314 1,627,561 1,925,903 1,441,285 1,637,417 1,667,336
All other markets 3,069,039 5,373,824 7,055,581 7,688,450 7,842,416 8,729,700 9,375,508
Total exports 5,032,441 7,342,139 8,800,837 9,867,249 9,891,498 10,806,972 11,579,529 Total shipments 18,289,527 23,762,773 30,610,376 37,924,11 47,092,366 56,852,197 62,400,650
Ratios and shares (percent)
Capacity utilization 67.3 76.8 85.7 87.6 84.3 86.7 89.1
Inventories/production 3.6 3.6 4.6 3.8 5.1 3.9 3.8Inventories/total shipments 3.6 3.6 4.6 3.8 5.2 3.9 3.8Share of shipments: Home market: Internal consumption/ transfers 65.4 62.5 66.0 63.0 72.4 73.6 74.2 Commercial shipments 7.1 6.6 5.3 10.9 6.6 7.4 7.2 Subtotal, home market shipments 72.5 69.1 71.2 74.0 79.0 81.0 81.4
Export shipments to: United States 1.5 1.0 0.4 0.7 1.3 0.8 0.9
European Union 9.2 7.2 5.3 5.1 3.1 2.9 2.7
All other markets 16.8 22.6 23.0 20.3 16.7 15.4 15.0
Total exports 27.5 30.9 28.8 26.0 21.0 19.0 18.6 Total shipments 100.0 100.0 100.0 100.0 100.0 100.0 100.0Source: Compiled from data submitted in response to Commission questionnaires.

IV‐166
Table IV-90
CSPV modules: Data on industry in all sources, 2012-16 and projected calendar years 2017 and 2018
Item
Actual experience Projections
Calendar year
2012 2013 2014 2015 2016 2017 2018
Quantity (kW)
Capacity 25,220,42 29,175,177 36,411,804 47,912,657 66,611,870 75,849,494 101,319,724
Production 15,789,716 20,848,784 28,619,986 38,441,620 51,430,556 63,146,950 70,921,329End-of-period inventories 1,469,841 1,632,198 2,754,735 3,090,425 3,963,102 4,152,019 4,369,156Shipments: Home market: Internal consumption/ transfers 1,118,524 2,392,560 2,878,762 3,407,500 3,617,734 6,482,549 8,497,106 Commercial shipments 2,327,088 4,874,199 6,665,802 11,274,345 18,473,701 23,084,322 25,786,450 Subtotal, home market shipments 3,445,612 7,266,759 9,544,564 14,681,845 22,091,435 29,566,871 34,283,556 Export shipments to: United States 2,311,545 3,208,589 4,727,225 7,828,975 11,822,895 8,772,953 8,439,592
European Union 5,396,870 4,080,856 4,400,864 3,926,287 4,369,185 4,808,192 5,734,442
All other markets 4,270,515 6,176,012 9,040,159 11,619,823 11,822,125 19,720,333 21,989,157
Total exports 11,978,930 13,465,457 18,168,248 23,375,085 28,014,205 33,301,478 36,163,191 Total shipments 15,424,542 20,732,216 27,712,812 38,056,930 50,105,640 62,868,349 70,446,747
Ratios and shares (percent)
Capacity 62.6 71.5 78.6 80.2 77.2 83.3 70.0
Production 9.3 7.8 9.6 8.0 7.7 6.6 6.2End-of-period inventories 9.5 7.9 9.9 8.1 7.9 6.6 6.2Shipments: Home market: Internal consumption/ transfers 7.3 11.5 10.4 9.0 7.2 10.3 12.1 Commercial shipments 15.1 23.5 24.1 29.6 36.9 36.7 36.6 Subtotal, home market shipments 22.3 35.1 34.4 38.6 44.1 47.0 48.7 Export shipments to: United States 15.0 15.5 17.1 20.6 23.6 14.0 12.0
European Union 35.0 19.7 15.9 10.3 8.7 7.6 8.1
All other markets 27.7 29.8 32.6 30.5 23.6 31.4 31.2
Total exports 77.7 64.9 65.6 61.4 55.9 53.0 51.3 Total shipments 100.0 100.0 100.0 100.0 100.0 100.0 100.0Source: Compiled from data submitted in response to Commission questionnaires.

V‐1
PART V: OTHER COMPETITIVE DYNAMICS OF THE U.S. MARKET
Market overview
As discussed in Part I, there are four primary market segments for CSPV products.1 The
three on‐grid market segments are residential, commercial, and utility. The off‐grid market
segment is relatively small and includes systems used in mobile power solutions,
telecommunications power and lighting, and portable consumer goods. However, the vast
majority of CSPV modules sold in the United States are connected to the grid.2 Modules vary in
size, nominal power output, and efficiency. Typical on‐grid modules have 60 to 72 cells and a
power output of between 240 watts and 340 watts.3 Residential and small commercial solar
installations typically use 60‐cell modules due to their higher conversion efficiency and smaller
size. The majority of utility‐scale projects now use 72‐cell modules which are typically less
expensive to install due to lower labor and balance of system costs.4 Overall, apparent U.S.
consumption of CSPV products increased, by quantity, *** percent from 2012 to 2016.5
U.S. installations of on‐grid PV systems have increased by 338 percent from 3,373 MW
in 2012 to 14,762 MW in 2016.6 All three on‐grid market segments (residential, commercial,
and utility) have experienced considerable growth in both the number of installations and the
1 CSPV products is defined as certain crystalline silicon photovoltaic cells, whether or not partially or
fully assembled into other products. 2 Hearing transcript, pp. 185‐86 (Card and Messer). 3 SEIA’s prehearing brief, p. 3 and appendix A, pp. 35‐36; and hearing transcript, p. 174 (Messer). 4 Previously, utilities also purchased 60‐cell modules, including 60‐cell monocrystalline modules. See,
e.g., CSPV 1, USITC Pub. 4360. 5 Overall, apparent U.S. consumption of 60‐cell CSPV modules increased by *** percent and apparent
U.S. consumption of 72‐cell CSPV modules increased by *** percent from 2012 to 2016. See Table C‐5. 6 In 2016, there were over 370,000 individual new PV systems installed in the United States. GTM
Research and the Solar Energy Industries Association (SEIA), U.S. Solar Market Insight: 2016 Year in Review, Executive Summary, 2017, p. 6.

V‐2
total wattage of installation projects during the period of investigation, with residential and
utility installations increasing by 423 percent and 488 percent, respectively, from 2012 to 2016
(figure V‐1).7 While there has been growth in the overall market for CSPV products, demand
trends vary across geographic markets, market segments, and customer types.
Figure V-1 Annual U.S. installations of PV solar by market segment, 2012-2016
Source: GTM Research and the Solar Energy Industries Association (SEIA), U.S. Solar Market Insight: 2012-2016 Year in Review, Executive Summaries.
U.S. installations of PV solar grew 97 percent from 2015 to 2016 (figure V‐1). This
growth, particularly in the utility segment, was driven by the anticipated expiration of the 30
percent federal Investment Tax Credit which had been scheduled to step down at the end of
7 According to the U.S. Energy Information Administration (EIA), the average size of a residential PV
system is 5 kW, commercial PV systems average 200 kW, and a utility scale project is defined as having a capacity of 1 MW and above. U.S. Energy Information Administration, “Utility‐scale solar has grown rapidly over the past five years,” May 4 2017, https://www.eia.gov/todayinenergy/detail.php?id=31072; and U.S. Energy Information Administration, “More than half of small‐scale photovoltaic generation comes from residential rooftops, June 1, 2017, https://www.eia.gov/todayinenergy/detail.php?id=31452. As the Commission noted in its prior AD/CVD investigations, the utility segment grew from the smallest segment of the U.S. market in 2009 to the largest by the first half of 2012. USITC Pub. 4360 at n.258.
0
2,000
4,000
6,000
8,000
10,000
12,000
2012 2013 2014 2015 2016
U.S
. in
stal
latio
ns (
MW
)
Residential Commercial Utility

V‐3
2016. The utility segment is the largest market segment.8 As of December 2016, more than
19,770 MW of utility‐scale solar PV generating capacity was in operation across the United
States, representing 60 percent of total U.S. solar PV installations.9 10 The majority of U.S.
importers’ U.S commercial shipments of imported CSPV products and *** of U.S. producers’
commercial shipments of CSPV products were sold to utilities during 2012‐16 (see Part I, table I‐
1).11
Utility project development is the most concentrated market segment, with the top nine
utility project developers accounting for 70 percent of the market in 2016.12 Utility‐scale
projects often involve a bidding process. 13 Bids are generally submitted by the project
8 GTM Research and the Solar Energy Industries Association (SEIA), U.S. Solar Market Insight: 2016
Year in Review, Executive Summary, 2017, pp. 7‐8. 9 U.S. Energy Information Administration, Electric Power Monthly, Table 6.1.A., July 31, 2017. 10 The average utility‐scale solar project has increased from 10 MW in 2014 to more than 17 MW in
2016. U.S. Energy Information Administration, “More than half of small‐scale photovoltaic generation comes from residential rooftops,” June 1, 2017, https://www.eia.gov/todayinenergy/detail.php?id=31452. According to respondent SEIA, 82 percent of utility‐scale installations were greater than 20 MW and 13 percent were less than 10 MW in 2016. SEIA’s posthearing brief, p. 6.
11 Respondent SEIA argues that SolarWorld and Suniva do not have the capacity to supply most utility‐scale projects, which typically use 72‐cell modules. SolarWorld reported that currently it is capable of supplying modules for projects up to ***, and that it has sold up to *** of modules for a single project during the period of investigation. SolarWorld’s posthearing brief, exh. 1, pp. 23‐26. SolarWorld stated that *** it added a U.S. 72‐cell module‐assembly line in 2016 due to increasing demand in the utility market. SolarWorld’s posthearing brief, p. 10. Suniva reported that 45 percent of its overall cell manufacturing capacity went into 72‐cell modules to service both the commercial and “small utility market” during the period. Hearing transcript, p. 164 (Card).
12 Energy Acuity, 2016 Solar Report: Utility Scale, March 2017, pp. 7, 11, https://www.energyacuity.com/energy‐acuity‐reports; Finlay Colville, “Top‐10 Solar Cell Producers in 2016,” PV Tech, January 30, 2017, https://www.pv‐tech.org/editors‐blog/top‐10‐solar‐cell‐producers‐in‐2016. See Part I for more information.
13 Both Suniva and SolarWorld provided their firms’ bids on utility projects during 2012‐16. SolarWorld provided a list of *** utility‐scale projects, totaling *** that it bid on during the period. Of these bids, SolarWorld won *** projects totaling *** and supplied an additional *** of modules to customers for utility projects through supply agreements with various companies. SolarWorld reported that it has supply agreements with *** and therefore, has limited information on specific bid proposals for which SolarWorld’s modules were used. SolarWorld’s posthearing brief, exh. 1, pp. 22‐23. Suniva

V‐4
developers or engineering, procurement, and construction (“EPC”) firms; once a contract has
been awarded, the EPC will enter into a supply agreement with a manufacturer to source
modules.14 15 The utility segment is acutely price sensitive and bids can often involve price
renegotiations throughout the project.16
U.S. supply
U.S. producers’ capacity and production of CSPV cells increased year‐on‐year
throughout the period. Additionally, global capacity to produce CSPV cells increased rapidly
from 2012 to 2016, with China and Taiwan accounting for the largest share of global
production.17 Table V‐1 reports U.S. producers’ and major foreign producers’ capacity, capacity
utilization, inventories of CSPV cells, as well as sales of CSPV modules to various markets in
2012 and 2016.
provided a list of *** utility‐scale bids, which totaled *** during 2012‐16. Suniva’s posthearing brief, exh. 9, pp. 1‐2 and attachment A.
14 SolarWorld’s posthearing brief, pp. 22‐23; and staff correspondence with ***. 15 According to NRG, one of the largest independent power producers in the United States, it
specifies the design of a module required for a utility project three years in advance of construction, solicits RFPs approximately 12 months from construction, and makes its final module selection no later than 6 months before the start of construction. NRG stated that its projects can reach 200 MW in size. Hearing transcript, pp. 320‐322 (Cornelius).
16 Hearing transcript, pp. 175, 183, and 320‐321 (Card, Messer, and Cornelius); SEIA’s posthearing brief, appendix A, p. 36.
17 IEA PVPS, Trends 2016 in Photovoltaic Power Applications, Report IEA PVPS T1‐30:2016, 2016, p. 48, http://www.iea‐pvps.org/fileadmin/dam/public/report/national/Trends_2016_‐_mr.pdf. See Part IV for more information.

V‐5
Table V-1 CSPV products: U.S. and foreign producers’ capacity, capacity utilization, inventories, ability to shift to alternate products, and sales to various markets
* * * * * * *
V‐6
Table V-1—Continued CSPV products: U.S. and foreign producer capacity, capacity utilization, inventories, ability to shift to alternate products, and sales to various markets
* * * * * * *
U.S. producers
U.S. producers’ overall capacity and production for CSPV cells increased during 2012‐16.
Domestic capacity utilization for CSPV cells increased from *** percent in 2012 to *** percent
in 2016 (table V‐1).18 However, U.S. producers’ capacity is slightly overstated in 2016. Tesla
began the process to open a manufacturing facility in Buffalo, NY to produce CSPV cells and
modules in 2016; however, this capacity is not currently being used for U.S. production and
represented *** percent of total domestic capacity in 2016 .19 ***
18 Domestic capacity utilization for CSPV modules fluctuated during the period, decreasing from ***
percent in 2012 to *** percent in 2016. 19 The small quantities (***) of U.S. CSPV cells produced by Tesla in 2016 were all used for R&D at its
Fremont, CA facility. Tesla anticipates that it will begin production of 1 GW of CSPV cells and modules annually in 2019. Tesla 10‐Q Quarterly Report, August 4, 2017, p. 4, http://ir.tesla.com/sec.cfm?view=all.

V‐7
***.20
U.S. producers’ inventories of CSPV cells, as a ratio to total shipments, fell from ***
percent in 2012 to *** percent in 2016; and U.S. producers’ inventories of CSPV modules, as a
ratio to total shipments, increased overall from *** percent in 2012 to *** percent in 2016.,
with U.S. producers reporting that they generally sell produced‐to‐order products (see “Lead
Times” later in this chapter). Export shipments of both CSPV cells and modules represented a
small share of U.S. producers’ total shipments during 2012‐16; ***.
Based on available information, U.S. producers of CSPV products have the ability to
respond to changes in demand with small to moderate changes in the quantity of shipments of
U.S.‐produced CSPV products to the U.S. market.21 The main contributing factors to this degree
20 Domestic capacity and production for CSPV cells continued to change during 2016 and the first half
of 2017. Mission Solar, which accounted for *** percent of U.S. production during 2016, closed its cell production lines in September 2016 and its cell manufacturing lines are currently for sale. Suniva expanded its production capacity of CSPV cells in July 2016. ***. In addition, SunPower reported that it opened a $25 million R&D facility which produces CSPV cells in California which it can scale up to megawatts. Hearing transcript, p. 328 (Werner). See Part III for more information. Petitioners argue that the domestic industry has the ability to rapidly scale up CSPV cell production capacity. Hearing transcript, pp. 154‐157 (Payne, Card, and Brightbill).
21 Staff’s U.S. supply analysis is based on the supply of U.S. CSPV cells, whether or not partially or fully assembled into other products. CSPV cells are used only in the production of CSPV modules and the production of modules requires CSPV cells. Therefore, the supply analysis is heavily weighted on the production and capacity of CSPV cells, but also takes into account inventory and export levels of CSPV modules which contain CSPV cells.

V‐8
of responsiveness of supply are the overall domestic capacity level, some unused capacity,
some inventories and limited ability to shift shipments from alternate markets.22 23
Foreign producers
Foreign producers’ reported CSPV cell capacity increased substantially in the nine
identified countries (table V‐1). Data for responding foreign producers suggest that capacity
utilization for CSPV cells is moderately high. In general, foreign producers’ inventories of CSPV
cells, as a ratio to total shipments, were small. Similarly to U.S. producers, most responding
importers reported that they generally sell produced‐to‐order products. The vast majority of
U.S. imports of CSPV products entered the United States as CSPV modules. Foreign producers
ship substantial amounts of CSPV modules to non‐U.S. markets. The vast majority of responding
foreign producers reported that they could not produce other products with the same
equipment and workers used to produce CSPV products.
Based on available information, foreign producers of CSPV products have the ability to
respond to changes in demand with large changes in the quantity of shipments of CSPV
products to the U.S. market. The main contributing factors to this degree of responsiveness of
supply are large and increasing capacity, the availability of unused capacity, and the ability to
shift shipments from alternate markets and inventories. Factors mitigating responsiveness of
supply include limited ability to shift production to or from alternate products.
22 Reported U.S. capacity to produce CSPV cells grew at a slower rate than apparent U.S.
consumption from 2012 to 2016. 23 Staff’s analysis of how U.S. supply would shift due to changes in demand does not take into
account ***.

V‐9
Changes in availability of U.S. supply
According to firms’ responses, the availability of both domestically produced and
imported CSPV products in the U.S. market has changed since 2012. Most U.S. producers,
importers, and purchasers reported that the availability of U.S.‐produced CSPV products has
declined primarily due to a number of plant closures while the availability of imported CSPV
products in the U.S. market has increased since 2012. According to U.S. producer ***, while
U.S. capacity has remained relatively flat, foreign capacity has rapidly increased particularly in
China, Taiwan, Thailand, Vietnam, Malaysia, Singapore, Korea, Mexico, and Canada in the last
five years.24
Most firms anticipate further changes to the availability of both domestically produced
and imported CSPV products. Most U.S. producers, importers, and purchasers stated that they
anticipate further reductions in the availability of domestically produced CSPV products with
firms noting the pending bankruptcies of SolarWorld’s parent company and Suniva. Most firms
anticipate that the decreased availability of domestic CSPV products will be offset by an
increase in imported product.
Supply constraints
Two‐thirds of responding purchasers (66 of 104) reported that their suppliers were
unable to supply CSPV products since 2012. Other firms noted that occasionally demand has
outpaced the available supply. Purchaser *** stated that both Suniva and SolarWorld have had
delayed deliveries. Purchaser *** reported that Suniva was unable to fulfil an order in the third
quarter of 2016 and therefore, it switched suppliers and purchased
24 *** U.S. producer questionnaire response, section IV‐13.

V‐10
from SolarWorld. A few purchasers stated that global market conditions have an impact on U.S.
supply, with *** specifying that increased demand in China has created supply constraints and
delayed shipments in the U.S. market. *** stated that there have been supply constraints for
high volume purchases of higher wattage modules. Several purchasers also reported that since
the filing of the 201 safeguard petition, their supply has been disrupted due to a surge in
demand as firms purchase large quantities of CSPV products at current price levels ahead of any
final ruling.
U.S. demand
Based on available information, the overall demand for CSPV products is likely to
experience moderately large to large changes in response to changes in price. The main
contributing factors are the availability of substitute products and the large cost share of CSPV
products in most of its end‐use products.
The demand for CSPV products and modules is derived from the demand for solar
electricity. The increasing demand for solar electricity is attributed to increasing cost of
electricity and energy consumption, environmental concerns and the general movement
toward “green energy” alternatives, cost competitiveness with traditional energy sources, a
desire for national energy independence, and the availability of federal, state, and local
incentives.
Electricity demand in the United States is supplied primarily by conventional sources,
with coal and natural gas accounting for almost two‐thirds of all electricity generated in 2016
(figure V‐2). Renewable energy sectors (excluding hydroelectric) accounted for 9 percent of
electricity generated in the United States in 2016, with solar energy accounting for 1.4 percent
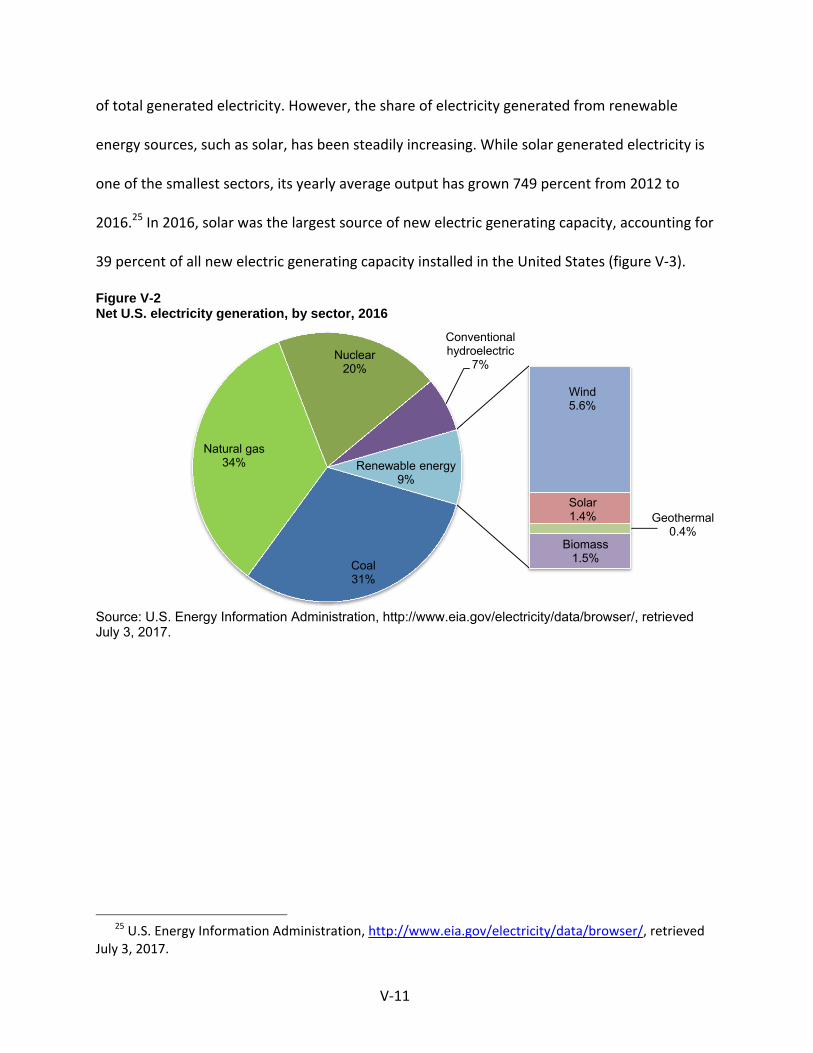
V‐11
of total generated electricity. However, the share of electricity generated from renewable
energy sources, such as solar, has been steadily increasing. While solar generated electricity is
one of the smallest sectors, its yearly average output has grown 749 percent from 2012 to
2016.25 In 2016, solar was the largest source of new electric generating capacity, accounting for
39 percent of all new electric generating capacity installed in the United States (figure V‐3).
Figure V-2 Net U.S. electricity generation, by sector, 2016
Source: U.S. Energy Information Administration, http://www.eia.gov/electricity/data/browser/, retrieved July 3, 2017.
25 U.S. Energy Information Administration, http://www.eia.gov/electricity/data/browser/, retrieved
July 3, 2017.
Coal 31%
Natural gas 34%
Nuclear 20%
Conventional hydroelectric
7%
Wind 5.6%
Solar 1.4% Geothermal
0.4%Biomass
1.5%
Renewable energy9%

V‐12
Figure V-3 New U.S. electricity generating capacity additions, 2012-2016
Source: GTM Research and the Solar Energy Industries Association (SEIA), U.S. Solar Market Insight: 2016 Year in Review, Executive Summary, 2017, p. 7.
End uses, cost share, and installed cost
CSPV products account for a moderate‐to‐large share of the cost of the end‐use
products in which they are used. The primary end use for CSPV cells are modules, and for
modules, the primary end use is some form of solar power generation installation or system
(see Part I for more information). Firms reported the share of the total production cost of the
end‐use products (modules, residential systems, commercial systems, and utility systems) that
is accounted for by CSPV cells (table V‐2). Ten U.S. producers, 39 importers, and 34 purchasers
reported that the cost share of CSPV cells in a module averaged 56 to 60 percent. Generally, the
cost share of CSPV cells increases as the size of the installation project increases. For residential
systems, two U.S. producers, 18 importers, and 37 purchasers reported that the average cost
share of CSPV cells was between 19 to 26 percent. For commercial systems, two U.S. producers,
16 importers, and 50 purchasers reported that the average cost of CSPV cells was between 18
9%
27% 27% 30%39%
31%
47% 43%29%
29%16%
10%
1%41%
7%25%
39% 26%
4% 9% 5% 3% 6%
0%
10%
20%
30%
40%
50%
60%
70%
80%
90%
100%
2012 2013 2014 2015 2016
Solar Natural gas Coal Wind Other
V‐13
and 27 percent. For utility systems, one U.S. producer, 12 importers, and 38 purchasers
reported that the average cost share of CSPV cells was between 29 and 31 percent. For off‐grid
portable consumer goods, 13 importers and 11 purchasers reported that the average cost share
of CSPV cells was between 24 and 30 percent.26
Table V-2 CSPV products: Firms’ estimates of cost share for CSPV cells in the following end uses
Item Producers Importers Purchasers
Average Range Average Range Average Range Module 58 30 to 100 60 30 to 100 56 23 to 100Residential system 19 11 to 28 25 7 to 67 26 10 to 65Commercial system 18 17 to 19 27 9 to 67 26 1 to 70Utility system 30 30 31 10 to 67 29 1 to 45Off grid portable consumer goods -- -- 30 15 to 67 24 10 to 58
Source: Compiled from data submitted in response to Commission questionnaires
The price of an installed PV system is comprised of the price of the module and non‐
module costs which include inverters, mounting hardware, labor, permitting fees, overhead,
and profit margin. According to several industry sources, average installed prices for PV solar
installations have declined steadily in all three market segments during the period. According to
one industry report, the median installed price of a PV system fell between 24.1 percent
(residential system) and 43.6 percent (non‐residential system >500 kW) from 2012 to 2015
(figure V‐4).27 According to another industry report, U.S. PV system pricing fell by almost 20
percent from the fourth quarter of 2015 to the fourth quarter of 2016. The steep decline in PV
system prices during 2016 is attributed to large decreases in module prices combined with
substantial declines in hardware costs.28 Both reports noted that installed PV system prices vary
26 No U.S. producer provided an estimate for the cost share of CSPV cells used in off‐grid portable
consumer goods. 27 Tracking the Sun Public Data File, The Open PV Project, National Renewable Energy Laboratory,
https://openpv.nrel.gov/search (accessed July 11, 2017). 28 GTM Research and the Solar Energy Industries Association (SEIA), U.S. Solar Market Insight: 2016
Year in Review, Executive Summary, 2017, p. 15.

V‐14
greatly from state‐to‐state and project‐to‐project, with a considerable spread among the prices
in each market segment.
Figure V-4 Average installed price of residential and non-residential PV systems, by system size, 2006-2015
Note: Data for 2016 were not available. Source: Tracking the Sun Public Data File, The Open PV Project, National Renewable Energy Laboratory, https://openpv.nrel.gov/search (accessed July 11, 2017).
For most of the period, declining system prices largely reflect falling non‐module costs,
as module prices remained relatively stable from 2013 to 2015. In residential PV systems,
module costs fell 9 percent while non‐module costs fell 27 percent from 2012 to 2015 (figure V‐
5).29 However, in 2016, declining system prices largely reflect falling module prices. Between
the fourth quarter of 2015 and the fourth quarter of 2016, module prices fell by 35.4 percent.
Declines in non‐module costs (e.g. inverters, mounting hardware, labor, design/engineering,
permitting fees, overhead, and profit margin) ranged from 6 percent for fixed‐tilt utility
29 Based on these data, the cost share for a PV module in a residential PV system increased from 16
percent in 2012 to 19 percent in 2015. Tracking the Sun Public Data File, The Open PV Project, National Renewable Energy Laboratory, https://openpv.nrel.gov/search (accessed July 11, 2017).
$0.0
$1.0
$2.0
$3.0
$4.0
$5.0
$6.0
$7.0
$8.0
$9.0
$10.0
2006 2007 2008 2009 2010 2011 2012 2013 2014 2015
2015
dol
lars
per
wat
t
Residential Non-Residential ≤500 kW Non-Residential >500 kW

V‐15
systems, 13 percent for residential and non‐residential systems, and 15 percent for single‐axis
tracking utility systems (figure V‐6).30
Figure V-5 Installed residential PV systems: module price index and implied non-module costs, 2012-151
1 The Module Price Index is the U.S. module price index published by SPV Market Research (Mints 2016). Implied non-module costs are calculated as the Total Installed Price minus the Module Price Index, and therefore include installer profit margin. Source: Tracking the Sun Public Data File, The Open PV Project, National Renewable Energy Laboratory, https://openpv.nrel.gov/search (accessed July 11, 2017).
30 Based on these data, the cost share of a PV module ranged from 15 to 19 percent in a residential
PV system, 26‐32 percent in a non‐residential system, and 36‐49 percent in a utility PV system. GTM Research and the Solar Energy Industries Association (SEIA), U.S. Solar Market Insight: 2016 Year in Review, Executive Summary, 2017, p. 15.
$0.00
$1.00
$2.00
$3.00
$4.00
$5.00
$6.00
2012 2013 2014 2015
2015
dol
lars
per
wat
t
Module price index Non‐module costs

V‐16
Figure V-6 Estimated U.S. national average system costs by market segment (residential, non-residential, utility fixed tilt, and utility single-axis tracking), 4th quarter 2015 and 4th quarter 20161
1 These data are based on GTM’s tracked wholesale pricing of major solar components and data collected from interviews with major installers. Source: GTM Research and the Solar Energy Industries Association (SEIA), U.S. Solar Market Insight: 2016 Year in Review, Executive Summary, 2017, p.15.
Business cycles and conditions of competition
The majority of U.S. producers (8 of 10), importers (30 of 48), and purchasers (55 of 101)
indicated that the market for CSPV products was subject to business cycles. Firms reported
seasonal fluctuations due to weather conditions as well as incentive program deadlines. A
plurality of firms indicated that demand is typically heavier in the latter half of the year, during
the warmer summer months up until the end of the calendar year, in order to finish projects to
qualify for various incentive programs for tax accounting purposes. Purchaser *** estimated
that two‐thirds of residential systems are installed during the second half of the year. Another
firm, ***, stated that sales bookings were the heaviest during the second and third quarters,
and installations and revenue were the heaviest in the third and fourth quarters.
Most U.S. producers (6 of 10) and importers (23 of 48) and nearly half of responding
purchasers (46 of 101) indicated that the market was subject to distinct conditions of
$0.00
$0.50
$1.00
$1.50
$2.00
$2.50
$3.00
$3.50
$4.00
Resi Q42015
Resi Q42016
Non‐resi Q42015
Non‐resi Q42016
Utility FixedTilt Q4 2015
Utility FixedTilt Q4 2016
UtilityTracking Q4
2015
UtilityTracking Q4
2016
Tur
nkey
Inst
alle
d C
ost (
$/W
dc)
PV Module Total Non‐module Costs

V‐17
competition. Most firms identified government incentive programs and changes in global
supply and demand. Several firms reported that policy changes in other countries (e.g., China’s
suspension of its feed‐in tariff program) rapidly impacts demand in those countries and can also
have an impact on prices in the U.S. market. Other factors identified included technology
improvements and cost reductions. Importer *** stated that the average selling price of CSPV
cells is driven by the top five to ten CSPV cell producers.
The majority of U.S. producers (6 of 9), importers (22 of 38), and purchasers (56 of 89)
indicated that there have been changes to the business cycle and conditions of competition
since 2012. Specifically, firms identified increased competition, market saturation, increased
efficiency of CSPV cells, introduction and extension of various solar incentive programs such as
the Investment Tax Credit, lower interest rates, and declining global prices of CSPV cells and
systems.
Demand trends
The vast majority of firms reported that U.S. demand for CSPV products has increased
since 2012 (table V‐3). Most firms attributed the increased demand to a reduction in CSPV
system prices and installation costs, as well as federal, state, and local incentive programs.
Firms also attributed the increased demand to the public’s increased knowledge and general
interest in renewable energy,31 increased technology improvements including module
efficiency, and increased military use of solar energy.
31 One firm, ***, stated that in the past two years, there has been an increase in demand for
community solar and corporate solar.

V‐18
Table V-3 CSPV products: Firms’ responses regarding U.S. demand, by number of responding firms
Item
Number of firms reporting
Increase No change Decrease Fluctuate
Demand inside the United States: U.S. producers 9 0 2 0
Importers 43 1 1 4
Purchasers 90 2 3 6
Demand outside the United States: U.S. producers 9 0 0 1
Importers 37 3 0 6
Purchasers 58 3 2 6 Source: Compiled from data submitted in response to Commission questionnaires.
The vast majority of firms also reported that demand for CSPV products outside the
United States has increased since 2012 (table V‐3). The increase in demand outside of the
United States was attributed to similar reasons as the growth in the United States: overall cost
reductions, reduced module prices, increased technology improvements, the existence of
government incentives and mandatory renewable energy goals, and a growing trend towards
green energy. Several firms noted that demand for CSPV products in China, Japan, India,
Australia, the Middle East, and South America is growing rapidly.
Substitute products
The majority of firms reported that non‐solar renewable energy products could not be
substituted for CSPV products at the initial purchase decision. However, 4 of 7 U.S. producers,
14 of 51 importers, and 23 of 102 purchasers indicated that there were non‐solar renewable
energy substitutes for CSPV products. The most often identified non‐solar renewable energy
substitute product for CSPV products was wind turbines. One U.S. producer, ten importers, and
14 purchasers indicated that the change in wind energy prices affects the price of CSPV
products. The remaining two importers and three purchasers reported that wind turbines did
not affect the price of CSPV products, citing the lack of direct competition for most installations

V‐19
and the historically lower prices for wind energy. Other substitutes cited by firms include
biomass, geothermal, and hydroelectric.
More than half of responding importers and purchasers indicated that other solar
energy products cannot be substituted for CSPV products at the initial purchase decision.
However, a majority of U.S. producers (7 of 11), 22 of 50 importers, and 47 of 99 responding
purchasers indicated that other solar energy products, such as thin film, can be substituted for
CSPV products.32 Three U.S. producers, 14 importers, and 18 purchasers indicated that changes
in thin film prices affect the price for CSPV products. The remaining 4 U.S. producers, 7
importers, and 25 purchasers reported that prices for thin film did not affect the price of CSPV
products.
SUBSTITUTABILITY OF DOMESTIC AND IMPORTED CSPV PRODUCTS
The degree of substitution between domestic and imported CSPV products depends
upon such factors as relative prices, quality (e.g., standards, reliability of supply, defect rates,
etc.), and conditions of sale (e.g., price discounts/rebates, lead times between order and
delivery dates, payment terms, product services, etc.). Based on available data, staff believes
that there is a high degree of substitutability between domestically produced CSPV products
and imported CSPV products.
Lead times
CSPV products are primarily produced‐to‐order. U.S. producers reported that 54.0
percent of their commercial shipments were produced‐to‐order, with lead times averaging 43
days. The remaining 46.0 percent of their commercial shipments came from inventories, with
32 Thin film was the most often cited solar energy substitute for CSPV products by firms.

V‐20
lead times averaging 4 days. Importers reported that 54.6 percent of their commercial
shipments were produced‐to‐order, with lead times averaging 62 days; 37.9 percent of
importers’ commercial shipments came from U.S. inventories, with lead times averaging 13
days. The remaining 7.5 percent of their sales came from foreign inventories, with lead times
averaging 62 days.
Factors affecting purchasing decisions
The most often cited top three factors firms consider in their purchasing decisions for
CSPV products were price (81 firms), quality/performance (77 firms), and availability (42 firms),
as shown in table V‐4. Quality/performance was the most frequently cited first‐ and second‐
most important factor, followed by price; and price was the most frequently reported third‐
most important factor.
Table V-4 CSPV products: Ranking of factors used in purchasing decisions as reported by U.S. purchasers, by factor
Factor First Second Third Total Price 21 26 35 81 Quality/performance 44 29 11 77 Availability 8 19 16 42 Bankability 10 1 4 15 Credit/terms 2 4 6 12 Warranty 5 3 3 11 Country of origin/U.S. produced 6 2 2 10 Delivery time/delivery dependability 1 5 3 9 Specification/product range/custom built 3 2 4 9 Technology/works with purchaser technology
5 1 2 6
Producer’s financial stability 1 2 3 6 Relationship with supplier/contract 3 1 2 6 Customer support 1 1 3 5 Other1 0 7 8 NA
1 Other factors include “how long”, longevity, and equity in consumer market for second factor; and lead time, shipping costs, ease of working with, product line consistency, distribution, appearance, and customer demand for the third factor. Source: Compiled from data submitted in response to Commission questionnaires.

V‐21
U.S. purchasers identified various principal factors they considered in determining the
quality of CSPV products. Reported factors included output efficiency, longevity and long‐term
performance degradation, output tolerances, warranty (suppliers’ ability to back up the
warranty), historical failure rates, appearance (matching cell colors and frame structure), sales
support, bankability, financial strength of manufacturer, third‐party testing, and UL
certification.
Purchasers were asked how frequently they purchased the lowest‐priced product. A
plurality of purchasers indicated that they sometimes purchase the lowest priced product (table
V‐5).
Table V-5 CSPV products: Frequency purchase decisions are based on price
Always Usually Sometimes Never 3 30 49 23
Source: Compiled from data submitted in response to Commission questionnaires.
When asked if they purchased CSPV products from one source although a comparable
product was available at a lower price from another source, 64 purchasers reported reasons
including product quality, lead time, availability, product reliability, level of customer service,
and financial viability of the manufacturer. One‐third of purchasers (29 of 97) reported that
certain types of product were only available from a single source. Several purchasers stated
that the higher efficiency modules are manufactured primarily in Asia and are not available
from any U.S. producers. Six purchasers reported that multicrystalline PERC cells are primarily
only available in Taiwan, Korea, Japan, China, and Malaysia. Two purchasers stated that N‐type
monocrystalline cells are only available from LG in Korea.
Most purchasers always or usually make purchasing decisions based on the producer,
while most of their customers either sometimes or never make purchasing decisions based on

V‐22
the producer (table V‐6). However, most purchasers and their customers sometimes or never
make purchasing decisions based on the country of origin. Of the 43 purchasers that reported
that they always make decisions based on the manufacturer, 21 firms cited quality or quality
factors (technology, long‐term performance, efficiency, solar scorecard, and reliability); other
reasons cited include quality of the firm (bankable manufacturer, capacity, financials, warranty
history, and brand recognition), and a preference for domestically produced product.
Table V-6 CSPV products: Purchasing decisions based on producer and country of origin
Purchaser/Customer Decision Always Usually Sometimes Never Purchaser makes decision based on producer 43 23 16 20 Purchaser’s customers make decision based on producer 12 23 35 19 Purchaser makes decision based on country 21 11 33 37 Purchaser’s customers make decision based on country 5 16 46 22
Source: Compiled from data submitted in response to Commission questionnaires. Supplier qualification
Most purchasers reported that no domestic or foreign supplier had failed in its attempt
to qualify product, or had lost its approved status, since 2012. However, 19 of 95 responding
purchasers reported that a domestic or foreign supplier had failed in its attempt to qualify
product, or had lost its approved status since 2012. Reasons suppliers were not qualified or
were disqualified included: customer service, financial strength, broken commitments, cell
cracks, use of thinner frame, quality control, bankability, failed audit, efficiency, delivery rates,
and prefer local manufacturer. Three purchasers stated that both SolarWorld and Yingli lost
their approved status due to financial distress. Sunrun stated that both SolarWorld and Suniva
refused to participate in the Sunrun Vendor Quality Management Program ‐ thereby preventing
Sunrun from approving them as vendors for systems financed by investors.33 SolarWorld stated
that it chose not to participate in the program because Sunrun required SolarWorld to release
33 Hearing transcript, pp. 269‐272 (Fenster).

V‐23
its bill of material, which is SolarWorld’s intellectual property.34 Suniva stated that after it went
through the preliminary levels of negotiation with Sunrun, it determined that Suniva was far
apart on price and therefore it did not make sense to spend the money to go through the
qualification process.35
Changes in purchasing patterns
Purchasers were asked about changes in their purchasing patterns from the United
States and all other countries since January 2012 (table V‐7). More than half of responding
purchasers indicated that they had not purchased U.S.‐origin CPSV products. Seven purchasers
provided reasons for not purchasing domestic product which included that U.S. manufacturers
failed bankability requirements, did not meet quality requirements, had limited availability, and
did not sell stand‐alone CSPV products. Reasons reported for increasing purchases of U.S.‐origin
CPSV products included increased demand, expansion of business, preference for domestically
produced CSPV products and superior Power Purchase Agreement (PPA) pricing for locally
produced modules. Reasons reported for decreasing purchases of U.S.‐origin CPSV products
included lower import prices, lack of availability, and longer lead times. The majority of
purchasers reported that they had increased their purchases of foreign‐origin CSPV products.
The most often cited reason for increasing purchases of foreign‐origin CPSV products was lower
price; other reasons included business expansion, availability, module efficiency, and increased
demand.
34 SolarWorld stated that it was unwilling to disclose to a third party the names of its approved
suppliers and to divulge intellectual property. Hearing transcript, pp. 239‐240 (Messer). 35 Hearing transcript, p. 241 (Card).

V‐24
Table V-7 CSPV products: Changes in purchase patterns from United States, all other countries
Source of purchases Did not
purchase Decreased Increased Constant FluctuatedUS-origin CPSV products 35 17 22 11 19 Foreign-origin CPSV products 4 12 51 18 22
Source: Compiled from data submitted in response to Commission questionnaires.
Comparisons of domestic products and imported articles
Most U.S. producers, importers, and purchasers reported that U.S.‐produced CSPV
products were interchangeable with imported CSPV products (table V‐8). However, roughly
one‐third of responding importers and one‐fourth of responding purchasers reported that U.S.‐
produced CSPV products were not interchangeable with imported CSPV products. Importer ***
stated that certain cells are copyrighted and can only be used in specific applications. Three
importers stated that performance data and bankability of the CSPV products can limit the
degree of interchangeability. They also noted that certification requirements and standards are
different for every country and CSPV products produced in a certain country may not be
certified for installation in other countries. Importer *** reported that there are no U.S.
manufacturers producing the type of cell required for small portable solar products. Three
importers and one purchaser reported that interdigitated back contact (IBC) solar cells are not
domestically produced and are not interchangeable with front‐contact CSPV products. One
purchaser noted that the pace of technological advancement has been very fast, resulting in
technological differentiation and competition among suppliers.
Table V-8 CSPV products: Interchangeability and importance of factors other than price between product produced in the United States and in other countries
Item
Number of U.S. producers reporting
Number of U.S. importers reporting
Number of purchasers reporting
No Yes No Yes No Yes Interchangeable 1 10 14 33 24 78 Factors other than price 3 8 11 34 11 90
Source: Compiled from data submitted in response to Commission questionnaires.

V‐25
In addition, the majority of responding U.S. producers, importers, and purchasers
indicated that differences other than price between CSPV products produced in the United
States and in other countries were a significant factor in sales of the products. In further
comments, firms identified technology, quality, availability, bankability, warranty terms,
product range (PERC cells, small 100W panels, N‐type cells, etc.), lead time, and credit terms as
important non‐price factors. Importer *** stated that quality and technical support are more
advanced in Japan and Germany. Importer *** reported that price and availability are the key
purchasing factors. U.S. producer *** stated that regardless of the advantages that U.S.‐
produced CSPV products can offer, they do not overcome the very low prices of imported
product. Three importers stated that developers, installers, and project owners chose module
suppliers with high bankability that are listed as Tier 1 by Bloomberg and that funding for
projects using low Tier modules are often rejected by financiers.
ELASTICITY ESTIMATES
This section discusses elasticity estimates. Parties were encouraged to comment on
these estimates in their prehearing or posthearing brief. As noted below, respondent SEIA
commented on the domestic supply elasticity. No other party comments were received
regarding elasticities.
U.S. supply elasticity
The domestic supply elasticity36 for CSPV products37 measures the sensitivity of the
quantity supplied by U.S. producers to changes in the U.S. market price of CSPV products. The
36 A supply function is not defined in the case of a non‐competitive market. 37 The U.S. supply elasticity estimate applies to U.S. CSPV cells, whether or not partially or fully
assembled into other products.

V‐26
elasticity of domestic supply depends on several factors including the level of excess capacity,
the ease with which producers can alter capacity, producers’ ability to shift to production of
other products, the existence of inventories, and the availability of alternate markets for U.S.‐
produced CSPV products. In the prehearing report, staff estimated that the U.S. supply elasticity
for CSPV products was in the range of 4 to 6. Respondent SEIA took issue with the estimate, and
argued that the operational U.S. cell producers ***, that U.S. inventory levels, as a ratio to total
shipments decreased from 2012 to 2016, and that the majority of U.S. producers’ exports ***.
SEIA suggested that the U.S. supply elasticity for CSPV cells would be in the range of 0 to 1 and
the U.S. supply elasticity for CSPV modules would be in the range of 1 to 2.38 After receiving
revised questionnaire data, additional information, and party arguments, staff is revising its
estimated range to 2 to 4.
Import supply elasticity
The import supply elasticity39 for CSPV products measures the sensitivity of the quantity
supplied by U.S. importers (in connection with foreign producers) to changes in the U.S. market
price of CSPV products. It depends on the same type of factors as the elasticity of domestic
supply. Analysis of these factors above indicates that U.S. imports have the ability to greatly
increase or decrease shipments to the U.S. market; an estimate in the range of 6 to 8 is
suggested.
38 SEIA’s prehearing brief, pp. 42‐44. 39 A supply function is not defined in the case of a non‐competitive market.

V‐27
U.S. demand elasticity
The U.S. demand elasticity for product measures the sensitivity of the overall quantity
demanded to a change in the U.S. market price of product. This estimate depends on factors
discussed earlier such as the existence, availability, and commercial viability of substitute
products, as well as the component share of CSPV products in the production of any
downstream products. Based on the available information, the aggregate demand for CSPV
products is likely to be elastic; a range of ‐1.0 to ‐1.5 is suggested.
Substitution elasticity
The elasticity of substitution depends upon the extent of product differentiation
between the domestic and imported products.40 Product differentiation, in turn, depends upon
such factors as quality (e.g., appearance, efficiency, etc.) and conditions of sale (e.g.,
availability, sales terms/ discounts/warranty, etc.). Based on available information, the elasticity
of substitution between U.S.‐produced product and imported product is likely to be in the
range of 3 to 5.
FACTORS AFFECTING PRICES
Raw material costs
Raw material costs is the largest component of total cost of goods sold (“COGS”) for
both cells and modules. Raw material costs for the production of CSPV cells accounted for ***
percent of U.S. cell producers’ total COGS during 2016, up from *** percent in 2012. The main
underlying raw material input for CSPV cells is polysilicon. Raw material costs for the
40 The substitution elasticity measures the responsiveness of the relative U.S. consumption levels of
the subject imports and the domestic like products to changes in their relative prices. This reflects how easily purchasers switch from the U.S. product to the subject products (or vice versa) when prices change.

V‐28
production of CSPV modules (much of which are the cost of cells which reflects purchased cells
and internally‐produced cells) accounted for 84.9 percent of U.S. module producers’ total COGS
in 2016, up from 58.2 percent in 2012.
The majority of U.S. producers (9 of 11) and importers (32 of 44) reported that prices of
raw materials for CSPV products have declined since 2012. Several firms reported that
polysilicon and wafer prices have declined since 2012. U.S. producer *** stated that raw
material prices have declined until recently; it reported that in late 2016 and into 2017, the
price of monocrystalline wafers began to increase due to high global demand. Importer ***
stated that in addition to the price of wafers, the price for silver paste has declined over the
past years.
The price of polysilicon ingots and wafers fluctuated during the period but declined
overall. According to industry reports, due to overcapacity of polysilicon, the price of polysilicon
ingots and wafers fell 52.6 percent and 54.5 percent, respectively, from the first quarter of
2012 to the fourth quarter of 2016 (figure V‐7).

V‐29
Figure V-7 Quarterly price trends for polysilicon ingots and wafers, January 2012-December 2016
Source: GTM Research and the Solar Energy Industries Association (SEIA), U.S. Solar Market Insight: 2012-2016 Year in Review, Executive Summaries.
U.S. inland transportation costs
Seven of ten responding U.S. producers and 40 of 46 importers reported that they
typically arrange transportation to their customers. Most U.S. producers reported that their
U.S. inland transportation costs ranged from 2 to 3 percent, while most importers reported
costs of 1 to 5 percent. U.S. producers reported that *** percent of sales were shipped within
100 miles of their production facility, *** percent were shipped between 101 and 1,000 miles,
and *** percent were shipped over 1,000 miles. Importers of CSPV products reported that 33.9
percent of sales were shipped within 100 miles of their U.S. point of shipment, 51.9 percent
between 101 and 1,000 miles, and 14.1 percent were shipped over 1,000 miles.
0
0.05
0.1
0.15
0.2
0.25
0.3
0.35
0
5
10
15
20
25
30
35
2012 2013 2014 2015 2016
Dol
lars
per
wat
t
Dol
lars
per
kilo
gram
Polysilicon ($/kg) Wafer ($/W)

V‐30
PRICING PRACTICES
Pricing methods
U.S. producers and importers reported using transaction‐by‐transaction negotiations,
contracts, and price lists. As presented in table V‐9, U.S. producers and importers sell primarily
on a transaction‐by‐transaction basis.
Table V-9 CSPV products: U.S. producers’ and importers’ reported price setting methods, by number of responding firms1
Method U.S. producers Importers Transaction-by-transaction 9 34 Contract 4 22 Set price list 4 21 Other 3 6 Responding firms 11 51
1 The sum of responses down may not add up to the total number of responding firms as each firm was instructed to check all applicable price setting methods employed. Source: Compiled from data submitted in response to Commission questionnaires.
Both U.S. producers and importers reported selling their CSPV products primarily under
contracts in 2016 (table V‐10). U.S. producers reported selling the majority of their CSPV
products through short‐term contracts with the remaining share sold on a spot basis, while
importers reported selling most of their CSPV products through a mix of short‐term, annual,
and long‐term contracts.
Table V-10 CSPV products: U.S. producers’ and importers’ shares of U.S. commercial shipments by type of sale, 2016
Type of sale U.S. producers Importers
Share (percent) Long-term contracts *** 17.0Annual contracts *** 24.3Short-term contracts *** 47.8Spot sales *** 10.8
Total 100.0 100.0Note.--Because of rounding, figures may not add to the totals shown. Source: Compiled from data submitted in response to Commission questionnaires.

V‐31
Five U.S. producers reported using short‐term contracts with an average duration
ranging from 30 to 183 days and 23 importers reported using short‐term contracts averaging
105 days. All five responding U.S. producers and most importers reported that their short‐term
contracts did not allow for price renegotiation, have fixed prices and quantities, and did not
have meet‐or‐release provisions. Four U.S. producers and 16 importers reported using annual
contracts. U.S. producers’ responses were split, with two firms reporting that their annual
contracts did not allow for price renegotiations, have fixed prices and quantities, and did not
have meet‐or‐release provisions. The majority of U.S. importers reported that their annual
contracts allowed for price renegotiations, have fixed prices and quantities, and did not have a
meet‐or‐release provision. Seven importers reported using long‐term contracts averaging two
years. Most importers reported that their long‐term contracts allowed for price renegotiations,
fixed both price and quantity, and did not have a meet‐or‐release provision.
Sales terms and discounts
Seven of nine U.S. producers reported that they typically quote prices on an f.o.b. basis,
while *** most importers reported that they typically quote prices on a delivered basis.41 A
plurality of U.S. producers (6 of 11) and importers (23 of 50) do not offer any type of discount.
However, five U.S. producers and 20 importers reported offering quantity‐based discounts and
two U.S. producers and nine importers offer volume discounts. In addition, one importer offers
seasonal promotions, one importer *** offers discounts at the retail or promotional level, and
one importer offers different discounts
41 ***.

V‐32
for dealers, distributors, and master distributors. 42 Typical sales terms for most responding
producers and importers is net 30 days; however, many firms noted that payment terms varied
depending on customers’ credit and purchase volume.
PRICE DATA
The Commission requested U.S. producers and importers to provide quarterly data for
the total quantity and f.o.b. value of the following CSPV products shipped to unrelated U.S.
customers during 2012‐16.
Product 1.‐‐ Monocrystalline cells with an efficiency between 17.0% and 22.0%. Product 2.‐‐ 60 cell Multicrystalline silicon module, with a peak power wattage between
240w to 290w, inclusive, P‐max or Wp. Product 3.‐‐ 60 cell Monocrystalline silicon module, with a peak power wattage between
250w to 300w, inclusive, P‐max or Wp. Product 4.— 72 cell Multicrystalline silicon module, with a peak power wattage
between 290w to 340w, inclusive, P‐max or Wp. Product 5.— 72 cell Monocrystalline silicon module, with a peak power wattage
between 300w to 350w, inclusive, P‐max or Wp.
Two U.S. producers and 31 importers provided usable pricing data for sales of the
requested products, although not all firms reported pricing for all products for all quarters.43 44
Pricing data reported by these firms accounted for approximately 83.3 percent of U.S.
42 ***. 43 Per‐unit pricing data are calculated from total quantity and total value data provided by U.S.
producers and importers. The precision and variation of these figures may be affected by rounding, limited quantities, and producer or importer estimates.
44 Price data were requested by the origin of the cell. U.S. module assemblers that used imported cells were requested to report their price data in the importer questionnaire.

V‐33
producers’ U.S. shipments of CSPV products and 74.1 percent of U.S. importers’ U.S. shipments
of CSPV products in 2016.45 46
The pricing product definitions consisted of a monocrystalline cell with an efficiency
range of 5 percent, and four modules, each with peak power range of 50 watts. U.S. producers
and importers reported their commercial shipment volumes for these pricing products, broken
into narrower efficiency and wattage ranges. As shown in table V‐11, U.S. producers and
importers generally reported sales of CSPV cells and modules within similar efficiency and
wattage ranges.47
45 U.S. importer *** revised its pricing data on August 31, 2016. These revisions changed the prices
and quantities for product 1. See email from *** and *** revised importer questionnaire response, section III‐2.
46 Products 2‐5 overlap with the pricing products 1‐8 from the previous AD/CVD investigations. The wider wattage ranges in products 2‐5 encompass the shifts to higher wattage modules during the five‐year period of investigation. Table V‐11 provides a breakout of the reported price data by narrower wattage ranges. Certain Crystalline Silicon Photovoltaic Products from China and Taiwan, Invs. Nos. 701‐TA‐511 and 731‐TA‐1246‐1247 (Final) USITC Publication 4519 February 2015 at p. V‐5.
47 For product 5, U.S. producers’ reported price data were split between the two wattage categories, while importers’ reported price data fell in the lower wattage category in 2015.

V‐34
Table V-11 CSPV products: Sales of U.S. produced and imported cells and modules, by wattage ranges, 2012-16
* * * * * * *
U.S. producers’ price data volumes for sales of monocrystalline modules *** accounted
for the *** of reported price data. Importers reported price data primarily for sales of
multicrystalline modules, with products 2 and 4 accounting for the majority of price data
volumes of foreign‐origin product. Both U.S. producers and importers reported *** quantities
of sales of monocrystalline cells (product 1), accounting for *** of domestic price data and in
2016 and *** of importers’ price data in 2015.

V‐35
Price data for products 1‐5 are presented in tables V‐12 to V‐16 and figures V‐8 to V‐12.
Prices are reported by import source in Appendix G.
Table V-12 CSPV products: Weighted-average f.o.b. prices and quantities of domestic and imported product 1,1 by quarters, 2012-16
* * * * * * *

V‐36
Table V-13 CSPV products: Weighted-average f.o.b. prices and quantities of domestic and imported product 2,1 by quarters, 2012-16
Period
U.S.-origin Foreign-origin Price
(dollars per kilowatt)
Quantity (kilowatts)
Price (dollars per
kilowatt) Quantity
(kilowatts) 2012: Jan.-Mar. *** *** 1,059 84,005
Apr.-June *** *** 910 151,062
July-Sept. *** *** 837 193,745
Oct.-Dec. *** *** 805 188,753 2013: Jan.-Mar. *** *** 723 178,906
Apr.-June *** *** 713 240,438
July-Sept. *** *** 726 338,025
Oct.-Dec. *** *** 738 259,915 2014: Jan.-Mar. *** *** 735 216,823
Apr.-June *** *** 728 287,980
July-Sept. *** *** 751 289,276
Oct.-Dec. --- *** 735 367,474 2015: Jan.-Mar. --- *** 713 333,306
Apr.-June --- *** 692 494,227
July-Sept. --- *** 674 482,561
Oct.-Dec. *** *** 667 517,662 2016: Jan.-Mar. --- *** 641 360,330
Apr.-June --- *** 632 330,869
July-Sept. --- *** 592 335,198
Oct.-Dec. --- *** 535 265,793 1 Product 2: 60 cell Multicrystalline silicon module, with a peak power wattage between 240w to 290w, inclusive, P‐max or Wp. Source: Compiled from data submitted in response to Commission questionnaires.

V‐37
Table V-14 CSPV products: Weighted-average f.o.b. prices and quantities of domestic and imported product 3,1 by quarters, 2012-16
* * * * * * *

V‐38
Table V-15 CSPV products: Weighted-average f.o.b. prices and quantities of domestic and imported product 4,1 by quarters, 2012-16
Period
U.S.-origin Foreign-origin Price
(dollars per kilowatt)
Quantity (kilowatts)
Price (dollars per
kilowatt) Quantity
(kilowatts) 2012: Jan.-Mar. -- 0 869 67,598
Apr.-June -- 0 *** ***
July-Sept. -- 0 749 92,542
Oct.-Dec. -- 0 716 85,968 2013: Jan.-Mar. -- 0 *** ***
Apr.-June -- 0 706 244,778
July-Sept. -- 0 697 329,372
Oct.-Dec. -- 0 690 323,929 2014: Jan.-Mar. -- 0 683 413,580
Apr.-June -- 0 687 666,572
July-Sept. -- 0 721 469,675
Oct.-Dec. -- 0 713 408,065 2015: Jan.-Mar. -- 0 716 310,628
Apr.-June -- 0 682 675,210
July-Sept. -- 0 652 1,221,632
Oct.-Dec. -- 0 641 1,763,922 2016: Jan.-Mar. -- 0 626 1,820,336
Apr.-June -- 0 623 2,130,333
July-Sept. -- 0 605 1,880,659
Oct.-Dec. -- 0 472 1,253,620 1 Product 4: 72 cell Multicrystalline silicon module, with a peak power wattage between 290w to 340w, inclusive, P‐max or Wp. Source: Compiled from data submitted in response to Commission questionnaires.

V‐39
Table V-16 CSPV products: Weighted-average f.o.b. prices and quantities of domestic and imported product 5,1 by quarters, 2012-16
* * * * * * *

V‐40
Figure V-8 CSPV products: Weighted-average prices and quantities of domestic and imported product 1, by quarters, 2012-16
* * * * * * *
V‐41
Figure V-9 CSPV products: Weighted-average prices and quantities of domestic and imported product 2, by quarters, 2012-16
* * * * * * *

V‐42
Figure V-10 CSPV products: Weighted-average prices and quantities of domestic and imported product 3, by quarters, 2012-16
* * * * * * *

V‐43
Figure V-11 CSPV products: Weighted-average prices and quantities of domestic and imported product 4, by quarters, 2012-16
* * * * * * *

V‐44
Figure V-12 CSPV products: Weighted-average prices and quantities of domestic and imported product 5, by quarters, 2012-16
* * * * * * *

V‐45
Aggregate pricing trends
Prices for all five price products decreased during 2012‐16. As shown in table V‐17, price
decreases of U.S.‐origin CSPV products ranged from 48.5 to 73.2 percent during 2012‐16 while
price decreases of foreign‐origin CSPV products ranged from 45.7 to 51.0 percent.
Table V-17 CSPV products: Summary of weighted-average f.o.b. prices for products 1-5 from the United States and from other countries
Item Number of quarters
Low price (dollars per
kilowatt)
High price (dollars per
kilowatt)
Change in price over
period1 (percent)
Product 1: U.S.-origin 17 *** *** ***
Foreign-origin 1 *** *** ***Product 2: U.S.-origin 12 *** *** ***
Foreign-origin 20 535 1,059 (49.4)Product 3: U.S.-origin 20 *** *** ***
Foreign-origin 20 *** *** ***Product 4: U.S.-origin --- -- -- --
Foreign-origin 20 472 869 (45.7)Product 5: U.S.-origin 20 *** *** ***
Foreign-origin 19 *** *** ***1 Percentage change from the first quarter to the last quarter, if available. Note.—No domestic data were reported for product 4. Source: Compiled from data submitted in response to Commission questionnaires.
Price comparisons
Prices for foreign‐origin CSPV products were lower than prices of U.S.‐origin CSPV
products in 33 of 52 instances (***) and higher in 19 instances (***) (table V‐18).48
48 On an annual basis, prices for foreign‐origin CSPV products were lower than prices of U.S.‐origin
CSPV products in 10 of 12 instances and higher in 2 instances during 2012, lower in 6 of 11 instances and higher in 5 instances during 2013, lower in 6 instances of 11 instances and higher in 5 instances during 2014, lower in 6 of 10 instances and higher in 4 instances during 2015, and lower in 5 of 8 instances and higher in 3 instances during 2016.
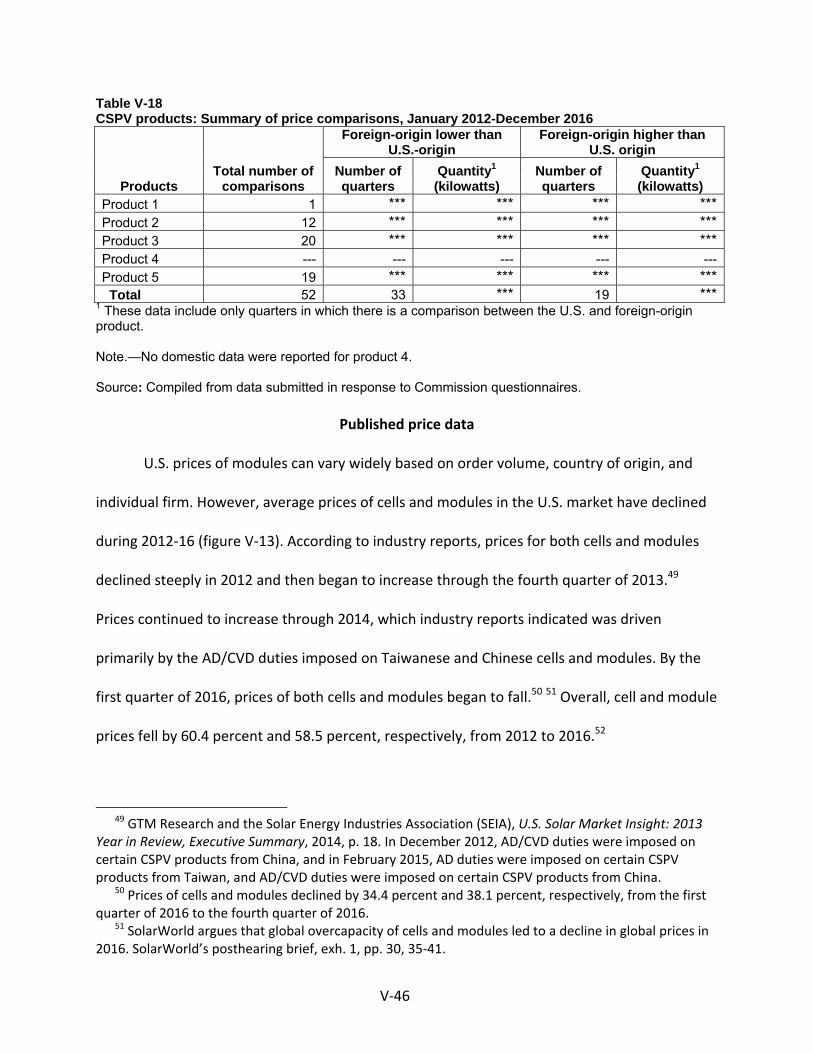
V‐46
Table V-18 CSPV products: Summary of price comparisons, January 2012-December 2016
Products Total number of
comparisons
Foreign-origin lower than U.S.-origin
Foreign-origin higher than U.S. origin
Number of quarters
Quantity1 (kilowatts)
Number of quarters
Quantity1 (kilowatts)
Product 1 1 *** *** *** ***Product 2 12 *** *** *** ***Product 3 20 *** *** *** ***Product 4 --- --- --- --- --- Product 5 19 *** *** *** *** Total 52 33 *** 19 ***
1 These data include only quarters in which there is a comparison between the U.S. and foreign-origin product. Note.—No domestic data were reported for product 4. Source: Compiled from data submitted in response to Commission questionnaires.
Published price data
U.S. prices of modules can vary widely based on order volume, country of origin, and
individual firm. However, average prices of cells and modules in the U.S. market have declined
during 2012‐16 (figure V‐13). According to industry reports, prices for both cells and modules
declined steeply in 2012 and then began to increase through the fourth quarter of 2013.49
Prices continued to increase through 2014, which industry reports indicated was driven
primarily by the AD/CVD duties imposed on Taiwanese and Chinese cells and modules. By the
first quarter of 2016, prices of both cells and modules began to fall.50 51 Overall, cell and module
prices fell by 60.4 percent and 58.5 percent, respectively, from 2012 to 2016.52
49 GTM Research and the Solar Energy Industries Association (SEIA), U.S. Solar Market Insight: 2013
Year in Review, Executive Summary, 2014, p. 18. In December 2012, AD/CVD duties were imposed on certain CSPV products from China, and in February 2015, AD duties were imposed on certain CSPV products from Taiwan, and AD/CVD duties were imposed on certain CSPV products from China.
50 Prices of cells and modules declined by 34.4 percent and 38.1 percent, respectively, from the first quarter of 2016 to the fourth quarter of 2016.
51 SolarWorld argues that global overcapacity of cells and modules led to a decline in global prices in 2016. SolarWorld’s posthearing brief, exh. 1, pp. 30, 35‐41.

V‐47
Figure V-13
U.S. cell and module prices, quarterly, 2012-16
Source: GTM Research and the Solar Energy Industries Association (SEIA), U.S. Solar Market Insight: 2012-2016 Year in Review, Executive Summaries.
Lost sales and lost revenue
Of the 12 responding U.S. producers, eight reported that they had to reduce prices and
three reported that they had to roll back announced price increases in order to avoid losing
sales to competitors selling imported CSPV products since 2012. Three of these U.S. producers
estimated that the revenue lost totaled approximately $140 million since 2012. Seven U.S.
producers reported that they had lost sales of CSPV products to imported product since 2012.
Four U.S. producers estimated that the total sales lost were approximately 950,000 kilowatts
since 2012.53
52 GTM Research and the Solar Energy Industries Association (SEIA), U.S. Solar Market Insight: 2016
Year in Review, Executive Summary, 2017, p. 16. 53 *** did not provide a quantity estimate but estimated that its lost sales totaled $148.7 million.
0.00
0.10
0.20
0.30
0.40
0.50
0.60
0.70
0.80
0.90
1.00
2012 2013 2014 2015 2016
Dol
lars
per
wat
t
Cell Module

V‐48
As noted in Part I, the Commission received purchaser questionnaire responses from
106 purchasers. Responding purchasers reported that more than 90 percent of their purchases
were foreign‐origin CSPV cells and CSPV modules during 2012‐16 (table V‐19). Purchasers
reported purchasing fewer CSPV cells and more CSPV modules on both an actual basis and as a
share of total CSPV products (cells and modules) from 2012 to 2016. Reported purchases of
CSPV cells from all sources, as a share of total CSPV products (cells and modules), decreased by
15.9 percentage points in 2012 to 4.2 percent in 2016, while reported purchases of CSPV
modules from all sources, as a share of total CSPV products, increased by 15.9 percentage
points to 95.8 percent from 2012 to 2016. Purchases of domestically produced modules, as a
share of total CSPV products, increased by 0.3 percentage points to 4.6 percent while purchases
of foreign‐origin CSPV modules, as a share of total CSPV products, increased by 15.6 percentage
points to 91.2 percent from 2012 to 2016.

V‐49
Table V-19 CSPV products: Purchasers' purchases by type, 2012-16
Item
Calendar year
2012 2013 2014 2015 2016
Quantity (kilowatts)
CSPV cells-- U.S.-origin 17,715 1,300 1,400 1,800 2,444
Foreign-origin 396,140 608,146 735,410 1,419,711 332,322
All origins 413,855 609,446 736,810 1,421,511 334,766
CSPV modules-- U.S.-origin 89,198 83,474 173,404 356,602 366,900
Foreign-origin 1,559,728 2,468,507 4,031,170 6,889,503 7,303,322
All origins 1,648,926 2,551,981 4,204,574 7,246,105 7,670,222
CSPV product (cells and modules)-- U.S.-origin 106,913 84,774 174,804 358,402 369,344
Foreign-origin 1,955,868 3,076,653 4,766,580 8,309,214 7,635,644
All origins 2,062,781 3,161,427 4,941,384 8,667,616 8,004,988
Share of quantity (percent)
CSPV cells-- U.S.-origin 0.9 0.0 0.0 0.0 0.0
Foreign-origin 19.2 19.2 14.9 16.4 4.2
All origins 20.1 19.3 14.9 16.4 4.2
CSPV modules-- U.S.-origin 4.3 2.6 3.5 4.1 4.6
Foreign-origin 75.6 78.1 81.6 79.5 91.2
All origins 79.9 80.7 85.1 83.6 95.8
CSPV products (cells and modules)-- U.S.-origin 5.2 2.7 3.5 4.1 4.6
Foreign-origin 94.8 97.3 96.5 95.9 95.4
All origins 100.0 100.0 100.0 100.0 100.0 Source: Compiled from data submitted in response to Commission questionnaires.
The majority of purchasers reported increasing purchases of domestic CSPV modules, in
actual kilowatts; however, the share of domestic CSPV module purchases remained relatively
unchanged, increasing from 4.3 percent of total purchases of CSPV products in 2012 to 4.6
percent in 2016. Less than one‐third of purchasers both decreased their purchases of
domestically produced CSPV modules and increased their foreign‐origin CSPV modules, either
by actual kilowatts or as a share of total purchases from 2012 to 2016 (table V‐20). No

V‐50
purchaser reported simultaneously decreasing purchases of domestically produced CSPV cells
and increasing purchases of foreign‐origin CSPV cells from 2012 to 2016.
Table V-20
CSPV products: Number of changes in firm-level share of purchases of U.S.-origin and foreign-origin CSPV products since 2012
Item Decreased US-origin
Increased foreign-origin
Both decreased U.S.-origin and
increased foreign-origin
Number of firms
CSPV cells.-- Absolute values (in kilowatts) 1 6 0 Relative values (percentage points) 1 4 0
CSPV modules.-- Absolute values (in kilowatts) 19 75 19 Relative values (percentage points) 27 48 27
CSPV products (cells and modules).-- Absolute values (in kilowatts) 20 79 19 Relative values (percentage points) 28 50 27 Source: Compiled from data submitted in response to Commission questionnaires.
Of the 104 responding purchasers, 91 reported that, since 2012, they had purchased
imported CSPV products instead of U.S.‐produced product. Seventy‐three of these purchasers
reported that import prices were lower than U.S.‐produced product, and 33 of these purchasers
reported that price was a primary reason for the decision to purchase imported product rather
than U.S.‐produced CSPV products. Thirty‐one purchasers estimated the quantity of imported
CSPV products purchased instead of domestic CSPV products; quantities ranged from 54 kW to
1.7 million kW, totaling 3.4 million kW. Fifty‐three of 86 purchasers indicated that price was not
a primary reason for purchasing imported product rather than the domestic product. These
purchasers identified financial strength/bankability, customer service, product range
(technology and efficiencies), quality, product availability, warranty backstop protection, and
V‐51
delivery time as non‐price reasons for purchasing imported rather than U.S.‐produced CSPV
products.
Of the 103 responding purchasers, 38 reported that U.S. producers had reduced prices
of CSPV products in order to compete with lower‐priced imports (44 purchasers reported that
they did not know). The reported estimated price reduction ranged from 3 to 70 percent,
averaging 31 percent. In describing the price reductions, purchasers indicated that domestic
prices have fallen throughout the period of investigation, with several purchasers noting
steeper price reductions in 2016.
OTHER DYNAMICS IN THE U.S. MARKET
Incentive programs and regulations
Changes in the availability and scope of Federal, state, and local government incentives
and regulations continue to affect demand for CSPV products. Various mechanisms were
created to help solar electricity reach price parity with traditional energy sources, thereby
stimulating demand for solar‐generated electricity. These mechanisms include fiscal incentives
and regulatory measures. These fiscal incentives and regulatory measures benefit system
owners, and typically are not directed at any particular domestic or foreign manufacturer of
CSPV products.
There are a wide array of fiscal incentives that are designed to lower the cost of solar
project development, including various tax credits, revenues from the sale of solar renewable
energy certificates (SRECs), cash grants in lieu of credit, accelerated depreciation, and loan
guarantees (table V‐21). Tax credits are the most common form of Federal fiscal incentive;
several types of tax credits, which have been modified and extended at various times, have

V‐52
affected the timing of the development of solar projects. However, these incentives were
designed to decline over time, as the cost to generate solar‐powered electricity declined.54
Table V-21 CSPV products: Selected U.S. fiscal incentives to promote solar energy
Type of incentive Description Expiration Date
Production Tax Credit (PTC)
Encourages solar energy production by providing a 10-year production-based tax credit equal to 2.3¢/kWh.
Project must have been under construction by end of 2013.
Investment Tax Credit (ITC)
A 30 percent tax credit on capital expenditures for new solar PV system on residential commercial properties, and utility-scale systems.
Project must be commissioned by end of 2019 for 30 percent tax credit; 26 percent tax credit in 2020, 22 percent in 2021 and after 2021 residential drops to zero while commercial and utility drop to a permanent 10 percent. Projects commenced before December 31, 2021 may still qualify for ITC if they are placed in service before December 31, 2023.
Cash grant program (Treasury 1603 program)
Cash grant equal to up to 30 percent of eligible capital expenditures in lieu of the ITC for commercial solar projects.
Project must be under construction by the end of 2011 and completed by the end of 2016.
Loan guarantee program (DOE 1705 loan program)
Authorized $16 billion in loan guarantees, mostly for wind and solar generation projects.
Must have begun construction before September 30, 2011.
Manufacturing tax credit (MTC)
Allocated $2.3 billion in investment tax credits up to 30 percent of investment in manufacturing facilities of clean energy products.
Project must have been commissioned before February 17, 2013.
Source: Renewable Energy and Related Services: Recent Developments, USITC Publication 4421, August 2013, pp. 2-11-12; and SEIA, “Solar Investment Tax Credit,” http://www.seia.org/policy/finance-tax/solar-investment-tax-credit, retrieved July 2017.
Recently, the Public Utility Regulatory Policies Act of 1978 (PURPA) has emerged as a
significant driver of utility‐scale solar installations in certain states.55 This regulation requires
utilities to purchase electricity from qualifying facilities (renewable projects that meet size
54 Certain Crystalline Silicon Photovoltaic Products from China, Inv. Nos. 701‐TA‐481 and 731‐TA‐1190
(Final), USITC Publication 4360, November 2012, pp. 22‐24. 55 GTM Research and the Solar Energy Industries Association (SEIA), U.S. Solar Market Insight: 2016
Year in Review, Executive Summary, 2017, p.12; EIA Website, https://www.eia.gov/todayinenergy/detail.php?id=27632, retrieved July 27, 2017; Smith, Colin, “What Drives Utility Solar Growth in a Post‐ITC‐Extension World?” Greentech Media, March 24, 2016, https://www.greentechmedia.com/articles/read/What‐Drives‐Utility‐Solar‐Growth‐in‐a‐Post‐ITC‐Extension‐World.

V‐53
requirements) at the utility’s avoided cost.56 The declining cost of solar generated electricity has
led to the development of more utility‐scale solar under PURPA in a number of states such as
North Carolina and Utah.57 In many other states, however, PURPA has not been a significant
driver of solar installations since states set certain criteria related to PURPA (which can make
solar projects more or less attractive) and the “Energy Policy Act of 2005 allowed states with
competitive electricity markets to opt out of PURPA.”58
One widespread state regulatory measure is the renewable portfolio standards
(“RPSs”).59 RPSs primarily affect demand for renewable energy, including solar electricity, by
mandating its use and thereby increasing the demand for CSPV products. In the United States,
29 states plus the District of Columbia had RPS policies in place in 2016. Of these, 18 states plus
the District of Columbia had RPS policies with a solar or distributed generation carve out (share
56 “Avoided cost is the cost a utility would incur if it chose to either provide the energy itself (by
building new capacity) or to purchase the energy from nonqualifying facilities.” EIA Website, https://www.eia.gov/todayinenergy/detail.php?id=27632, retrieved July 27, 2017; Federal Energy Regulatory Commission (FERC) Website, https://www.ferc.gov/industries/electric/gen‐info/qual‐fac/what‐is.asp, retrieved July 27, 2017.
57 EIA Website, https://www.eia.gov/todayinenergy/detail.php?id=27632, retrieved July 27, 2017; Smith, Colin, “What Drives Utility Solar Growth in a Post‐ITC‐Extension World?” Greentech Media, March 24, 2016, https://www.greentechmedia.com/articles/read/What‐Drives‐Utility‐Solar‐Growth‐in‐a‐Post‐ITC‐Extension‐World; Warren, Chris, “Once an Obscure Law, PURPA Now Drives Utility‐Scale Solar. Regulatory Conflict Quickly Followed,” Greentech Media, February 23, 2017, https://www.greentechmedia.com/articles/read/purpa‐is‐causing‐conflict‐in‐montana.
58 EIA Website, https://www.eia.gov/todayinenergy/detail.php?id=27632, retrieved July 27, 2017; Smith, Colin, “What Drives Utility Solar Growth in a Post‐ITC‐Extension World?” Greentech Media, March 24, 2016, https://www.greentechmedia.com/articles/read/What‐Drives‐Utility‐Solar‐Growth‐in‐a‐Post‐ITC‐Extension‐World; Warren, Chris, “Once an Obscure Law, PURPA Now Drives Utility‐Scale Solar. Regulatory Conflict Quickly Followed,” Greentech Media, February 23, 2017, https://www.greentechmedia.com/articles/read/purpa‐is‐causing‐conflict‐in‐montana.
59 An RPS is a regulatory mandate that requires entities that supply electricity, such as utility companies, to generate or buy a portion of their retail electricity sales from renewable energy sources, including solar.

V‐54
of the RPS that must be supplied by these sources).60 Several of these states with RPSs also set
up a market for tradeable certificates.61 During 2012–16, a majority of utility‐scale solar
additions were for entities (such as utilities) and markets with RPS requirements.62 By 2016,
many utilities had met interim or final renewable energy mandates and 64 percent of utility PV
projects in development were driven by non‐RPS mechanisms.63 At the same time, however,
seven states increased their RPS requirements in 2016.64
States and utilities have implemented a number of programs to encourage the
installation of solar, including rebates and feed‐in‐tariffs (“FITs”).65 In renewable energy rebate
programs (such as the California Solar Initiative), customers that install PV systems receive a
60 An additional three states have credit multipliers, which award additional credit for certain types of
renewable energy. Barbose, Galen, U.S. Renewables Portfolio Standards: 2016 Annual Status Report, April 2016, pp. 5–6, https://emp.lbl.gov/sites/all/files/lbnl‐1005057.pdf. In 2011, California increased its RPS goals to 20 percent by the end of 2013, 25 percent by the end of 2016, and 33 percent by the end of 2020. In October 2015, California increased its renewable energy mandate to 50 percent of all electricity supplied by retail sellers and publicly owned utilities. Certain Crystalline Silicon Photovoltaic Products from China and Taiwan, Invs. Nos. 701‐TA‐511 and 731‐TA‐1246‐1247 (Final) USITC Publication 4519 February 2015. p. II‐25; California Energy Commission Website, http://www.energy.ca.gov/portfolio/, retrieved July 27, 2017.
61 A SREC is created for each megawatt‐hour of electricity generated from solar energy systems. A large customer or retailer of electricity required to meet renewable energy targets can purchase a certificate in lieu of deploying MWh of its own. Renewable energy generators can also sell certificates to entities covered by RPS. “SREC” markets have emerged in the United States, with New Jersey as the largest market. Prices of tradable certificates can be volatile. Certain Crystalline Silicon Photovoltaic Products from China and Taiwan, Invs. Nos. 701‐TA‐511 and 731‐TA‐1246‐1247 (Final), USITC Publication 4519 February 2015. p. II‐25.
62 Lawrence Berkeley National Laboratory defines RPS capacity additions as “capacity contracted to entities subject to an RPS or sold on a merchant basis into regional RPS markets.” Barbose, Galen, U.S. Renewables Portfolio Standards: 2017 Annual Status Report, July 2017, pp. 17‐18, https://emp.lbl.gov/sites/default/files/2017_annual_rps_summary_report.pdf.
63 According to industry reports, 64 percent of utility PV projects in development are driven by non‐RPS mechanisms. GTM Research and the Solar Energy Industries Association (SEIA), U.S. Solar Market Insight: 2016 Year in Review, Executive Summary, 2017, p. 12.
64 Barbose, Galen, U.S. Renewables Portfolio Standards: 2017 Annual Status Report, July 2017, p. 10. 65 A FIT offers a guarantee of payments to solar electricity developers for the electricity they produce.
Payments are based on a certain price per kilowatt‐hour (kWh) at which electricity is purchased, typically as part of a long‐term agreement set over a period of 15‐20 years.

V‐55
refund to cover a portion of the cost of the system installation.66 FITs primarily affect the supply
of solar energy by paying a solar electricity generator a known rate for electricity fed into the
grid. In the United States, six states have FITs in place (California, Hawaii, Maine, Oregon,
Vermont, and Washington). These payments are generally awarded as long‐term contracts set
over a period of 15 to 20 years.67
Net metering allows residential and commercial customers that generate their own
electricity from solar to receive credit for excess electricity fed into the grid.68 In some states,
utilities may offer net metering programs voluntarily or as a result of regulatory decisions.
Differences between states’ legislation and implementation mean that the benefits of net
metering can vary widely for solar customers in different areas of the United States. There were
more than 43 states, the District of Columbia and four territories with some form of net energy
metering legislation or regulation in process in 2013.69 However, since then, Hawaii, Arizona,
Maine, and Indiana have begun to phase out their net metering incentives.70 Utility companies,
that are forced to credit customers for the solar electricity they generate but do not use, have
66 NREL Website,
http://www.nrel.gov/tech_deployment/state_local_governments/basics_rebates.html, retrieved July 27, 2017; Go Solar California Website, http://www.gosolarcalifornia.ca.gov/about/csi.php, retrieved July 27, 2017.
67 National Renewable Energy Laboratory (NREL), “Feed‐In‐Tariffs,” http://www.nrel.gov/tech_deployment/state_local_governments/basics_tariffs.html, retrieved July 17, 2017.
68 Residential and commercial customers can use this credit to offset the cost of grid electricity used when their CSPV system does not generate enough electricity to cover their needs.
69 SEIA, “Net Metering,” http://www.seia.org/policy/distributed‐solar/net‐metering. 70 As of July 2017, 38 states, the District of Columbia, and three territories have mandatory net
metering rules in place. Database of State Incentives for Renewables & Efficiency (DSIRE), Net Metering, July 2017, http://ncsolarcen‐prod.s3.amazonaws.com/wp‐content/uploads/2017/07/DSIRE_Net_Metering_July2017.pdf. National Conference of State Legislatures, “State Net Metering,” November 3, 2016, http://www.ncsl.org/research/energy/net‐metering‐policy‐overview‐and‐state‐legislative‐updates.aspx, retrieved July 19, 2017.
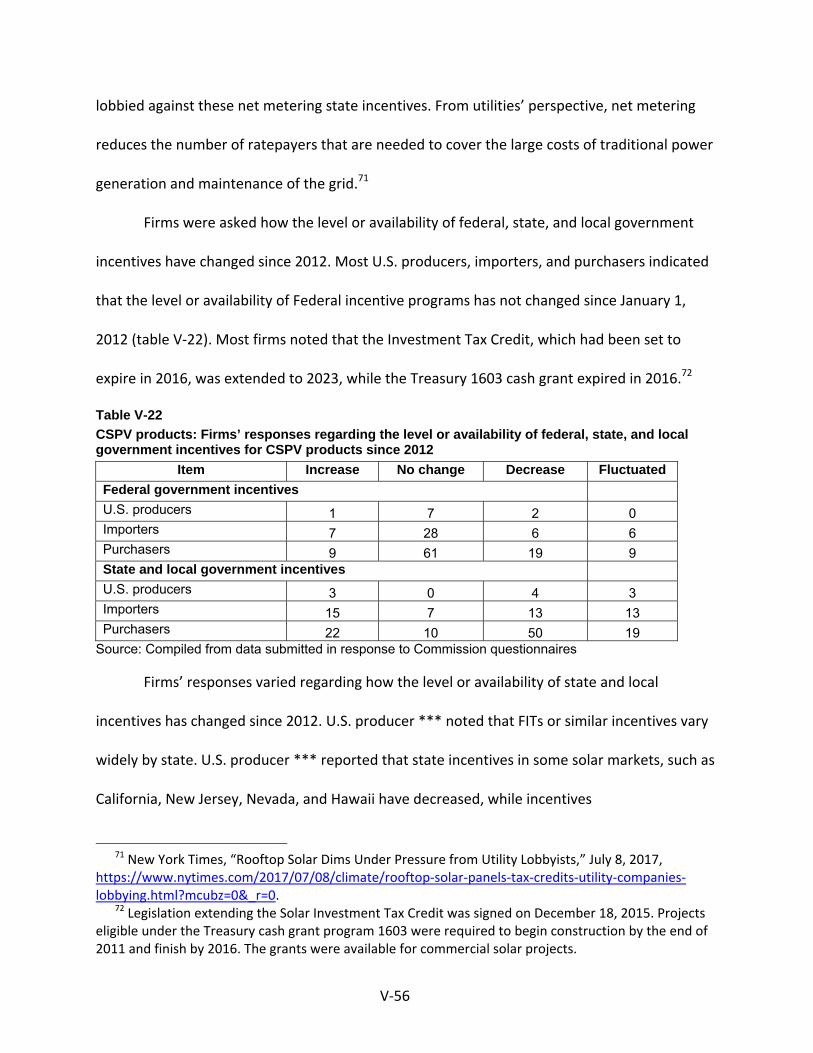
V‐56
lobbied against these net metering state incentives. From utilities’ perspective, net metering
reduces the number of ratepayers that are needed to cover the large costs of traditional power
generation and maintenance of the grid.71
Firms were asked how the level or availability of federal, state, and local government
incentives have changed since 2012. Most U.S. producers, importers, and purchasers indicated
that the level or availability of Federal incentive programs has not changed since January 1,
2012 (table V‐22). Most firms noted that the Investment Tax Credit, which had been set to
expire in 2016, was extended to 2023, while the Treasury 1603 cash grant expired in 2016.72
Table V-22
CSPV products: Firms’ responses regarding the level or availability of federal, state, and local government incentives for CSPV products since 2012
Item Increase No change Decrease Fluctuated
Federal government incentives
U.S. producers 1 7 2 0 Importers 7 28 6 6 Purchasers 9 61 19 9 State and local government incentives
U.S. producers 3 0 4 3 Importers 15 7 13 13 Purchasers 22 10 50 19
Source: Compiled from data submitted in response to Commission questionnaires
Firms’ responses varied regarding how the level or availability of state and local
incentives has changed since 2012. U.S. producer *** noted that FITs or similar incentives vary
widely by state. U.S. producer *** reported that state incentives in some solar markets, such as
California, New Jersey, Nevada, and Hawaii have decreased, while incentives
71 New York Times, “Rooftop Solar Dims Under Pressure from Utility Lobbyists,” July 8, 2017,
https://www.nytimes.com/2017/07/08/climate/rooftop‐solar‐panels‐tax‐credits‐utility‐companies‐lobbying.html?mcubz=0&_r=0.
72 Legislation extending the Solar Investment Tax Credit was signed on December 18, 2015. Projects eligible under the Treasury cash grant program 1603 were required to begin construction by the end of 2011 and finish by 2016. The grants were available for commercial solar projects.

V‐57
in other markets, such as Massachusetts, North Carolina, and South Carolina, have increased.
Of the firms that indicated a decline in state and local incentives, most attributed the decrease
to changes in net metering policies.
Firms were asked how the changes in the level of federal, state, and local government
incentives have affected the demand for CSPV products since 2012 (table V‐23). For federal
incentives, most firms reported that changes to federal incentives have not changed the
demand for CSPV products. Most firms that indicated an increase in demand of CSPV products
was due to the level of federal incentives noted the extension of the ITC. For state and local
incentives, a plurality of U.S. producers, importers, and purchasers reported an increase in the
demand for CSPV products due to the availability of state and local incentives. U.S. producers,
importers, and purchasers most often described state RPS mandates as a mechanism that
increased demand for CSPV product installations.
Table V-23 CSPV products: Firms’ responses regarding how changes in the availability of government incentives have affected the demand for CSPV products since 2012
Item Increase No change Decrease Fluctuated
Federal government incentives
U.S. producers 3 5 1 1 Importers 17 19 2 9 Purchasers 33 49 9 11 State and local government incentives
U.S. producers 4 3 1 3 Importers 18 8 8 13 Purchasers 38 24 21 22
Source: Compiled from data submitted in response to Commission questionnaires
Firms were asked how changes in the availability of government incentives have
affected the price of solar generated electricity since 2012 (table V‐24). Most firms responded
that availability of government incentives had led to a decrease in the price of solar generated

V‐58
electricity. Several firms attributed the decline in the price of solar generated electricity to the
increase in supply of solar generated electricity in the marketplace.
Table V-24 CSPV products: Firms’ responses regarding how changes in the availability of government incentives have affected the price of solar generated electricity since 2012
Item Increase No change Decrease Fluctuated U.S. producers 0 3 6 1 Importers 2 10 27 8 Purchasers 4 23 56 11
Source: Compiled from data submitted in response to Commission questionnaires
Firms were asked how changes in the price of solar generated electricity have affected
the price of CSPV products since 2012. Most U.S. producers (7 of 10), importers (24 of 44), and
purchasers (53 of 95) reported that changes in the price of solar generated electricity did not
affect the prices of CSPV products. Several firms, however, reported that the price of CSPV
modules is a large factor in the price of solar electricity; and therefore, declining CSPV module
prices translate directly into less expensive solar generated electricity.
Other sources of electricity
The demand for CSPV products is derived from the demand for solar electricity.
However, purchasers can use energy and electricity from a wide variety of sources, ranging
from traditional fossil fuels to various forms of renewable energy (including wind, solar,
geothermal, and biomass). Electricity providers using renewable energy sources seek to achieve
“grid parity” with other sources of electricity.73 Levelized cost of electricity (“LCOE”) represents
the per‐kilowatt hour cost of building and operating a generating plant over an assumed
73 Grid parity is the price at which the levelized cost of electricity generated from renewable sources
is competitive with the cost of conventional energy from the grid.
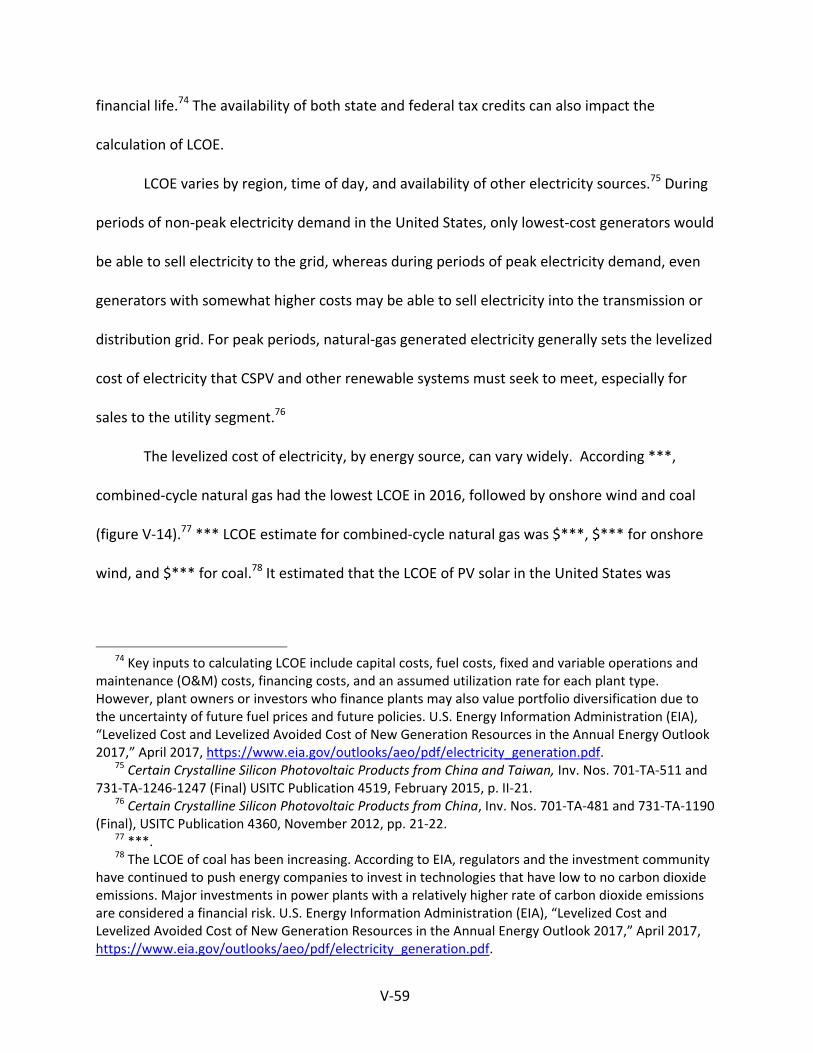
V‐59
financial life.74 The availability of both state and federal tax credits can also impact the
calculation of LCOE.
LCOE varies by region, time of day, and availability of other electricity sources.75 During
periods of non‐peak electricity demand in the United States, only lowest‐cost generators would
be able to sell electricity to the grid, whereas during periods of peak electricity demand, even
generators with somewhat higher costs may be able to sell electricity into the transmission or
distribution grid. For peak periods, natural‐gas generated electricity generally sets the levelized
cost of electricity that CSPV and other renewable systems must seek to meet, especially for
sales to the utility segment.76
The levelized cost of electricity, by energy source, can vary widely. According ***,
combined‐cycle natural gas had the lowest LCOE in 2016, followed by onshore wind and coal
(figure V‐14).77 *** LCOE estimate for combined‐cycle natural gas was $***, $*** for onshore
wind, and $*** for coal.78 It estimated that the LCOE of PV solar in the United States was
74 Key inputs to calculating LCOE include capital costs, fuel costs, fixed and variable operations and
maintenance (O&M) costs, financing costs, and an assumed utilization rate for each plant type. However, plant owners or investors who finance plants may also value portfolio diversification due to the uncertainty of future fuel prices and future policies. U.S. Energy Information Administration (EIA), “Levelized Cost and Levelized Avoided Cost of New Generation Resources in the Annual Energy Outlook 2017,” April 2017, https://www.eia.gov/outlooks/aeo/pdf/electricity_generation.pdf.
75 Certain Crystalline Silicon Photovoltaic Products from China and Taiwan, Inv. Nos. 701‐TA‐511 and 731‐TA‐1246‐1247 (Final) USITC Publication 4519, February 2015, p. II‐21.
76 Certain Crystalline Silicon Photovoltaic Products from China, Inv. Nos. 701‐TA‐481 and 731‐TA‐1190 (Final), USITC Publication 4360, November 2012, pp. 21‐22.
77 ***. 78 The LCOE of coal has been increasing. According to EIA, regulators and the investment community
have continued to push energy companies to invest in technologies that have low to no carbon dioxide emissions. Major investments in power plants with a relatively higher rate of carbon dioxide emissions are considered a financial risk. U.S. Energy Information Administration (EIA), “Levelized Cost and Levelized Avoided Cost of New Generation Resources in the Annual Energy Outlook 2017,” April 2017, https://www.eia.gov/outlooks/aeo/pdf/electricity_generation.pdf.

V‐60
$*** and $***.79 However, the LCOE of solar varied widely by state. In California, the state with
the largest PV installations (by MW), the LCOE of PV solar ***. ***.80
Figure V-14 Estimated U.S. levelized cost of electricity ranges for selected technologies, dollars per MWh, 20161
* * * * * * *
The EIA estimated the average LCOE for new plants entering service in 2019 (table V‐
25). When tax credits were included, new onshore wind installations had the lowest estimated
79 ***. 80 ***. ***.

V‐61
LCOE, at $34.50/MWh. For new combined‐cycle natural gas plants, the estimated LCOE ranged
from $45.2/MWh to $49.3/MWh. The estimated LCOE of new solar PV installations was
estimated to be $53.10/MWh when tax credits are included and $70.10/MWh unsubsidized.
Table V-25 Estimated U.S. capacity-weighted average LCOE for plants entering service in 20191
Total System LCOE
Total LCOE including Tax
Credits2
(2016 $/MWh) Natural Gas-fired: Conventional combined cycle 49.30 49.30
Advanced combined cycle 45.20 45.20
Conventional combustion Turbine 92.70 92.70
Advanced combustion turbine 78.30 78.30
Wind-onshore 52.40 34.50
Solar PV 70.10 53.10
Solar thermal 158.90 122.101 The capacity-weighted average is the average levelized cost per technology, weighted by the new capacity coming online in each region. The capacity additions for each region are based on additions in 2017-2019. 2 Levelized cost with tax credits reflects tax credits available for plants entering service in 2019. Not all technologies have tax credits available. Source: U.S. Energy Information Administration, Annual Energy Outlook 2017, January 2017, DOE/EIA-0383 (2017).
As shown in figure V‐15, the general trend of the price of coal used for electricity
generation has remained relatively unchanged since 2012 and is forecasted to stay stable
through 2018. The price of natural gas used for electricity generation increased in the latter half
of 2012 and 2013, peaking in February 2014 and then declined to its lowest level in March
2016. Since then, the price of natural gas has risen, and is projected to continue to increase.
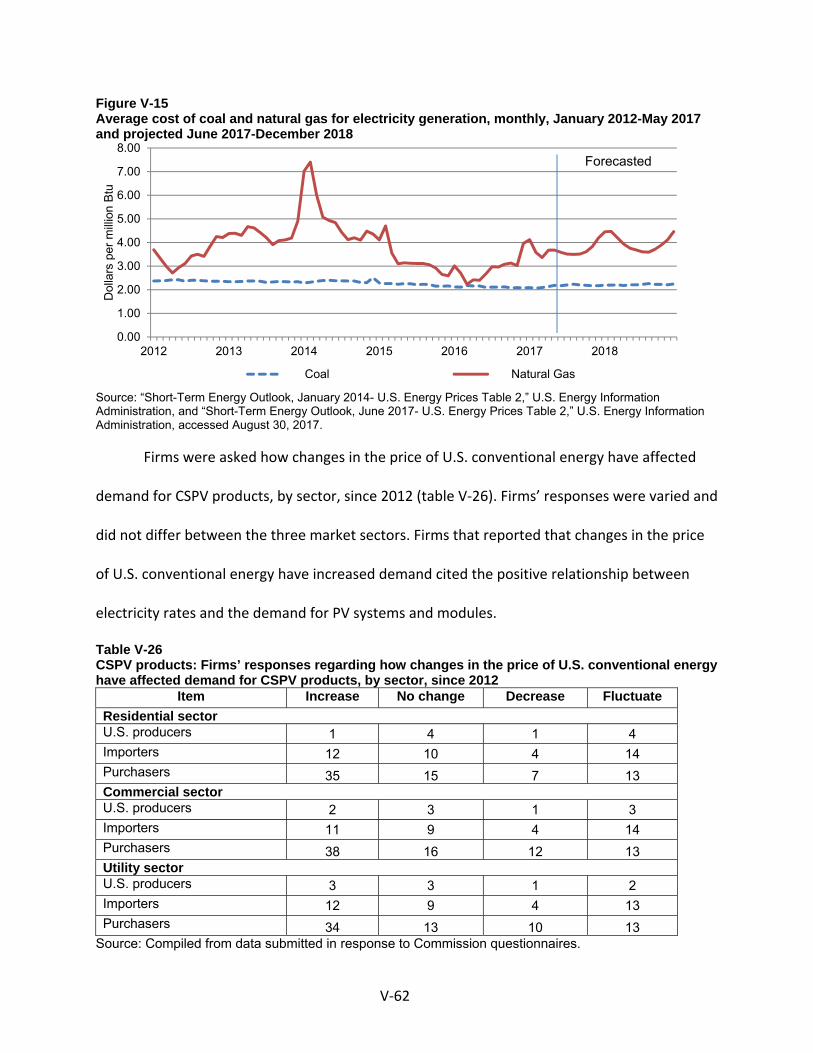
V‐62
Figure V-15 Average cost of coal and natural gas for electricity generation, monthly, January 2012-May 2017 and projected June 2017-December 2018
Source: “Short-Term Energy Outlook, January 2014- U.S. Energy Prices Table 2,” U.S. Energy Information Administration, and “Short-Term Energy Outlook, June 2017- U.S. Energy Prices Table 2,” U.S. Energy Information Administration, accessed August 30, 2017.
Firms were asked how changes in the price of U.S. conventional energy have affected
demand for CSPV products, by sector, since 2012 (table V‐26). Firms’ responses were varied and
did not differ between the three market sectors. Firms that reported that changes in the price
of U.S. conventional energy have increased demand cited the positive relationship between
electricity rates and the demand for PV systems and modules.
Table V-26 CSPV products: Firms’ responses regarding how changes in the price of U.S. conventional energy have affected demand for CSPV products, by sector, since 2012
Item Increase No change Decrease Fluctuate
Residential sector U.S. producers 1 4 1 4 Importers 12 10 4 14 Purchasers 35 15 7 13 Commercial sector U.S. producers 2 3 1 3 Importers 11 9 4 14 Purchasers 38 16 12 13 Utility sector U.S. producers 3 3 1 2 Importers 12 9 4 13 Purchasers 34 13 10 13
Source: Compiled from data submitted in response to Commission questionnaires.
0.00
1.00
2.00
3.00
4.00
5.00
6.00
7.00
8.00
2012 2013 2014 2015 2016 2017 2018
Dol
lars
per
mill
ion
Btu
Coal Natural Gas
Forecasted

V‐63
Most U.S. producers reported that changes in the price of U.S. conventional energy have
not affected the price of solar generated electricity since 2012 (table V‐27).81 However, a
plurality of importers and purchasers reported that changes in the price of U.S. conventional
energy has decreased the price of solar generated electricity. U.S. producers reported that the
decrease in the price of solar generated electricity has been driven by CSPV market competition
and not by falling prices of conventional energy. Furthermore, several importers and purchasers
stated that there is no correlation between conventional energy prices and prices of solar
generated electricity.
Table V-27 CSPV products: Firms’ responses regarding how changes in the price of U.S. conventional energy have affected the price of solar generated electricity since 2012
Item Increase No change Decrease Fluctuate
U.S. producers 0 6 1 2 Importers 0 13 14 13 Purchasers 4 29 44 13
Source: Compiled from data submitted in response to Commission questionnaires
81 SolarWorld argues that there is no correlation between the price of conventional energy and the
price of CSPV products, noting that U.S. solar prices declined by approximately 60 percent during 2012‐16 while natural gas prices increased from 2012 through the first quarter of 2014 and increased in the second half of 2016. SolarWorld’s posthearing brief, p. 19 and exh. 1, pp. 29‐30.


A‐1
APPENDIX A
FEDERAL REGISTER NOTICES

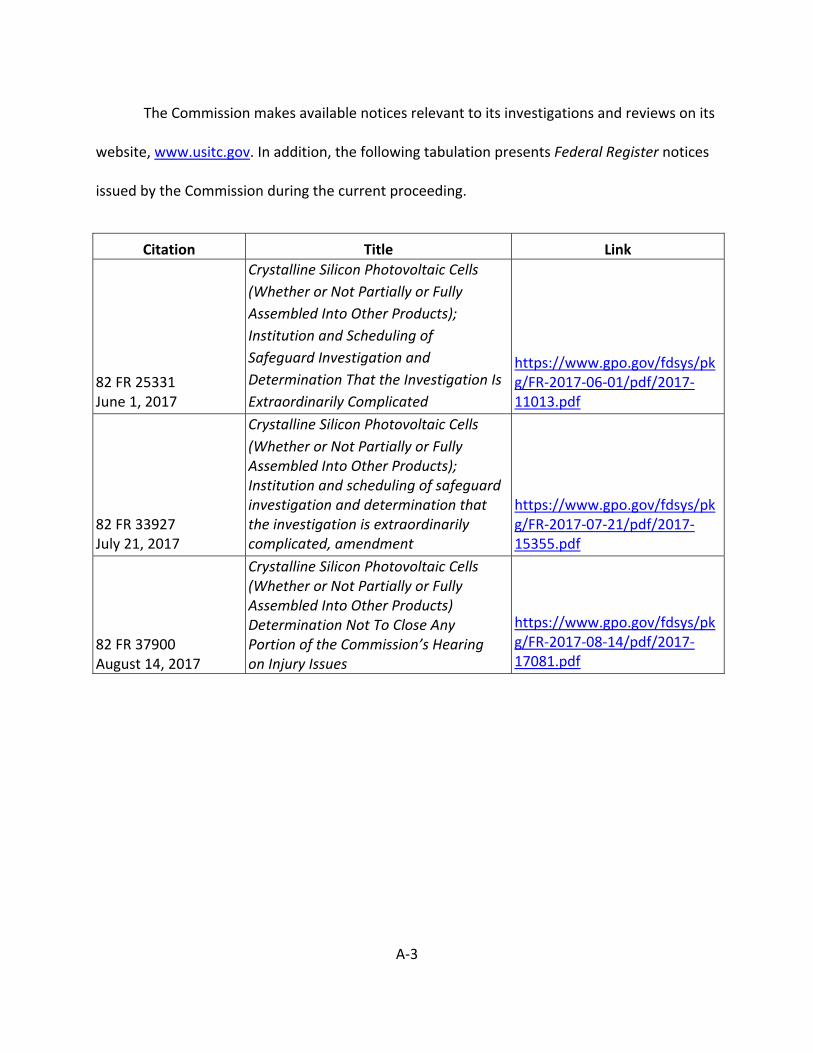
A‐3
The Commission makes available notices relevant to its investigations and reviews on its
website, www.usitc.gov. In addition, the following tabulation presents Federal Register notices
issued by the Commission during the current proceeding.
Citation Title Link
82 FR 25331 June 1, 2017
Crystalline Silicon Photovoltaic Cells
(Whether or Not Partially or Fully
Assembled Into Other Products);
Institution and Scheduling of
Safeguard Investigation and
Determination That the Investigation Is
Extraordinarily Complicated
https://www.gpo.gov/fdsys/pkg/FR‐2017‐06‐01/pdf/2017‐11013.pdf
82 FR 33927 July 21, 2017
Crystalline Silicon Photovoltaic Cells
(Whether or Not Partially or Fully Assembled Into Other Products); Institution and scheduling of safeguard investigation and determination that the investigation is extraordinarily complicated, amendment
https://www.gpo.gov/fdsys/pkg/FR‐2017‐07‐21/pdf/2017‐15355.pdf
82 FR 37900 August 14, 2017
Crystalline Silicon Photovoltaic Cells (Whether or Not Partially or Fully Assembled Into Other Products) Determination Not To Close Any Portion of the Commission’s Hearing on Injury Issues
https://www.gpo.gov/fdsys/pkg/FR‐2017‐08‐14/pdf/2017‐17081.pdf


B‐1
APPENDIX B
LIST OF HEARING WITNESSES

B‐2
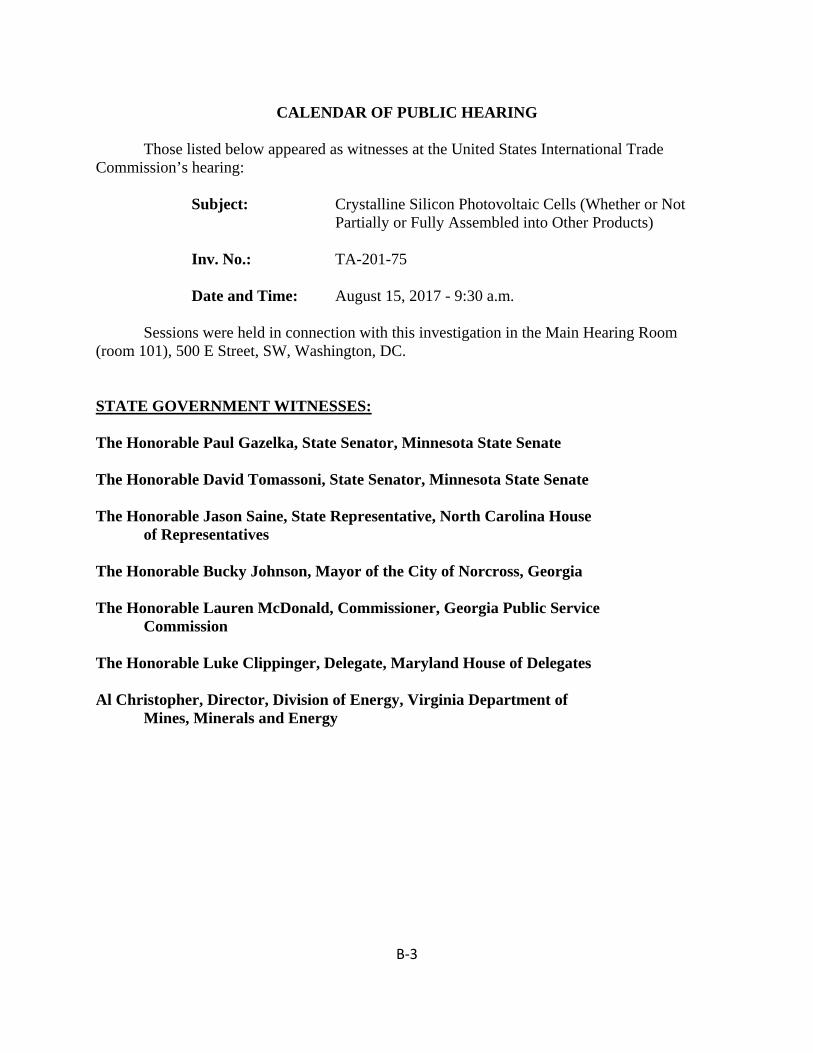
B‐3
CALENDAR OF PUBLIC HEARING
Those listed below appeared as witnesses at the United States International Trade Commission’s hearing:
Subject: Crystalline Silicon Photovoltaic Cells (Whether or Not Partially or Fully Assembled into Other Products)
Inv. No.: TA-201-75
Date and Time: August 15, 2017 - 9:30 a.m.
Sessions were held in connection with this investigation in the Main Hearing Room
(room 101), 500 E Street, SW, Washington, DC.
STATE GOVERNMENT WITNESSES: The Honorable Paul Gazelka, State Senator, Minnesota State Senate The Honorable David Tomassoni, State Senator, Minnesota State Senate The Honorable Jason Saine, State Representative, North Carolina House of Representatives The Honorable Bucky Johnson, Mayor of the City of Norcross, Georgia The Honorable Lauren McDonald, Commissioner, Georgia Public Service Commission The Honorable Luke Clippinger, Delegate, Maryland House of Delegates Al Christopher, Director, Division of Energy, Virginia Department of Mines, Minerals and Energy

B‐4
EMBASSY WITNESSES: Embassy of the Republic of Korea Washington, DC The Honorable Chang K. Kim, Minister Counsellor for Trade, Industry & Energy Embassy of the Republic of Indonesia Washington, DC Reza Pahlevi Chairul, Commercial Attaché Delegation of the European Union to the United States of America Washington, DC Sibylle Zitko, Senior Legal Advisor Embassy of Brazil Washington, DC Reynaldo Linhares Colares, Second Secretary Embassy of Mexico Washington, DC Aristeo Lopez, Legal Adviser in the Commercial and NAFTA Office of the Secretariat of Economy Embassy of Canada Washington, DC
Carrie Goodge O’Brien, Counsellor (Trade Policy) Taipei Economic and Cultural Representative Office Washington, DC Chien Chi Chao, Economic Officer OPENING REMARKS Petitioners (Matthew J. McConkey, Mayer Brown LLP) Respondents (Matthew R. Nicely, Hughes Hubbard & Reed LLP)

B‐5
IN SUPPORT OF THE PETITION:
Mayer Brown LLP Washington, DC on behalf of Suniva Inc.
Matt Card, Executive Vice President of Commercial Operations, Suniva Inc. Dave McCarty, Chief Operating Officer, Itek Energy Steve Shea, Consultant, Formerly Vice President at Beamreach Solar Warren Payne, Sr., International Trade Advisor, Mayer Brown LLP Andrew Szamosszegi, Principal, Capital Trade Inc. Seth Kaplan, President, International Economic Research LLC Matthew J. McConkey )
) – OF COUNSEL Margaret Sales )
Wiley Rein LLP Washington, DC on behalf of SolarWorld Americas, Inc. (“SolarWorld”)
Juergen Stein, Chief Executive Officer, SolarWorld Shane Messer, Vice President of Sales and Marketing, SolarWorld Edward Harner, Chief Operating Officer, Green Solar Technologies Timothy C. Brightbill )
Usha Neelakantan ) – OF COUNSEL Tessa V. Capeloto )
B‐6
NON-PARTIES IN SUPPORT OF THE PETITION: FisherBroyles,LLP Washington, DC on behalf of SKC, Inc. Emmarine Byerson, Senior Accounting & Risk Manager Aiden Oh, Business Manager Philip Gallas ) – OF COUNSEL Stion Corporation Hattiesburg, MS Frank Yang, Vice President of Business Development & Marketing IN OPPOSITION TO THE PETITION: Hughes Hubbard & Reed LLP Washington, DC on behalf of The Solar Energy Industries Association (“SEIA”) and its member company SunPower Corporation Thomas Werner, President and CEO, SunPower Corp.
Ed Fenster, Co-Founder and Executive Chairman, Sunrun Inc. Dan Shugar, Founder and CEO, NEXTracker Craig Cornelius, Senior Vice President, Renewables, NRG Energy Inc. Bastel Wardak, President, California Solar Systems, Inc. Thomas J. Prusa, Professor and Chair, Department of Economics,
Rutgers University
Amy Grace, Head of North America Research, Bloomberg New Energy Finance
B‐7
IN OPPOSITION TO THE PETITION (continued): James P. Dougan, Vice President, Economic Consulting Services, LLC
Jennifer Lutz, Senior Economist, Economic Consulting Services, LLC Emma K. Peterson, Economist, Economic Consulting Services, LLC
Matthew R. Nicely ) ) – OF COUNSEL Julia K. Eppard )
Baker & McKenzie LLP Washington, DC on behalf of Depcom Power Inc. (“Depcom”)
James Lamon, Chief Executive Officer, Depcom Kevin M. O’Brien ) – OF COUNSEL Curtis, Mallet-Prevost, Colt & Mosle LLP Washington, DC on behalf of Korea Photovoltaic Industry Association Hanwha Q Cells Korea Corporation LG Electronics, Inc. Hyundai Heavy Industries Green Energy Co., Ltd. (collectively, “KOPIA”) Aaron Hall President, Borrego Solar
Stephen Hahm, VP of Energy Business, LG Electronics USA
Kevin Kim, Head of Solar Business, LG Electronics USA
Dave Byrne, Senior Sales Manager of Solar Business, LG Electronics USA
Bo Gyung Kim-Lauren, Senior Counsel, LG Electronics USA

B‐8
IN OPPOSITION TO THE PETITION (continued): Edward Balistreri, Associate Professor, Department of Economics,
Iowa State University Daniel L. Porter ) ) – OF COUNSEL James P. Durling ) Akin Gump Strauss Hauer & Feld LLP Washington, DC on behalf of China Chamber of Commerce for Import and Export of Machinery and Electronic Products, Solar Energy and Photovoltaic Products Branch (“CCCME”) Spencer S. Griffith ) – OF COUNSEL Appleton Luff Pte. Ltd. Washington, DC on behalf of REC Solar Pte. Ltd (“REC Solar”) REC Americas, LLC (collectively, “REC”)
Steven M. O’Neil, Chief Executive Officer, REC Solar Edmund W. Sim )
) – OF COUNSEL Kelley A. Slater )
Arent Fox LLP Washington, DC on behalf of Hanwha Q Cells America Inc. (“Hanwha”) Sunghoon Kim, Senior Director of Sales Planning, Hanwha Andres Munro, General Counsel, Hanwha Sam Yoon, Sales Planning Manager, Hanwha John N. Gurley ) ) – OF COUNSEL Nancy A. Noonan )
B‐9
IN OPPOSITION TO THE PETITION (continued): Vinson & Elkins LLP Washington, DC on behalf of SunPower Corporation (“SunPower”) Thomas Werner, President and Chief Executive Officer, SunPower Daniel J. Gerkin ) – OF COUNSEL Hogan Lovells US LLP Washington, DC on behalf of Canadian Solar Inc. Silfab Solar, Inc. Heliene Inc. (collectively, the “Canadian Industry”) Vincent Ambrose, General Manager for North America, Canadian Solar Inc.
Paolo Maccario, General Manager and Chief Operating Officer, Silfab Solar Inc.
Martin Pochtaruk, President, Heliene Inc.
Robert A. Rogowsky, Ph.D., Professor and Program Chair of Trade and Economic Diplomacy at the Monterey Institute of International Studies
Jonathan T. Stoel ) Craig A. Lewis ) ) – OF COUNSEL
Michael Jacobsen ) Mary Van Houten ) Smirnow Law Washington, DC on behalf of 8minutenergy Renewables LLC (“8minutenergy”)
Arthur Haubenstock, General Counsel and Vice President, Government & Regulatory, 8minutenergy
John P. Smirnow ) – OF COUNSEL GigaWatt, Inc. Placentia, CA Deep Patel, Founder and Chief Executive Officer

B‐10
NON-PARTIES IN OPPOSITION TO THE PETITION:
PT. Sky Energy Indonesia Indonesia Jio Wu, Director of International Business Development REBUTTAL/CLOSING REMARKS: Petitioners (Timothy C. Brightbill, Wiley Rein LLP; Matthew J. McConkey of Mayer Brown LLP; and Seth Kaplan, International Economic Research LLC) Respondents (Matthew R. Nicely, Hughes Hubbard & Reed LLP)

C‐1
APPENDIX C
SUMMARY DATA

C‐2
Table C‐1a CSPV products: Summary data concerning the U.S. market with country‐of‐origin of imports based on cell manufacture location, 2012‐16 ................................................................ C‐3 Table C‐1b CSPV products: Summary data concerning the U.S. market with country‐of‐origin of imports based on cell manufacture location except modules assembled in NAFTA countries, 2012‐16 ....................................................................................................................... C‐5 Table C‐2 CSPV products: Summary data concerning the merchant U.S. market for cells, 2012‐16 ......... C‐7 Table C‐3a CSPV products: Summary data concerning the total U.S. market for modules with country‐of‐origin of imports based on cell manufacture location, 2012‐16 ............................... C‐9 Table C‐3b CSPV products: Summary data concerning the total U.S. market for modules with country‐of‐origin of imports based on cell manufacture location, 2012‐16 ............................. C‐11 Table C‐4 CSPV products: Apparent consumption and market shares by channel for modules, 2012‐16 ..................................................................................................................................... C‐13 Table C‐5 CSPV products: Apparent consumption and market shares by 60‐cell vs 72‐cell modules, 2012‐16 ..................................................................................................................................... C‐14 Table C‐6 CSPV products: Apparent consumption and market shares by mono‐ vs multi‐crystaline cell modules 2012‐16 ................................................................................................................ C‐15 Table C‐7 CPSV products: U.S. imports compiled from official U.S. import statistics, 2012‐16 ............... C‐16

Table C-1aCSPV products: Summary data concerning the U.S. market with country-of-origin of imports based on cell manufacture location, 2012-16
2012 2013 2014 2015 2016 2012-16 2012-13 2013-14 2014-15 2015-16U.S. consumption quantity:
Amount................................................................................ *** *** *** *** *** *** *** *** *** ***Producers' share (fn1).......................................................... *** *** *** *** *** *** *** *** *** ***Importers' share (fn1):
Canada............................................................................. *** *** *** *** *** *** *** *** *** ***China................................................................................ *** *** *** *** *** *** *** *** *** ***Germany........................................................................... *** *** *** *** *** *** *** *** *** ***Indonesia.......................................................................... *** *** *** *** *** *** *** *** *** ***Japan............................................................................... *** *** *** *** *** *** *** *** *** ***Korea................................................................................ *** *** *** *** *** *** *** *** *** ***Malaysia........................................................................... *** *** *** *** *** *** *** *** *** ***Mexico.............................................................................. *** *** *** *** *** *** *** *** *** ***Philippines........................................................................ *** *** *** *** *** *** *** *** *** ***Singapore......................................................................... *** *** *** *** *** *** *** *** *** ***Taiwan.............................................................................. *** *** *** *** *** *** *** *** *** ***Thailand............................................................................ *** *** *** *** *** *** *** *** *** ***Vietnam............................................................................ *** *** *** *** *** *** *** *** *** ***All other sources............................................................... *** *** *** *** *** *** *** *** *** ***
All import sources.......................................................... *** *** *** *** *** *** *** *** *** ***
U.S. consumption value:Amount................................................................................ *** *** *** *** *** *** *** *** *** ***Producers' share (fn1).......................................................... *** *** *** *** *** *** *** *** *** ***Importers' share (fn1):
Canada............................................................................. *** *** *** *** *** *** *** *** *** ***China................................................................................ *** *** *** *** *** *** *** *** *** ***Germany........................................................................... *** *** *** *** *** *** *** *** *** ***Indonesia.......................................................................... *** *** *** *** *** *** *** *** *** ***Japan............................................................................... *** *** *** *** *** *** *** *** *** ***Korea................................................................................ *** *** *** *** *** *** *** *** *** ***Malaysia........................................................................... *** *** *** *** *** *** *** *** *** ***Mexico.............................................................................. *** *** *** *** *** *** *** *** *** ***Philippines........................................................................ *** *** *** *** *** *** *** *** *** ***Singapore......................................................................... *** *** *** *** *** *** *** *** *** ***Taiwan.............................................................................. *** *** *** *** *** *** *** *** *** ***Thailand............................................................................ *** *** *** *** *** *** *** *** *** ***Vietnam............................................................................ *** *** *** *** *** *** *** *** *** ***All other sources............................................................... *** *** *** *** *** *** *** *** *** ***
All import sources.......................................................... *** *** *** *** *** *** *** *** *** ***
U.S. imports from:Canada:
Quantity............................................................................ *** *** *** *** *** *** *** *** *** ***Value................................................................................ *** *** *** *** *** *** *** *** *** ***Unit value.......................................................................... *** *** *** *** *** *** *** *** *** ***Ending inventory quantity.................................................. *** *** *** *** *** *** *** *** *** ***
China:Quantity............................................................................ 326,846 82,264 1,263,270 3,311,513 2,720,193 732.3 (74.8) 1,435.6 162.1 (17.9)Value................................................................................ 291,878 69,976 747,148 1,680,733 1,258,864 331.3 (76.0) 967.7 125.0 (25.1)Unit value.......................................................................... $893 $851 $591 $508 $463 (48.2) (4.7) (30.5) (14.2) (8.8)Ending inventory quantity.................................................. *** *** *** *** *** *** *** *** *** ***
Germany:Quantity............................................................................ *** *** *** *** *** *** *** *** *** ***Value................................................................................ *** *** *** *** *** *** *** *** *** ***Unit value.......................................................................... *** *** *** *** *** *** *** *** *** ***Ending inventory quantity.................................................. *** *** *** *** *** *** *** *** *** ***
Indonesia:Quantity............................................................................ *** *** *** *** *** *** *** *** *** ***Value................................................................................ *** *** *** *** *** *** *** *** *** ***Unit value.......................................................................... *** *** *** *** *** *** *** *** *** ***Ending inventory quantity.................................................. *** *** *** *** *** *** *** *** *** ***
Japan:Quantity............................................................................ *** *** *** *** *** *** *** *** *** ***Value................................................................................ *** *** *** *** *** *** *** *** *** ***Unit value.......................................................................... *** *** *** *** *** *** *** *** *** ***Ending inventory quantity.................................................. *** *** *** *** *** *** *** *** *** ***
Korea:Quantity............................................................................ *** *** *** *** *** *** *** *** *** ***Value................................................................................ *** *** *** *** *** *** *** *** *** ***Unit value.......................................................................... *** *** *** *** *** *** *** *** *** ***Ending inventory quantity.................................................. *** *** *** *** *** *** *** *** *** ***
Malaysia:Quantity............................................................................ *** *** *** *** *** *** *** *** *** ***Value................................................................................ *** *** *** *** *** *** *** *** *** ***Unit value.......................................................................... *** *** *** *** *** *** *** *** *** ***Ending inventory quantity.................................................. *** *** *** *** *** *** *** *** *** ***
Mexico:Quantity............................................................................ *** *** *** *** *** *** *** *** *** ***Value................................................................................ *** *** *** *** *** *** *** *** *** ***Unit value.......................................................................... *** *** *** *** *** *** *** *** *** ***Ending inventory quantity.................................................. *** *** *** *** *** *** *** *** *** ***
Philippines:Quantity............................................................................ *** *** *** *** *** *** *** *** *** ***Value................................................................................ *** *** *** *** *** *** *** *** *** ***Unit value.......................................................................... *** *** *** *** *** *** *** *** *** ***Ending inventory quantity.................................................. *** *** *** *** *** *** *** *** *** ***
Signapore:Quantity............................................................................ *** *** *** *** *** *** *** *** *** ***Value................................................................................ *** *** *** *** *** *** *** *** *** ***Unit value.......................................................................... *** *** *** *** *** *** *** *** *** ***Ending inventory quantity.................................................. *** *** *** *** *** *** *** *** *** ***
Taiwan:Quantity............................................................................ 1,065,160 2,113,220 2,090,974 852,758 1,118,967 5.1 98.4 (1.1) (59.2) 31.2Value................................................................................ 743,337 1,349,271 1,274,305 467,820 606,449 (18.4) 81.5 (5.6) (63.3) 29.6Unit value.......................................................................... $698 $638 $609 $549 $542 (22.3) (8.5) (4.6) (10.0) (1.2)Ending inventory quantity.................................................. 128,249 116,508 200,189 170,345 91,083 (29.0) (9.2) 71.8 (14.9) (46.5)
Thailand:Quantity............................................................................ *** *** *** *** *** *** *** *** *** ***Value................................................................................ *** *** *** *** *** *** *** *** *** ***Unit value.......................................................................... *** *** *** *** *** *** *** *** *** ***Ending inventory quantity.................................................. *** *** *** *** *** *** *** *** *** ***
Vietnam:Quantity............................................................................ *** *** *** *** *** *** *** *** *** ***Value................................................................................ *** *** *** *** *** *** *** *** *** ***Unit value.......................................................................... *** *** *** *** *** *** *** *** *** ***Ending inventory quantity.................................................. *** *** *** *** *** *** *** *** *** ***
All other sources:Quantity............................................................................ *** *** *** *** *** *** *** *** *** ***Value................................................................................ *** *** *** *** *** *** *** *** *** ***Unit value.......................................................................... *** *** *** *** *** *** *** *** *** ***Ending inventory quantity.................................................. *** *** *** *** *** *** *** *** *** ***
All import sources:Quantity............................................................................ 2,162,388 3,101,412 4,582,898 8,430,393 12,813,568 492.6 43.4 47.8 84.0 52.0Value................................................................................ 1,904,664 2,214,457 3,014,861 4,967,865 7,060,489 270.7 16.3 36.1 64.8 42.1Unit value.......................................................................... $881 $714 $658 $589 $551 (37.4) (18.9) (7.9) (10.4) (6.5)Ending inventory quantity.................................................. 303,409 327,638 560,211 1,107,536 1,238,641 308.2 8.0 71.0 97.7 11.8
Table continued on next page.
Period changes
(Quantity=kW; Value=1,000 dollars; Unit values, unit labor costs, and unit expenses=dollars per kilowatt; Period changes=percent--exceptions noted)
Reported dataBetween calendar yearsCalendar year
C-3
CSPV products: Total market: COO petition
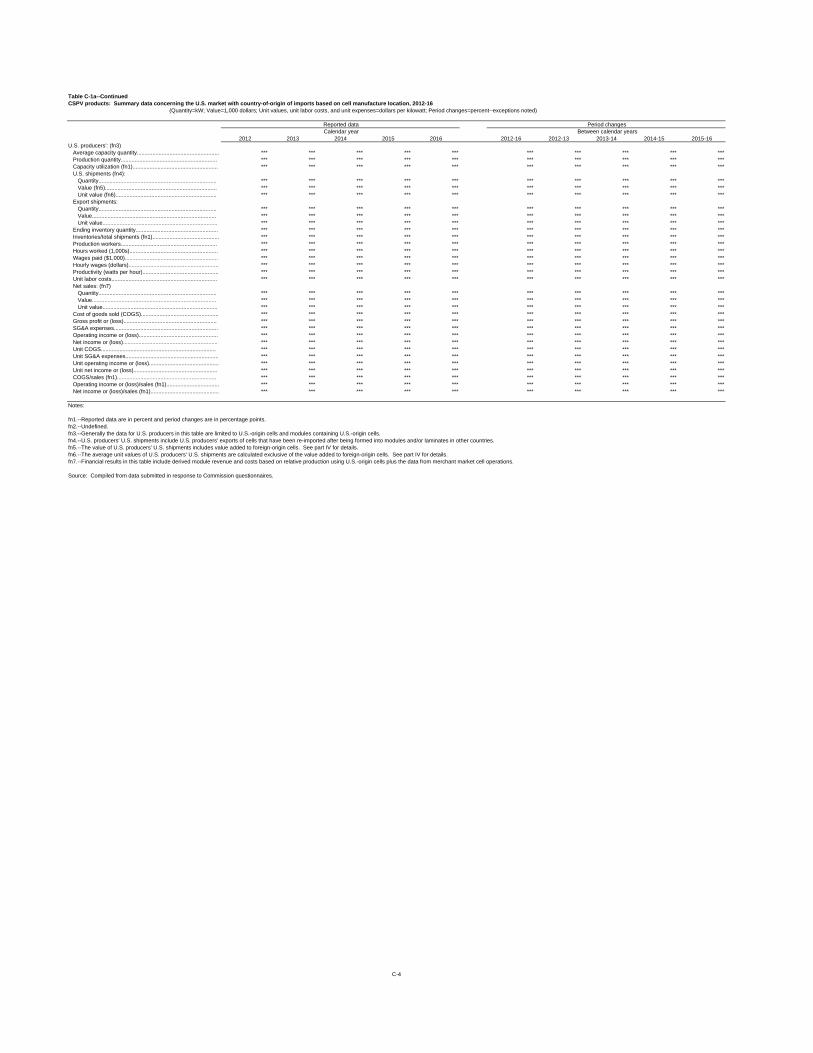
Table C-1a--ContinuedCSPV products: Summary data concerning the U.S. market with country-of-origin of imports based on cell manufacture location, 2012-16
2012 2013 2014 2015 2016 2012-16 2012-13 2013-14 2014-15 2015-16U.S. producers': (fn3)
Average capacity quantity..................................................... *** *** *** *** *** *** *** *** *** ***Production quantity.............................................................. *** *** *** *** *** *** *** *** *** ***Capacity utilization (fn1)....................................................... *** *** *** *** *** *** *** *** *** ***U.S. shipments (fn4):
Quantity............................................................................ *** *** *** *** *** *** *** *** *** ***Value (fn5)........................................................................ *** *** *** *** *** *** *** *** *** ***Unit value (fn6)................................................................. *** *** *** *** *** *** *** *** *** ***
Export shipments: Quantity............................................................................ *** *** *** *** *** *** *** *** *** ***Value................................................................................ *** *** *** *** *** *** *** *** *** ***Unit value.......................................................................... *** *** *** *** *** *** *** *** *** ***
Ending inventory quantity..................................................... *** *** *** *** *** *** *** *** *** ***Inventories/total shipments (fn1)........................................... *** *** *** *** *** *** *** *** *** ***Production workers.............................................................. *** *** *** *** *** *** *** *** *** ***Hours worked (1,000s)......................................................... *** *** *** *** *** *** *** *** *** ***Wages paid ($1,000)............................................................ *** *** *** *** *** *** *** *** *** ***Hourly wages (dollars).......................................................... *** *** *** *** *** *** *** *** *** ***Productivity (watts per hour)................................................. *** *** *** *** *** *** *** *** *** ***Unit labor costs.................................................................... *** *** *** *** *** *** *** *** *** ***Net sales: (fn7)
Quantity............................................................................ *** *** *** *** *** *** *** *** *** ***Value................................................................................ *** *** *** *** *** *** *** *** *** ***Unit value.......................................................................... *** *** *** *** *** *** *** *** *** ***
Cost of goods sold (COGS).................................................. *** *** *** *** *** *** *** *** *** ***Gross profit or (loss)............................................................ *** *** *** *** *** *** *** *** *** ***SG&A expenses................................................................... *** *** *** *** *** *** *** *** *** ***Operating income or (loss)................................................... *** *** *** *** *** *** *** *** *** ***Net income or (loss)............................................................. *** *** *** *** *** *** *** *** *** ***Unit COGS.......................................................................... *** *** *** *** *** *** *** *** *** ***Unit SG&A expenses............................................................ *** *** *** *** *** *** *** *** *** ***Unit operating income or (loss)............................................. *** *** *** *** *** *** *** *** *** ***Unit net income or (loss)...................................................... *** *** *** *** *** *** *** *** *** ***COGS/sales (fn1)................................................................ *** *** *** *** *** *** *** *** *** ***Operating income or (loss)/sales (fn1).................................. *** *** *** *** *** *** *** *** *** ***Net income or (loss)/sales (fn1)............................................ *** *** *** *** *** *** *** *** *** ***
Notes:
fn1.--Reported data are in percent and period changes are in percentage points.fn2.--Undefined. fn3.--Generally the data for U.S. producers in this table are limited to U.S.-origin cells and modules containing U.S.-origin cells.fn4.--U.S. producers' U.S. shipments include U.S. producers' exports of cells that have been re-imported after being formed into modules and/or laminates in other countries.fn5.--The value of U.S. producers' U.S. shipments includes value added to foreign-origin cells. See part IV for details.fn6.--The average unit values of U.S. producers' U.S. shipments are calculated exclusive of the value added to foreign-origin cells. See part IV for details.fn7.--Financial results in this table include derived module revenue and costs based on relative production using U.S.-origin cells plus the data from merchant market cell operations.
Source: Compiled from data submitted in response to Commission questionnaires.
(Quantity=kW; Value=1,000 dollars; Unit values, unit labor costs, and unit expenses=dollars per kilowatt; Period changes=percent--exceptions noted)
C-4
Reported data Period changesCalendar year Between calendar years

Table C-1bCSPV products: Summary data concerning the U.S. market with country-of-origin of imports based on cell manufacture location except modules assembled in NAFTA countries, 2012-16
2012 2013 2014 2015 2016 2012-16 2012-13 2013-14 2014-15 2015-16U.S. consumption quantity:
Amount................................................................................ *** *** *** *** *** *** *** *** *** ***Producers' share (fn1).......................................................... *** *** *** *** *** *** *** *** *** ***Importers' share (fn1):
Canada............................................................................. *** *** *** *** *** *** *** *** *** ***China................................................................................ *** *** *** *** *** *** *** *** *** ***Germany........................................................................... *** *** *** *** *** *** *** *** *** ***Indonesia.......................................................................... *** *** *** *** *** *** *** *** *** ***Japan............................................................................... *** *** *** *** *** *** *** *** *** ***Korea................................................................................ *** *** *** *** *** *** *** *** *** ***Malaysia........................................................................... *** *** *** *** *** *** *** *** *** ***Mexico.............................................................................. *** *** *** *** *** *** *** *** *** ***Philippines........................................................................ *** *** *** *** *** *** *** *** *** ***Singapore......................................................................... *** *** *** *** *** *** *** *** *** ***Taiwan.............................................................................. *** *** *** *** *** *** *** *** *** ***Thailand............................................................................ *** *** *** *** *** *** *** *** *** ***Vietnam............................................................................ *** *** *** *** *** *** *** *** *** ***All other sources............................................................... *** *** *** *** *** *** *** *** *** ***
All import sources.......................................................... *** *** *** *** *** *** *** *** *** ***
U.S. consumption value:Amount................................................................................ *** *** *** *** *** *** *** *** *** ***Producers' share (fn1).......................................................... *** *** *** *** *** *** *** *** *** ***Importers' share (fn1):
Canada............................................................................. *** *** *** *** *** *** *** *** *** ***China................................................................................ *** *** *** *** *** *** *** *** *** ***Germany........................................................................... *** *** *** *** *** *** *** *** *** ***Indonesia.......................................................................... *** *** *** *** *** *** *** *** *** ***Japan............................................................................... *** *** *** *** *** *** *** *** *** ***Korea................................................................................ *** *** *** *** *** *** *** *** *** ***Malaysia........................................................................... *** *** *** *** *** *** *** *** *** ***Mexico.............................................................................. *** *** *** *** *** *** *** *** *** ***Philippines........................................................................ *** *** *** *** *** *** *** *** *** ***Singapore......................................................................... *** *** *** *** *** *** *** *** *** ***Taiwan.............................................................................. *** *** *** *** *** *** *** *** *** ***Thailand............................................................................ *** *** *** *** *** *** *** *** *** ***Vietnam............................................................................ *** *** *** *** *** *** *** *** *** ***All other sources............................................................... *** *** *** *** *** *** *** *** *** ***
All import sources.......................................................... *** *** *** *** *** *** *** *** *** ***
U.S. imports from:Canada:
Quantity............................................................................ *** *** *** *** *** *** *** *** *** ***Value................................................................................ *** *** *** *** *** *** *** *** *** ***Unit value.......................................................................... *** *** *** *** *** *** *** *** *** ***Ending inventory quantity.................................................. *** *** *** *** *** *** *** *** *** ***
China:Quantity............................................................................ *** *** *** *** *** *** *** *** *** ***Value................................................................................ *** *** *** *** *** *** *** *** *** ***Unit value.......................................................................... *** *** *** *** *** *** *** *** *** ***Ending inventory quantity.................................................. *** *** *** *** *** *** *** *** *** ***
Germany:Quantity............................................................................ *** *** *** *** *** *** *** *** *** ***Value................................................................................ *** *** *** *** *** *** *** *** *** ***Unit value.......................................................................... *** *** *** *** *** *** *** *** *** ***Ending inventory quantity.................................................. *** *** *** *** *** *** *** *** *** ***
Indonesia:Quantity............................................................................ *** *** *** *** *** *** *** *** *** ***Value................................................................................ *** *** *** *** *** *** *** *** *** ***Unit value.......................................................................... *** *** *** *** *** *** *** *** *** ***Ending inventory quantity.................................................. *** *** *** *** *** *** *** *** *** ***
Japan:Quantity............................................................................ *** *** *** *** *** *** *** *** *** ***Value................................................................................ *** *** *** *** *** *** *** *** *** ***Unit value.......................................................................... *** *** *** *** *** *** *** *** *** ***Ending inventory quantity.................................................. *** *** *** *** *** *** *** *** *** ***
Korea:Quantity............................................................................ *** *** *** *** *** *** *** *** *** ***Value................................................................................ *** *** *** *** *** *** *** *** *** ***Unit value.......................................................................... *** *** *** *** *** *** *** *** *** ***Ending inventory quantity.................................................. *** *** *** *** *** *** *** *** *** ***
Malaysia:Quantity............................................................................ *** *** *** *** *** *** *** *** *** ***Value................................................................................ *** *** *** *** *** *** *** *** *** ***Unit value.......................................................................... *** *** *** *** *** *** *** *** *** ***Ending inventory quantity.................................................. *** *** *** *** *** *** *** *** *** ***
Mexico:Quantity............................................................................ *** *** *** *** *** *** *** *** *** ***Value................................................................................ *** *** *** *** *** *** *** *** *** ***Unit value.......................................................................... *** *** *** *** *** *** *** *** *** ***Ending inventory quantity.................................................. *** *** *** *** *** *** *** *** *** ***
Philippines:Quantity............................................................................ *** *** *** *** *** *** *** *** *** ***Value................................................................................ *** *** *** *** *** *** *** *** *** ***Unit value.......................................................................... *** *** *** *** *** *** *** *** *** ***Ending inventory quantity.................................................. *** *** *** *** *** *** *** *** *** ***
Signapore:Quantity............................................................................ *** *** *** *** *** *** *** *** *** ***Value................................................................................ *** *** *** *** *** *** *** *** *** ***Unit value.......................................................................... *** *** *** *** *** *** *** *** *** ***Ending inventory quantity.................................................. *** *** *** *** *** *** *** *** *** ***
Taiwan:Quantity............................................................................ *** *** *** *** *** *** *** *** *** ***Value................................................................................ *** *** *** *** *** *** *** *** *** ***Unit value.......................................................................... *** *** *** *** *** *** *** *** *** ***Ending inventory quantity.................................................. *** *** *** *** *** *** *** *** *** ***
Thailand:Quantity............................................................................ *** *** *** *** *** *** *** *** *** ***Value................................................................................ *** *** *** *** *** *** *** *** *** ***Unit value.......................................................................... *** *** *** *** *** *** *** *** *** ***Ending inventory quantity.................................................. *** *** *** *** *** *** *** *** *** ***
Vietnam:Quantity............................................................................ *** *** *** *** *** *** *** *** *** ***Value................................................................................ *** *** *** *** *** *** *** *** *** ***Unit value.......................................................................... *** *** *** *** *** *** *** *** *** ***Ending inventory quantity.................................................. *** *** *** *** *** *** *** *** *** ***
All other sources:Quantity............................................................................ *** *** *** *** *** *** *** *** *** ***Value................................................................................ *** *** *** *** *** *** *** *** *** ***Unit value.......................................................................... *** *** *** *** *** *** *** *** *** ***Ending inventory quantity.................................................. *** *** *** *** *** *** *** *** *** ***
All import sources:Quantity............................................................................ *** *** *** *** *** *** *** *** *** ***Value................................................................................ *** *** *** *** *** *** *** *** *** ***Unit value.......................................................................... *** *** *** *** *** *** *** *** *** ***Ending inventory quantity.................................................. *** *** *** *** *** *** *** *** *** ***
C-5
(Quantity=kW; Value=1,000 dollars; Unit values, unit labor costs, and unit expenses=dollars per kilowatt; Period changes=percent--exceptions noted)
Reported data Period changesCalendar year Between calendar years
CSPV products: Total market: COO NAFTA

Table C-1b--ContinuedCSPV products: Summary data concerning the U.S. market with country-of-origin of imports based on cell manufacture location except modules assembled in NAFTA countries, 2012-16
2012 2013 2014 2015 2016 2012-16 2012-13 2013-14 2014-15 2015-16U.S. producers': (fn3)
Average capacity quantity..................................................... *** *** *** *** *** *** *** *** *** ***Production quantity.............................................................. *** *** *** *** *** *** *** *** *** ***Capacity utilization (fn1)....................................................... *** *** *** *** *** *** *** *** *** ***U.S. shipments (fn4):
Quantity............................................................................ *** *** *** *** *** *** *** *** *** ***Value (fn5)........................................................................ *** *** *** *** *** *** *** *** *** ***Unit value (fn6)................................................................. *** *** *** *** *** *** *** *** *** ***
Export shipments: Quantity............................................................................ *** *** *** *** *** *** *** *** *** ***Value................................................................................ *** *** *** *** *** *** *** *** *** ***Unit value.......................................................................... *** *** *** *** *** *** *** *** *** ***
Ending inventory quantity..................................................... *** *** *** *** *** *** *** *** *** ***Inventories/total shipments (fn1)........................................... *** *** *** *** *** *** *** *** *** ***Production workers.............................................................. *** *** *** *** *** *** *** *** *** ***Hours worked (1,000s)......................................................... *** *** *** *** *** *** *** *** *** ***Wages paid ($1,000)............................................................ *** *** *** *** *** *** *** *** *** ***Hourly wages (dollars).......................................................... *** *** *** *** *** *** *** *** *** ***Productivity (watts per hour)................................................. *** *** *** *** *** *** *** *** *** ***Unit labor costs.................................................................... *** *** *** *** *** *** *** *** *** ***Net sales: (fn7)
Quantity............................................................................ *** *** *** *** *** *** *** *** *** ***Value................................................................................ *** *** *** *** *** *** *** *** *** ***Unit value.......................................................................... *** *** *** *** *** *** *** *** *** ***
Cost of goods sold (COGS).................................................. *** *** *** *** *** *** *** *** *** ***Gross profit or (loss)............................................................ *** *** *** *** *** *** *** *** *** ***SG&A expenses................................................................... *** *** *** *** *** *** *** *** *** ***Operating income or (loss)................................................... *** *** *** *** *** *** *** *** *** ***Net income or (loss)............................................................. *** *** *** *** *** *** *** *** *** ***Unit COGS.......................................................................... *** *** *** *** *** *** *** *** *** ***Unit SG&A expenses............................................................ *** *** *** *** *** *** *** *** *** ***Unit operating income or (loss)............................................. *** *** *** *** *** *** *** *** *** ***Unit net income or (loss)...................................................... *** *** *** *** *** *** *** *** *** ***COGS/sales (fn1)................................................................ *** *** *** *** *** *** *** *** *** ***Operating income or (loss)/sales (fn1).................................. *** *** *** *** *** *** *** *** *** ***Net income or (loss)/sales (fn1)............................................ *** *** *** *** *** *** *** *** *** ***
Notes:
fn1.--Reported data are in percent and period changes are in percentage points.fn2.--Undefined. fn3.--Generally the data for U.S. producers in this table are limited to U.S.-origin cells and modules containing U.S.-origin cells.fn4.--U.S. producers' U.S. shipments include U.S. producers' exports of cells that have been re-imported after being formed into modules and/or laminates in other countries.fn5.--The value of U.S. producers' U.S. shipments includes value added to foreign-origin cells. See part IV for details.fn6.--The average unit values of U.S. producers' U.S. shipments are calculated exclusive of the value added to foreign-origin cells. See part IV for details.fn7.--Financial results in this table include derived module revenue and costs based on relative production using U.S.-origin cells plus the data from merchant market cell operations.
Source: Compiled from data submitted in response to Commission questionnaires.
(Quantity=kW; Value=1,000 dollars; Unit values, unit labor costs, and unit expenses=dollars per kilowatt; Period changes=percent--exceptions noted)
Reported data Period changesBetween calendar years
C-6
Calendar year

Table C-2CSPV products: Summary data concerning the merchant U.S. market for cells, 2012-16
2012 2013 2014 2015 2016 2012-16 2012-13 2013-14 2014-15 2015-16U.S. consumption quantity:
Amount................................................................................ *** *** *** *** *** *** *** *** *** ***Producers' share (fn1).......................................................... *** *** *** *** *** *** *** *** *** ***Importers' share (fn1):
Canada............................................................................. *** *** *** *** *** *** *** *** *** ***China................................................................................ *** *** *** *** *** *** *** *** *** ***Germany........................................................................... *** *** *** *** *** *** *** *** *** ***Indonesia.......................................................................... *** *** *** *** *** *** *** *** *** ***Japan............................................................................... *** *** *** *** *** *** *** *** *** ***Korea................................................................................ *** *** *** *** *** *** *** *** *** ***Malaysia........................................................................... *** *** *** *** *** *** *** *** *** ***Mexico.............................................................................. *** *** *** *** *** *** *** *** *** ***Philippines........................................................................ *** *** *** *** *** *** *** *** *** ***Singapore......................................................................... *** *** *** *** *** *** *** *** *** ***Taiwan.............................................................................. *** *** *** *** *** *** *** *** *** ***Thailand............................................................................ *** *** *** *** *** *** *** *** *** ***Vietnam............................................................................ *** *** *** *** *** *** *** *** *** ***All other sources............................................................... *** *** *** *** *** *** *** *** *** ***
All import sources.......................................................... *** *** *** *** *** *** *** *** *** ***
U.S. consumption value:Amount................................................................................ *** *** *** *** *** *** *** *** *** ***Producers' share (fn1).......................................................... *** *** *** *** *** *** *** *** *** ***Importers' share (fn1):
Canada............................................................................. *** *** *** *** *** *** *** *** *** ***China................................................................................ *** *** *** *** *** *** *** *** *** ***Germany........................................................................... *** *** *** *** *** *** *** *** *** ***Indonesia.......................................................................... *** *** *** *** *** *** *** *** *** ***Japan............................................................................... *** *** *** *** *** *** *** *** *** ***Korea................................................................................ *** *** *** *** *** *** *** *** *** ***Malaysia........................................................................... *** *** *** *** *** *** *** *** *** ***Mexico.............................................................................. *** *** *** *** *** *** *** *** *** ***Philippines........................................................................ *** *** *** *** *** *** *** *** *** ***Singapore......................................................................... *** *** *** *** *** *** *** *** *** ***Taiwan.............................................................................. *** *** *** *** *** *** *** *** *** ***Thailand............................................................................ *** *** *** *** *** *** *** *** *** ***Vietnam............................................................................ *** *** *** *** *** *** *** *** *** ***All other sources............................................................... *** *** *** *** *** *** *** *** *** ***
All import sources.......................................................... *** *** *** *** *** *** *** *** *** ***
U.S. imports from:Canada:
Quantity............................................................................ [---] [---] [---] [---] [---] [fn2] [fn2] [fn2] [fn2] [fn2]Value................................................................................ [---] [---] [---] [---] [---] [fn2] [fn2] [fn2] [fn2] [fn2]Unit value.......................................................................... [---] [---] [---] [---] [---] [fn2] [fn2] [fn2] [fn2] [fn2]Ending inventory quantity.................................................. [---] [---] [---] [---] [---] [fn2] [fn2] [fn2] [fn2] [fn2]
China:Quantity............................................................................ *** *** *** *** *** *** *** *** *** ***Value................................................................................ *** *** *** *** *** *** *** *** *** ***Unit value.......................................................................... *** *** *** *** *** *** *** *** *** ***Ending inventory quantity.................................................. *** *** *** *** *** *** *** *** *** ***
Germany:Quantity............................................................................ *** *** *** *** *** *** *** *** *** ***Value................................................................................ *** *** *** *** *** *** *** *** *** ***Unit value.......................................................................... *** *** *** *** *** *** *** *** *** ***Ending inventory quantity.................................................. *** *** *** *** *** *** *** *** *** ***
Indonesia:Quantity............................................................................ *** *** *** *** *** *** *** *** *** ***Value................................................................................ *** *** *** *** *** *** *** *** *** ***Unit value.......................................................................... *** *** *** *** *** *** *** *** *** ***Ending inventory quantity.................................................. *** *** *** *** *** *** *** *** *** ***
Japan:Quantity............................................................................ *** *** *** *** *** *** *** *** *** ***Value................................................................................ *** *** *** *** *** *** *** *** *** ***Unit value.......................................................................... *** *** *** *** *** *** *** *** *** ***Ending inventory quantity.................................................. *** *** *** *** *** *** *** *** *** ***
Korea:Quantity............................................................................ *** *** *** *** *** *** *** *** *** ***Value................................................................................ *** *** *** *** *** *** *** *** *** ***Unit value.......................................................................... *** *** *** *** *** *** *** *** *** ***Ending inventory quantity.................................................. *** *** *** *** *** *** *** *** *** ***
Malaysia:Quantity............................................................................ *** *** *** *** *** *** *** *** *** ***Value................................................................................ *** *** *** *** *** *** *** *** *** ***Unit value.......................................................................... *** *** *** *** *** *** *** *** *** ***Ending inventory quantity.................................................. *** *** *** *** *** *** *** *** *** ***
Mexico:Quantity............................................................................ *** *** *** *** *** *** *** *** *** ***Value................................................................................ *** *** *** *** *** *** *** *** *** ***Unit value.......................................................................... *** *** *** *** *** *** *** *** *** ***Ending inventory quantity.................................................. *** *** *** *** *** *** *** *** *** ***
Philippines:Quantity............................................................................ *** *** *** *** *** *** *** *** *** ***Value................................................................................ *** *** *** *** *** *** *** *** *** ***Unit value.......................................................................... *** *** *** *** *** *** *** *** *** ***Ending inventory quantity.................................................. *** *** *** *** *** *** *** *** *** ***
Signapore:Quantity............................................................................ *** *** *** *** *** *** *** *** *** ***Value................................................................................ *** *** *** *** *** *** *** *** *** ***Unit value.......................................................................... *** *** *** *** *** *** *** *** *** ***Ending inventory quantity.................................................. *** *** *** *** *** *** *** *** *** ***
Taiwan:Quantity............................................................................ *** *** *** *** *** *** *** *** *** ***Value................................................................................ *** *** *** *** *** *** *** *** *** ***Unit value.......................................................................... *** *** *** *** *** *** *** *** *** ***Ending inventory quantity.................................................. *** *** *** *** *** *** *** *** *** ***
Thailand:Quantity............................................................................ *** *** *** *** *** *** *** *** *** ***Value................................................................................ *** *** *** *** *** *** *** *** *** ***Unit value.......................................................................... *** *** *** *** *** *** *** *** *** ***Ending inventory quantity.................................................. *** *** *** *** *** *** *** *** *** ***
Vietnam:Quantity............................................................................ *** *** *** *** *** *** *** *** *** ***Value................................................................................ *** *** *** *** *** *** *** *** *** ***Unit value.......................................................................... *** *** *** *** *** *** *** *** *** ***Ending inventory quantity.................................................. *** *** *** *** *** *** *** *** *** ***
All other sources:Quantity............................................................................ *** *** *** *** *** *** *** *** *** ***Value................................................................................ *** *** *** *** *** *** *** *** *** ***Unit value.......................................................................... *** *** *** *** *** *** *** *** *** ***Ending inventory quantity.................................................. *** *** *** *** *** *** *** *** *** ***
All import sources:Quantity............................................................................ *** *** *** *** *** *** *** *** *** ***Value................................................................................ *** *** *** *** *** *** *** *** *** ***Unit value.......................................................................... *** *** *** *** *** *** *** *** *** ***Ending inventory quantity.................................................. *** *** *** *** *** *** *** *** *** ***
Reported data Period changesCalendar year Between calendar years
C-7
(Quantity=kW; Value=1,000 dollars; Unit values, unit labor costs, and unit expenses=dollars per kilowatt; Period changes=percent--exceptions noted)
CSPV cells: Merchant market

Table C-2--ContinuedCSPV products: Summary data concerning the merchant U.S. market for cells, 2012-16
2012 2013 2014 2015 2016 2012-16 2012-13 2013-14 2014-15 2015-16U.S. producers':
Average capacity quantity..................................................... *** *** *** *** *** *** *** *** *** ***Production quantity.............................................................. *** *** *** *** *** *** *** *** *** ***Capacity utilization (fn1)....................................................... *** *** *** *** *** *** *** *** *** ***U.S. shipments:
Quantity............................................................................ *** *** *** *** *** *** *** *** *** ***Value................................................................................ *** *** *** *** *** *** *** *** *** ***Unit value.......................................................................... *** *** *** *** *** *** *** *** *** ***
Export shipments: Quantity............................................................................ *** *** *** *** *** *** *** *** *** ***Value................................................................................ *** *** *** *** *** *** *** *** *** ***Unit value.......................................................................... *** *** *** *** *** *** *** *** *** ***
Ending inventory quantity..................................................... *** *** *** *** *** *** *** *** *** ***Inventories/total shipments (fn1) (fn3)................................... *** *** *** *** *** *** *** *** *** ***Production workers.............................................................. *** *** *** *** *** *** *** *** *** ***Hours worked (1,000s)......................................................... *** *** *** *** *** *** *** *** *** ***Wages paid ($1,000)............................................................ *** *** *** *** *** *** *** *** *** ***Hourly wages (dollars).......................................................... *** *** *** *** *** *** *** *** *** ***Productivity (watts per hour) (fn3)......................................... *** *** *** *** *** *** *** *** *** ***Unit labor costs (fn3)............................................................ *** *** *** *** *** *** *** *** *** ***Net sales:
Quantity............................................................................ *** *** *** *** *** *** *** *** *** ***Value................................................................................ *** *** *** *** *** *** *** *** *** ***Unit value.......................................................................... *** *** *** *** *** *** *** *** *** ***
Cost of goods sold (COGS).................................................. *** *** *** *** *** *** *** *** *** ***Gross profit or (loss)............................................................ *** *** *** *** *** *** *** *** *** ***SG&A expenses................................................................... *** *** *** *** *** *** *** *** *** ***Operating income or (loss)................................................... *** *** *** *** *** *** *** *** *** ***Net income or (loss)............................................................. *** *** *** *** *** *** *** *** *** ***Unit COGS.......................................................................... *** *** *** *** *** *** *** *** *** ***Unit SG&A expenses............................................................ *** *** *** *** *** *** *** *** *** ***Unit operating income or (loss)............................................. *** *** *** *** *** *** *** *** *** ***Unit net income or (loss)...................................................... *** *** *** *** *** *** *** *** *** ***COGS/sales (fn1)................................................................ *** *** *** *** *** *** *** *** *** ***Operating income or (loss)/sales (fn1).................................. *** *** *** *** *** *** *** *** *** ***Net income or (loss)/sales (fn1)............................................ *** *** *** *** *** *** *** *** *** ***
Notes:
Note.--Share and ratios shown as "0.0" represent values greater than zero but less than "0.05" percent.
fn1.--Reported data are in percent and period changes are in percentage points.fn2.--Undefined. fn3.--These ratios are off of a total market basis (i.e., inclusive of the shipments that were internally consumed or production of cells dedicated for internal consumption).
Source: Compiled from data submitted in response to Commission questionnaires.
Period changesCalendar year Between calendar years
(Quantity=kW; Value=1,000 dollars; Unit values, unit labor costs, and unit expenses=dollars per kilowatt; Period changes=percent--exceptions noted)
C-8
Reported data

Table C-3aCSPV products: Summary data concerning the total U.S. market for modules with country-of-origin of imports based on cell manufacture location, 2012-16
2012 2013 2014 2015 2016 2012-16 2012-13 2013-14 2014-15 2015-16U.S. consumption quantity:
Amount................................................................................ *** *** *** *** *** *** *** *** *** ***Producers' share (fn1).......................................................... *** *** *** *** *** *** *** *** *** ***Importers' share (fn1):
Canada............................................................................. *** *** *** *** *** *** *** *** *** ***China................................................................................ *** *** *** *** *** *** *** *** *** ***Germany........................................................................... *** *** *** *** *** *** *** *** *** ***Indonesia.......................................................................... *** *** *** *** *** *** *** *** *** ***Japan............................................................................... *** *** *** *** *** *** *** *** *** ***Korea................................................................................ *** *** *** *** *** *** *** *** *** ***Malaysia........................................................................... *** *** *** *** *** *** *** *** *** ***Mexico.............................................................................. *** *** *** *** *** *** *** *** *** ***Philippines........................................................................ *** *** *** *** *** *** *** *** *** ***Singapore......................................................................... *** *** *** *** *** *** *** *** *** ***Taiwan.............................................................................. *** *** *** *** *** *** *** *** *** ***Thailand............................................................................ *** *** *** *** *** *** *** *** *** ***Vietnam............................................................................ *** *** *** *** *** *** *** *** *** ***All other sources............................................................... *** *** *** *** *** *** *** *** *** ***
All import sources.......................................................... *** *** *** *** *** *** *** *** *** ***
U.S. consumption value:Amount................................................................................ *** *** *** *** *** *** *** *** *** ***Producers' share (fn1).......................................................... *** *** *** *** *** *** *** *** *** ***Importers' share (fn1):
Canada............................................................................. *** *** *** *** *** *** *** *** *** ***China................................................................................ *** *** *** *** *** *** *** *** *** ***Germany........................................................................... *** *** *** *** *** *** *** *** *** ***Indonesia.......................................................................... *** *** *** *** *** *** *** *** *** ***Japan............................................................................... *** *** *** *** *** *** *** *** *** ***Korea................................................................................ *** *** *** *** *** *** *** *** *** ***Malaysia........................................................................... *** *** *** *** *** *** *** *** *** ***Mexico.............................................................................. *** *** *** *** *** *** *** *** *** ***Philippines........................................................................ *** *** *** *** *** *** *** *** *** ***Singapore......................................................................... *** *** *** *** *** *** *** *** *** ***Taiwan.............................................................................. *** *** *** *** *** *** *** *** *** ***Thailand............................................................................ *** *** *** *** *** *** *** *** *** ***Vietnam............................................................................ *** *** *** *** *** *** *** *** *** ***All other sources............................................................... *** *** *** *** *** *** *** *** *** ***
All import sources.......................................................... *** *** *** *** *** *** *** *** *** ***
U.S. imports from:Canada:
Quantity............................................................................ *** *** *** *** *** *** *** *** *** ***Value................................................................................ *** *** *** *** *** *** *** *** *** ***Unit value.......................................................................... *** *** *** *** *** *** *** *** *** ***Ending inventory quantity.................................................. *** *** *** *** *** *** *** *** *** ***
China:Quantity............................................................................ *** *** *** *** *** *** *** *** *** ***Value................................................................................ *** *** *** *** *** *** *** *** *** ***Unit value.......................................................................... *** *** *** *** *** *** *** *** *** ***Ending inventory quantity.................................................. *** *** *** *** *** *** *** *** *** ***
Germany:Quantity............................................................................ *** *** *** *** *** *** *** *** *** ***Value................................................................................ *** *** *** *** *** *** *** *** *** ***Unit value.......................................................................... *** *** *** *** *** *** *** *** *** ***Ending inventory quantity.................................................. *** *** *** *** *** *** *** *** *** ***
Indonesia:Quantity............................................................................ *** *** *** *** *** *** *** *** *** ***Value................................................................................ *** *** *** *** *** *** *** *** *** ***Unit value.......................................................................... *** *** *** *** *** *** *** *** *** ***Ending inventory quantity.................................................. *** *** *** *** *** *** *** *** *** ***
Japan:Quantity............................................................................ *** *** *** *** *** *** *** *** *** ***Value................................................................................ *** *** *** *** *** *** *** *** *** ***Unit value.......................................................................... *** *** *** *** *** *** *** *** *** ***Ending inventory quantity.................................................. *** *** *** *** *** *** *** *** *** ***
Korea:Quantity............................................................................ *** *** *** *** *** *** *** *** *** ***Value................................................................................ *** *** *** *** *** *** *** *** *** ***Unit value.......................................................................... *** *** *** *** *** *** *** *** *** ***Ending inventory quantity.................................................. *** *** *** *** *** *** *** *** *** ***
Malaysia:Quantity............................................................................ *** *** *** *** *** *** *** *** *** ***Value................................................................................ *** *** *** *** *** *** *** *** *** ***Unit value.......................................................................... *** *** *** *** *** *** *** *** *** ***Ending inventory quantity.................................................. *** *** *** *** *** *** *** *** *** ***
Mexico:Quantity............................................................................ *** *** *** *** *** *** *** *** *** ***Value................................................................................ *** *** *** *** *** *** *** *** *** ***Unit value.......................................................................... *** *** *** *** *** *** *** *** *** ***Ending inventory quantity.................................................. *** *** *** *** *** *** *** *** *** ***
Philippines:Quantity............................................................................ *** *** *** *** *** *** *** *** *** ***Value................................................................................ *** *** *** *** *** *** *** *** *** ***Unit value.......................................................................... *** *** *** *** *** *** *** *** *** ***Ending inventory quantity.................................................. *** *** *** *** *** *** *** *** *** ***
Signapore:Quantity............................................................................ *** *** *** *** *** *** *** *** *** ***Value................................................................................ *** *** *** *** *** *** *** *** *** ***Unit value.......................................................................... *** *** *** *** *** *** *** *** *** ***Ending inventory quantity.................................................. *** *** *** *** *** *** *** *** *** ***
Taiwan:Quantity............................................................................ *** *** *** *** *** *** *** *** *** ***Value................................................................................ *** *** *** *** *** *** *** *** *** ***Unit value.......................................................................... *** *** *** *** *** *** *** *** *** ***Ending inventory quantity.................................................. *** *** *** *** *** *** *** *** *** ***
Thailand:Quantity............................................................................ *** *** *** *** *** *** *** *** *** ***Value................................................................................ *** *** *** *** *** *** *** *** *** ***Unit value.......................................................................... *** *** *** *** *** *** *** *** *** ***Ending inventory quantity.................................................. *** *** *** *** *** *** *** *** *** ***
Vietnam:Quantity............................................................................ *** *** *** *** *** *** *** *** *** ***Value................................................................................ *** *** *** *** *** *** *** *** *** ***Unit value.......................................................................... *** *** *** *** *** *** *** *** *** ***Ending inventory quantity.................................................. *** *** *** *** *** *** *** *** *** ***
All other sources:Quantity............................................................................ *** *** *** *** *** *** *** *** *** ***Value................................................................................ *** *** *** *** *** *** *** *** *** ***Unit value.......................................................................... *** *** *** *** *** *** *** *** *** ***Ending inventory quantity.................................................. *** *** *** *** *** *** *** *** *** ***
All import sources:Quantity............................................................................ *** *** *** *** *** *** *** *** *** ***Value................................................................................ *** *** *** *** *** *** *** *** *** ***Unit value.......................................................................... *** *** *** *** *** *** *** *** *** ***Ending inventory quantity.................................................. *** *** *** *** *** *** *** *** *** ***
(Quantity=kW; Value=1,000 dollars; Unit values, unit labor costs, and unit expenses=dollars per kilowatt; Period changes=percent--exceptions noted)
Reported data Period changesCalendar year Between calendar years
C-9
CSPV modules: Total market: COO Petition

Table C-3a--ContinuedCSPV products: Summary data concerning the total U.S. market for modules with country-of-origin of imports based on cell manufacture location, 2012-16
2012 2013 2014 2015 2016 2012-16 2012-13 2013-14 2014-15 2015-16U.S. producers': (fn3)
Average capacity quantity..................................................... 929,827 913,452 716,900 871,603 1,245,807 34.0 (1.8) (21.5) 21.6 42.9Production quantity.............................................................. 538,633 447,129 440,259 552,968 669,089 24.2 (17.0) (1.5) 25.6 21.0Capacity utilization (fn1)....................................................... 57.9 48.9 61.4 63.4 53.7 (4.2) (9.0) 12.5 2.0 (9.7)U.S. shipments:
Quantity............................................................................ *** *** *** *** *** *** *** *** *** ***Value................................................................................ *** *** *** *** *** *** *** *** *** ***Unit value.......................................................................... *** *** *** *** *** *** *** *** *** ***
Export shipments: Quantity............................................................................ *** *** *** *** *** *** *** *** *** ***Value................................................................................ *** *** *** *** *** *** *** *** *** ***Unit value.......................................................................... *** *** *** *** *** *** *** *** *** ***
Ending inventory quantity..................................................... *** *** *** *** *** *** *** *** *** ***Inventories/total shipments (fn1) (fn3)................................... *** *** *** *** *** *** *** *** *** ***Production workers.............................................................. 1,293 1,080 956 1,038 1,253 (3.1) (16.5) (11.5) 8.6 20.7Hours worked (1,000s)......................................................... 3,041 2,335 1,781 2,095 2,364 (22.3) (23.2) (23.7) 17.6 12.8Wages paid ($1,000)............................................................ *** *** *** *** *** *** *** *** *** ***Hourly wages (dollars).......................................................... *** *** *** *** *** *** *** *** *** ***Productivity (watts per hour) ................................................ *** *** *** *** *** *** *** *** *** ***Unit labor costs ................................................................... *** *** *** *** *** *** *** *** *** ***Net sales:
Quantity............................................................................ 581,762 464,771 472,355 527,683 623,846 7.2 (20.1) 1.6 11.7 18.2Value................................................................................ 607,615 410,608 420,661 476,920 484,359 (20.3) (32.4) 2.4 13.4 1.6Unit value.......................................................................... $1,044 $883 $891 $904 $776 (25.7) (15.4) 0.8 1.5 (14.1)
Cost of goods sold (COGS).................................................. 858,747 545,848 422,575 432,924 488,577 (43.1) (36.4) (22.6) 2.4 12.9Gross profit or (loss)............................................................ (251,132) (135,240) (1,914) 43,996 (4,218) (98.3) (46.1) (98.6) [fn2] [fn2]SG&A expenses................................................................... 125,946 68,803 56,642 54,526 210,773 67.4 (45.4) (17.7) (3.7) 286.6Operating income or (loss)................................................... (377,078) (204,043) (58,556) (10,530) (214,991) (43.0) (45.9) (71.3) (82.0) 1,941.7Net income or (loss)............................................................. (551,170) (217,135) (54,504) (21,071) (224,873) (59.2) (60.6) (74.9) (61.3) 967.2Unit COGS.......................................................................... $1,476 $1,174 $895 $820 $783 (46.9) (20.4) (23.8) (8.3) (4.5)Unit SG&A expenses............................................................ $216 $148 $120 $103 $338 56.1 (31.6) (19.0) (13.8) 227.0Unit operating income or (loss)............................................. $(648) $(439) $(124) $(20) $(345) (46.8) (32.3) (71.8) (83.9) 1,627.0Unit net income or (loss)...................................................... $(947) $(467) $(115) $(40) $(360) (62.0) (50.7) (75.3) (65.4) 802.7COGS/sales (fn1)................................................................ 141.3 132.9 100.5 90.8 100.9 (40.5) (8.4) (32.5) (9.7) 10.1Operating income or (loss)/sales (fn1).................................. (62.1) (49.7) (13.9) (2.2) (44.4) 17.7 12.4 35.8 11.7 (42.2)Net income or (loss)/sales (fn1)............................................ (90.7) (52.9) (13.0) (4.4) (46.4) 44.3 37.8 39.9 8.5 (42.0)
Notes:
Note.--Share and ratios shown as "0.0" represent values greater than zero but less than "0.05" percent.
fn1.--Reported data are in percent and period changes are in percentage points.fn2.--Undefined. fn3.--U.S. producers’ data in this table includes modules assembled from U.S.-origin cells and from foreign-origin cells.
Source: Compiled from data submitted in response to Commission questionnaires.
C-10
(Quantity=kW; Value=1,000 dollars; Unit values, unit labor costs, and unit expenses=dollars per kilowatt; Period changes=percent--exceptions noted)
Reported data Period changesCalendar year Between calendar years

Table C-3bCSPV products: Summary data concerning the total U.S. market for modules with country-of-origin of imports based on cell manufacture location except modules assembled in NAFTA countries, 2012-16
2012 2013 2014 2015 2016 2012-16 2012-13 2013-14 2014-15 2015-16U.S. consumption quantity:
Amount................................................................................ *** *** *** *** *** *** *** *** *** ***Producers' share (fn1).......................................................... *** *** *** *** *** *** *** *** *** ***Importers' share (fn1):
Canada............................................................................. *** *** *** *** *** *** *** *** *** ***China................................................................................ *** *** *** *** *** *** *** *** *** ***Germany........................................................................... *** *** *** *** *** *** *** *** *** ***Indonesia.......................................................................... *** *** *** *** *** *** *** *** *** ***Japan............................................................................... *** *** *** *** *** *** *** *** *** ***Korea................................................................................ *** *** *** *** *** *** *** *** *** ***Malaysia........................................................................... *** *** *** *** *** *** *** *** *** ***Mexico.............................................................................. *** *** *** *** *** *** *** *** *** ***Philippines........................................................................ *** *** *** *** *** *** *** *** *** ***Singapore......................................................................... *** *** *** *** *** *** *** *** *** ***Taiwan.............................................................................. *** *** *** *** *** *** *** *** *** ***Thailand............................................................................ *** *** *** *** *** *** *** *** *** ***Vietnam............................................................................ *** *** *** *** *** *** *** *** *** ***All other sources............................................................... *** *** *** *** *** *** *** *** *** ***
All import sources.......................................................... *** *** *** *** *** *** *** *** *** ***
U.S. consumption value:Amount................................................................................ *** *** *** *** *** *** *** *** *** ***Producers' share (fn1).......................................................... *** *** *** *** *** *** *** *** *** ***Importers' share (fn1):
Canada............................................................................. *** *** *** *** *** *** *** *** *** ***China................................................................................ *** *** *** *** *** *** *** *** *** ***Germany........................................................................... *** *** *** *** *** *** *** *** *** ***Indonesia.......................................................................... *** *** *** *** *** *** *** *** *** ***Japan............................................................................... *** *** *** *** *** *** *** *** *** ***Korea................................................................................ *** *** *** *** *** *** *** *** *** ***Malaysia........................................................................... *** *** *** *** *** *** *** *** *** ***Mexico.............................................................................. *** *** *** *** *** *** *** *** *** ***Philippines........................................................................ *** *** *** *** *** *** *** *** *** ***Singapore......................................................................... *** *** *** *** *** *** *** *** *** ***Taiwan.............................................................................. *** *** *** *** *** *** *** *** *** ***Thailand............................................................................ *** *** *** *** *** *** *** *** *** ***Vietnam............................................................................ *** *** *** *** *** *** *** *** *** ***All other sources............................................................... *** *** *** *** *** *** *** *** *** ***
All import sources.......................................................... *** *** *** *** *** *** *** *** *** ***
U.S. imports from:Canada:
Quantity............................................................................ *** *** *** *** *** *** *** *** *** ***Value................................................................................ *** *** *** *** *** *** *** *** *** ***Unit value.......................................................................... *** *** *** *** *** *** *** *** *** ***Ending inventory quantity.................................................. *** *** *** *** *** *** *** *** *** ***
China:Quantity............................................................................ *** *** *** *** *** *** *** *** *** ***Value................................................................................ *** *** *** *** *** *** *** *** *** ***Unit value.......................................................................... *** *** *** *** *** *** *** *** *** ***Ending inventory quantity.................................................. *** *** *** *** *** *** *** *** *** ***
Germany:Quantity............................................................................ *** *** *** *** *** *** *** *** *** ***Value................................................................................ *** *** *** *** *** *** *** *** *** ***Unit value.......................................................................... *** *** *** *** *** *** *** *** *** ***Ending inventory quantity.................................................. *** *** *** *** *** *** *** *** *** ***
Indonesia:Quantity............................................................................ *** *** *** *** *** *** *** *** *** ***Value................................................................................ *** *** *** *** *** *** *** *** *** ***Unit value.......................................................................... *** *** *** *** *** *** *** *** *** ***Ending inventory quantity.................................................. *** *** *** *** *** *** *** *** *** ***
Japan:Quantity............................................................................ *** *** *** *** *** *** *** *** *** ***Value................................................................................ *** *** *** *** *** *** *** *** *** ***Unit value.......................................................................... *** *** *** *** *** *** *** *** *** ***Ending inventory quantity.................................................. *** *** *** *** *** *** *** *** *** ***
Korea:Quantity............................................................................ *** *** *** *** *** *** *** *** *** ***Value................................................................................ *** *** *** *** *** *** *** *** *** ***Unit value.......................................................................... *** *** *** *** *** *** *** *** *** ***Ending inventory quantity.................................................. *** *** *** *** *** *** *** *** *** ***
Malaysia:Quantity............................................................................ *** *** *** *** *** *** *** *** *** ***Value................................................................................ *** *** *** *** *** *** *** *** *** ***Unit value.......................................................................... *** *** *** *** *** *** *** *** *** ***Ending inventory quantity.................................................. *** *** *** *** *** *** *** *** *** ***
Mexico:Quantity............................................................................ *** *** *** *** *** *** *** *** *** ***Value................................................................................ *** *** *** *** *** *** *** *** *** ***Unit value.......................................................................... *** *** *** *** *** *** *** *** *** ***Ending inventory quantity.................................................. *** *** *** *** *** *** *** *** *** ***
Philippines:Quantity............................................................................ *** *** *** *** *** *** *** *** *** ***Value................................................................................ *** *** *** *** *** *** *** *** *** ***Unit value.......................................................................... *** *** *** *** *** *** *** *** *** ***Ending inventory quantity.................................................. *** *** *** *** *** *** *** *** *** ***
Signapore:Quantity............................................................................ *** *** *** *** *** *** *** *** *** ***Value................................................................................ *** *** *** *** *** *** *** *** *** ***Unit value.......................................................................... *** *** *** *** *** *** *** *** *** ***Ending inventory quantity.................................................. *** *** *** *** *** *** *** *** *** ***
Taiwan:Quantity............................................................................ *** *** *** *** *** *** *** *** *** ***Value................................................................................ *** *** *** *** *** *** *** *** *** ***Unit value.......................................................................... *** *** *** *** *** *** *** *** *** ***Ending inventory quantity.................................................. *** *** *** *** *** *** *** *** *** ***
Thailand:Quantity............................................................................ *** *** *** *** *** *** *** *** *** ***Value................................................................................ *** *** *** *** *** *** *** *** *** ***Unit value.......................................................................... *** *** *** *** *** *** *** *** *** ***Ending inventory quantity.................................................. *** *** *** *** *** *** *** *** *** ***
Vietnam:Quantity............................................................................ *** *** *** *** *** *** *** *** *** ***Value................................................................................ *** *** *** *** *** *** *** *** *** ***Unit value.......................................................................... *** *** *** *** *** *** *** *** *** ***Ending inventory quantity.................................................. *** *** *** *** *** *** *** *** *** ***
All other sources:Quantity............................................................................ *** *** *** *** *** *** *** *** *** ***Value................................................................................ *** *** *** *** *** *** *** *** *** ***Unit value.......................................................................... *** *** *** *** *** *** *** *** *** ***Ending inventory quantity.................................................. *** *** *** *** *** *** *** *** *** ***
All import sources:Quantity............................................................................ *** *** *** *** *** *** *** *** *** ***Value................................................................................ *** *** *** *** *** *** *** *** *** ***Unit value.......................................................................... *** *** *** *** *** *** *** *** *** ***Ending inventory quantity.................................................. *** *** *** *** *** *** *** *** *** ***
Reported data Period changesCalendar year Between calendar years
C-11
(Quantity=kW; Value=1,000 dollars; Unit values, unit labor costs, and unit expenses=dollars per kilowatt; Period changes=percent--exceptions noted)
CSPV modules: Total market: COO NAFTA

Table C-3b--ContinuedCSPV products: Summary data concerning the total U.S. market for modules with country-of-origin of imports based on cell manufacture location except modules assembled in NAFTA countries, 2012-16
2012 2013 2014 2015 2016 2012-16 2012-13 2013-14 2014-15 2015-16U.S. producers': (fn3)
Average capacity quantity..................................................... 929,827 913,452 716,900 871,603 1,245,807 34.0 (1.8) (21.5) 21.6 42.9Production quantity.............................................................. 538,633 447,129 440,259 552,968 669,089 24.2 (17.0) (1.5) 25.6 21.0Capacity utilization (fn1)....................................................... 57.9 48.9 61.4 63.4 53.7 (4.2) (9.0) 12.5 2.0 (9.7)U.S. shipments:
Quantity............................................................................ *** *** *** *** *** *** *** *** *** ***Value................................................................................ *** *** *** *** *** *** *** *** *** ***Unit value.......................................................................... *** *** *** *** *** *** *** *** *** ***
Export shipments: Quantity............................................................................ *** *** *** *** *** *** *** *** *** ***Value................................................................................ *** *** *** *** *** *** *** *** *** ***Unit value.......................................................................... *** *** *** *** *** *** *** *** *** ***
Ending inventory quantity..................................................... *** *** *** *** *** *** *** *** *** ***Inventories/total shipments (fn1) (fn3)................................... *** *** *** *** *** *** *** *** *** ***Production workers.............................................................. 1,293 1,080 956 1,038 1,253 (3.1) (16.5) (11.5) 8.6 20.7Hours worked (1,000s)......................................................... 3,041 2,335 1,781 2,095 2,364 (22.3) (23.2) (23.7) 17.6 12.8Wages paid ($1,000)............................................................ *** *** *** *** *** *** *** *** *** ***Hourly wages (dollars).......................................................... *** *** *** *** *** *** *** *** *** ***Productivity (watts per hour) ................................................ *** *** *** *** *** *** *** *** *** ***Unit labor costs ................................................................... *** *** *** *** *** *** *** *** *** ***Net sales:
Quantity............................................................................ 581,762 464,771 472,355 527,683 623,846 7.2 (20.1) 1.6 11.7 18.2Value................................................................................ 607,615 410,608 420,661 476,920 484,359 (20.3) (32.4) 2.4 13.4 1.6Unit value.......................................................................... $1,044 $883 $891 $904 $776 (25.7) (15.4) 0.8 1.5 (14.1)
Cost of goods sold (COGS).................................................. 858,747 545,848 422,575 432,924 488,577 (43.1) (36.4) (22.6) 2.4 12.9Gross profit or (loss)............................................................ (251,132) (135,240) (1,914) 43,996 (4,218) (98.3) (46.1) (98.6) [fn2] [fn2]SG&A expenses................................................................... 125,946 68,803 56,642 54,526 210,773 67.4 (45.4) (17.7) (3.7) 286.6Operating income or (loss)................................................... (377,078) (204,043) (58,556) (10,530) (214,991) (43.0) (45.9) (71.3) (82.0) 1,941.7Net income or (loss)............................................................. (551,170) (217,135) (54,504) (21,071) (224,873) (59.2) (60.6) (74.9) (61.3) 967.2Unit COGS.......................................................................... $1,476 $1,174 $895 $820 $783 (46.9) (20.4) (23.8) (8.3) (4.5)Unit SG&A expenses............................................................ $216 $148 $120 $103 $338 56.1 (31.6) (19.0) (13.8) 227.0Unit operating income or (loss)............................................. $(648) $(439) $(124) $(20) $(345) (46.8) (32.3) (71.8) (83.9) 1,627.0Unit net income or (loss)...................................................... $(947) $(467) $(115) $(40) $(360) (62.0) (50.7) (75.3) (65.4) 802.7COGS/sales (fn1)................................................................ 141.3 132.9 100.5 90.8 100.9 (40.5) (8.4) (32.5) (9.7) 10.1Operating income or (loss)/sales (fn1).................................. (62.1) (49.7) (13.9) (2.2) (44.4) 17.7 12.4 35.8 11.7 (42.2)Net income or (loss)/sales (fn1)............................................ (90.7) (52.9) (13.0) (4.4) (46.4) 44.3 37.8 39.9 8.5 (42.0)
Notes:
Note.--Share and ratios shown as "0.0" represent values greater than zero but less than "0.05" percent.
fn1.--Reported data are in percent and period changes are in percentage points.fn2.--Undefined. fn3.--U.S. producers’ data in this table includes modules assembled from U.S.-origin cells and from foreign-origin cells.
Source: Compiled from data submitted in response to Commission questionnaires.
C-12
(Quantity=kW; Value=1,000 dollars; Unit values, unit labor costs, and unit expenses=dollars per kilowatt; Period changes=percent--exceptions noted)
Reported data Period changesCalendar year Between calendar years

Table C-4CSPV products: Apparent consumption and market shares for by channel for modules, 2012-16
2012 2013 2014 2015 2016 2012-16 2012-13 2013-14 2014-15 2015-16U.S. consumption quantity: Utilities channel:
Amount......................................................................................... *** *** *** *** *** *** *** *** *** ***Producers' share (fn1) (fn3)......................................................... *** *** *** *** *** *** *** *** *** ***Importers' share (fn1):
Canada...................................................................................... *** *** *** *** *** *** *** *** *** ***China......................................................................................... *** *** *** *** *** *** *** *** *** ***Germany.................................................................................... *** *** *** *** *** *** *** *** *** ***Indonesia................................................................................... *** *** *** *** *** *** *** *** *** ***Japan......................................................................................... *** *** *** *** *** *** *** *** *** ***Korea......................................................................................... *** *** *** *** *** *** *** *** *** ***Malaysia..................................................................................... *** *** *** *** *** *** *** *** *** ***Mexico........................................................................................ *** *** *** *** *** *** *** *** *** ***Philippines................................................................................. *** *** *** *** *** *** *** *** *** ***Singapore................................................................................... *** *** *** *** *** *** *** *** *** ***Taiwan....................................................................................... *** *** *** *** *** *** *** *** *** ***Thailand..................................................................................... *** *** *** *** *** *** *** *** *** ***Vietnam...................................................................................... *** *** *** *** *** *** *** *** *** ***All other sources........................................................................ *** *** *** *** *** *** *** *** *** ***
All import sources................................................................... *** *** *** *** *** *** *** *** *** ***
Quantity: Utilities channel:U.S. producers' commercial U.S. shipments (fn3)...................... *** *** *** *** *** *** *** *** *** ***U.S. importer' commercial U.S. shipments of imports from:
Canada...................................................................................... *** *** *** *** *** *** *** *** *** ***China......................................................................................... *** *** *** *** *** *** *** *** *** ***Germany.................................................................................... *** *** *** *** *** *** *** *** *** ***Indonesia................................................................................... *** *** *** *** *** *** *** *** *** ***Japan......................................................................................... *** *** *** *** *** *** *** *** *** ***Korea......................................................................................... *** *** *** *** *** *** *** *** *** ***Malaysia..................................................................................... *** *** *** *** *** *** *** *** *** ***Mexico........................................................................................ *** *** *** *** *** *** *** *** *** ***Philippines................................................................................. *** *** *** *** *** *** *** *** *** ***Singapore................................................................................... *** *** *** *** *** *** *** *** *** ***Taiwan....................................................................................... *** *** *** *** *** *** *** *** *** ***Thailand..................................................................................... *** *** *** *** *** *** *** *** *** ***Vietnam...................................................................................... *** *** *** *** *** *** *** *** *** ***All other sources........................................................................ *** *** *** *** *** *** *** *** *** ***
All import sources................................................................... *** *** *** *** *** *** *** *** *** ***
U.S. consumption quantity: Residential and commercial installation channels:Amount......................................................................................... *** *** *** *** *** *** *** *** *** ***Producers' share (fn1) (fn3)......................................................... *** *** *** *** *** *** *** *** *** ***Importers' share (fn1):
Canada...................................................................................... *** *** *** *** *** *** *** *** *** ***China......................................................................................... *** *** *** *** *** *** *** *** *** ***Germany.................................................................................... *** *** *** *** *** *** *** *** *** ***Indonesia................................................................................... *** *** *** *** *** *** *** *** *** ***Japan......................................................................................... *** *** *** *** *** *** *** *** *** ***Korea......................................................................................... *** *** *** *** *** *** *** *** *** ***Malaysia..................................................................................... *** *** *** *** *** *** *** *** *** ***Mexico........................................................................................ *** *** *** *** *** *** *** *** *** ***Philippines................................................................................. *** *** *** *** *** *** *** *** *** ***Singapore................................................................................... *** *** *** *** *** *** *** *** *** ***Taiwan....................................................................................... *** *** *** *** *** *** *** *** *** ***Thailand..................................................................................... *** *** *** *** *** *** *** *** *** ***Vietnam...................................................................................... *** *** *** *** *** *** *** *** *** ***All other sources........................................................................ *** *** *** *** *** *** *** *** *** ***
All import sources................................................................... *** *** *** *** *** *** *** *** *** ***
Quantity: Residential and commercial installation channels:U.S. producers' commercial U.S. shipments (fn3)...................... *** *** *** *** *** *** *** *** *** ***U.S. importer' commercial U.S. shipments of imports from:
Canada...................................................................................... *** *** *** *** *** *** *** *** *** ***China......................................................................................... *** *** *** *** *** *** *** *** *** ***Germany.................................................................................... *** *** *** *** *** *** *** *** *** ***Indonesia................................................................................... *** *** *** *** *** *** *** *** *** ***Japan......................................................................................... *** *** *** *** *** *** *** *** *** ***Korea......................................................................................... *** *** *** *** *** *** *** *** *** ***Malaysia..................................................................................... *** *** *** *** *** *** *** *** *** ***Mexico........................................................................................ *** *** *** *** *** *** *** *** *** ***Philippines................................................................................. *** *** *** *** *** *** *** *** *** ***Singapore................................................................................... *** *** *** *** *** *** *** *** *** ***Taiwan....................................................................................... *** *** *** *** *** *** *** *** *** ***Thailand..................................................................................... *** *** *** *** *** *** *** *** *** ***Vietnam...................................................................................... *** *** *** *** *** *** *** *** *** ***All other sources........................................................................ *** *** *** *** *** *** *** *** *** ***
All import sources................................................................... *** *** *** *** *** *** *** *** *** ***
Notes:
Note.--Share and ratios shown as "0.0" represent values greater than zero but less than "0.05" percent.
fn1.--Reported data are in percent and period changes are in percentage points.fn2.--Undefined. fn3.--U.S. producers' data relate to modules made from U.S.-origin cells.
Source: Compiled from data submitted in response to Commission questionnaires.
Calendar year Between calendar years
C-13
(Quantity=kW; Period changes=percent--exceptions noted)
Reported data Period changes
CSPV modules: Utilities vs Residential and Commercial Installation
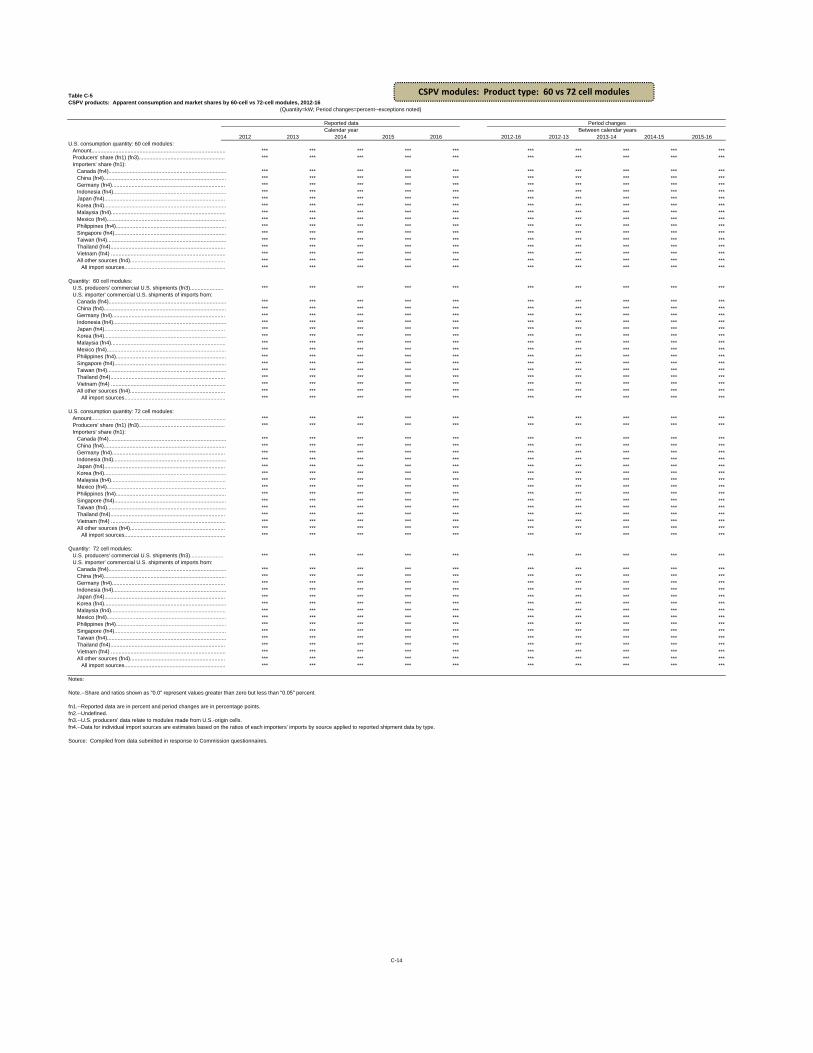
Table C-5CSPV products: Apparent consumption and market shares by 60-cell vs 72-cell modules, 2012-16
2012 2013 2014 2015 2016 2012-16 2012-13 2013-14 2014-15 2015-16U.S. consumption quantity: 60 cell modules:
Amount......................................................................................... *** *** *** *** *** *** *** *** *** ***Producers' share (fn1) (fn3)......................................................... *** *** *** *** *** *** *** *** *** ***Importers' share (fn1):
Canada (fn4).............................................................................. *** *** *** *** *** *** *** *** *** ***China (fn4)................................................................................. *** *** *** *** *** *** *** *** *** ***Germany (fn4)........................................................................... *** *** *** *** *** *** *** *** *** ***Indonesia (fn4)........................................................................... *** *** *** *** *** *** *** *** *** ***Japan (fn4)................................................................................ *** *** *** *** *** *** *** *** *** ***Korea (fn4)................................................................................. *** *** *** *** *** *** *** *** *** ***Malaysia (fn4)............................................................................ *** *** *** *** *** *** *** *** *** ***Mexico (fn4)............................................................................... *** *** *** *** *** *** *** *** *** ***Philippines (fn4)......................................................................... *** *** *** *** *** *** *** *** *** ***Singapore (fn4).......................................................................... *** *** *** *** *** *** *** *** *** ***Taiwan (fn4)............................................................................... *** *** *** *** *** *** *** *** *** ***Thailand (fn4)............................................................................ *** *** *** *** *** *** *** *** *** ***Vietnam (fn4) ............................................................................ *** *** *** *** *** *** *** *** *** ***All other sources (fn4)............................................................... *** *** *** *** *** *** *** *** *** ***
All import sources................................................................... *** *** *** *** *** *** *** *** *** ***
Quantity: 60 cell modules:U.S. producers' commercial U.S. shipments (fn3)...................... *** *** *** *** *** *** *** *** *** ***U.S. importer' commercial U.S. shipments of imports from:
Canada (fn4).............................................................................. *** *** *** *** *** *** *** *** *** ***China (fn4)................................................................................. *** *** *** *** *** *** *** *** *** ***Germany (fn4)........................................................................... *** *** *** *** *** *** *** *** *** ***Indonesia (fn4)........................................................................... *** *** *** *** *** *** *** *** *** ***Japan (fn4)................................................................................ *** *** *** *** *** *** *** *** *** ***Korea (fn4)................................................................................. *** *** *** *** *** *** *** *** *** ***Malaysia (fn4)............................................................................ *** *** *** *** *** *** *** *** *** ***Mexico (fn4)............................................................................... *** *** *** *** *** *** *** *** *** ***Philippines (fn4)......................................................................... *** *** *** *** *** *** *** *** *** ***Singapore (fn4).......................................................................... *** *** *** *** *** *** *** *** *** ***Taiwan (fn4)............................................................................... *** *** *** *** *** *** *** *** *** ***Thailand (fn4)............................................................................ *** *** *** *** *** *** *** *** *** ***Vietnam (fn4) ............................................................................ *** *** *** *** *** *** *** *** *** ***All other sources (fn4)............................................................... *** *** *** *** *** *** *** *** *** ***
All import sources................................................................... *** *** *** *** *** *** *** *** *** ***
U.S. consumption quantity: 72 cell modules:Amount......................................................................................... *** *** *** *** *** *** *** *** *** ***Producers' share (fn1) (fn3)......................................................... *** *** *** *** *** *** *** *** *** ***Importers' share (fn1):
Canada (fn4).............................................................................. *** *** *** *** *** *** *** *** *** ***China (fn4)................................................................................. *** *** *** *** *** *** *** *** *** ***Germany (fn4)........................................................................... *** *** *** *** *** *** *** *** *** ***Indonesia (fn4)........................................................................... *** *** *** *** *** *** *** *** *** ***Japan (fn4)................................................................................ *** *** *** *** *** *** *** *** *** ***Korea (fn4)................................................................................. *** *** *** *** *** *** *** *** *** ***Malaysia (fn4)............................................................................ *** *** *** *** *** *** *** *** *** ***Mexico (fn4)............................................................................... *** *** *** *** *** *** *** *** *** ***Philippines (fn4)......................................................................... *** *** *** *** *** *** *** *** *** ***Singapore (fn4).......................................................................... *** *** *** *** *** *** *** *** *** ***Taiwan (fn4)............................................................................... *** *** *** *** *** *** *** *** *** ***Thailand (fn4)............................................................................ *** *** *** *** *** *** *** *** *** ***Vietnam (fn4) ............................................................................ *** *** *** *** *** *** *** *** *** ***All other sources (fn4)............................................................... *** *** *** *** *** *** *** *** *** ***
All import sources................................................................... *** *** *** *** *** *** *** *** *** ***
Quantity: 72 cell modules:U.S. producers' commercial U.S. shipments (fn3)...................... *** *** *** *** *** *** *** *** *** ***U.S. importer' commercial U.S. shipments of imports from:
Canada (fn4).............................................................................. *** *** *** *** *** *** *** *** *** ***China (fn4)................................................................................. *** *** *** *** *** *** *** *** *** ***Germany (fn4)........................................................................... *** *** *** *** *** *** *** *** *** ***Indonesia (fn4)........................................................................... *** *** *** *** *** *** *** *** *** ***Japan (fn4)................................................................................ *** *** *** *** *** *** *** *** *** ***Korea (fn4)................................................................................. *** *** *** *** *** *** *** *** *** ***Malaysia (fn4)............................................................................ *** *** *** *** *** *** *** *** *** ***Mexico (fn4)............................................................................... *** *** *** *** *** *** *** *** *** ***Philippines (fn4)......................................................................... *** *** *** *** *** *** *** *** *** ***Singapore (fn4).......................................................................... *** *** *** *** *** *** *** *** *** ***Taiwan (fn4)............................................................................... *** *** *** *** *** *** *** *** *** ***Thailand (fn4)............................................................................ *** *** *** *** *** *** *** *** *** ***Vietnam (fn4) ............................................................................ *** *** *** *** *** *** *** *** *** ***All other sources (fn4)............................................................... *** *** *** *** *** *** *** *** *** ***
All import sources................................................................... *** *** *** *** *** *** *** *** *** ***
Notes:
Note.--Share and ratios shown as "0.0" represent values greater than zero but less than "0.05" percent.
fn1.--Reported data are in percent and period changes are in percentage points.fn2.--Undefined. fn3.--U.S. producers' data relate to modules made from U.S.-origin cells.fn4.--Data for individual import sources are estimates based on the ratios of each importers' imports by source applied to reported shipment data by type.
Source: Compiled from data submitted in response to Commission questionnaires.
(Quantity=kW; Period changes=percent--exceptions noted)
C-14
Calendar year Between calendar yearsReported data Period changes
CSPV modules: Product type: 60 vs 72 cell modules

Table C-6CSPV products: Apparent consumption and market shares by mono- vs multi-crystaline cell modules 2012-16
2012 2013 2014 2015 2016 2012-16 2012-13 2013-14 2014-15 2015-16U.S. consumption quantity: Modules with monocrystalline cells:
Amount......................................................................................... *** *** *** *** *** *** *** *** *** ***Producers' share (fn1) (fn3)......................................................... *** *** *** *** *** *** *** *** *** ***Importers' share (fn1):
Canada (fn4).............................................................................. *** *** *** *** *** *** *** *** *** ***China (fn4)................................................................................. *** *** *** *** *** *** *** *** *** ***Germany (fn4)........................................................................... *** *** *** *** *** *** *** *** *** ***Indonesia (fn4)........................................................................... *** *** *** *** *** *** *** *** *** ***Japan (fn4)................................................................................ *** *** *** *** *** *** *** *** *** ***Korea (fn4)................................................................................. *** *** *** *** *** *** *** *** *** ***Malaysia (fn4)............................................................................ *** *** *** *** *** *** *** *** *** ***Mexico (fn4)............................................................................... *** *** *** *** *** *** *** *** *** ***Philippines (fn4)......................................................................... *** *** *** *** *** *** *** *** *** ***Singapore (fn4).......................................................................... *** *** *** *** *** *** *** *** *** ***Taiwan (fn4)............................................................................... *** *** *** *** *** *** *** *** *** ***Thailand (fn4)............................................................................ *** *** *** *** *** *** *** *** *** ***Vietnam (fn4) ............................................................................ *** *** *** *** *** *** *** *** *** ***All other sources (fn4)............................................................... *** *** *** *** *** *** *** *** *** ***
All import sources................................................................... *** *** *** *** *** *** *** *** *** ***
Quantity: Modules with monocrystalline cells:U.S. producers' commercial U.S. shipments (fn3)...................... *** *** *** *** *** *** *** *** *** ***U.S. importer' commercial U.S. shipments of imports from:
Canada (fn4).............................................................................. *** *** *** *** *** *** *** *** *** ***China (fn4)................................................................................. *** *** *** *** *** *** *** *** *** ***Germany (fn4)........................................................................... *** *** *** *** *** *** *** *** *** ***Indonesia (fn4)........................................................................... *** *** *** *** *** *** *** *** *** ***Japan (fn4)................................................................................ *** *** *** *** *** *** *** *** *** ***Korea (fn4)................................................................................. *** *** *** *** *** *** *** *** *** ***Malaysia (fn4)............................................................................ *** *** *** *** *** *** *** *** *** ***Mexico (fn4)............................................................................... *** *** *** *** *** *** *** *** *** ***Philippines (fn4)......................................................................... *** *** *** *** *** *** *** *** *** ***Singapore (fn4).......................................................................... *** *** *** *** *** *** *** *** *** ***Taiwan (fn4)............................................................................... *** *** *** *** *** *** *** *** *** ***Thailand (fn4)............................................................................ *** *** *** *** *** *** *** *** *** ***Vietnam (fn4) ............................................................................ *** *** *** *** *** *** *** *** *** ***All other sources (fn4)............................................................... *** *** *** *** *** *** *** *** *** ***
All import sources................................................................... *** *** *** *** *** *** *** *** *** ***
U.S. consumption quantity: Modules with multicrystalline cells:Amount......................................................................................... *** *** *** *** *** *** *** *** *** ***Producers' share (fn1) (fn3)......................................................... *** *** *** *** *** *** *** *** *** ***Importers' share (fn1):
Canada (fn4).............................................................................. *** *** *** *** *** *** *** *** *** ***China (fn4)................................................................................. *** *** *** *** *** *** *** *** *** ***Germany (fn4)........................................................................... *** *** *** *** *** *** *** *** *** ***Indonesia (fn4)........................................................................... *** *** *** *** *** *** *** *** *** ***Japan (fn4)................................................................................ *** *** *** *** *** *** *** *** *** ***Korea (fn4)................................................................................. *** *** *** *** *** *** *** *** *** ***Malaysia (fn4)............................................................................ *** *** *** *** *** *** *** *** *** ***Mexico (fn4)............................................................................... *** *** *** *** *** *** *** *** *** ***Philippines (fn4)......................................................................... *** *** *** *** *** *** *** *** *** ***Singapore (fn4).......................................................................... *** *** *** *** *** *** *** *** *** ***Taiwan (fn4)............................................................................... *** *** *** *** *** *** *** *** *** ***Thailand (fn4)............................................................................ *** *** *** *** *** *** *** *** *** ***Vietnam (fn4) ............................................................................ *** *** *** *** *** *** *** *** *** ***All other sources (fn4)............................................................... *** *** *** *** *** *** *** *** *** ***
All import sources................................................................... *** *** *** *** *** *** *** *** *** ***
Quantity: Modules with multicrystalline cells:U.S. producers' commercial U.S. shipments (fn3)...................... *** *** *** *** *** *** *** *** *** ***U.S. importer' commercial U.S. shipments of imports from:
Canada (fn4).............................................................................. *** *** *** *** *** *** *** *** *** ***China (fn4)................................................................................. *** *** *** *** *** *** *** *** *** ***Germany (fn4)........................................................................... *** *** *** *** *** *** *** *** *** ***Indonesia (fn4)........................................................................... *** *** *** *** *** *** *** *** *** ***Japan (fn4)................................................................................ *** *** *** *** *** *** *** *** *** ***Korea (fn4)................................................................................. *** *** *** *** *** *** *** *** *** ***Malaysia (fn4)............................................................................ *** *** *** *** *** *** *** *** *** ***Mexico (fn4)............................................................................... *** *** *** *** *** *** *** *** *** ***Philippines (fn4)......................................................................... *** *** *** *** *** *** *** *** *** ***Singapore (fn4).......................................................................... *** *** *** *** *** *** *** *** *** ***Taiwan (fn4)............................................................................... *** *** *** *** *** *** *** *** *** ***Thailand (fn4)............................................................................ *** *** *** *** *** *** *** *** *** ***Vietnam (fn4) ............................................................................ *** *** *** *** *** *** *** *** *** ***All other sources (fn4)............................................................... *** *** *** *** *** *** *** *** *** ***
All import sources................................................................... *** *** *** *** *** *** *** *** *** ***
Notes:
Note.--Share and ratios shown as "0.0" represent values greater than zero but less than "0.05" percent.
fn1.--Reported data are in percent and period changes are in percentage points.fn2.--Undefined. fn3.--U.S. producers' data relate to modules made from U.S.-origin cells.fn4.--Data for individual import sources are estimates based on the ratios of each importers' imports by source applied to reported shipment data by type.
Source: Compiled from data submitted in response to Commission questionnaires.
C-15
(Quantity=kW; Period changes=percent--exceptions noted)
Reported data Period changesCalendar year Between calendar years
CSPV modules: Product type: Mono vs multi

C‐16
Table C‐7 CPSV products: U.S. imports, 2012‐16
Source Calendar year
2012 2013 2014 2015 2016 Value (1,000 dollars)
Argentina 54 27 ‐‐‐ ‐‐‐ ‐‐‐
Australia 1,671 426 613 407 150
Austria 744 402 ‐‐‐ ‐‐‐ 44
Bangladesh ‐‐‐ ‐‐‐ ‐‐‐ ‐‐‐ 39
Belgium 1,039 84 48 57 17
Belize ‐‐‐ ‐‐‐ ‐‐‐ 25 ‐‐‐
Br Virgin Is ‐‐‐ ‐‐‐ ‐‐‐ ‐‐‐ 32
Cambodia ‐‐‐ ‐‐‐ 658 ‐‐‐ ‐‐‐
Canada 47,680 5,456 18,885 77,151 88,741
Chile ‐‐‐ 5 ‐‐‐ ‐‐‐ ‐‐‐
China 1,717,276 1,171,672 1,634,023 1,733,170 1,531,218
Colombia ‐‐‐ ‐‐‐ ‐‐‐ ‐‐‐ 3
Costa Rica ‐‐‐ 123 ‐‐‐ ‐‐‐ ‐‐‐
Cyprus ‐‐‐ ‐‐‐ ‐‐‐ 239 ‐‐‐
Czech Republic 10,234 2,901 408 ‐‐‐ ‐‐‐
Denmark ‐‐‐ 133 24 3 21
Dominican Rep ‐‐‐ ‐‐‐ ‐‐‐ 10 ‐‐‐
Estonia ‐‐‐ ‐‐‐ ‐‐‐ 7 ‐‐‐
Finland 10 11 ‐‐‐ 132 ‐‐‐
France 88 249 160 855 15,578
Germany 201,046 38,842 123,447 409,272 163,827
Greece ‐‐‐ 52 ‐‐‐ ‐‐‐ ‐‐‐
Honduras ‐‐‐ ‐‐‐ ‐‐‐ ‐‐‐ 21
Hong Kong 2,942 7,287 2,365 140 1,930
Hungary 2 ‐‐‐ ‐‐‐ 46 27
India 11,608 832 35,079 13,349 6,741
Indonesia ‐‐‐ ‐‐‐ ‐‐‐ 846 1,810
Ireland ‐‐‐ ‐‐‐ 10 21 ‐‐‐
Israel 100 21 35 49 17
Italy 110 231 731 982 1,797
Jamaica 4 ‐‐‐ ‐‐‐ ‐‐‐ ‐‐‐
Japan 172,700 22,569 52,337 115,484 113,732
Jordan ‐‐‐ 7 ‐‐‐ ‐‐‐ ‐‐‐
Korea 141,549 36,487 110,817 404,272 1,331,309
Latvia ‐‐‐ ‐‐‐ ‐‐‐ ‐‐‐ 5
Lithuania 112 239 127 38 69
Macao 6 ‐‐‐ ‐‐‐ ‐‐‐ ‐‐‐
Malaysia 1,512,045 1,251,732 896,650 1,315,635 2,530,531
Mauritius ‐‐‐ ‐‐‐ ‐‐‐ ‐‐‐ 2,087
Table continued next page.

C‐17
Table C‐7‐‐Continued CPSV products: U.S. imports, 2012‐16
Source Calendar year
2012 2013 2014 2015 2016 Value (1,000 dollars)
Mexico 482,440 439,440 506,212 911,979 854,638
Netherlands 294 22 ‐‐‐ 512 2,033
New Zealand 53 ‐‐‐ 5 9 ‐‐‐
Norway 5 39 71 77 ‐‐‐
Pakistan ‐‐‐ ‐‐‐ ‐‐‐ 55 ‐‐‐
Peru ‐‐‐ ‐‐‐ ‐‐‐ ‐‐‐ 36
Philippines 394,421 98,319 67,770 85,418 125,307
Poland 40 17 22 12 6,213
Portugal 65 ‐‐‐ 232 451 3,997
Qatar ‐‐‐ ‐‐‐ 3 ‐‐‐ ‐‐‐
Romania ‐‐‐ ‐‐‐ 8 ‐‐‐ 14
Saudi Arabia 6 ‐‐‐ ‐‐‐ ‐‐‐ ‐‐‐
Serbia ‐‐‐ ‐‐‐ 10 ‐‐‐ ‐‐‐
Singapore 70,135 48,983 57,592 426,532 360,180
Slovak Republic 3 ‐‐‐ ‐‐‐ 5 6
South Africa ‐‐‐ ‐‐‐ ‐‐‐ ‐‐‐ 5,055
Spain 19,470 20,226 95 544 2,683
Sweden 14 110 196 ‐‐‐ 3
Switzerland 104 11 16 51 ‐‐‐
Taiwan 424,075 573,146 761,855 342,446 269,860
Thailand 12 374 751 40,858 532,257
Turkey 95 108 7,111 24,408 4,622
United Arab Emirates 12 ‐‐‐ 5 172 39
United Kingdom 495 369 1,002 690 387
Vietnam 940 158 7,408 176,289 529,803
Total U.S. imports 5,213,699 3,721,106 4,286,778 6,082,698 8,486,876

C‐18
Table C‐7‐‐Continued CPSV products: U.S. imports, 2012‐16
Source Calendar year
2012 2013 2014 2015 2016 Share of value (percent)
Argentina 0.0 0.0 ‐‐‐ ‐‐‐ ‐‐‐
Australia 0.0 0.0 0.0 0.0 0.0
Austria 0.0 0.0 ‐‐‐ ‐‐‐ 0.0
Bangladesh ‐‐‐ ‐‐‐ ‐‐‐ ‐‐‐ 0.0
Belgium 0.0 0.0 0.0 0.0 0.0
Belize ‐‐‐ ‐‐‐ ‐‐‐ 0.0 ‐‐‐
Br Virgin Is ‐‐‐ ‐‐‐ ‐‐‐ ‐‐‐ 0.0
Cambodia ‐‐‐ ‐‐‐ 0.0 ‐‐‐ ‐‐‐
Canada 0.9 0.1 0.4 1.3 1.0
Chile ‐‐‐ 0.0 ‐‐‐ ‐‐‐ ‐‐‐
China 32.9 31.5 38.1 28.5 18.0
Colombia ‐‐‐ ‐‐‐ ‐‐‐ ‐‐‐ 0.0
Costa Rica ‐‐‐ 0.0 ‐‐‐ ‐‐‐ ‐‐‐
Cyprus ‐‐‐ ‐‐‐ ‐‐‐ 0.0 ‐‐‐
Czech Republic 0.2 0.1 0.0 ‐‐‐ ‐‐‐
Denmark ‐‐‐ 0.0 0.0 0.0 0.0
Dominican Rep ‐‐‐ ‐‐‐ ‐‐‐ 0.0 ‐‐‐
Estonia ‐‐‐ ‐‐‐ ‐‐‐ 0.0 ‐‐‐
Finland 0.0 0.0 ‐‐‐ 0.0 ‐‐‐
France 0.0 0.0 0.0 0.0 0.2
Germany 3.9 1.0 2.9 6.7 1.9
Greece ‐‐‐ 0.0 ‐‐‐ ‐‐‐ ‐‐‐
Honduras ‐‐‐ ‐‐‐ ‐‐‐ ‐‐‐ 0.0
Hong Kong 0.1 0.2 0.1 0.0 0.0
Hungary 0.0 ‐‐‐ ‐‐‐ 0.0 0.0
India 0.2 0.0 0.8 0.2 0.1
Indonesia ‐‐‐ ‐‐‐ ‐‐‐ 0.0 0.0
Ireland ‐‐‐ ‐‐‐ 0.0 0.0 ‐‐‐
Israel 0.0 0.0 0.0 0.0 0.0
Italy 0.0 0.0 0.0 0.0 0.0
Jamaica 0.0 ‐‐‐ ‐‐‐ ‐‐‐ ‐‐‐
Japan 3.3 0.6 1.2 1.9 1.3
Jordan ‐‐‐ 0.0 ‐‐‐ ‐‐‐ ‐‐‐
Korea 2.7 1.0 2.6 6.6 15.7
Latvia ‐‐‐ ‐‐‐ ‐‐‐ ‐‐‐ 0.0
Lithuania 0.0 0.0 0.0 0.0 0.0
Macao 0.0 ‐‐‐ ‐‐‐ ‐‐‐ ‐‐‐
Malaysia 29.0 33.6 20.9 21.6 29.8
Mauritius ‐‐‐ ‐‐‐ ‐‐‐ ‐‐‐ 0.0
Table continued next page.

C‐19
Table C‐7‐‐Continued CPSV products: U.S. imports, 2012‐16
Source Calendar year
2012 2013 2014 2015 2016 Share of value (percent)
Mexico 9.3 11.8 11.8 15.0 10.1
Netherlands 0.0 0.0 ‐‐‐ 0.0 0.0
New Zealand 0.0 ‐‐‐ 0.0 0.0 ‐‐‐
Norway 0.0 0.0 0.0 0.0 ‐‐‐
Pakistan ‐‐‐ ‐‐‐ ‐‐‐ 0.0 ‐‐‐
Peru ‐‐‐ ‐‐‐ ‐‐‐ ‐‐‐ 0.0
Philippines 7.6 2.6 1.6 1.4 1.5
Poland 0.0 0.0 0.0 0.0 0.1
Portugal 0.0 ‐‐‐ 0.0 0.0 0.0
Qatar ‐‐‐ ‐‐‐ 0.0 ‐‐‐ ‐‐‐
Romania ‐‐‐ ‐‐‐ 0.0 ‐‐‐ 0.0
Saudi Arabia 0.0 ‐‐‐ ‐‐‐ ‐‐‐ ‐‐‐
Serbia ‐‐‐ ‐‐‐ 0.0 ‐‐‐ ‐‐‐
Singapore 1.3 1.3 1.3 7.0 4.2
Slovak Republic 0.0 ‐‐‐ ‐‐‐ 0.0 0.0
South Africa ‐‐‐ ‐‐‐ ‐‐‐ ‐‐‐ 0.1
Spain 0.4 0.5 0.0 0.0 0.0
Sweden 0.0 0.0 0.0 ‐‐‐ 0.0
Switzerland 0.0 0.0 0.0 0.0 ‐‐‐
Taiwan 8.1 15.4 17.8 5.6 3.2
Thailand 0.0 0.0 0.0 0.7 6.3
Turkey 0.0 0.0 0.2 0.4 0.1
United Arab Emirates 0.0 ‐‐‐ 0.0 0.0 0.0
United Kingdom 0.0 0.0 0.0 0.0 0.0
Vietnam 0.0 0.0 0.2 2.9 6.2
Total U.S. imports 100.0 100.0 100.0 100.0 100.0
Note.—Shares and ratios shown as "0.0" represent values greater than zero, but less than "0.05" percent. Source: Official U.S. imports statistics using HTS statistical reporting numbers 8541.40.6020 and 8541.40.6030, accessed August 21, 2017.


D‐1
APPENDIX D
COMPETITIVE EFFORTS AND PROPOSED ADJUSTMENTS
D‐2
Table D‐1 CSPV products: U.S. producers’ efforts to compete more effectively in the U.S. market, by reporting firm, January 2012 ‐ present ........................................................................................ D‐4 Table D‐2 CSPV products: U.S. producers’ anticipated adjustments under safeguard import relief .......... D‐9

D‐3
U.S. producers were asked whether their firm has undertaken or planned any efforts to
compete more effectively in the U.S. market for CSPV cells (whether or not partially or fully
assembled into other products) (“CSPV products”) since 2012. The following five U.S. producers
that together represented *** percent of reported U.S. CSPV module production during
January 2012‐December 2016 responded that they had not made any efforts to compete more
effectively since 2012: ***. None of these firms manufactured CSPV cells in the United States
during the period of investigation. The following eight U.S. producers that together represented
*** percent of reported U.S. CSPV cell production and *** percent of reported U.S. CSPV
module production during January 2012‐December 2016 responded that they had made efforts
to compete more effectively since 2012: ***. The aggregate reported expenditures involved in
these U.S. producers’ efforts to compete was $***. U.S. producers were further instructed to
provide a description of (1) the efforts made since 2012 to compete more effectively, (2) the
year in which the effort was made, (3) the expenditure involved, and (4) the specific
competitive advantage sought or acquired. The responses of the U.S. producers to this request
are presented in table D‐1.

D‐4
Table D-1 CSPV products: U.S. producers’ efforts to compete more effectively in the U.S. market, by reporting firm, January 2012 – June 2017 * * * * * * *

D‐5
Table D-1—Continued CSPV products: U.S. producers’ efforts to compete more effectively in the U.S. market, by reporting firm, January 2012 – present * * * * * * *

D‐6
Table D-1—Continued CSPV products: U.S. producers’ efforts to compete more effectively in the U.S. market, by reporting firm, January 2012 - present * * * * * * *

D‐7
Table D-1—Continued CSPV products: U.S. producers’ efforts to compete more effectively in the U.S. market, by reporting firm, January 2012 - present * * * * * * *

D‐8
U.S. producers were asked if they were to receive import relief as a result of this
safeguard investigation, would the firm and/or its workers make adjustments in its operations
producing CSPV products that would permit it to compete more effectively with imports of
CSPV products. The following six U.S. producers that together represented *** percent of
reported U.S. CSPV cell production and *** percent of reported U.S. CSPV module production
during January 2012‐December 2016 responded that they would not make any adjustments in
their operations if they were to receive import relief: ***. The following seven U.S. producers
that together represented *** percent of reported U.S. CSPV cell production and *** percent
of reported U.S. CSPV module production during January 2012‐December 2016 responded that
if they were to receive import relief, they would make adjustments in their operations: ***. The
aggregate reported anticipated expenditures involved were $***. U.S. producers were also
instructed to describe (1) the specific adjustment actions that they would make during any
period of relief that would permit them to compete more effectively with imports, (2) the
anticipated expenditure involved, and (3) the specific competitive advantage expected to be
gained by the adjustment. The firms were asked to include adjustment actions that were in
addition to those that they would incur notwithstanding any relief under section 202 and which
was described in the previous table above. The responses of the U.S. producers to this request
are presented in table D‐2.

D‐9
Table D-2 CSPV products: U.S. producers’ anticipated adjustments under safeguard import relief * * * * * * *

D‐10
Table D-2—Continued CSPV products: U.S. producers’ anticipated adjustments under safeguard import relief * * * * * * *

D‐11
Table D-2—Continued CSPV products: U.S. producers’ anticipated adjustments under safeguard import relief * * * * * * *

D‐12

APPENDIX E
Effects of imports on U.S. producers and related information by firm

E‐2
Table E-1 CSPV products: Narrative relating to actual and anticipated negative effects of imports on investment and growth and development, since January 1, 2012
* * * * * *
Table continued on next page.

E‐3
Table E-1--Continued CSPV products: Narrative relating to actual and anticipated negative effects of imports on investment and growth and development, since January 1, 2012
* * * * * *
Table continued on next page.

E‐4
Table E-1--Continued CSPV products: Narrative relating to actual and anticipated negative effects of imports on investment and growth and development, since January 1, 2012
* * * * * *
Table continued on next page.

E‐5
Table E-1--Continued CSPV products: Narrative relating to actual and anticipated negative effects of imports on investment and growth and development, since January 1, 2012
* * * * * *
Table continued on next page.

E‐6
Table E-1--Continued CSPV products: Narrative relating to actual and anticipated negative effects of imports on investment and growth and development, since January 1, 2012
* * * * * *
Table continued on next page.

E‐7
Table E-1--Continued CSPV products: Narrative relating to actual and anticipated negative effects of imports on investment and growth and development, since January 1, 2012
* * * * * *
Table continued on next page.

E‐8
Table E-1--Continued CSPV products: Narrative relating to actual and anticipated negative effects of imports on investment and growth and development, since January 1, 2012
* * * * * *

E‐9
Table E-2 CSPV products: U.S. producers’ financial results on cells (commercial sales and transfers) by firm, 2012-16
* * * * * * Table continued on next page.
E‐10
Table E-2--Continued CSPV products: U.S. producers’ financial results on cells (commercial sales and transfers) by firm, 2012-16
* * * * * *

E‐11
Table E-3 CSPV products: U.S. producers’ financial results on modules by firm, 2012-16
* * * * * *
Table continued on next page.

E‐12
Table E-3--Continued CSPV products: U.S. producers’ financial results on modules by firm, 2012-16
* * * * * * Table continued on next page.

E‐13
Table E-3--Continued CSPV products: U.S. producers’ financial results on modules by firm, 2012-16
* * * * * * Table continued on next page.

E‐14
Table E-3--Continued CSPV products: U.S. producers’ financial results on modules by firm, 2012-16
* * * * * * Table continued on next page.

E‐15
Table E-3--Continued CSPV products: U.S. producers’ financial results on modules by firm, 2012-16
* * * * * *

E‐16
Table E-4 CSPV products: U.S. producers’ capital expenditures, research and development (R&D) expenses, and investment in productive assets related to cells and modules by firm, 2012-16
* * * * * * Table continued on next page.

E‐17
Table E-4--Continued CSPV products: U.S. producers’ capital expenditures, research and development (R&D) expenses, and investment in productive assets related to cells and modules by firm, 2012-16
* * * * * *


F‐1
APPENDIX F
COMMENTS ON THE EFFECTS OF U.S. ORDERS ON CRYSTALLINE SILICON PHOTOVOLTAIC PRODUCTS
F‐2
Table F‐1 CSPV products: U.S. producers’ injury from imports ................................................................... F‐3 Table F‐2 CSPV products: Ranking of the importance of factors causing injury as reported by U.S. producers, by factor ..................................................................................................................... F‐5 Table F‐3 CSPV products: U.S. producers’ descriptions of factors that have adverse impact on firm ....... F‐6 Table F‐4 CSPV products: U.S. producers’ descriptions of significance of existing U.S. antidumping and countervailing duty orders on imports of CSPV products from China and Taiwan ............ F‐11 Table F‐5 CSPV products: Effect of AD/CVD order on U.S. importers’ imports of CSPV cells and modules, by number of responding firms ................................................................................. F‐12 Table F‐6 CSPV products: U.S. importers’ explanations on the effect of AD/CVD orders on their purchases ................................................................................................................................... F‐13 Table F‐7 CSPV products: U.S. importers’ descriptions of significance of existing U.S. antidumping and countervailing duty orders on imports of CSPV products from China and Taiwan ............ F‐17 Table F‐8 CSPV products: Effect of AD/CVD order on U.S. purchasers’ purchases of CSPV cells and modules, by number of responding firms ................................................................................. F‐22 Table F‐9 CSPV products: U.S. purchasers’ explanations on the effect of AD/CVD orders on their purchases ................................................................................................................................... F‐23 Table F‐10 CSPV products: Foreign producers’ descriptions of significance of existing U.S. antidumping and countervailing duty orders on U.S. imports of CSPV products from China and Taiwan .... F‐28

F‐3
Ten of 13 responding U.S. producers that accounted for *** percent of U.S. production
of CSPV cells and *** percent of U.S. production of CSPV modules during the period of
investigation reported that their firm's operations concerning CSPV cells (whether or not
partially or fully assembled into other products) (“CSPV products”) had been injured by imports
of CSPV products since January 1, 2012.1 Explanations of their responses are presented in table
F‐1.
Table F-1 CSPV products: U.S. producers’ injury from imports * * * * * * *
1 The three responding U.S. producers that indicated that their firm's operations concerning CSPV
products had not been injured by imports of CSPV products since January 1, 2012 include [Mission Solar, Sunstream, and Tesla].

F‐4
Table F-1—Continued CSPV products: U.S. producers’ injury from imports * * * * * * *
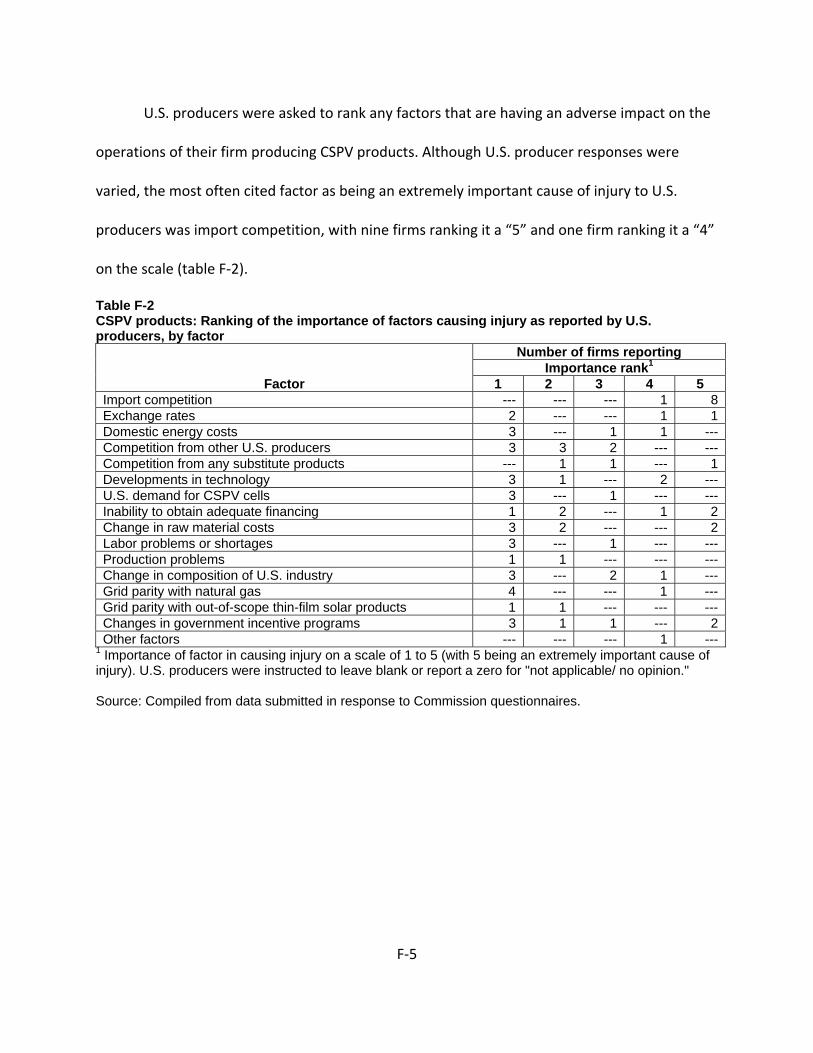
F‐5
U.S. producers were asked to rank any factors that are having an adverse impact on the
operations of their firm producing CSPV products. Although U.S. producer responses were
varied, the most often cited factor as being an extremely important cause of injury to U.S.
producers was import competition, with nine firms ranking it a “5” and one firm ranking it a “4”
on the scale (table F‐2).
Table F-2 CSPV products: Ranking of the importance of factors causing injury as reported by U.S. producers, by factor
Factor
Number of firms reporting Importance rank1
1 2 3 4 5 Import competition --- --- --- 1 8Exchange rates 2 --- --- 1 1Domestic energy costs 3 --- 1 1 ---Competition from other U.S. producers 3 3 2 --- ---Competition from any substitute products --- 1 1 --- 1Developments in technology 3 1 --- 2 ---U.S. demand for CSPV cells 3 --- 1 --- ---Inability to obtain adequate financing 1 2 --- 1 2Change in raw material costs 3 2 --- --- 2Labor problems or shortages 3 --- 1 --- ---Production problems 1 1 --- --- ---Change in composition of U.S. industry 3 --- 2 1 ---Grid parity with natural gas 4 --- --- 1 ---Grid parity with out-of-scope thin-film solar products 1 1 --- --- ---Changes in government incentive programs 3 1 1 --- 2Other factors --- --- --- 1 ---
1 Importance of factor in causing injury on a scale of 1 to 5 (with 5 being an extremely important cause of injury). U.S. producers were instructed to leave blank or report a zero for "not applicable/ no opinion." Source: Compiled from data submitted in response to Commission questionnaires.

F‐6
U.S. producers were also asked to describe the impact of imports of CSPV products on
their U.S. operations producing CSPV products and to identify and describe any factors that are
having an adverse impact on the operation of their firm. They were also asked to describe the
role played by each factor that they identified. The responses of U.S. producers to this request
are presented in table F‐3.
Table F-3 CSPV products: U.S. producers’ descriptions of factors that have adverse impact on firm * * * * * * *

F‐7
Table F-3—Continued CSPV products: U.S. producers’ descriptions of factors that have adverse impact on firm * * * * * * *

F‐8
Table F-3—Continued CSPV products: U.S. producers’ descriptions of factors that have adverse impact on firm * * * * * * *

F‐9
Table F-3—Continued CSPV products: U.S. producers’ descriptions of factors that have adverse impact on firm * * * * * * *

F‐10
Table F-3—Continued CSPV products: U.S. producers’ descriptions of factors that have adverse impact on firm * * * * * * *
U.S. producers were asked to describe the significance, if any, of the existing U.S.
antidumping and countervailing duty orders on imports of CSPV products from China and
Taiwan on their firm’s production, capacity, U.S. shipments, inventories, purchases,
employment, revenues, costs, profits, cash flow, capital expenditures, research and
development expenditures, and asset values. Responses to this request are presented in table
F‐4.

F‐11
Table F-4 CSPV products: U.S. producers’ descriptions of significance of existing U.S. antidumping and countervailing duty orders on imports of CSPV products from China and Taiwan * * * * * * *

F‐12
Thirty‐four of 56 responding importers reported importing CSPV products prior to 2012.
Importers were asked if their patterns of importing CSPV products had changed since the
United States imposed antidumping and countervailing duty orders on imports from China and
Taiwan. Importer responses were varied. Of the most cited responses, 17 importers indicated
that they reduced their imports from China because of the orders, 16 importers indicated that
they began importing from sources other than China and Taiwan, and 12 indicated that they
discontinued imports from China because of the orders (table F‐5). Ten importers indicated that
their pattern of imports remained essentially unchanged.
Table F-5 CSPV products: Effect of AD/CVD order on U.S. importers’ imports of CSPV cells and modules, by number of responding firms1
Item Cells Modules
Total responding
firms No, our pattern of imports is essentially unchanged. 4 6 10
Yes, we discontinued imports from China because of the orders. 3 92 122
Yes, we reduced imports from China because of the orders. 5 12 17Yes, but changes in the pattern of our imports from China are for reasons other than the orders. 0 93 93
Yes, we discontinued imports from Taiwan because of the order. 4 3 7
Yes, we reduced imports from Taiwan because of the order. 4 4 8Yes, but changes in the pattern of our imports from Taiwan are for reasons other than the order. 0 3 3Yes, we began importing from sources other than China and Taiwan. 3 13 16Yes, we increased imports from sources other than China and Taiwan. 3 6 9Yes, but changes in the pattern of our imports from sources other than China and Taiwan are for reasons other than the orders. 1 7 8
1 The sum of responses may not add up to the total number of responding firms as each firm was instructed to check all applicable effects on imports. 2 Three of the reporting firms have a common corporate parent (i.e., ***). 3 Two of the reporting firms have a common corporate parent (i.e., ***). In additional three of the reporting firms have a common corporate parent (i.e., ***). Source: Compiled from data submitted in response to Commission questionnaires.

F‐13
Importers were requested to provide an explanation when identifying an effect on their
pattern of imports. Importers’ responses are provided in table F‐6.
Table F-6 CSPV products: U.S. importers’ explanations on the effect of AD/CVD orders on their imports * * * * * * *

F‐14
Table F-6--Continued CSPV products: U.S. importers’ explanations on the effect of AD/CVD orders on their imports * * * * * * *

F‐15
Table F-6--Continued CSPV products: U.S. importers’ explanations on the effect of AD/CVD orders on their imports * * * * * * *

F‐16
Table F-6--Continued CSPV products: U.S. importers’ explanations on the effect of AD/CVD orders on their imports * * * * * * *
F‐17
Importers were asked to describe the significance, if any, of the existing U.S.
antidumping and countervailing duty orders on imports of CSPV products from China and
Taiwan on their firm’s imports, U.S. shipments of imports, and inventories. Responses to this
request are presented in table F‐7.
Table F-7 CSPV products: U.S. importers’ descriptions of significance of existing U.S. AD/CVD orders on imports of CSPV products from China and Taiwan * * * * * * *

F‐18
Table F-7—Continued CSPV products: U.S. importers’ descriptions of significance of existing U.S. AD/CVD orders on imports of CSPV products from China and Taiwan * * * * * * *

F‐19
Table F-7—Continued CSPV products: U.S. importers’ descriptions of significance of existing U.S. AD/CVD orders on imports of CSPV products from China and Taiwan * * * * * * *

F‐20
Table F-7—Continued CSPV products: U.S. importers’ descriptions of significance of existing U.S. AD/CVD orders on imports of CSPV products from China and Taiwan * * * * * * *

F‐21
Table F-7—Continued CSPV products: U.S. importers’ descriptions of significance of existing U.S. AD/CVD orders on imports of CSPV products from China and Taiwan * * * * * * *

F‐22
Seventy‐eight of 106 responding purchasers reported purchasing CSPV products prior to
2012. Purchasers were asked if their purchase patterns of CSPV products had changed since the
United States imposed antidumping and countervailing duty orders on imports from China and
Taiwan. Purchaser responses were varied. Of the most cited responses, 38 purchasers indicated
that their pattern of purchases remained essentially unchanged, 21 purchasers indicated that
they began purchasing CSPV products from sources other than China and Taiwan, 16
purchasers indicated that they reduced their purchases of CSPV products from China, and 12
indicated that they changed their pattern of purchases of CSPV products from other sources for
reasons other than the orders (table F‐8).
Table F-8 CSPV products: Effect of U.S. AD/CVD order on U.S. purchasers’ purchases of CSPV cells and modules, by number of responding firms1
Item Cells Modules
Total responding
firms
No, pattern of purchasing is essentially unchanged. 4 37 38
Yes, discontinued purchases from China because of the orders. 4 10 12
Yes, reduced purchases from China because of the orders. 1 15 16Yes, but changes in purchases from China are for reasons other than the orders. 0 9 9
Yes, discontinued purchases from Taiwan because of the order. 2 6 7
Yes, reduced purchases from Taiwan because of the order. 1 9 10Yes, but changes in purchases from Taiwan are for reason other than the order. 0 6 6Yes, began purchasing from sources other than China and Taiwan. 3 20 21Yes, increased purchases from sources other than China and Taiwan. 0 9 9Yes, but changes in purchases from sources other than China and Taiwan are for reasons other than the orders. 1 12 12
1 The sum of responses may not add up to the total number of responding firms as each firm was instructed to check all applicable effects on purchases. Source: Compiled from data submitted in response to Commission questionnaires.
Purchasers were requested to provide an explanation when identifying an effect on
their pattern of purchases of CSPV products. Purchasers’ responses are provided in table F‐9.

F‐23
Table F-9 CSPV products: U.S. purchasers’ explanations on the effect of AD/CVD orders on their purchases of CSPV products * * * * * * *

F‐24
Table F-9—Continued CSPV products: U.S. purchasers’ explanations on the effect of AD/CVD orders on their purchases of CSPV products * * * * * * *

F‐25
Table F-9—Continued CSPV products: U.S. purchasers’ explanations on the effect of AD/CVD orders on their purchases of CSPV products * * * * * * *

F‐26
Table F-9—Continued CSPV products: U.S. purchasers’ explanations on the effect of AD/CVD orders on their purchases of CSPV products * * * * * * *

F‐27
Table F-9—Continued CSPV products: U.S. purchasers’ explanations on the effect of AD/CVD orders on their purchases of CSPV products * * * * * * *

F‐28
Foreign producers were asked to describe the significance, if any, of the existing U.S.
antidumping and countervailing duty orders on CSPV products from China and Taiwan on their
firm’s production, capacity, U.S. exports, inventories, purchases, or other indicators. Responses
to this request are presented in table F‐10.
Table F-10 CSPV products: Foreign producers’ descriptions of significance of existing U.S. AD/CVD orders on U.S. imports of CSPV products from China and Taiwan * * * * * * *

F‐29
Table F-10—Continued CSPV products: Foreign producers’ descriptions of significance of existing U.S. AD/CVD orders on U.S. imports of CSPV products from China and Taiwan * * * * * * *

F‐30
Table F-10—Continued CSPV products: Foreign producers’ descriptions of significance of existing U.S. AD/CVD orders on U.S. imports of CSPV products from China and Taiwan * * * * * * *

F‐31
Table F-10—Continued CSPV products: Foreign producers’ descriptions of significance of existing U.S. AD/CVD orders on U.S. imports of CSPV products from China and Taiwan * * * * * * *

F‐32
Table F-10—Continued CSPV products: Foreign producers’ descriptions of significance of existing U.S. AD/CVD orders on U.S. imports of CSPV products from China and Taiwan * * * * * * *

F‐33
Table F-10—Continued CSPV products: Foreign producers’ descriptions of significance of existing U.S. AD/CVD orders on U.S. imports of CSPV products from China and Taiwan * * * * * * *

F‐34
Table F-10—Continued CSPV products: Foreign producers’ descriptions of significance of existing U.S. AD/CVD orders on U.S. imports of CSPV products from China and Taiwan * * * * * * *

G‐1
APPENDIX G
PRICE DATA BY COUNTRY SOURCE


G‐3
Thirty‐one importers reported price data. Twenty importers provided price data for
Taiwan, 13 for China, 11 for Korea, 11 for Malaysia, 9 for German, 9 for Vietnam, 6 for Thailand,
1 for Singapore, and 7 for all other sources (Netherlands, India, Japan, Portugal, and Turkey).1
These price items and accompanying data are comparable to those presented in tables V‐12 to
V‐16. Price and quantity data for individual country sources are shown in tables G‐1 to G‐5.
1 There are antidumping and countervailing duty orders in place on imports from China and Taiwan. Antidumping and countervailing duty orders associated with the CSPV 1 investigations became effective December 7, 2012. Antidumping and countervailing duty orders associated with the CSPV 2 investigations became effective February 18, 2015.
G‐4
Table G-1 CSPV products: Weighted-average f.o.b. prices and quantities of domestic and imported product 1,1 by quarters, 2012-16
* * * * * * *

G‐5
Table G-2 CSPV products: Weighted-average f.o.b. prices and quantities of domestic and imported product 2,1 by quarters, 2012-16
* * * * * * *

G‐6
Table G-2—Continued CSPV products: Weighted-average f.o.b. prices and quantities of domestic and imported product 2,1 by quarters, 2012-16
* * * * * * *

G‐7
Table G-2—Continued CSPV products: Weighted-average f.o.b. prices and quantities of domestic and imported product 2,1 by quarters, 2012-16
* * * * * * *

G‐8
Table G-3 CSPV products: Weighted-average f.o.b. prices and quantities of domestic and imported product 3,1 by quarters, 2012-16
* * * * * * *

G‐9
Table G-3—Continued CSPV products: Weighted-average f.o.b. prices and quantities of domestic and imported product 3,1 by quarters, 2012-16
* * * * * * *

G‐10
Table G-3—Continued CSPV products: Weighted-average f.o.b. prices and quantities of domestic and imported product 3,1 by quarters, 2012-16
* * * * * * *

G‐11
Table G-4 CSPV products: Weighted-average f.o.b. prices and quantities of domestic and imported product 4,1 by quarters, 2012-16
* * * * * * *

G‐12
Table G-4—Continued CSPV products: Weighted-average f.o.b. prices and quantities of domestic and imported product 4,1 by quarters, 2012-16
* * * * * * *

G‐13
Table G-4—Continued CSPV products: Weighted-average f.o.b. prices and quantities of domestic and imported product 4,1 by quarters, 2012-16
* * * * * * *

G‐14
Table G-5 CSPV products: Weighted-average f.o.b. prices and quantities of domestic and imported product 5,1 by quarters, 2012-16
* * * * * * *

G‐15
Table G-5—Continued CSPV products: Weighted-average f.o.b. prices and quantities of domestic and imported product 5,1 by quarters, 2012-16
* * * * * * *

G‐16
Table G-5—Continued CSPV products: Weighted-average f.o.b. prices and quantities of domestic and imported product 5,1 by quarters, 2012-16
* * * * * * *