· pdf filepromoting public transit through subsidized transit passes has been key to our...
TRANSCRIPT


For more than three decades, UCLA has been committed to getting its commuters out of their cars and into more sustainable transportation modes as a way to ease traffic on campus and in the surrounding community, and decrease the University’s overall carbon footprint. As more students, staff, and faculty have left their vehicles behind and chosen alternative transportation options like public transit, vanpools, carpools, biking, and walking, UCLA has become a more sustainable, safer, and healthier campus for everyone. Promoting public transit through subsidized transit passes has been key to our success. This year, we strengthened the transit payment process for the campus community by placing transit passes for our most popular transit service providers on one easy-to-use TAP card. In addition, we coordinated with Santa Monica Big Blue Bus to provide more accessible and covenient Rapid 12 service for commuters using the new Expo Line Phase II Extension, which gets riders to campus in just minutes.
When it comes to active transportation options, we greatly enhanced the University’s built environment to support bicycling and walking by adding more bike lanes and bike racks, while installing an innovative bike channel and contra-flow bike lanes for easier access through campus. With over 3,000 bicyclists now arriving to campus each day – double what our bike community was a decade ago – there’s more to come, including an exciting campus bike share program launching in 2017.
In order to keep our increasing pedestrian population safe, UCLA has enhanced campus crosswalks with piano key striping and added a crosswalk scramble at one of our busiest intersections. In 2017, speed limits will be reduced campuswide to 20 miles per hour.
UCLA Transportation has worked hard to reduce vehicle traffic on campus, and the results speak for themselves. Since 1987, the UCLA employee drive-alone rate has fallen from 74% to 53% – far lower than LA County as a whole, where roughly 74% of all commuters drive alone to work. While less than 4% of Angelenos bike or walk as their commute mode, 36% of UCLA commuting students and 9% of our employees are pedestrians or bike commuters. And compared to the 6% of LA County commuters who use public transit, 17% of UCLA employees and 28% of students commute by bus.
Still, there is more to do. Through sound planning and strategic partnerships, UCLA will continue to make the campus and surrounding area a safer, healthier, and more accessible place to work, learn, and visit. I invite you to review our most recent transportation successes in this year’s report.
A LETTER FROM THE EXECUTIVE DIRECTOR
December 2016
Sincerely,
Renée A. Fortier
Executive Director
UCLA Transportation

TIMELINE OF ACHIEVEMENTS 04
INTRODUCTION 06
COMMUTER CHARACTERISTICS 08
VEHICLE TRIPS AND TRAFFIC 10
MODE SPLIT 12
COMMUTER BENEFITS 16
COMMUTE MODES 16
OTHER MODES 24
WHAT’S NEXT? 30
ADDITIONAL RESOURCES 32
TABLE OF CONTENTS

2016
UCLA Transportation
launches employee
commuter vanpool
program.
UCLA Transportation
develops Transportation
Demand Management
Plan, setting long-range
traffic reduction targets
for the University.
UCLA publishes Long
Range Development Plan,
setting vehicle trip caps
and parking space caps to
counter increasing campus
construction projects.
BruinGO! subsidized transit
pass program begins for
Santa Monica Big Blue Bus
and Culver CityBus routes,
following pilot program
started in 2000.
Go Metro subsidized
transit pass program
begins for Los Angeles
County Metro Bus and
Metro Rail, and LADOT
commuter bus routes.
1984 1987 1990 2002 2005 2006 2008 2011 2014 2015
UCLA introduces two all-electric, zero-emission buses to its campus shuttle service
4 | Timeline of Achievements2016 State of the Commute Report0

UCLA Transportation
publishes Bicycle
Master Plan in an effort
to establish campus
bike program.
UCLA publishes Climate
Action Plan, establishing
campuswide goals to
reduce greenhouse
gas emissions.
UCLA Transportation
implements Bruin
Commuter Club,
offering incentives for
alternative transportation
participants.
UCLA receives Bronze
status as Bicycle Friendly
University by the League
of American Bicyclists.
UCLA Transportation
publishes Sustainable
Transportation Plan,
highlighting goals and
strategies set forth by
the campus’ Climate
Action Plan to reduce
greenhouse gas
emissions.
UCLA recognized with the
Governor’s Environmental and
Economic Leadership Award
(GEELA), the state’s highest
environmental honor.
UCLA receives upgraded
Silver status as Bicycle Friendly
University by the League of
American Bicyclists.
1984 1987 1990 2002 2005 2006 2008 2011 2014 2015

06 | Introduction2016 State of the Commute Report

UCLA is a premier teaching, research, and public service institution located in the most traffic congested city in the United States. Los Angeles also experiences some of the worst air pollution in the country. Its infamous car culture has long dominated mobility in the city and region, and emissions from internal combustion engines have greatly impacted air quality in the LA basin and beyond.
UCLA, however, has for decades expended efforts to reduce vehicle traffic to and from its Westwood campus, and is a leader in transportation demand management and alternative fuel vehicle use.
In this State of the Commute Report for 2016, we review the University’s efforts to maintain sustainable transportation programs, analyze recent commute trends, and highlight notable achievements in our effort to reduce greenhouse gas emissions while making the campus a safer and more livable environment.
INTRODUCTION

So who exactly commutes to UCLA?
UCLA enrolled nearly 45,000 students during fall quarter
2016, continuing to host the largest student population on the
smallest acreage of land of any campus in the UC system.
Over the last five years, University enrollment has increased
by nearly 11%, with undergraduates increasing by nearly 14%
and the graduate student population growing by over 4%
(Figure 1). Though nearly 15,000 students reside on campus
and are therefore not counted as commuters, more than
30,000 students commute from their off-campus residences
to the University each school day. More than 5,000 faculty
and academic staff and nearly 26,000 staff members (not
including residents, interns, graduate assistants, or other part-
time workers) are employed at UCLA (Table 1). Of the total
population (76,180), 61,520 commute to campus on a regular
basis (Table 2).
UCLA commuters are far less likely than their fellow commuters
in Los Angeles County to travel alone in their automobile. The
drive-alone rate for UCLA employees in 2016 was close to
53%, while the drive-alone for UCLA students came in at just
over 25% (Figure 2). In contrast, the drive-alone rate for all LA
County commuters was nearly 74% in 2015 (the latest available
year for this data).
University commuters used alternative transportation modes
at a rate far higher than Los Angeles commuters as a whole, a
pattern that held true for all major modes. Nearly 9% of UCLA
employees (and more than 36% of commuting students) were
pedestrians or bicycle commuters, options exercised by less
than 4% of LA County commuters. Seventeen percent of UCLA
employees and 28% of students commuted by public transit,
compared to only 6% for all of LA County. Finally, more than
16% of UCLA employees commuted by carpool or vanpool,
while 9% of LA County commuters used one of these modes.
COMMUTER CHARACTERISTICS
TABLE 1. CAMPUS POPULATIONStudents 44,947
Undergraduate 1 30,873
On-Campus 2 12,805
Off-Campus 18,068
Graduate 1 14,074
On-Campus 2 1,855
Off-Campus 12,219
Faculty & Academic Staff 5,432
Staff 25,801
Total Campus Population 76,180
1 UCLA Office of Analysis & Information Management
2 UCLA Housing, November 2016
TABLE 2. COMMUTER POPULATION
Faculty & Staff 31,233
Off-Campus Students 30,287
Undergraduate 18,068
Graduate 12,219
Total Commuters 61,520
Source: UCLA Office of Analysis & Information Management
0%
10%
20%
30%
40%
50%
60%
70%
80%
UCLAStudents
UCLAEmployees
LA CountyCommuters
FIGURE 2. COMMUTER DRIVE-ALONE RATE
Sources: UCLA SCAQMD Survey, UCLA Spring Student Survey, American Community Survey
74%53%25%
08 | Commuter Characteristics2016 State of the Commute Report

FIGURE 1. UCLA STUDENT ENROLLMENT, 1990-2016

CHARING CROSS/HILGARD
SUNSET/ROYCE
15,000 +
10,000 - 15,000
5,000 - 10,000
1,000 - 5,000
0 - 1,000
WYTON/HILGARD
SUNSET/WESTWOOD PLAZA
SUNSET/BELLAGIO
STRATHMORE/GAYLEY
GAYLEY/CHARLES E. YOUNG DRIVE SO.
REAGAN MEDICAL CENTER/GAYLEY
GAYLEY/STRUCTURE 1
MAGNOLIA COURT/MIDVALE
LOT 31 NO.LOT 31 SO.
SYCAMORE COURT NO.
SYCAMORE COURT SO.
WEYBURN TER/VETERAN NO.
WEYBURN TER/VETERAN SO.
WEYBURN TER/WEYBURN AVE
PALM COURT/VETERAN
WILSHIRE CENTER
STR 32 SO. ENT/EXITLOT 36/KINROSS
STR 32/KINROSS
STR 32 EXIT/MIDVALE ALLEY
WESTWOOD/LE CONTE TIVERTON/LE CONTE
MANNING/HILGARD
WESTHOLME/HILGARD
WESTWOOD CENTER
FIGURE 4. 2016 TRAFFIC VOLUMES BY INTERSECTION AT UCLA
10 | Vehicle Trips and Traffic2016 State of the Commute Report

UCLA Transportation conducts a cordon count during the fall quarter each year in order to
track the number of trips made to/from campus by vehicles over the course of one week
(Figure 3). The number of vehicle trips on campus increased this year compared to the
previous year. An average of 105,284 daily trips were taken to or from campus in 2016, an
increase of 4% compared to 2015 (Table 3). However, this total represents a slight decrease
compared to 2010, despite a campus population increase of 17% during the same period. The
most heavily used gateway to campus is Westwood Plaza at Le Conte Avenue, which accounts
for 16% of vehicle trips (Figure 4).
VEHICLE TRIPS AND TRAFFIC
2010 2011 2012 2013 2014 2015 2016
Main Campus 91,169 88,906 82,428 87,081 87,324 86,998 90,612
Southwest Campus 12,758 11,741 12,977 11,164 11,235 12,034 12,640
Wilshire Center 2,058 2,058 1,922 1,996 2,002 2,001 2,080
Westwood Center 0 0 672 708 710 720 750
Bus Trip Subtraction 402 678 775 785 780 792 798
Total 105,584 102,027 97,224 100,163 100,491 100,961 105,284
Source: UCLA Cordon Count Reports
TABLE 3. AVERAGE DAILY VEHICLE TRIPS TO/FROM UCLA, 2010-2016
FIGURE 3. AVERAGE DAILY VEHICLE TRIPS TO/FROM UCLA, 1991-2016
Note: All numbers are rounded five-day averages; therefore, the totals may not match the sum of components.
UCLA Transportation conducts two surveys annually that
capture the commute habits of the University community:
one for employees (SCAQMD Survey) and one for students
(Student Transportation Survey).
The SCAQMD Survey satisfies the South Coast Air Quality
Management District’s regulatory requirement for
large employers (over 250 employees) to report the
organization’s average vehicle ridership (AVR), which
signifies the ratio of people to vehicles arriving at the
worksite. The higher the AVR, the fewer vehicles there
are in relationship to the population, which means more
employees are carpooling, taking public transit, walking,
telecommuting or engaging in some other alternative
commute mode or work schedule. In 2016, UCLA achieved
an AVR of 1.66, well above SCAQMD’s regulatory required
target for compliance of 1.50.
The Student Transportation Survey provides information
on the travel patterns of undergraduate and graduate
students residing both on and off campus. These two
surveys are the sources for all UCLA mode split information
contained in this report.
MODE SPLIT
12 | Mode Split2016 State of the Commute Report


DRIVEALONE53.0%
OTHER5.0%WALK
6.9%
BICYCLE1.9%
PUBLICTRANSIT16.9%
VANPOOL4.3%
CARPOOL12.0%
FIGURE 5. COMMUTING EMPLOYEE MODE SPLIT, 2016
OTHER4.4%
BICYCLE5.4%
VANPOOL.1%
CARPOOL6.2%
DRIVEALONE
25.0%
WALK30.9%
PUBLICTRANSIT28.0%
FIGURE 6. COMMUTING STUDENT MODE SPLIT, 2016
Approximately 39% of all UCLA commuters drive alone to
campus, including 53% of employees and 25% of commuting
students (Table 4). The remaining 61% of all commuters
travel to UCLA by some form of alternative transportation,
including carpool, vanpool, public transit, bicycling, and
walking (Figure 7).
Non-motorized transportation modes (bikes, scooters,
pedestrians) account for more than 23% of all commuters,
making this the largest block of alternative transportation
users. Walkers constitute nearly 19% of all commuters,
including nearly 7% of employees (Figure 5) and close to
31% of students (Figure 6). Nearly 4% of commuters bicycle
to UCLA, including 1.9% of employees and more than 5% of
students.
More than 22% of all UCLA commuters take public transit,
including close to 17% of employees and 28% of students.
Forty percent of student public transit users ride the
University-operated BruinBus shuttles, while 60% ride with
one or more of UCLA’s six partner public transit agencies.
UCLA vanpoolers make up more than 2% of all commutes
to campus, including 4.3% of employees. Carpoolers
constitute more than 9% of commuters, including 12%
of employees and 6% of students. More than 3% of
commuters come to UCLA by some mode other than
those listed above. This group includes those who are
driven to campus and dropped off, those who ride a
motorcycle, and other options.
Nearly 15,000 students live in residence halls or in other
on-campus facilities. While these on-campus residents
are not considered commuters, they still make an intra-
campus trip to school each day and the transportation
choices they make certainly have an impact on the
University and the surrounding community. Trips to class
or work for on-campus residents are dominated by non-
motorized modes. Walking accounted for almost 90% of
on-campus trips, with biking adding an additional 2%. Five
percent rode BruinBus Shuttle.
Mode choice varies greatly depending on the location
of a student’s on-campus residence. More than 90% of
students in residence halls walked to class or work. For
graduate student residents living in Weyburn Terrace on
the Southwest Campus, more than half walked while over
a quarter rode BruinBus.
TABLE 4. UCLA 2016 MODE SPLIT Employees Students
Drive Alone 53.0% 25.0%
Carpool 12.0% 6.2%
Vanpool 4.3% 0.1%
Public Transit 16.9% 28.0%
Bike 1.9% 5.4%
Walk 6.9% 30.9%
Other 5.0% 4.4%
Sources: 2016 UCLA SCAQMD Survey, 2016 UCLA StudentTransportation Survey
14 | Mode Split2016 State of the Commute Report
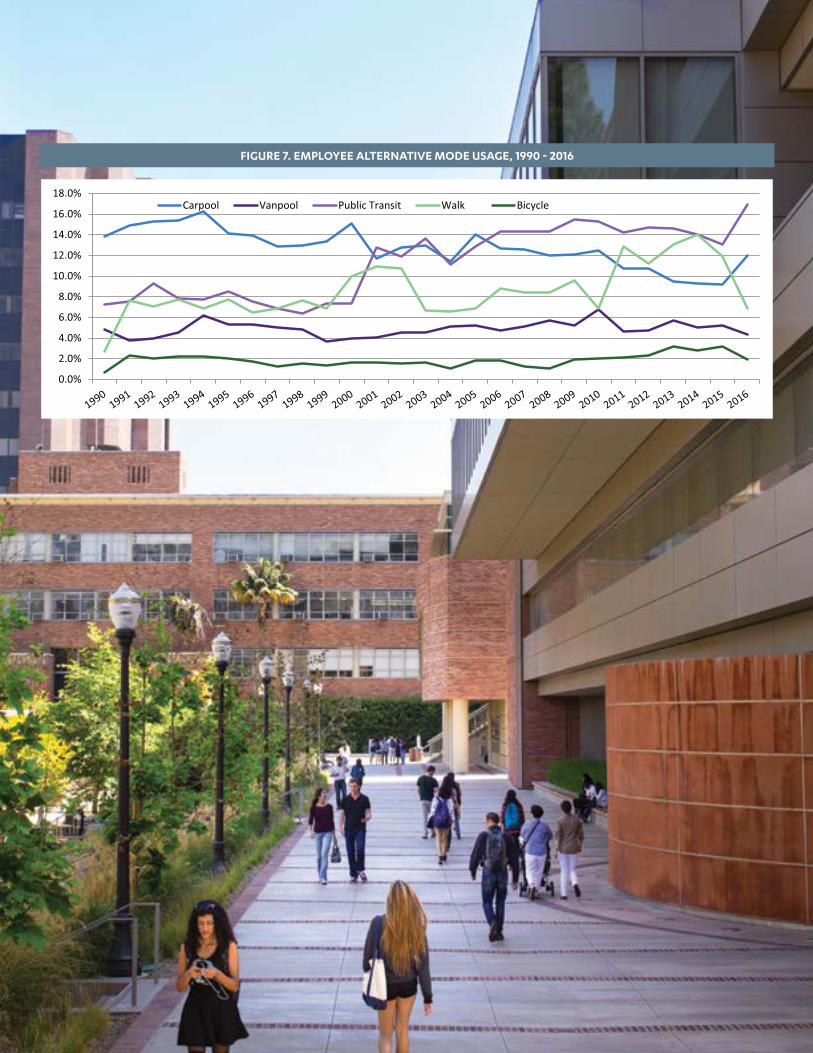
FIGURE 7. EMPLOYEE ALTERNATIVE MODE USAGE, 1990 - 2016

To further incentivize ridesharing and active
transportation, UCLA students and employees
who use an alternative transportation mode can
receive commuter benefits by joining the Bruin Commuter
Club (BCC). BCC members receive discounted daily parking
privileges, commuter rewards from Los Angeles County
Metro and emergency ride home services. Those who bike
or walk to campus also receive additional mode-specific
benefits through BCC. In 2016, the BCC had more than
5,400 members, including about 5,000 employees and 400
students.
COMMUTER BENEFITS
Twelve percent of campus employees and over 6% of the
student commuter population reported carpooling as
their travel mode of choice. UCLA Transportation offers
discounted carpool parking permits and commuter
assistance for students and employees interested in forming
carpools (Table 5). As of December 2016, the average
commuter in a two-person carpool saves more than $550
per year in permit costs compared to a commuter who drives
solo and purchases a basic individual permit. Members of
three-person carpools save nearly $800 per year in permit
costs.
UCLA operates more than 148 vanpools that serve campus
commuters throughout Southern California (Figure 8).
Pick-up locations for vanpools are as far north as Lancaster
(northern LA County); as far east as Moreno Valley (Riverside
County); as far south as Laguna Hills (Orange County); and as
far west as Oxnard (Ventura County).
COMMUTE MODES
CARPOOL
VANPOOL
TABLE 5. CARPOOL PERMITS ISSUED - FALL 2016
Employees
Two-Person Permits 461
Three-Person Permits 112
Students
Two-Person Permits 321
Three-Person Permits 136
Total Carpool Permits Issued 1,030
Total Parking Permits Issued 32,398
Carpool’s % of All Permits Issued 3.2%
Source: UCLA Parking Programs (as of Nov. 1, 2016)
16 | Commuter Benefits - Commute Modes2016 State of the Commute Report

FIGURE 8. RESIDENCES OF CARPOOL AND VANPOOL PARTICIPANTS, FALL 2016

18 | Commute Modes2016 State of the Commute Report
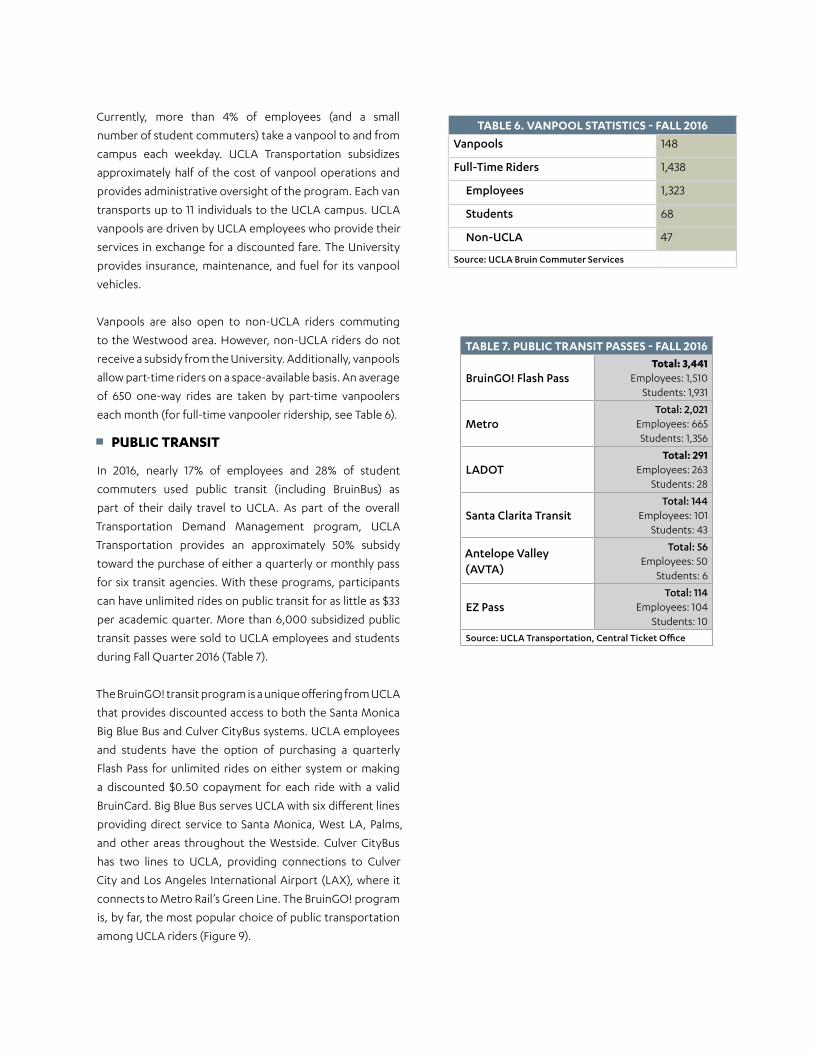
Currently, more than 4% of employees (and a small
number of student commuters) take a vanpool to and from
campus each weekday. UCLA Transportation subsidizes
approximately half of the cost of vanpool operations and
provides administrative oversight of the program. Each van
transports up to 11 individuals to the UCLA campus. UCLA
vanpools are driven by UCLA employees who provide their
services in exchange for a discounted fare. The University
provides insurance, maintenance, and fuel for its vanpool
vehicles.
Vanpools are also open to non-UCLA riders commuting
to the Westwood area. However, non-UCLA riders do not
receive a subsidy from the University. Additionally, vanpools
allow part-time riders on a space-available basis. An average
of 650 one-way rides are taken by part-time vanpoolers
each month (for full-time vanpooler ridership, see Table 6).
In 2016, nearly 17% of employees and 28% of student
commuters used public transit (including BruinBus) as
part of their daily travel to UCLA. As part of the overall
Transportation Demand Management program, UCLA
Transportation provides an approximately 50% subsidy
toward the purchase of either a quarterly or monthly pass
for six transit agencies. With these programs, participants
can have unlimited rides on public transit for as little as $33
per academic quarter. More than 6,000 subsidized public
transit passes were sold to UCLA employees and students
during Fall Quarter 2016 (Table 7).
The BruinGO! transit program is a unique offering from UCLA
that provides discounted access to both the Santa Monica
Big Blue Bus and Culver CityBus systems. UCLA employees
and students have the option of purchasing a quarterly
Flash Pass for unlimited rides on either system or making
a discounted $0.50 copayment for each ride with a valid
BruinCard. Big Blue Bus serves UCLA with six different lines
providing direct service to Santa Monica, West LA, Palms,
and other areas throughout the Westside. Culver CityBus
has two lines to UCLA, providing connections to Culver
City and Los Angeles International Airport (LAX), where it
connects to Metro Rail’s Green Line. The BruinGO! program
is, by far, the most popular choice of public transportation
among UCLA riders (Figure 9).
PUBLIC TRANSIT
TABLE 6. VANPOOL STATISTICS - FALL 2016
Vanpools 148
Full-Time Riders 1,438
Employees 1,323
Students 68
Non-UCLA 47
Source: UCLA Bruin Commuter Services
TABLE 7. PUBLIC TRANSIT PASSES - FALL 2016
BruinGO! Flash Pass Total: 3,441
Employees: 1,510Students: 1,931
MetroTotal: 2,021
Employees: 665Students: 1,356
LADOTTotal: 291
Employees: 263Students: 28
Santa Clarita TransitTotal: 144
Employees: 101Students: 43
Antelope Valley (AVTA)
Total: 56Employees: 50
Students: 6
EZ PassTotal: 114
Employees: 104Students: 10
Source: UCLA Transportation, Central Ticket Office

In 2016, UCLA Transportation launched the BruinTAP for
Transit program providing UCLA employees and students the
ability to purchase a quarterly BruinGO! Flash Pass and/or Go
Metro pass online and load both passes onto one TAP card. By
purchasing both options, commuters can now ride any Santa
Monica Big Blue Bus, Culver CityBus, Metro bus or Metro rail
line, including the new Expo Line, all quarter long.
Metro serves UCLA and Westwood Village with six lines
providing direct connections to downtown LA, the San
Fernando Valley, Santa Monica, and many points in between.
Metro riders can connect from one of these six buses to
the rest of the Metro network, which includes two subway
lines, four light rail lines and nearly 200 bus lines stretching
throughout LA County.
UCLA partners with three agencies to provide long-distance
bus service for UCLA employees and students who commute
from locations far from campus: The City of Los Angeles
Department of Transportation (LADOT), City of Santa Clarita
Transit (SCT), and the Antelope Valley Transit Authority (AVTA).
All three of these agencies serve the UCLA population with
stops in both Westwood Village and adjacent to the UCLA
campus.
LADOT operates three Commuter Express routes from the
San Fernando Valley and downtown LA to the Westwood
area. The vast majority of UCLA’s LADOT riders come from
the San Fernando Valley on a line with 16 arrivals from and 15
departures to the Valley each weekday.
SCT operates two commuter routes between the Santa Clarita
Valley and Westwood, with 11 arrivals from and 11 departures
to Santa Clarita each weekday.
AVTA runs five buses between the Antelope Valley and UCLA
each weekday.
BruinBus, the year-round campus shuttle bus operated by
UCLA Transportation, provides complimentary weekday
service and is widely used by students (and some employees)
as either a primary commute mode or to supplement another
mode, such as public transit or walking (more BruinBus
information on page 27).
20 | Commute Modes2016 State of the Commute Report

FIGURE 9. MOST POPULAR TRANSIT PASSES FOR UCLA RIDERS (DAILY BOARDINGS)

BICYCLING
UCLA has been designated a Bike Friendly University twice by
the League of American Bicyclists, receiving a Bronze status
in 2011 and an upgraded Silver status in 2015. The Silver status
places UCLA in the top third of the nationwide rankings.
The UCLA campus has over seven miles of bike routes, low-cost
quarterly bike rentals for students, and a bike shop located
in central campus. This year, almost 5.4% of commuting
students traveled to UCLA by bicycle, while approximately
2% of the campus employee population reported bicycling as
their commute mode.
Major infrastructure improvements completed during 2016
include a bike channel in central campus, a shared bicycle/
pedestrian path in the medical center area, and another
protected bike lane on the west side of campus. UCLA
Transportation also launched a new employee Earn-A-Bike
program and a bicycle citation diversion program called
BruinBikeSmart. The Earn-A-Bike program encourages
eligible employees to trade in their parking permit for a free
bike, while the BruinBikeSmart program allows cyclists who
receive a moving violation to take an online bike safety class
in lieu of paying the full citation amount.
Employees who are members of the Bruin Commuter Club
and bike to campus receive an annual monetary benefit that
may be used for services or products at the UCLA Bike Shop
or Helen’s Cycles, access to shower facilities on campus, or a
membership to the Los Angeles County Bicycle Coalition.
22 | Commute Modes2016 State of the Commute Report


UCLA’s beautiful, compact campus, as well as Southern
California’s favorable weather, makes walking an ideal commute
mode for many students and employees throughout the year.
With more people choosing health and fitness as part of their
daily routine, UCLA’s enhanced crosswalks and slowed vehicle
speeds make it easier and safer for pedestrians to choose this
active transportation commute mode.
Pedestrian trips account for nearly 7% of UCLA’s employee
commutes, while nearly 31% of commuting students walk to
campus. Proximity plays a key role in student commutes, as
almost two-thirds of off-campus students living in nearby
Westwood walk to campus.
In 2016, the Bruin Commuter Club continued an incentive
program that provided employees who walked to work with
benefits such as a gift card or access to on-campus shower
facilities.
Walking is the primary mode of transportation for almost
90% of students living on campus. More than 93% of students
living in residence halls and more than half of Weyburn Terrace
residents walk to class. Almost all UCLA commuters and
residents, regardless of their primary mode, are pedestrians for
a portion of their trip, even if the walk is only from their parking
structure or bus stop to their office or classroom.
Numerous other modes account for a small
percentage of the commutes to and from the UCLA
campus. BruinBus is widely used by students (and
also by some employees) as either a primary commute mode
or as a supplement to another mode, such as public transit or
walking. Some employees have the option of telecommuting
or working a compressed work week. In total, approximately
5% of employees and over 4% of students identify their primary
commute mode as something other than driving alone, carpool,
vanpool, public transit, biking, or walking.
OTHER MODES
WALKING
24 | Commute Modes - Other Modes2016 State of the Commute Report


Your Daily True Bruin Experience.
26 | Other Modes2016 State of the Commute Report

BRUINBUS
BruinBus, the year-round campus shuttle bus service
operated by UCLA Transportation, provides service on four
distinct routes each weekday, excluding University holidays.
Campus Express – the most popular BruinBus route – includes
stops at the Weyburn Terrace graduate student housing area,
the Ronald Reagan Medical Center, and the academic core of
campus. The Wilshire Center Express serves as a connection
from the Wilshire Center office building on Wilshire Boulevard
to the main campus. The Weyburn Express provides direct
service between Weyburn Terrace and the academic core of
campus during peak morning hours. Finally, the University
Apartment Shuttle transports students from UCLA-owned
off-campus apartments to the main campus.
Between July 2015 and June 2016, BruinBus vehicles traveled
more than 187,000 miles and transported over one million
riders. More than a quarter of the graduate students residing
in Weyburn Terrace use BruinBus as part of their trip to
school. Almost 5% of off-campus students use BruinBus for
at least a portion of their commute.
In 2016, two new all-electric buses were incorporated into
the BruinBus transit program. These zero emission, clean-
fueled buses run for up to 145 miles; are equipped with
portable electric chargers and can be fully charged in two
and a half hours; and are five times more efficient compared
to diesel, CNG, and hybrid technologies. These are the first
electric buses at any public university in California.
In alignment with the University’s commitment to carbon
neutrality, UCLA Transportation continues to promote the
use of electric vehicles (EV) and plug-in hybrids among
employees, students, and campus visitors by expanding the
EV infrastructure throughout the campus.
Since 2012, UCLA has partnered with the vendor ChargePoint
to provide EV charging stations in numerous parking facilities
accessible to University permit holders, visitors, and those
with ADA parking needs. These stations provide both Level
1 (120 volt) and Level 2 (240 volt) chargers. Level 1 charging
is included in the price of a UCLA Clean Fuel Permit, while
ELECTRIC VEHICLES
customers using Level 2 stations are charged an hourly
usage fee. Over the last three years, the number of
charging sessions at these stations has increased by an
average of 40% annually (Figure 10).
UCLA Transportation continues to partner with UCLA’s
Smart Grid Energy Research Center as well to facilitate
research and innovation in the field while providing
additional EV charging options for UCLA commuters.
FIGURE 10. ON CAMPUS ELECTRIC VEHICLE CHARGING SESSIONS
Source: ChargePoint Network

FLYAWAY
Carsharing services allow customers to rent a vehicle
for an hourly or daily rate, with fuel and insurance costs
included in the rental fee. At the end of the reservation
period, the user parks the vehicle in the designated
carshare space, allowing the next user to pick up the
vehicle once it is available.
Carsharing is attractive for customers who do not need
regular access to a vehicle but do need a car periodically
for the occasional errand or appointment. Carsharing
typically benefits the users of alternative transportation
modes, such as public transit and vanpool, because it
provides a midday mobility option for customers who do
not have their own automobile available at work
or school.
Zipcar is an official carsharing provider for UCLA, with 24
vehicles available at 11 different locations on
campus (Table 8).
UCLA Transportation also subsidizes Zipcar usage for
University employees who commute to campus by an
alternative mode and belong to Bruin Commuter Club.
Members of Bruin Commuter Club are provided four
complimentary hours of Zipcar usage each month.
Amtrak Thruway connects the UCLA community to Amtrak’s
rail network. Four motor coaches stop at the University
each day, with schedules coordinated with the arrivals and
departures of the San Joaquin line at Bakersfield, which
serves the Central Valley, Sacramento and the San Francisco
Bay Area. These same buses can also be used to connect to
the Van Nuys station, where riders can catch Amtrak’s Pacific
Surfliner trains to the Central Coast and San Diego.
AMTRAK
The LAX FlyAway bus service, operated by the City of Los
Angeles World of Airports, provides direct shuttle service
between Los Angeles International Airport (LAX) and
UCLA’s Parking Structure (PS) 32 in Westwood Village. Buses
depart both Westwood and LAX hourly throughout the
day, with 17 departures from and 18 arrivals to PS 32 each
day. FlyAway also operates bus service to LAX from Van
Nuys, Union Station, Hollywood, and Long Beach, as well as
connecting service from the Metro Orange Line.
UCLA Transportation provides supplemental bus service
between LAX and PS 32 during periods of peak travel and
academic breaks for the University community. UCLA
Transportation also provides marketing support to
FlyAway both on campus and in the Westwood community
throughout the year.
CARSHARING
TABLE 8. ZIPCAR USAGE - 2016
Reservations 15,961
Total Hours 77,224
Total Miles 583,311
Avg. Hours per Reservation 4.8
Avg. Miles per Reservation 36.6
Number of Vehicles on Campus 24
Source: Zipcar
28 | Other Modes2016 State of the Commute Report


In the coming year, UCLA will continue to cultivate
both on and off-campus partnerships to achieve its
current sustainable transportation goals.
UCLA will launch the new Bruin Bike Share program in
spring 2017, a joint effort with the Westwood Business
Improvement District and Westside cities, including
Beverly Hills, West Hollywood, and Santa Monica. The
University will also continue to work with surrounding
municipalities in the ongoing effort to provide safer and
more accessible bicycle routes to campus.
UCLA will continue to increase the number of commuters
utilizing electric vehicles and plug-in hybrids by
expanding the EV infrastructure throughout the campus.
When completed, a larger network of Level 1 charging
areas will be accessible to permit holders, visitors, and
those with ADA parking needs, complementing existing
Level 2 charging stations.
Finally, the University will continue to foster
transportation relationships with area public transit
providers to ensure the best service for UCLA
commuters. This includes working with Metro to bring
the long anticipated Purple Line subway to UCLA.
With the overwhelming passage of Measure M last
fall, Metro’s extension of the Purple Line to Westwood
will be completed much sooner than expected, and
in addition, a rail tunnel through the Sepulveda Pass
Corridor will eventually connect Westwood Village with
the San Fernando Valley.
Transportation programs require teamwork, and
UCLA will remain an innovator and leader in providing
sustainable transportation options that support the
campus community and the surrounding areas.
WHAT’S NEXT?
30 | What's Next?2016 State of the Commute Report


2016 UCLA Cordon Count
http://bit.ly/UCLACordonCount2016
2016 UCLA Student Transportation Survey
http://bit.ly/UCLAStudentSurvey2016
UCLA Bicycle Master Plan
http://bit.ly/UCLABikeMasterPlan
ADDITIONAL RESOURCES
32 | Additional Resources2016 State of the Commute Report


UCLA Transportation supports the campus community
by providing for safe and efficient access and mobility
in an environmentally responsible manner.
“ ”
MISSION