public sector residential aged care quality of care
TRANSCRIPT

Public Sector Residential Aged Care Quality of Care Performance Indicator ProjectReport
Public SectorResidential Aged Care
Quality of
Care Perform
ance IndicatorProject Report

A project conducted for the Aged Care Branch of the Department ofHuman Services (Victoria) by:
The Gerontic Nursing Clinical School School of Public Health La Trobe University and Bundoora Extended Care Centre
Project Team Professor Rhonda Nay Professor Shane Thomas Dr Susan Koch Ms Jacinda Wilson Assoc Professor Sally GarrattMrs Anne Fox – Bundoora Extended Care Centre Dr Bill Koch
June 2004
Public Sector Residential Aged Care Quality of Care Performance Indicator ProjectReport

ii Public Sector Residential Aged Care
© The Aged Care Branch of the Department of Human Services (Victoria), 2004
ISBN 07311 6198 XThis work is copyright. Apart from any use permitted under the Copyright Act 1968,no part may be reproduced by any process without prior written permission from theAged Care Branch of the Department of Human Services (Victoria).
Acknowledgements
The Project Team acknowledges the Aged Care Branch of the Department of HumanServices (Victoria) for funding this project. The participation of all forum attendees,industry stakeholders who responded with feedback to the website, clinical/qualityindicator experts who participated in interviews and participants of the consumerissues focus group is acknowledged. The contribution of the Project Advisory Groupis similarly acknowledged.
Project Advisory Group
Sue Brennan Manager, Residential Services, Aged Care DHSMaree Cameron Manager, Quality Improvement, Aged Care DHSLisa Clinnick Executive DON – Hepburn Health Service Anne-Maree Connors Manager, Health, Housing & Aged Care – Loddon Mallee
Region, DHSAnne Curtin DON, West Gippsland Health Care GroupJill Dunbar Manager, Aged, Community & Primary Health, Barwon South-
West Region, DHSJoy Easton Senior Project Manager, Funding & Performance – Mental
Health, Service Planning DHSPeter Faulkner Director, Rehabilitation & Aged Care Services Melanie Hendrata Senior Project Officer, Service Development Rural & Regional
Health Services DHSAlan Lilly Director of Rehabilitation and Aged Care Services, Southern
Health Sheryl Nicolson DON, Moyne Health Services Rose Rowan ADON, Residential
Services – Bendigo Healthcare Group Chris Symons DON, Cobram District Health (Hume)
Margaret Summers Manager, Residential Care Strategy, Aged Care DHS
Mary Swift Senior Policy Officer, Residential Care Strategy, Aged CareDHS

Quality of Care Performance Indicator Project Report iii
Contents
Executive summary iv Introduction iv Project aims and purpose iv Method iv Results and recommendations v Consultations with industry stakeholders v Consultations with experts vi Consultations with consumer issues focus group vi The way forward vii Conclusion viii
1 Introduction 11.1 Background to project 11.2 Project aims and purpose 2
2 Project methodology 3
3 Literature review 4
4 Consultations 254.1 Industry stakeholder forums 254.2 Clinical/quality indicator experts 254.3 Consumer issues focus group 26
5 Data analysis 27
6 Outcomes of project activities 28 6.1 Outcomes of industry stakeholder forums 28 6.2 Summary of consultations with industry stakeholders 40 6.3 Outcomes of interviews with quality/clinical indicator experts 40 6.4 Outcomes of the consumer issues focus group 466.4 Summary of consultations with consumer representatives 516.5 Written submissions 51
7 Outcomes of formulation of recommendations 557.1 Methodology for the final selection of Victorian public
sector RACS QIs 55
8 Recommendations 628.1 Recommended procedure for risk adjustment 628.2 Recommended quality indicator set 658.3 Recommendations for implementation of Victorian
public sector RACS QI indicator set 85
9 Conclusion 90
10 References 92
11 Appendices 100
iv Public Sector Residential Aged Care
Introduction In 2003, the Aged Care Branch of the Department of Human Services (Victoria)contracted the Gerontic Nursing Clinical School of La Trobe University to develop aset of quality of care performance indicators for the State’s public sector residentialaged care services (RACS)1. It is intended that the quality indicators identified anddeveloped in this Project will complement and be used in conjunction with theaccreditation standards. While numerous quality indicators have been developedand evaluated in the United States, little has been done in Australia and even in theUS debate continues regarding which indicators are most appropriate.
Project aims and purpose The objective of this project was to identify and recommend a set of appropriatequality indicators (QIs) to assist in monitoring and improving the quality of careprovided to residents by Victoria’s public sector RACS. It is intended that theestablishment of a more comprehensive accountability framework related to qualityof care will enable RACS to trend their care performance over time, benchmarkagainst other services to identify both improvements in quality of care and targetspecific areas for improvement. Learning in relation to care management could bedisseminated across the sector (i.e. between different RACS) and facilitate enhancedfocus on issues considered to be influential markers with respect to quality of carewithin a RACS. The proposed set of quality indicators are intended to monitor majoraspects of quality of care at the facility level. It is anticipated that identification ofquality indicators will enable a framework that will assist RACS to report publicly onthe quality of care delivered to residents. Furthermore, that a flow-on effect of thispublic reporting will be enhanced community understanding of the quality and otherperformance issues in RACS.
Method The Project was undertaken between September 2003 and April 2004. Phase 1 ofthe Project involved establishing a Project Advisory Group and conducting aliterature review of existing QIs. Phase 2 involved consultations with residential agedcare stakeholders through forums held at Benalla, Geelong and Melbourne,interviews with experts in clinical/quality indicator development, and a consumerissues focus group. A website (www.latrobe.edu.au.becc/quality) was alsoconstructed to advertise the forums, invite feedback and provide updates of progresson the Project.
Executive summary
1 Residential aged care service (RACS) – “An organisation that provides care and accommodationfor aged people requiring a certain level of care. For the purposes of accreditation, this refers to
services that receive funding from the Australian Government

Quality of Care Performance Indicator Project Report v
Results and recommendations Key findings of the literature review are as follows:
• QIs provide an essential tool in the efforts to continuously improve residential agedcare.
• QI sets should ideally include structure, process and outcome indicators, howeverstructure and process indicators do not necessarily reflect outcomes.
• QIs must be demonstrably valid, reliable, applicable and practicable.
• Some published research in Australian has looked at QIs of care in RACS (e.g.Courtney & Spencer 2000; Madsen & Leonard 1997).
• Most commonly referred to QI set in the literature is that developed by CHSRA andthe University of Wisconsin-Madison, by Zimmerman and colleagues and derivedfrom the MDS.
• Many researchers, both in Australia and internationally, argue for inclusion of someform of Quality of Life (QOL) elements in assessments of RACS. However Courtneyet al. (2003) did not identify any tool that currently exists for this population andidentified a need for an appropriate tool to be developed and validated. Thomas et al.(2004) suggest the SF 36 is worthy of consideration, although it would requiremodification
• Incorporating consumer input is increasingly being recognised and the developmentof consumer experience – rather than consumer ‘satisfaction’ –tools appear to beproviding more meaningful data.
• There is a trend toward including staffing experience/satisfaction indicators in QIsets.
Consultations with industry stakeholders The indicators identified by the stakeholder groups as being important reflecteddomains where some of the participants already collected data for other purposes.This may have included their own internal quality requirements or governmentbodies, eg complaints. There was some indication by participants that data alreadybeing collected had its original focus in the acute care sector. While some domainswere seen as transferable to RACS, others such as death rates may not be.Important to the industry stakeholders was that they would be able to learn from theperformance of other RACS on QIs. For example, if one RACS performs well on oneindicator, then it was hoped that that RACS could be approached about whatpractices they used, so other RACS could use them to improve their ownperformance.

vi Public Sector Residential Aged Care
Perceived barriers to implementation of QIs included issues related to datacollection, culture and staffing, resources, the need for genuine collaboration withDHS and the need for agreement on QI definitions. Strategies to overcome thebarriers included efforts to minimise additional work, training related to QIs andchange management skills and leadership, timely reporting from DHS back to RACS,aiming for resource neutrality and/or recognising the need for more/different staff,use QIs to report better practice and develop RACS, develop agreed definitions andestablish networks to ensure peer support.
Consultations with experts All participants emphasised the importance that the QI process be inclusive of theviews of all stakeholders (this included government, industry and consumers such asstaff, residents and family). It was seen as essential that those involved in the QIprocess agree upon what data would be collected, how the data would be analysedand the reporting back mechanisms implemented. Lack of understanding and howthe program was constructed and integrated into other management processes wasseen as a barrier to the successful implementation of QIs.
When discussing the QOL indicators, the value of outcome measures and how theymeasured improvement for the individual were raised as issues. There were someconcerns expressed regarding the feasibility of having this as a QI. There were alsodifferences expressed regarding the definition of QOL.
Consultations with consumer issues focus group Consumer representatives identified QIs that were unique to this group. Thisincluded up to date practices within a RACS and how they dealt with the death ofresidents in the RACS community. Overwhelmingly the major indicator of qualityrevolved around inclusion of residents in decision making processes.
Following analysis of all of the data collected through the Project activities (forums,interviews and literature review), the general consensus of the Project Advisory Groupwas that some of the QIs are more ready to be implemented at this stage thanothers. The six QIs seen to be most ready for implementation in a pilot phase are:
• Incidence of stage 1–4 pressure ulcers
• Incidence of new fractures as a proportion of falls
• Incidence of daily physical restraints
• Incidence of residents using nine or more different medications
• Incidence of weight change (i.e. a significant increase or decrease from the norm)
• Prevalence of symptoms of depression
Four other QIs were seen by the Project Advisory Group as very important toimplement, however require further refinement before being rolled out. The rationalebehind deferment of implementation is due to definitional and measurement issues.

Quality of Care Performance Indicator Project Report vii
These are:
• Incidence of behavioural symptoms
• Resident experiences of care
• Health related quality of life of residents
• Staff experiences of care
The way forward
Frequency and timing of data collection and reporting issues
In relation to the issues of how often and when data should be collected, therelationship between useful impact upon Quality Improvement Plans (QIPs) andactivities is pivotal. On the basis of consultancy feedback, quarterly reporting shouldbe implemented, so that there be would four cycles of indicator data available foreach QIP. There will need to be consultation between the DHS and RACS toformulate an agreed sampling strategy that adequately balances effort andoutcomes.
Data validation issues
The second substantive issue is the issue of data validation and quality. A number ofoptions are presented and it is recommended that the decision involve detailedconsultation between the DHS and RACS.
Dissemination of indicator results
The third substantive issue is how the indicator results should be disseminated. Animportant driver in quality improvement activities is the use of benchmark datawhere services/facilities compare their performance on common data andindicators with each other. The Project Team recommends open disclosure, howeverit is to be expected that most RACS will want to be satisfied with the reliability andvalidity of the data and processes before publishing their QI data. Central toagreement on dissemination will be a collaborative approach between DHS andRACS, alongside timely feedback.
Proposed piloting of QIs in RACS
The proposed implementation strategy for the QIs takes account of the barriers andstrategies identified by the consultations and better practice in changemanagement. Gaining support from the RACS generally will be facilitated by testingthe QIs initially in a small number of RACS to identify and address anyimplementation issues. The following steps are suggested in implementing the pilotphase in RACS:
1. Publish final report on DHS (Aged Care) website;
2. Identify RACS to be involved in the pilot of QIs;

viii Public Sector Residential Aged Care
3. Use an action research approach to implementation and evaluation;
4. Provide education of staff at pilot RACS;
5. Establish action groups/liaison persons at each pilot RACS to assistimplementation and clarify any matters related to the QIs;
6. Implement through 2 to 3 cycles, and
7. On the basis of feedback from pilot RACS, finalise/modify the QI collection andimplementation strategy for roll out to the rest of the Victorian public sector RACS.
Conclusion This Project, conducted for the Aged Care Branch of the DHS (Victoria), hasidentified and made recommendations for a set of QIs for the State’s public sectorRACS. The recommended QIs were identified through a literature review andconsultations with residential aged care stakeholders, experts in clinical/qualityindicator development and a consumer issues focus group, in addition to input andguidance from the Project Advisory Group.
It is recommended that six QIs are currently ready to be implemented in a pilotphase. These are:
• Incidence of stage 1–4 pressure ulcers
• Incidence of new fractures as a proportion of falls
• Incidence of daily physical restraints
• Incidence of residents using nine or more different medications
• Incidence of weight change (i.e. a significant increase or decrease from the norm)
• Prevalence of symptoms of depression
Four other QIs, whilst no less important, require further refinement before theirimplementation. These are:
• Incidence of behavioural symptoms
• Resident experiences of care
• Health related QOL of residents
• Staff experiences of care
A piloting phase is suggested and it is clear that the implementation process shouldinclude a strong educative element. This would include information about what QIsare and their role in the accreditation process and should be provided to all levels ofstaff. There will also need to be a process for the subsequent development of theindicators recommended in the three new domains of resident experience, staffexperience and resident health-related QOL, as well as the indicator relating tobehaviours. It is suggested that the development of these new indicators beconducted in parallel with the roll out of the currently collected indicators and beadded to the set perhaps at the time of the second data collection cycle. This will

Quality of Care Performance Indicator Project Report ix
allow the timely introduction of the indicator system without having to wait for the fulldevelopment of the new indicators.
A key feature of further activity is engagement between RACS and the DHS tofinalise the indicators and their implementation. The implementation of therecommended Victorian RACS QI set should take a participatory approach based onthe principles of action research and contemporary change management. Asexpressed during the consultations, it is important that there is a partnershipbetween DHS and RACS and that RACS receive timely feedback from the DHS. Inaddition, involvement of staff at all levels within each RACS will supportimplementation. Finally, while monitoring QIs will illuminate poor practice, a punitiveapproach will only result in low compliance and inaccurate recording. For the QIs toimpact positively on care for older people in public sector RACS the emphasis mustbe on highlighting and sharing practice improvements.

x Public Sector Residential Aged Care

Quality of Care Performance Indicator Project Report 1
1.1 Background to projectCurrently in Victoria, there are 194 public sector RACS. This includes 11multipurpose services, 17 psycho-geriatric RACS and eight that are generic andpsycho-geriatric) provided by 79 agencies.
These services provide over 6,700 residential aged care places, including 585psycho-geriatric places. Almost two thirds of all places are high care places, and79% of all places are located in rural and regional Victoria. The vast majority ofservices are co-located with other health services. All services, with the exception ofthe 11 multipurpose services, are required to be accredited under the Aged Care Act1997 and hold a current, affirmative accreditation status.
The Australian Government approves public sector RACS as providers and theirresidents are eligible for subsidies under the Aged Care Act 1997. The StateGovernment provides $67.7 million a year in additional recurrent funding and alsoprovides capital funding assistance for building and upgrading.
Quality of care provided by RACS in Australia is currently regulated through anaccreditation process, managed by the Aged Care Standards and AccreditationAgency, which is independent of government. In order to continue to receiveAustralian and State Government funding, RACS must at least meet accreditationstandards within the following four domains:
• Management systems, staffing and organisational development,
• Health and personal care,
• Resident lifestyle, and
• Physical environment and safe systems (Aged Care Standards Agency 2001).
All four accreditation standards have an expectation of continuous qualityimprovement (CQI) built in to them (Bartlett & Boldy 2001). The initial phase of CQIis identifying care issues, and this is where quality indicators (QIs) can
provide a structure, organising framework and guidance mechanism for launchingthe improvement effort (Karon & Zimmerman 1996, p.65)
However, although some Australian RACS have developed QIs to gauge their ownactivity and in some cases to benchmark across RACS, there are no agreed QIsacross the industry sector, and while the accreditation process requires evidence ofCQI, it does not dictate what this evidence should be. Quality indicators
are not direct measures of quality in themselves: they are tools that can supportquality improvement (Thomson et al. 1997, p. 49)
Furthermore,
Indicators are seen as a guide to monitor, evaluate and improve services delivered.Indicators are neutral. Their sole purpose is to provide information (Harrigan 2000,p.163)
1. Introduction

Karon and Zimmerman (1996) argued that QIs could be used by staff to:
• compare their performance on key indicators with that of their peers or otherstandards;
• identify particular problem areas to target for quality improvement efforts;
• identify residents to review in order to help identify the types of qualityimprovements needed; and
• structure information to be used in identifying and monitoring quality of care issues.
The Center for Health Systems Research and Analysis (CHSRA) at the University ofWisconsin-Madison argues that QIs
… represent the first known systematic attempt to longitudinally record the clinicaland psychosocial profile of nursing home residents in a standardized, relativelyinexpensive and regular manner requiring the expertise of only in-housestaff…quality indicators are the starting point for a process of evaluating the qualityof care though careful investigation (www.chsra.wisc.edu)
QIs of care are used in RACS most notably in the United States, although theirdevelopment and use in other countries are expanding. Some of the domains thathave been included in QI sets include clinical, staffing, environmental, andconsumer satisfaction. Distinction has been made between QIs, quality measuresand clinical indicators. The primary focus of this project is with QIs which it isexpected will include predominantly indicators of clinical care quality – i.e. clinicalindicators. The purpose of this project is not to focus on QIs related to managementsystems. Quality measures require
clear agreement as to the acceptable level of outcomes, and the circumstancesunder which an undesirable outcome would be tolerated. The latter also requiresdetailed information about those circumstances (Zimmerman 2003, p 254)
While this may be an ideal for the future, the development of QIs is a first and moreachievable step in the CQI process.
1.2 Project aims and purpose The objective of this project was to identify and recommend a set of QIs to assist inmonitoring and improving the quality of care provided to residents by Victoria’spublic sector RACS. It is anticipated that the proposed set of indicators will be usedto monitor and report on major aspects of quality of care at the facility level. Theestablishment of a more comprehensive accountability framework related to qualityof care will enable RACS to trend their care performance over time, benchmarkagainst other services to identify both improvements in quality of care and targetspecific areas for improvement. Learning in relation to care management could bedisseminated across the sector and facilitate enhanced focus on issues consideredto be influential markers with respect to quality of care within a RACS. A stateddesire of the DHS was that any recommendations take account of accreditationstandards, and as far as possible, not add significantly to paperwork already requiredby RACS providers.
2 Public Sector Residential Aged Care

Quality of Care Performance Indicator Project Report 3
1 A Project Advisory Group was established by the DHS and comprised of 15representatives from public sector RACS, Aged Person’s Mental Health Services andthe DHS.
2 A literature review was undertaken to identify and investigate QIs currently used insimilar contexts.
3 Public forums were held to gain comment from stakeholders in relation to theapplicability and practicability of QIs, as well as to identify potential QIs of care,possible obstacles to implementation and strategies to overcome them.
4 Individual interviews were held with experts in the field of quality/clinical experts.
5 A consumer issues focus group was conducted.
6 Qualitative data from the forums, interviews and focus group were audio-taped andtranscribed for analysis.
7 Recommendations from all consultations were analysed in the context of theliterature and a set of criteria developed to formulate recommendations.
8 The Project Advisory Group and Project Team convened and discussed therecommended QIs and implementation strategy.
9 A set of QIs was recommended and an implementation strategy provided.
2. Project Methodology

A search of the computerised databases (Ageline, CINAHL, Medline, PsychInfo) wasconducted to locate relevant existing QIs and issues relating to quality measurementin healthcare. A search was also conducted via the Internet search engines Yahooand Google for details of QIs. The search term quality indicator, was combined withlong term care, residential aged care, and nursing home. Searches were restricted tothe English language and went back as far as 1990. An exception was a paper byDonabedian (1988), who was much referred to in the literature. A hand search ofreference lists from the journal articles was also conducted.
The review of the literature identified a number of significant areas around which thissection is organised:
• Defining quality of residential aged care
• Characteristics of quality indicators
• Australian studies into quality in RACS
• Some studies undergoing completion
• MDS derived quality indicators
• Validation of MDS quality indicators
• Mega QI and the public reporting of QIs
• Other QI sets
• Limitations of the MDS 2.0 QI set
• Consumer satisfaction and perceptions of quality of care
• Consumer input and health and human services
• Incorporation of QOL QIs into the RACS indicator suite
• Staffing issues
• Staff satisfaction and perceptions of quality of care
• Using QI information
Defining quality of residential aged care
Governments and service providers across the world are requiring services todemonstrate CQI and provide an evidence base for clinical decisions. Theaccreditation processes now in place for Australian RACS reflect this trend. It iswithin this environment that interest in QIs has developed. QIs have a number ofpotential applications, such as being:
• Part of a regulatory review process;
• Part of a facility’s quality assurance and improvement activities;
• The basis of research into care practices;
• The source of consumer information, and
• An aide for policy makers (Karon & Zimmerman 1998).
3. Literature Review
4 Public Sector Residential Aged Care

Quality of Care Performance Indicator Project Report 5
However, attempting to define quality care in RACS is complicated (Wiener 2003).The concept of ‘quality’ is multifaceted (Rantz 1999a, 1998, 1997). It is widelyrecognised that good performance on one QI does not guarantee an equally goodperformance on another QI (Mukamel & Brower 1998; Porell & Caro 1998).According to Zimmerman (2003), most attempts to categorise RACS care qualityinclude a variation of the following elements of care:
• Medical/clinical care
• Functional care, including three subcategories of physical, cognitive and emotionalfunctioning
• Psychosocial aspects of resident status, and
• Preservation of resident rights, such as dignity, privacy and autonomy.
This categorisation is reflected in examples of domains of quality that have beensuggested by a range of researchers and practitioners, including:
• Moxey et al. (2002) developed their own Quality Measurement Tool and ReportingFormat for long term care settings following a literature review and discussions withtheir Project Advisory Group. The domains arrived at were: organisational (e.g. staffing,accreditation), clinical (using MDS data), environmental (i.e. ambience, staff-residentinteractions) and social (e.g. resident, staff and family satisfaction, activities).
• Rantz et al. (1999a, 2000a, 2001a, 2002) developed a tool known as ObservableIndicators of Nursing Home Care Quality, intended to be used in conjunction withMDS assessments. Domains incorporated in this tool were: communication, care,environment, staff, and home/family.
• Glass (1991) in a literature review, identified the domains of staff intervention,physical environment, nutrition/food service and community relations as reflectiveof long term care quality.
• Gustafson et al. (1990) used an expert panel to identify the following domains:direct resident care (outcome), resident care (process), recreational activities, staff,facility, dietary and resident/community ties. These domains were incorporated toproduce a Quality Assessment Index (QAI).
Perceptions of the key dimensions of quality of care in RACS may differ betweenstakeholder groups. Stakeholder groups such as consumers, funders, provideragencies and professional clinicians do not necessarily agree on what constitutesgood performance (Pearson 2003). One of the key steps Rubin et al. (2001)advocated in the development and evaluation of process QIs was to ensure theparticipation of different groups of stakeholders.
Consumers (residents and relatives) and nursing staff were consulted in anAustralian study by Doyle and Carter (1992). In this study consumers suggested thatobjective indicators could be incorporated into the assessment of quality of care.Examples given of potential indicators included: the number of agency staff, numberof therapists employed, polypharmacy and staff turnovers.
Within staffing groups there may also be differing perceptions of what is a ‘good’indicator of quality care. Courtney and Spencer (2000) asked 36 RNs in QueenslandRACS to nominate which clinical indicators they deemed to be the most importantclinical indicators of high quality aged care. A clinical indicator was defined as “aperformance indicator that relates to the clinical practice of health care” (p.17).Twenty-six of the participants provided bedside care, and this group ranked theabsence of decubitus ulcers as being the most important medical condition. Theother ten participants were employed in managerial capacities and rated hydrationmanagement most commonly as being the most important clinical indicator inRACS. Polypharmacy was the clinical indicator that received the greatest agreementof importance between both groups, despite giving it different rankings.
Characteristics of quality indicators
Donabedian (1988) classified information about quality of care into three elements:structural, process and outcome. The three are theorised to be linked;
better structure and more appropriate processes are expected to yield betteroutcomes (Kane 1998 p.232).
In their paper, Spector and Mukamel (1998) presented studies that link process andstructural elements of care in RACS to outcomes. According to Donabedian (1988)each element has its own strengths and weaknesses with regards to assessingquality. As such, he advocated the inclusion of all three elements in any assessmentof quality framework. Doyle (1991) argued along a similar vein in her discussionsabout the then-used 31 outcomes standards for Australian RACS, asking why onlyoutcomes were used and not structures and processes as well.
Structural aspects of care settings include material resources (e.g. equipment,finances), human resources (e.g. staffing numbers and qualifications) andorganisational elements such as medical staffing organisation, peer reviewstrategies and reimbursement methods (Donabedian 1992). Despite Donabedian’srecommendation for their inclusion, structural indicators are not included in allstudies of QIs applicable to RACS. Saliba and Schnelle (2002) intentionally did notfocus on structural indicators (such as private rooms, arrangement of dining areas).Their rationale was that current knowledge and the variation amongst the nursinghome population precludes the ability to prescribe a set structural environment (Dayet al. 2000, cited in Saliba & Schnelle 2002). Mukamel (1997) suggested that the“quality of hotel services and living environment of nursing homes” (p.369), whichcould be classified as structural aspects, are able to be assessed by residents andtheir relatives, whereas quality of clinical care outcomes are not able to be assessedso easily. However this assertion is untested. Holtzman et al. (1997) reported thattwo drawbacks with assessing structural aspects of quality are that good structuresdo not necessarily result in a good outcome and the structure of a facility does notnecessarily reflect the care that an individual receives.
6 Public Sector Residential Aged Care

Quality of Care Performance Indicator Project Report 7
Despite this, there appears to be a current shift in the US towards structuralindicators, at least in terms of staffing issues. Among recent movements has beenthe California Nursing Home Search (CNHS) website (located at: www.calnhs.org)becoming the first in the US to list ratings of staffing levels (i.e. RN, LPN-LVN, CNA)and quality for individual nursing homes (Harrington 2003). Prior to developing thewebsite, a sample of 30 nursing facilities in Southern California was used to addressthe following two questions:
1.Do homes that score in the upper and lower 25 percentile of selected QIs andstaffing indicators provide different processes of care that reflect quality, and
2.What information about the indicator can be useful for consumers?
Process indicators capture information about the content, actions and proceduresconducted by the provider in response to the assessed condition of a resident.Outcome indicators capture information about how the resident fared in responseto the intervention provided, which is whether there was an improvement, nochange or a decline in their condition (Zimmerman 2003).
In the QI literature, a distinction is often made between what are called prevalenceand incidence indicators. Prevalence is the occurrence of cases over usually anextended period of time. Incidence is the occurrence of cases at a specific time, asnapshot. Another distinguishing characteristic of QIs is the level at which theyprovide information. Resident level QIs provide information about the presence orabsence of a condition in that resident. Facility level QIs allow comparison withother RACS or with population norms (Zimmerman et al. 1995). The focus of thisproject is on facility level QIs.
Australian studies into quality in RACS
The current Review found few published Australian research articles conducted intothis area. The potential to use QIs in Australian RACS was explored in 1991, whenDoyle presented a Working Paper which reviewed three methods for assessing thequality of long term care;
• criterion-guided assessment
• structured assessment protocols/written questionnaires
• assessment based on selected indicators
Doyle concluded that an advantage of using indicators is their efficiency in‘piggybacking’ existing data sources. For example, Doyle (1991) suggested that thePharmaceutical Benefits Scheme could be used to provide information about apolypharmacy indicator. A similar approach was actually investigated in anAustralian study by Robertson et al. (2002), which looked at whether routinelycollected Health Insurance Commission (HIC) data could be used to deriveprescribing indicators that would be useful for general practitioners.

A number of identified studies focused on the accreditation of Australian RACS. Thisincluded a comparison of approaches to quality improvement in Australian and UKnursing homes (Bartlett & Boldy 2001), in which it was noted that there is growinginterest in consumer satisfaction as an indicator of quality of care in assessments ofAustralian RACS. Another paper reviewed the implementation of the accreditationprocess of Western Australian RACS. While accreditation was generally supported,one specific concern was inconsistency and subjectivity with regard to the conductof the site audits and expectations of different standards (Grenade & Boldy 2002).
Braithwaite et al. (1992) critiqued the 31 outcome standards that at that time wereused to assess quality of care in RACS. The outcomes fell under seven domains:
1. Health Care
2. Social Independence
3. Freedom of Choice
4. Homelike Environment
5. Privacy and Dignity
6. Variety of Experience
7. Safety
In their discussion, Braithwaite et al. (1992) noted that one criticism of theobjectives was that they were not objective enough.
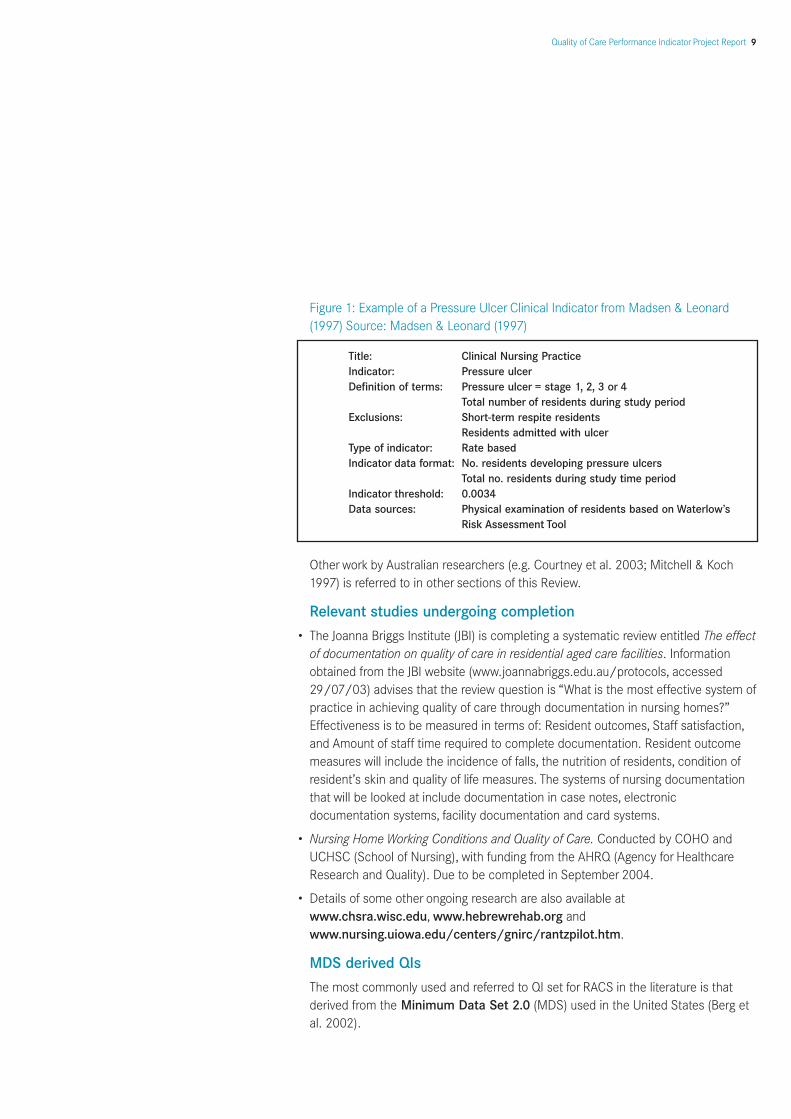
A Queensland study (Madsen & Leonard 1997) focused on the development of aclinical indicator for pressure ulcers. Subjects were 117 residents drawn from oneRACS. Nurses categorised each resident’s risk of developing a pressure ulcer usingWaterlow’s Pressure Sore Risk Adjustment Tool. For any residents with existingpressure ulcers, the stage of tissue breakdown was noted. Mobility and continencestatus of all residents was collected and short stay residents were excluded. It wasfound that although many of the residents were at risk of developing a pressureulcer (53.8% fell into the highest risk category), the actual incidence of pressureulcers was low (only four residents actually showed a breakdown in skin integrity).The authors concluded that using the Tool is clinically relevant, as well as beingvaluable to staff and providing a convenient data bank about quality care. From theirwork they derived the following Pressure Ulcer Indicator (see Figure 1).
8 Public Sector Residential Aged Care
Quality of Care Performance Indicator Project Report 9
Figure 1: Example of a Pressure Ulcer Clinical Indicator from Madsen & Leonard(1997) Source: Madsen & Leonard (1997)
Other work by Australian researchers (e.g. Courtney et al. 2003; Mitchell & Koch1997) is referred to in other sections of this Review.
Relevant studies undergoing completion
• The Joanna Briggs Institute (JBI) is completing a systematic review entitled The effectof documentation on quality of care in residential aged care facilities. Informationobtained from the JBI website (www.joannabriggs.edu.au/protocols, accessed29/07/03) advises that the review question is “What is the most effective system ofpractice in achieving quality of care through documentation in nursing homes?”Effectiveness is to be measured in terms of: Resident outcomes, Staff satisfaction,and Amount of staff time required to complete documentation. Resident outcomemeasures will include the incidence of falls, the nutrition of residents, condition ofresident’s skin and quality of life measures. The systems of nursing documentationthat will be looked at include documentation in case notes, electronicdocumentation systems, facility documentation and card systems.
• Nursing Home Working Conditions and Quality of Care. Conducted by COHO andUCHSC (School of Nursing), with funding from the AHRQ (Agency for HealthcareResearch and Quality). Due to be completed in September 2004.
• Details of some other ongoing research are also available atwww.chsra.wisc.edu, www.hebrewrehab.org andwww.nursing.uiowa.edu/centers/gnirc/rantzpilot.htm.
MDS derived QIs
The most commonly used and referred to QI set for RACS in the literature is thatderived from the Minimum Data Set 2.0 (MDS) used in the United States (Berg etal. 2002).
Title: Clinical Nursing Practice Indicator: Pressure ulcerDefinition of terms: Pressure ulcer = stage 1, 2, 3 or 4
Total number of residents during study period Exclusions: Short-term respite residents
Residents admitted with ulcerType of indicator: Rate based Indicator data format: No. residents developing pressure ulcers
Total no. residents during study time period Indicator threshold: 0.0034Data sources: Physical examination of residents based on Waterlow’s
Risk Assessment Tool

The MDS QIs were developed by the Center for Health Systems Research andAnalysis (CHSRA) and the University of Wisconsin-Madison (Zimmerman et al.1995). The MDS 2.0 is an assessment tool designed to capture uniform informationon all nursing home residents (Harris & Clauser 2002), and is completed for allresidents upon admission to an aged care facility, and then quarterly thereafter or inresponse to a substantial change in condition (Zimmerman 2003). The MDS is acomponent of the Resident Assessment Instrument (RAI) (Hawes et al. 1997).Further information about the MDS and RAI is available in papers such as Rantz etal. (1999b) and Phillips et al. (1997). Since 1998, the Centers for Medicare andMedicaid Services (CMS) have required nursing homes to electronically submit MDSdata collected. CMS then uses the MDS data to derive information about QIs(Wiener 2003).
On 2nd April 2003 a draft version of MDS 3.0 was released (a working copy isavailable from the CMS website, http://www.cms.gov/quality/nhqi). Thecurrently used MDS 2.0 is available in 6 versions, the most commonly used versionbeing 6.3 which contains 24 QIs for use in nursing homes that fall under 12 domains(http://www.chsra.wisc.edu) (see Appendix 11.1).
Validation of MDS QIs (independent to the developer’s validationstudies)
The following section provides a review of papers identified which have conductedvalidity studies of some MDS 2.0 QIs, independent of the developer’s validationstudies. The first five papers (Schnelle et al. 2003; Simmons et al. 2003; Bates-Jensen et al. 2003; Cadogan et al. 2004; Schnelle et al. 2004), used care processesderived from the Assessing Care of Vulnerable Elders (ACOVE) project to test theassumption of the MDS QIs, which is that
differences in scores reflect real differences in the quality of related care processes(Schnelle et al. 2003, p.910).
The format used in the five studies was to use ACOVE-developed care processesand compare them in facilities where residents scored in the lower quartile for theQI of interest on the most recent MDS assessment, against facilities which scored inthe upper quartile.
The findings have been mixed. Bates-Jensen et al. (2003) investigated whether theMDS Pressure Ulcer QI reflected differences in care processes related to pressureulcer prevention and treatment in nursing homes. It was found that nursing homesthat scored low (i.e. had few pressure ulcers) did not necessarily provide better carethan nursing homes which performed badly on the QI. One limitation of the studyhowever, was that the researchers did not include facilities that scored high and lowon pressure ulcer prevalence in high-risk and low-risk residents, as determined bythe MDS. A reason given was that “risk adjustments are controversial” (p.1211).Similarly, Schnelle et al. (2003) investigated whether the MDS urinary incontinenceQI reflects differences in care processes, and concluded that this QI does not reflectdifferences in quality of incontinence care.
10 Public Sector Residential Aged Care
Quality of Care Performance Indicator Project Report 11
Conversely, Simmons et al. (2003) concluded that the MDS QI does differentiatebetween nursing homes with a lower prevalence of weight loss than those with ahigher prevalence. Verbal prompting and social interaction with meals was one careprocess that consistently distinguished low weight loss nursing homes from highweight loss nursing homes. The study used an observational protocol for feedingassistance developed by Simmons et al. (2002), from which data collected could bereported as a QI score.
Cadogan et al. (2004) investigated whether the MDS prevalence of pain QI reflecteddifferences in care processes. They found that the QI was accurate in discriminatingbetween prevalence of pain in nursing homes scoring in the lower pain quartileversus nursing homes scoring in the upper pain quartile. More interestingly however,it was found that on every measure of pain-related quality of care evaluated by thestudy (detection, assessment, treatment and documentation of treatmentresponse), performance was better in nursing homes that had high reports of painprevalence. This suggests that the prevalence of pain QI (where a high scoredenotes a high prevalence of pain), rather than indicating poor quality of care, maybe in fact associated with better pain assessment and treatment care processes.
A fifth independent evaluation of a MDS QI was conducted by Schnelle et al.(2004), who investigated whether the prevalence of physical restraint QI reflectsdifferences in care. It was found that this MDS QI is not an accurate measure ofrestraint use as it only measured restraint use when the resident was out of bed anddid not include the use of bedrails. “The observational data did not agree with the[MDS] prevalence rates and the extent of the disagreement depended on thedefinition of restraint use” (Schnelle et al. 2004, 252).
Zisselman et al. (2002) conducted a preliminary study to assess the validity of theMDS depression without treatment QI and whether staff education would improvethe accuracy of responses to the QI. Staff received education about psychotropicdrugs and differentiating between apathy associated with dementia and negativesymptoms of schizophrenia. Zisselman et al. (2002) made the point that the MDS QI‘Depression without treatment’ does not “acknowledge nonpharmacologictreatment modalities for depression” (p. 44), such as Electro-convulsive Therapy(ECT) and psychotherapy. They further note that this QI does not address dosingadequacy or effectiveness.
Schnelle et al. (2001) looked at the prevalence MDS QI for depression. Two siteswere selected; one of which was flagged by the MDS as having an unusually lowdepression prevalence, the other as having an unusually high depression prevalence.However, after applying the Geriatric Depression Scale (GDS), the research team didnot find any significant differences between the two sites. It was concluded thatprevalence of depression, as measured by the MDS, may be more reflective of staffability to detect depression symptoms, than of actual depression prevalence anddifferences in care processes. The authors again recommended staff training toassist them recognise depression symptoms.

Mukamel et al. (2003) developed a risk-adjusted urinary incontinence QI derivedfrom the MDS, for residents of aged care facilities. Other studies have providedevidence of the MDS urinary incontinence QI to distinguish between continent andincontinent residents, however they also reveal that there is scope for inaccuraciesin the reporting of the severity of incontinence. For this reason, Mukamel et al.(2003) elected to base their outcome on change in the resident’s urinaryincontinence status, as opposed to level of urinary incontinence.
Mega QIs and the public reporting of QIs
In 1998, CMS launched its Nursing Home Compare website (www.medicare.gov/nhcompare/home), to make public to consumers various aspects concerning thequality of residential aged care. In 2001, it was announced that the website wouldpublish information to enable consumers to compare nursing homes. One of theissues in publishing collected information of QIs was deciding which QIs topublicise. This led to CMS contracting the services of Abt Associates and theNational Quality Forum (NQF) (Sprague 2003).
Abt conducted a review of existing QIs (Abt Associates Inc. 2001a), and identified143 QIs, 44 of which underwent empirical analysis. This included all of the CHSRAQIs, as well as QIs from other sources. Following the literature review, additional QIswere developed to ‘fill-in’ for any ‘gaps’ – i.e. where certain aspects of care were notbeing addressed by the existing QIs (Abt Associates Inc. 2003). These 15 newlycreated QIs became known as Mega QIs. The existing QIs and the Mega QIs wereput forward for validation testing. Of the 15 QIs considered, 8 were relevant tochronic care and 7 to post acute settings.
NQF then reviewed Abt’s findings to (a) recommend a set of QIs appropriate for usein the six state pilot program and (b) develop a set of quality measures (QMs) to beused nationally (Sprague 2003). Care outcomes are publicised in terms of QMsthrough the CMS Nursing Home Compare website. The rationale for reporting QMsas opposed to QIs is that CMS believes the new measures have been sufficientlyvalidated and thus can be termed measures, compared with QIs, that are used aspointers to potential problems (Manard 2002). Thus, by definition, QMs are appliedwhen it is certain that there is a problem and are used to identify the aspects ofcare that are deficient (Zimmerman 2003) and have undergone validation andreliability tests (Sprague 2003).
On 3rd October 2003, a press release announced the endorsement of a set ofNursing Home Performance Measures, designed to assist consumers in theirselection of nursing homes. This set comprised of seven chronic care measures, twochronic care measure pairs, three post-acute care measures and two measures tobe used in all facilities.
12 Public Sector Residential Aged Care

Quality of Care Performance Indicator Project Report 13
The seven chronic care measures endorsed were:
• Residents whose need for more help with daily activities has increased
• Residents who experience moderate to severe pain
• Residents who were physically restrained during the seven-day assessment period
• Residents with a decline in their ability to move about in their room or the adjacentcorridor
• Residents with a urinary tract infection
• Residents with worsening of a depressed or anxious mood
Two chronic care measure pairs were also endorsed, which should not be pursuedindependent of each other:
• High-risk residents with pressure ulcers AND average-risk residents with pressureulcers
• Residents who frequently lose control of the bowel or bladder (low-risk) ANDresidents who have a catheter in the bladder at any time during the 14-dayassessment period.
The two measures applicable to all facilities were:
• Pneumococcal polysaccharide vaccination of residents age 65 or older
• Influenza vaccination for all nursing home residents
Other QI sets
QI set developed by Grant et al. (1996) Grant et al. (1996) developed QIs of nursing home care, as perceived by residents,significant others and staff. An indicator was defined as ‘a factor which is useful toshow quality of care as defined by a specific population’ (p. 471). Participantsdescribed an incident about the care that they liked best and one that they likedleast, from which themes were identified and translated into indicators (Appendix11.2). A limitation of these QIs is that they are not quantified. For example the firstindicator “nature of the facility” does not even have any sub-indicators and couldrefer to a vast range of elements concerning the facility. Furthermore, as the authorsnoted, weighting of QIs in terms of most critical, validation of QIs, and replication ofresults is lacking.
International Quality Indicator Project (IQIP) The aim of the IQIP is to identify the more frequent, significant and representativeelements of care provided by four health settings, namely hospitals, psychiatricinstitutions, nursing homes or home care agencies (Kazandjian et al. 2003). Much of the information regarding the Project came from two websites:(www.internationalqip.com and www.qiproject.org). Participation in the Projectis through paying a fee, that enables users access to a password protected website,where they can enter their data and receive a quarterly performance report.

Participants can chose from four sets of indicators which each correspond to a caresetting; acute care, psychiatric care, long term care and home care. The long termcare set contains six domains of QIs (Appendix 11.3).
The specifics and outcomes of validating the QIs are not outlined on the websites(although queries to the research department are invited), however the generalmethods used in testing potential QIs are listed as involving literature searches,expert panels and pilot tests amongst health care providers.
In summary, of all of the QI developments for RACS, the MDS 2.0 set appears to bethe most widely used and validated – although not without its limitations.
Limitations of the MDS 2.0 QI set
Whilst not a criticism per se of the MDS 2.0 QIs, it is interesting that structuralindicators are not included in the set. In the paper which describes the developmentof the initial set, Zimmerman et al. (1995) wrote:
To fully measure quality of care requires a complete accounting of the interplayamong structural, process and outcome measures (p. 110).
Later in the paper however, it is commented that:
The QIs were designed to cover both process and outcome of care… (p. 111).
Criticism also has been levelled against the MDS 2.0 QI set for its reliance onclinical aspects of quality of care. Saliba and Schnelle (2002) argued that whilst theMDS measured levels of ADL needs, it neglected to take into account the degreethat needs were met on a daily basis. As such, they identified a need for a“residential care” domain, which would acknowledge the nursing home as beinghome to residents, daily interactions between staff and resident, residentpreferences etc. Using a review of the literature and reference to an expert panel,they developed a set of QIs (see Appendix 11.4) for use in nursing homes, intendedto complement the MDS QI set. The is set reported to be an attempt to
contribute to the literature that seeks to move quality discussions beyond generaldescriptions of quality of life and toward more specific items that might bemeasured and improved (p. 1425).
Whilst not referring to the MDS QIs or any specific “service evaluation”, Marquis(2002) suggests that the complexity of defining quality may explain why suchevaluations
typically concentrate on tangible, material, quantifiable components and overlookthe more subjective aspects of service life or ‘what it’s like’ to live in a service(p.25).
The need for a greater focus on more than clinical aspects of quality of care has notgone unnoticed however (Mor et al. 2003). Kane et al. (2003) were funded by CMSto develop quality of life (QOL) measures that were not captured or explicitlyemphasised in the current version of the MDS 2.0. The researchers developed QOL
14 Public Sector Residential Aged Care

Quality of Care Performance Indicator Project Report 15
scales using the 11 domains suggested by Kane (2001); sense of security, physicalcomfort, enjoyment, meaningful activity, relationships, functional competence,dignity, privacy, individuality, autonomy/choice and spiritual wellbeing. Thesedomains were developed using a review of the literature, expert opinion, focusgroups and stakeholder consultation.
Adoption of a ‘comfort domain’ in the MDS was recommended by Bowers et al.(2001). Bowers et al. conducted in-depth interviews that were analysed usinggrounded dimensional analysis, to investigate how residents defined quality. Theauthors concluded that the MDS QI set
does not acknowledge the complexity of quality as it is experienced by nursinghome residents (p.544).
The closest category in the MDS 2.0 QIs for ‘comfort’ is ‘pain’, prompting Bowers etal. to recommend that a ‘comfort domain’ be incorporated into the MDS QI set. Thecomfort domain suggested by Kane (2001) included, in addition to pain, discomfortssuch as being too hot or cold, or being uncomfortably positioned.
Kane (2001) noted that the domains they identified were not exhaustive, whichunderlines one of the issues in measuring QOL; lack of consensus over a definition.Courtney et al. (2003) conducted a review of QOL tools and concluded that there isa need for a measure specific to RACS in Australia and that one of the practicalconsiderations in developing such a tool would be arriving at QOL definitions manyagree with.
However, even once a definition is agreed upon, there still remains the issue of howbest to elicit QOL information from residents of RACS. Mitchell and Koch (1997)attempted “to give nursing home residents a voice in the quality improvementprocess” (p.453). They found however that out of the 32 residents in the RACS, 78%had dementia, with only seven residents being classed as articulate. Two methodsused to obtain information were asking significant others and during the negotiationperiod, reading out relevant sections of transcripts from interviews with residents atstakeholder meetings. However, whilst the latter strategy does provide residents witha ‘voice’, it also raises potential confidentiality issues, if stakeholders recognise whothe transcripts originated from. Another study, by Kane (2003), suggested fourmethods for assessing QOL in nursing home residents:
1. through directly asking residents;
2. through proxy informants, such as staff or family members;
3. through inferences made from resident’s behaviour, and
4. through collecting information regarding the physical, social and care environment,deemed to be associated with QOL.
In addition to older age, poorer ADL functioning, and longer length of stay, it wasfound that MDS cognition score was strongly linked to ability to complete the QOLquestionnaire (Kane et al. 2003). Similarly, Simmons and Schnelle (2001) found that
the MDS-derived cognitive status score is an excellent predictor of the accuracy of aresident’s self-report of care received. They concluded that given care documentedon charts is not always what was actually received by the resident, this implies thatnursing home care quality should be assessed using a number of strategies, such asresident self-report.
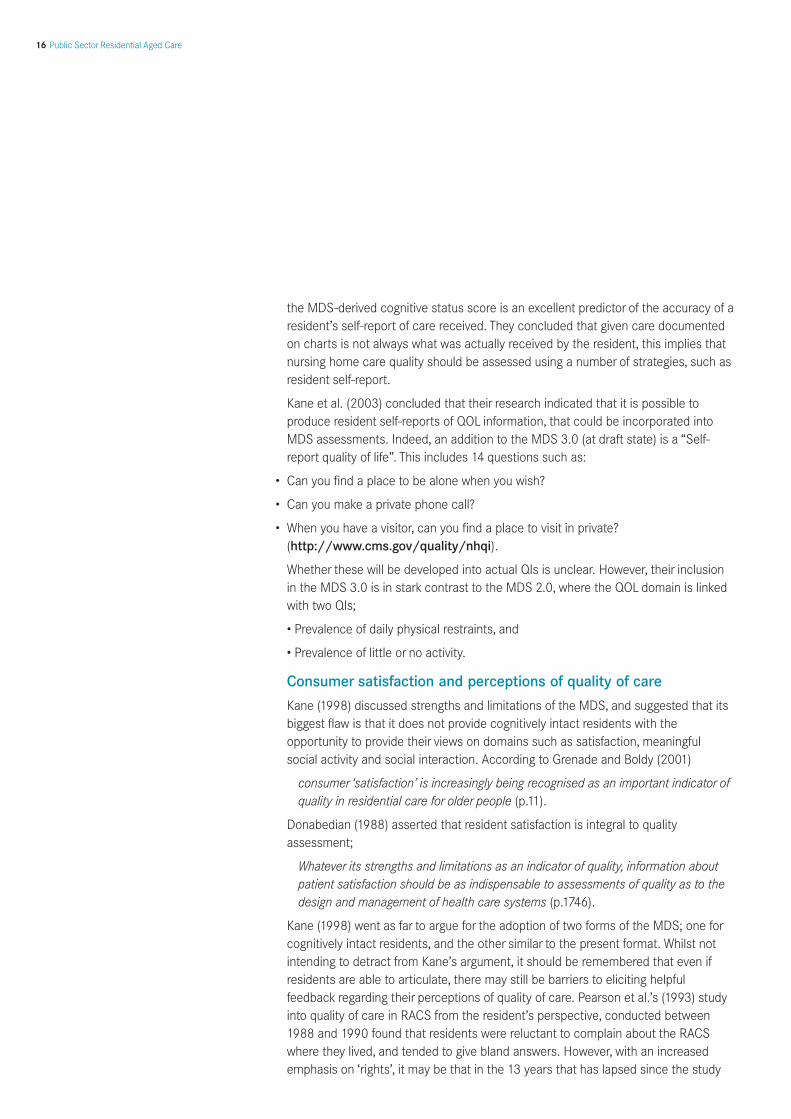
Kane et al. (2003) concluded that their research indicated that it is possible toproduce resident self-reports of QOL information, that could be incorporated intoMDS assessments. Indeed, an addition to the MDS 3.0 (at draft state) is a “Self-report quality of life”. This includes 14 questions such as:
• Can you find a place to be alone when you wish?
• Can you make a private phone call?
• When you have a visitor, can you find a place to visit in private?(http://www.cms.gov/quality/nhqi).
Whether these will be developed into actual QIs is unclear. However, their inclusionin the MDS 3.0 is in stark contrast to the MDS 2.0, where the QOL domain is linkedwith two QIs;
• Prevalence of daily physical restraints, and
• Prevalence of little or no activity.
Consumer satisfaction and perceptions of quality of care
Kane (1998) discussed strengths and limitations of the MDS, and suggested that itsbiggest flaw is that it does not provide cognitively intact residents with theopportunity to provide their views on domains such as satisfaction, meaningfulsocial activity and social interaction. According to Grenade and Boldy (2001)
consumer ‘satisfaction’ is increasingly being recognised as an important indicator ofquality in residential care for older people (p.11).
Donabedian (1988) asserted that resident satisfaction is integral to qualityassessment;
Whatever its strengths and limitations as an indicator of quality, information aboutpatient satisfaction should be as indispensable to assessments of quality as to thedesign and management of health care systems (p.1746).
Kane (1998) went as far to argue for the adoption of two forms of the MDS; one forcognitively intact residents, and the other similar to the present format. Whilst notintending to detract from Kane’s argument, it should be remembered that even ifresidents are able to articulate, there may still be barriers to eliciting helpfulfeedback regarding their perceptions of quality of care. Pearson et al.’s (1993) studyinto quality of care in RACS from the resident’s perspective, conducted between1988 and 1990 found that residents were reluctant to complain about the RACSwhere they lived, and tended to give bland answers. However, with an increasedemphasis on ‘rights’, it may be that in the 13 years that has lapsed since the study
16 Public Sector Residential Aged Care

Quality of Care Performance Indicator Project Report 17
was completed, that residents may be more likely to offer insightful and criticalfeedback about their ‘home’. Conversely, the increased prevalence of dementia inRACS in Australia suggests that any resident experience survey would need to relyheavily on proxies.
Casarett et al. (2002) investigated whether satisfaction with a particular area of care(pain management) is a valid and reliable QI amongst nursing home residents.Findings of the cross-sectional interview study were that satisfaction with painmanagement is stable over time in this population, as well as being weakly inverselycorrelated with pain severity. This was true even for residents with a Mini MentalState Examination (MMSE) score of less than 21. Cognitive status can impact on aresident’s likelihood of reporting pain, as Fries et al. (2001) found in their study thatdeveloped and validated a pain scale based on MDS items, for nursing homepopulations. They noted that the percentage of residents who reported they did nothave pain, increased rapidly with increasing impaired cognition.
Casarett et al. (2002) presented several cautions about the findings from theirsatisfaction with pain management study:
• The stability of satisfaction raises questions about the responsiveness of thetechnique;
• Pain severity and pain satisfaction were inversely correlated only in residents withsevere pain, raising questions about the applicability to residents with mild pain, and
• There was an inverse significant relationship between pain satisfaction ratings andGlobal Depression Scale (GDS) scores, which reinforces that measures ofsatisfaction should always take into account the possible presence of depression.
One tool that has been employed by some researchers to gauge residentsatisfaction is the Satisfaction with Nursing Home Scale (SNHS). Mattiasson andAndersson (1997) modified McCaffree and Harkins’ (1976) SNHS, by addingadditional single item questions. The Scale was used as an indicator of residentautonomy, and quality of care was defined as the “discrepancy between level of[resident] perceived autonomy and institutional possibility” (p.1117). Included in thetool were measures of security, social relations, activities and routine. Findings againrecommended that resident’s perceptions of quality of care be taken into account.
The SNHS was also used in a longitudinal study by Yeh et al. (2003), which looked atresident satisfaction and clinical outcomes as indicators of quality of care in nursinghomes in Taiwan. Resident satisfaction was assessed using the SNHS during fourinterviews; initial, 3 months, 6 months and 12 months. Results indicated thatresidents consistently found nursing home life monotonous, failed to meet theirpreconceived expectations and that they did not receive adequate privacy.
The ability of residents of long-term care facilities to exercise autonomy and choicewas the focus of a report by Polivka and Salmon (2001) of the Florida PolicyExchange Center on Aging. Providing the consumer with autonomy is said to belargely denied by long-term care:

The implicit assumption of most long-term care programs for the frail elderly is thatthey must sacrifice their autonomy – their ability to exercise sufficient choice – as acondition of receiving care (p.3)
However,
The limited research done on the importance of choice and control to recipients oflong-term care services indicates that a substantial percentage want greater controlover the delivery of care and that the ability to exercise choice and control greatlyaffects the recipient’s perceived quality of life (p.37)
This desire for more control was also noted by an earlier study conducted by Kaneet al. (1997). The study investigated the importance that nursing home residents andnursing assistants (NA’s) place on residents having control and choice over day-to-day issues and the level of satisfaction residents had with their level of perceivedcontrol. Both groups viewed choice and control as very important to residents.However, the groups differed significantly in terms of the importance placed onhaving control over use of the telephone and mail (NA’s placed less importance),nursing home activities (NA’s placed more importance) and visitors (NA’s placedmore importance). Satisfaction with level of perceived control and choice amongstresidents however was very low, with residents desiring greater control and decisionmaking potential.
Information is available on the Internet to assist consumers in making their ownassessments of indicators of quality. The most prominent example is the CMSNursing Home Compare website (Wiener 2003), as mentioned earlier in this Review.The California Nursing Home Search website also mentioned earlier in this Reviewhas a section labelled “Quality Indicators”. Other examples include checklists putout by some organisations (e.g. British Columbia Ministry of Health and MinistryResponsible for Seniors, ElderCare Online, California Advocates for Nursing HomeReform) which comprise of questions to ask and things to observe when viewing aprospective aged care facility. Furthermore, according to Kaplan (2002), consumersare now able to approach facilities directly and ask for a copy of their QI report,which provides performance scores based on the MDS QIs.
Consumer input and health and human services
The last two decades have seen a widespread international and Australiancommitment towards “giving voice” to consumers in the design and delivery ofhealth and human services. A key event in the progress towards the incorporation ofconsumer input into service delivery occurred when the United Nations Assemblypassed a Resolution concerning consumer rights on 9 April 1985. The followingrights were endorsed:
• The right to safety
• The right to be informed
• The right to choose
18 Public Sector Residential Aged Care

Quality of Care Performance Indicator Project Report 19
• The right to be heard
• The right to satisfaction of basic needs
• The right to redress
• The right to consumer education
• The right to a healthy environment
This statement has been at the foundation of the enshrinement of such rights in awide range of legislation and in service standards and statements of serviceprinciples in the delivery of health and human services.
Another highly significant piece of work in this area was the 1998 report of PresidentClinton’s Advisory Commission on Consumer Protection and Quality in the HealthCare Industry (http://www.hcqualitycommission.gov). This was and is a veryimportant review of consumer issues in the health industry. It asserted the rights ofconsumers:
• To receive accurate easily understood information
• To choice
• To fully participate in all decisions
• To considerate, respectful attention
• To a fair and efficient process for resolving differences
• To assume reasonable responsibilities for their own care
The consumer “voice” imperative is now included in many consumer charters wherethe rights and responsibilities of consumers are formally stated as a commitment bythe facility as to how it is to conduct its business with its consumers.
The issue arises then as to what should be collected routinely from consumers andcarers? There are two main candidate domains. The first of these domains is healthrelated QOL measures and the second domain is consumer experience andsatisfaction measures. Health related QOL measures seek to determine the healthrelated QOL status of people. Most health and human services have at their basethe goal of maintaining the maximum possible well being of their consumers. Healthrelated QOL measures directly address the measurement of the effectiveness withwhich this goal has been achieved. As presented in the following section of thisReview, the incorporation of health related QOL measures into clinical effectivenessoutcome measurement suites is a common approach in recommended national andinternational protocols.
Consumer and carer satisfaction and experience measures seek to determine theexperiences that they have had with the service delivery and their view of them. Theincorporation of consumer and carer experience tools into quality monitoring ofhealth and human services is also becoming routine.

Incorporation of QOL QIs into the RACS indicator suite
Thomas et al. (2004) were commissioned by the Australian Government torecommend a suite of continence outcome measures to be used by clinicians andresearchers in Australia. The recommended suite includes health related QOLmeasures as a key component and built upon work conducted internationally in thisfield.
The World Health Organization (WHO) in association with the InternationalContinence Society (ICS) hosted two international consultations on incontinence in1998 and 2001 in which important determinations were made concerning outcomesmeasurement. The WHO report recommended the inclusion of both generic andcondition specific QOL measures as a way of ensuring that consumers hadadequate input into consideration of the effectiveness and efficiency of the servicesprovided to them.
Both the Australian study and the WHO/ ICS study recommended the use of theSF-36 tool. This tool is now widely used in health service and clinical research. A fullreview of the tool is provided in Thomas et al. (2004). It must be noted that this toolwas not designed for RACS consequently many of the questions are not relevant aswritten and responses would rely on proxies.
Staffing Issues
Many papers identified in the current literature search referred to the role staffingand related issues play in quality of care. Teal (2002) presented a ‘consumer’sperspective’, in which she noted that the majority of calls received by an advocacyorganisation for “long-term aged care residents”, are concerned with staffing issues,in particular staff levels, inadequate training or high turnover rates. Kovner et al.(2000) listed 12 research priorities relating to staffing, case mix and quality of carein U.S. nursing homes. These included looking at the relationship between staffeducation/training and resident outcomes, what is the appropriate staff mix andestimates of the time taken to perform basic nursing activities at a high level ofquality. A report funded by CMS found that staffing levels are associated with qualitycare, however there is a threshold above which more staff were not associated withfurther benefits. Once this threshold is reached, it was found that other issuesrelating to staffing, such as practices and management, were the majordeterminants of quality care (Abt Associates Inc 2001b).
Staffing turnover and retention Whilst staffing levels are linked with quality of care, other staffing factors, such asturnover and retention rates, are also important determinants of quality care (AbtAssociates Inc. 2001b). Sheryl Zimmerman and colleagues (2002) found that RNturnover was significantly associated with infection rates in nursing home residentsand infection-related hospitalisation.
20 Public Sector Residential Aged Care

Quality of Care Performance Indicator Project Report 21
Castle (2001) provided “preliminary evidence that the turnover of administrators ofnursing homes may have an important influence in the quality of care” (p. 765). Hisstudy investigated the relationship between the turnover of nursing administratorsand five quality of care outcomes (restraint use, pressure ulcers, urethralcatheterisation, psychoactive drug use and nursing home code violations). A surveyof 420 nursing homes and the 1999 On-Line Survey, Certification and Reporting(OSCAR) System was used. For nursing homes belonging to chains, all, bar one ofthe quality of care outcomes (proportion of residents restrained) were significantlyassociated with nursing administrator turnover. Also, for nursing homes that werenot affiliated with chains, all but one of the care outcomes were significantlyassociated with nursing administrator turnover, the non-significant association beingwith the proportion of quality of care deficiencies. Furthermore, it was found that asnursing administrator turnover increased, the association with dependent variableslikewise increased.
Interestingly, in their study, Brannon et al. (2002) assumed that neither high (75th-100th percentile) or low (0–10th percentile) nursing assistant (NA) turnover isoptimal, therefore these two categories were compared against a more ideal middlereferent (11th–75th percentile). The study was conducted to explore which job,organisational and environmental factors were associated with high and low NAturnover in nursing homes. The authors concluded factors associated with highturnover of NAs are different to factors associated with low turnover, with theexception of a linear relationship found to exist between RN turnover rate and NAturnover rate in both types of facilities. The authors did note however, that the notionof assuming that neither very high nor very low turnover is desirable, is anexploratory approach.
Other staffing issues related to quality of care Wiener (2003) presented a discussion of issues relating to staff training, wages andworking conditions. A report by Biles et al. (2003) summarised some of the work todate, with respect to quality, staffing and payment of nursing homes. Bowers et al.(1992) found that many of new nurses aides interviewed in their study have beentaught tasks, yet had received minimal advice about how to integrate the tasks once‘on their own’. Bowers et al. (1992) reported that the findings supported Litwak’shypothesis that NA’s who are economically motivated provide poorer quality care bycutting corners. Alternatively, NAs who are affectively motivated may choose to quitif they are unable to organise their time in a manner that enables them to providewhat they perceive to be good quality care.
Staff satisfaction and perceptions of quality of care
Schirm et al. (1999) investigated how nursing staff (NAs and Licensed Nurses)defined quality of care in nursing homes, within the context of the structure, processand outcome framework. Analyses of narrative statements from staff indicated thatthey perceived structural elements important to quality of care as being staff

teamwork, time for extras for the resident and the availability of staffing andresources. Process elements of care seen as important to quality care wereresident-staff relationships, acknowledging the resident as a person, the nature ofstaff-resident communication and technical aspects of care. Outcome elementswere resident satisfaction, resident health and mental status, family satisfaction andstaff satisfaction.
Bowers et al. (2000) found that when defining quality, NAs focused on the quality ofrelationships between resident and staff and how care was delivered, rather than onspecific outcomes, such as measured by the MDS QIs. A similar focus on staff-resident relationships was seen in a Western Australian study. Marquis (2002)conducted interviews with residents and aged care workers at seven RACS inWestern Australia to examine the manner in which day-to-day interactions betweenstaff and residents influence resident perceptions of the quality of the care theyreceived. A study conclusion was that quality assessments of RACS should includean evaluation of daily staff-resident interactions, as current procedures neglect toaddress relational deprivation and abuse.
Another Western Australian study investigated the application of the Measure of JobSatisfaction (MJS) instrument in RACS. Chou et al. (2002) examined the factorstructure of the MJS and assessed the validity and reliability of the instrument inRACS. Five elements were found to be linked with staff satisfaction; personalsatisfaction, workload, team spirit, training and professional support. Theresearchers concluded that the MJS is a valid and reliable tool, and may beappropriate for further research examining the link between staff and residentsatisfaction.
Interestingly, Berlowitz et al. (2003) found staff at RACS who had taken on qualityimprovement programs reported being significantly more satisfied with their jobscompared with staff from RACS who had not adopted similar programs. The authorshypothesised that the reason for this relationship was that
QI [quality improvement] implementation may enhance satisfaction by empoweringemployees to be more active in daily care decisions. (p.79)
Using QI information
There exists extensive literature on implementing change generally that has notbeen reviewed for this Project but that could inform any future implementationstrategy. Specifically in relation to using QIs, Popejoy et al. (2000) investigated howmuch support facilities require to utilise information about MDS QIs and the extentto which a Gerontological Clinical Nurse Specialist (GCNS) would be helpful inreviewing, interpreting and implementing changes specified in the QI reports. Therewas a tendency for facility administrators to interpret poor QI scores as codingerrors, whereas Directors of Nursing (DONs) tended to perceive them as reflectingthe true state of events. Some staff did not see the value of the QI reports. TheGCNS was perceived as an ally by some facilities, who eagerly accepted any quality
22 Public Sector Residential Aged Care

Quality of Care Performance Indicator Project Report 23
improvement strategies, based on their QI reports, which were offered by the GCNS.A randomised clinical trial conducted by Rantz et al. (2001b) provided furtherrecommendation that a GCNS is beneficial in assisting facilities utilise QI feedbackto improve resident outcomes.
Rantz et al. (2000b) proposed that staff would be more able to use QI data when itwas presented in conjunction with meaningful thresholds. A concern was thatsimply comparing a single facility’s QI performance with relative standards (e.g.statewide averages, medians and percentile rankings) may give false feedback ofquality. For example, whilst not empirically explored, a potential problem may be ifmany aged care facilities were performing poorly, thereby lowering the ‘bar’ ofcomparison. The study involved the convening of an expert panel and single-roundDelphi to derive appropriate thresholds for all of the MDS QIs that were thendisplayed in a user-friendly format. For example, staff would be made aware that forQI 6 (“use of nine or more different medications”) the following would apply;
Lower threshold (good score): fewer than 13% of residents should be taking nineor more different medications.Upper threshold (poor score): this would be indicated by 30% or more residentstaking nine or more different medications.
In his editorial, Schnelle (1997) presents three assumptions that are warranted ifchanges in processes and outcomes have occurred as a result of the MDS:
1. It must then be assumed that residential aged care providers are aware of how tochange processes in a manner that affects outcomes
2.It must be assumed that residential aged care staff have the resources to provideeffective care processes
3.It must be assumed that what is documented in care plans and medical records ismore than just paper compliance; i.e. the resident has actually received the care.
Summary
Whilst quality in aged care has been a focus for some time in Australia, there isclearly a need both for the development of a set of QIs and a QOL tool with crediblepsychometric properties and are appropriate to Australian RACS. It is also clear thatmeaningful consumer input should be integral to the development of QIs for RACS.Setting thresholds for the QIs appears beneficial for staff in using the QIs to improvecare, however it does rely on the availability of valid, reliable data regarding ‘best’practice. In summary, the key findings of the literature review are as follows:
• QIs provide an essential tool in the efforts to continuously improve residential agedcare.
• QI sets should ideally include structure, process and outcome indicators, howeverstructure and process indicators do not necessarily reflect outcomes.
• QIs must be demonstrably valid, reliable, applicable and practicable.

• Some published research in Australian has looked at QIs of care in RACS (e.g.Courtney & Spencer 2000; Madsen & Leonard 1997).
• Most commonly referred to QI set in the literature is that developed by CHSRA andthe University of Wisconsin-Madison, by Zimmerman and colleagues and derivedfrom the MDS.
• Many researchers, both in Australia and internationally, argue for inclusion of someform of QOL elements in assessments of RACS. However Courtney et al. (2003) didnot identify any tool that currently exists for this population and identified a need foran appropriate tool to be developed and validated. Thomas et al.(2004) suggest theSF 36 is worthy of consideration, although it would require modification
• Incorporating consumer input is increasingly being recognised and the developmentof consumer experience – rather than consumer ‘satisfaction’ –tools appear to beproviding more meaningful data.
• There is a trend toward including staffing experience/satisfaction indicators in QIsets.
24 Public Sector Residential Aged Care

Quality of Care Performance Indicator Project Report 25
In phase two of the Project, forums provided the opportunity for public sectorstakeholders and individuals from consumer representative groups to have theirviews recorded. In addition, individual interviews with people knowledgeable aboutQIs and aged care were conducted. These people were identified through thenetworks of the DHS and La Trobe University (LTU).
4.1 Industry stakeholder forums Forums were held in Benalla, Geelong and Melbourne. Participants included staffand managers of RACS. A total of 61 industry stakeholders attended the forums;Benalla (9), Geelong (22), Melbourne morning forum (14) and Melbourne afternoonforum (17). The designations of the forum participants are detailed in Table 1(Appendix 11.5). The duration of each forum was two hours.
Letters of invitation were sent out by both the DHS and LTU, using a database ofpublic RACS provided by the DHS (Appendix 11.6). The letters provided informationregarding, date, time and venue (Appendix 11.7). The letters also directed therecipient to a website that was constructed through LTU to advertise the forums,invite feedback and provide updates on the progress of the project. Industrystakeholders unable to attend the forums were invited to provide writtensubmissions.
The facilitator began with a brief presentation on the project and its objectives.Participants were then asked a series of questions, these were:
• What QIs are currently used by your RACS, how are they collected and what is donewith the data collected?
• What other indicators does your RACS wish to recommend and reasons why?
• What does your RACS perceive to be the potential barriers that may impede the useof specific indicators or indicators generally? and
• What strategies has your RACS experienced, or believes would, facilitate theimplementation of QIs?
Participants were provided with a handout listing the 24 MDS/CHSRA QIs andasked to list the six QIs that they believed were the best or most critical indicators ofquality. The six QIs could either come from suggestions raised by the group or fromthe handout. Participants indicated the QIs chosen, and the forum then ranked theQI according to majority voting.
4.2 Clinical/quality indicator experts People identified by the Project Team and the DHS to be knowledgeable aboutclinical or quality indicators were invited to participate in a telephone interview. Atotal of six participated as interviewees (Appendix 11.8). Typically an interview lastedbetween 30–40 minutes.
4. Consultations

An interview protocol was developed however interviewees were encouraged toprovide any information that they felt would be valuable to the Project. Following abrief introduction and outline of the project, interviewees were asked the followingquestions:
• What indicators do you believe would be the best or most critical indicators ofquality of care in RACS?
• What do you see to be the barriers to implementing quality of care indicators inRACS?
• What strategies do you feel would be helpful in implementing quality of careindicators in RACS?
• What are your thoughts on a QOL indicator?
• Are you happy for your name to be mentioned in the report as a contributor?
4.3 Consumer issues focus group Individuals from peak consumer bodies were invited to attend a consumer issuesfocus group. A total of four consumer representatives participated; MinisterialAdvisory Council of SeniorVictorians, Department of Veteran Affairs, Partners inCulturally Appropriate Care-Victoria and Alzheimer’s Australia, Victoria (Appendix11.9). Proceedings were consistent with those used at the industry stakeholderforums.
26 Public Sector Residential Aged Care

Quality of Care Performance Indicator Project Report 27
Qualitative data from forums, individual interviews and the consumer representativeissues focus group were transcribed and analysed using constant comparisonmethods developed by Glaser and Strauss (1967), to identify concepts and thendevelop codes and patterns and themes.
5. Data Analysis

The outcomes of consultations are presented separately in the following section. Asummary is presented of comments from the three groups highlighting commonand contrasting themes.
6.1 Outcomes of industry stakeholder forums A key theme throughout the forums with industry stakeholders was how specific QIswould be defined. This became a springboard for subsequent discussions in relationto what QIs were currently used by their RACS, and how they collected and utilizeddata. This also guided recommendations of potential QIs.
Forum participants identified QIs which fell under the following domains:
• Behaviours of concern • Medication management• Complaints • Pain Management• Continence management • Palliative care • Death rates • Resident Lifestyle • Depression • Restraint• Falls • Separations • Human resources • Weight change/Nutritional status • Infection Control • Wound management/Skin integrity
Following is a description of the QIs suggested by forum participants, listed underdomains, presented in alphabetical order. Each QI suggested under each domain ispresented in a small table, preceded by an explanation of some of the commentsand issues raised regarding the suggested QIs.
Behaviours of concern
QIs relating to behaviours were suggested at all four forums. Types of behavioursthat were suggested included aggression (towards staff and/or other residents),assault (of staff and/or other residents), absconding and withdrawal.
You can have emotional injury[Melbourne AM forum]
…if it [i.e. a behaviour] is reportable, it’s really because it is affecting anotherperson…[Melbourne AM forum]
We define them just as aggressive behaviours…wandering is not something that isa great issue [Benalla forum]
DOMAIN SUGGESTED QIs
Behaviours of concern Percentage of residents exhibiting behaviours of concern; Reduction of consequences/outcomes e.g. injury to staff/residents; Number of injuries from aggressive assault; Reduction of identified behaviours; Behavioural incidents relating to other residents; Number of aggressive behaviours
6. Outcomes of Project Activities
28 Public Sector Residential Aged Care

Quality of Care Performance Indicator Project Report 29
Complaints
Potential QIs relating to complaints were suggested at two of the forums. Thenumber of complaints against a RACS was tentatively suggested as a QI, however itwas then rejected on the basis that it may be more reflective of resident’s or family’sability, willingness or reluctance to complain. This means it can not be assumed thatRACS with a high number of complaints have poorer quality of care, it just may meanthat residents or families feel more able to complain. As one participant put it,
That could be an issue of quality in itself, if people are living in facilities and don’tspeak up… [Melbourne AM forum]
DOMAIN SUGGESTED QIs
Complaints The number of complaints The number of complaints accepted by the complaints resolution scheme Awareness of how to lodge a complaint/the ability to complain
Continence management
QIs relating to continence management were suggested at three of the four forums.However, not all of the suggested indicators were well received by otherparticipants. For example, it was it was felt that “the number of pads used perresident day” may be more a financial indicator, than an indicator of quality. Similarlyit was questioned whether the “number of residents who are incontinent” is really anindicator of quality.
DOMAIN SUGGESTED QIs
Continence management Number of residents with catheters; Number of incontinence pads per resident per day; Number of residents who are incontinent; Number of people who are continent who have had continence assessments; Increase or decrease in the incidence of incontinence; Presence of a continence management program.
Death rates
Death rates were suggested at two of the four forums. However, they were typicallyseen as more relevant to acute care settings, rather than RACS.
It’s almost unexpected deaths…what’s the definition of unexpected…[MelbourneAM forum ]
Bit of a flag…rather than a quality indicator [Melbourne AM forum]

DOMAIN SUGGESTED QIs
Death rates Number of deaths over a specified time
Depression
A QI relating to depression was suggested at two of the four forums.
DOMAIN SUGGESTED QIs
Depression Percentage of residents assessed as having depression and then reassessed at 3 months to identify any improvement.
Falls
QIs relating to falls were suggested at all four forums. However defining falls wasseen as problematic. One participant reported that their RACS used the followingdefinition –
landing in spot lower than intended…and not including a CVA that caused thatfall… [Benalla forum]
Participants suggested that central to defining a fall is taking into account behaviour.One participant [Geelong forum] reported that their RACS distinguished in theirinternal reporting process between being found on the floor and being seen to fall.
There’s a difference between whether they’re [resident] standing beside the bedand sink or whether they actually crashed [Melbourne AM forum]
Participants at the Benalla forum reported collecting information about the numberof falls on a monthly basis. However, it was argued that it was not enough to simplyreport the number of falls as a QI. Rather the severity of a fall should also bereported. Many participants (Benalla and both Melbourne forums) reported currentlycollecting falls information and using a grading system of no injury, minor injury,major injury and death. However, not all participants reported using such a matrix:
They’re not graded as such, you do an incident form and it goes off to qualityimprovement people [Melbourne PM forum]
One participant was concerned that RACS with repeat fallers may score higher ratesof falls. It was suggested that a tag be used to identify repeat fallers when reportingto the DHS. However, a suggested problem with this strategy would be that RACSmay use this as an excuse for their fall rates.
DOMAIN SUGGESTED QIs
Falls Incidence of falls; Incidence of new fractures; Outcome of the falls – falls that result in abrasions, bruising,fractures or require surgical intervention
30 Public Sector Residential Aged Care

Quality of Care Performance Indicator Project Report 31
Human resources
At all four forums, participants identified many possible areas to focus on relating tostaff at RACS. Comments included:
however agency use is far less in country
It is very difficult to measure change from training
DOMAIN SUGGESTED QIs
Staffing Use of agency staff/Continuity of staff v’s agency staffNumbers of staffStaff Qualifications/Training Staff injury/WorkCoverSeparations/Turnover/Resignations Absenteeism Staff EFT (look at volunteers when calculating staff EFT) Staff developmentStaff satisfaction/Staff suggestions Staff skills mix Compliance with no-lift policy
Infection control
QIs relating to infections were suggested at all four forums. Infections about whichdata could be reported included gastroenteritis, chest infections and urinary tractinfections (UTIs). One issue with reporting UTIs is at what stage it becomesreportable. It was suggested UTIs become reportable when they impact onbehaviour [Melbourne AM forum].
Participants at the Benalla and Melbourne morning forums reported collectinginformation about the prevalence of infection rates on a three monthly basis.
It was suggested that if a QI relating to infection was used, then immunisation ratesand epidemics/outbreaks should be risk adjusted for. A counter argument was thatepidemics would possibly show up across RACS.
DOMAIN SUGGESTED QIs
Infection control New infections per resident per day Prevalence of infection rates Incidence of UTIs
Medication management
A number of areas which fell under the broad heading of medication managementwere identified by forum participants at all four forums. Whilst a polypharmacy QIwas suggested, medication review was seen by others as a better QI thanpolypharmacy, because of perceived difficulty in deciding how to definepolypharmacy. One participant at the Benalla forum reported their RACS definedpolypharmacy as a resident being on nine or more different medications.

Another area in which polypharmacy was seen as problematic was in determining asuitable data source for polypharmacy. Community pharmacists are sometimesinvolved in doing medication reviews. Part of this review is to look at polypharmacy.Using a pharmacist to report polypharmacy information was rejected by at least oneforum participant, who felt this would be too hard and that some smaller facilities donot have contracts with pharmacists. Another felt that a pharmacist may conduct areview and comment on prescribing, however this may still have no effect on whatGP’s chose to prescribe. Some forum participants felt they themselves had littleimpact on drug prescribing, as this was a GP’s domain;
…in some cases we don’t even have a say in it” [Melbourne AM forum]
“Whose quality is being reported…is it the GP’s or the facility’s? [Geelong forum]
Regarding medication errors, there were concerns raised over whether the errorsarise internally (i.e. within a facility) or externally (i.e. pharmacist). Monitor thosearising within facility and those due to other agencies, such as pharmacy error.
Have to decide on definition [of medication errors], because at the moment itincludes not signing [Melbourne AM forum]
Caution was also urged with respect to reporting data about prns, the name given to‘when required’ medications. PRN medications are defined by the AustralianPharmaceutical Advisory Council (APAC) as being
…those which are ordered by a medical practitioner for a specific person on thatperson’s medicine records and when the registered nurse, using clinical judgment,initiates, or delegates to an authorized enrolled nurse, when necessary. Theadministration of PRN medicines must be recorded on the person’s medicinerecord (APAC 2002).
As one participant pointed out:
You have to be careful with prns because quite often they become routine[Melbourne AM forum]
DOMAIN SUGGESTED QIs
Medication errors Number of medication errors
Polypharmacy Number of drugs people have and how frequently
Medication review Is there a medication review process in place and does itactually take place?
Adverse events Incidence of adverse events arising from medication
Pain management
QIs relating to pain management were suggested at two of the four forums. Oneconcern with reporting the number of residents who report pain was that residentsmay not, in all cases, actually report pain.
32 Public Sector Residential Aged Care
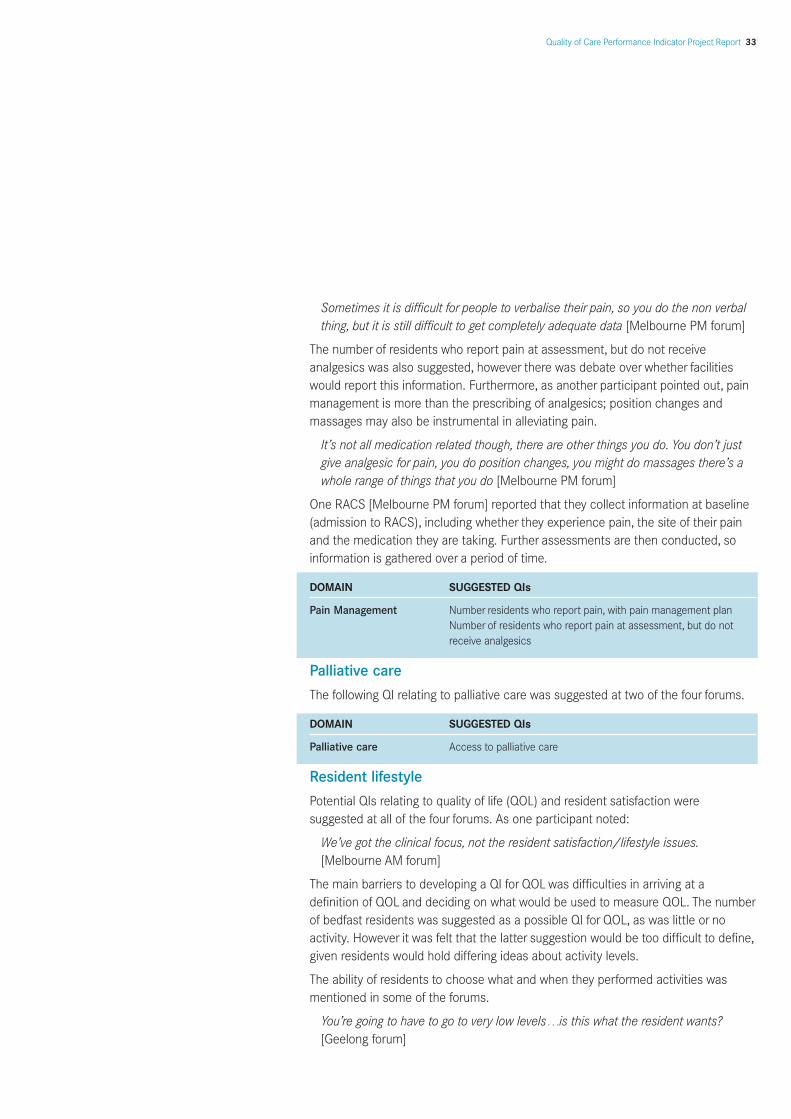
Quality of Care Performance Indicator Project Report 33
Sometimes it is difficult for people to verbalise their pain, so you do the non verbalthing, but it is still difficult to get completely adequate data [Melbourne PM forum]
The number of residents who report pain at assessment, but do not receiveanalgesics was also suggested, however there was debate over whether facilitieswould report this information. Furthermore, as another participant pointed out, painmanagement is more than the prescribing of analgesics; position changes andmassages may also be instrumental in alleviating pain.
It’s not all medication related though, there are other things you do. You don’t justgive analgesic for pain, you do position changes, you might do massages there’s awhole range of things that you do [Melbourne PM forum]
One RACS [Melbourne PM forum] reported that they collect information at baseline(admission to RACS), including whether they experience pain, the site of their painand the medication they are taking. Further assessments are then conducted, soinformation is gathered over a period of time.
DOMAIN SUGGESTED QIs
Pain Management Number residents who report pain, with pain management plan Number of residents who report pain at assessment, but do notreceive analgesics
Palliative care
The following QI relating to palliative care was suggested at two of the four forums.
DOMAIN SUGGESTED QIs
Palliative care Access to palliative care
Resident lifestyle
Potential QIs relating to quality of life (QOL) and resident satisfaction weresuggested at all of the four forums. As one participant noted:
We’ve got the clinical focus, not the resident satisfaction/lifestyle issues.[Melbourne AM forum]
The main barriers to developing a QI for QOL was difficulties in arriving at adefinition of QOL and deciding on what would be used to measure QOL. The numberof bedfast residents was suggested as a possible QI for QOL, as was little or noactivity. However it was felt that the latter suggestion would be too difficult to define,given residents would hold differing ideas about activity levels.
The ability of residents to choose what and when they performed activities wasmentioned in some of the forums.
You’re going to have to go to very low levels…is this what the resident wants?[Geelong forum]

Lifestyle’s not just about doing activities…lifestyle issues things…forinstance…does the resident get to go to bed at a time they choose, do they haveshowers at a time they choose, do they get their meals at a time they choose…?[Geelong forum]
The value to us, as facilities, in collecting any type of measurement, is can we makea difference to the lives to the people who are living with us at the moment. So wecan dig down into falls and polypharmacy and any of the others, but to actually havea lifestyle indicator would be of more benefit to us…To actually look at lifestyleissues is something that the industry probably needs badly to do [Geelong forum]
Participants reported that they were already monitoring, to some extent, residentand/or family satisfaction. This was reported to be collected through surveys, familymeetings and resident rights portfolios. A participant at the Benalla forum reportedtheir facility surveyed families once or twice a year for their satisfaction levels.
However there were a number of issues raised when considering residentsatisfaction as a QI. One issue was the difficulty in obtaining information fromresidents with dementia and the like. Consider the following two quotes:
None of them [residents with dementia] respond to a satisfaction survey…theyaren’t able to respond [Geelong forum]
One approach used by RACS was to use a proxy report of the resident’s satisfaction.One participant reported that they used a carer satisfaction survey for their residentswith dementia because
…none of the residents can actually answer.
Another concern raised was the usefulness of any feedback received from residentsor family about satisfaction.
The question is how honest are they…don’t get many returned [i.e. residentsatisfaction surveys]…and everything’s wonderful anyway so you just keep goingthe way you are.
DOMAIN SUGGESTED QIs
Quality of Life Number of bedfast residents Number of residents with little or no activity
Resident satisfaction
Activities Minutes per day devoted by staff to activities Number of minutes per resident per day offered with a lifestyle co-ordinatorNon-clinical time spent with residents
Choice/decision making
34 Public Sector Residential Aged Care

Quality of Care Performance Indicator Project Report 35
Restraint
QIs relating to restraint were suggested at all four forums. This included bothphysical and chemical forms of restraint. Types of physical restraint suggested werelapbelts, tables, chairs and bed rails. Types of chemical restraints suggestedincluded benzodiazepines and psychotropics. Antidepressants were not popularlyperceived as a chemical restraint.
It’s such a grey area, chemical restraint [Melbourne PM forum]
Drugs that are given as a restraint measure…because the doctors put it there [onthe resident’s chart], he (sic) has to say why he’s giving it, you can’t just put themon psychomedicines… doctor has to indicate his reasons [Melbourne PM forum]
DOMAIN SUGGESTED QIs
Restraint Incidence of restraint (physical and chemical)
Separations
The relevance of this suggested QI to RACS was debated with participantssuggesting it is more appropriate to acute settings.
DOMAIN SUGGESTED QIs
Unexpected/ Number of days in acute setting unplanned transfer
Weight change/nutritional status
QIs relating to weight change and/or nutritional status were suggested at three ofthe four forums. Body Mass Index (BMI) was not reported to be commonly collectedby RACS. For example, when asked, no participants at the Melbourne morningforum reported collecting weight information using BMI. Participants at theafternoon Melbourne forum reported that none of them collected BMI information,however they did have visiting dieticians who collect BMI data. However, one forumparticipant reported using BMI.
Hydration was also mentioned in relation to weight change and nutritional status ofresidents. A participant at the Geelong forum reported that their facility noted fluidintake on resident charts on a random basis.
DOMAIN SUGGESTED QIs
Weight change Number of residents who have significantly departed from the norm for weight
Hydration
Oral health/hygiene

Wound management/skin integrity
It was agreed that there is a need to look at the severity of pressure ulcers, howeverdebate arose over whether to report stage 1–4 pressure ulcer data or only stage 2–4 pressure ulcer data. One concern with collecting and reporting informationabout stage 1 pressure ulcers was that
Stage 1 is difficult to define.
Another participant reported that they felt:
Stage 1 is an internal indicator, rather than for DHS [reporting].
A vote was held at one forum, with 3 participants voting to report information onstage 1–4 pressure ulcers, and 4 participants voting to report information on stage2–4 pressure ulcers only. Some participants who currently collect information aboutstage 2–4 pressure ulcers, believed that incorporating stage 1 reporting would“markedly” increase documentation. Others agreed, however noted that theVictorian Quality Council (VQC) now recommends it is included. Some participantsreported their RACS to be in transition (from reporting stage 2–4, to reporting stage1–4), following participation in the Pressure Ulcer Point Prevalence Survey (PUPPS)conducted by the VQC.
Skin tears were also mentioned at forums and participants at the Benalla andMelbourne morning forums reported that at their facility, skin tears are noted onincidence forms.
DOMAIN SUGGESTED QIs
Pressure ulcers/ Abrasions Incidence of residents with pressure ulcers stage 1–4Pressure areas/Bed sores/Pressure sores
Skin tears Incidence of skin tears
Following completion of all of the forums, the data was collated and the QIs ranked(Table 1). Most forum participants (65.6%) believed reporting Stage 1–4 pressureulcers would be a critical indicator of quality. The prevalence of falls related injurywas also strongly perceived to be a QI, 60.6% of participants ranked this in their topsix QIs. The prevalence of residents using nine or more different medications andprevalence of daily physical restraints were perceived by 54.1% of participants asbeing useful as QIs. The QI that the least number of participants identified wasprevalence of indwelling catheters. Forum participants also suggested four QIs theydeemed to be indicators of quality that were not in the MDS/CHSRA set. Thesewere Transfers to Acute Settings, Death Rates, Sick Leave/WorkCover andMedication/Adverse Events.
36 Public Sector Residential Aged Care

Quality of Care Performance Indicator Project Report 37
Table 1: Quality indicators industry stakeholder forum participants perceived tobe the most critical indicators of quality of care.
Benalla Geelong Melbourne Melbourne(am) (pm)
n = 8* n = 22 n = 14 n = 17 N = 61
Incidence of stage 3 17 9 11 40 1–4 pressure ulcers (65.6%)
Prevalence of falls 8 13 8 8 37(60.6%)
Prevalence of residents using 9 6 10 10 7 33 or more different medications (54.1%)
Prevalence of daily physical restraints 5 12 9 7 33 (54.1%)
Prevalence of weight loss 3 18 0 8 29(47.5%)
Prevalence of behavioural symptoms 5 10 6 7 28 (45.9%)
Prevalence of urinary tract infections 1 15 4 5 25 (41%)
Incidence of new fractures 6 7 2 7 22(36.1%)
Prevalence of depression and no 1 1 7 4 13 antidepressant therapy (21.3%)
Prevalence of antipsychotic use in 2 0 7 3 12the absence of psychotic and (19.7%) related conditions
Incidence in decline in range of 3 0 0 6 9motion (ROM) (14.8%)
Prevalence of depression 0 1 1 6 8 (13.1%)
Prevalence of occasional bladder 1 2 5 0 8 or bowel incontinence without a (13.1%) toileting plan
Prevalence of bedfast residents 0 4 1 2 6 (9.8%)
Prevalence of hypnotic use more 2 2 0 0 4than two times in the last week (6.6%)
Prevalence of faecal impaction 0 1 0 2 3 (4.9%)
Prevalence of dehydration 1 2 0 0 3 (4.9%)
…continued next page

Table 1: Quality indicators industry stakeholder forum participants perceived to bethe most critical indicators of quality of care, continued
Benalla Geelong Melbourne Melbourne(am) (pm)
n = 8* n = 22 n = 14 n = 17 N = 61
Prevalence of anti-anxiety/ 2 1 0 0 3 hypnotic use (4.9%)
Prevalence of little or no activity 0 3 0 0 3 (4.9%)
Incidence of cognitive impairment 0 0 0 2 2(3.3%)
Prevalence of bladder or bowel 1 0 0 1 2incontinence (3.3%)
Prevalence of tube feeding 0 1 0 1 2(3.3%)
Incidence of decline in late 0 1 0 1 2loss ADLs (3.3%)
Prevalence of indwelling catheters 0 1 0 0 1(1.6%)
Transfers to acute settings 3
Death rates 1
Sick leave/WorkCover 3
Medication/ Adverse events 4
* One participant at the Benalla forum did not vote
Barriers and strategies to implementation of QIs
Forum participants identified a wide range of barriers they perceived may beexperienced when attempting to implement QIs in RACS. They also identified manystrategies which they believed would be instrumental in aiding the implementationof QIs in RACS. These are both presented in Table 2.
38 Public Sector Residential Aged Care

Quality of Care Performance Indicator Project Report 39
Table 2: Barriers and strategies to QI implementation as perceived by industrystakeholders
Barriers to implementing QIs Strategies to implementing QIs
DATA COLLECTION: • Additional work/ adds to documentation • Align to current work• Complexity of data collection • Modify existing data collection • Existing electronic systems and/or data • Simple to use – link to current data
collection – able to cope with new data collection and quality processes collection? • Update existing systems?
• Possible changes in priorities • Single data program provided by DHS? • Incorporate into electronic care-planning? • System needs to be flexible • Training re data collection and analysis
RACS CULTURE/ STAFFING ISSUES: • Culture of clinical indicators and not QIs • Training at all levels. Leadership CEOs,• RACS perception of ability to bring about DONs, Boards
change in outcomes • Timely reporting back – improve feedback• Lack of compliance/ commitment • Change management skills • “what’s in it for me?” • Leadership • Ageism – can’t see relevance • Recognition of bias e.g. expectations re • Lack of knowledge about QIs /need for people with dementia
education • Education – why, how, benefits to residentand facility
• Sell as supporting accreditation/benefitto RACS
• Keep simple • User friendly tools • Part of forum offered by DHS quality branch
RESOURCES: • insufficient staff • DHS to simplify data collection procedures • skills mix/ expertise/ attitude • Systems online?
• Funding for quality coordinator? • Increase staff? • Skills mix?
RACS-DHS COLLABORATION: • DHS-RACS-staff-all stakeholders; • Engage staff in feedback loops
timeliness of feedback • Sell QI collection and reporting as good • Fear of repercussions/what happens/ practice and not punitive by DHS
comparison of results with other RACS • DHS to provide feedback• Awareness raising • Make clear outcomes of reporting • Communication from DHS Develop
collaborative networks
OTHER: • Lack of definition/ need for agreed definitions • Develop generally agreed definitions • Lack of trust/time to share/ benchmark etc • Resources to support leadership networking
to establish the process. • Resources to support leadership networking
to share/develop/review strategies

6.2 Summary of consultations with industry stakeholders The indicators identified by the stakeholder groups as being important reflecteddomains where some of the participants already collected data for other purposes.This may have included their own internal quality requirements or governmentbodies, eg complaints. There was some indication by participants that data alreadybeing collected had its original focus in the acute care sector. While some domainswere seen as transferable to RACS, others such as death rates may not. Importantto the industry stakeholders was that they would be able to learn from theperformance of other RACS on QIs. For example, if one RACS performs well on oneindicator, then it was hoped that that RACS could be approached about whatpractices they used, so other RACS could use them to improve their ownperformance.
Perceived barriers to implementation of QIs included issues related to datacollection, culture and staffing, resources, the need for genuine collaboration withDHS and the need for agreement on QI definitions. Strategies to overcome thebarriers included efforts to minimise additional work, training related to QIs, changemanagement skills and leadership, timely reporting from DHS back to RACS, aimingfor resource neutrality and/or recognising the need for additional/different staff; useQIs to report better practice and develop RACS, develop agreed definitions andestablish networks to ensure peer support.
6.3 Outcomes of interviews with quality/clinical indicatorexperts Six experts participated in the interviews. A protocol was used to guide theinterviews, however interviewees were encouraged to provide any information thatthey felt would be valuable to the project. Following a brief introduction and outlineof the project, interviewees were asked to comment on the following areas:
• indicators they considered would be the best or most critical indicators of quality ofcare in RACS
• the barriers to implementing quality of care indicators in RACS
• strategies that would be helpful in implementing quality of care indicators in RACS
• their thoughts on a QOL indicator
In response to the question regarding the best or most critical indicators,interviewees tended to answer globally, focusing on the QI process itself rather thanon specific indicators. This included thoughts about what the implementationprocesses of QIs should be; the importance of understanding the process; thevarious forms of QIs; barriers relating to the implementation of QIs and strategies tosuccessfully implement QIs. They provided their thoughts on QOL indicators, whichwere appreciated as very important, however some spoke of the difficulty in theirimplementation. Some participants identified tools that are already in useinternationally and nationally.
40 Public Sector Residential Aged Care

Quality of Care Performance Indicator Project Report 41
The quotations used in this section of the Report have been extracted from therecorded interviews and are presented anonymously, in order to retainconfidentiality.
QI processes
This theme was at the core of what participants spoke of, and was viewed asessential before embarking on the identification and implementation of QIs:
To me the most important thing about indicators is not the individual indicators, buthow you construct the program.
So I rarely start off with what I think is ideal to measure, but I’d start of with “whowants the information, who’s going to collect the information, who’s going to use it,and how will it be used?” If you’re going to get the nurses to collect the informationbecause you want something that’s real, then they have to get the information back,so they feel they own it.
Interviewees discussed the need for processes to be used when
• identifying the purpose of QIs;
…what’s the purpose of the indicator. If you’re getting indicators to set standards,then you need to choose indicators that do not have double interpretation andthere’s very few, there’s not many indicators around that can’t be looked at in twovery different ways.
I think when you look at what people have done with indicators, my personal beliefis you need to look at why are the indicators there and who will be using them.
• determining who should develop the QIs;
So essentially what will happen is people will create indicators …they might dosome sort of desktop analysis and face validity of indicators and say “does thatsound like something that would be a good quality indicator?”, then they go out andask consumers and providers what they think would be good, then they get this set.
• determining who will be using the QIs;
…I think needs to take into account the different perspective or different suite ofpeople involved. You may have some indicators that staff feel are good, that helpwith their work, that clients of the residential homes wants, what the governmentmay see as important government issues or bigger picture things and somethingthat can be reported to the general public.
It was also seen as important that all involved in the QI process agree upon whatdata would be collected;
What I’ve always argued is to have consistency, from the point of view thatwhoever’s setting the policy, to whoever’s implementing it, to whoever’s evaluatingit, you need consistency in your target audience.

Understanding the process
Consistently the theme emerged that those involved in the QI process mustunderstand the purpose of the process.
One of the most important strategies is of course that (the QIs) make good sense,And so its important to have things that are very visibly useful and practical and allof those things and so a lot of work has to go into designing the thing, so its notsomething that just looks like a good idea at the time and then gets built into thesystem and forever sanctified and done because people like to see the results. Ithas to have more justification. That justification needs to be understood by thepeople collecting the data and getting the feedback.
For others it was how the program was constructed and integrated into othermanagement processes.
The programs often aren’t put in the context with other programs, so how will theseindicators fit into an accreditation program.
Structure of QIs
While there was agreement on the need for consistency regarding the QI processand development, it was also identified that the process could be tailored toindividual needs, this included culturally appropriate QIs. However it was noted thattailoring had to ensure a quality outcome.
You can’t have the same indicators in a particular cultural diversity nursing home, tothe mainstream nursing home because their activity program is different, culturaldifferent, etc.
If a particular cultural behaviour or attitude leads to bad care, I don’t think it’sacceptable to modify things to meet the sensitivity of a particular group if theoutcome is poor care. So it’s more about interpretation and to some extent thelanguage and the process of gathering this data and analysing it that has to beculturally tuned.
The issue was also raised regarding the definitions used when identifying QIs. Thisincluded definitions of quality:
When you are talking about quality – you are looking at it in two different ways, oneis perceived quality and the other is delivery quality.
At the moment we only look at the delivery quality, not the perceived quality.
Discussion also focused around the structure (type) and development, and themultidimensionality of QIs.
I think there’s two dimensions to be appraised. One is the delivery of health andhealth care in a broad sense, that is management of illness and functional andrelated problems – psychosocial issues and so forth – how well is the homeattending to those, and the second aspect is what about the person’s lifestyle fromthe point of view of recreation, meaningful activities, capacity to see their relatives,
42 Public Sector Residential Aged Care

Quality of Care Performance Indicator Project Report 43
availability of privacy, things like that are also important. It is a bit of an artificialdivide, but you can for the sake of convenience, you need different methodologiesto develop indicators for each. Broadly speaking you’ve got to attend to both sets ofissues
There’s a need for a range of things that cover a pretty wide territory. If you went forjust one of these [process, structural or outcome indicators only], you would misssome essential elements
The other thing I like to do when I look at indicators is get a suite that integrates, sothat they reflect different parts of the care process and they sort of complementeach other, so you’re not focusing only on, lets say, health care, or only on lifestyleissues or only on complaints
Participants spoke of the types of QIs they were familiar with and their preferences.Preferences were reported as personal biases and from research or implementationexperience. Comment was also made that the type of information to be elicited fromthe indicator and its purpose would influence the type of indicator required. Thenotion was raised that perhaps no one type of indicator would be appropriate andthat several indicators with different foci would be required.
…that’s a tough question. In years gone by, it would have been pressureulcers….that’s the one we got the most questions about in the past…I suppose theone most people would talk to us about…I think resident falls. Resident falls wouldbe the biggest one…either resident falls or medication errors.
Structural indicators are quite commonly used, things about numbers of nursinghours or facility, equipment and design and so on. There are process indicators thatare about different forms of care and the way their provided and then there areoutcome indicators which are I think the more valuable in terms of measuring whatthe results of care are e.g. if you look for things like pressure areas or incidents ofinfections of various kinds, behavioural issues – a whole range of things aroundwhat the consequences of care are...It’s very difficult to get something that is best– one size fits all.
You can then also have the debate about outcomes and process. People preferoutcomes because they understand that much better, but the outcomes are oftenhighly variable and are due to factors beyond the control of an organisation.
…I tend to favour process measures, but people don’t like process measuresbecause they say they are too specific and they don’t give you a global picture.
My belief at the moment is that process is the simplest way of getting comparablemeasures and they are easier to define than outcomes.
I’d get the InterRAI 24 quality indicators and use them and that’s 5 minutes workotherwise I could spend several years trying to validate someone else’s set ofinstruments. So that’s my simple answer to the health ones. And there is a little bitof quality of life material in there. The others, I’d have to sit down and do somework, figure out what I’d do with quality indicators in the other area.

Barriers and strategies to implementation of QIs Lack of success in the implementation of QIs revolved around the accuracy of thedata collected and understanding why the data was being collected, the lack offeedback and the utilisation of the data.
Barriers Data interpretation and utilisation
Nothing will be more of a barrier than if the process is seen not to be effective. It isterribly important for the people who have responsibility for collecting the data andalso for interpreting it to understand what it’s all about
… but all of the data collected seems to go into a big black hole and no one everhears what use it’s made. And the tragedy is very little damn use is made of it, yet itcould be very valuable.
Timeliness of reporting
…so if you’re asking nurses to collect data that’s going to be used once a year bymanagement, they’re not going to put any effort into it. If you want them to use it,you’ve got to come back to them within 3 months.
This information will never be used unless you can get it back to the people itsintended to serve in manner that gives them proximity to it
Other reasons for unsuccessful implementation included a lack of commitment, lackof time, lack of staff involvement and a lack of education.
Quality won’t work if it’s in the manager’s office
…they don’t have time to do this type of thing
There isn’t the commitment to them…, there isn’t a commitment to collectingthem, reporting on them, interpreting them and reviewing what they mean andreviewing the relevance of the program to the context that you’re in.
The programs often aren’t put in the context with other programs, so how will theseindicators fit into an accreditation program, how will they fit into building regulationsand other legislated requirements, how do they fit into OHS, how do they fit intoprofessional, and people often just disregard indicators..
Strategies For some participants the success of the QI process would appear to be dependenton several factors including the definitions used; the reporting mechanism and itspurpose; the development or creation of the QI; and the testing of QIs. The mainstrategies identified to support the success of QI were education and changingattitudes, this included management and staff.
The one question you need to ask yourself is what will be the response to anindicator report. And if you can determine what the response to the indicators willbe – who’s going to respond and how do you want them to respond – if you cananswer that question, then you can design the program.
44 Public Sector Residential Aged Care

Quality of Care Performance Indicator Project Report 45
Then there really needs to be about 3 years testing to actually figure out whetherthey work or not…A lot of these things you need several years of data before youcan start to see significant change.
The kinds of measures need to be ones that are valid, reliable and can be properlycollected. There of course needs to be built in (and there usually is in such things)some sort of internal checks/consistency and so on that can highlight data that hasbeen fudged.
Education
I think the whole process needs to be linked very closely with education.
Any introduction of these things needs to be accompanied by a major educationaleffort. At the outset to teach people what it’s all about and subsequently to ensurethat there’s a process whereby there can be re-education where it’s necessary toimprove in any particular area, rather than litigation.
Changing attitudes
Every unfortunate occurrence is an opportunity for improvement. So if the attitudesand understanding of these things can be turned into a more positive light then Ithink it’s a lot easier to achieve.
You need to change their thinking process before bringing in the indicators.
Timely reporting back
…change in practice, change in clientele and people’s ability to learn more meansyou’ve got to be feeding back within about 3 months
If you want them [nurses] to use it [QI data], you’ve got to come back to them within3 months
…the feedback should be no longer than a month or so after the analysis has beencarried out
QIs need to be meaningful/practical/effective
One of the most important strategies is of course that they make good sense, andthat isn’t always the case
It’s important not to create a super structure for its own sake…the outcome has tobe improvement in care or what’s the point?
What the staff who are involved in patient care want to know often is ‘what can I doto do a better job for the patient today, how will this information help me’?
Quality of Life indicator
There were some concerns regarding the feasibility of having QOL as a QI. Some ofthese concerns arose because of difficulties expressed regarding the definition ofQOL.

What constitutes a good QOL indicator was seen to be difficult to decide upon
…the anomalies about it all are of course quality of life is strictly in the mind of therecipient, rather than being something that can be objectively assessed effectivelyby an outsider
I think there should be some kind of process to reflect on how the residents arefeeling and how their carers are feeling in a home at least once a year. But whetherthat turns into what we traditionally call quality indicators is another matter.
Quality of life is a difficult area everywhere. I think it’s very good to have one. I’mnot sure we have got tools yet to support such an area – it’s an area that thereneeds to be more development on
…people aren’t that willing to accept the measures that are used for quality of life,but they talk about that being the most important thing
I think it is dangerous to label them as quality of life measures, I think it’s useful toargue that these measures facilitate or help promote a healthier lifestyle, they makefor long life and they reduce disability and promote function which we believeenhance quality of life.
Eliciting information regarding QOL was also seen as problematic in the residentialaged care population:
Where possible to, ask a resident – it’s best to be able to collect that data fromthem
Some participants identified tools that were already being used for gathering dataon QOL indicators:
Quality of life is quite important. Kane and Kane, have been working on a set ofquality of life indicators for residents in residential care and they start to talk aboutmany of the things that we take into consideration here – person’s level ofautonomy, privacy that they have, independence to make decisions, many of thosesort of things that we already take on board, and then there’s another term, lifesatisfaction – are they satisfied with life, or does it mean they have a good quality oflife. Duncan Boldy over in Perth, they’ve got a life satisfaction tool that they’veconstructed a couple of years ago and a lot of things on that start to creep into thethings that you might think are good quality care.
I think you can actually get robust measures of things like social engagement, thereis a social engagement scale in the InterRAI schedule that gives some idea of howmuch resident interacting with the outside world, and that’s a validated measure.
If you wanted to look at quality of life, then standardised quality of life, we’re usingthe WHOQOL, we were going to try and devise one ourselves, but we found thatwould be a whole project in itself, so we used the WHOQOL, and there is Australianstandardised data for it, so we could actually use that and look at the standardiseddata for that age group and see how it stands up. There’s a short version and thenthere’s a long version, 100 questions is the long version and the short version isabout 20 questions. It’s got 6 domains, it’s quite good.
46 Public Sector Residential Aged Care

Quality of Care Performance Indicator Project Report 47
Summary
All participants emphasised the importance that the QI process be inclusive of theviews of all stakeholders (this included government, industry and consumers suchas staff, residents and family). It was seen as essential that those involved in the QIprocess agree upon what data would be collected, how the data would be analysedand the reporting back mechanisms implemented. Lack of understanding and howthe program was constructed and integrated into other management processes wasseen as a barrier to the successful implementation of QIs.
When discussing the QOL indicators, the value of outcome measures and how theymeasured improvement for the individual were raised as issues. There were someconcerns expressed regarding the feasibility of having this as a QI. There were alsodifferences expressed regarding the definition of QOL.
6.4 Outcomes of the consumer issues focus group The focus of consumer representative discussions was not on clinical aspects ofcare, but rather on the patient as a person and the RACS as a home – a “communityof individuals” and “not one size fits all”. A key issue from the focus group was theneed for RACS to provide “resident-centred care”. It was suggested when developingQIs, that rather than first going to the existing structure (i.e. the accreditationstandards), that developers approach the residents first and then build the structurearound them. As one participant put it:
the 44 ticks [of the accreditation standards] are very worthy but not the whole story
One way in which the consumer representatives felt RACS could demonstrate theywere resident-centred was through the capacity of their residents to engage indecision making and self-determination, rather than the clinical indicators normallyused. Examples of how this could be achieved included the identification of differentQIs. These included:
• Are residents able to engage in decision making and self determination?
• Are the staff responsive to residents and engaged in interactions with residents?
• Is the diversity/individuality of residents acknowledged?
• Are days of significance/commemoration acknowledged?
• How the RACS handles death – are residents able to attend the funerals of otherresidents, is dying discussed with the residents?
• How cutting edge is a RACS – meaning the degree to which a RACS keeps up-to-date with new research findings?
• How is the rite of passage from hospital to RACS handled?

• Are residents able to engage in decision making and self determination?
One way in which the consumer representatives felt RACS could demonstrate theywere resident-centred was through the capacity of their residents to engage indecision making and self-determination. Examples of how this could be achievedinclude providing residents the opportunity to choose what they want to wear andwhat they want to eat. Therefore consulting with residents and ensuring they wereinformed and able to exercise choice was seen as highly valued. When asked howthis would be demonstrated, participants gave a number of responses:
There is so many things – do they choose what they wear, do they choose whenthey wake up, do they have a choice about what they want to eat and when theywant to eat it, if they want to have a peanut butter sandwich in the middle of theafternoon when no one [else] chooses that – can they say no, I don’t feel like doingthat and that is okay, or do they have to participate because everyone does
They can’t do everything they want because they do live in a facility which bringssome constraints with it, but equally we don’t want everyone to be automated andtold what to do all the time, so we are looking for a spot in the middle
• Are the staff responsive to residents and engaged in interactions with residents?
Related to decision-making was staff-resident communication. Staff-residentrelationships were seen as particularly important to resident wellbeing. Participantsspoke of looking at the level of engagement between staff and their residents, andstaff responsiveness to resident’s communications. One participant looked beyondthe level of communication, to what she referred to as the ‘how’ of communication;whether ageism was indicated by how the staff spoke to residents – the examplegiven was of staff referring to residents as ‘dear’ which may be patronising.
The level of noise, social interaction and the relaxed faces which smile. The kind ofinteraction which is happening within the facility. Whether the staff are engaged, orwhether they are just performing their work – the communication you see takingplace.
• Is the diversity/individuality of residents acknowledged?
The consumer representative focus group differed from the industry stakeholdergroup in that its focus was not on clinical aspects of care, but rather on the residentas a person and the RACS as a home – a “community of individuals” and “not onesize fits all”.
We should be looking at it as this is the home of X people – they live here, so youwould be looking at all the ways in which the facility is demonstrating that they’rerecognising they have a community of individuals rather than a one size fits all.
• Are days of significance/commemoration acknowledged?
Such days may relate to birthdays, deaths, cultural days or ANZAC day and may belinked to activities such as enabling residents to visit graves and attend cultural orcommemorative days.
48 Public Sector Residential Aged Care

Quality of Care Performance Indicator Project Report 49
• How the RACS handles death – are residents able to attend the funerals of otherresidents, is dying discussed with the residents?
How facilities handle death? …Do they pretend it doesn’t happen – all of a suddenthere is a gap. Allowing people to talk about approaching death and how they mightwant to arrange that time that’s left for them
It’s about honesty – all these residents are facing exactly that and it’s the one issuethat won’t be talked about
• Another suggested QI was how cutting edge a RACS is, meaning the degree towhich a RACS keeps up-to-date with new research findings.
…has that facility got people in it who really are interested and are concerned withnew ideas coming out of the Alzheimer’s Association?
I would love to aspire to something like a system whereby we can actually verify therange of training that the staff have had with regard to dementia and that this facilityis one which is involved in ongoing communication, updating information etc…
• How is the rite of passage from hospital to RACS handled?
And sometimes of course they go to hospital to care and never make the point ofbeen able to say goodbye at home and we’re trying to look at models where there isin fact the capacity of someone wanting to be home with that person for even onenight so they can say goodbye and they can actually collect a few things which willtake their own lives with them…that will tell you something about whether thatperson is allowed to be that person”
Quality of life indicator
Consumer representatives were asked for their views on a QOL indicator.
Quality of Life is not something that I would feel comfortable defining for anotherperson – there are so many constraints, so many factors operating that quality oflife is going to vary enormously.
What I’m saying is that quality of life wouldn’t just be measured by seeing that theydidn’t have any pressure ulcers, but somehow or other people want an indicator thatsays all of that…
I would say how the staff interacted with that person is the important part aboutquality of life.

Table 3: Quality indicators that consumer representatives perceived to be themost critical indicators of quality of care
N = 4 N = 4
Prevalence of residents using 9 or 4 (100%) Incidence of stage 1–4 pressure 1 (25%) more different medications ulcers
Prevalence of behavioural symptoms 4 (100%) Prevalence of bedfast residents 1 (25%)
Prevalence of little or no activity 4 (100%) Prevalence of falls 1 (25%)
Prevalence of urinary tract infections 3 (75%) Prevalence of indwelling catheters 1 (25%)
Prevalence of weight loss 3 (75%) Incidence of new fractures 1 (25%)
Prevalence of depression 3 (75%) Incidence of decline in late loss ADLs 1 (25%)
Prevalence of dehydration 3 (75%) Prevalence of depression and no antidepressant therapy 0
Prevalence of occasional bladder or Prevalence of faecal impaction 0bowel incontinence without a toileting plan 2 (50%)
Incidence of cognitive impairment 2 (50%) Prevalence of anti-anxiety/hypnotic use 0
Prevalence of daily physical restraints 2 (50%) Prevalence of hypnotic use more than two times in the last week 0
Incidence in decline in range of (25%) Prevalence of bladder or bowel motion (ROM) 1 incontinence 0
Prevalence of antipsychotic use in the 1 (25%) Prevalence of tube feeding 0 absence of psychotic and related conditions
Barriers and strategies to implementation of QIs
Consumer representatives identified resource constraints as a barrier that may beexperienced when attempting to implement QIs in RACS. They also identifiedstrategies which they believed would be instrumental in aiding the implementationof QIs in RACS.
Barriers Perceived resource constraints – time, money
There are a number of arguments I think people would throw up immediately whichwould be things like you can’t teach everybody – we haven’t got the resources, wedon’t have the time…
It’s time consuming as a start. I think its one of those perceived as something whichis onerous and burdensome and very time consuming
50 Public Sector Residential Aged Care

Quality of Care Performance Indicator Project Report 51
Strategies Cultural change
Cultural change is something that is required
…cultural change from the perspective there is no time or energy to do this warmfuzzy stuff…
Cultural change is something that is required because if the proposal was to havean indicator about inclusiveness and making decisions about things like that.
Present positives and benefits
People need to be led gently and helped to understand what the benefits are andthese are not in fact insurmountable barriers, but it’s an achievable goal
…I think if you weigh that [perceived barriers] up against the benefits of it – I thinkthat longer term if the transition is eased and the family is happy, the resident ishappy – its time and energy well invested because you get a very good return on it– talking about transition QI.
People need to understand why they are collecting QIs
I suppose the other thing it has got to be something that people generallyunderstand.
…the other thing is because I always feel the PCA’s have a very tough job and theydon’t really get a lot of appropriate recognition – so it would be again that thing ofthis is what we would like you to do and this is why we would like you to do it andthis is the benefit of it, rather than here at this facility, enforce it
6.5 Summary of consultations with consumer representatives Consumer representatives identified QIs that were unique to this group. Thisincluded up to date practices within a RACS and how they dealt with the death ofresidents in the RACS community. Overwhelmingly the major indicator of qualityrevolved around inclusion of residents in decision making processes.
6.6 Written submissions There were two written submissions to the LTU website. One RACS submittedsuggestions for QIs (Table 4). Some of these were also mentioned and voted on inthe forums, such as prevalence of depression and number of resident deaths.

Table 4: Suggestions for potential QIs provided by one RACS in Victoria
Clinical 1 Number of resident deaths
Clinical 2 Number of residents admitted with a diagnosis of depression
Clinical 3 Number of residents diagnosed with depression post admission
Administrative 1 Number of resident admissions
Administrative 1 Number of resident transfers
Administrative 2 Number of new care staff hires
Administrative 3 Number of new non-care staff hires
Financial 1 Number of total beddays unfunded each month
Financial 2 Number of Respite beddays unfunded each month
Financial 3 Number of RCS claims denied by CDHA (late submissions, etc)
Financial 4 Number of residents dropping in RCS category each month
CDHA = Commonwealth Department of Health and Ageing, RCS = Resident Classification Scale
Another industry respondent advised that they currently collect information on threeindicators; pressure ulcers, falls/found on fall and medication errors. However, noinformation was provided regarding data collection, as the development of theindicators was still in its infancy.
Summary
The three groups consulted with (industry stakeholders, academic experts andconsumer representatives) differed in their responses regarding what they believedto be the most critical indicators of quality care. The industry stakeholders whoparticipated at the forums tended to suggest clinical indicators of care. Conversely,the consumer representatives did not spontaneously suggest any clinical indicatorsof care, and instead suggested indicators that showed the resident was recognisedto be an individual and the RACS was recognised to be their home. When providedwith the MDS/CHSRA QI set, they were hesitant to nominate which QIs belongingto the set they perceived to be the most critical. The experts differed again in thatthey tended to talk more globally, about approaching quality of care as consisting ofboth the delivery of health and recognition of resident lifestyle issues. Barriers toimplementation and strategies to overcome them were perceived similarly acrossgroups although the industry groups provided more examples. Barriers andstrategies fell under the headings of resources, education, networks andcollaboration and agreed definitions.
The following section discusses findings from the literature review and theconsultations.
52 Public Sector Residential Aged Care
Quality of Care Performance Indicator Project Report 53
Discussion For the introduction of QIs to be successful, clearly they will need to be endorsed bythe RACS industry and consumers as meaningful and useful. While the identificationof high and low thresholds for each indicator would allow each RACS to see howthey were performing in relation to these, at this initial stage in the absence ofAustralian data, they would need to be based on international literature. It issuggested therefore, that thresholds be determined after full implementation andwhen valid Victorian data is available. A number of clinical indicators have beentested and provide some basis for discussion regarding relevance in Victoria. Inparticular, the MDS provides a QI set that has been well researched and which mayprove applicable to the Australian context – although it would probably requiresupplementation to compensate for its clinical, process/outcome focus. Someindicators require more development than others if included in the Victorian set –but for various reasons this effort could be considered worthwhile. For example theassessment of depression, while not commonly undertaken, would seem worthy ofinclusion given the level of unrecognised/untreated depression said to be the normin Australian RACS. The prevalence of falls is seen to be inadequate by theconsultations unless it is related to injury – that is the indicator would be falls relatedinjury and /or data should be collected on falls, fractures and use of restraint. Therationale was that some staff may increase the use of restraint in an effort to reducefalls and that while the number of falls may increase with reduced restraint,increased severity of injury was more likely where restraint is used. Polypharmacy isa major issue for older people and is linked to increased falls and restraint use. Whilethe Project Team recognise that at times there may be a therapeutic reason for nineor more medications this does seem to provide at least a flag for furtherinvestigation and justification. Evidence of regular medication review could berequired. Weight loss was not supported as an indicator because in some cases itmay be appropriate that residents lose weight; significant weight change wasperceived to be a better indicator of quality care.
It is useful to note that the nature and function of consumer and carer surveys hasevolved somewhat over the last decade. It used to be the case that consumersurveys focused solely on satisfaction with services. However, there is a developingview that such global responses have not proven to be particularly useful in qualityimprovement activities. Some surveys have reflected this thinking in their naming,e.g. the Picker Patient Experience Survey. Now the focus is on developing consumerand carer experiences, specifically in relation to service standards or undertakingsgiven in consumer or service charters.
This approach is best illustrated by example, as follows. Under the old stylesatisfaction question form, the question might have taken the following form:

• Were you satisfied with the handover between your previous nurse and your new nurse?
This question provides general information about the respondent’s level ofsatisfaction, but it does not reveal whether the handover actually occurred accordingto the manual’s requirements. The new form of the question might be:
• When you had a new nurse, did your previous nurse introduce the new nurse to you?
This question tells you, according to the consumer, whether the desired actionactually occurred, not whether the resident was happy with it. This type of item iscalled an ‘experience’ item rather than a ‘satisfaction’ item. Thus the focus is notwhether the respondent was happy but whether the desired activity actuallyoccurred. This represents an orientation towards factual matters rather thaninterpretation of these matters.
On the basis of the literature review and consultations it seems clear that theindicator suite should ultimately include:
• A health related quality of life measure and
• A consumer experience and satisfaction measure.
The Australian Government’s Department of Health and Ageing, Ageing and AgedCare Division have recently released a set of materials relating to Seeking Residents’Views in Residential Aged Care. This package of materials is designed to assist RACSto gain and use the views of residents. The materials in the package complementmajor aspects of the aged care reform strategy and provide a practical way forservices to learn more about residents’ needs and concerns. The Seeking Residents’Views in Residential Aged Care set contains five products:
• An Information Booklet
• Getting Started Notes
• A Resident’s Survey Tool that seeks residents’ views on a range of matters. Itincludes multiple-choice questions and has space for comments.
• A Resident’s Representative Survey Tool designed for use by other people acting onbehalf of a resident.
• A Key Points Survey Tool that is a short form version of the Resident’s Survey Tool.
(See http://www.ageing.health.gov.au/publicat/resviews.htm for details).
It might be argued that consumer satisfaction could be a proxy for staff satisfactionin that it is unlikely residents and families would be satisfied in an environment ofhigh staff turnover and staff dissatisfaction. On the other hand, given the issuessurrounding staff ‘shortages’ in RACS this may be an area worthy of its own QI.Should staff ‘satisfaction’ be used as an indicator for similar reasons it would makesense to develop and use a staff experience approach along the line of thatrecommended for residents. Chou et al. (2002) suggest that staff and residentsatisfaction are linked and that this
implies a need for a holistic approach to organisational evaluation and interventionto improve service quality, including the regular monitoring of both resident and staffsatisfaction (p.49)
54 Public Sector Residential Aged Care

Quality of Care Performance Indicator Project Report 55
7.1 Methodology for the final selection of Victorian publicsector RACS QIs The general epistemological philosophy underpinning this Project is that oftriangulation. Triangulation involves the systematic collection of informationconcerning the same matters from a variety of different viewpoints. In the presentProject, information concerning appropriate QIs for public RACS was collected fromthe following sources:
• The published literature including an analysis of existing indicators
• Public sector RACS industry stakeholder forums
• Consumer issues focus group
• Interviews with experts in the area of clinical/quality indicators and aged care
Each of these sources resulted in somewhat different list of indicators with a fairdegree of overlap. It was necessary to integrate these disparate lists into a final listof valid, reliable, relevant and practical indicators that may then be applied to do thejob for which they are intended.
Frequently such selection decisions and recommendations are devised solely onthe basis of an unexplained process of formation of professional judgments on thepart of the consultants. The approach taken by the Project Team was to explicatethe process of final selection of indicators using a formal selection process, in orderthat the users of this work can see how recommendations were arrived at.
Indicators identified by the project activities were rated by the Project Team usingthe specified evaluation criteria outlined in Table 5.
Quality indicators, like all measurement tools, need to have four intrinsic properties.These are:
• Reliability
• Validity
• Applicability
• Practicability
Traditionally, reliability and validity have been the most studied properties ofmeasurement tools. However, there is growing recognition of the importance ofapplicability and practicability as criteria for the evaluation of measurement toolsand protocols.
Reliability refers to the need for a test or measure to give the same resultconsistently. There are several different ways of measuring reliability including testretest reliability (where the results of a test are compared on repeated applications),inter-rater reliability (where different raters or judges use the same testcontemporaneously and the results compared) and internal consistency (where theresults of items within the test battery are compared for consistency). These
7. Outcomes of Formulation of Recommendations

properties are measured by correlation measures including Pearson, Spearman andCronbach’s indices. Consistency of measurement outcome is a necessary but notsufficient condition for tool validity.
Validity refers to the accuracy of the indicator result. There are various varietiesincluding face or content validity (where a judgment is made concerning the extentto which the test content captures the desired content), predictive validity (wherethe test results are used to predict a future event), concurrent or criterion relatedvalidity (where the test results are compared with the results of other, perhaps goldstandard, tests). In clinical contexts, validity is frequently measured by specificityand sensitivity, referring to a test’s capacity to correctly detect those with the targetattribute and to correctly filter out those who do not have it. In evaluation contextsvalidity may refer to whether activity data are accurate or whether the client’soutcome has been accurately captured.
Applicability refers to the ability of the indicator to be applied to the particulartarget group. For example, an indicator for general clinical contexts or American agedcare facilities may not be suitable forVictorian RACS. The development sample for atest may introduce properties within it that mean it works less well with otherpopulations. Applicability may also be affected by cultural factors. An example fromthe literature found that US prescribing indicators were not applicable to the UK,because they referred to drugs rarely prescribed in the UK (Oborne et al. 2003). Acontinence test that taps into different intervention practices that are unused in onejurisdiction or another may also have applicability issues. Applicability ensurescredibility and usefulness in the local context. Applicability is generally determinedby the application of expert and stakeholder judgments.
Practicability refers to the ability of the indicator to be practically applied in givencontexts. Practicability may be enhanced by the incorporation of already routinelycollected data into key performance indicators. If “new” (currently uncollected) datahas now to be collected to construct the indicators, this is less practical than usingexisting data. The amount of effort involved in capturing data needs to be weighedup in practicability considerations. It may be that data are already being collectedbut they may not be electronically recorded. The fact that the data are availablesomewhere in a set of paper records is cold comfort as the effort involved inconsulting the records may be very high. Tool length (i.e. how many indicators are tobe collected) is also a key consideration in practicability considerations. Once basiccontent validity criteria are met (i.e. the tool must contain the content that isrequired) it is highly desirable that a tool is as short as possible and includes datathat are easy to collect. Brevity is not only a virtue from an operational viewpoint inimplementing an indicator set. There is also the issue of simply conveying theoutcomes of an assessment of performance on QIs to the field and staff andmanagers to drive performance improvement. If the indicators are complex andtechnical it is difficult to construct coherent and practical feedback to driveimprovements. To implement quality improvements, it is necessary to understand
56 Public Sector Residential Aged Care

Quality of Care Performance Indicator Project Report 57
what the required changes are. Highly technical and complex indicators may not beas easy to improve as simpler ones.
In assessing the suitability of indicators forVictorian public sector RACS, the ProjectTeam considered all four attributes of reliability, validity, applicability andpracticability.
Justification of the selection criteria
Current use within RACS (applicability and practicability) Indicators that are currently used within RACS are likely to have benchmark dataavailable and to be applicable to the current task. The availability of benchmark datais important in the interpretation of the performance of services in a wider contextand enhances the credibility of the indicators.
Ease of collection of data (practicability) It is desirable that proposed indicators can be collected within existing resourceswithout significant extra expense.
Table 5: Evaluation criteria used by the Project Team in rating the suitability of QIs tobe included in the Public Sector RACS set.
Evaluation Criteria Scoring system
Current use 1 = not widely used in Australian and international settingswithin RACS 2 = some use in Australian and international settings
3 = wide use in Australian and international settings
Ease of collection 1 = difficult to collect within current resources of data 2 = medium difficulty to collect within current resources
3 = easy to collect within current resources
Reliability evidence 1 = no or little published evidence identified available 2 = evidence suggests moderate reliability
3 = evidence suggests good reliability
Validity evidence 1 = no published validity evidence identified available 2 = evidence suggests moderate validity
3 = evidence suggests good validity
Acceptability to 1 = the indicator has been nominated by no or a small minority of keykey informants informants
2 = the indicator has been nominated by some of the key informants 3 = the indicator has been nominated by the majority of the key informants
Impact upon 1= affects a small minority of residents and/ or has minor impactresident population 2 = affects up to half of the residents and/or has moderate impact
3 = affects the majority of residents and/or has serious impact
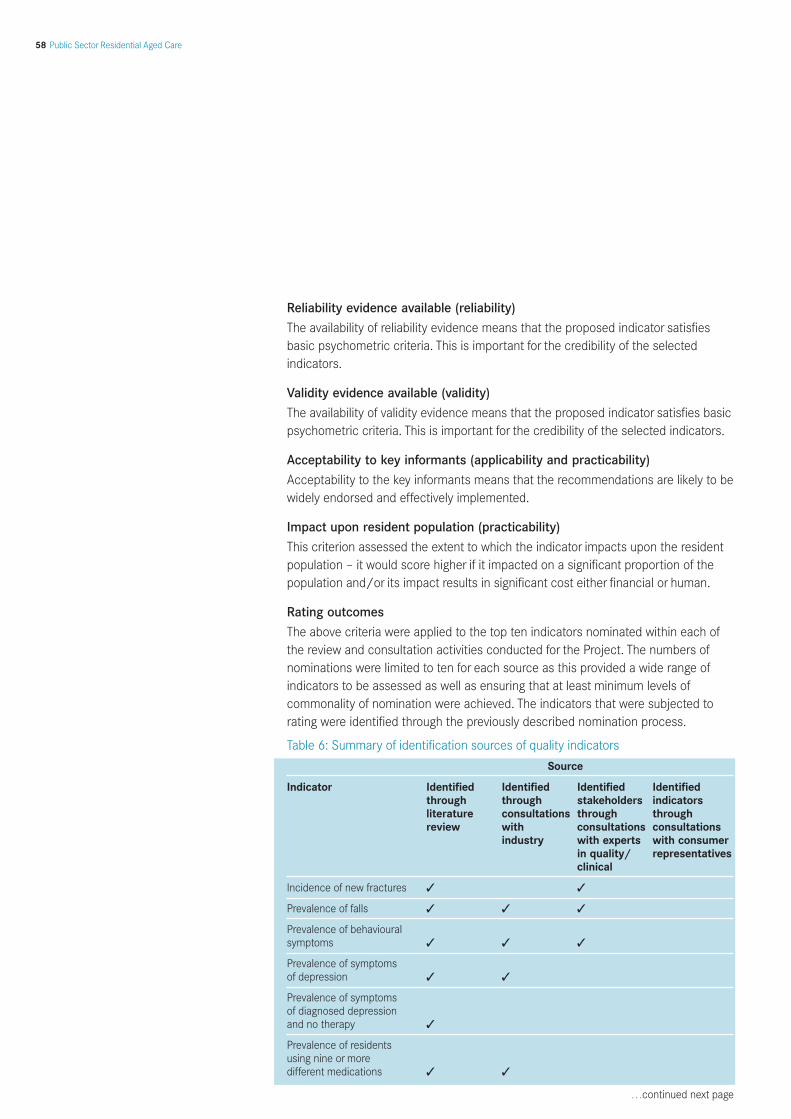
Reliability evidence available (reliability) The availability of reliability evidence means that the proposed indicator satisfiesbasic psychometric criteria. This is important for the credibility of the selectedindicators.
Validity evidence available (validity) The availability of validity evidence means that the proposed indicator satisfies basicpsychometric criteria. This is important for the credibility of the selected indicators.
Acceptability to key informants (applicability and practicability) Acceptability to the key informants means that the recommendations are likely to bewidely endorsed and effectively implemented.
Impact upon resident population (practicability) This criterion assessed the extent to which the indicator impacts upon the residentpopulation – it would score higher if it impacted on a significant proportion of thepopulation and/or its impact results in significant cost either financial or human.
Rating outcomes The above criteria were applied to the top ten indicators nominated within each ofthe review and consultation activities conducted for the Project. The numbers ofnominations were limited to ten for each source as this provided a wide range ofindicators to be assessed as well as ensuring that at least minimum levels ofcommonality of nomination were achieved. The indicators that were subjected torating were identified through the previously described nomination process.
Table 6: Summary of identification sources of quality indicators
Source
Indicator Identified Identified Identified Identifiedthrough through stakeholders indicatorsliterature consultations through throughreview with consultations consultations
industry with experts with consumerin quality/ representativesclinical
Incidence of new fractures ✓ ✓
Prevalence of falls ✓ ✓ ✓
Prevalence of behavioural symptoms ✓ ✓ ✓
Prevalence of symptoms of depression ✓ ✓
Prevalence of symptoms of diagnosed depression and no therapy ✓
Prevalence of residents using nine or more different medications ✓ ✓
…continued next page
58 Public Sector Residential Aged Care

Quality of Care Performance Indicator Project Report 59
Table 6: Summary of identification sources of quality indicators, continuedSource
Indicator Identified Identified Identified Identifiedthrough through stakeholders indicatorsliterature consultations through throughreview with consultations consultations
industry with experts with consumerin quality/ representativesclinical
Prevalence of incontinence without a continence management plan ✓
Prevalence of indwelling catheters ✓
Prevalence of faecal impaction ✓
Prevalence of urinary tract infections ✓ ✓
Prevalence of weightchange ✓ ✓
Prevalence of dehydration ✓ ✓
Prevalence of bedfastresidents ✓
Incidence of decline in late loss ADLs ✓
Incidence of decline in range of motion (ROM) ✓
Prevalence of inappropriate antipsychotic use ✓
Prevalence of anti-anxiety/hypnotic use ✓
Prevalence of hypnotic use more than two times in the last week ✓
Prevalence of daily physical restraints ✓ ✓
Prevalence of little orno activity ✓
Prevalence of stage 1–4 pressure ulcers ✓ ✓
Resident experiences of care ✓ ✓ ✓ ✓
Quality of life of residents ✓ ✓ ✓ ✓
Staff experiences of care ✓ ✓

All of the indicators listed in the above table were rated by the Project Team usingthe specified rating criteria. Members of the Project Team (Professor Rhonda Nay,Professor Shane Thomas, Dr Susan Koch, Ms Jacinda Wilson and Associate ProfessorSally Garratt) met to deliberate the ratings.
60 Public Sector Residential Aged Care
Table 7: Rank ordering of the Project Team ratings of the current use, ease of collection, reliability, validity, acceptability andimpact upon residents of identified quality indicators
Quality indicator Current Ease of Reliability Validity Acceptability Impact upon Total Use Collection residents
1. Prevalence of stage 1–4 pressure ulcers 3 3 3 3 3 3 18
1. Incidence of new fractures 3 3 2 2 3 3 16
2. Prevalence of daily physical restraints 3 3 2 2 3 3 16
3. Prevalence of behavioural symptoms 3 2 2 2 3 3 15
4. Prevalence of residents using nine or more differentmedications 2 3 2 2 3 3 15
5. Prevalence of incontinence without a continence management plan 3 3 2 2 2 3 15
6. Prevalence of significant weight change 3 2 3 3 2 2 15
7. Resident experiences of care 1 2 3 3 3 3 15
8. Prevalence of symptoms of depression 1 2 3 3 1 3 13
9. QOL of residents 1 1 3 3 2 3 13
10. Prevalence of falls 3 1 2 2 3 1 12
11. Staff experiences of care 1 1 2 2 3 3 12
12. Prevalence of urinary tract infections 3 1 2 2 1 2 11
13. Prevalence of dehydration 1 1 2 2 2 3 11
14. Prevalence of inappropriate antipsychotic use 1 2 2 2 1 3 11
15. Prevalence of anti-anxiety/hypnotic use 1 2 2 2 1 3 11
16. Prevalence of hypnotic usemore than two times in the last week 1 2 2 2 1 3 11
17. Prevalence of symptoms of diagnosed depression and no therapy 1 1 2 2 1 3 10
18. Prevalence of faecal impaction 1 2 2 2 1 2 10
19. Incidence of decline in late loss ADLs 1 1 2 2 1 2 9
20. Prevalence of indwelling catheters 1 1 1 1 2 2 8
21. Incidence of decline in range of motion 1 1 2 2 1 1 8
22. Prevalence of bedfast residents 1 1 1 1 1 1 6
23. Prevalence of little or no activity 1 1 1 1 1 1 6

Quality of Care Performance Indicator Project Report 61
The point at which one could argue that a rating and the Project Team’s associatedranking is insufficient to be included in the final indicator set is somewhat arbitrary.It should be remembered that each of the indicators rated by the Project Team hasbeen derived from a short-listing process using each of the information sourcesincluded in this Project. Thus each indicator was:
• Identified through literature analysis and/or
• Identified through consultations with industry stakeholders and/or
• Identified through consultations with experts in clinical/quality indicators and/or
• Identified through consultations with consumer representatives

8.1 Recommended procedure for risk adjustment
What is risk adjustment and why is it necessary? “Risk adjustment” is the statistical adjustment of raw QI outcomes for RACS. Theraw scores are “adjusted” to new values using an adjustment procedure. It shouldbe noted that the exact nature of the risk adjustment procedure cannot be specifieda priori without knowing the characteristics of the distributions of the indicatorscores. That is, the exact formula for adjustment and the coefficients contained withthe formula need to be constructed once a data collection has occurred. This isso that the adjustments reflect the reality of the actual distributions which, as in thepresent case involving the application of new indicators to new study populations, isan empirical question that can only be answered by the collection of actual data.That said it certainly is possible to specify in advance what variables are going to beincluded in the risk adjustment formulae for the indicators, as these are conceptualrather than empirical issues. The rationale for risk adjustment is the knowledge thatcertain characteristics of the RACS residents are likely to be systematically relatedto the obtained outcomes on the QI set. Risk adjustment is a statistical adjustmentthat tries to compensate for the different characteristics of the RACS whencomparing and interpreting QI outcomes so that in a statistical sense apples arecompared with apples.
The following example (Table 8) shows two RACS which have residents with thefollowing age distributions:
Table 8: Sample age distributors in two RACS (A and B)
RACS Number of clients in each age group
51–60 61–70 71–80 81+
RACS A 100 100 100 100
RACS B 50 50 150 150
For the purposes of this example, assume that each RACS has had the samenumber of falls within its resident group in the last year, 10 in RACS A and 10 inRACS B. From analysis of indicator data across a wide range of RACS, the risk ofhaving a fall is related to age (see Table 9).
Table 9: Sample fall risk distribution by age for RACS
Risk of a resident having a fall by age group
51–60 61–70 71–80 81+
Risk 1 in 100 2 in 100 3 in 100 4 in 100
In RACS A, given that there are 100 residents in each age group, it is expected thatthe number of falls in RACS A would be 1 (for the 51–60 group) + 2 (for the 61–70group) + 3 (for the 71 – 80 group) + 4 (for the 81+ group) = 10, which is what wasactually obtained.
8. Recommendations
62 Public Sector Residential Aged Care

Quality of Care Performance Indicator Project Report 63
For RACS B, it would be expected that the number of falls would be 0.5 (becausethere are 50 residents in the 51–60 age group and the rate of falls in that group is 1in 100) + 1 ( for the 61–70 group) + 4.5 (for the 71–80 group) + 6 (for the 81+group) = 12. However, if RACS B actually had 10 falls, when adjustments for the riskof a fall by age group were conducted, although RACS B had the same number offalls as RACS A, they did better in risk adjusted terms.
The consultations with forum participants identified the following suggestions forrisk adjustment variables:
• Resident mix – especially rate of dementia
• RACS size/configuration
• Access to appropriately skilled staff
• Access to training for staff
• Family dynamics
• Resident background
• Buildings/design of RACS
• RACS culture
• Geographical location – rural/metropolitan
Suggested responses to each of these suggestions appear below:
Resident mix – especially rate of dementia The use of resident mix variables is appropriate and justified and it is suggested thatthe distribution of Resident Classification Scale (RCS) classifications is used to riskadjust the QI outcomes. The RCS classifications are likely to be systematicallyrelated to the scores on most indicators. Risk adjustment means that RACS withRCS distributions unlike others will not be penalised nor rewarded for thesedifferences.
RACS size/configuration This variable should be used to risk adjust, as such factors, if they influence theoutcomes on the QIs, represent naturally occurring advantages that provide benefitsto clients. These benefits should not be hidden by statistical adjustment. If it is thecase that large or small RACS score systematically better or worse on the relevantindicators then the residents in these RACS should not be disadvantaged by poorerstandards of care and outcomes simply because they happen to have ended up insuch a RACS.
Access to appropriately skilled staffWhile it is recognised that the recruitment of staff is a problem for some ruralservices, to risk adjust would mean that this potential natural disadvantage would behidden in the indicator results. It would be difficult and complex to measure thisfactor and it would involve complex analysis of labour force trends on a widely

dispersed spatial basis. Experience of the Project Team in the development of smallarea measures of wellbeing suggests that even if it were agreed that this was adesirable risk adjustment factor, it is most unlikely that the required data toimplement it would be available.
Access to training for staffWhile it is recognised that this is a problem for some rural services, as with theprevious indicator to risk adjust would mean that this natural disadvantage would behidden. As with the previous suggested risk adjustment consideration it would bedifficult and complex to measure this factor.
Family dynamics This was not a widely accepted suggestion and would be very difficult to measure. Inany event this is not a factor that is under the purview of the RACS.
Resident background Indicators are used to interpret RACS level performance. This variable should formpart of the research program into resident outcomes, not a key component of theindicator risk adjustment process.
Buildings/design of RACS It is not considered that this variable should be used to risk adjust. Such factors, ifthey influence the outcomes on the QIs, represent naturally occurring advantagesthat provide benefits to residents. These benefits should not be hidden by statisticaladjustment. Further, the measurement of this factor would be time consuming andcostly.
RACS culture This was not a widely accepted suggestion and would be difficult and complex tomeasure.
Geographical location – rural/metropolitan It is considered that the analysis of such differences should be routinely conductedand reported in the form of benchmarks for RACS within each category. However, itshould not form part of the risk adjustment variable set. For this risk adjustmentconsideration, it is recommended that adjustment occur at the reporting(benchmark) level, rather than at the indicator level.
General form of the risk adjustment procedure As outlined above the exact coefficients to be used in the risk adjustment procedurewill need to be derived from the first data collection and adjusted as more data iscollected. However the general form of the proposed risk adjustment procedure isas follows:
64 Public Sector Residential Aged Care

Quality of Care Performance Indicator Project Report 65
QI scoreadjusted = For all RCS categories (x) Sum (QI scoreraw for RCS category X – Mean QI score (for RCS category
X for all RACS)) multiplied by (nx / N) where nx is the number of residents in RCS category x for thisRACS and N is the total number of residents in this RACS
Conclusions
Risk adjustment should be conducted for resident RCS mix, but not for other RACSor resident characteristics. Some RACS and researchers have invested considerableeffort into the development of risk adjustment procedures to ensure that RACSperformances on the QIs are not particularly advantaged or disadvantaged. While itis accepted that risk adjustment for key resident characteristics may be desirable,there is also a risk that a ‘lowest common denominator’ orientation can creep intothe interpretation of RACS data. It may be that all RACS in a specific jurisdictionmay have very poor performance on selected indicators; however a slightly betterthan average performance in a very poor field must not be interpreted asacceptable. Complex risk adjustment can have the effect of masking andattenuating poor performance and rendering the indicator scores to beuninterpretable.
8.2 Recommended quality indicator setThe Project Team recommended the top 12 ranked indicators for inclusion in theVictorian public sector RACS set. These were:
• Incidence of stage 1–4 pressure ulcers
• Incidence of new fractures
• Prevalence of daily physical restraints
• Prevalence of behavioural symptoms
• Prevalence of residents using nine or more different medications
• Prevalence of incontinence without a continence management plan
• Incidence of weight change (i.e. significant increase or decrease from the norm)
• Resident experiences of care
• Prevalence of symptoms of depression
• Quality of life of residents
• Prevalence of falls
• Staff experience of care
On 5th April 2004, the Project Advisory Group and Project Team convened todiscuss the 12 QIs recommended by the Project Team. Each QI was discussed inturn. The general consensus of the Project Advisory Group was that some of the QIsare more ready to be implemented as part of a pilot program at this stage than
others. One QI – Prevalence of incontinence without a continence managementplan – was not recommended for implementation at all and was removed from thelist. This was related to concerns that some RACS may be tempted to over-reportthe number of residents with continence management plans, in order to maximisebenefits received under the Resident Classification Scale (RCS). Another QI –Prevalence of falls – was collapsed with the Incidence of new fractures QI. As it isthe severity of injury caused by a fall that causes concern, it was felt that anindicator which reported simply the prevalence of falls was less relevant than fallsrelated fractures. As such, the denominator for the incidence of new fractures QIwas changed from being the total number of residents, to the total number of falls.The six QIs seen to be most ready for implementation in a piloting program are:
• Incidence of stage 1–4 pressure ulcers
• Incidence of new fractures as a proportion of falls
• Incidence of daily physical restraints
• Incidence of residents using nine or more different medications
• Incidence of weight change (i.e. a significant increase or decrease from the norm)
• Prevalence of symptoms of depression
Four other QIs were seen by the Project Advisory Group as important to implement,however require further refinement before being rolled out. Reasons for defermentrelate to definitional and instrument availability issues. These QIs are:
• Incidence of behavioural symptoms
• Resident experiences of care
• Health related QOL of residents
• Staff experiences of care
A QI relating to the incidence of behavioural symptoms was strongly favoured,however was not deemed ready for implementation in a pilot phase at this stage,because of the need to establish an agreed definition of behaviours and a datacollection tool.
Resident experiences of care was highly supported by participants in the consumerissues focus group and the Australian and international literature. However, atpresent it appears that further work regarding definitional and measurement issuesis needed before resident experiences of care can be represented by a QI. Forexample, the Key Points Survey and Resident’s Representative Survey Tool requiresfurther investigation in relation to its validity, reliability and practicability.
A QI for resident health related QOL was also strongly favoured by participants in theconsumer issues focus group, forums and international literature. Again however,there are definitional and measurement decisions to be made before developmentof such a QI can be finalised.
66 Public Sector Residential Aged Care

Quality of Care Performance Indicator Project Report 67
A QI relating to staff experiences was highly supported by forum participants andindicated in the international literature as being an area of future development.However, in Australia further work is needed to decide what aspect(s) of staffingexperiences should be represented in a QI, and what would be an appropriatemeasurement strategy.
It was agreed that the QIs should be piloted in a small number of RACS and that asmall reference group (probably of the pilot site DONS and DHS) would work onrefining the QIs and facilitating implementation. The QIs recommended for pilotinginitially are all outcome QIs. Structure and process indicators, while not necessarilyreflecting outcome, are important in assisting RACS to improve outcomes. Forexample, education of staff to improve competencies will not improve outcomes ifthe problem lies with a lack of assessment tools, management support and/ordocumentation procedures. To some extent structure and process indicators will bebuilt into resident and staff experiences. In addition the audit tools used by RACSshould include an in-house assessment of structure and process criteria related tothe QIs.
Table 10: Summary of recommendations made by Project Advisory Group regardingQIs suggested by the Project Team
Quality Indicator Project Advisory Group recommendation
Prevalence of stage 1–4 pressure ulcers Ready to pilot
Incidence of new fractures Ready to pilot. Combined with Prevalence of falls: i.e. no. of fractures
no. of falls
Prevalence of daily physical restraints Ready to pilot
Prevalence of residents using nine or Ready to pilotmore different medications
Prevalence of incontinence without a Not recommended continence management plan
Incidence of weight change (i.e. significant Ready to pilotincrease or decrease from the norm)
Resident experiences of care More development work needed
Prevalence of symptoms of depression Ready to pilot
Health-related QOL of residents More developmental work needed
Prevalence of falls Collapsed into Incidence of new fractures: i.e. no. of fractures
no. of falls
Staff experience of care More developmental work needed

Indicator: Incidence of stage 1–4 pressure ulcers Objective: To record the number of pressure ulcers, at each pressure ulcer stage,on any part of the body.
Quality Domain: Clinical
Relevant accreditation outcome: 2.11 Skin care Residents’ skin integrity is consistent with their general health
Calculation formula (numerator and denominator): Numerator: Number of residents with stage 1–4 pressure ulcers on day ofauditDenominator: Total number of residents
Anticipated benefit: Reduction in the incidence of pressure ulcers Reduction in the incidence of higher stage pressure
ulcers (stages 3–4)
Definition of key data elements: A pressure ulcer can be defined as
any lesion caused by pressure, resulting in damage to underlying tissues.Alternate terms include bed sore and decubitus ulcers. Pressure ulcers range inseverity from mild (minor skin reddening) to severe (deep craters down to muscleand bone)
Source: Centers for Medicare and Medicaid, Department of Health and Human Services USA.Revised Long-Term Care Resident Assessment Instrument User’s Manual.Version 2.0. December2002
Stage 1 Pressure Ulcer:
Observable pressure related alteration of intact skin whose indicators ascompared to the adjacent or opposite area of the body may include changes inone or more of the following: skin temperature (warmth or coolness), tissueconsistency (firm or boggy feel) and/or sensation (pain, itching). The ulcerappears as a defined area of persistent redness in lightly pigmented skins,whereas in darker skin tones, the ulcer may appear with persistent red, blue orpurple hues.
Stage 2 Pressure Ulcer:
Partial thickness skin loss involving epidermis and/or dermis. The ulcer issuperficial and presents clinically as an abrasion, blister or shallow crater.
Stage 3 Pressure Ulcer:
Full thickness skin involving damage or necrosis of subcutaneous tissue that mayextend down to but not through underlying fascia. The ulcer presents clinically asa deep crater with or without undermining of adjacent tissue.
Summaries of quality indicators for Victorian RACS asrecommended by the Project Team and accepted byProject Advisory Group
68 Public Sector Residential Aged Care
1

Quality of Care Performance Indicator Project Report 69
Stage 4 Pressure Ulcer:
Full thickness skin loss with extensive destruction, tissue necrosis or damage tomuscle, bone, or supporting structures (for example, tendon or joint capsule).Undermining and sinus tracts may also be associated with Stage 4 pressureulcers.
Source: National Pressure Ulcer Advisory Panel (NPUAP) Pressure Ulcer Staging System, VictoriaQuality Council.
Data source – potential or actual: Full body assessment of resident to determine the stage and number of ulcerspresentNursing and medical records Consultation with the primary caregiver
Data collection – methods and timing: Assessment tools – Norton’s Risk Assessment Scale (see Appendix 11.10) Suggested collection timing: Quarterly snapshot
Exclusions: Residents admitted from other health care facilities with a pressure ulcer since theprevious audit. Limitations: Inaccurate recording of data
Support from literature and consultations: Centers for Medicare and Medicaid, Department of Health and Human ServicesUSA, Long-term care resident assessment instrument user’s manual, version 2.0,December 2002. Zimmerman et al. (1995) Kaplan (2002) Courtney & Spencer (2000) Rantz et al. (2004) Madsen & Leonard (1997) Most forum participants (65.6%) believed the incidence of stage 1–4 pressureulcers to be a critical indicator of quality. Some participants were from RACSwhich had been involved in the Pressure Ulcer Point Prevalence Study (PUPPS).

Indicator: Incidence of new fractures as a proportion of falls Objective: To record the number of new falls-related fractures on any part of thebody acquired since the last audit date.
Quality Domain: Clinical
Relevant accreditation outcome: 2.4 Clinical care Residents receive appropriate clinical care2.5 Specialised nursing care needs esidents’ specialised nursing care needs
are identified and met by appropriately qualified nursing staff
2.6 Other health and related services Residents are referred to appropriate health specialists in accordance with the resident’s needs and preferences
Calculation formula (numerator and denominator): Numerator: Number of residents with new fractures since previous auditDenominator: Total number of falls since previous audit
Anticipated benefit: Reduction in the number of new fractures
Definition of key data elements: Fracture:
traumatic injury to a bone in which the continuity of the bone tissue is broken.Classified by the bone involved, the part of that bone and the nature of the break(e.g. comminuted fracture of the head of the tibia)
Source: Mosby’s Medical Nursing & Allied Health Dictionary (6th edition) 2002
Falls include:
Episodes when a resident lost his/her balance and would have fallen if not for staffintervention – i.e. an intercepted fall is counted as a fall… If a resident is found onthe floor, unless there is evidence suggesting otherwise the most logicalconclusion is that a fall has occurred – i.e. assume in such instances that a fallhas occurred.
Source: Centers for Medicare and Medicaid, Department of Health and Human Services USA.Revised Long-Term Care Resident Assessment Instrument User’s Manual. Version 2.0. December2002
Data source – potential or actual: Incident forms Resident records
Data collection – methods and timing: Review of data sources to determine the number of falls and new fractures sinceprevious audit. Suggested collection timing: Quarterly snapshot
Exclusions: Nil
Limitations: Inaccurate recording of data Missed fractures
70 Public Sector Residential Aged Care
2

Quality of Care Performance Indicator Project Report 71
Support from literature and consultations: Centers for Medicare and Medicaid, Department of Health and Human ServicesUSA, Long-term care resident assessment instrument user’s manual, version 2.0,December 2002. Zimmerman et al. (1995) Participants at the stakeholder forums felt that it would not be enough to simplyrecord the number of falls, rather the severity of a fall should be reported.

Indicator: Incidence of daily physical restraints Objective: To record the number of residents physically restrained at any timeduring the day or night.
Quality Domain: Preservation of resident rights
Relevant accreditation outcome: 4.4 Living environment Management of the residential care service is
actively working to provide a safe and comfortable environment consistent with residents’ care needs
Calculation formula (numerator and denominator): Numerator: Number of residents physically restrained on the day of auditDenominator: Total number of residents
Anticipated benefit: Reduction in the use of restraint – In their systematicliterature review, the Joanna Briggs Institute (JBI 2002) concluded that restraintuse has caused injuries such as nerve damage, ischaemic injury to hands andlimb dislocation, as well as death, typically due to strangulation.
Definition of key data elements:
Physical restraints are defined as any manual method or physical or mechanicaldevice, material, or equipment attached or adjacent to the resident’s body thatthe individual cannot remove easily which restricts freedom of movement ornormal access to one’s body.
Types of physical restraints include but are not restricted to bed rails, trunkrestraint, limb restraint and chairs and tables used to prevent freedom ofmovement.
Source: Centers for Medicare and Medicaid, Department of Health and Human Services USA.Revised Long-Term Care Resident Assessment Instrument User’s Manual. Version 2.0. December2002 (P3-198)
Data source – potential or actual: Resident records (every incidence ofrestraint use should already be documented in resident records, along withdocumentation that the pros and cons of restraint has been explained to theresident/guardian/family member) Observation of residents Incident reports
Data collection – methods and timing:Review of patient records, for incidences of restraint use Observation Suggested collection timing: Quarterly snapshot
Exclusions: Items that are typically used in the provision of medical care (egcatheters, drainage tubes, casts, traction, braces, abdominal binder and bandagesthat are serving their usual medical needs
Source: Centers for Medicare and Medicaid, Department of Health and Human Services USA.Revised Long-Term Care Resident Assessment Instrument User’s Manual. Version 2.0. December2002 (P3-199)
72 Public Sector Residential Aged Care
3

Quality of Care Performance Indicator Project Report 73
Limitations:
Inaccurate recording of data – Restraint use not being documented in patientrecords Dependent on the assessors’ interpretation of what constitutes physical restraint
Support from literature and consultations: Centers for Medicare and Medicaid, Department of Health and Human ServicesUSA, Long-term care resident assessment instrument user’s manual, version 2.0,December 2002. |Zimmerman et al. (1995) QIs relating to restraint use were suggested at all four forums and by 50% ofconsumer representatives.

Indicator: Incidence of unmet need behaviours Objective: To identify the frequency of behavioural symptoms that cause distressto the resident or are distressing and disruptive to facility, residents or staffmembers.
Quality Domain: Functional
Relevant accreditation outcome:
2.13 Behavioural management The needs of residents with challenging [sic] behaviours are managed effectively
Calculation formula (numerator and denominator): Numerator: Number of residents exhibiting unmet need (challenging)
behaviours since the previous audit. Denominator: Total number of residents
Anticipated benefit: Decreased numbers of residents exhibiting behaviouralsymptoms
Definition of key data elements: Unmet need behaviours are those behaviourswhere their frequency and duration; • appear to be taxing to the resident and health professionals (Kopecky &
Yodofsky 1999),• require repeated limit setting (Kopecky & Yodofsky 1999),• interfere with activities of daily living (Kopecky & Yodofsky 1999),• require multiple pharmacological interventions (Kopecky & Yodofsky 1999) • endanger residents or others (Beck et al. 1997) • disrupt clinical care (e.g. pulling out IV), and • reduce the quality of life for the resident (e.g. distress/anxiety
/frustration/social isolation)
Data source – potential or actual: Behavioural assessment documents Incident forms Medical and nursing records
Data collection – methods and timing: Review of documentation including behaviour charts Suggested collection timing: Quarterly snapshot
Exclusions: Residents whose admission is less than 30 days during the auditperiod
Limitations: Inaccurate recording of data Staff perceptions of behavioural symptoms
74 Public Sector Residential Aged Care
4

Quality of Care Performance Indicator Project Report 75
Support from literature and consultations: Centers for Medicare and Medicaid, Department of Health and Human ServicesUSA, Long-term care resident assessment instrument user’s manual, version 2.0,December 2002. Zimmerman et al. (1995) Participants at all four forums suggested QIs relating to behaviours (e.g.aggression towards staff and/or other residents, assault of staff and/or otherresidents, absconding, withdrawal) as important, as did 100% of consumerrepresentatives.

Indicator: Incidence of residents using nine or more differentmedications Objective: To identify residents at risk of polypharmacy
Quality Domain: Clinical/medical
Relevant accreditation outcome: 2.7 Medication management Residents’ medication is managed
safely and correctly
Calculation formula (numerator and denominator): Numerator: Number of residents with nine or more medications (including
prescribed, over the counter and prn) during the audit period. Denominator: Total number of residents
Anticipated benefit: Will flag potential risk and need for review and so assiststaff in identifying potential problems related to polypharmacy, drug reactions andinteractions.
Definition of key data elements: A general definition of polypharmacy is:
the use of a number of different drugs by a patient who may have one or severalhealth problems
Source: Mosby’s Medical Nursing & Allied Health Dictionary (6th edition) 2002
Data source – potential or actual: Medication charts
Data collection – methods and timing: Review of documentation to count thenumber of different medications (not the number of doses and different dosages),administered by any of the following routes: oral, intramuscular, intravenously,subcutaneously, rectally and vaginally to each resident. Suggested collection timing: Quarterly snapshot
Exclusions: Topical medications Lotions/creams/ointments used in wound care Eye drops Do not include dietary supplements that contain vitamins
Limitations: Inaccurate recording of data There will be times when multiple medications are clinically justified, however this indicator assists risk management.
Support from literature and consultations: Centers for Medicare and Medicaid, Department of Health and Human ServicesUSA, Long-term care resident assessment instrument user’s manual, version 2.0,December 2002. Zimmerman et al. (1995) Kaplan (2002) Rantz et al. (2004) The QI “Incidence of residents using nine or more different medications” wasstrongly perceived to be an indicator of quality of care by those who participatedin consultations. All four consumer representatives and 54.1% of the forumparticipants perceived this indicator to be a critical QI.
76 Public Sector Residential Aged Care
5

Quality of Care Performance Indicator Project Report 77
Indicator: Incidence of weight change (i.e. significant increase ordecrease from the norm) Objective: To monitor stability of weight over time
Quality Domain: Clinical
Relevant accreditation outcome: 2.10 Nutrition and hydration Residents receive adequate
nourishment and hydration
Calculation formula (numerator and denominator): Numerator: Number of residents who have weight changes outside the
norm as defined by the Body Mass Index (BMI) since last audit. Denominator: Total number of residents
Anticipated benefit: The measurement of weight is a guide in determiningnutritional status and assist staff in identifying potential problems related tonutritional status Reduce the risk of co-morbidities (e.g. dehydration, compromised skin integrity)
Definition of key data elements: Body Mass Index (BMI): WEIGHT (kg) / HEIGHT (m)2 (Weight in kilograms dividedby the square of height in metres). • <18 kg/m2 – underweight• 18–<25 kg/m2 – healthy weight• 25–30 kg/m2 – overweight• >30 kg/m2 – obese
Source: World Health Organisation
Data source – potential or actual: Medical and Nursing records Transfer forms BMI
Data collection – methods and timing: For new admission, measure height (incentimetres) with shoes offCheck the clinical records of current residents, if last height recorded is more than12 months re measure height with shoes off. Measure weight consistently over time (eg after voiding, before meals) Check clinical records, if the last recorded weight is more than one month orprevious weight is not available, weigh resident.
Source: Centers for Medicare and Medicaid, Department of Health and Human Services USA.Revised Long-Term Care Resident Assessment Instrument User’s Manual. Version 2.0. December2002
Calculate BMI using height and weight readings. Suggested collection timing: Quarterly snapshot
6

Exclusions: Residents unable to be weighed due to medical or physicalconditions (eg extreme pain, immobility or risk of pathological fractures)
Source: Centers for Medicare and Medicaid, Department of Health and Human Services USA.Revised Long-Term Care Resident Assessment Instrument User’s Manual. Version 2.0.December 2002 (P3-198)
Limitations: Inaccurate recording of data Inconsistent measurement of heightInconsistent measurement of weightIncorrect BMI calculation Circumstances when resident cannot be weighed (eg extreme
pain, immobility or risk ofpathological fractures)
Support from literature and consultations: Centers for Medicare and Medicaid, Department of Health and Human ServicesUSA, Long-term care resident assessment instrument user’s manual, version 2.0,December 2002. Zimmerman et al. (1995) Feilmann (2000) Participants at three out of the four forums and 75% of consumer representativessuggested QIs relating to weight change and/or nutritional status.
78 Public Sector Residential Aged Care

Quality of Care Performance Indicator Project Report 79
Indicator: Resident experiences of care Objective: To record the resident’s experiences of care
Quality Domain: Psychosocial/ Preservation of human rights
Relevant accreditation outcome:
1.4 Comments and complaints Each resident (or his or herrepresentative) and other interested parties have
access to internal and externalcomplaints mechanisms
3.9 Choice and decision-making Each resident (or his or herrepresentative) participates in decisions about the
services the resident receives, and isenabled to exercise choice and control over
his or her lifestyle while not infringingon the rights of other people
Calculation formula (numerator and denominator): The indicator wouldinclude a frequency analysis of the numbers of respondents who rate each of thekey point questions affirmatively. NB: 6 is the number of questions in the KeyPoints Survey (see later in this summary).
Numerator: Sum of the number of residents/6 who rate the questions affirmatively since previous audit.
Denominator: Total number of residents
Anticipated benefit: Consumer involvement in quality indicator process
Definition of key data elements: Resident experiences of care as defined bythe Key Points Survey Tool or the Resident’s Representative Survey Tool.
Data source – potential or actual: Key Points Survey Tool (short form versionof the Resident’s Survey Tool)
Data collection – methods and timing: Application of the Key Points Survey Tool to residents who are able to respond tothe following 6 questions:
Creating a Home-Like Environment1. Do you feel at home, comfortable and safe in your room? Yes/No Is there anything that would improve the comfort of your room?
Building Design and Access to Facilities 2. Are you able to use all areas of your aged care home? Yes/No Would you like to suggest any improvements to the building?
Enjoying Life 3. Does the variety of activities offered include your particular interests? Yes/No Do you have any comments or suggestions about the activities offered?
Relationships 4. Do you receive support and encouragement to maintain your relationships withother people, including friends and family? Yes/No Is there anything staff could do to help you maintain your relationships?
7

Receiving Good Quality Service 5. Are you satisfied with the standard of service regarding your meals, personalcare and nursing care? Yes/No Is there anything we could do to improve the quality of service you receive?
Making Choices and Having Your Say 6. Do you have the opportunity to suggest changes or improvements to how youraged care home operates? Yes/No
Please comment.
Suggested collection timing: Quarterly snapshot
Exclusions: Cognitively compromised residents will require the use of thealternate representative/carer version of the tool (Resident’s RepresentativeSurvey Tool – designed for use by other people acting on behalf of a resident.)
Limitations: Inaccurate recording of data Additional data collection required – however, the Australian Government is likelyto promote national use of this tool in all RACS, pending validation and reliabilitytesting.
Support from literature and consultations: Yeh et al. (2003) Marquis (2002) Kane (2003)
Resident experience of care was a focus of participants in the consumerrepresentative group, as well as being consistently identified throughout theforums held with stakeholders.
80 Public Sector Residential Aged Care

Quality of Care Performance Indicator Project Report 81
Indicator: Prevalence of symptoms of depression Objective: To determine the number of residents with symptoms of depression
Quality Domain: Functional
Relevant accreditation outcome: 2.4 Clinical care Residents receive appropriate clinical care 2.5 Specialised nursing care needs Residents’ specialised nursing care needs
are identified and met by appropriately qualified nursing staff
2.6 Other health and related services Residents are referred to appropriate health specialists in accordance with the resident’s needs and preferences
Calculation formula (numerator and denominator): Numerator: Number of residents with symptoms of depression since
previous audit. Denominator: Total number of residents
Anticipated benefit: Identification of symptoms of depression, so appropriatetreatment can be administered
Definition of key data elements: Depression as defined by either the GeriatricDepression Scale (GDS) or the Cornell Scale for Depression in Dementia.
Data source – potential or actual: Resident medical and nursing records Geriatric Depression Scale (GDS) – to be used with residents without cognitiveimpairment (see Appendix 11.11) Cornell Scale for Depression in Dementia – to be used with residents withcognitive impairment (see Appendix 11.12)
Data collection – methods and timing:Review of resident medical and nursing records. Review of depression assessment outcomes Suggested collection timing: Quarterly snapshot
Exclusions: Nil
Limitations: Inaccurate recording of data Staff would require training in use of tools.
Support from literature and consultations: Centers for Medicare and Medicaid, Department of Health and Human ServicesUSA, Long-term care resident assessment instrument user’s manual, version 2.0,December 2002. Zimmerman et al. (1995) Rantz et al. (2004) Participants at two of the four forums and 75% of consumer representativesperceived QIs related to depression to be critical indicators of quality of care.
8

Indicator: Health related quality of life of residents Objective: This indicator is concerned with the outcomes of the quality of carecomponents as measured by the health related quality of life achieved byresidents.
Quality Domain: Psychosocial/ Preservation of human rights
Relevant accreditation outcome: Standard 2 Health and personal care
Principle: Residents’ physical and mental health will be promoted and achieved at the optimum level in partnership between each resident (or his or her representative) and the health care team.
Calculation formula (numerator and denominator): Numerator: Number of residents achieving SF-36 scores above the average
for Australian Residents of Aged Care Services as measured in the Australian published review (or agreed tool) since previous audit. (http://www.uow.edu.au/commerce/ahoc/sf36review.html)
Denominator: Total number of residents
Anticipated benefit: The achievement of well being of residents is a paramountgoal in Australian and international standards.
Definition of key data elements: Medical Outcomes Study Short-Form 36-Item Health Survey (SF-36) scores.
The SF-36 includes one multi-item scale measuring each of eight health concepts: 1. physical functioning; 2. role limitations because of physical health problems; 3. bodily pain; 4. social functioning;
5. general mental health (psychological distress and psychological well-being); 6. role limitations because of emotional problems;
7. vitality (energy/fatigue); and 8. general health perceptions.
The SF-36 also includes a single-item measure of health transition or change. TheSF-36 can also be divided into two aggregate summary measures the PhysicalComponent Summary (PCS) and the Mental Component Summary (MCS). (In thestandard version of the SF-36 all scale questions refer to a 4 week period.)
Source: http://www.uow.edu.au/commerce/ahoc/sf36review
Data source – potential or actual: Survey of sample of residents
Data collection – methods and timing: This will need to be developed inconsultation with RACS. This will need to conform with the timing of the collectionand reporting of the indicators.
Exclusions: Cognitively compromised clients (as evidenced by a score of 23 orless on the Mini Mental Status Examination (MMSE)) will not be able to participatedirectly will require proxies.
82 Public Sector Residential Aged Care
9
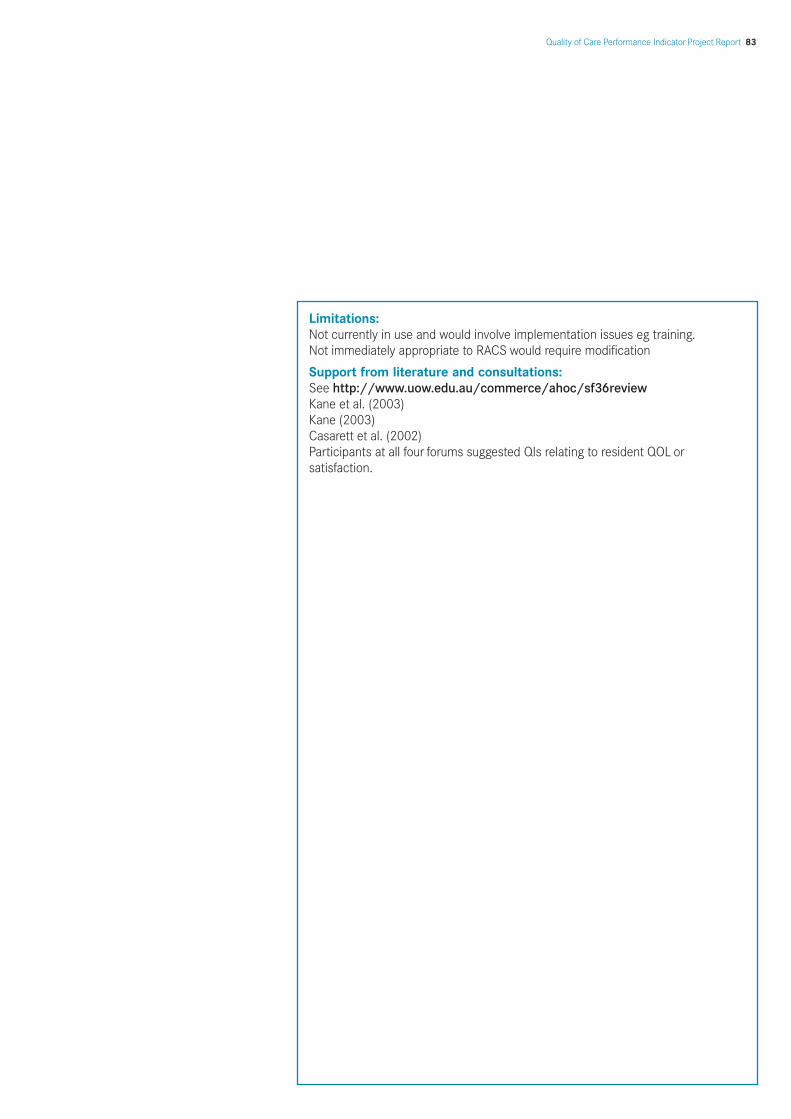
Quality of Care Performance Indicator Project Report 83
Limitations:Not currently in use and would involve implementation issues eg training. Not immediately appropriate to RACS would require modification
Support from literature and consultations: See http://www.uow.edu.au/commerce/ahoc/sf36reviewKane et al. (2003) Kane (2003) Casarett et al. (2002) Participants at all four forums suggested QIs relating to resident QOL orsatisfaction.

Indicator: Staff experiences of care
Objective: To record factors that impact on staff experience in RACS.
Quality Domain: Psychosocial/ Preservation of human rights
Relevant accreditation outcome: Standard 1: Management systems, staffing and organisational developmentPrinciple: Within the philosophy and level of care offered in the residential
care service, management systems are responsive to the needs of residents, their representatives, staff and stakeholders, and the changing environment in which the service operates.
Calculation formula (numerator and denominator): Numerator: Staff experience questionnaire data Denominator: Total number of care delivery staff
Anticipated benefit: Where staff experiences are positive, higher quality care can be expected.
Definition of key data elements: To be developed but may include: Staff retention/turnover/sick leave Education and career pathways Staff autonomy and decision making Flexible rosters
Data source – potential or actual: Staff experience questionnaire Data collection – methods and timing: To be determined
Exclusions: Nil
Limitations: Inaccurate recording of data Additional data collection required
Support from literature and consultations: Chou et al. (2002) Bowers et al. (2000) Schirm et al. (1999) At all four forums, participants identified many possible areas to focus on relatingto staff at RACS.
84 Public Sector Residential Aged Care
10

Quality of Care Performance Indicator Project Report 85
8.3 Recommendations for implementation of Victorianpublic sector RACS QI indicator setThe purpose of the development of the QIs is to devise a system that will enableRACS to monitor their performance against the indicators and to provide useful andcredible data that will, in turn, facilitate maximum quality improvement. A key facetand driver of quality improvement is the Quality Improvement Plans (QIPs) devised byRACS. QIPs are generally annually presented and devised with ongoing activitythrough the year designed to drive quality improvement. The indicators and thecollection, reporting and quality improvement activities need, therefore, to dovetailwell.
Taking account of feedback from the consultations, a number of questions relating toimplementation must be addressed. These include:
1. How often should the indicators be collected and reported?
2. How should data quality/validation considerations be handled?
3. How should the indicator results be disseminated?
4. What processes should be used for implementation?
Frequency and timing of data collection and reporting issues
In relation to the issues of how often and when data should be collected, therelationship to useful impact upon QIPs is pivotal. On the basis of consultancyfeedback, quarterly reporting should be implemented, meaning there be would fourcycles of indicator data available for each QIP and it is suggested that six monthlycycles should be the minimum considered. Six monthly requires less effort by RACS,however does not provide as fine detail to enable tracking and timely intervention forquality improvement.
The Project Team consider that close joint consideration of this issue should bemade by the DHS and the relevant RACS. If it is agreed that quarterly reporting isfeasible and desirable than this should be implemented, however it may be that thisdecision is not made until after a pilot roll-out. Inevitably the first implementation willbe more effortful than subsequent ones, however this experience would provide veryuseful information to inform the decision. If six monthly reporting is contemplatedthen the data collection cycle should align with this i.e. occur on a six monthly basis.
It should be noted that the current practices for collection of the existing indicatorsvary from indicator to indicator. Most current clinical indicators are collected on acontinuous basis either because of individual RACS decisions to do so or because offormal accreditation requirement. Thus these indicators will not need significantchange from current practice to fit into a new QI reporting system. Some RACSalready internally report on these indicators on a frequent and routine basis. In thecase of some indicators, most notably the proposed resident experience, staffexperience and resident health-related QOL indicators, few RACS currently collectsuch data and new data collection activity will be required. Unlike the clinical

indicators where a census approach is currently implemented (i.e. data is collectedabout all pertinent residents), a sampling strategy will be required for these newindicators. From a statistical viewpoint, there is no need to perform census studiesof these indicators in most RACS. It should nevertheless be noted that in the caseof small RACS, because of the very small number of residents, it is likely that somemay require the collection of data from all residents and/or carers.
The exact sample frame for each RACS will need a detailed consideration of thecurrent size and throughput of each RACS. There will be a suitable balance betweendata collection effort and the need for data validity and statistical accuracy. Onceagain there will need to be consultation between the DHS and the RACS toformulate an agreed sampling strategy that adequately balances effort andoutcomes.
Data validation issues
The second substantive issue is the issue of data validation and quality. Theaccreditation standards generally require some degree of validation of the datareported by RACS in their accreditation submissions. The Project Team does notsuggest that an onerous validation regimen should or needs to be constructed.However residents and their families and the Victorian and provider communitiesneed to have confidence in the fact that data reported by RACS are credible andaccurate. This can be achieved in various ways. The first is through clear andunambiguous data collection protocols so that variations in data quality do not arisethrough misunderstandings of the data collection processes and protocol variations.The second is by a process of direct validation of data by people outside the employof the specific RACS. Once again the Project Team does not consider that a censusapproach should be employed. There are several different ways that this could beimplemented. One way might be to devise a validation cycle where each RACS isguaranteed that a data validation exercise will occur once over a three-year cyclebut that the timing will be randomly determined. For example, with 120 RACS and asix monthly cycle, this suggests that at each cycle 20 RACS would undergo avalidation exercise at each data collection. For quarterly data collection thissuggests a rate of 10 RACS at each data collection. Another way might be to nothave a specific requirement that all RACS will have a data validation exercise over aparticular period, but rather have a random selection procedure with the proviso thatno RACS will have a validation exercise repeated over a specified period (e.g. threeyears). This decision needs to be made on the basis of the balance betweenresources and data quality requirements. The over three year census approach ismore comprehensive but it is more resource intensive. It is recommended that thedecision involve detailed consultation between the DHS and RACS.
86 Public Sector Residential Aged Care

Quality of Care Performance Indicator Project Report 87
Dissemination of indicator results
The third substantive issue is how the indicator results should be disseminated. Animportant driver in quality improvement activities is the use of benchmark datawhere services/facilities compare their performance on common data andindicators with each other. Benchmarking provides vital data concerning theperformances of RACS and enables their valid interpretation. In order to accrue thefull benefits of the QIs, the Project Team recommends open disclosure, however it isto be expected that most RACS will want to be satisfied with the reliability andvalidity of the data and processes before publishing their QI data. Central toagreement on dissemination will be a collaborative approach between DHS andRACS alongside timely feedback.
Cultural background and indicators
In any credible indicator set consideration needs to be given to factors that mayalter the pertinence of the indicators for different groups of residents affected bythem. In the present context, the Project Team has attempted to make the indicatorsgender and culturally neutral. That is, they are designed so that they do not requiredifferent interpretations according to the people to whom they are being applied.Thus for clinical indicators such as incidence of new fractures the indicators haveequal application across the different groups. Similarly, a fall is a fall, no matter thegender or culture of the resident involved.
People from different cultures have similar requirements of high QOL and positivecare experiences in RACS. The measures to be used of these domains will need tobe culturally appropriate. The outcomes of a current project using theCommonwealth Resident Experience Tools in association with the Partners inCulturally Appropriate Care Victoria (PICVIC) to assess the suitability of these Tools,will be potentially useful to the future validation of the Resident Experience Tools forthe developments suggested in the current Project.
Proposed piloting of QIs in RACS
The proposed implementation strategy for the QIs takes account of the barriers andstrategies identified by the consultations and better practice in changemanagement. Gaining support from the RACS generally will be facilitated by testingthe QIs initially in a small number of RACS to identify and address anyimplementation issues. The following steps are suggested in implementing the pilotphase in RACS:
1. Publish final report on DHS (Aged Care) website;
2. Identify RACS to be involved in the pilot of QIs;
3. Use an action research approach to implementation and evaluation;
4. Provide education of staff at pilot RACS;

5. Establish action groups/liaison persons at each pilot RACS to assistimplementation and clarify any matters related to the QIs;
6. Implement through 2 to 3 cycles, and
7. On the basis of feedback from pilot RACS, finalise/modify the QI collection andimplementation strategy for roll out to the remaining Victorian public sector RACS.
1. Publication of Final ReportMaking available the Project Report will enable all stakeholders to become familiarwith the QIs and related issues.
2. Identification of RACS for pilot of QIs It was agreed at the Project Advisory Group meeting that RACS represented on theProject Advisory Group would offer good pilot sites, as understanding of the QIs isalready high. It was also anticipated that other RACS would self-nominate toparticipate in the piloting phase of this Project. DONs (or nominees) of these siteswould meet with DHS to finalise the details of the QI collection process. It isenvisaged that this group will develop more detailed audit tools potentially includingstructure and process criteria related to each outcome. This group would continueto meet regularly throughout the implementation phase to lead the action process.
3. Use an action research approach to implementation and evaluation Using an action research approach increases the likelihood that staff will ‘own’ theoutcomes and that change will be embedded in practice. The advantage of thisapproach is that stakeholders participate in the identification of problems, theimplementation of change, and the subsequent evaluation of outcomes (Birkett1995). The action research process is cyclical, consisting of goal setting, planning,data collection, implementation of strategies, and evaluation. The process isrepeated until the desired improvement is achieved. It is effective in achievingincremental change which is likely to be sustainable, because there is ongoinganalysis and critical reflection.
Figure 2: Action Research Structure (Street 1999)
88 Public Sector Residential Aged Care
Reflection
Reflection
Collecting baseline data Take action and
monitor effects
Implement action and monitor effects
Plan actionAnalyse effects
Analyse effects

Quality of Care Performance Indicator Project Report 89
4. Education of staff at pilot RACS Once the pilot RACS have been determined, staff at all levels will need to undergotraining and education about QIs in general, as well as about the specific QIs to bepiloted. Staff education was recommended throughout the forums and interviews asvital. Topics that could be covered in information sessions include:
• QIs and how they relate to accreditation and CQI;
• Using QIs to improve quality of care – e.g. through own performance and throughbenchmarking against other RACS;
• Specific information regarding the selected QIs;
• The proposed implementation strategy.
If knowledge/skill gaps are identified through the action research process, furthereducation could then be initiated to support staff development. Such education, inresponding to an identified need, may be perceived as more obviously relevant andthus attractive to staff.
5. Establishment of action group/liaison person at each RACS Change management requires good leadership and facilitation skills. The changeliterature demonstrates the need for participation and ownership if change is to besuccessfully implemented and embedded (Goleman 2002; Mant 1997). Thereforethe RACS selected for the pilot should have leaders who are committed to the QIsand who can generate enthusiasm/support for their implementation. In addition, anaction team constituted of staff that will assist with developing context specificstrategies for implementation at their site and provide feed-back to the group as partof the action cycle will further enable the process. Thus there would be an overallsteering group made up of the DONs and DHS supported by action teams at eachsite.
6. Implementation through 2 to 3 cycles It is envisaged that two to three cycles of QI data collection and reporting will berequired to pilot the QIs and it is recommended that the duration of a cycle be 3months. Regular meetings and feedback from the action teams will assist therefinement of the QIs and further implementation strategy.
7. Use feedback from pilot RACS to finalise/modify the QI collection andimplementation strategy for roll out to the remaining Victorian public sectorRACS. This would include addressing any risk adjustment considerations. Coefficients tobe used in the risk adjustment formula are to be derived from data collected in thepilot phase. It is recommended that risk adjustment should not occur at theindicator level, but at the reporting (benchmark) level.

This Project, conducted for the Aged Care Branch of the DHS (Victoria), hasidentified and made recommendations for a set of QIs forVictorian public sectorRACS. The recommended QIs were identified through a literature review andconsultations with residential aged care stakeholders, experts in clinical/qualityindicator development and a consumer issues focus group, in addition to input andguidance from the Project Advisory Group.
It is recommended that six QIs are currently ready to be implemented in a pilotphase. These are:
• Incidence of stage 1–4 pressure ulcers
• Incidence of new fractures as a proportion of falls
• Incidence of daily physical restraints
• Incidence of residents using nine or more different medications
• Incidence of weight change (i.e. a significant increase or decrease from the norm)
• Prevalence of symptoms of depression
Four other QIs, whilst no less important, require further refinement before theirimplementation. These are:
• Incidence of behavioural symptoms
• Resident experiences of care
• Health related QOL of residents
• Staff experiences of care
A piloting phase is suggested and it is clear that the implementation process shouldinclude a strong educative element. This would include information about what QIsare and their role in the accreditation process and should be provided to all levels ofstaff. There will also need to be a process for the subsequent development of theindicators recommended in the three new domains of resident experience, staffexperience and resident health-related QOL, as well as the indicator relating tobehaviours. It is suggested that the development of these new indicators beconducted in parallel with the roll out of the currently collected indicators and beadded to the set perhaps at the time of the second data collection cycle. This willallow the timely introduction of the indicator system without having to wait for thefull development of the new indicators.
9. Conclusion
90 Public Sector Residential Aged Care

Quality of Care Performance Indicator Project Report 91
A key feature of further activity is engagement between RACS and the DHS tofinalise the indicators and their implementation. The implementation of therecommended Victorian public sector RACS QI set should take a participatoryapproach based on the principles of action research and contemporary changemanagement. As expressed during the consultations, it is important that there is apartnership between DHS and RACS and that RACS receive timely feedback fromthe DHS. In addition, involvement of staff at all levels within each RACS will supportimplementation. Finally, while monitoring QIs will illuminate poor practice, a punitiveapproach will only result in low compliance and inaccurate recording. For the QIs topositively impact upon care for older people in Victorian public sector RACS, theemphasis must be on highlighting and sharing practice improvements.

Abt Associates Inc (2001a). Identification and Evaluation of Existing QualityIndicators that are appropriate for Use in Long-Term Care Settings. Final Report forCenters for Medicare and Medicaid Services (CMS). October 1 2001.
Abt Associates (2001b). Appropriateness of Nurse Staffing Ratios in NursingHomes. Report to Congress. Phase II Final. Volume 1. Report for Centers forMedicare and Medicaid Services (CMS). December 24 2001.
Abt Associates Inc (2003). Validation of Long-Term and Post-Acute Care QualityIndicators. Final Report. Prepared for Centers for Medicare and Medicaid Services(CMS). June 10 2003.
Aged Care Standards Agency. Accreditation Guide for Residential Aged CareServices. Issue 2. December 2001.
Australian Pharmaceutical Advisory Council (APAC). Guidelines for MedicationManagement in Residential Aged Care Facilities. 3rd ed., November 2002.
Bartlett, H. & Boldy, D. (2001). Recent Developments in Australia and TheirRelevance to the UK. Quality in Ageing – Policy, Practice and Research 2(3), 3–14.
Bates-Jensen, B. M., Cadogan, M., Osterweil, D., Levy-Storms, L., Jorge, J., Al-Samarrai, N., Grbic, V., & Schnelle, J.F. (2003). The Minimum Data Set Pressure UlcerIndicator: Does it Really Reflect Differences in Care Processes Related to PressureUlcer Prevention and Treatment in Nursing Homes? Journal of the AmericanGeriatrics Society 51, 1203–12.
Berlowitz, D.R., Young, G.J., Hickey, E.C., Saliba, D., Mittman, B.S., Czarnowski, E.,Simon, B., Anderson, J.J., Ash, A.S., Rubenstein, L.V. & Moskowitz, M.A. (2003).Quality Improvement Implementation in the Nursing Home. HSR: Health ServicesResearch, 38(1), 65–83.
Berg, K., Mor, V., Morris, J., Murphy, K.M., Moore, T., & Harris, Y. (2002). Identificationand Evaluation of Existing Nursing Homes Quality Indicators. Health Care FinancingReview, 23(4), 19–36.
Biles, B., Hersch Nicholas, L., & Burke, R. Quality, Staffing and Payment of NursingHomes: Current Evidence and the Next Steps. Center for Health Services Researchand Policy, The George Washington University, May 22 2003.
Birkett, M. (1995). Is Audit Action Research? Physiotherapy, 81(4), 190–4.
Bowers, B. & Becker, M. (1992). Nurse’s Aides in Nursing Homes: The Relationshipbetween Organization and Quality. The Gerontologist, 32(3), 360–6.
Bowers, B. J., Esmond, S. & Jacobson, N. (2000). The Relationship between Staffingand Quality in Long-Term Care Facilities: Exploring the Views of Nurse Aides. Journalof Nursing Care Quality, 14(4), 55–64.
Bowers, B. J., Fibich, B., & Jacobson, N. (2001). Care-as-service, Care-as-relating,Care-as-comfort: Understanding Nursing Home Residents’ Definitions of Quality.The Gerontologist 41(4), 539–45.
10. References
92 Public Sector Residential Aged Care

Quality of Care Performance Indicator Project Report 93
Braithwaite, V., Braithwaite, J., Gibson, D., & Makkai, T. (1992). Progress in Assessingthe Quality of Australian Nursing Home Care. Australian Journal of Public Health16(1), 89–97.
Brannon, D., J. Zinn, S., Mor, V., & Davis, J. (2002). An Exploration of Job,Organizational and Environmental Factors Associated with High and Low NursingAssistant Turnover. The Gerontologist 42(2), 159–68.
Cadogan, M.P., Schnelle, J.F., Yamamoto-Mitani, N., Cabrera, G. & Simmons, S.F.(2004). A Minimum Data Set Prevalence of Pain Quality Indicator: Is It Accurate andDoes It Reflect Differences in Care Processes? Journal of Gerontology: MEDICALSCIENCES, 59A(3), 281–5.
Casarett, D. J., Hirschman, K.B., Miller, E.R. & Farrar, J.T. (2002). Is Satisfaction withPain Management a Valid and Reliable Quality Indicator for Use in Nursing Homes?Journal of the American Geriatrics Society 50, 2029–34.
Castle, N. G. (2001). AdministratorTurnover and Quality of Care in Nursing Homes.The Gerontologist 41(3), 757–67.
Center for Health Systems Research and Analysis, University for Wisconsin-Madison. Facility Guide for the Nursing Home Quality Indicators. September 281999.
Centers for Medicare and Medicaid, Department of Health and Human ServicesUSA. Revised Long-Term Care Resident Assessment Instrument User’s Manual.Version 2.0. December 2002.
Chou, S.-C., Boldy, D.P. & Lee, A.H. (2002). Measuring Job Satisfaction in ResidentialAged Care. International Journal for Quality in Health Care 14(1), 49–54.
Commonwealth of Australia. Quality of Care Principles 1997, Aged Care Act 1997.
Courtney, M. & Spencer, L. (2000). Clinical Indicators of Quality in Residential AgedCare Facilities. What’s best? Collegian 7(2), 14–19.
Courtney, M., Edwards, H., Stephan, J., O’Reilly, M. & Duggan, C. (2003). Quality ofLife Measures for Residents of Aged Care Facilities: A Literature Review. AustralasianJournal on Ageing 22(2), 58–64.
Donabedian, A. (1992). Quality Assurance in Health Care: Consumers’ Role. Qualityin Health Care 1(4), 247–51.
Donabedian, A. (1988). The Quality of Care. How Can it Be Assessed? Journal of theAmerican Medical Association 260(12), 1743–8.
Doyle, C. (1991). How to Assess the Quality of Long Term Care. Working Paper 14.Centre for Health Program Evaluation, Melbourne. December 1991.
Doyle, C. & Carter, M. (1992). Consumer and ProviderViews on Assessing theQuality of Residential Aged Care. Working Paper 27. Centre for Health ProgramEvaluation, Melbourne. November 1992.

Feilmann, A. (2000). Measuring the Prevalence of Weight Loss. The Quality IndicatorProcess at Iowa Veterans Home. Health Care Food & Nutrition Focus 17(2), 8–11.
Fries, B. E., Simon, S.E., Morris, J.N., Flodstrom, C. & Bookstein, F.L. (2001). Pain inU.S. Nursing Homes: Validating a Pain Scale for the Minimum Data Set. TheGerontologist, 41(2), 173–9.
Glass, A.P. (1991). Nursing Home Quality: A Framework for Analysis. The Journal ofApplied Gerontology, 10(1), 5–18.
Goleman, D. (2002). The New Leaders, Timewarner Paperbacks: London.
Grant, N. K., Reimer, M. & Bannatyne, J. (1996). Indicators of Quality in Long-termCare Facilities. International Journal of Nursing Studies, 33(5), 469–78.
Grenade, L. & Boldy, D. (2002). The Accreditation Experience. Views of ResidentialAged Care Providers. Geriaction 20(1), 5–9.
Gustafson, D.H., Sainfort, F.C., Konigsveld, R.V., & Zimmerman, D.R. (1990). TheQuality Assessment Index (QAI) for Measuring Nursing Home Quality. HealthServices Research, 25, 97–127.
Harrigan, M. (2000). Quest for Quality in Canadian Health Care: Continuous QualityImprovement (2nd Ed.).
Harrington, C. (2003). New Nursing Home Web Site. Australian Journal of Nursing,103(9), 98.
Harris, Y. & Clauser, S.B. (2002). Achieving Improvement Through Nursing HomeQuality Measurement. Health Care Financing Review 23(4), 5–18.
Hawes, C., Morris, J.N., Phillips, C.D. Fries, B.E., Murphy, K. & Mor, V. (1997).Development of the Nursing Home Resident Assessment Instrument in the USA.Age and Ageing 26(6), S19–S26.
Holtzman, J., Degelau, J., Meyers, R., Christianson, C. & Lurie, N. (1997).Development and Testing of a Process Measure of Nursing Home Quality of Care.Journal of the American Geriatrics Society 45, 1203–7.
Joanna Briggs Institute (JBI 2002). Physical Restraint in Acute and Residential Care.A Systematic Review. No. 22.
Kane, R.A., Caplan, A.L., Urv-Wong, E.K., Freeman, I.C, Aroskar, M.A & Finch, M.(1997). Everyday Matters in the Lives of Nursing Home Residents: Wish for andPerception of Choice and Control. Journal of the American Geriatrics Society, 45,1086–93.
Kane, R. L. (1998). Assuring Quality in Nursing Home Care. Journal of the AmericanGeriatrics Society 46, 232–7.
Kane, R. A. (2001). Long-Term Care and a Good Quality of Life: Bringing Them CloserTogether. The Gerontologist 41(3), 293–304.
Kane, R. A., Kling, K.C., Bershasky, B., Kane, R.L., Giles, K., Degenholtz, H.B. Liu, J. &
94 Public Sector Residential Aged Care

Quality of Care Performance Indicator Project Report 95
Cutler, L.J. (2003). Quality of Life Measures for Nursing Home Residents. Journal ofGerontology: MEDICAL SCIENCES 58A(3), 240–8.
Kane, R. A. (2003). Definition, Measurement and Correlates of Quality of Life inNursing Homes: Toward a Reasonable Practice, Research, and Policy Agenda. TheGerontologist 43(Special Issue II), 28–36.
Kaplan, M. J. (2002). A Powerful New Tool For Nursing Home Consumers: TheQuality Indicator Report. Annals of Long Term Care 10(6), 21–4.
Karon, S. L. & Zimmerman, D.R. (1996). Using Indicators to Structure QualityImprovement Initiatives in Long-Term Care. Quality Management in Health Care 4(3),54–66.
Karon, S. L. & Zimmerman, D.R. (1998). Nursing Home Quality Indicators and QualityImprovement Initiatives. Topics in Health Information Management 18(4), 46–58.
Kazandjian, V. A., N. Matthes, et al. (2003). Are Performance Indicators Generic?The International Experience of the Quality Indicator Project. Journal of Evaluation inClinical Practice 9(2), 265–76.
Kovner, C., M. Mezey, et al. (2000). Research Priorities for Staffing, Case Mix andQuality of Care in U.S Nursing Homes. Journal of Nursing Scholarship 32(1), 77–80.
Madsen, W. & Leonard, M. (1997). Monitoring Pressure Ulcers in Nursing Homes.Journal of Quality Clinical Practice 17, 209–13.
Manard, B. Nursing Home Quality Indicators: Their Uses and Limitations. Papercommissioned by the Independent Living and Long-Term Care Team of the AARPPublic Policy Institute. December 2002.
Mant, A. (1997). Intelligent Leadership. Allen & Unwin: Sydney.
Marquis, R. (2002). Quality in Aged Care: A Question of Relational Ethics?Australasian Journal on Ageing 21(1), 25–9.
Mattiasson, A.-C. & Andersson, L. (1997). Quality of Nursing Home Care Assessedby Competent Nursing Home Patients. Journal of Advanced Nursing 26, 1117–24.
Mitchell, P. & Koch, T. (1997). An Attempt to Give Nursing Home Residents a Voice inthe Quality Improvement Process: The Challenges of Frailty. Journal of ClinicalNursing 6, 453–61.
Mor, V., Angelelli, J., Jones, Roy, J., Moore, T. & Morris, J. (2003). Inter-rater Reliabilityof Nursing-Home Quality Indicators. BioMed Central Health Services Research 3(20),
Mosby’s Medical, Nursing and Allied Health Dictionary (2002). 6th Edition. Mosby:USA.
Moxey, E. D., J. P. O’Connor, et al. (2002). Developing a Quality Measurement Tooland Reporting Format for Long Term Care. Journal on Quality Improvement 28(4),180–96.

Mukamel, D. B. (1997). Risk-adjusted Outcome Measures and Quality of Care inNursing Homes. Medical Care 35(4), 367–85.
Mukamel, D. B. & Brower, C.A. (1998). The Influence of Risk Adjustment Methods onConclusions About Quality of Care in Nursing Homes Based on Outcome Measures.The Gerontologist 38(6), 695–703.
Mukamel, D. B., Watson, N.M., Meng, H. & Spector, W.D. (2003). Development of aRisk-Adjusted Urinary Incontinence Outcome Measure of Quality for NursingHomes. Medical Care 41(4), 467–78.
Oborne, C. A., R. Hooper, et al. (2003). Explicit, Evidence-based Criteria to Assessthe Quality of Prescribing to Elderly Nursing Home Residents. Age and Ageing 32,102–8.
Pearson, A., Hocking, S., Mott, S. & Riggs, A. (1993). Quality of Care in NursingHomes: From the Resident’s Perspective. Journal of Advanced Nursing 18, 20–4.
Pearson, A. (2003).Key Performance Indicators for Nursing. International Journal ofNursing Practice 9, 337.
Phillips, C. D., Zimmerman, D., Bernabei, R. & Jonsson, P.V. (1997). Using theResident Assessment Instrument for Quality Enhancement in Nursing Homes. Ageand Ageing 26(6), 77–82.
Polivka, L. & Salmon, J.R. (2001). Consumer-directed Care: An Ethical, Empirical andPractical Guide for State Policymakers. Florida Policy Exchange Center on Aging.June 2001.
Popejoy, L. L., Rantz, M.J., Conn, V., Wipke-Tevis, D., Grando, V.T. & Porter, R. (2000).Improving Quality of Care in Nursing Facilities: Gerontological Clinical NurseSpecialist as Research Nurse Consultant. Journal of Gerontological Nursing 26(4),6–13.
Porell, F. & Caro, F.G. (1998). Facility-Level Outcome Performance Measures forNursing Homes. The Gerontologist 38(6), 665–83.
Rantz, M. J., Popejoy, L., Mehr, D.R., Zwygart-Stauffacher, M., Hicks, L.L., Grando, V.,Conn, V.S., Porter, R., Scott, J. & Maas, M. (1997). Verifying Nursing Home CareQuality Using Minimum Data Set Quality Indicators and Other Quality Measures.Journal of Nursing Care Quality 12(2), 54–62.
Rantz, M. J., Mehr, D.R., Popejoy, L., Zwygart-Stauffacher, M., Hicks, L.L., Grando, V.,Conn, V.S., Porter, R., Scott, J. & Maas, M. (1998). Nursing Home Care Quality: AMultidimensional Theoretical Model. Journal of Nursing Care Quality 12(3), 30–46.
Rantz, M. J., Zwygart-Stauffacher, M., Popejoy, L., Grando, V.T., Mehr, D.R., Hicks,L.L., Conn, V.S., Wipke-Tevis, D., Porter, R., Bostick, J. & Maas, M. (1999a). NursingHome Care Quality: A Multidimensional Theoretical Model Integrating the Views ofConsumers and Providers. Journal of Nursing Care Quality 14(1), 16–37.
96 Public Sector Residential Aged Care

Quality of Care Performance Indicator Project Report 97
Rantz, M.J., Popejoy, L., Zwygart-Stauffacher, M., Wipke-Tevis, D.D., & Grando, V.T.(1999b). Minimum Data Set and Resident Assessment Instrument: Can usingstandardized assessment improve clinical practice and outcomes of care? Journal ofGerontological Nursing, 25(6), 35–43.
Rantz, M. J., D. R. Mehr, et al. (2000a). Initial Field Testing of an Instrument toMeasure: Observable Indicators of Nursing Home Care Quality. Journal of NursingCare Quality 14(3), 1–12.
Rantz, M. J., G. F. Petroski, et al. (2000b). Setting Thresholds for Quality IndicatorsDerived from MDS Data for Nursing Home Quality Improvement Reports: An Update.Journal on Quality Improvement 26(2), 101–10.
Rantz, M. J. & Mehr, D.R. (2001a). A Quest to Understand and Measure NursingHome Quality of Care. Long-Term Care Interface 2(7), 34–8.
Rantz, M. J., Popejoy, L., Petroski, G.F., Madsen, R.W., Mehr, D.R., Zwygart-Stauffacher, M., Hicks, L.L., Grando, V., Wipke-Tevis, D.D., Bostick, J., Porter, R.,Conn, V.S. & Maas, M. (2001b). Randomized Clinical Trial of a Quality ImprovementIntervention in Nursing Homes. The Gerontologist 41(4), 525–38.
Rantz, M., Jensdottir, A.B., Hjaltadottir, I., Gudmundsdottir, H., Gudjonsdottir, J.S.,Brunton, B. & Rook, M. (2002). International Field Test Results of the ObservableIndicators of Nursing Home Care Quality Instrument. International Nursing Review49, 234–42.
Rantz, M. J., Hicks, L., Petroski, G.F., Madsen, R.W., Mehr, D.R., Conn, V., Zwygart-Staffacher, M. & Maas, M. (2004). Stability and Sensitivity of Nursing Home QualityIndicators. Journal of Gerontology: MEDICAL SCIENCES, 59A(1), 79–82.
Robertson, J., Fryer, J.L., O’Connell, D.L., Smith, A.J. & Henry, D.A. (2002). Limitationsof Health Insurance Commission (HIC) Data for Deriving Prescribing Indicators.Medical Journal of Australia 176(May), 419–24.
Rubin, H. R., Pronovost, P. & Diette, G.B. (2001). From a Process of Care to aMeasure: The Development and Testing of a Quality Indicator. International Journalfor Quality in Health Care 13(6), 489–96.
Saliba, D. & Schnelle, J.F. (2002). Indicators of the Quality of Nursing HomeResidential Care. Journal of the American Geriatrics Society 50, 1421–30.
Schirm, V., Albanese, T. & Garland, T.N. (1999). Understanding Nursing Home Qualityof Care: Incorporating Caregivers’ Perceptions Through Structure, Process andOutcome. Quality Management in Health Care, 8(1), 55–63.
Schnelle, J. F. (1997). Can Nursing Homes Use the MDS to Improve Quality? Journalof the American Geriatrics Society 45, 1027–8.
Schnelle, J. F., Wood, S., Schnelle, E.R. & Simmons, S.F. (2001). MeasurementSensitivity and the Minimum Data Set Depression Quality Indicator. TheGerontologist 41(3), 401–5.

Schnelle, J. F., Cadogan, M.P., Yoshii, J., Al-Samarrai, N.R., Osterweil, D., Bates-Jensen, B. & Simmons, S.F. (2003). The Minimum Data Set Urinary IncontinenceQuality Indicators: Do They Reflect Differences in Care Processes Related toIncontinence? Medical Care 41(8), 909–22.
Schnelle, J.F., Bates-Jensen, B.M., Levy-Stroms, L., Grbic, V., Yoshii, J., Cadogan, M. &Simmons, S.F. (2004). The Minimum Data Set Prevalence of Restraint QualityIndicator: Does it Reflect Differences in Care? The Gerontologist, 44(2), 245–55.
Simmons, S. F. & Schnelle, J.F. (2001). The Identification of Residents Capable ofAccurately Describing Daily Care: Implications for Evaluating Nursing Home CareQuality. The Gerontologist 41(5), 605–11.
Simmons, S. F., Babineau, S., Garcia, E. & Schnelle, J.F. (2002). Quality Assessmentin Nursing Homes by Systematic Direct Observation: Feeding Assistance. TheJournals of Gerontology. Series A, Biological Sciences and Medical Sciences, 57A(10),M665–M671.
Simmons, S. F., Garcia, E.T., Cadogan, M.P., Al-Samarrai, N.R., Levy-Storms, L.F.,Osterweil, D. & Schnelle, J.F. (2003). The Minimum Data Set Weight-Loss QualityIndicator: Does it Reflect Differences in Care Processes Related to Weight Loss?Journal of the American Geriatrics Society 51, 1410–18.
Spector, W. D. & Mukamel, D.B. (1998). Using Outcomes to Make Inferences AboutNursing Home Quality. Evaluation and the Health Professions 21(3), 291–315.
Sprague, L. (2003) Converging on Nursing Home Quality. National Health PolicyForum Issue Brief, No. 787, January 9 2003.
Street, A. (1999). Bedtimes in Nursing Homes – An Action-Research Approach. In R.Nay & S. Garratt (Eds.), Nursing Older People. Maclennan & Petty: Sydney.
Teal, C. (2002). Direct Care Workers – Number One Quality Indicator in Long TermCare. A Consumer’s Perspective. NCMJ 63(2): 102–5.
Thomas, S.A., Moore, K., Nay, R., Fonda, D. Marosszeky, N & Hawthorne, G. (2004).Continence Outcomes Measurement Final Report, Melbourne: La Trobe University.ISBN 0642 82408 8.
Thomson, R.G., McElroy, H. & Kazandjian, V.A. (1997). Maryland Hospital QualityIndicator Project in the United Kingdom: An Approach for Promoting ContinuousQuality Improvement, Quality in Health Care, 6, 49–55.
Wiener, J. M. (2003). An Assessment of Strategies for Improving Quality of Care inNursing Homes. The Gerontologist 43(Special Issue II), 19–27.
Yeh, S.-H., Lin, L-W. & Lo, S.K. (2003). A Longitudinal Evaluation of Nursing HomeCare Quality in Taiwan. Journal of Nursing Care Quality 18(3), 209–16.
Zimmerman, D. R., Karon, S.L., Arling, G., Clark, B.R., Collins, T., Ross, R. & Sainfort,F. (1995). Development and Testing of Nursing Home Quality Indicators. Health CareFinancing Review 16(4), 107–27.
98 Public Sector Residential Aged Care

Quality of Care Performance Indicator Project Report 99
Zimmerman, S., Gruber-Baldini, A.L., Hebel, J.R., Sloane, P.D. & Magaziner, J. (2002).Nursing Home Facility Risk Factors for Infection and Hospitalization: Importance ofRegistered Nurse Turnover, Administration and Social Factors. Journal of theAmerican Geriatrics Society 50, 1987–95.
Zimmerman, D. R. (2003). Improving Nursing Home Quality of Care ThroughOutcomes Data: The MDS Quality Indicators. International Journal of GeriatricPsychiatry 18, 250–7.
Zisselman, M. H., Warren, R.S., Cutillo-Schmitter, T. & Denman, S.J. (2002).Challenging the Quality of the Quality Indicator, ‘Depression Without Treatment’.Journal of the American Medical Directors Association 3, 41–5.

100 Public Sector Residential Aged Care
APPENDIX 11.1Table 1: Quality indicators for RACS used in the MDS 2.0 Version 6.3
Domain Quality Indicator Process/Outcome
Accidents Incidence of new fractures OutcomeNumerator: Residents with new fractures on most recentassessmentDenominator: Residents who did not have fractures on the previous assessment
Prevalence of falls OutcomeNumerator: Residents who had falls on most recent assessmentDenominator: All residents on most recent assessment
Behavioural/ Prevalence of behavioural symptoms affecting others OutcomeEmotional (verbally abusive, physically abusive, or socially inappropriate/Patterns disruptive behaviour
Numerator: Residents with behavioural symptoms affecting others on most recent assessmentDenominator: All residents on most recent assessment
Prevalence of symptoms of depression (sad mood plus at Outcomeleast two of following: resident made negative statements,agitation or withdrawal, wakes with unpleasant mood, suicidal or has recurrent thoughts of death, weight loss. Numerator: Residents with symptoms of depression on mostrecent assessmentDenominator: All residents on most recent assessment
Prevalence of symptoms of depression and no Bothantidepressant therapy Numerator: Residents with symptoms of depression on mostrecent assessment and no antidepressant therapy Denominator: All residents on most recent assessment
Clinical Prevalence of residents using nine or more different medications ProcessManagement Numerator: Residents who received 9 or more different
medications on most recent assessmentDenominator: All residents on most recent assessment
Cognitive Incidence of cognitive impairment OutcomePatterns Numerator: Residents who were newly cognitively impaired
on most recent assessmentDenominator: Residents who were not cognitively impaired on previous assessment
Elimination/ Prevalence of bladder or bowel incontinence OutcomeIncontinence Numerator: Residents who were frequently incontinent or
incontinent on most recent assessmentDenominator: All residents, except as noted in exclusion
…continued next page
11. Appendices

Quality of Care Performance Indicator Project Report 101
Domain Quality Indicator Process/Outcome
Prevalence of occasional bladder or bowel incontinence Bothwithout a toileting plan Numerator: Residents without toileting plan on mostrecent assessmentDenominator: Residents with frequent incontinence oroccasionally incontinent in either bladder or bowel on most recent assessment.
Prevalence of indwelling catheters ProcessNumerator: Indwelling catheter on most recent assessmentDenominator: All residents on most recent assessment
Prevalence of faecal impaction OutcomeNumerator: Residents with faecal impaction on mostrecent assessmentDenominator: All residents on most recent assessment
Infection Prevalence of urinary tract infections OutcomeControl Numerator: Residents with urinary tract infections on most
recent assessmentDenominator: All residents on most recent assessment
Nutrition/ Prevalence of weight loss OutcomeEating Numerator: Proportion of residents with weight loss of 5% or
more in the last 30 days or 10% or more in the last 6 months on most recent assessmentDenominator: All residents on most recent assessment
Prevalence of tube feeding ProcessNumerator: Residents with tube feeding on most recentassessmentDenominator: All residents on most recent assessment
Prevalence of dehydration OutcomeNumerator: Residents with dehydration Denominator: All residents on most recent assessment
Physical Prevalence of bedfast residents OutcomeFunctioning Numerator: Residents who are bedfast on most recent
assessmentDenominator: All residents on most recent assessment
Incidence of decline in late loss ADLs OutcomeNumerator: Residents showing ADL decline in self-performance between previous and most recent assessment. Denominator: All residents who have most recent and previous assessments (Excluding those who cannot decline because they are already totally dependent or who are comatose on the previous assessment)
…continued next page

102 Public Sector Residential Aged Care
Domain Quality Indicator Process/Outcome
Incidence of decline in range of motion (ROM) OutcomeNumerator: Residents with increases in functional limitation in ROM between previous and most recent assessments Denominator: All residents with previous and most recentassessments, with the exclusion noted (i.e. residents with maximal loss of ROM at previous assessment)
Psychotropic Prevalence of antipsychotic use in the absence of psychotic ProcessDrug Use and related conditions
Numerator: Residents receiving anti-psychotics on mostrecent assessmentDenominator: All residents on most recent assessment, exceptthose with psychotic or related conditions
Prevalence of antianxiety/hypnotic use ProcessNumerator: Residents who received antianxiety or hypnotics on most recent assessmentDenominator: All residents on most recent assessment, exceptthose with psychotic or related conditions.
Prevalence of hypnotic use more than two times in the last week ProcessNumerator: Residents who received hypnotics more than 2 times in last week on most recent assessmentDenominator: All residents on most recent assessment
Quality Of Prevalence of daily physical restraints ProcessLife Numerator: Residents who were physically restrained daily
on most recent assessmentDenominator: All residents on most recent assessment
Prevalence of little or no activity EitherNumerator: Residents with little or no activity on mostrecent assessmentDenominator: All residents (excluding comatose) on mostrecent assessment
Skin Care Prevalence of stage 1–4 pressure ulcers OutcomeNumerator: Residents with pressure ulcers (Stage 1–4) on most recent assessmentDenominator: All residents on most recent assessment
Source: Table modified from CHRSA (www.chrsa..wisc.edu) and Zimmerman (2003).

Quality of Care Performance Indicator Project Report 103
APPENDIX 11.2
Indicators of quality of care identified by Grant et al. (1996)
Fourteen major indicators of quality of care (see following) and many sub-indicators(not replicated here) were identified:
• Nature of the facility
• Nature of relationships (e.g. caring, shared experience)
• Acknowledgement of the personhood of the resident (e.g. involvement in meaningfulactivities, recognition of personal property, protection of privacy)
• Nature of communication with residents (e.g. content of conversation, commitmentof time for conversation, manner or tone of the communication)
• Disposition of decision making (e.g. offering of choice, disposition of power)
• Judgements about assistance required
• Degree and nature of surveillance
• Presence of planning and judgement about care (e.g. discuss care with resident,Assessment)
• Nature of communication with the health care team (e.g. communication among themembers of the nursing staff, team conferences)
• Do or assist with activities of living which residents cannot do for themselves
• Do or assist with therapeutic activities which residents cannot do for themselves
• Manner in which activities of living and therapeutic activities are carried out (e.g.correctness, thoroughness, perserverance, pace, reliability)
• Nature of interaction with significant others (e.g. recognition of significant others asproviders of personal supplies, significant others as advocates)
• Provision of use and attributes of resources (e.g. nursing staff, time, provision ofequipment and supplies).

104 Public Sector Residential Aged Care
APPENDIX 11.3 Table 2: Long term care quality indicators used by International Quality IndicatorProject
Indicator 1: Unplanned Weight Change Unplanned weight loss Unplanned weight gain
Indicator 2: Pressure Ulcers Pressure Ulcer Point Prevalence Stage I Pressure Ulcer Point Prevalence Stage II Pressure Ulcer Point Prevalence Stage III Pressure Ulcer Point Prevalence Stage IV Pressure Ulcer Point Prevalence
Indicator 3: Documented Falls Documented falls Falls due to resident/patient health status Falls due to response to treatment, medication or anaesthesia Falls due to environmental hazard Falls due to other causes Falls that resulted in injury Falls that resulted in injury with Severity Score 1Falls that resulted in injury with Severity Score 2Falls that resulted in injury with Severity Score 3 Residents/patients experiencing falls
Indicator 4: Unscheduled Transfers/Discharges to Inpatient Acute Care Unscheduled transfers/discharges to inpatient acute care within 72 hours of LTC admission Total unscheduled transfers/discharges to inpatient acute care Unscheduled transfers/discharges to inpatient acute care for cardiovasculardecompensation Unscheduled transfers/discharges to inpatient acute care for evaluation ortreatment of fractures Unscheduled transfers/discharges to inpatient acute care for gastrointestinal bleeding Unscheduled transfers/discharges to inpatient acute care for infection Unscheduled transfers/discharges to inpatient acute care for all othermedical/surgical reasons
…continued next page

Quality of Care Performance Indicator Project Report 105
Indicator 5: Nosocomial Infections Lower respiratory tract infections treated Resident/patient days in which lower respiratory tract infections were treated Symptomatic urinary tract infections treated Symptomatic urinary tract infections treated in residents/patients with indwelling catheters Symptomatic urinary tract infections treated in residents/patients without indwelling catheters Residents/patients treated for one or more symptomatic urinary tract infections Residents/patients with indwelling catheters treated for one or more symptomatic urinary tract infections Residents/patients without indwelling catheters treated for one or more symptomatic urinary tract infections
Indicator 6: Physical Restraint Events Physical restraint events Physical restraint events <1 hourPhysical restraint events >1 hour but < 4 hours Physical restraint events >4 hour but < 8 hours Physical restraint events >8 hour but < 16 hours Physical restraint events >16 hour but < 24 hours Physical restraint events >24 hours Physical restraint events due to cognitive disorderPhysical restraint events due to risk of falling Physical restraint events due to disruptive behaviourPhysical restraint events to facilitate treatmentPhysical restraint events for all other reasons Physical restraint events initiated between 7:00am and 2.59pm Physical restraint events initiated between 3:00pm and 10:59pm Physical restraint events initiated between 11:00pm and 6:59pm Residents/patients experiencing physical restraintResidents/patients with multiple restraint events
Source: http://www.qiproject.org/Brochure/IndLTC.pdf

106 Public Sector Residential Aged Care
APPENDIX 11.4Table 3: QIs identified by Saliba & Schnelle (2002) to measure nursing homeresidential care process
Preferences1. IF a vulnerable older person is admitted to a nursing home (NH) THEN within two weeks, the
resident’s preferences for daily life activities in all of the following areas should be assessed anddocumented in the record: sleep schedule, meals, roommates, telephone access, participationin activities, spirituality and privacy. 2. IF a NH resident can provide stable and realisticpreference information about daily life activities that are related to quality of life THEN thedegree to which these preferences are being met should be monitored at least quarterly afteradmission.
Assistance3. IF the MDS documents a resident’s self-performance of transfers as level 1, 2, 3 or 4 THEN the
resident should be offered assistance with transfer at least three times a day.
4. IF the MDS documents a resident’s self-performance of dressing or hygiene as level 1, 2, 3 or 4THEN the resident should be offered assistance with dressing or hygiene at least twice a day.
5. IF the MDS documents a resident’s self-performance of eating as level 1 , 2, 3 or 4 THEN theresident should be offered assistance with eating
6. IF the MDS documents a resident’s self-performance of toileting as level 1, 2, 3 or 4 THEN theresident should be offered assistance with toileting: Every two hours while awake Using a schedule based on formal need assessment (24 hour voiding record or pad test), orWhenever requested
7. IF the MDS documents a resident’s self-performance of any activity of daily living (ADL) as level1, 2, 3 or 4 or the resident or proxy reports needing assistance with an ADLTHEN the NH staffshould promote increased independence and self-performance (eg. graduated promotingprotocols matched to resident need)
8. IF the MDS documents a resident’s self-performance of any ADL as level 1, 2, 3 or 4 or theresident or proxy reports needing assistance with an ADLTHEN the resident should report thatshe/he receives verbal notification or cueing before the assistance is given, is not rushed tocomplete the task, and is not afraid to request assistance when needed
9. IF the MDS documents that a resident requires assistance with any personal care activity(dressing/personal hygiene, bathing or continence) or the resident or proxy reports needingassistance with any personal care activity THEN the resident/proxy should report that privacy isrespected (eg. closing curtains, closing door, not changing in public place) when personal careassistance is provided.
10.IF the NH resident or proxy reports requesting assistance with any ADLTHEN the residentshould report that he/she is satisfied with the timeliness of staff response to their request.
…continued next page

Quality of Care Performance Indicator Project Report 107
11. ALL NH residents with ADL limitations should be monitored within the NH by a system thatdocuments the frequency, timeliness and quality of assistance provided by staff to residentsusing: Direct observation by human observerResident, family or advocate interview (after resident or proxy consent) or,Direct observation aided by monitoring systems such as movement sensors or video camerasDaily Exercise
12. IF a NH resident is physically inactive, THEN she/he should be provided with assisted exercisedaily unless the resident clearly refuses. Access to Activity
13.IF a NH resident is capable of participating in a structured activity program (alert, able tounderstand visual or verbal cues, not restricted to bed rest) THEN she/he should have accessto, and be prompted to participate in, varied structured activities (beyond that of group mealtimes) at least four days per week. Access to Assistive Devices
14.IF a NH resident uses an assistive device such as corrective lenses, large-print readingmaterials, hearing aid, amplifiers, dentures or mobility devices THEN the devices should beusable and readily accessible Care Planning
15.IF a vulnerable older person is admitted to a NH THEN the chart should document, or NHresident/surrogate should report, a discussion to establish goals of care. If neither resident norfamily participates in planning goals of care, then the reason should be clearly documented.
16.IF a NH resident has a significant deterioration in physical or mental condition that requires anew evaluation, new medication or other therapeutic intervention THEN the NH resident orsurrogate should be provided sufficient information (prognosis, diagnosis, options and expectedoutcomes) to allow participation in diagnostic and treatment decisions, unless a surrogatecannot be contacted.
17. IF a NH resident has diabetes mellitus, hypertension or ischemic heart disease and thecondition is not tightly controlled (e.g. glycosylated haemoglobin >10, blood pressure >160/90)THEN the goals of care for these conditions should be clearly identified in the record Access toprimary care provider
18.IF the NH staff attempts to contact the primary care provider to discuss a significantdeterioration in resident status, and the primary care provider does not respond to NHnotification in 1 hourTHEN the NH staff should repeat the contact attempt within 20 minutesand if no response call the medical director Communication
19. IF a NH resident is deaf or does not speak English THEN an interpreter and other written or visualmaterials should be employed to facilitate communication between the resident and NH staff(unless NH staff speak the language of the resident)
Source: Modified from Saliba and Schnelle (2002). NH = nursing home, MDS = Minimum Data Set, Level 1 = supervision, Level 2 = limitedassistance, Level 3 = extensive assistance, Level 4 = total dependence. Activities of Daily Living(ADL) = mobility, transfer, dressing, eating, toileting, personal hygiene

108 Public Sector Residential Aged Care
APPENDIX 11.5Table 4: Number of industry stakeholder forum attendees and their positiondesignations
Benalla Geelong Melbourne Total(n = 9) (n = 22) (n = 31) N = 62
Acting CE (actually DON) 1 1
Acting DON 1 1
Activities Person 1 1
ADON 1 1 2
Age Care Coordinator 1 1
CEO/QIC 1 1
Charge Nurse 2 2
CNC 1 1
Divisional Nursing Director 1 1
DON 1 4 3 8
DON/CEO 1 1 2
DON/Manager 1 1 1 3
General Manager 1 1
Health Information Manager 1 1
Improvement Coordinator (RN Div 1) 1 1
Manager Aged Care 1 1
Manager Residential Care Services 1 1
Manager/RN 1 1
NUM 4 2 5 11
Nursing Home Manager 1 1
Principal Carer 1 1
Program Manager 1 1
Project Officer 1 1
QI Coordinator 2 2
Quality Coordinator 3 3
Quality Coordinator (RN Div 1) 1 1
Quality Manager 1 1 2
Quality Manager – Physiotherapist 1 1
Quality Manager/ADON 1 1
RCS Quality 1 1
Rec. Worker 1 1
Residential Care Coordinator (RN Div 1) 1 1
RN Div 1 ACN 1 1
RN Division 1 1 1 2
RN Division 2 1 1
1 Forum participants provided their own designations and these have been replicated here.
ADON = Associate Director of Nursing, ACN = Associate Charge Nurse, CNC = Clinical NurseConsultant, DON = Director of Nursing, NUM = Nurse Unit Manager, RN = Registered Nurse

Quality of Care Performance Indicator Project Report 109
APPENDIX 11.6
Names of attendees at the forums held with industry stakeholders
Steve Demeye Elizabeth Wilson Tineka Carr Karen James Christine Mitchell Michelle Gurry Mary Bruce Carita Potts Dorothy Rogers Donna WatmuffLeanne Hilburn Noleen Wales Ross Waddington Kate TaylorJan Hutchinson Marlene Connaughton Ronalda Coucher Lisa Hee Gayle Dougherty Hazel Saligari Enid Smith Gabrielle Nagle Kene Marshall Deborah Sykes Mary Swift Louise ArthurMary-Jane White Rosemary Hogan Jan Bennett Libby Reeves Terrona Ramsey Gael Traa Janice Preston Denise Matheson Jill Peterkin Kally Kannan Fiona McKinnon Maria Mc Intosh Heath Richardson Annie CarrRosemary Lardner Helen Pini Fiona Stevens Jan Webb Donna Broughton Mary Stapleton Michael Sharon Godleman Debra Hitchcock Sue McLaurin Moira Hecker Geraldine CalderChristine Koch JenniferGeraldine Fernandes Gaye JacksonJoan Murphy Irene Perry Sandra Parker Tony Tuohey Gwen Carll Jill Roberts Jan McEgan Maree Townsend Meredith Hare Jan FisherRosemary Rees

110 Public Sector Residential Aged Care
APPENDIX 11.7
Letter of invitation
3rd October 2003
Invitation to a forum – Quality Care Performance Indicators
Dear
The Department of Human Services in Victoria has funded our team at La TrobeUniversity/Bundoora Extended Care Centre to undertake a project which aims toidentify and assess a set of appropriate performance indicators and relatedrecommendations to assist in monitoring and improving the quality of care providedto residents by Victoria’s public sector residential aged care services. It isanticipated that the proposed set of indicators would include the major aspects ofquality of care that can be measured at an organisational level.
The project involves reviewing the literature and consultations with industrystakeholders. These consultations will include public forums and possibly interviewswith a small number of key stakeholders to explore issues raised in the forums inmore depth. The consultations will provide an opportunity for stakeholders tocomment on quality indicators currently in use, propose other indicators forconsideration and to identify barriers to, or strategies to assist, implementation ofquality indicators in aged care.
Forums will be held on:
Monday 3rd November 2003 Venue: Dept. of Human Services 26 Church StreetBenalla Time: 10.30am – 1.00 pm approx. RSVP: 03 9495 3330, by 27 October 2003 (Numbers limited)
Thursday 6th November 2003 Venue: Dept. of Human Services Cnr. Fenwick & Lt. Malop Streets Geelong Time: 10.30 – 1.00 pm approx. RSVP: 03 9495 3330, by 30 October 2003 (Numbers limited)
Monday 10th November 2003 Venue: La Trobe University 215 Franklin StreetMelbourne Time: 10.30 – 1.00 pm approx. RSVP: 03 9495 3330, by 30 October 2003 (Numbers limited)

Quality of Care Performance Indicator Project Report 111
These Forums will be taped and all participants will be invited to sign a formindicating whether or not they wish to have their participation noted in the FinalReport. While information from the forums and possibly direct quotes will beincluded in publications related to this project no individual will be identified inrelation to the ideas/quotes. Further information sheets will be available toparticipants at each forum.
If you have any queries please contact: Professor Rhonda Nay 03 9495 3141 orJacinda Wilson 03 9495 3330.
Written Submissions are welcomed and should be emailed to Jacinda [email protected]
Your submissions should address:
• Quality Indicators currently in use (Indicators may, for example, be falls, restraintetc.);
• Other indicators you wish to recommend and why;
• Potential barriers that you perceive may impede the use of specific indicators orindicators generally; and
• Strategies that you have experienced, or believe would, work in facilitatingimplementation of quality indicators.
PLEASE INDICATE IFYOU WISH YOUR NAMETO BE LISTED IN THE FINAL REPORT ASA CONTRIBUTOR.
Details of this project are available fromwww.latrobe.edu.au/nursing/bundoora/gerontic/quality.htm. I encourage youto participate in this essential work.
Yours sincerely,
Rhonda Nay Professor Gerontic Nursing Gerontic Nursing Clinical School La Trobe University

112 Public Sector Residential Aged Care
APPENDIX 11.8
Clinical/Quality Indicator Experts Interviewed
Stephen Midson Consulting Director, Moving ON Audits Dr Joe Ibrahim Clinical Service Director for Aged Care,
Williamstown Hospital, Western Health, andConsultant Forensic Physician, Clinical Liaison Service State Coroners Office and Victorian Institute forForensic Medicine
Professor Mary Courtney Professor of Nursing, Director of Research,School of Nursing, University of Queensland
Professor Len Gray Professor in Geriatric Medicine,University of Queensland
Nandana Devi Ranasinghe PhD candidate, Total Quality Management Training Services, Mt Waverley
Professor Gary Andrews Professor of Ageing, Division of Health Sciences University of South Australia

Quality of Care Performance Indicator Project Report 113
APPENDIX 11.9
Consumer Issues Focus Group participants
Janet Wood Ministerial Advisory Council of SeniorVictorians Bronwyn Williams Department of Veteran Affairs Ljubica Petrov Partners in Culturally Appropriate Care – Victoria (PICVIC) Gillean Glazenbrook Alzheimer’s Australia

114 Public Sector Residential Aged Care
APPENDIX 11.10
Norton’s Risk Assessment Scale
A total score of 14 indicates the onset of risk and a total score of 12 or belowindicates that a patient is at a high risk of developing a pressure ulcer.
Physical Mental Activity Mobility IncontinentCondition Condition level status
Good Alert Ambulant Full Not4 4 4 4 4
Fair Apathetic Walks with help Slightly limited Occasional3 3 3 3 3
Poor Confused Chair bound Very limited Usually urine2 2 2 2 2
Very bad Stupor Bed bound Immobile Doubly1 1 1 1 1
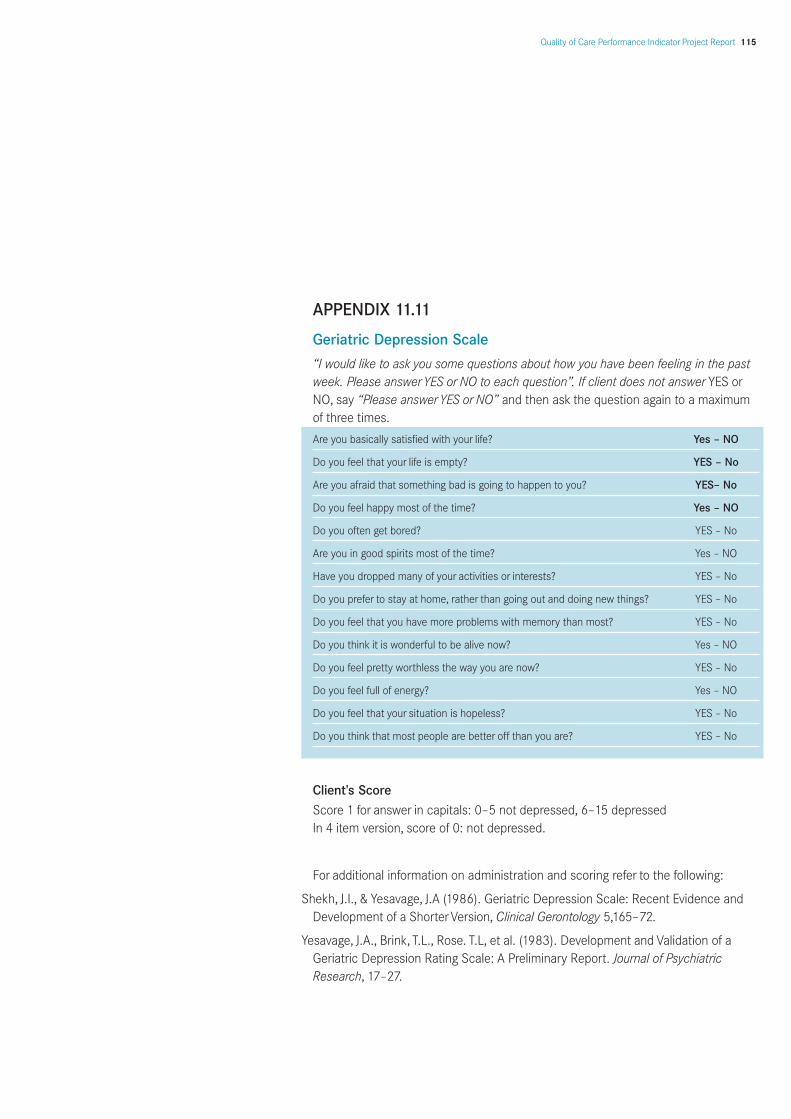
Quality of Care Performance Indicator Project Report 115
APPENDIX 11.11
Geriatric Depression Scale
“I would like to ask you some questions about how you have been feeling in the pastweek. Please answerYES or NO to each question”. If client does not answer YES orNO, say “Please answerYES or NO” and then ask the question again to a maximumof three times.
Are you basically satisfied with your life? Yes – NO
Do you feel that your life is empty? YES – No
Are you afraid that something bad is going to happen to you? YES– No
Do you feel happy most of the time? Yes – NO
Do you often get bored? YES – No
Are you in good spirits most of the time? Yes – NO
Have you dropped many of your activities or interests? YES – No
Do you prefer to stay at home, rather than going out and doing new things? YES – No
Do you feel that you have more problems with memory than most? YES – No
Do you think it is wonderful to be alive now? Yes – NO
Do you feel pretty worthless the way you are now? YES – No
Do you feel full of energy? Yes – NO
Do you feel that your situation is hopeless? YES – No
Do you think that most people are better off than you are? YES – No
Client’s ScoreScore 1 for answer in capitals: 0–5 not depressed, 6–15 depressed In 4 item version, score of 0: not depressed.
For additional information on administration and scoring refer to the following:
Shekh, J.I., & Yesavage, J.A (1986). Geriatric Depression Scale: Recent Evidence andDevelopment of a ShorterVersion, Clinical Gerontology 5,165–72.
Yesavage, J.A., Brink, T.L., Rose. T.L, et al. (1983). Development and Validation of aGeriatric Depression Rating Scale: A Preliminary Report. Journal of PsychiatricResearch, 17–27.

116 Public Sector Residential Aged Care
APPENDIX 11.12
Cornell Scale for Depression in Dementia
Scoring (based on symptoms/signs occurring during the week prior to testing): a =unable to evaluate; 0 = absent; 1 = mild or intermittent; 2 = severe. Cornell Scale forDepression in Dementia
Patient’s name: _____________________________________________
Date: _____________________________________________
Location: _____________________________________________
A. Mood-related signs
1. Anxiety (anxious expression, ruminations, worrying) a 0 1 2
2. Sadness (sad expression, sad voice, tearfulness) a 0 1 2
3. Lack of reactivity to pleasant events a 0 1 2
4. Irritability (easily annoyed, short tempered) a 0 1 2
B. Behavioral disturbances
5. Agitation (restlessness, hand-wringing, hair-pulling) a 0 1 2
6. Retardation (slow movements, slow speech, slow reactions) a 0 1 2
7. Multiple physical complaints (score 0 if gastrointestinal symptoms only) a 0 1 2
8 Loss of interest, less involved in usual activities (score only if change occurred acutely—in less than 1 month) a 0 1 2
C. Physical signs
9. Appetite loss (eating less than usual) a 0 1 2
10. Weight loss (score 2 if greater than 5 lb in one month) a 0 1 2
11. Lack of energy (fatigues easily, unable to sustain activities) (score only if change occurred acutely—in less than one month) a 0 1 2
D. Cyclic functions
12. Diurnal variation on mood (symptoms worse in the morning) a 0 1 2
13. Difficulty falling asleep (later than usual for this person) a 0 1 2
14. Multiple awakenings during sleep a 0 1 2
15. Early morning awakening (earlier than usual for this person) a 0 1 2

Quality of Care Performance Indicator Project Report 117
E. Ideational disturbances
16. Suicide (feels life is not worth living, has suicidal wishes,or makes suicidal attempt) a 0 1 2
17. Poor self-esteem (self-blame, self-deprecation, feelings of failure) a 0 1 2
18. Pessimism (anticipation of the worst) a 0 1 2
19. Mood-congruent delusions (delusions of poverty, illness, or loss) a 0 1 2
Total score:*
*—Not diagnostic of depression, but higher scores indicate greater need for furtherevaluation.
For further information: Alexopoulos, G.S., Abrams, R.C. & Shamoian C.A. (1998). Cornell Scale forDepression in Dementia. Biol Psychiatry, 23(3), 271–84.