public sector mis - united...
TRANSCRIPT
Information Systemsfor Public Sector
Management
Working Paper Series
Paper No. 5
Public SectorManagement Information
Systems
RICHARD HEEKS
September 1998
Published with the support of:
http://www.comnet.mt
Publishedby:
Institute for Development Policy and ManagementUniversity of Manchester, Precinct Centre, Manchester, M13 9GH, UKTel: +44-161-275-2800/2804 Fax: +44-161-273-8829Email: [email protected] Web: http://www.man.ac.uk/idpm
View/Download from: http://www.man.ac.uk/idpm/idpm_dp.htm#isps_wp
Table of Contents
Abstract .................................................................................................................................... 1
A. INTRODUCTION .......................................................................................................................... 2
A1. Management Monitoring and Control Systems.................................................................... 2
A2. Complicating the Simple Picture......................................................................................... 4
B. FEATURES OF MANAGEMENT INFORMATION SYSTEMS.................................................................. 9
B1. Link to Data-Gathering Systems ......................................................................................... 9
B2. Reports, Reports, Reports ................................................................................................... 9
B3. The Role of Reports .......................................................................................................... 10
B4. Management Information System Model ........................................................................... 12
B5. Benefits of MIS Computerisation ...................................................................................... 13
C. EXAMPLES OF MANAGEMENT INFORMATION SYSTEMS ............................................................... 14
C1. Internal Transaction-Based MIS....................................................................................... 14
C2. Public Administration and Regulation MIS....................................................................... 17
C3. Public Service Delivery MIS............................................................................................. 18
D. CONCLUSION ........................................................................................................................... 20
References .............................................................................................................................. 21
1
PUBLIC SECTOR MANAGEMENTINFORMATION SYSTEMS
Richard Heeks1
IDPM, University of Manchester, UK
1998
Abstract
Management information systems (MIS) are fundamental for public sector
organisations seeking to support the work of managers. Yet they are often ignored in
the rush to focus on ‘sexier’ applications. This paper aims to redress the balance by
providing a detailed analysis of public sector MIS. It firstly locates MIS within the
broader management monitoring and control systems that they support. Understanding
the broader systems and the relationship to public sector inputs, processes, outputs and
outcomes is essential to understanding MIS. The paper details the different types of
reports that MIS produce, and uses this as the basis for an MIS model and a
description of the decision-making benefits that computerised MIS can bring. Finally,
the paper describes generic public sector MIS that address internal government
transactions, public administration/regulation, and public service delivery. Real-world
examples of all types are provided from the US, UK, Africa, and Asia.
1 An amended version of this paper will appear in Information Technology and Computer
Applications in Public Administration, D. Garson (ed.), Idea Group Publishing: http://www.idea-
group.com/
2
A. Introduction
Management information systems can be defined as information systems that provide
reports which assist the managerial monitoring and control of organisational functions,
resources or other responsibilities.
MIS were first developed during the 1950s and 1960s but came into the organisational
mainstream somewhat later. There was a rich literature on MIS during the 1970s,
continuing into the 1980s (e.g. Davis, 1974; Davis & Olson, 1984). However, the
explosion of other organisational applications of IT has led MIS – at least as defined
above – to retain only a small foothold in many more recent publications. Despite their
book titles, for example, Hicks (1993) devotes just one chapter to MIS, whilst Laudon
& Laudon (1998) devote just a few pages. Nonetheless the fundamental importance of
MIS has meant some writers continue to provide a broad and deep discussion of the
topic (e.g. Zwass, 1992; Lucey, 1997).
Our discussion in this paper begins with a deeper understanding of the managerial
processes that management information systems support.
A1. Management Monitoring and Control Systems
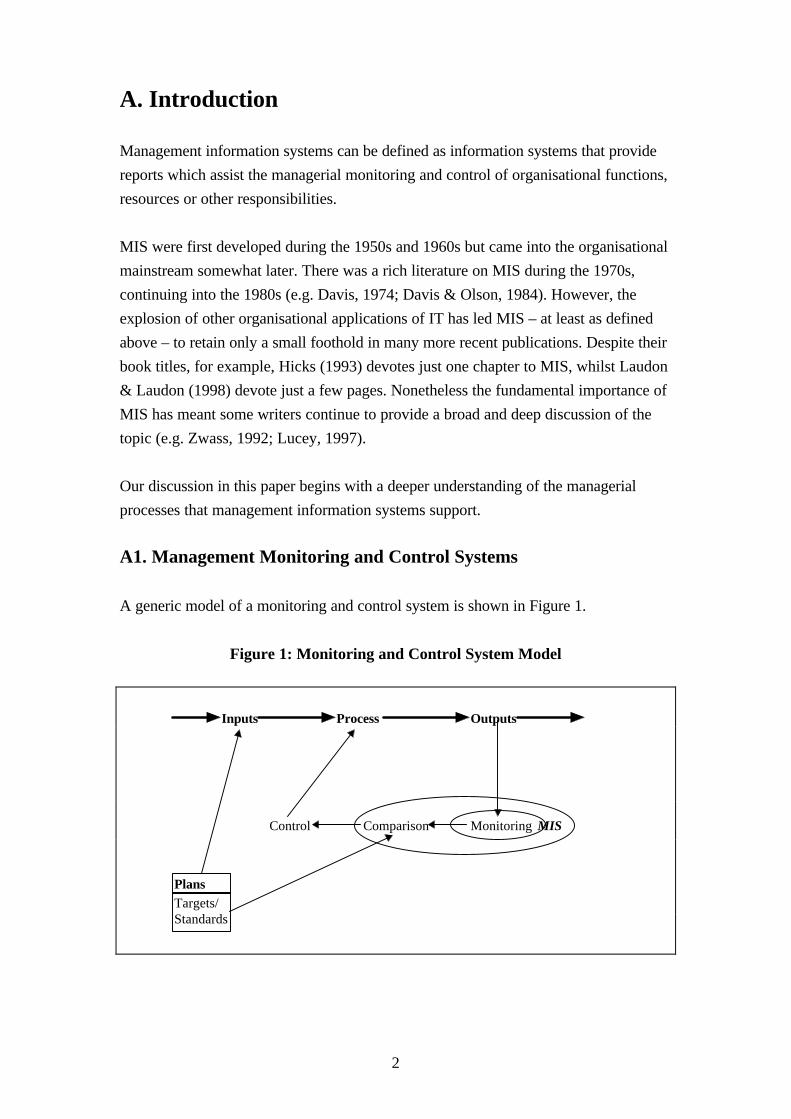
A generic model of a monitoring and control system is shown in Figure 1.
Figure 1: Monitoring and Control System Model
Inputs Process Outputs
Plans
MIS
Targets/Standards
ComparisonControl Monitoring
3
This monitoring and control system consists of four main elements:
• A process. At the core of the system is some kind of process that turns inputs into
outputs. Let us take the example of a public sector training project that seeks to
provide new skills for the unemployed. This project turns inputs of money,
equipment and staff labour into outputs of skilled people who are trained via
processes of training delivery.
• A monitoring mechanism. This mechanism gathers information about the outputs
from the process. For example, it would gather information about the number of
people trained and the extent of their new skills in the training project.
• A comparison mechanism. This compares the information gathered about current
performance with information on previously-set plans, benchmarks, targets, etc.
These two types of information represent the information needs of the monitoring
and control system. For example, this mechanism would compare information on
actual skills gained with skill gain targets. This part of the system is often known as
the 'evaluation mechanism' (as in the phrase, 'monitoring and evaluation').
• A control mechanism. This decides upon and then ensures implementation of
corrective action based on the output of the comparison. For example, where skill
levels produced by training were lower than expected, changes to the method or
location of training might be decided upon and implemented.
Monitoring and control therefore represents a feedback loop, in which information
about a later stage is fed back into control of an earlier stage. Where all is well, the
system's only function is to monitor and report. Where a problem - a shortfall between
the actual and the desired situation - arises, the system's function is to assess the
impact of that problem, and to decide on and then implement remedial action. Most
organisational systems are intended to work on a negative feedback principle where
corrective action is in the opposite direction to monitored deviations from norms. Take
the case of a budget system. Where the monitoring mechanism indicated that more
than budget was being spent, feedback should lead the control mechanism to correct
this by starting to spend less.
4
Rationally, the system provides the mechanisms by which the organisation a) knows if
it is achieving its objectives, and b) achieves its objectives in the face of problems. In
order for this to happen, all the following must be present:
• outputs that can be measured,
• a monitoring mechanism that does measure the outputs,
• a monitoring mechanism that produces information on the outputs that is accurate,
timely, relevant, and complete,
• a comparison mechanism,
• targets against which to compare,
• a control and implementation mechanism, and
• an overall feedback loop that does not take too long to be effective.
The place of management information systems in the model is indicated in Figure 1. As
shown, MIS can be of two different types:
• Monitoring MIS: these MIS merely gather information about output performance
and present it to the manager, who will then do the comparison him/herself.
• Monitoring and comparison MIS: for these MIS, the pre-set standards for output
performance have been entered onto the computer system. The MIS is therefore
able to perform the comparisons itself. This forms the basis of exception reporting,
discussed below.
Computers are not a necessary part of this or any other management system. There are
many manual methods of monitoring and comparing, such as:
• tables of accounts and budgets,
• a chart of staff names and absence days, or
• a line on the wall which, when reached by a diminishing pile of stock items,
indicates that they should be re-ordered.
However, computerisation will be our focus in this paper.
A2. Complicating the Simple Picture
So far, a relatively simple picture has been presented of both management system and
information system. However, there are four main ways in which these systems differ,
as described next.
5
i. What is monitored: inputs, outputs and outcomes
The model above places a process at the centre of the model. But, for many
management information systems, the focus is on the measure being monitored and
reported upon. In overall organisational terms, these measures are not always outputs,
but can be divided into three categories:
• Inputs: the resources that are used by the organisation.
• Outputs: the direct services (or products) produced by the organisation.
• Outcomes: the wider impacts of organisational outputs.
To differentiate these, let us take the example of an enterprise development agency. Its
inputs would include general financial expenditure and hours of staff time worked. Its
outputs could include number of clients served, and number and size of loans provided
or guaranteed. The outcomes could include number of new enterprises created,
enterprise growth rates, number or proportion of people employed in enterprises, and
average income per capita.
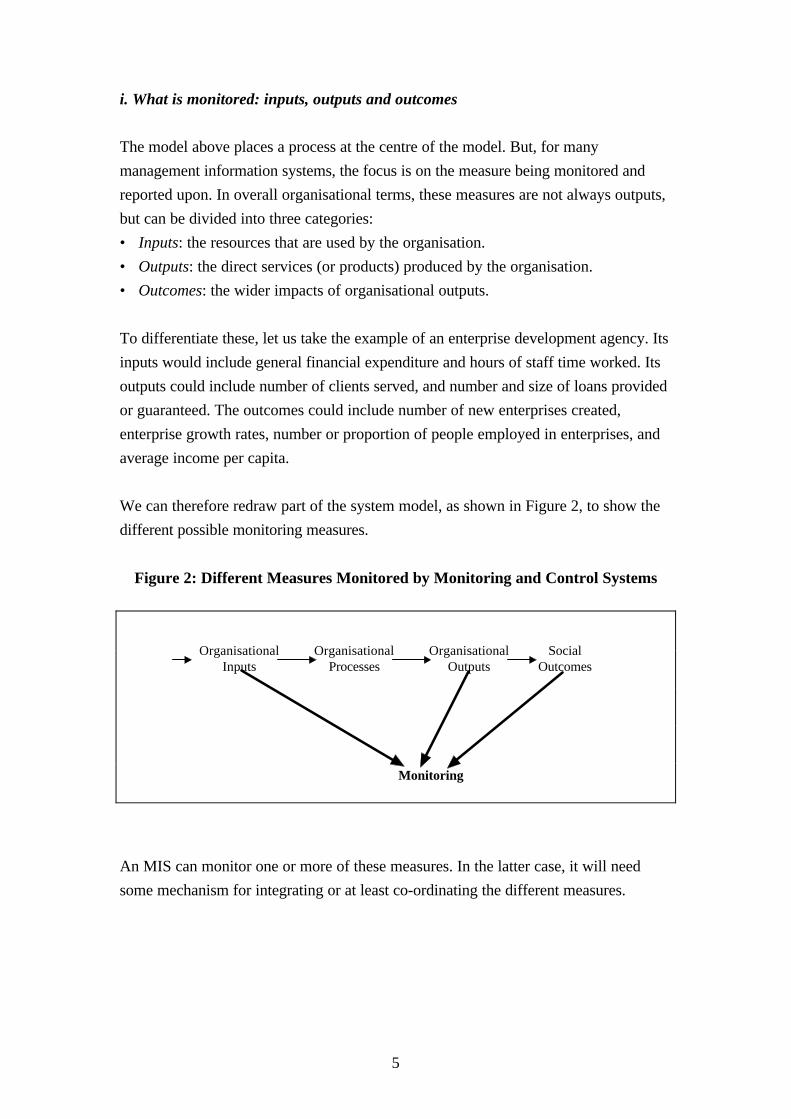
We can therefore redraw part of the system model, as shown in Figure 2, to show the
different possible monitoring measures.
Figure 2: Different Measures Monitored by Monitoring and Control Systems
An MIS can monitor one or more of these measures. In the latter case, it will need
some mechanism for integrating or at least co-ordinating the different measures.
OrganisationalInputs
OrganisationalProcesses
OrganisationalOutputs
SocialOutcomes
Monitoring
6
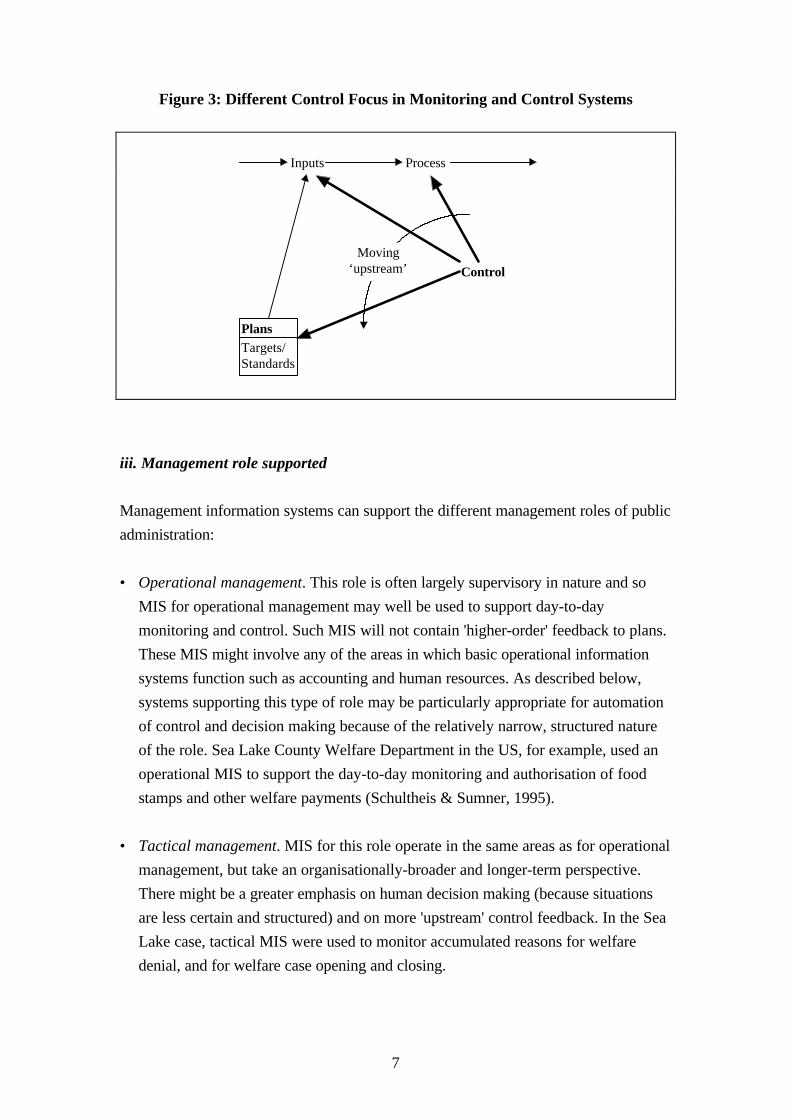
ii. What is controlled: plans, inputs and processes
The control mechanism can focus on one or more different parts of the model:
• Processes. The training project example given above described control of processes.
• Inputs. Alternatively, information may be fed back further 'upstream' than processes,
and affect the inputs to the process. For example, the information gathered on skill
levels produced by the training project might indicate that, to generate the required
outputs, altering the training method or location was not enough. Instead, more
labour (e.g. a higher trainer:trainee ratio) or more investment (e.g. in better-paid,
better-qualified trainers) was required.
• Plans. Moving even further 'upstream' in the model, information may be fed back to
affect the original planning of the process. For example, the information gathered
might indicate that no amount of 'tinkering' with inputs or methods can produce the
originally-planned outputs. The plans themselves would therefore have to be
amended. These changes could be directed at increasingly higher-order parts of
planning:
- Amended targets. For example, revised output targets on the number of skilled
trainees or the depth of required skills to be produced.
- Amended immediate objectives. For example, changing the project to produce
a different set of skills.
- Amended intermediate objectives. For example, changing the project type from
increasing the employability of the jobless through training to provision of a
direct employment subsidy.
- Amended overall objectives. For example, changing from trying to raise
employment levels in a poor rural district to encouraging relocation to areas of
high employment demand.
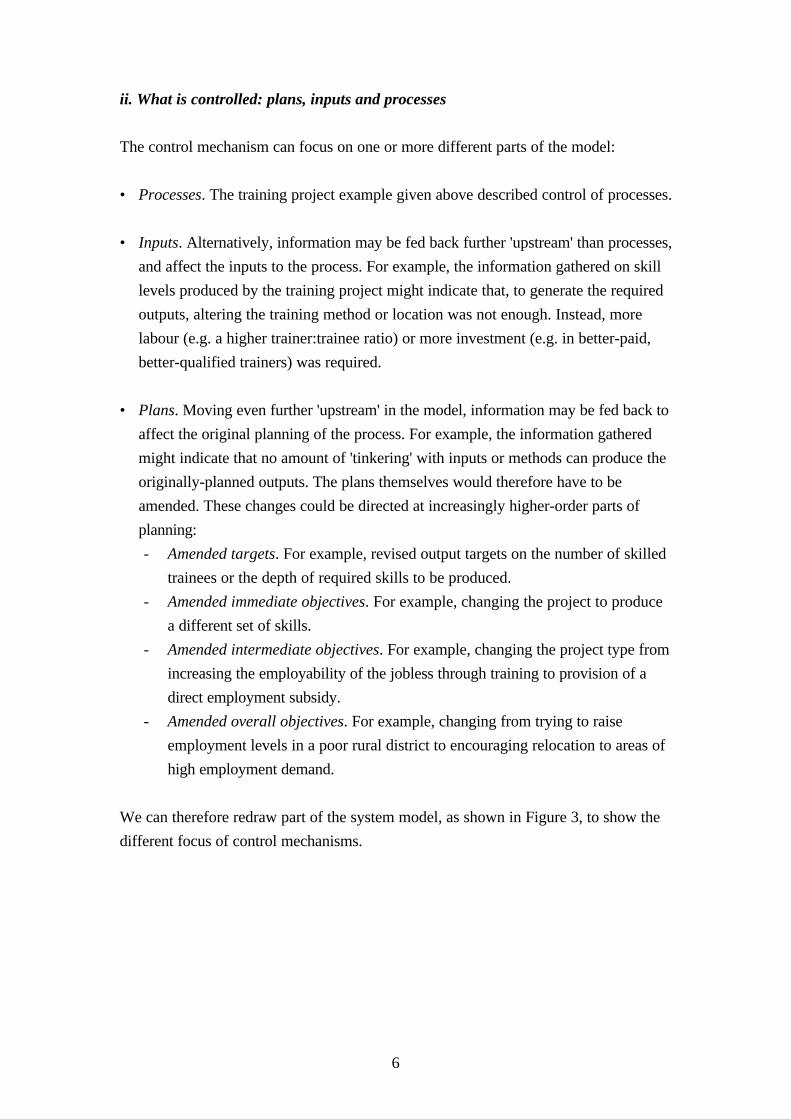
We can therefore redraw part of the system model, as shown in Figure 3, to show the
different focus of control mechanisms.
7
Figure 3: Different Control Focus in Monitoring and Control Systems
iii. Management role supported
Management information systems can support the different management roles of public
administration:
• Operational management. This role is often largely supervisory in nature and so
MIS for operational management may well be used to support day-to-day
monitoring and control. Such MIS will not contain 'higher-order' feedback to plans.
These MIS might involve any of the areas in which basic operational information
systems function such as accounting and human resources. As described below,
systems supporting this type of role may be particularly appropriate for automation
of control and decision making because of the relatively narrow, structured nature
of the role. Sea Lake County Welfare Department in the US, for example, used an
operational MIS to support the day-to-day monitoring and authorisation of food
stamps and other welfare payments (Schultheis & Sumner, 1995).
• Tactical management. MIS for this role operate in the same areas as for operational
management, but take an organisationally-broader and longer-term perspective.
There might be a greater emphasis on human decision making (because situations
are less certain and structured) and on more 'upstream' control feedback. In the Sea
Lake case, tactical MIS were used to monitor accumulated reasons for welfare
denial, and for welfare case opening and closing.
Inputs Process
PlansTargets/Standards
Control
Moving‘upstream’
8
Decision-MakingMIS
• Strategic management. MIS can and do support strategic management. However,
rational description of the strategic role places a particular emphasis on planning
and, for more senior managers, on an integrated view of the organisation. This is
seen as being supported mainly by executive information systems. In the Sea Lake
case, the executive information system incorporated both internal welfare data and
external data on government regulations to assist strategic planning.
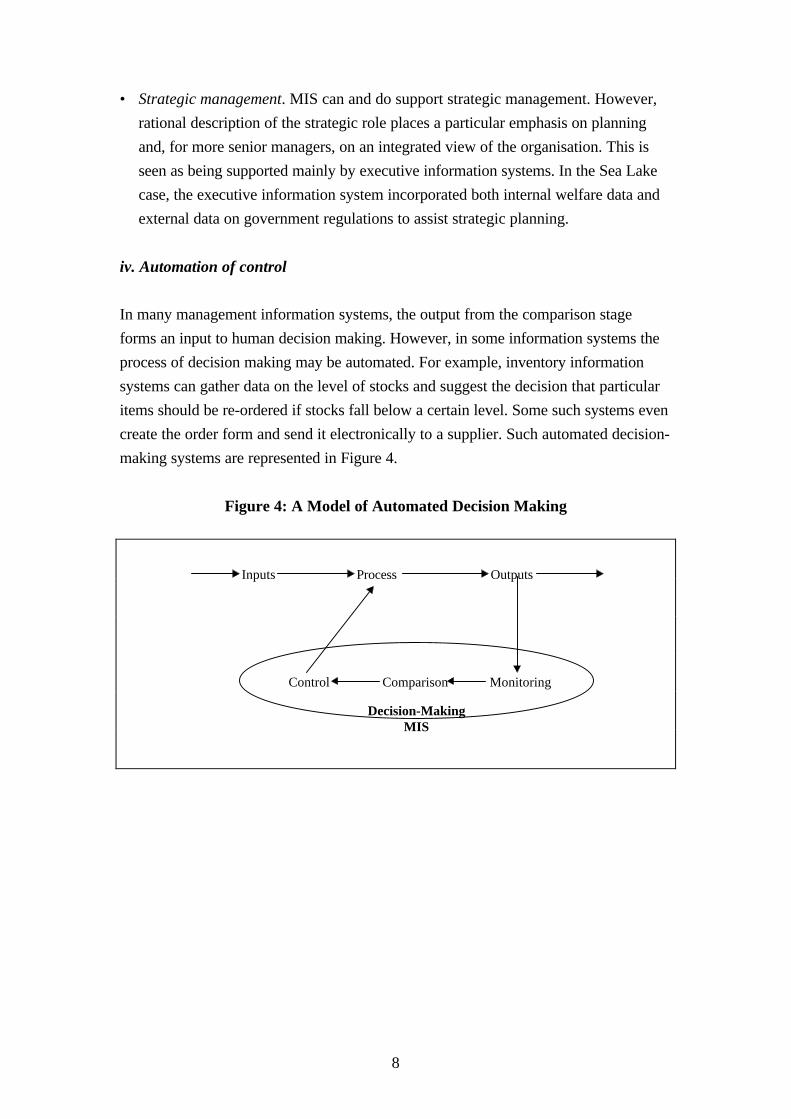
iv. Automation of control
In many management information systems, the output from the comparison stage
forms an input to human decision making. However, in some information systems the
process of decision making may be automated. For example, inventory information
systems can gather data on the level of stocks and suggest the decision that particular
items should be re-ordered if stocks fall below a certain level. Some such systems even
create the order form and send it electronically to a supplier. Such automated decision-
making systems are represented in Figure 4.
Figure 4: A Model of Automated Decision Making
Inputs Process Outputs
ComparisonControl Monitoring
9
B. Features of Management Information Systems
You should by now understand the main rationale for a management information
system. In order to draw up a model of an MIS, two further elements must be
described: the link to data-gathering systems and the production of reports.
B1. Link to Data-Gathering Systems
MIS often rely on monitoring data produced by a corporate database. In many cases,
the division between the two systems is not obvious. For example, many users merely
perceive that they have a payroll system that collects payroll data, produces both
operational payroll information and management reports, and is used for both
operation and monitoring/control of the payroll system.
B2. Reports, Reports, Reports
Central to its monitoring and control roles, an MIS produces reports. This is mainly
what managers perceive about an MIS since these are its tangible outputs. Reports
come in many forms, as described below. They can be differentiated in two main ways:
by content and by schedule.
i. Differentiation by content
MIS reports fall into three main categories of content:
• Detail report. This contains all relevant information on the report topic. For
example, a detailed payroll report might give the following information for all staff:
employee number, name, wage/salary rate, standard monthly earnings, standard tax
payable, and each individual monthly payment for the year to-date.
• Summary report. This contains a summarisation of information on the report topic.
For example, the total number of staff in each unit, each unit's total payroll bill for
this year and last year, and the percentage change between the two. Some
summaries may be recognised performance indicators. For example, one measure of
a unit's performance might be its total actual payroll bill as a proportion of the total
budgeted payroll bill.
• Exception report. This filters out information to provide just that which is deemed
to be most important, according to some pre-set criteria. It may be summarised or
10
detailed. For example, a report could include employee name, total individual
payroll payments this and last year, and percentage change between the two, only
for those staff whose pay rose by more than 10 per cent.
These reports may find themselves combined. For example, a report might:
• provide information on unit salary and income tax payment totals (summary),
• for only those units where the total was more than 5 per cent above last year's total
(exception), and
• allow the manager to break this down into individual staff salaries and tax payments
if required (detail).
ii. Differentiation by schedule
MIS reports fall into three main categories of schedule:
• Periodic report. This is produced at regular intervals: daily, weekly, monthly,
quarterly, etc. For example, a report of organisational unit salary totals produced
every month after staff have been paid.
• Event-triggered report. This is produced in response to a particular event or set of
conditions. An example of the former might be a detailed payroll report produced
once the first tranche of federal government funding for a project was agreed. An
example of the latter might be a detailed payroll report produced if the total payroll
bill in a unit exceeded budget in any month by more than 3 per cent. In some cases,
more than a report might be triggered. For instance, the last example could also
trigger production of a pro forma memo to the head of unit warning them about
their payroll expenditure situation.
• Request report. This is produced as and when required in response to an ad hoc
request. For example, a payroll report on all staff in the top two salary grades could
be produced in response to a politician's concern about increasing public vs. private
sector pay differentials for top managers.
B3. The Role of Reports
Periodic summary and detailed reports are the 'bread and butter' of management
information systems. For certain older MIS, this might be all that they produced.
However, it is the other forms of report that provide MIS with much of their
organisational value. If they work correctly, for example, exception-triggered reports

11
can take a substantial monitoring workload from managers. Managers know that the
computer system is 'watching out' for certain problems and will alert them if these
problems arise. Examples could include alerting reports when:
• an unusually large amount of cash is involved in a transaction,
• there is a sudden increase in recorded imports, or
• more than three states report the incidence of Colorado beetle infestation.
Reports with just exception contents provide no redundant information, but just focus
the manager on problem areas that require corrective action. This therefore helps
managers cope with the problem of information overload. Exception reports have a
wide variety of applications and can provide, for example:
• just the names of those staff who have been absent more than five times during the
past month,
• details of only those loans which have received no repayment for more than eight
weeks, or
• codes of only those budget heads which are more than 10 per cent over-spent.
One exception report issue lies in the choice of exception condition on which to report.
In the loan example, the eight week condition might be a bad choice. It could be that
an eight week delay is perfectly normal. The report is therefore unnecessarily targeting
many borrowers who are not in trouble. Alternatively, it could be that a default of only
two weeks indicates that help is needed. By eight weeks, matters may have
deteriorated too far for any outside assistance to be of value. There will have to be an
input of both experience and analytical skills in the choice of exception condition.
A second exception report issue relates to data inputs: such reporting can only be
relied upon if data inputs are being continuously and reliably gathered.
Request reports provide the manager with a great deal of power. They can produce
information that more exactly matches the manager’s particular needs at the moment
of need. Request reports are often a response to the unexpected. Examples could
include reports on:
• the finances of a project, for input to a meeting requested by the project manager,
• those clients who have been occupying a refuge bed for more than six months, in
response to a shortage of beds for incoming homeless persons, or
• the past training of a staff member, in response to their request to go on a training
course.

12
Typically these request reports are produced using search forms or search expressions.
Many computerised management information systems allow this to be done online: the
request is typed in and the report appears almost immediately on-screen. There will
often be a choice of showing the report as a table of figures or, if appropriate, as a
graph, or as both.
As with all information systems, the response to the request can only be as good as the
data that has been put into the system. MIS data is often entered with the expected
rather than the unexpected in mind, leading to the risk that unexpected requests cannot
be answered. If, on the other hand, large swathes of data are entered into the MIS 'just
in case they are needed', this runs the risk of substantial expenditure on gathering data
that is never used. A balance should therefore be struck between the likelihood of
needing data in a request plus the value of being able to respond to that request, and
the cost of providing that data.
B4. Management Information System Model
Using the further details described above, we can now draw an MIS model that builds
on the organisation’s corporate database, as shown in Figure 5.
Figure 5: Management Information System Model
Basic Data-Gathering System
CorporateDatabase
ManagementInformation
System
Online RequestReports
Periodic Reports Event-TriggeredReports
Action Outputs
13
In some systems, the separation of basic data-gathering system and MIS would not be
so clear cut as depicted here. Instead, they would merely be separate modules of the
same overall information system. The data-gathering module would deal largely with
data input and storage. The MIS module would deal largely with information retrieval
and output.
B5. Benefits of MIS Computerisation
If it functions as anticipated, the creation of a monitoring and control system produces,
by definition, greater understanding of the organisation and a greater ability to manage
organisational resources and their performance. Within these systems, and by
comparison with manual systems, creation of a computerised, rationally-functioning
MIS can produce a number of organisational benefits. These include:
• Faster decision making and control through provision of timely information. For
example, the MIS described by Anthes (1993 cited in Laudon & Laudon, 1995)
provided an early warning of performance problems in bulk buying of inputs by US
public agencies. Faster decision making released time that would otherwise be tied
up on monitoring. Tottle (1986) describes the introduction of an MIS to assist
government agricultural extension workers in Malaysia. Time was released in this
case thanks to upward reporting by the computer system and to exception
reporting, which focused the extensionists on those farmers with immediate
problems.
• Better decision making and control through provision of relevant information. The
Malaysian government workers described by Tottle (1986) had a much better
understanding of what was going on in their area thanks to the introduction of an
MIS. They also had more detailed information which allowed them to provide
farmers with a better service, and make better use of available resources. Similarly,
in the Anthes (1993) example, the statistical analyses gave US state agencies a
much better understanding of what was going on in contract bidding. Without the
MIS, such an understanding would not have been possible.
In addition, MIS can improve job satisfaction for public servants and can reduce the
number of paper records that have to be held.
14
C. Examples of Management Information Systems
Management information systems can be introduced to support a variety of public
sector applications, as described below.
C1. Internal Transaction-Based MIS
Three main types of management information system fall into this category:
accounting, human resources, and 'other'.
i. Accounting MIS
Far more than anything else, the emphasis of public sector MIS has been on money: on
monitoring how much has been spent; on comparing this with budget; and on
controlling expenditure to bring it in as close as possible to budget at year-end.
Examples of this type of computerisation range from the Kenyan Ministry of
Agriculture (Pinckney et al., 1987) to major US regulatory agencies (Brown, 1999).
Typical reports include:
• Statements of account: month-end, year-end, year-to-date, etc.; these will generally
have to be designed to fit with existing regulatory or legislative standards for public
sector accounting.
• Warnings of budget head over- or under-spend against target; variance from
planned budget can be shown either in absolute or in percentage terms.
• Statements of cash requirements in the month ahead based on payments still owed
within accounts payable data.
Payroll often represents the main cost for public sector organisations. It has therefore
been a starting point for MIS in many organisations, looking to monitor and control
salary and income tax payments, and also to issue payments. One focus for payroll
MIS in some countries has been to identify and then eliminate 'ghost workers', who do
not exist but whose pay is fraudulently collected by other employees. Cain (1999)
describes the importance of this approach in the creation of MIS for the governments
of Ghana, Uganda and Zimbabwe. Examples of payroll reports were described above.
15
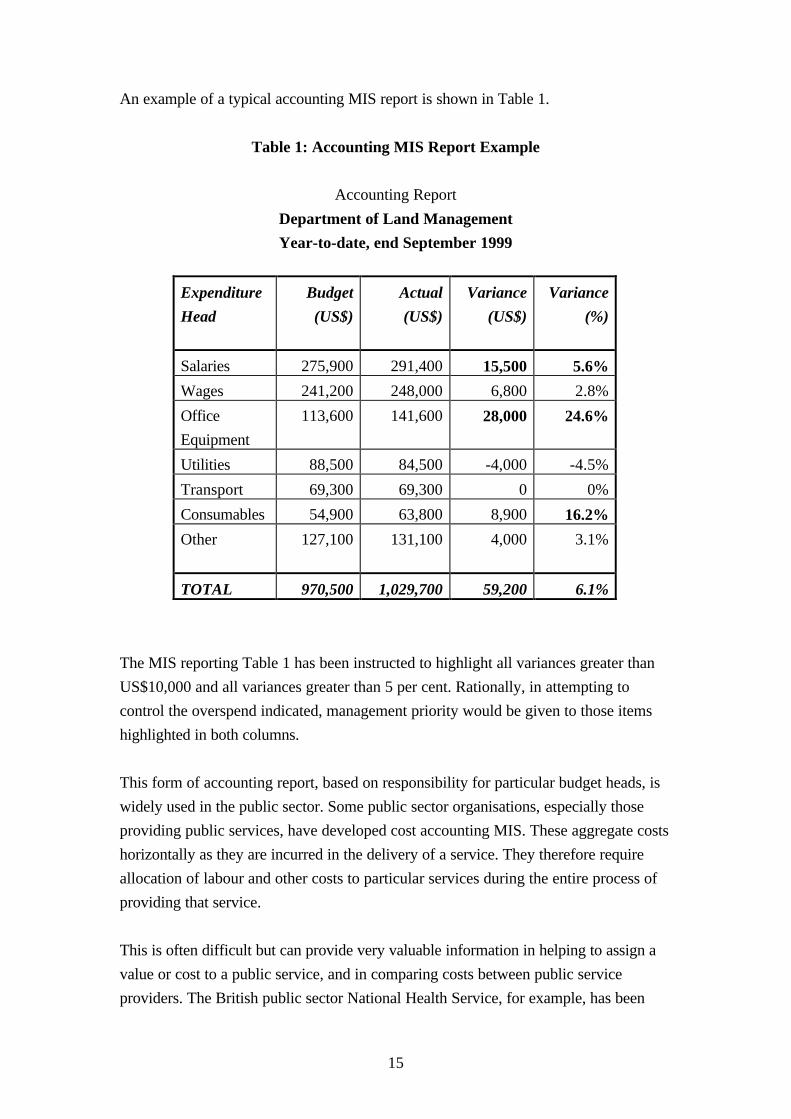
An example of a typical accounting MIS report is shown in Table 1.
Table 1: Accounting MIS Report Example
Accounting Report
Department of Land Management
Year-to-date, end September 1999
Expenditure
Head
Budget
(US$)
Actual
(US$)
Variance
(US$)
Variance
(%)
Salaries 275,900 291,400 15,500 5.6%
Wages 241,200 248,000 6,800 2.8%
Office
Equipment
113,600 141,600 28,000 24.6%
Utilities 88,500 84,500 -4,000 -4.5%
Transport 69,300 69,300 0 0%
Consumables 54,900 63,800 8,900 16.2%
Other 127,100 131,100 4,000 3.1%
TOTAL 970,500 1,029,700 59,200 6.1%
The MIS reporting Table 1 has been instructed to highlight all variances greater than
US$10,000 and all variances greater than 5 per cent. Rationally, in attempting to
control the overspend indicated, management priority would be given to those items
highlighted in both columns.
This form of accounting report, based on responsibility for particular budget heads, is
widely used in the public sector. Some public sector organisations, especially those
providing public services, have developed cost accounting MIS. These aggregate costs
horizontally as they are incurred in the delivery of a service. They therefore require
allocation of labour and other costs to particular services during the entire process of
providing that service.
This is often difficult but can provide very valuable information in helping to assign a
value or cost to a public service, and in comparing costs between public service
providers. The British public sector National Health Service, for example, has been
16
creating management information systems that can report health care provision costs
down to the level of individual patients. This allows better-informed decisions about
prioritising the use of scarce resources. It also allows health units to compare their
costs with other units (HSMU, 1996).
Income-related MIS are the exception rather than the rule in the public sector. MIS are
found, though, reporting on:
• Loans and loan repayment. For example, to report those applicants who have been
waiting for more than one month to know if their loan application has been granted.
• Customer payments where cost recovery operates in health, education and other
social welfare provision. For example, to report those public hospitals which have
recovered most and least per patient treated.
• Customer payments to public sector utilities, transportation, rented housing, and
enterprises. In these cases, the MIS are likely to be building upon some form of
accounts receivable transaction processing system. For example, to report those
customers whose accounts remain outstanding 60 days after bills for provision of
utility services were issued.
ii. Human resources MIS
Management information systems are used in the entire human resource lifecycle from
recruitment to termination or retirement. Reports include:
• Vacancies: for example, a detail report on all vacant posts in the organisation.
• Recruitment and selection: for example, a summary report on the ethnic origin and
sex of all job applicants and recruits for use in equal opportunities monitoring.
• Staff performance: for example, an exception report on only those secretarial staff
who are able to take shorthand dictation and type at over 50 words per minute.
• Payroll: examples have already been given.
• Training: for example, an ad hoc report on all those staff who have received
training in gender awareness.
• Staff promotion: for example, a detail report on all performance assessments for a
potentially-promotable member of staff.
• Staff departure: for example, a comparative report on turnover rates and reason for
departure in the information systems and accounting departments.
• Pensions: for example, a summary report on recent annual pension fund growth
rates.
17
• Other: for example, a comparative report on workplace accident rates on different
days of the week; this and other categories may relate to government reporting and
compliance.
The State of Vermont in the US developed a human resources management
information system (albeit both over-time and over-budget) that covered a number of
these reporting functions (Cats-Baril & Thompson, 1995). Similar experiences are
reported in the development of a personnel information system with MIS capabilities
for Northamptonshire County Council, a local government body in the UK (Palmer,
1993).
iii. Other MIS
Public sector inventory information systems tend to be relatively basic and/or
automated. The aim of an inventory MIS is to monitor stock levels and to control
stocks to ensure that all items are neither over- nor under-stocked.
MIS may also report on other entities such as fixed assets, financial investments and
projects. One US regulatory agency, for instance, set up an MIS covering its major
facilities in order to monitor, control and then reduce expenditure on those facilities, as
requested by Congress (Brown, 1999).
MIS may also combine the functional areas described above. The British Department
of Social Security, for instance, has proceeded with development of an integrated MIS
covering financial, personnel and resource management (Bellamy & Henderson, 1992).
C2. Public Administration and Regulation MIS
Management information systems have been created to support the whole range of
public administration and regulatory activities. In the US, for example, the National
Drivers Register has MIS facilities to report on driver licence details, such as all those
within a given state whose licence has been revoked or suspended (Danziger, 1991).
Similarly, the US Environmental Protection Agency is pushing forward in use of MIS
to help monitor and control environmental risks (Sparrow, 1992). Just a couple of
other examples are provided here.
i. Buildings registration MIS
18
Based on data recorded about particular types of buildings, or buildings in a particular
locality, this could monitor building ownership and use, and produce reports on, for
instance:
• all details of one individual building (building code, address, description, owner,
floor space, utility connections, local tax liabilities, etc.),
• annual growth in the total number of small industrial units in major cities, or
• all buildings within one city block for which no ownership records were lodged.
Japan’s registration MIS has these types of uses in mind. It was begun in earnest in
1988 as a 20-year project, and will eventually cover some 40 million buildings and 230
million parcels of land (Snellen, 1991).
ii. Taxation MIS
Based on data recorded about individual tax-paying entities (whether individuals or
organisations), this could monitor the payment of taxation, and produce reports on, for
instance:
• all details of an individual tax payer (payer code, name, address, employment,
employer, tax code, record of assets, record of recent tax payments and liabilities,
etc.),
• a summary of sales tax receipts broken down by sector,
• patterns of non-payment in order to target enforcement efforts more effectively, or
• the names and addresses of all those registered on public or private payrolls as tax
payers who are also claiming social welfare payments.
The State of New Jersey in the US used the last of these report types to identify
welfare cheats and to generate ‘estimated savings of $45 million in the first two years
of operation’ (Danziger, 1991:175).
C3. Public Service Delivery MIS
Many public service providers have developed management information systems to
monitor and control the services that they provide. Both the US and UK Social
Security agencies have developed MIS to report on the welfare payments and services
that they provide (Danziger, 1991; Bellamy & Henderson, 1992). The British public
healthcare system has also been a major investor in MIS as it tries to control healthcare
costs and simultaneously improve delivery standards (HSMU, 1996; Ballantine &
Cunningham, 1999). One further example is provided here.
19
i. Education sector MIS for schools
Based on data gathered from individual schools and from other educational institutions
such as exam boards and school inspectorates, this could monitor the provision of
education and produce reports on, for instance:
• details of one individual school (school code, name, address, location, staff
numbers, student enrolment by year, annual budgets, school facilities, examination
grades, etc.),
• a summary of the average staff:student ratio for each state, or
• the name and location of all schools without on-site sports facilities.
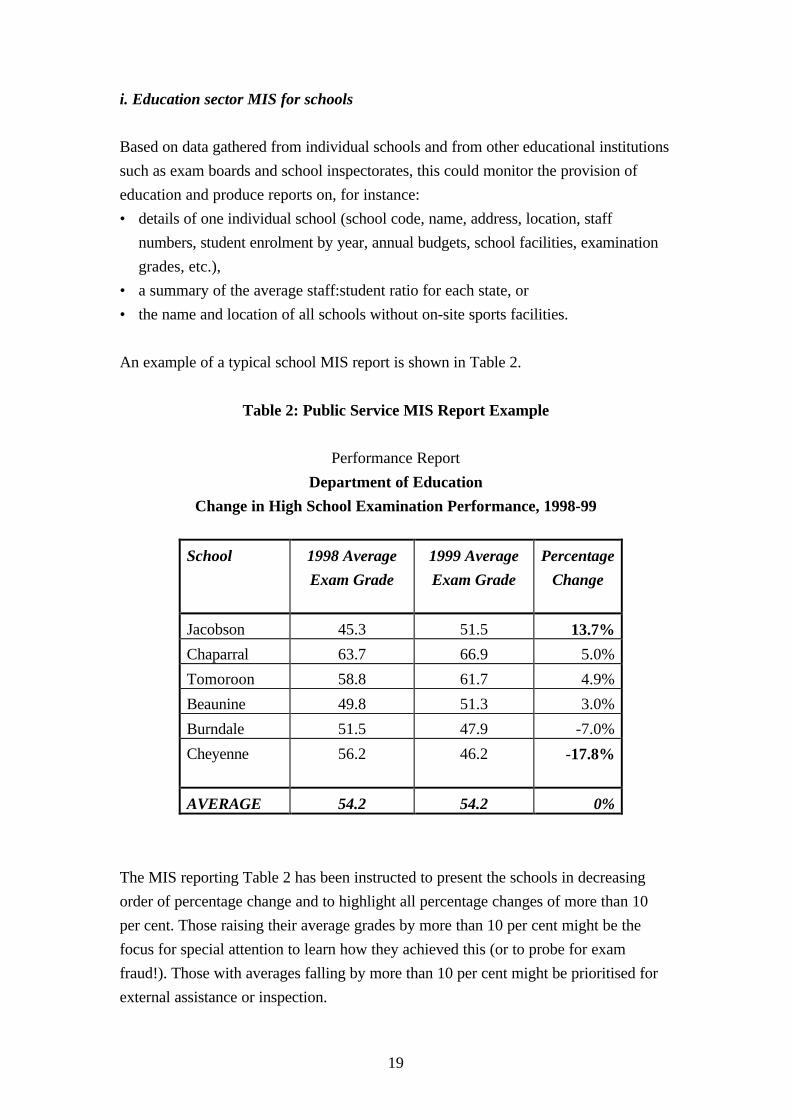
An example of a typical school MIS report is shown in Table 2.
Table 2: Public Service MIS Report Example
Performance Report
Department of Education
Change in High School Examination Performance, 1998-99
School 1998 Average
Exam Grade
1999 Average
Exam Grade
Percentage
Change
Jacobson 45.3 51.5 13.7%
Chaparral 63.7 66.9 5.0%
Tomoroon 58.8 61.7 4.9%
Beaunine 49.8 51.3 3.0%
Burndale 51.5 47.9 -7.0%
Cheyenne 56.2 46.2 -17.8%
AVERAGE 54.2 54.2 0%
The MIS reporting Table 2 has been instructed to present the schools in decreasing
order of percentage change and to highlight all percentage changes of more than 10
per cent. Those raising their average grades by more than 10 per cent might be the
focus for special attention to learn how they achieved this (or to probe for exam
fraud!). Those with averages falling by more than 10 per cent might be prioritised for
external assistance or inspection.
20
Individual schools can also make use of MIS. Hobmoor Junior and Infant School, a
public school in Birmingham, UK, introduced a computerised attendance system to
produce MIS reports that monitor pupil attendance. This improved the Principal’s
ability to understand and control absence patterns, resulting in a 2.5 per cent increase
in attendance rates (Capita, 1998).
D. Conclusion
Management information systems form a bedrock of IT use in the public sector. They
are therefore found in all sections of the public sector and in all countries, as the
examples cited in this paper suggest.
Of course, different people use the term ‘management information system’ differently.
The term should therefore not form the basis for arguments about what an MIS is and
is not. So long as one and those with whom one works understand and agree on a
definition, that is good enough. Similarly, when dealing with written material, one
needs to be able to understand and communicate, not get locked into doctrinal debate.
On the basis of our definition provided here, though, we can end by summarising a few
general points about MIS that differentiate them from other types of public sector
information systems:
• Monitoring and control is central; the focus is therefore mainly on information
about what has happened (or is happening) rather than, as with planning, what will
happen.
• Reports are generally based on relatively simple analysis techniques.
• MIS normally feed into some human decision making, based on their reports; such
decision making is usually structured or semi-structured.
• MIS are mainly targeted at operational and tactical management levels.
• Unless custom-written, MIS are often based on a database system, because of the
superior query and reporting capabilities of database management systems.
21
References
Anthes, G.H. (1993). Stat tool weeds out bid-rigging companies, Computerworld, July
5.
Ballantine, J.A. & Cunningham, N. (1999). Strategic information systems planning:
applying private sector frameworks in UK public healthcare, in R.B. Heeks (ed.),
Reinventing Government in the Information Age. London: Routledge.
Bellamy, C. & Henderson, A. (1992). The UK Social Security Benefits Agency: a case
study of the information polity?, Informatization and the Public Sector, 2(1), 1-26.
Brown, D.M. (1999). Information systems for improved performance management:
development approaches in US public agencies, in R.B. Heeks (ed.), Reinventing
Government in the Information Age. London: Routledge.
Cain, P. (1999). Automating personnel records for improved management of human
resources: the experience of three African governments, in R.B. Heeks (ed.),
Reinventing Government in the Information Age. London: Routledge.
Capita (1998). Case Study: Attendance.
http://www.sims.co.uk/interest/CaseStudies/attendance.htm
Cats-Baril, W. & Thompson, R. (1995). Managing information technology projects in
the public sector, Public Administration Review, 55(6), 559-66.
Danziger, J.N. (1991). Management information systems and interorganizational
relations within the American governmental system, Informatization and the Public
Sector, 1(3), 169-87.
Davis, G.B. (1974). Management Information Systems. New York: McGraw-Hill.
Davis, G.B. & Olson, M.H. (1984). Management Information Systems (2nd edn.).
New York: McGraw-Hill.
Hicks, J.O. (1993). Management Information Systems (3rd edn.). St. Paul, MN: West
Publishing.
HSMU (1996). The Evaluation of the NHS Resource Management Programme in
England. Manchester, UK: Health Services Management Unit, University of
Manchester.
Laudon, K.C. & Laudon, J.P. (1995). Information Systems (3rd edn.). Fort Worth,
TX: Dryden Press.
Laudon, K.C. & Laudon, J.P. (1998). Management Information Systems (5th edn.).
Upper Saddle River, NJ: Prentice Hall.
Lucey, T. (1997). Management Information Systems (8th edn.). London: Letts
Educational.
Palmer, J. (1993). CPIS: three years on, in Computers in Personnel. London: Institute
of Personnel Management.
22
Pinckney, T.C., Cohen, J.M. & Leonard, D.K. (1987). Kenya’s introduction of
microcomputers to improve budgeting and financial management in the Ministry of
Agriculture, in S.R. Ruth & C.K. Mann (eds.), Microcomputers in Public Policy.
Boulder, CO: Westview Press.
Schultheis, R. & Sumner, M. (1995). Management Information Systems (3rd edn.).
Chicago: Irwin.
Snellen, I.Th.M. (1991). Informatization in Japanese public administration,
Informatization and the Public Sector, 1(4), 247-67.
Sparrow, M.K. (1992). Informing enforcement, Informatization and the Public Sector,
2(3), 197-212.
Tottle, G. (1986). The use of computing techniques to support agricultural extension
in rural development, Information Technology for Development, 1(3), 187-98.
Zwass, V. (1992). Management Information Systems. Dubuque, IA: WCB Publishers.