public satisfaction with the nhs and social care in 2018 · introduction 2 public satisfaction with...
TRANSCRIPT
Public satisfaction with the NHS and social care in 2018Results from the British Social Attitudes survey
Ruth Robertson
John Appleby
Harry Evans
Nina Hemmings
March 2019

Public satisfaction with the NHS and social care in 2018
1 2 3 4 5
ContentsIntroduction 2
Keyfindings 3
How satisfied is the British public with the NHS overall? 5
Who is most satisfied with the NHS? 8
Why is the public satisfied or dissatisfied with the NHS? 11
How satisfied is the British public with different NHS and social care services? 17
Conclusion 26
Appendix:Methodology 27
References 28
Acknowledgements 30
Abouttheauthors 31
Contents 1
1
2
3
4
5

Introduction 2
Public satisfaction with the NHS and social care in 2018
1 2 3 4 5
IntroductionSince1983,NatCenSocialResearch’sBritishSocialAttitudes(BSA)surveyhasaskedmembersofthepublic–ratherthanonlypatients–inEngland,ScotlandandWalesabouttheirviewsontheNHSandhealthandcareissuesgenerally.ThelatestsurveywascarriedoutbetweenJulyandOctober2018andaskedanationallyrepresentativesampleof2,926peopleabouttheirsatisfactionwiththeNHSoverall,and973peopleabouttheirsatisfactionwithindividualNHSandsocialcareservices.The2018BSAsurveyquestionsreportedherewerejointlysponsoredbytheNuffieldTrustandTheKing’sFund.
TheBSAisa‘goldstandard’surveythatusesarobustmethodologytoexplorepublicviews.ThemethodologyisbasedonarandomlyselectedsampleoftheBritishpublic,andisconductedviaaface-to-faceinterview,withmultiplefollow-uprequeststonon-responders.Thesurveyisconductedthesamewayeveryyearandthedataprovidesarichtimetrendgoingbackto1983,addingadepthandcontexttothefindingsthatnoothermeasureofNHSsatisfactionprovides.Asaresult,whensatisfactionchangesintheBSA,weareasconfidentaswecanbethatitreflectsagenuinechangeinpublicattitudes.
Intheanalysisbelow,whenwesaysatisfactionhasgoneupordown,thechangeisstatisticallysignificantatthe5percentlevel,unlessotherwisestated.Ifachangeordifferenceisstatisticallysignificant,thismeanswecanbe95percentconfidentthatthesurveyresultreflectsarealchangeordifferenceinpublicviews,ratherthanbeingdowntochance.Whereachangeordifferenceisnotstatisticallysignificant,wecannotbeconfidentthatitreflectsarealchangeordifferenceinpublicviews.

Keyfindings 3
Public satisfaction with the NHS and social care in 2018
1 2 3 4 5
Key findings Satisfaction with the NHS overall in 2018
• PublicsatisfactionwiththeNHSoverallcontinuedtofallin2018.Overallsatisfactionwas53percent–a3percentagepointdropfromthepreviousyearandthelowestlevelsince2007.
• Olderpeopleweremoresatisfiedthanyoungerpeople:61percentofthoseaged65andoverweresatisfiedwiththeNHScomparedto51percentofthoseaged18–64.
• Satisfactionlevelsalsodifferedbetweensupportersofdifferentpoliticalparties:58percentofsupportersoftheConservativepartyweresatisfiedcomparedto51percentofsupportersoftheLabourparty.
• ThefourmainreasonspeoplegaveforbeingsatisfiedwiththeNHSoverallwere:thequalityofcare;thefactthattheNHSisfreeatthepointofuse;therangeofservicesandtreatmentsavailable;andtheattitudesandbehaviourofNHSstaff.
• ThefourmainreasonspeoplegaveforbeingdissatisfiedwiththeNHSoverallwere:longwaitingtimes;staffshortages;alackoffunding;andmoneybeingwasted.
Satisfaction with NHS and social care services in 2018
• Satisfactionwithinpatientserviceswas63percent.Levelshavefluctuatedinrecentyears,butthe8percentagepointincreasefromthepreviousyeartakessatisfactiontoitshighestlevelsince1993.
• Satisfactionwithoutpatientserviceswas70percent.Again,levelshavefluctuatedinrecentyears,butthe5percentagepointincreasefromthepreviousyeartakessatisfactiontoitshighestlevelsincethesurveybegan.Forthefirsttime,outpatientswasthehighest-ratedserviceinthesurvey.
• Satisfactionwithbothinpatientandoutpatientserviceswashigheramongthosewhohaveusedthoseservicesrecentlyorhavefriendsandfamilymemberswhohavedoneso.

Keyfindings 4
Public satisfaction with the NHS and social care in 2018
1 2 3 4 5
• Satisfactionwithaccidentandemergency(A&E)serviceswas53percent.Thechangeinsatisfactionfromthepreviousyearwasnotstatisticallysignificant.
• SatisfactionwithGPserviceswas63percent.Thechangeinsatisfactionfromthepreviousyearwasnotstatisticallysignificant,andsatisfactionremainsatitslowestlevelsincethesurveybeganin1983.
• SatisfactionwithNHSdentistryserviceswas58percent.Thechangeinsatisfactionfromthepreviousyearwasnotstatisticallysignificant.
• Satisfactionwithsocialcareserviceswas26percent.Again,thechangeinsatisfactionfromthepreviousyearwasnotstatisticallysignificant.

HowsatisfiedistheBritishpublicwiththeNHSoverall? 5
Public satisfaction with the NHS and social care in 2018
1 2 3 4 5
1 How satisfied is the British public with the NHS overall?
Thisyear,theNHSembarksonimplementinganew10-yearplan,accompaniedbyitsmostgenerousfundingsettlementforalmostadecade,albeitbelowwhatwethinkisneededtomaintainandimproveservices(NHS England 2019;The King’s Fund et al 2017).Asitstartsthisnewchapter,theNHS’sreportcardismixed.Althoughitisoneofthemostequitablesystemsintheworld,itlagsbehindmanycomparablecountriesonkeyoutcomemeasuresfordiseaseslikecancer,strokeandheartattack,aswellaschildhoodmortality(Dayan et al 2018).SowhatdotheBritishpublicthinkabouttheNHSandhowhasthatchangedovertime?
For36years,theBSAsurveyhasaskedasampleofthepublic‘howsatisfiedareyouwiththewaytheNHSrunsnowadays?’In2018,publicsatisfactionwiththeNHSwas53percent;thiscombinespeoplewhosaytheyare‘very’and‘quite’satisfied(Figure1).Thisisa3percentagepointdropfromthepreviousyearandcontinuesadownwardtrendthattakessatisfactiontoitslowestlevelsince2007.
PublicdissatisfactionwiththeNHSwas30percentin2018.Thechangefrom2017wasnotstatisticallysignificantandthisisthehighestlevelofdissatisfactionwiththeNHSoverallsince2007.

HowsatisfiedistheBritishpublicwiththeNHSoverall? 6
Public satisfaction with the NHS and social care in 2018
1 2 3 4 5
Question asked: ‘All in all, how satisfied or dissatisfied would you say you are with the way in which the National Health Service runs nowadays?’
Notes:Thisquestionwasnotaskedin1985,1988and1992;in2018,n=2926;‘Don’tknow’responsesarenotshown,in2018thisresponsecategorywasselectedbylessthan0.05percentofrespondents.
Source:TheKing’sFundandNuffieldTrustanalysisofNatCenSocialResearch’sBSAsurveydata
Figure 1 Public satisfaction with the NHS, 1983–2018
40
0
Perc
enta
ge
100
20
80
60
Year
Very or quite satisfied Very or quite dissatisfied
1985 2005 20101990 1995 2000 2015
Neither satisfied nor dissatisfied
Thisdatagivesitsrichestinsightswhenviewedoverdecadesratherthanyears.Takingthatlong-termview,Figure1showsthatthe2000swerecharacterisedbyincreasingsatisfaction,upby31percentagepointsoverthedecadefrom38percent(in2001)to70percent(in2010).Conversely,the2010sarecharacterisedbydecreasingsatisfaction;althoughlevelshavefluctuated(includinga12percentagepointslumpin2011,anda5percentagepointjumpin2014),thebroadtrendshowsafallinglevelofsatisfaction,whichin2018was16percentagepointslowerthanin2010.

HowsatisfiedistheBritishpublicwiththeNHSoverall? 7
Public satisfaction with the NHS and social care in 2018
1 2 3 4 5
Public views of the NHS at 70
VariouspiecesofresearchconductedbyTheKing’sFundandNuffieldTrustfortheNHS’s70thbirthday–includingpollingandin-depthworkshops–exploredchangingpublicperceptionsoftheservice(Burkitt et al 2018;McKenna 2018).Despitefallinglevelsofsatisfactionwiththehealthservicein2018,therelationshipbetweenthepublicandtheNHSremainedstrong.
PeopleremainedstronglycommittedtothefoundingprinciplesoftheNHS–freeatthepointofdelivery,comprehensiveandavailabletoall,andfundedthroughtaxation.
Thepublicsaidtheirexpectationsoftheserviceweregenerallymetandtheyfeltthattheirexpectationswere,forthemostpart,realistic.Theyrecognisedthattheyhavearoletoplayinkeepinghealthybutwerealsosupportiveofspecificgovernmentinterventionsdesignedtopromotehealthybehaviours–suchasthesmokingbanandthesoftdrinksindustrylevy.
Alackoffundingaroseasakeyconcern–somethingthatisbackedupbyBSAdatacollectedin2017,whichshowsthatthevastmajorityoftheBritishpublicbelievedtheNHShadafundingproblem,andmostsaidthatiftheNHSneededmoremoney,theywouldbewillingtopaymoreintaxes(Evans 2018).Morerecentdataonthisfromthe2018BSAsurveywillbepublishedsoon.
Inlinewiththis,pollsconductedaftertheprimeminister’sannouncementofextramoneyfortheserviceinJune2018showedstrongsupportforafundingincreaseandforusingtaxrisestofundit(althoughataxrisewasnotultimatelynecessary)(NHS Confederation 2018;Smith 2018).
Foralargepartoftheyear,theNHSremainedneckandneckwithBrexitasthebiggestconcernforvoters,althoughafterthesummer,concernfortheNHSdroppedoffasBrexitworriesmovedtothefore(Ipsos MORI 2019).

Public satisfaction with the NHS and social care in 2018
WhoismostsatisfiedwiththeNHS? 8
2 1 3 4 5
2 Who is most satisfied with the NHS?
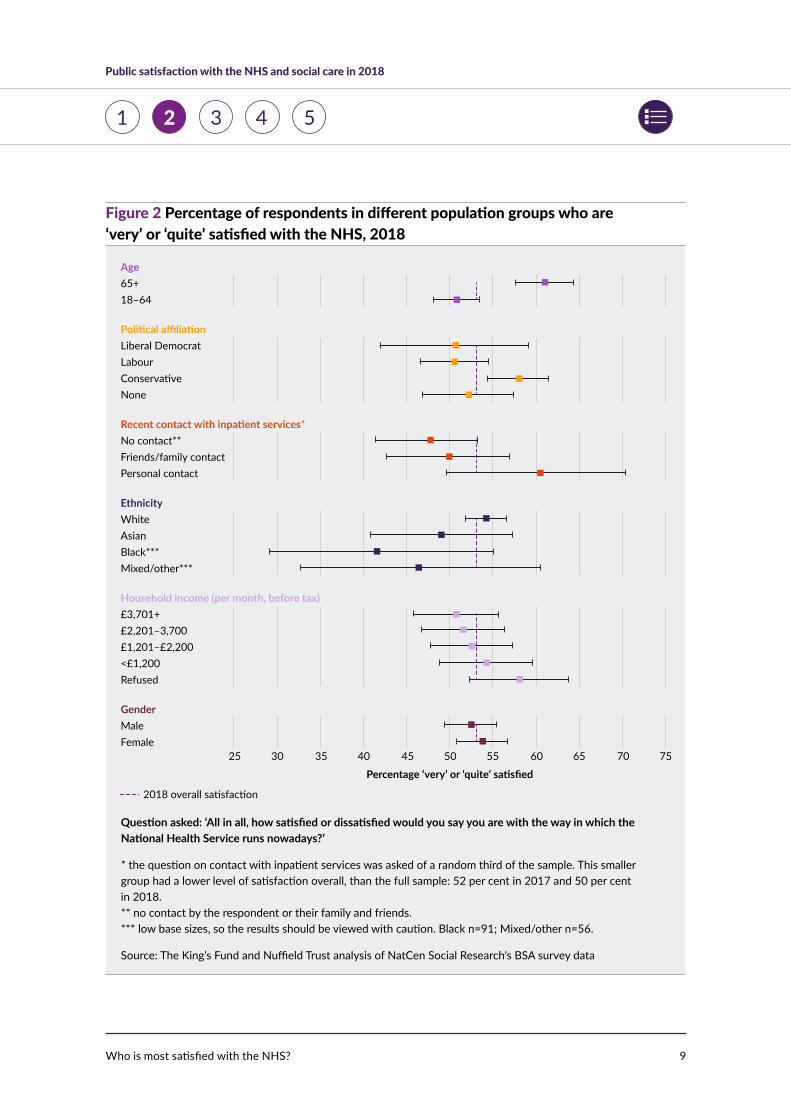
Figure2showshowsatisfactiondiffersamongdifferentpopulationgroups.Foreachgroupwehaveincludedbarsshowingthe95percentconfidenceintervalaroundtheirlevelofsatisfaction.Thisistherangeofvaluesthat,basedonthesurveydata,wecanbe95percentcertainincludethetruesatisfactionlevelforeachgroup.Wheretheconfidenceintervalsoverlapbetweengroups,wecannotbeconfidentthatthetruesatisfactionlevelsdiffer.Asinpreviousyears,satisfactionlevelsdifferbyage:respondentsaged65andolderhavehigherlevelsofsatisfaction(61percent)thanthoseaged18–64(51percent).Andalthoughnotshownonthechart,thoseaged75andolderhaveanevenhigherlevelofsatisfaction(67percent).
Thereisalsoadifferenceinthesatisfactionlevelsreportedbysupportersofdifferentpoliticalparties.RespondentswhosupporttheConservativepartyhaveahigherlevelofsatisfaction(58percent)thanrespondentswhosupporttheLabourparty(51percent).ThisfollowsapatternseenintheBSAinmostyears,wherebysupportersofthepoliticalpartyinpower(ie,thepartythatiscurrently‘running’theNHS)reporthigherlevelsofsatisfactionthansupportersofthemainoppositionparty.
Althoughtherearedifferencesinthesatisfactionlevelsreportedbyothergroups,theyarenotstatisticallysignificant.Thismeansthatwecannotbeconfidentthatthetruelevelsofsatisfactionforthesegroupsactuallydiffer;thesurveyresultsmaybedowntochance.Figure2showsthattherearenostatisticallysignificantdifferencesinsatisfactionlevelsbetweenmenandwomen,acrossdifferentincomegroups,betweenpeopleofdifferentethnicities,andbetweenthosewhohaveandhavenothadrecentcontactwithNHSinpatientservicesinthepastyear.
Figure3showshowsatisfactionlevelsforeachpopulationgroupchangedbetween2017and2018.Satisfactionlevelsdecreasedformost,butalotofthosechangeswerenotstatisticallysignificant.Onthechart,thechangesthatarestatisticallysignificantaremarkedwitha‘v’.
Public satisfaction with the NHS and social care in 2018
WhoismostsatisfiedwiththeNHS? 9
2 1 3 4 5
Question asked: ‘All in all, how satisfied or dissatisfied would you say you are with the way in which the National Health Service runs nowadays?’
*thequestiononcontactwithinpatientserviceswasaskedofarandomthirdofthesample.Thissmallergrouphadalowerlevelofsatisfactionoverall,thanthefullsample:52percentin2017and50percentin2018.**nocontactbytherespondentortheirfamilyandfriends.***lowbasesizes,sotheresultsshouldbeviewedwithcaution.Blackn=91;Mixed/othern=56.
Source:TheKing’sFundandNuffieldTrustanalysisofNatCenSocialResearch’sBSAsurveydata
Figure 2 Percentage of respondents in different population groups who are ‘very’ or ‘quite’ satisfied with the NHS, 2018
Percentage ‘very’ or ‘quite’ satisfied 25 30 35 40 45 50 55 60 65 70 75
Age65+18–64
Political affiliationLiberalDemocratLabourConservativeNone
Recent contact with inpatient services*Nocontact**Friends/familycontactPersonalcontact
EthnicityWhiteAsianBlack***Mixed/other***
Household income (per month, before tax)£3,701+£2,201–3,700£1,201–£2,200<£1,200Refused
GenderMaleFemale
2018overallsatisfaction

Public satisfaction with the NHS and social care in 2018
WhoismostsatisfiedwiththeNHS? 10
2 1 3 4 5
Question asked: ‘All in all, how satisfied or dissatisfied would you say you are with the way in which the National Health Service runs nowadays?’
vdifferenceisstatisticallysignificantat5percentlevel,p<=0.05*nocontactbytherespondentortheirfamilyandfriends.**lowbasesizes,sotheresultsshouldbeviewedwithcaution.2018:Blackn=91;Mixed/othern=56;2017:Blackn=109;Mixed/othern=45
Source:TheKing’sFundandNuffieldTrustanalysisofNatCenSocialResearch’sBSAsurveydata
Figure 3 Change in percentage of respondents in different population groups who are ‘very’ or ‘quite’ satisfied with the NHS, 2017–2018
Between 2017 and 2018 the change
in satisfaction was statistically significant
for the four groups marked v
Change in satisfaction from 2017 to 2018, in percentage points -18 -16 -14 -12 -10 -8 -6 -4 -2 0 2 4 6
Age65+18–64
Political affiliationLiberalDemocratLabourConservativeNone
Recent contact with inpatient servicesNocontact*Friends/familycontactPersonalcontact
EthnicityWhiteAsianBlack**Mixed/other**
Household income (per month, before tax)£3,701+£2,201–3,700£1,201–£2,200<£1,200Refused
GenderMaleFemale
v
v
v
v

Public satisfaction with the NHS and social care in 2018
WhyisthepublicsatisfiedordissatisfiedwiththeNHS? 11
3 1 2 4 5
3 Why is the public satisfied or dissatisfied with the NHS?
WeknowthatpublicviewsabouttheNHSaredrivenbyarangeoffactors,andthattheprecisereasonsforchangesinpublicsatisfactionovertimearedifficulttopindown.However,since2015wehaveincludedquestionsthatexplorewhatliesbehindtheoveralllevelsofsatisfactionanddissatisfactionreportedinthesurvey.Thequestionsaskrespondentswhoareeither‘satisfied’or‘dissatisfied’withtheNHStoexplaintheiranswerbypresentingninepossiblereasonsandaskingthemtoselectuptothree.Thelistsofreasonsweredevelopedusinganswerstoanopen-endedquestionaboutwhyrespondentswereeithersatisfiedordissatisfied.
WhenweaskedrespondentswhoweresatisfiedwiththeNHSoveralltoexplaintheiranswer,themajoritysaidtheyweresatisfiedbecauseofthequalityofcare(71percent)andtheNHSbeingfreeatthepointofuse(62percent)(Figure4).Almosthalfsaidtheyweresatisfiedbecauseofthegoodrangeofservicesavailable(46percent)andtheattitudesandbehaviourofNHSstaff(44percent),andforalmostaquarter(23percent),thelengthofwaitingtimeswasafactor.

Public satisfaction with the NHS and social care in 2018
WhyisthepublicsatisfiedordissatisfiedwiththeNHS? 12
3 1 2 4 5
Question asked: ‘You said you are satisfied with the way in which the National Health Service runs nowadays. Why do you say that? You can choose up to three answers.’(Optionspresentedonacard).Thisquestionwasaskedofarandomthirdofthosewhosaidtheywere‘quite’or‘very’satisfiedwiththewaytheNHSrunsnowadays,n=494
Source:TheKing’sFundandNuffieldTrustanalysisofNatCenSocialResearch’sBSAsurveydata
Figure 4 Reasons for satisfaction with the NHS overall, 2018
Percentage of respondents stating that they were ‘very’ or ‘quite’ satisfied 0 10 20 30 40 50 60 70 80 90 100
ThequalityofNHScare
NHScareisfreeatthepointofuse
GoodrangeofservicesandtreatmentsavailableontheNHS
AttitudesandbehaviourofNHSstaff
Don’thavetowaitlongforaGPorhospitalappointment
MoneyisspentwiselyintheNHS
GovernmentreformsthataffecttheNHS
HowmuchmoneythegovernmentspendsontheNHS
Storiesinthenewspapers,ontheradiooronTV
Other
Overthepastfouryears,respondentshaveselectedthesametopfivemainreasonsforbeingsatisfied(Figure5).Therehasbeenanincreaseintheproportionofrespondentswhocitequalityofcareasafactor,andadecreaseintheproportionwhosaythattheyaresatisfiedbecauseofshortwaitingtimesforaGPorhospitalappointment.

Public satisfaction with the NHS and social care in 2018
WhyisthepublicsatisfiedordissatisfiedwiththeNHS? 13
3 1 2 4 5
Question asked: ‘You said you are satisfied with the way in which the National Health Service runs nowadays. Why do you say that? You can choose up to three answers.’(Optionspresentedonacard).
Thisquestionwasaskedofarandomthirdofthosewhosaidtheywere‘quite’or‘very’satisfiedwiththewaytheNHSrunsnowadays
Source:TheKing’sFundandNuffieldTrustanalysisofNatCenSocialResearch’sBSAsurveydata
Figure 5 Reasons for satisfaction with the NHS overall, 2015–2018
30
0
Perc
enta
ge o
f res
pond
ents
stati
ng th
at th
ey w
ere
‘ver
y’ o
r ‘qu
ite’ s
atisfi
ed
60
20
10
50
40
80
70
100
90
2015
Don’t have towait long for
a GP or hospitalappointment
The quality ofNHS care
Attitude andbehaviour of
NHS staff
Good range ofservices and
treatments availableon the NHS
NHS care is freeat the point
of use
2016 2017 2018
Dissatisfactionisdrivenbyadifferentsetoffactors(Figure6).ThetopthreereasonsgivenbyrespondentswhoweredissatisfiedwiththeNHSrelatetoaccessandresourcing.Aroundhalfsaidtheyweredissatisfiedbecauseoflongwaitingtimes(53percent),notenoughstaffintheNHS(52percent)andgovernmentfundingfortheservice(49percent).Athird(33percent)identifiedwasteasareason,andoneinfive(20percent)citedgovernmentreformsasthereason.

Public satisfaction with the NHS and social care in 2018
WhyisthepublicsatisfiedordissatisfiedwiththeNHS? 14
3 1 2 4 5
Forthepasttwoyears,aroundhalfofrespondentshaveselectedthreemainreasonstoexplaintheirdissatisfaction:longwaitingtimes,staffshortagesandconcernsaboutalackoffunding(Figure7).Lookingathowthedriversofdissatisfactionhavechangedsincethisquestionwasfirstintroducedin2015,theproportionofrespondentscitinglackoffundingandstaffhaveincreased,whereastheproportioncitingwaitingtimesremainedconstant.
AsmallerproportionofrespondentscitedmoneybeingwastedintheNHSandgovernmentreformsthroughoutthisperiod.Butwhile2017sawajumpintheproportionofrespondentscitinggovernmentreformsasareason,andaslumpintheproportionofrespondentscitingwasteasareason,thelatestdatashowsthesereasonsreturningtolevelssimilartothosereportedin2015and2016.
Question asked: ‘All in all, how satisfied or dissatisfied would you say you are with the way in which the National Health Service runs nowadays? Why do you say that? You can choose up to three answers.’(Optionspresentedonacard).’
Thisquestionwasaskedofarandomthirdofthosewhosaidtheywere‘quite’or‘very’ withthewaytheNHSrunsnowadays,n=305
Source:TheKing’sFundandNuffieldTrustanalysisofNatCenSocialResearch’sBSAsurveydata
Figure 6 Reasons for dissatisfaction with the NHS overall, 2018
Percentage of respondents stating that they were ‘very’ or ‘quite’ dissatisfied 0 10 20 30 40 50 60 70 80 90 100
IttakestoolongtogetaGPorhospitalappointment
TherearenotenoughNHSstaff
Thegovernmentdoesn’tspendenoughmoneyontheNHS
MoneyiswastedintheNHS
GovernmentreformsthataffecttheNHS
ThequalityofNHScare
SomeservicesortreatmentsarenotavailableontheNHS
AttitudesandbehaviourofNHSstaff
Storiesinthenewspaper,ontheradiooronTV
Other
dissatisfied

Public satisfaction with the NHS and social care in 2018
WhyisthepublicsatisfiedordissatisfiedwiththeNHS? 15
3 1 2 4 5
Veryfewpeoplesaidtheirsatisfactionordissatisfactionwasdrivenbystoriesinthemedia–despitewidespreadmediacoverageabouttheNHS’s70thbirthdayandaboutpressuresontheservice(seeFigure8).However,previousstudieshaveidentifiedlinksbetweenpubliclevelsofsatisfactionwiththeNHSandmediacoverage(JudgeandSolomon1993;Judgeet al1992).Itmaybethatmediastorieshaveanindirectimpactonunderlyingattitudes,whichisnotimmediatelyobvioustotherespondent.
Question asked: ‘You said you are dissatisfied with the way in which the National Health Service runs nowadays. Why do you say that? You can choose up to three answers.’(Optionspresentedonacard).
Thisquestionwasaskedofarandomthirdofthosewhosaidtheywere‘quite’or‘very’dissatisfiedwiththewaytheNHSrunsnowadays
Source:TheKing’sFundandNuffieldTrustanalysisofNatCenSocialResearch’sBSAsurveydata
Figure 7 Reasons for dissatisfaction with the NHS overall, 2015–2018
30
0
Perc
enta
ge st
ating
that
they
wer
e‘v
ery’
or ‘
quite
’ dis
satis
fied
60
20
10
50
40
70
100
90
80
2015
Government reforms that
affect the NHS
It takes too longto get a GP or hospital
appointment
Money iswasted inthe NHS
The governmentdoesn’t spendenough money
on the NHS
Not enoughNHS staff
2016 2017 2018

Public satisfaction with the NHS and social care in 2018
WhyisthepublicsatisfiedordissatisfiedwiththeNHS? 16
3 1 2 4 5
Figure 8 Media coverage of the NHS and social care during 2018
ByFebruary,newsofthecrisisreachedTheWhiteHouse.PresidentDonaldTrumptweetedthattheNHSwas‘goingbroke’,aclaimswiftlyrefutedbyNHSChiefExecutiveEngland,SimonStevens.
InthefirstweekofJanuary 2018,journalistswerereportingacrisisintheNHSasA&Eunitsstruggledwithasurgeofpatientsneedingtreatmentandovercrowded
hospitalswereforcedtocancelplannedoperations.
JAN2018 FEB
MAR
APR
InOctober,newsemergedthatawastedisposalcompanyhadfailedtodisposeoftonnesofclinicalwastefromNHStrusts,triggeringameetingofthegovernment’semergencyCobracommittee.
Followingmonthsofmediacoverage,thePrimeMinisterrespondedtopressure,announcinga£20billionboostforthehealthserviceinJune.
InMarchministershailedtheendofausterityastheyannouncedadealtoincrease
thepayofmorethanonemillionNHSworkers.
InJuly,theNHSwasmarkingits70thanniversary,withextensivecoverageinthenewspapersandontelevision,includingalivestudiodebateontheBBC.The70thbirthdayoftheadventofthesocialcaresystembarelyregisteredamongstthenation’smedia.
CallstoincreaseNHSspendinggrewlouderinAprilandMayasthepressuresontheservicecontinuedandadebateaboutwhethertoincreasetaxationtopayforafunding
boostwasconductedthroughthemedia.
SURV
EY P
ERIO
D
MAYJUN
JUL
OCT TheCabinetOfficeBriefingRooms(COBRA)

Public satisfaction with the NHS and social care in 2018
HowsatisfiedistheBritishpublicwithdifferentNHSandsocialcareservices? 17
4 1 2 3 5
4 How satisfied is the British public with different NHS and social care services?
Since1983,theBSAsurveyhasalsoaskedtheBritishpublichowsatisfiedtheyarewithNHSgeneralpractice,dentistry,inpatientandoutpatientservices–and,morerecently,A&Eservices(since1999)andlocalauthoritysocialcareservices(since2005).Manyoftheserespondentswillnothaverecentlyusedalltheservicesthattheyarebeingaskedtocommenton,sotheresultsarelikelytoreflecttheexperiencesoffamilyandfriendsandinformationfromothersourcessuchasthemedia,aswellaspersonalexperienceforthosethathaveusedthem.
Thatsaid,theGPsatisfactionmeasureistheclosestthesurveygetstoameasurebasedondirectpersonalexperience,asmostpeoplewillhavevisitedtheirGPinthepastyearforeitherthemselvesorafamilymember(NHS Digital 2009).
In2018,satisfactionwithNHSgeneralpracticeserviceswas63percent.Thechangefromthepreviousyearwasnotstatisticallysignificantandsatisfactionremainsatitslowestlevelsincethesurveybeganin1983.Lookingoverthelongerterm,satisfactionhasdecreasedby16percentagepointssince2009,whenitwas80percent(Figure9).Dissatisfactionwithgeneralpracticein2018remainsatitshighestlevelsincethesurveybegan.Almostaquarter(24percent)ofrespondentsreportedbeingdissatisfiedwiththeirGPservice–doublethelevelofdissatisfactionreportedin2009.
NHSEngland’snationalGPpatientsurvey(whichcoversEngland,ratherthanGreatBritain)includesquestionsthatprovideausefultriangulationfortheBSAsurvey(Ipsos MORI and NHS England 2018).PatientsregisteredwithaGPareaskedhowtheywouldratetheirexperienceoftheirGPpracticeoverall,andtheproportionratingitas‘good’(‘very’+‘fairly’)hassteadilydecreasedfrom88percentin2012

Public satisfaction with the NHS and social care in 2018
HowsatisfiedistheBritishpublicwithdifferentNHSandsocialcareservices? 18
4 1 2 3 5
to84percentin2018.Similarly,theproportionwhoratedtheiroverallexperienceofmakinganappointmentasgoodhasdecreasedfrom79percentin2012to69percentin2018.1
1Changesweremadetothissurveyin2018,whichmeantrendsbetween2017and2018shouldbetreatedwithcaution.Althoughthetwoquestionsreportedhereremainbroadlyunchanged,otherquestionsinthesurveywereamendedandthismayhavehadanimpactonresponses.
Questions asked: GP satisfaction: ‘From your own experience, or from what you have heard, please say how satisfied or dissatisfied you are with the way in which each of these parts of the National Health Service runs nowadays. First, local doctors or GPs?’Thisquestionwasnotaskedin1984,1985,1988,1992and1997; NHS dentistry satisfaction: …National Health Service dentists?’Thisquestionwasnotaskedin1984,1985,1988,1992and1997; Overall satisfaction: ‘All in all, how satisfied or dissatisfied would you say you are with the way in which the National Health Service runs nowadays?’Thisquestionwasnotaskedin1985,1988and1992.
Source:TheKing’sFundandNuffieldTrustanalysisofNatCenSocialResearch’sBSAsurveydata
Figure 9 Public satisfaction with NHS GP services, NHS dentistry services and the NHS overall, 1983–2018
40
0
Perc
enta
ge ‘v
ery’
or ‘
quite
’ sati
sfied
100
20
80
60
Year
GPs Dentistry
1985 2005 20101990 1995 2000 2015
NHS overall

Public satisfaction with the NHS and social care in 2018
HowsatisfiedistheBritishpublicwithdifferentNHSandsocialcareservices? 19
4 1 2 3 5
ManyofthosewhorespondedtothesurveywillhavevisitedanNHSdentistfairlyrecently.DatafromNHSDigitalshowsthathalfofadultsinEnglandsawanNHSdentistoveratwo-yearperiodtoJune2018(NHS Digital 2018).ChangesinsatisfactionwithNHSdentistryfollowaverydifferentpatterntosatisfactionwithGPservices(Figure9).In2018,satisfactionwithdentistrywas58percent,andtheincreasefromthepreviousyearwasnotstatisticallysignificant.SatisfactionwithNHSdentistryhasincreasedby15percentagepointssince2008.Therelativelyhighratesofsatisfactioncomparedtothemid-2000sarelikelytobepartlyexplainedbyeffortstoincreaseaccesstoNHSdentistryservicesoverthepastdecade.
Satisfactionwithsocialcareservicesprovidedbylocalauthoritieswas26percentin2018,withnostatisticallysignificantchangeinsatisfactionsince2015.Dissatisfactionwithsocialcareserviceswas34percentin2018–a7percentagepointdecreasefromthepreviousyear,takingdissatisfactionbacktolevelssimilartothosereportedin2016and2015.
Wheninterpretingtheseresults,itisimportanttotakeintoaccountthelackofpublicunderstandingaboutsocialcareservicesandaboutwhichservicesarefundedbylocalauthorities(asopposedtothosepurchasedprivately),aswellasthefactthatmostrespondentswillnothaveanyexperienceofusingthoseservices(Bottery et al 2018).Thiscontributestoahigherproportionofrespondentsgivinganeutralor‘don’tknow’answertothesatisfactionquestionthanforotherservices(seeFigure13).DataonthequalityofsocialcareservicesfromtheCareQualityCommission(CQC)suggeststhatratingsmaybeimproving,butaccesstoservicesisincreasinglysqueezedaslocalauthoritiestightenentitlements(Thorlby et al 2018;Care Quality Commission 2014).
Thesurveyquestionaboutsocialcareserviceshasbeenaskedsince2005,althoughthefirsttwoyears’dataisbasedonaquestionwithslightlydifferentwording,whichdoesnotmentionlocalauthoritiesinitsdefinitionofsocialcare(seenotesunderFigure10formoredetailonquestionwording).

Public satisfaction with the NHS and social care in 2018
HowsatisfiedistheBritishpublicwithdifferentNHSandsocialcareservices? 20
4 1 2 3 5
Thesurveyalsoasksaboutsatisfactionwithinpatientandoutpatientservices,bothofwhichincreasedin2018(Figure11).
Satisfactionwithinpatientserviceswas63percent–thehighestlevelofsatisfactionsince1993.Levelshavefluctuatedoverthepastthreeyears:the8percentagepointincreasein2018takessatisfactionbacktoalevelsimilarto2016.Dissatisfactionwithinpatientserviceswasjust9percent–adropof5percentagepointsfromthepreviousyearandthelowestlevelofdissatisfactionsince1983.
Social care satisfaction: Questions asked: ‘And how satisfied or dissatisfied are you with social care provided by local authorities for people who cannot look after themselves because of illness, disability or old age?’[2012–2018], ‘At some point in their lives people can need regular help looking after themselves because of illness, disability or old age… From your own experience, or from what you have heard, please say how satisfied or dissatisfied you are with the services provided to people who need this kind of regular help with looking after themselves, whose family cannot provide it?’[2005,2007].Questionnotasked2006and2008–2011.
Overall satisfaction: ‘All in all, how satisfied or dissatisfied would you say you are with the way in which the National Health Service runs nowadays?’
Source:TheKing’sFundandNuffieldTrustanalysisofNatCenSocialResearch’sBSAsurveydata
Figure 10 Satisfaction with social care services and the NHS overall, 2005–2018
40
0
Perc
enta
ge ‘v
ery’
or ‘
quite
’ sati
sfied
100
20
80
60
Year
NHS overall Social care
2005 201720162015201420132012201020082006 2007 2009 2011 2018

Public satisfaction with the NHS and social care in 2018
HowsatisfiedistheBritishpublicwithdifferentNHSandsocialcareservices? 21
4 1 2 3 5
Satisfactionwithoutpatientserviceswas70percentin2018–thehighestlevelsincethesurveybeganin1983.Aswithinpatientservices,satisfactionlevelshavefluctuatedoverthepastthreeyears:the5percentagepointincreasein2018takessatisfactionbacktoalevelsimilarto2016.Dissatisfactionwithoutpatientserviceswas11percent,andthechangefromthepreviousyearwasnotstatisticallysignificant.
SatisfactionwithA&Eservices(53percentin2018)hasnotchangedsignificantlysince2015.
Questions asked: ‘From your own experience, or from what you have heard, please say how satisfied or dissatisfied you are with the way in which each of these parts of the National Health Service runs nowadays… being in hospital as an inpatient?… attending hospital as an outpatient?… accident and emergency departments?’;Overallsatisfaction: ‘All in all, how satisfied or dissatisfied would you say you are with the way in which the National Health Service runs nowadays?’
Questionsaboutoutpatients,inpatientsandtheNHSoverallwerenotaskedin1984,1985,1988,1992;questionsonoutpatientsandinpatientswerenotaskedin1997;questionsonaccidentandemergencywerefirstaskedin1999.
Source:TheKing’sFundandNuffieldTrustanalysisofNatCenSocialResearch’sBSAsurveydata
Figure 11 Satisfaction with NHS inpatient, outpatient and accident and emergency services, 1983–2018
40
0
Perc
enta
ge ‘v
ery’
or ‘
quite
’ sati
sfied
100
20
80
60
Year
Outpatients Inpatients
1985 2005 20101990 1995 2000 2015
Accident and emergency NHS overall
Public satisfaction with the NHS and social care in 2018
HowsatisfiedistheBritishpublicwithdifferentNHSandsocialcareservices? 22
4 1 2 3 5
ThedataonsatisfactionwithinpatientservicesshowsasimilartrendtothenationalNHSinpatientsurvey,whichwasconductedin2017(resultsofthe2018surveyareyettobepublished)(CQC 2018).WhenaskedtoratetheirexperienceofNHSinpatientservicesoverallonascaleof0(verypoor)to10(verygood),almosthalfofrespondentsgaveascoreof9or10–afigurethathasbeengraduallyincreasingsincethequestionwasfirstintroducedin2012.Thelatestemergencydepartmentnationalpatientsurveyresultsfrom2016alsoshowthataroundhalfofpatientsgivetheserviceanoverallratingof9or10,butchangestothesurveysamplingandanalysisapproachmeanthatthisdatacannotbecomparedtopreviousyears(CQC 2017).Thereisnorecentnationalpatientsurveydataonoutpatientservicesagainstwhichtocomparethesemeasures.
ThetrendofincreasingsatisfactionwithinpatientandoutpatientservicesisstrikinggiventhatoverallsatisfactionwiththeNHShasbeenfallinginrecentyears.PublicsatisfactionsurveysliketheBSAoftenfindthatthepublicgivedifferentratingswhentheyareaskedabouttheNHSingeneraltowhentheyareaskedaboutspecificservices,andtheformerisnotasumoftheirviewsonthelatter.Itisbeyondthescopeofthissurveytorevealtheunderlyingreasonsfortheassociationsbetweenthesedifferentsatisfactionmeasures,butitisworthbearinginmindthatrespondentsarelikelytobeconsideringarangeofdifferentfactorsandgivingdifferentweightingstoeachwhenexpressingsatisfactionwithindividualservicesandtheNHSoverall(Wellings 2012).
Onefactorthatweknowaffectssatisfactionratingsforhospitalservicesisrecentexperienceofusingtheservice(Figure12).Asinpreviousyears,thelatestsurveyshowsthatsatisfactionwithinpatientserviceswashigheramongthosewhohadusedinpatientservicesinthepastyear(83percent)thanamongthosewhohadnotusedtheservicethemselvesbuthadfriendsandfamilywhohad(69percent),andsatisfactionwasevenloweramongthosewhohadhadnocontactwithinpatientserviceseitherthemselvesorthroughtheirfriendsandfamily(57percent).Responsesaboutoutpatientservicesfollowasimilarpattern(Figure12).
Thesedifferencesremainwhenageistakenintoaccount.So,forexample,peopleagedover65whohadbeenanNHSinpatientrecentlyweremoresatisfiedthanpeopleinthesameagegroupwhohadnothadrecentexperienceoftheservice.

Public satisfaction with the NHS and social care in 2018
HowsatisfiedistheBritishpublicwithdifferentNHSandsocialcareservices? 23
4 1 2 3 5
Thesurveydoesnottelluswhatliesbehindthesedifferences,butthefindingsatleastsuggestthatpeoplewhousehospitalserviceshavepositivefeelingsabouttheexperience(bethatbecauseofthequalityofcaretheyreceive,feelingsofgratitudefortheserviceorotherthings)andthiscontributestothemreportinghigherlevelsofsatisfaction.Thosewithnoexperienceoftheservicemaydrawonadifferentsetofinformationsourceswhendecidingontheirlevelofsatisfaction.Theirmorenegativeresponsesmight,forexample,bemoreinfluencedbystoriesabouthospitalsinthemedia,whichtendtobenegative(Pinker 2018).
Questions asked: ‘In the last twelve months, have you or a close family member or close friend… been an out-patient/in-patient in an NHS hospital?[Yes,justme,Yes,notmebutclosefamilymemberorfriend,Yes,bothmeandclosefamilymemberorfriend,No,neither’]; ‘From your own experience, or from what you have heard, please say how satisfied or dissatisfied you are with the way in which each of these parts of the National Health Service runs nowadays… being in hospital as an inpatient?… attending hospital as an outpatient?…
Source:TheKing’sFundandNuffieldTrustanalysisofNatCenSocialResearch’sBSAsurveydata
Figure 12 Satisfaction with NHS inpatient and outpatient services by recent contact with the service, 2018
60
0
Perc
enta
ge ‘v
ery’
or ‘
quite
’ sati
sfied
100
40
20
80
Inpatients Outpatients
Personal contact No personal contact but friend or family contact
No contact by individual, friend or family

Public satisfaction with the NHS and social care in 2018
HowsatisfiedistheBritishpublicwithdifferentNHSandsocialcareservices? 24
4 1 2 3 5
Figure13bringstogetherpublicsatisfactiondataforhealthandsocialcareservicesandtheNHSoverallin2018.ItshowsthatsatisfactionwithoutpatientservicesishigherthanforallotherservicesincludedinthesurveyandfortheNHSoverall.Thisisthefirsttimesincethesurveybeganin1983thataserviceotherthangeneralpracticehasreceivedthehighestsatisfactionratings(althoughin2017GPandoutpatientserviceshadthesamelevelofsatisfaction).Thisistheresultoffallinglevelsofsatisfactionwithgeneralpracticeandincreasinglevelsofsatisfactionwithoutpatientservices.
Questions asked: ‘From your own experience, or from what you have heard, please say how satisfied or dissatisfied you are with the way in which each of these parts of the National Health Service runs nowadays. First, local doctors or GPs?… National Health Service dentists?’ …being in hospital as an inpatient?… attending hospital as an outpatient?… accident and emergency departments?’ ‘And how satisfied or dissatisfied are you with social care provided by local authorities for people who cannot look after themselves because of illness, disability or old age?’;Overallsatisfaction: ‘All in all, how satisfied or dissatisfied would you say you are with the way in which the National Health Service runs nowadays?’
Source:TheKing’sFundandNuffieldTrustanalysisofNatCenSocialResearch’sBSAsurveydata
Figure 13 Satisfaction with NHS and social care services, 2018
Percentage of respondents 0 10 20 30 40 50 60 70 80 90 100
Outpatients
GPs
Inpatients
Dentists
NHSoverall
Accidentandemergency
Socialcare
Veryorquitesatisfied Neithersatisfiednordissatisfied VeryorquitedissatisfiedDon’tknow/refused

Public satisfaction with the NHS and social care in 2018
HowsatisfiedistheBritishpublicwithdifferentNHSandsocialcareservices? 25
4 1 2 3 5
Asinpreviousyears,satisfactionwiththesocialcareservicesprovidedbylocalauthoritiesisfarlowerthansatisfactionwithhealthcareservices.
Whenrespondingtothequestiononsocialcare,40percentofrespondentssaidthatthey‘don’tknow’howsatisfiedtheyare,orprovideaneutralanswer(‘neithersatisfiednordissatisfied’).Thisishigherthanforotherservices,wherethefigurerangesfrom13percentto29percent,andislikelytoreflectalowerlevelofunderstandingamongthepublicaboutwhatsocialcareservicesare,coupledwithlessexperienceofusingthem(Bottery et al 2018).
In2018,netsatisfactionwithsocialcareservices(calculatedassatisfactionminusdissatisfaction)was-8percent,whereasnetsatisfactionwiththeNHSoverallandindividualNHSservicesrangedfrom23percentto59percent.

Public satisfaction with the NHS and social care in 2018
Conclusion 26
5 1 2 3 4
5 Conclusion
In2018,theoutpouringofaffectionthataccompaniedtheNHS’s70thbirthdaydidnotstemfallinglevelsofpublicsatisfactionwiththeservice.SatisfactionwiththeNHSsitsatitslowestlevelformorethanadecade,drivenbyconcernsaboutalackofmoney,staffshortagesandmountingwaitingtimes.ThenewfundingsettlementfortheNHSandaccompanyinglong-termplanhavesetthedirectionoftravelforthenext10years,butwithless-firmcommitmentstoreducingwaitingtimesthantherewereinthepast,andthegovernment’sstrategyfordealingwithcriticalworkforceissuesstilloutstanding,wemustwaittoseewhenthedecade-longslideinpublicsatisfactionwiththeNHSwillcometoanend.

Appendix:Methodology 27
Public satisfaction with the NHS and social care in 2018
5 1 2 3 4
Appendix: MethodologySample and approach
The2018surveyconsistedof3,879interviewswitharepresentativesampleofadultsinEngland,ScotlandandWales.AddressesareselectedatrandomandvisitedbyoneofNatCenSocialResearch’sinterviewers.Afterselecting(againatrandom)oneadult(aged18orover)attheaddress,theinterviewercarriesoutanhour-longinterview.Theparticipantanswersmostquestionsbyselectingananswerfromasetofcards.
ThesamplesizefortheoverallNHSsatisfactionquestionreportedherewas2,926in2018;forquestionsaboutsatisfactionwithotherNHSservicesandsocialcareservices,thesamplesizewas973.Thedataisweightedtocorrectfortheunequalprobabilitiesofselection,andforbiasescausedbydifferentialnon-response.Theweightedsampleiscalibratedtomatchthepopulationintermsofage,sexandregion.Themarginoferrorin2018forthehealthcarequestionswasaround+/-1.5to3.7percentagepoints.
Themajorityoffieldworkforthe2018surveywasconductedbetweenJulyandOctober,withasmallnumberofinterviewstakingplaceinNovember.
Topics
Thetopicscoveredbythesurveychangefromyeartoyear,dependingontheidentitiesandinterestsofitsfunders.Somequestionsareaskedeveryyear,someareaskedeverycoupleofyearsandsomeareaskedlessfrequently.
Funding
Thesurveyisfundedbyarangeofcharitableandgovernmentsources,whichchangefromyeartoyear.ThesurveyisledbyNatCenSocialResearch.NatCencarriesoutresearchinthefieldsofsocialandpublicpolicy.

References 28
Public satisfaction with the NHS and social care in 2018
1 2 3 4 5
ReferencesBotteryS,VarrowM,ThorlbyR,WellingsD(2018).A fork in the road: next steps for social care funding reform. The costs of social care funding options, public attitudes to them – and the implications for policy reform.London:TheKing’sFundandHealthFoundation.Availableat:www.kingsfund.org.uk/publications/fork-road-social-care-funding-reform(accessedon13February2019).
BurkittR,DuxburyK,EvansH,EwbankL,GregoryF,HallS,WellingsD,WenzelL(2018).The public and the NHS: what’s the deal?London:TheKing’sFund.Availableat:www.kingsfund.org.uk/publications/public-and-nhs-whats-the-deal(accessedon13February2019).
CareQualityCommission(2018).2017 Adult inpatient survey statistical release.Newcastle:CareQualityCommission.Availableat:www.nhssurveys.org/surveys/1223(accessedon13February2019).
CareQualityCommission(2017).2016 Emergency department survey statistical release.Newcastle:CareQualityCommission.Availableat:www.cqc.org.uk/publications/surveys/emergency-department-survey-2016(accessedon13February2019).
CareQualityCommission(2014).The state of health care and adult social care in England 2013/14.HC691.London:StationeryOffice.Availableat:www.gov.uk/government/publications/the-state-of-health-care-and-adult-social-care-in-england-201314(accessedon13February2019).
DayanM,WardD,GardnerT,KellyE(2018).How good is the NHS?London:TheKing’sFund,NuffieldTrust,HealthFoundationandInstituteforFiscalStudies.Availableat:www.kingsfund.org.uk/publications/nhs-70-how-good-is-the-nhs(accessedon13February2019).
EvansH(2018).‘DoesthepublicseetaxrisesastheanswertoNHSfundingpressures?’TheKing’sFundwebsite.Availableat:www.kingsfund.org.uk/publications/does-public-see-tax-rises-answer-nhs-funding-pressures(accessedon13February2019).
IpsosMORI(2019).Ipsos MORI issues index December 2018[online].IpsosMORIwebsite.Availableat:www.slideshare.net/IpsosMORI/ipsos-mori-issues-index-december-2018(accessedon13February2019).
IpsosMORI,NHSEngland(2018).‘GPpatientsurveynationalreport’.GPpatientsurveywebsite.Availableat:www.gp-patient.co.uk/surveysandreports(accessedon13February2019).
JudgeK,SolomonM,MillerD,PhiloG(1992).‘Publicopinion,theNHS,andthemedia:changingpatternsandperspectives’.BMJ (Clinical research ed.),vol304,no6831,pp892–895.

References 29
Public satisfaction with the NHS and social care in 2018
1 2 3 4 5
JudgeK,SolomonM(1993).‘PublicopinionandtheNationalHealthService:patternsandperspectivesinconsumersatisfaction’.Journal of Social Policy,vol22,no3,pp299–327.
McKennaH(2018).Are we expecting too much from the NHS?London:HealthFoundation,InstituteforFiscalStudies,TheKing’sFundandNuffieldTrust.Availableat:www.kingsfund.org.uk/sites/default/files/2018-06/NHS_at_70_are_we_expecting_too_much_from_the_NHS.pdf(accessedon13February2019).
NHSConfederation(2018).‘Overwhelmingmajorityofpublicsupportsspendingincreasetofundimprovedhealthcare’Newsrelease.London:NHSConfederation.Availableat:www.nhsconfed.org/media-centre/2018/06/ipsos-polling(accessedon13February2019).
NHSDigital(2018).NHS dental statistics for England – 2017–18, annual report.London:NHSDigital.Availableat:https://digital.nhs.uk/data-and-information/publications/statistical/ nhs-dental-statistics/2017-18-annual-report(accessedon13February2019).
NHSDigital(2009).Trends in consultation rates in general practice – 1995–2009.London:NHSDigital.Availableat:https://digital.nhs.uk/data-and-information/publications/statistical/trends-in-consultation-rates-in-general-practice/trends-in-consultation-rates-in-general-practice-1995-2009(accessedon13February2019).
NHSEngland(2019).The NHS long term plan.London:NHSEngland.Availableat:www.long termplan.nhs.uk/publication/nhs-long-term-plan/(accessedon13February2019).
PinkerS(2018).‘Themediaexaggeratesnegativenews.Thisdistortionhasconsequences’.The Guardian,17February.Availableat:www.theguardian.com/commentisfree/2018/feb/17/steven-pinker-media-negative-news(accessedon13February2019).
SmithM(2018).A majority of Brits now support increasing income tax to fund the NHS.London:YouGov.Availableat:https://yougov.co.uk/topics/politics/articles-reports/2018/07/03/majority-brits-now-support-increasing-income-tax-f(accessedon13February2019).
TheKing’sFund,NuffieldTrust,HealthFoundation(2017).The autumn budget: joint statement on health and social care.London:TheKing’sFund.Availableat:www.kingsfund.org.uk/publications/autumn-budget-2017(accessedon13February2019).
ThorlbyR,StarlingA,BroadbentC,WattT(2018).What’s the problem with social care, and why do we need to do better?London:TheKing’sFund.Availableat:www.kingsfund.org.uk/publications/nhs-70-whats-the-problem-with-social-care(accessedon13February2019).
WellingsD(2012).‘Beyondtheheadlines:whatishappeningwithNHSsatisfactionrates?’NuffieldTrustBlog.Availableat:www.nuffieldtrust.org.uk/news-item/beyond-the-headlines-what-is-happening-with-nhs-satisfaction-rates(accessedon13February2019).

Acknowledgements 30
Public satisfaction with the NHS and social care in 2018
1 2 3 4 5
AcknowledgementsManythankstoEleanorAttarTaylor,SivaAnandacivaandDavidMaguirefortheirassistancewithdataanalysis,toAndrewMcCrackenforhisanalysisofmediastoriesduringthefieldperiod,andtoallofourcolleaguesatTheKing’sFundandNuffieldTrustwhoprovidedhelpfulcommentsonearlierdraftsandhelpedwiththeediting,digitalcontentandlaunchofthisreport.MostimportantlywewouldliketothankmembersoftheBritishpublicforthetimetheytooktocompletethissurveyandforprovidinguswiththisfascinatingdataset.

Abouttheauthors 31
Public satisfaction with the NHS and social care in 2018
1 2 3 4 5
About the authorsRuth Robertson
RuthworksinthepolicyteamwheresheleadsresearchprojectsonawiderangeofNHSpolicyissues.Recently,thesehaveincludedthedevelopmentofclinicalcommissioninggroups,thequesttogetbettervaluefromtheNHSbudgetandtheimpactofNHSfinancialpressuresonpatients.
BeforereturningtoTheKing’sFundin2013,RuthspentthreeyearsattheCommonwealthFundinNewYorkresearchingtheimplementationoftheAffordableCareActanditsimpactontheuninsured.ShepreviouslyworkedatTheKing’sFundbetween2006and2010,whenshecompletednationalevaluationsoftwoofLabour’smajorhealthsystemreforms:patientchoiceandpractice-basedcommissioning.EarlierinhercareerRuthworkedasananalystattheCommissionforHealthImprovement(apredecessortotheCareQualityCommission)andasamedicalsecretaryatvariousNHStrusts.
John Appleby
JohnApplebyjoinedtheNuffieldTrustasDirectorofResearchandChiefEconomistinSeptember2016,after18yearsatTheKing’sFund.
HeisaVisitingProfessorattheCityHealthEconomicsCentre,CityUniversityLondonandVisitingProfessorattheInstituteofGlobalHealthInnovationatImperialCollege.
JohnhaspreviouslyworkedintheNHSinBirminghamandLondon,andasseniorlecturerattheuniversitiesofBirminghamandEastAnglia.ForfiveyearsheworkedfortheNationalAssociationofHealthAuthorities(nowtheNHSConfederation)asmanageroftheAssociation’sCentralPolicyUnit.
JohnhasactedasanadvisortotheUKgovernmentandParliamentinvariouscapacities,forexample,carryingoutareviewforMinistersofthefuturefundingneedsofNorthernIreland’shealthservice,andasataskforcememberforthe

Abouttheauthors 32
Public satisfaction with the NHS and social care in 2018
1 2 3 4 5
MarmotCommissiononhealthinequalities;aspecialadvisertotheHouseofCommonsHealthSelectCommittee,memberoftheNationalQualityBoard’sPrioritiessub-committeeandasamemberoftheDepartmentofHealth’sStakeholderReferenceGrouponpatientreportedoutcomemeasures.
Harry Evans
Harryisaresearcherinthepolicyteam.BeforejoiningtheFundin2016,HarryworkedforthreeyearsatIpsosMORI’sSocialResearchInstitute,focusingonhealthresearch,workingwitharangeofhealthsectororganisations,includingNHSEnglandandtheDepartmentofHealth.AtIpsosMORI,HarryworkedontheGPPatientSurvey,andalsohadaspecialinterestinspeakingtothepublicabouttheirhealthdataandinemerginghealthtechnologies.
HeholdsaMastersinEuropeanlanguage,cultureandhistoryfromUCL.
Nina Hemmings
NinajoinedtheNuffieldTrustasaResearcherinHealthPolicyinJanuary2018.SheprovidessupportacrossthePolicyteamonarangeofqualitativeprojectsrelatingtohealthandsocialcare.
PriortojoiningtheTrustNinaworkedasaPolicyOfficerleadingonNHSfinancesatNHSProviders,andasCoordinatorfortheObesityHealthAlliance(acoalitiongroupcomprisingover30royalmedicalcollegesandnationalcharities).Shehasspecialinterestsinadultsocialcare,childrenandyoungpeople,andmentalhealth.
NinaholdsanMScinComparativeSocialPolicyfromtheUniversityofOxford,andaBAinArchaeologyandAnthropology.

Public satisfaction with the NHS and social care in 2018
TheKing’sFundisanindependentcharityworkingtoimprovehealthandcareinEngland.Wehelptoshapepolicyandpracticethroughresearchandanalysis;developindividuals,teamsandorganisations;promoteunderstandingofthehealthandsocialcaresystem;andbringpeopletogethertolearn,shareknowledgeanddebate.Ourvisionisthatthebestpossiblehealthandcareisavailabletoall.
www.kingsfund.org.uk @thekingsfund
1 2 3 4 5
Published byTheKing’sFund11–13CavendishSquareLondonW1G0ANTel:02073072568Fax:02073072801
Email:[email protected]
www.kingsfund.org.uk
©TheKing’sFund2019
Firstpublished2019byTheKing’sFund
Charityregistrationnumber:1126980
Allrightsreserved,includingtherightofreproductioninwholeorinpartinanyform
EditedbyKathrynO’Neill
TypesetbyGrasshopperDesignCompany,www.grasshopperdesign.net
PrintedintheUKbyTheKing’sFund
TheNuffieldTrustisanindependenthealththinktank.WeaimtoimprovethequalityofhealthcareintheUKbyprovidingevidence-basedresearchandpolicyanalysisandinformingandgeneratingdebate.
www.nuffieldtrust.org.uk/ @nuffieldtrust

Since1983,NatCenSocialResearch’sBritishSocialAttitudes(BSA)surveyhasaskedmembersofthepublicinEngland,ScotlandandWalesabouttheirviewsontheNHSandhealthandcareissuesgenerally.ThelatestsurveywascarriedoutbetweenJulyandOctober2018andaskedrespondentsabouttheirsatisfactionwiththeNHSoverallandindividualNHSandsocialcareservices.
ThisreportfromTheKing’sFundandNuffieldTrustanalysestheresultsofthesurvey,lookingatthechanginglevelsofsatisfactionwiththeNHSandsocialcareandthefactorsthataffectsatisfaction.
TheKing’sFund11–13CavendishSquareLondonW1G0ANTel:02073072568
Charityregistrationnumber:1126980
www.kingsfund.org.uk