public procurement in portugal 2015 - impic 1 – calculation of the manchester index for portugal...
TRANSCRIPT

Public Procurement in Portugal 2015

2
TECHNICAL DATA
Title: Public Procurement in Portugal 2015 Authors: Cláudia Roriz Pedro Ministro Directorate of Financial Management, Research and Strategy Instituto dos Mercados Públicos, do Imobiliário e da Construção, I.P. Av. Júlio Dinis, 11 1069–010 Lisboa Telephone: 217 946 700 |Fax: 217 946 799 |Email: [email protected] Date of publication: June 2016
Figures in this report for which the source indicated is the “BASE portal” (www.base.gov.pt) are based on data taken from said portal in March 2016.

3
Table of Contents
1. Introduction ................................................................................................................................................................................................ 9 2. Electronic Public Procurement in Portugal ..................................................................................................................................... 11 2.1. The Electronic Public Procurement Index in Portugal (ICPEP) ............................................................................................... 11 2.2. Manchester Index (above Community thresholds) ....................................................................................................................... 13 3. Public Procurement Figures ................................................................................................................................................................ 17 3.1. Public Procurement Statistics ............................................................................................................................................................. 17 3.1.1. Public Procurement Evolution ........................................................................................................................................................... 17 3.1.2. Public Procurement as a share of Gross Domestic Product (GDP) .......................................................................................... 18 3.1.3. Public Procurement and Gross Fixed Capital Formation (GFCF) ............................................................................................ 19 3.1.4. Public Procurement and Budgetary Implementation by Public Administrations ................................................................. 20 3.1.5. Launched procedures vs Concluded contracts ............................................................................................................................... 21 3.2. Public procurement per type of contract ......................................................................................................................................... 22 3.3. Contracts per year of the decision to contract and per average length of procedures ......................................................... 25 3.3.1. Contracts per year of the decision to contract ................................................................................................................................ 25 3.3.2. Breakdown of concluded contracts per month ............................................................................................................................... 27 3.4. Contracts per Type of Procedure ....................................................................................................................................................... 28 3.5. Competitive Procedures vs Direct Award Procedures ................................................................................................................. 31 3.5.1. Competitive procedures ....................................................................................................................................................................... 33 3.5.2. Direct Awards ......................................................................................................................................................................................... 35 3.5.2.1. Simplified Direct Awards .................................................................................................................................................................... 39 3.5.2.2. Direct Awards per Substantive Criterion ........................................................................................................................................ 43 4. Forecast for charges arising from concluded contracts ............................................................................................................... 49 5. The average length of procurement procedures............................................................................................................................. 57 6. Number of competitors by procedure ............................................................................................................................................... 59 7. Award Criteria ........................................................................................................................................................................................ 63 7.1. “Lowest price” vs “Most economically advantageous tender” ................................................................................................. 63 7.2. “Most economically advantageous tender”: weight of the price factor .................................................................................. 65 7.3. Abnormally Low Prices ....................................................................................................................................................................... 67 8. Contracts classified according to the “Common Procurement Vocabulary“ (CPV) ........................................................... 71 9. Stakeholders in Public Procurement Procedures ........................................................................................................................... 73 9.1. Contracting authorities ......................................................................................................................................................................... 73 9.1.1. The contracting authorities universe ................................................................................................................................................. 73 9.1.2. Public procurement per Type of Contracting Authority ............................................................................................................. 76 9.2. Economic Operators ............................................................................................................................................................................. 78 9.2.1. Number of Economic Operators ........................................................................................................................................................ 78 9.2.2. Characterization of national economic operators .......................................................................................................................... 79
4
9.2.3. Public Contracts Share in Economic Operators Turnover .......................................................................................................... 83 9.2.4. Origin of non-domestic economic operators .................................................................................................................................. 84 9.3. Electronic Platforms ............................................................................................................................................................................. 86 9.3.1. Contracts concluded in 2015 with electronic platforms for the purchase of electronic procurement platform services86 9.3.2. Contracts concluded in 2015, per platform through which procedures were carried out ................................................... 88 10. Contract Performance ........................................................................................................................................................................... 90 10.1. Price Deviation ....................................................................................................................................................................................... 90 10.2. Deadline Deviation................................................................................................................................................................................ 94 11. Final Considerations ............................................................................................................................................................................. 96
5
Table 1 – Calculation of the Manchester Index for Portugal ......................................................................................................................................................... 14 Table 2 – Public procurement in Portugal as a share of GDP ....................................................................................................................................................... 18 Table 3 – Public procurement in Portugal as a share of the GFCF in the construction sector (EUR thousand)................................................................... 19 Table 4 – Contracts concluded in 2015 per year of decision ......................................................................................................................................................... 26 Table 5 – Direct awards in 2015, per CPV ....................................................................................................................................................................................... 39 Table 6 – Simplified direct awards in 2015, per CPV .................................................................................................................................................................... 42 Table 7 – Breakdown of the contractual amounts of the contracts concluded on the basis of a substantive criterion in 2015, per substantive reason 46 Table 8 – Breakdown of contracts per CPV ..................................................................................................................................................................................... 71 Table 9 – Breakdown of contracts per CPV: comparing 2014 and 2015 .................................................................................................................................... 71 Table 10 – Ranking of the contracting authorities with the largest procurement volume ........................................................................................................ 78 Table 11 – Contractors per nationality .............................................................................................................................................................................................. 78 Table 12 – Public contracts structure, per company size and per CPV ...................................................................................................................................... 83 Table 13 – Ranking of contractors with the largest procurement volume ................................................................................................................................... 86 Table 14 – Contracts indicating the final deadline .......................................................................................................................................................................... 94 Graph 1 – Public procurement in 2015 .............................................................................................................................................................................................. 11 Graph 2 – Electronic public procurement in Portugal in 2015: the weight of the number of procedures carried out in Portugal .................................... 12 Graph 3 – Changes in ICPEP .............................................................................................................................................................................................................. 13 Graph 4- Changes in the Manchester Index ...................................................................................................................................................................................... 14 Graph 5 – Public procurement in Portugal in 2015: overall figures ............................................................................................................................................. 17 Graph 6 – Public procurement in Portugal from 2011 to 2015: overall figures ......................................................................................................................... 18 Graph 7 – Public procurement as a share of GDP ........................................................................................................................................................................... 19 Graph 8 – Public procurement in Portugal: comparison with budgetary implementation (EUR million) ............................................................................. 20 Graph 9 – Public procurement in Portugal: comparison with budgetary implementation. Changes from 2011 to 2015 (EUR million) ......................... 21 Graph 10 - Comparing the number of launched procedures with the number of concluded contracts and the value of the basic price of launched procedures with the contractual amounts (2015) ............................................................................................................................................................................. 21 Graph 11 – Ratio between the contracts concluded and the procedures launched in the same year: changes from 2012 to 2015 ................................... 22 Graph 12 – Public procurement per type of contract in 2015 ........................................................................................................................................................ 23 Graph 13- Relative weight of goods and services as compared to public works per contractual amounts: from 2010 to 2015 ........................................ 23 Graph 14- Number of contracts concluded from 2011 to 2015 ..................................................................................................................................................... 24 Graph 15- Value of the contracts concluded in 2011-2015 (EUR million)................................................................................................................................. 24 Graph 16- Average value of the contracts concluded in 2011-2015 (EUR) ............................................................................................................................... 25 Graph 17- Percentage of contracts for which the procurement procedure was launched in the same year ........................................................................... 26 Graph 18- Average value of contracts concluded in 2015 per year of the procedure decision (EUR) .................................................................................. 27 Graph 19- Breakdown of concluded contracts per month .............................................................................................................................................................. 28 Graph 20 - Public procurement per type of procedure (2014) ....................................................................................................................................................... 28 Graph 21 - Number of contracts per type of procedure: changes from 2012 to 2015 ............................................................................................................... 29 Graph 22 – Contractual amounts per type of procedure: changes from 2012 to 2015 (EUR million) ................................................................................... 29 Graph 23- Number of contracts per type of procedure (2015) ...................................................................................................................................................... 30 Graph 24- Contractual amounts per type of procedure (2015) ...................................................................................................................................................... 30 Graph 25 - Public procurement in 2015 per type of procedure ..................................................................................................................................................... 31 Graph 26- Relative weight of competitive procedures considering their number from 2011 to 2015 ................................................................................... 32 Graph 27 – Relative weight of competitive procedures, considering the contractual amounts, from 2011 to 2015............................................................ 32 Graph 28 - Contracts resulting from competitive procedures in 2015 ......................................................................................................................................... 33 Graph 29 - Number of contracts resulting from competitive procedures: from 2012 to 2015 ................................................................................................. 34 Graph 30 - Amounts of the contracts resulting from competitive procedures: from 2012 to 2015 (EUR million) ............................................................. 34 Graph 31 - Average value of contracts resulting from competitive procedures, per type of contract: from 2012 to 2015 (EUR million) ..................... 35 Graph 32 – Direct awards in 2015 ...................................................................................................................................................................................................... 36 Graph 33 - Number of contracts under direct award: from 2012 to 2015 ................................................................................................................................... 36 Graph 34 – Value of contracts under direct award: from 2012 to 2015 (EUR million) ............................................................................................................ 37 Graph 35 – Average value of contracts under direct award: from 2012 to 2015 ....................................................................................................................... 37 Graph 36 - Number of contracting authorities that reported direct awards ................................................................................................................................. 38 Graph 37 - Number of contracting authorities that reported contracts concluded in 2015, including (or not) direct awards ............................................ 38 Graph 38 - Simplified direct awards in 2015.................................................................................................................................................................................... 39 Graph 39 – Relative weight of simplified direct awards as compared to the total number of direct awards in 2015.......................................................... 40 Graph 40 - Number of contracting authorities having reported contracts preceded by simplified direct awards, in 2015 ................................................. 40 Graph 41 – Breakdown of simplified direct awards per type of authority in 2015 .................................................................................................................... 41 Graph 42 - Breakdown of contracts under simplified direct award, per ranges of contractual amounts ............................................................................... 42 Graph 43 – Relative weight of contracts under direct award per substantive reasons .............................................................................................................. 43 Graph 44 – Relative weight of contracts under direct award per substantive reasons in public contracts, in 2015 ............................................................. 43 Graph 45 - Changes in the number of contracts concluded on the basis of a substantive criterion in 2015 ......................................................................... 44 Graph 46 - Changes in the contractual amount of contracts concluded on the basis of a substantive criterion in 2015 ..................................................... 44 Graph 47 - Breakdown of the contracts for goods and services concluded on the basis of a substantive criterion in 2015............................................... 45 Graph 48 - Breakdown of the contracts for public works concluded on the basis of a substantive criterion in 2015 ......................................................... 46

6
Graph 49 - Breakdown of the number of contracts concluded on the basis of a substantive criterion: from 2012 to 2015 ............................................... 47 Graph 50 - Breakdown of the contractual amounts of the contracts concluded on the basis of a substantive criterion in 2015, per CPV: comparing 2013 and 2014 ........................................................................................................................................................................................................................................ 48 Graph 51 – Forecast for charges arising from contracts concluded in 2015 (EUR million) .................................................................................................... 49 Graph 52 – Planned implementation rate for contracts concluded in 2015 (EUR million) ...................................................................................................... 49 Graph 53 – Forecast of charges arising from contracts concluded in 2015, per CPV ............................................................................................................... 51 Graph 54 – Forecast of charges arising from contracts concluded in 2015, per type of procedure ........................................................................................ 52 Graph 55 - Forecast of charges arising from contracts concluded in 2015, per type of contract ............................................................................................ 53 Graph 56- Forecast of charges arising from contracts concluded in 2015, per type of contracting authority ...................................................................... 54 Graph 57 – Forecast of charges arising from contracts concluded in 2015, per range of contractual value – goods and services ................................... 55 Graph 58 – Forecast of charges arising from contracts concluded in 2015, per range of contractual value – public works.............................................. 56 Graph 59- Length of procedures related to contracts concluded in 2015, per range and per type of contract (all contracts except simplified direct awards) .................................................................................................................................................................................................................................................... 57 Graph 60- Length of procedures related to contracts concluded in 2015, per time range and per type of contract (contracts resulting from competitive procedures) ....................................................................................................................................................................................................................... 58 Graph 61- Average number of tenders per procedure (2015) ........................................................................................................................................................ 59 Graph 62- Average number of tenders per procedure: changes from 2012 to 2015 .................................................................................................................. 60 Graph 63- Average number of tenders per procedure: changes from 2012 to 2015 .................................................................................................................. 60 Graph 64- Average number of tenders per direct award procedure: changes from 2012 to 2015........................................................................................... 61 Graph 65- Number of tenders per procedure: competitive procedures (2014) ........................................................................................................................... 61 Graph 66- Number of tenders per procedure: direct awards for the purchase of goods and services (2015)........................................................................ 62 Graph 67- Award criteria in open procedures (public procedures and restricted procedures) ................................................................................................. 63 Graph 68 – Relative weight of the award criteria per number of contracts: changes from 2011 to 2015.............................................................................. 64 Graph 69– Relative weight of the award criteria per contractual amounts: changes from 2012 to 2015 .............................................................................. 64 Graph 70– Average value of the contracts preceded by a competitive procedure, per type of award criterion: changes from 2012 to 2015 ................ 65 Graph 71- Breakdown of the weight of the “price” factor, or the like, when assessing tenders submitted under open procedures in 2015................... 66 Graph 72- Cumulative breakdown of the weight of the price factor, or the like, when assessing tenders: from 2011 to 2015 ......................................... 66 Graph 73 – Percentage of the number of contracts in which the price factor, or the like, was largely dominant ................................................................ 67 Graph 74 - The ratio between the basic price and the contractual price, per contractual price range, of contracts for goods and services (including those related to public works) in 2015 ............................................................................................................................................................................................... 68 Graph 75 - The ratio between the basic price and the contractual price, per contractual price range, of contracts for goods and services (including those related to public works): changes from 2012 to 2015 .......................................................................................................................................................... 68 Graph 76 - The ratio between the basic price and the contractual price, per contractual price range, of public works contracts in 2015 ...................... 69 Graph 77 - The ratio between the basic price and the contractual price, per contractual price range, of contracts for public works: changes from 2012 to 2015 ........................................................................................................................................................................................................................................... 69 Graph 78 - Deviation between the basic price and the contractual price, per contractual price range, of the contracts for goods and services (including those related to public works) resulting from competitive procedures in 2015 ...................................................................................................... 70 Graph 79 - Deviation between the basic price and the contractual price, per contractual price range, of public works contracts resulting from competitive procedures in 2015 .......................................................................................................................................................................................................... 70 Graph 80 – Number of contracting authorities having reported contracts: changes from 2011 to 2015 .............................................................................. 73 Graph 81 - Number of contracting authorities per type of authority (2015) ............................................................................................................................... 74 Graph 82- Number of contracting authorities per type of authority: changes from 2012 to 2015 .......................................................................................... 74 Graph 83 - Number of contracting authorities that reported only one contract or zero contracts under direct award, but did report other contracts ... 75 Graph 84- Number of contracting authorities that reported only one contract or zero contracts under direct award, but did report other contracts, per type of authority..................................................................................................................................................................................................................................... 76 Graph 85- Public procurement in 2015 per type of contracting authority ................................................................................................................................... 76 Graph 86- Public procurement per type of authority: changes from 2012 to 2015 ................................................................................................................... 77 Graph 87 – Procurement profile in 2015 per type of authority ..................................................................................................................................................... 77 Graph 88 – Contractors per nationality ............................................................................................................................................................................................. 79 Graph 89 – Contractors representativeness, per company size ..................................................................................................................................................... 80 Graph 90 – Contractors representativeness per company size – Goods and services ............................................................................................................... 80 Graph 91 – Contractors representativeness per company size – Public works ........................................................................................................................... 81 Graph 92 – Pubic contracts structure per company size and per CPV ......................................................................................................................................... 82 Graph 93– Number of situations in which the weight of the contracts concluded with a given contracting authority in 2015 represented more than 20 % of the economic operator’s turnover in 2014 ......................................................................................................................................................................... 84 Graph 94- Classification per type of the companies whose turnover was lower than the value of the public contracts they concluded (2015) ............ 84 Graph 95- Number of contractors, per country (2015) ................................................................................................................................................................... 85 Graph 96 – Contractors from the Community of Portuguese-Speaking Countries.................................................................................................................... 85 Graph 97- Breakdown of the contracts concluded with electronic platforms for the conduct of procedures, per certified entity .................................... 87 Graph 98- Breakdown of the contracts concluded with electronic platforms for the conduct of procedures, per certified entity: changes from 2012 to 2015 ......................................................................................................................................................................................................................................................... 87 Graph 99- Breakdown of the number of contracts and the contractual amounts carried out per platform ............................................................................ 88 Graph 100- Breakdown of the contractual amounts, per platform: changes from 2012 to 2015 ............................................................................................ 89 Graph 101- Breakdown of the number of contracts and the contractual amounts carried out per platform in 2015 ........................................................... 89 Graph 102- Contracts indicating the actual total price ................................................................................................................................................................... 90 Graph 103- Price deviations per range: Goods and services ......................................................................................................................................................... 91 Graph 104- Price deviations per range: Public works ..................................................................................................................................................................... 91

7
Graph 105 - Contracts with an actual price higher than the contractual price, per type of contract ....................................................................................... 92 Graph 106 - Contracts with an actual price higher than the contractual price, per type of procedure ................................................................................... 92 Graph 107 - Contracts with an actual price higher than the contractual price, per type of contracting authority ................................................................ 93 Graph 108 - Contracts with an actual price higher than the contractual price, per CPV (number of contracts)................................................................... 93 Graph 109 – Deadline deviations per range: Goods and services ............................................................................................................................................... 94 Graph 110 – Deadline deviations per range: Public works .......................................................................................................................................................... 95
Abbreviations
ACT Above Community thresholds PCC Public Contracts Code CPV Common Procurement Vocabulary
GFCF Gross fixed capital formation
ICPEP Electronic Public Procurement Index in Portugal (Ìndice da Contratação Pública Eletrónica em Portugal))
MI(act)) Manchester Index (above Community thresholds)
IMPIC Instituto dos Mercados Públicos, do Imobiliário e da Construção (Institute of Public Procurement, Real Estate and Construction)
INCM Imprensa Nacional Casa da Moeda (the Portuguese Mint and Official Printing Office) OJEU Official Journal of the European Union
EP Electronic Platforms GDP Gross domestic product pp Percentage points
SMEs Small and medium-sized enterprises EM EUR million

8

9
1. INTRODUCTION
The Institute of Public Procurement, Real Estate and Construction (hereinafter referred to as “IMPIC”, from Instituto dos Mercados Públicos, do Imobiliário e da Construção) is presenting once again its annual report on public procurement in Portugal, which is designed to disseminate the key indicators on public procurement and provide a better insight into this important field.
In a context where most contracting authorities are under budgetary pressure, a careful, efficient and effective use of public money is more and more required in order to ensure a sound public management. The increasing complexity of public contracts (more diversified products and more sophisticated production processes and technologies) also puts increased pressure on the players involved in public procurement.
Like in previous years1, this report aims at providing a better understanding of public procurement in our country. It is based on the data published in the public procurement portal (the BASE portal2), which is managed by IMPIC and is meant to serve as a repository of all public procurement procedures carried out by entities covered by the Public Contracts Code.
The BASE portal is an integral part of the electronic public procurement model adopted by Portugal in 2009 and plays a significant role in terms of transparency and accountability, namely because it is freely available. Besides that, it also allows for the preparation of analyses that otherwise would not be feasible - at least not in the same way – and that clearly increase the concrete knowledge on public procurement in Portugal, allowing for more informed decisions when designing public policies.
Although the innovative nature of the Portuguese electronic public procurement model is self-evident, namely as regards the creation of a website with the characteristics and objectives of the BASE portal, we are aware that there is still a long way to go before its relevance in the process of understanding the reality of public contracts becomes more effective. The relatively low share of the public contracts reported to the BASE portal not only in GDP3 but also in the budgetary implementation4, on the one hand, and the number of contracting authorities having reported their contracts5, on the other, make us believe that some under-representativeness still exists.
1Reports for 2010, 2011, 2012, 2013 and 2014 are available on the IMPIC’s website (http://www.impic.pt/impic/pt-pt/relatorios-e-dados-estatisticos/relatorios-de-contratacao-publica) and on the BASE portal (http://www.base.gov.pt/Base/pt/Relatorios). 2http://www.base.gov.pt/ 3 See item 3.1.2. 4 See item 3.1.4. 5 See item 9.1.1.
10
From another perspective, the inclusion of data on physical indicators associated with each contract could also be an asset at the level of the BASE portal and the information that can be processed, as it would provide not only a better public understanding of public procurement but also better information for decision-making on public policies.
Transposing the public procurement directives6 into national law is certainly an opportunity for us to have a regulatory framework that can help increase the information to be “placed“ on the portal. The mandatory conduct of (present) direct award procedures through public procurement platforms, the possibility of reporting (present) simplified direct award procedures on a different basis from that of the other procedures, the mandatory reporting of all contracts concluded by public entities (other than contracting authorities), whether or not it is an excluded procurement, and the monitoring of procedures reported by public administration entities are among the aspects that can improve the significance and relevance of the BASE portal.
_______________________ * __________________________
6 Directives 2014/23/EU, 2014/24/EU and 2014/25/EU of 28 March 2014.
11
2. ELECTRONIC PUBLIC PROCUREMENT IN PORTUGAL
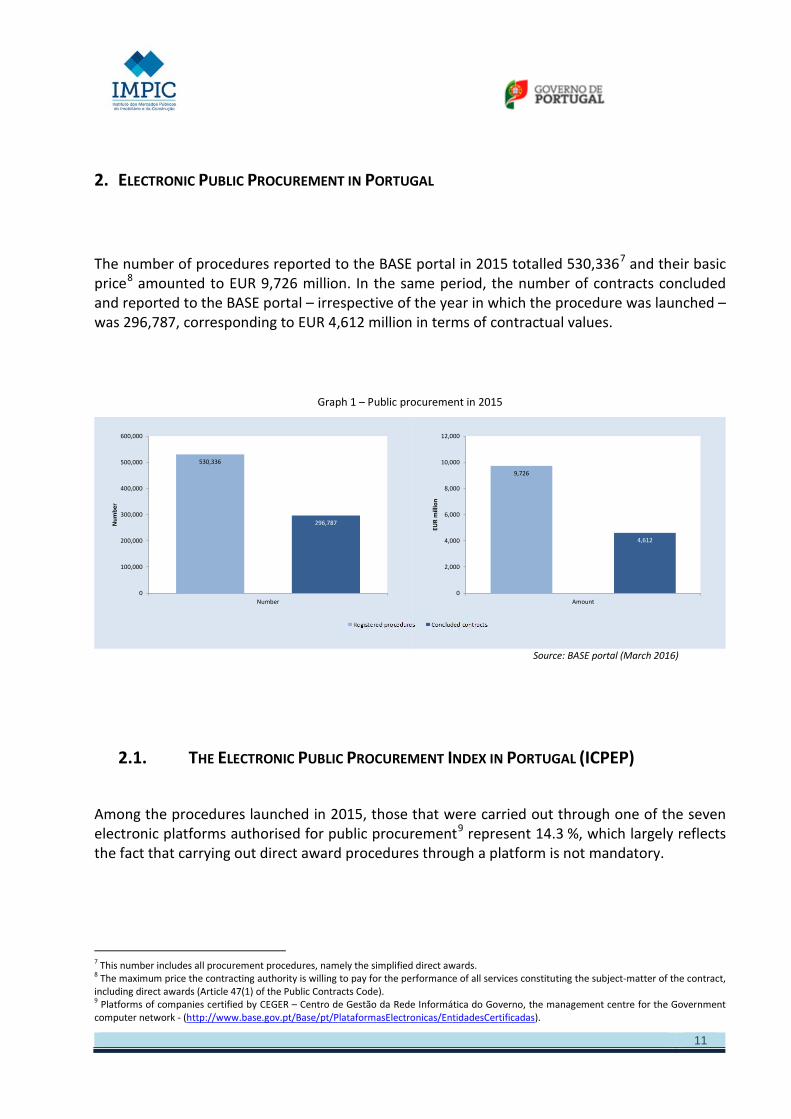
The number of procedures reported to the BASE portal in 2015 totalled 530,3367 and their basic price8 amounted to EUR 9,726 million. In the same period, the number of contracts concluded and reported to the BASE portal – irrespective of the year in which the procedure was launched – was 296,787, corresponding to EUR 4,612 million in terms of contractual values.
Graph 1 – Public procurement in 2015
Source: BASE portal (March 2016)
2.1. THE ELECTRONIC PUBLIC PROCUREMENT INDEX IN PORTUGAL (ICPEP)
Among the procedures launched in 2015, those that were carried out through one of the seven electronic platforms authorised for public procurement9 represent 14.3 %, which largely reflects the fact that carrying out direct award procedures through a platform is not mandatory.
7 This number includes all procurement procedures, namely the simplified direct awards. 8 The maximum price the contracting authority is willing to pay for the performance of all services constituting the subject-matter of the contract, including direct awards (Article 47(1) of the Public Contracts Code). 9 Platforms of companies certified by CEGER – Centro de Gestão da Rede Informática do Governo, the management centre for the Government computer network - (http://www.base.gov.pt/Base/pt/PlataformasElectronicas/EntidadesCertificadas).
530,336
296,787
0
100,000
200,000
300,000
400,000
500,000
600,000
Number
Num
ber
9,726
4,612
0
2,000
4,000
6,000
8,000
10,000
12,000
Amount
EUR
mill
ion

12
Graph 2 – Electronic public procurement in Portugal in 2015: the weight of the number of procedures carried out in Portugal10
Source: BASE portal (March 2016)
The weight of the procurement procedures carried out through electronic platforms was more significant if we consider the monetary values inherent in those procedures: the sum of the basic prices of the procedures carried out through public procurement platforms represented 67.4 % of the sum of the basic price of all the procedures launched in 2015.
Therefore, the Electronic Public Procurement Index in Portugal (ICPEP) – an index designed to monitor the weight of the public procurement procedures carried out through platforms that at present are duly authorized to that effect - was 67 %.
ELECTRONIC PUBLIC PROCUREMENT INDEX IN PORTUGAL ICPEP (total), in 2014
ICPEP 2015(total)=67%
Although the value of this index was higher in 2015 than in 2014, it is nevertheless a very positive value, as it largely exceeds the 5 % estimated in 2010 in the Green Paper on the use of e-Procurement in the EU11.
10 Comparing with the preceding years (2010 and 2011), there was a change in the calculation of the ICPEP: instead of using as a criterion the number of contracts concluded in the relevant year, we used the number of procedures launched in the relevant year. We believe this approach is more appropriate for two reasons: i) first, because when you use the number of contracts you have to consider the procedures launched in previous years, when the use of electronic platforms was not supposed to be very frequent; ii) second, because the use of the number of concluded contracts would not take into account those procedures that had been launched but did not lead to a contract (which does not mean that there had been no procedure at all or that it had not been conducted through an electronic platform). 11 Green Paper on expanding the use of e-Procurement in the EU - SEC(2010) 1214 (http://eur-lex.europa.eu/LexUriServ/LexUriServ.do?uri=COM:2010:0571:FIN:EN:PDF).
76,082
454,254
Number of procedures
14,3%
6,552
3,174
Basic price value
67,4%

13
Graph 3 – Changes in ICPEP
Since competitive procedures12 must be carried out through electronic platforms for public procurement purposes, this indicator depends on the evolution of the procurement procedures launched under direct awards – which saw an increase in their relative weight (see item 3.5.2) – as for these procedures the use of a public procurement platform is at the discretion of the contracting authority.
2.2. MANCHESTER INDEX (ABOVE COMMUNITY THRESHOLDS)
In the Manchester commitment made in 200513, Member-States established that by 2010 at least 50 % of public procurement above the EU thresholds would be carried out electronically.
12 Open procedures and restricted procedures. 13 Ministerial Declaration approved on 24 November 2005, in Manchester, United Kingdom, on the occasion of the Ministerial eGovernment Conference “Transforming Public Services”.
75%
62%
77% 70%
61%
67%
0%
25%
50%
75%
100%
2010 2011 2012 2013 2014 2015
Anos
Changes in ICPEP
EU Green Paper estimate: 5%

14
The calculated value of the Manchester Index for 2015 indicates that it largely exceeds the agreed target, reaching 93 %.
Table 1 – Calculation of the Manchester Index for Portugal
Source: OJEU
MANCHESTER INDEX (ACT) for 2015
MI 2015(act) =93% ACT: above Community thresholds
It should be noted that our country has been steadily exceeding that target since 2010, as shown in the graph below.
Graph 4- Changes in the Manchester Index
2015 Contractual values
Contracts published in the OJEU 2,087,230,946.53 €
Direct awards above Community theresholds not reported to BASE 144,801,119.10 €
Manchester Index 93%
91%92%
89%87%
90%93%
0%
10%
20%
30%
40%
50%
60%
70%
80%
90%
100%
2010 2011 2012 2013 2014 2015
Changes in the Manchester Index
Manchester Index

15
The value established for the Index in 2015 (showing a slight increase of 3 pp when compared to 2014), still meets and exceeds by far the target established by Member States in 2005.
As with ICPEP, the Manchester Index value also depends on the use of electronic platforms by the contracting authorities for direct award procedures.
Whereas the use of electronic platforms enhances transparency and even facilitates the accountability of decision-makers, a higher value in those indexes would be an indicator of a better performance in public procurement. That can be obtained by spreading their use (including in direct award procedures) and/or by changing the rules on the use of direct award procedures (namely by changing the upper limit value for the use of direct awards, or by introducing an intermediate threshold beyond which consulting more than one supplier and/or using the platforms would become mandatory).
Moreover, it should be highlighted that the EU directives now enshrine this idea, by recognising that “Electronic means of information and communication can greatly simplify the publication of contracts and increase the efficiency and transparency of procurement processes.” and making mandatory the “…communication by electronic means at all stages of the procedure …”14, after a transition period of 30 months, until 18 April 201815.
_______________________ * __________________________
14 Recital 52 of Directive 2014/24/EU of the European Parliament and of the Council of 26 February 2014 on public procurement and repealing Directive 2004/18/EC. 15See Articles 22(1) and 90(2) of Directive 2014/24/EU of the European Parliament and of the Council of 26 February 2014.

16

17
3. PUBLIC PROCUREMENT FIGURES
In 2015, the total amount of public contracts reported to the BASE portal16 reached EUR 4,61 billion, as a result of the conclusion of 296,787 contracts.
Graph 5 – Public procurement in Portugal in 2015: overall figures
Source: BASE portal (March 2016)
3.1. PUBLIC PROCUREMENT STATISTICS
3.1.1. PUBLIC PROCUREMENT EVOLUTION
Compared to the preceding years, 2015 saw a decrease in the number of public contracts reported to the BASE portal. This change was particularly marked in the case of goods and services, where there was an decrease of 27% from 2014 to 2015 (although it corresponds to an
16 It should be noted (like in previous reports) that the reported contracts may not include all the contracts concluded by contracting authorities. Besides the fact that some authorities may not have reported their contracts, either because they did not know it was necessary or for any other reason, there are other contracts that because of their very nature or legal framework may not have been fully reported to the BASE portal, namely:
(a) Contracts with a contractual price of less than EUR 5,000; (b) Contracts for the purchase of water and electricity services; (c) Contracts of entities operating in the special sectors (water, energy, transport and postal services) below the Community thresholds; (d) Contracts excluded under Article 4 of the Public Contracts Code; (e) Contracts resulting from procedures not covered by Part II of the Public Contracts Code, pursuant to Article 5 thereof (e.g.: in house procurement).
284,650
3,547
12,137
1,065
0%
10%
20%
30%
40%
50%
60%
70%
80%
90%
100%
Contractual amounts(EUR million)
Number of contacts
Goods and services Public works

18
increase of 159% in relation to 2011). Compared to 2014, public works saw an increase of 8 %, which nevertheless represents a decrease of 6% over 2011.
As regards the contractual amounts, there was an overall decrease of 6.7% (-EUR 329 million) over 2014, and of 3.2% (-EUR 153 million) over 2011. This evolution corresponds to a positive change for goods and services (+6 %, i.e. +EUR 199 million when compared to 2014, and +70% when compared to 2011) and a negative one for public works (-33.1 %, corresponding to -EUR 528 million in comparison with 2014; and -60.2 %, i.e. -EUR 1,613 in relation to 2011).
Graph 6 – Public procurement in Portugal from 2011 to 2015: overall figures
Source: BASE portal (March 2016)
3.1.2. PUBLIC PROCUREMENT AS A SHARE OF GROSS DOMESTIC PRODUCT (GDP)
In 2015, the value of the contractual amounts reported to the BASE portal represented 2.57% of the GDP.
Table 2 – Public procurement in Portugal as a share of GDP
Source: BASE portal (March 2016)
INE - Quarterly National Accounts (last update: 24-03-2016)
This value reflects a decrease of 6.65 % in the value of the contracts reported to the BASE portal and a decrease of 0.28 pp in the contracts weight.
109,831 98,288144,524
388,190
284,65012,932 16,776
13,251
11,188
12,137
0
50,000
100,000
150,000
200,000
250,000
300,000
350,000
400,000
450,000
2011 2012 2013 2014 2015
Num
ber o
f con
trac
ts
2,087 1,8722,586
3,347 3,547
2,678
1,605
1,567
1,593 1,065
0
1,000
2,000
3,000
4,000
5,000
6,000
2011 2012 2013 2014 2015
EUR
mill
ion
2012 2013 2014 2015 ∆ 2015 %
Gross Domestic Product 168,398 170,269 173,446 179,379 3.42%
Contractual amount 3,477 4,153 4,940 4,612 -6.65%
Public procurement as a share of GDP 2.06% 2.44% 2.85% 2.57%
19
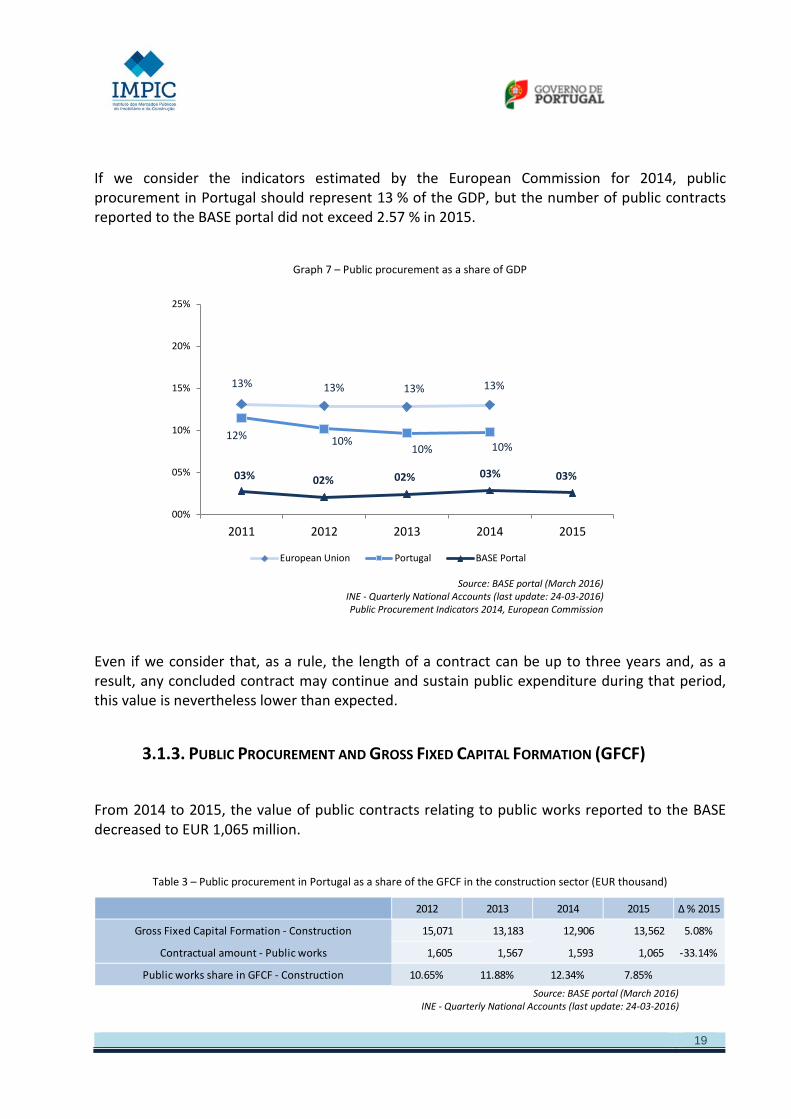
If we consider the indicators estimated by the European Commission for 2014, public procurement in Portugal should represent 13 % of the GDP, but the number of public contracts reported to the BASE portal did not exceed 2.57 % in 2015.
Graph 7 – Public procurement as a share of GDP
Source: BASE portal (March 2016)
INE - Quarterly National Accounts (last update: 24-03-2016) Public Procurement Indicators 2014, European Commission
Even if we consider that, as a rule, the length of a contract can be up to three years and, as a result, any concluded contract may continue and sustain public expenditure during that period, this value is nevertheless lower than expected.
3.1.3. PUBLIC PROCUREMENT AND GROSS FIXED CAPITAL FORMATION (GFCF)
From 2014 to 2015, the value of public contracts relating to public works reported to the BASE decreased to EUR 1,065 million.
Table 3 – Public procurement in Portugal as a share of the GFCF in the construction sector (EUR thousand)
Source: BASE portal (March 2016)
INE - Quarterly National Accounts (last update: 24-03-2016)
13% 13% 13% 13%
12% 10%10% 10%
03% 02% 02% 03% 03%
00%
05%
10%
15%
20%
25%
2011 2012 2013 2014 2015
European Union Portugal BASE Portal
2012 2013 2014 2015 ∆ % 2015
Gross Fixed Capital Formation - Construction 15,071 13,183 12,906 13,562 5.08%
Contractual amount - Public works 1,605 1,567 1,593 1,065 -33.14%
Public works share in GFCF - Construction 10.65% 11.88% 12.34% 7.85%

20
The decrease in the value of public works contracts reported to the BASE portal resulted in a decrease of -4.49 pp in the ratio between the overall contractual amount and the gross fixed capital formation in construction, now representing 7.85 % of that indicator.
3.1.4. PUBLIC PROCUREMENT AND BUDGETARY IMPLEMENTATION BY PUBLIC ADMINISTRATIONS
A comparison between the contractual amounts reported to the BASE portal and the budgetary implementation by public administrations shows that the overall contractual amount of the contracts reported to the BASE portal in 2015 was EUR 4,612 million (including public works), representing 27.2 % of the execution headings “purchase of goods and services” and “other current expenditure”.
Graph 8 – Public procurement in Portugal: comparison with budgetary implementation (EUR million)
Source: BASE portal (March 2016)
Directorate-General for Budget (Summaries of Budget Implementation - January-December 2015)
While the budgetary implementation value can be affected by contracts concluded in previous years, as well as by procurement procedures to which the Public Contracts Code does not apply, a higher amount for the public contracts reported to the BASE portal should be expected if we consider the budgetary implementation value.
Moreover, this has been a recurring situation in the last years, during which the value of the contracts reported to the BASE portal ranged from 22.91 % (2012) to 36.09 % (2011).
16,935
4,612
0
2,000
4,000
6,000
8,000
10,000
12,000
14,000
16,000
18,000
EUR
mill
ion
Purchase of goods and services and other current expenditure
Contractual amount reported to the BASE portal

21
Graph 9 – Public procurement in Portugal: comparison with budgetary implementation. Changes from 2011 to 2015 (EUR million)
Source: BASE portal (March 2016)
Directorate-General for Budget (Summaries of Budget Implementation - January-December 2014)
3.1.5. LAUNCHED PROCEDURES VS CONCLUDED CONTRACTS
As mentioned above, 530,336 launched procedures (corresponding to EUR 9,726 million in terms of basic price) and 296,787 concluded contracts (corresponding to EUR 4,612 million in terms of contractual price) were reported to the BASE portal in 2015.
Comparing with 2014, there was in 2015 an increase in the number of new procedures (+304,093 procedures, i.e. +134.4 %), contrary to what happened with the number of new contracts (-102,591 new contracts, i.e. -25.7 %)
Graph 10 - Comparing the number of launched procedures with the number of concluded contracts and the value of the basic price of launched procedures with the contractual amounts (2015)
Source: BASE portal (March 2016)
13,204
15,176
18,08316,811 16,935
4,765
3,4774,153
4,9404,612
0
2,000
4,000
6,000
8,000
10,000
12,000
14,000
16,000
18,000
20,000
EUR
mill
ion
Purchase of goods and services and other current expenditure
Contractual amount reported to the BASE portal
(36.09%)
(22.91%)(22.97%)
(29.39%)(27.23%)
142,403115,064
175,392 157,775
226,243
399,378
530,336
296,787
0
100,000
200,000
300,000
400,000
500,000
600,000
Registered procedures Concluded contracts
Num
ber 6,291
3,477
7,115
4,153
10,177
4,940
9,726
4,612
0
2,000
4,000
6,000
8,000
10,000
12,000
Registered procedures Concluded contracts
EUR
mill
ion

22
In 2015, in the values associated with those procedures and contracts, the aggregate value of the basic price of launched procedures decreased by EUR 451 million (-4.4 %), as it was the case with the contractual amounts, which dropped by EUR 329 million (-6.7 %).
While they are distinct concepts17, it is possible to establish a link between the procedures launched and the contracts concluded in the same period. The ratio between the number of contracts concluded and the number of procedures launched in 2015 was, therefore, 56.0 % in terms of numbers and 47.4 %, in terms of contractual amounts.
Compared to 2014, there was decrease in the level of completed procedures, i.e. in the ratio between the contracts concluded and the procedures launched during the year both as regards the number of contracts (-120.6 pp), and their value (-1.1 pp).
Graph 11 – Ratio between the contracts concluded and the procedures launched in the same year: changes from 2012 to 2015
Source: BASE portal (March 2016)
Report on Public Procurement in Portugal – 2014
3.2. PUBLIC PROCUREMENT PER TYPE OF CONTRACT
Most contracts (95.9%) reported to the BASE portal in 2015 concerned the purchase of goods and services. Although to a lesser extent (76.9%) goods and services were also in majority in terms of contractual amounts.
17 A procurement procedure means the launching of a procedure that hopefully will lead to the conclusion of a contract. It may happen, however, that some procedures do not result in a contract, either because no tenders are submitted or because the contracting authority decides not to award the contract, or for any other reasons. Conversely, it may happen that a given procedure results in several contracts. That is the case, for example, of contracts with lots or contracts concluded under a framework agreement.
80.8%
55.3%
90.0%
58.4%
176.5%
48.5%56.0% 47.4%
0%
20%
40%
60%
80%
100%
120%
140%
160%
180%
200%
Number Value
2012 2013 2014 2015

23
Graph 12 – Public procurement per type of contract in 2015
Source: BASE portal (March 2016)
In 2015, the public contracts structure followed the same trend as that observed since 2010, whereby the weight of public works contracts18 have been decreasing in relation to the contracts for the purchase of goods and services. While in 2010 contracts related to public works represented 61 % of the total value of public contracts, in 2015 their weight was just 23%.
Graph 13- Relative weight of goods and services as compared to public works per contractual amounts: from 2010 to 2015
Source: BASE portal (March 2016)
The number of contracts relating to goods and services concluded in 2015 represents a decrease of 26.7 % over 2014 (103,540), but still an increase of 97 % (+140,126) in relation to 2013.
As far as public works are concerned, the trend observed in the preceding years was not sustained in 2015, since the number of contracts increased by 8.5 % (+949) over 2014.
18 Considering that “public works” include the services related thereto.
284,650
12,137
0
50,000
100,000
150,000
200,000
250,000
300,000
Num
ber o
f con
trac
ts
3,547
1,065
0
500
1,000
1,500
2,000
2,500
3,000
3,500
4,000
Cont
ract
ual a
mou
nt (E
UR
mill
ion)
39%44%
54%62%
68%77%
61%56%
46%38%
32%23%
0%
25%
50%
75%
100%
2010 2011 2012 2013 2014 2015
Goods and services Public Works
24
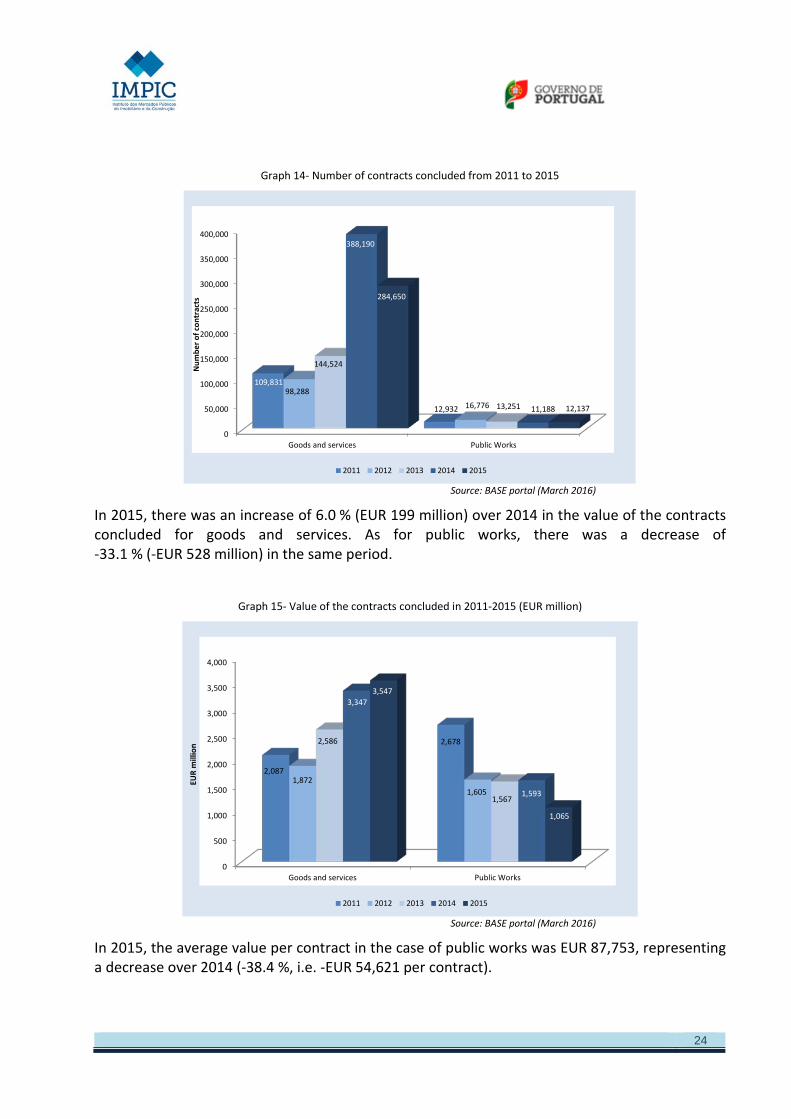
Graph 14- Number of contracts concluded from 2011 to 2015
Source: BASE portal (March 2016)
In 2015, there was an increase of 6.0 % (EUR 199 million) over 2014 in the value of the contracts concluded for goods and services. As for public works, there was a decrease of -33.1 % (-EUR 528 million) in the same period.
Graph 15- Value of the contracts concluded in 2011-2015 (EUR million)
Source: BASE portal (March 2016)
In 2015, the average value per contract in the case of public works was EUR 87,753, representing a decrease over 2014 (-38.4 %, i.e. -EUR 54,621 per contract).
0
50,000
100,000
150,000
200,000
250,000
300,000
350,000
400,000
Goods and services Public Works
109,831
12,932
98,288
16,776
144,524
13,251
388,190
11,188
284,650
12,137
Num
ber o
f con
trac
ts
2011 2012 2013 2014 2015
0
500
1,000
1,500
2,000
2,500
3,000
3,500
4,000
Goods and services Public Works
2,087
2,678
1,8721,605
2,586
1,567
3,347
1,593
3,547
1,065
EUR
mill
ion
2011 2012 2013 2014 2015

25
Graph 16- Average value of the contracts concluded in 2011-2015 (EUR)
Source: BASE portal (March 2016)
In the case of contracts for goods and services, their average value in 2015 was EUR 12,460, corresponding to an increase of 44.5 % (+EUR 3,837 per contract) over 2014.
3.3. CONTRACTS PER YEAR OF THE DECISION TO CONTRACT AND PER AVERAGE LENGTH OF PROCEDURES
3.3.1. CONTRACTS PER YEAR OF THE DECISION TO CONTRACT
An analysis of the contracts per year of the decision to contract shows that 98.4% of the contracts concluded in 2015 stem from procurement procedures launched in the same year. Only 1.59 % of the contracts had been launched in 2014, and we can consider as residual the number of contracts concluded in 2015 following procedures launched before 2014.
0
50,000
100,000
150,000
200,000
250,000
Goods and services Public Works
18,999
207,090
19,049
95,668
17,896
118,228
8,623
142,374
12,460
87,753
EUR
2011 2012 2013 2014 2015

26
Table 4 – Contracts concluded in 2015 per year of decision
Source: BASE portal (March 2016)
A comparison between 2014 and 2015 shows that the number of contracts resulting from procedures launched in the same year was slightly lower (-0.24 pp) in the last year.
Graph 17- Percentage of contracts for which the procurement procedure was launched in the same year
Source: BASE portal (March 2016)
Among the public works contracts concluded in 2015 it is possible to notice that their average value varies according to the year when the procedure was launched, where the average value of the contract increases for procedures with the oldest launch date (except for the average value of contracts whose procedure was launched in 2011, in the case of public works, and in 2011 and 2012, in the case of goods and services).
2009 2010 2011 2012 2013 2014 2015 Total
Goods and services 5 0 1 2 20 4,124 280,498 284,650
Public Works 0 0 1 3 13 582 11,538 12,137
Total 5 0 2 5 33 4,706 292,036 296,787
75%
80%
85%
90%
95%
100%
2012 2013 2014 2015
93.16%
96.48%
98.75% 98.54%
84.14%
95.15% 94.74%95.06%
92.47%
96.36%
98.64% 98.40%
Goods and services Public Works Total

27
Graph 18- Average value of contracts concluded in 2015 per year of the procedure decision (EUR)
Source: BASE portal (March 2016)
3.3.2. BREAKDOWN OF CONCLUDED CONTRACTS PER MONTH
Looking at the breakdown of the number of contracts concluded over the months, we see that August was the month in which fewer contracts were concluded. On the other, 10.6 % of the contracts were awarded in January while 8.8 % were awarded in December, corresponding to -17 % of the contracts concluded in the first month of the year.
As far as the contractual values are concerned, the breakdown ranged between 11.1% (September) and 5.9 % (October).
During the same period, the average value of contracts saw some variation and reached its peak in September (EUR 58,953).
0
100,000
200,000
300,000
400,000
500,000
600,000
700,000
Goods and services Public Works
30,000
450,405
13,440
666,589
104,678
313,786
80,577
185,747
11,452
82,374
2011 2012 2013 2014 2015

28
Graph 19- Breakdown of concluded contracts per month
Source: BASE portal (March 2016)
3.4. CONTRACTS PER TYPE OF PROCEDURE
Among the contracts concluded in 2015, the direct award was the most frequently used type of procedure, representing 90.2 % of the total number of procedures. In terms of contractual amounts, its weight was relatively lower (47.9 %).
Graph 20 - Public procurement per type of procedure (2014)
Source: BASE portal (March 2016)
4051
5.04
1 €
4337
5.05
8 €
4224
1.99
5 €
4189
6.15
9 €
4407
2.79
1 €
3585
9.99
3 €
5341
2.68
9 €
5123
4.68
5 €
5895
2.81
8 €
3853
7.41
0 €
4711
3.45
6 €
5193
9.18
3 €
10.6%
8.4%
9.5%
7.9%7.6%
8.6%
9.1%
6.6%
8.6%7.0%
7.2%
8.8%9.4%
8.0%
8.8%
7.3% 7.3%6.8%
10.6%
7.4%
11.1%
5.9%
7.4%
10.0%
0
10,000
20,000
30,000
40,000
50,000
60,000
70,000
00%
02%
04%
06%
08%
10%
12%
Jan Fev Mar Abr Mai Jun Jul Ago Set Out Nov DezValor médio dos contratos Number of contracts Contractual values
6,88
1
1,639
138
146
6,04
5
527
83,535
2,102
184,187
106
16,0
0192
0% 25% 50% 75% 100%
Num
ber o
f co
ntra
cts
Cont
ract
ual a
mou
nts
(EU
R m
illio
n)
Open procedure Restricted procedure Simplified direct award
Direct award (excl. simplified ones) Framework agreement Others
29
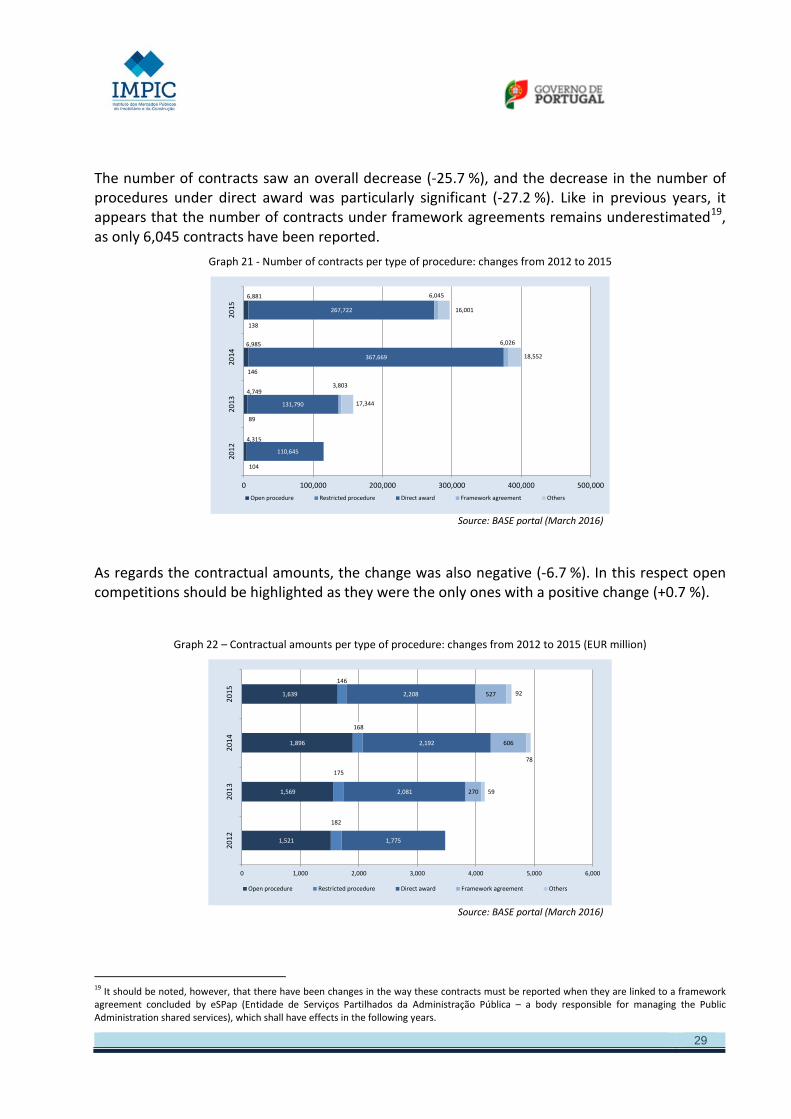
The number of contracts saw an overall decrease (-25.7 %), and the decrease in the number of procedures under direct award was particularly significant (-27.2 %). Like in previous years, it appears that the number of contracts under framework agreements remains underestimated19, as only 6,045 contracts have been reported.
Graph 21 - Number of contracts per type of procedure: changes from 2012 to 2015
Source: BASE portal (March 2016)
As regards the contractual amounts, the change was also negative (-6.7 %). In this respect open competitions should be highlighted as they were the only ones with a positive change (+0.7 %).
Graph 22 – Contractual amounts per type of procedure: changes from 2012 to 2015 (EUR million)
Source: BASE portal (March 2016)
19 It should be noted, however, that there have been changes in the way these contracts must be reported when they are linked to a framework agreement concluded by eSPap (Entidade de Serviços Partilhados da Administração Pública – a body responsible for managing the Public Administration shared services), which shall have effects in the following years.
4,315
4,749
6,985
6,881
104
89
146
138
110,645
131,790
367,669
267,722
3,803
6,026
6,045
17,344
18,552
16,001
0 100,000 200,000 300,000 400,000 500,000
2012
2013
2014
2015
Open procedure Restricted procedure Direct award Framework agreement Others
1,521
1,569
1,896
1,639
182
175
168
146
1,775
2,081
2,192
2,208
270
606
527
59
78
92
0 1,000 2,000 3,000 4,000 5,000 6,000
2012
2013
2014
2015
Open procedure Restricted procedure Direct award Framework agreement Others

30
If we consider the use of the different procurement procedures for each type of contract, we see that the share of direct awards is more significant for goods and services (90.3 %) than for public works (87.0 %). Competitive procedures, however, are more significant for contracts relating to public works (11.6 %) than for contracts relating to the purchase of goods and services (2.0 %).
Graph 23- Number of contracts per type of procedure (2015)
Source: BASE portal (March 2016)
As regards the contractual amounts, the proportion of contracts concluded under competitive procedures is relatively more significant for public works (64.9 %) than for goods and services (30.8 %). Conversely, the contracts concluded following a direct award are the majority for goods and services (51.8 %) although they represent just over ⅓ (34.7 %) for public works.
Graph 24- Contractual amounts per type of procedure (2015)
Source: BASE portal (March 2016)
90.3%
0.03%
1.9%
2.1%
5.6%
9.7%
Goods and services
87.0%
0.39%
11.2%
1.3%0.1%
13.0%
Public works
51.8%
1.1%
29.7%
14.7%
2.6%
Goods and services
34.7%
10.1%
54.9%
0.4%
Public works

31
3.5. COMPETITIVE PROCEDURES VS DIRECT AWARD PROCEDURES
The share of contracts concluded in 2015 following a competitive procedure was 2.4 % in terms of their number but 38.7 % in terms of contractual amounts. On the other hand, contracts concluded under a direct award procedure in 2015 represented 90.2 % of the total number of contracts and 47.9 % in terms of contractual amounts.
Graph 25 - Public procurement in 2015 per type of procedure
Source: BASE portal (March 2016)
Between 2014 and 2015, the relative weight of the number of direct award procedures has slightly decreased from 92.1% to 90.2%.
0% 20% 40% 60% 80% 100%
Num
ber o
f con
trac
tsCo
ntra
ctau
l am
ount
s
2.4%
38.7%
7.4%
13.4%
90.2%
47.9%
Competitive procedures Framework agreement / Others Direct award

32
Graph 26- Relative weight of competitive procedures considering their number from 2011 to 2015
Source: BASE portal (March 2016)
Looking at the weight of the contracts per contractual amount, direct award procedures still represented the majority of the contracts concluded in 2015 (47,9 %), but there was a decrease in the weight of contracts resulting from framework agreements and other procedures (13.4 %, i.e. -0.4 pp compared to 2014).
Graph 27 – Relative weight of competitive procedures, considering the contractual amounts, from 2011 to 2015
Source: BASE portal (March 2016)
0% 25% 50% 75% 100%
2011
2012
2013
2014
2015
4.1%
3.8%
3.1%
1.8%
2.4%
13.4%
6.2%
7.4%
95.9%
96.2%
83.5%
92.1%
90.2%
Competitive procedures Framework agreement / Others Direct award
0% 25% 50% 75% 100%
2011
2012
2013
2014
2015
53.9%
49.0%
42.0%
41.8%
38.7%
7.9%
13.8%
13.4%
46.1%
51.0%
50.1%
44.4%
47.9%
Competitive procedures Framework agreement / Others Direct award
33
3.5.1. COMPETITIVE PROCEDURES
The number and contractual amounts of contracts concluded in 2015 following a competitive procedure lost some of their share to the other procedures as far as their representativeness in public procurement is concerned.
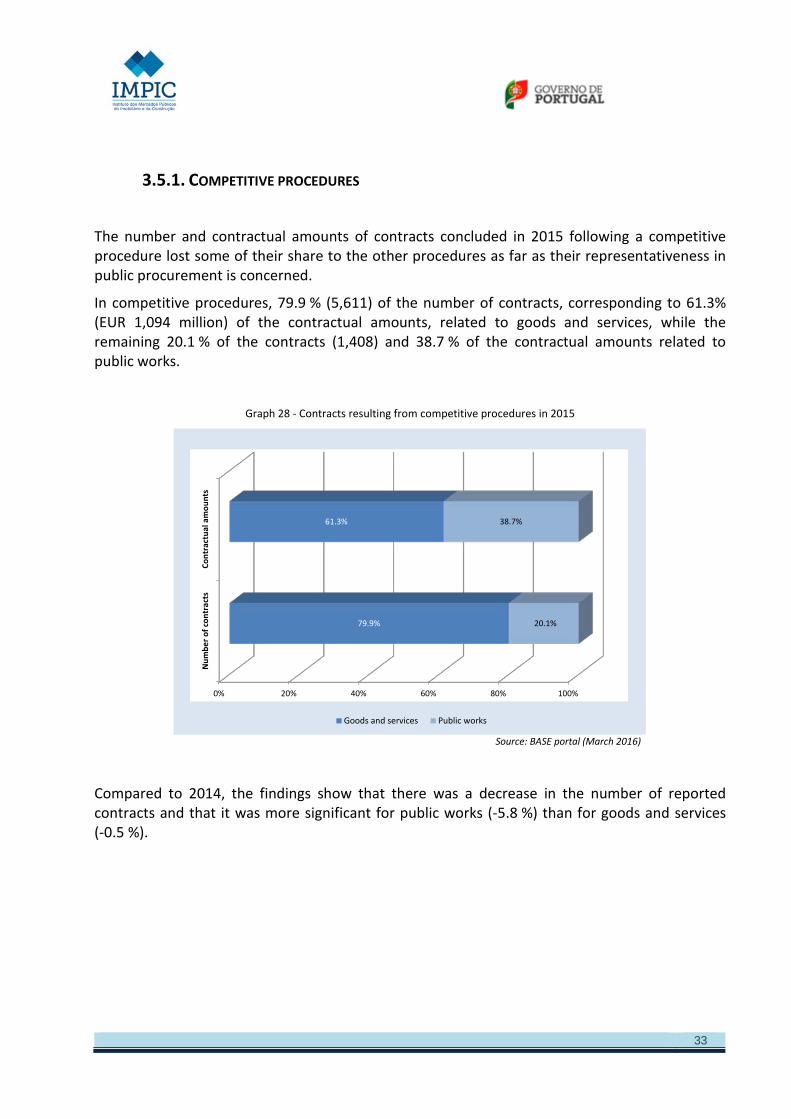
In competitive procedures, 79.9 % (5,611) of the number of contracts, corresponding to 61.3% (EUR 1,094 million) of the contractual amounts, related to goods and services, while the remaining 20.1 % of the contracts (1,408) and 38.7 % of the contractual amounts related to public works.
Graph 28 - Contracts resulting from competitive procedures in 2015
Source: BASE portal (March 2016)
Compared to 2014, the findings show that there was a decrease in the number of reported contracts and that it was more significant for public works (-5.8 %) than for goods and services (-0.5 %).
0% 20% 40% 60% 80% 100%
Num
ber o
f con
trac
tsCo
ntra
ctua
l am
ount
s
79.9%
61.3%
20.1%
38.7%
Goods and services Public works

34
Graph 29 - Number of contracts resulting from competitive procedures: from 2012 to 2015
Source: BASE portal (March 2016)
As far as the contractual amounts are concerned, there was also a decrease in their values (-13.5 %), due to a sharp drop in the case of public works (-43,1 %); in the case of goods and services there was an increase (+28,9 %)
Graph 30 - Amounts of the contracts resulting from competitive procedures: from 2012 to 2015 (EUR million)
Source: BASE portal (March 2016)
0
1,000
2,000
3,000
4,000
5,000
6,000
7,000
8,000
Goods and services Public works Total
3,035
1,384
4,419
3,384
1,454
4,838
5,637
1,494
7,131
5,611
1,408
7,019
2012 2013 2014 2015
0
500
1,000
1,500
2,000
2,500
Goods and services Public works Total
688
1,014
1,702
738
1,005
1,744
848
1,216
2,064
1,094
691
1,785
2012 2013 2014 2015

35
As regards the average value of the contracts concluded in 2015 following a competitive procedure, there was an increase in the contracts for the purchase of goods and services (+29.5 %) and a decrease in the contracts for public works (-39.7 %), when compared to 2014.
Graph 31 - Average value of contracts resulting from competitive procedures, per type of contract: from 2012 to 2015 (EUR
million)
Source: BASE portal (March 2016)
3.5.2. DIRECT AWARDS
Among the 267,722 contracts concluded in 2015 under direct award procedures, 96.1 % (257,159) related to the purchase of goods and services, while the remaining 3.9 % (10,563) related to public works contracts.
As regards the contractual amounts, more thant ⅘ (EUR 1,839 million) concerned the purchase of goods and services, and the remaining EUR 369 million (16.7 %) concerned public works.
0 €
100,000 €
200,000 €
300,000 €
400,000 €
500,000 €
600,000 €
700,000 €
800,000 €
900,000 €
Goods and services Public works
226,785 €
732,774 €
218,154 €
691,401 €
150,491 €
813,821 €
194,910 €
491,025 €
2012 2013 2014 2015

36
Graph 32 – Direct awards in 2015
Source: BASE portal (March 2016)
Compared to 2014, there was a decrease in the number of contracts under direct award for the purchase of goods and services (-28.2%). Conversely, there was an increase in the number of contracts under direct award relating to public works (+11.3 %).
Graph 33 - Number of contracts under direct award: from 2012 to 2015
Source: BASE portal (March 2016)
257,159
1,839
10,563
369
0% 20% 40% 60% 80% 100%
Num
ber o
f co
ntra
cts
Cont
ract
ual a
mou
nts (
EUR
mill
ion)
Goods and services Public works
0
60,000
120,000
180,000
240,000
300,000
360,000
420,000
Goods and services Public works Total
95,253
15,392
110,645120,220
11,570
131,790
358,176
9,493
367,669
257,159
10,563
267,722
2012 2013 2014 2015

37
In terms of contractual amounts, there was a reversal of the trend observed in previous years for both goods and services (+1.0 %) and public works (-0.5 %).
Graph 34 – Value of contracts under direct award: from 2012 to 2015 (EUR million)
Source: BASE portal (March 2016)
Regarding the average contract values, the overall average value per contract in 2015 was EUR 8,248, which corresponds to an increase when compared to 2014 (+38. 3%, i.e. +EUR 2,285 per contract).
Graph 35 – Average value of contracts under direct award: from 2012 to 2015
Source: BASE portal (March 2016)
0
500
1,000
1,500
2,000
2,500
Goods and services Public works Total
1,184
591
1,775
1,531
550
2,081
1,821
371
2,192
1,839
369
2,208
2012 2013 2014 2015
0 €
5,000 €
10,000 €
15,000 €
20,000 €
25,000 €
30,000 €
35,000 €
40,000 €
45,000 €
50,000 €
Goods and services Public works Total
12,430 €
38,381 €
16,040 €12,731 €
47,556 €
15,788 €
5,084 €
39,107 €
5,963 €7,150 €
34,979 €
8,248 €
2012 2013 2014 2015

38
As regards contracts for goods and services, the average value per contract in 2015 was EUR 7,150, corresponding to an increase of +40.6 % over 2014 (+EUR 2,065 per contract). In the case of public works there was a decrease in the average contract value corresponding to -10.6 % (-EUR 4,127 per contract).
In 2015, the number of contracting authorities (other than groups of entities) that reported direct awards was 2,712, i.e. less 722 contracting authorities than in 2014 (-21 %).
Graph 36 - Number of contracting authorities that reported direct awards
Source: BASE portal (March 2016)
These authorities represented 97.6% of the total number of contracting authorities (2,779) that reported contracts concluded in 2015 to the BASE portal. A contrario, this means that 2.4 % (67) of the authorities that reported contracts concluded in 2015 did not report any contract concluded under a direct award procedure.
Graph 37 - Number of contracting authorities that reported contracts concluded in 2015, including (or not) direct awards
Source: BASE portal (March 2016)
2,500
2,700
2,900
3,100
3,300
3,500
3,700
2012 2013 2014 2015
3,321
3,5123,434
2,712
2.4%
97.6%
0% 25% 50% 75% 100%
Reporting authorities that did not report any contract concluded under a direct award procedure Reporting authorities

39
As regards the type of contracts classified according the CPV and concluded under direct award procedures, “Construction work” comes first (15.8 % of the contractual amounts), followed by “Medical equipments, pharmaceuticals and personal care products” (13.3 %), “Business services: law, marketing, consulting, recruitment, printing and security” (7.3% ) “Repair and maintenance services” (4.7 %) and “IT services: consulting, software development, Internet and support” (4.4 %), which together represent more than a half of the total contractual amount under direct awards (45.5 %).
Table 5 – Direct awards in 2015, per CPV
Source: BASE portal (March 2016)
3.5.2.1. SIMPLIFIED DIRECT AWARDS The number of simplified direct awards (contracts for the acquisition or rental of immovable property or the purchase of services with a contractual price of no more than EUR 5,00020) reported to the BASE portal was 184,187 (62.1 % of the total number of contracts), corresponding to an overall contractual amount of EUR 106 million (2.3 % of total amount).
Graph 38 - Simplified direct awards in 2015
Source: BASE portal (March 2016)
20 See Article 128 of the Public Contracts Code.
Number % Amount %45 Construction work 9 599 3.6% 347,920,645 € 15.8%33 Medical equipments, pharmaceuticals and personal care products 16 026 6.0% 294,325,950 € 13.3%
79 Business services: law, marketing, consulting, recruitment, printing and security 5 388 2.0% 160,788,079 € 7.3%
50 Repair and maintenance services 6 917 2.6% 104,202,392 € 4.7%72 IT services: consulting, software development, Internet and support 2 955 1.1% 98,106,549 € 4.4%65 Public utilities 493 0.2% 95,586,478 € 4.3%35 Security services, fire-fighting, police and defense 438 0.2% 85,002,926 € 3.8%71 Architectural, construction, engineering and inspection services 3 365 1.3% 84,418,554 € 3.8%34 Transport equipment and auxiliary products to transportation 1 791 0.7% 77,096,396 € 3.5%90 Sewage-, refuse-, cleaning-, and environmental services 1 815 0.7% 55,166,791 € 2.5%92 Recreational, cultural and sporting services 3 231 1.2% 53,204,912 € 2.4%
215 704 80.6% 752,257,826 € 34.1%
267 722 100% 2,208,077,497.09 € 100%
Others
CPV Code CPV DescriptionNumber of contracts Contractual values
Total
29,065
2,404
83,535
2,102
184,187
106
0% 25% 50% 75% 100%
Num
ber o
f con
trac
tsCo
ntra
ctua
l am
ount
s (E
UR
mill
ion)
Others Direct award Simplified direct award

40
Considering all direct awards, although the number of simplified direct awards accounted for 68.8 % of the total number of contracts, it only represented 4.8 % of the contractual amounts concerned.
Graph 39 – Relative weight of simplified direct awards as compared to the total number of direct awards in 2015
Source: BASE portal (March 2016)
However, the actual weight of simplified direct awards might be underestimated, particularly because only 735 of the contracting authorities (26.4 % of all reporting authorities) did report this type of contracts.
Graph 40 - Number of contracting authorities having reported contracts preceded by simplified direct awards, in 2015
Source: BASE portal (March 2016)
0% 20% 40% 60% 80% 100%
Number ofcontracts
Contractualamounts
31.2%
95.2%
68.8%
4.8%
Direct awards Simplified direct awards
2,7792,712
735
0
500
1,000
1,500
2,000
2,500
3,000
Others Direct award Simplified direct award

41
A higher number of contracting authorities, in particular those belonging directly or indirectly to the central, regional or local administration, will certainly have used this type of procedure.
As the weight of simplified direct awards varied according to the authority concerned, among all the contracting authorities that in 2015 reported at least 50 procedures of this type (341, i.e. 46.4 % of the authorities that reported simplified direct awards), the share of the value of these contracts in the total number of contracts concluded in the same period was 6.5 %.
Most of the 184,187 contracts concluded under simplified direct awards and reported in 2015 concerned “other bodies governed by public law” (37.0 %), followed by “local authorities” (34.2 %) and “national authorities” (21.2 %).
Graph 41 – Breakdown of simplified direct awards per type of authority in 2015
Source: BASE portal (March 2016)
An analysis by type of expenditure shows that contracts under simplified direct awards were mainly related to “Repair and maintenance services” (14.6 %), “Medical equipments, pharmaceuticals and personal care products” (12.1 %), “Business services: law, marketing, consulting, recruitment, printing and security” (7.6 %), “Construction structures and materials; auxiliary products to construction” (6.9 %), “Office and computing machinery, equipment and supplies except furniture and software packages” (4.6 %), “Furniture (incl. office furniture), furnishings, domestic appliances (excl. lighting) and cleaning products” (3.8 %), and “Recreational, cultural and sporting services” (3.6 %), which together accounted for 53.2 % of the overall contractual amount.
21.2%
3.4%
34.2%
37.0%
2.2% 2.0%
Number of contracts
13.5% 2.7%
27.7%51.2%
2.1% 2.8%
Contractual amounts

42
Table 6 – Simplified direct awards in 2015, per CPV
Source: BASE portal (March 2016)
Considering the contract value, contracts with a value equal to or lower than EUR 500 predominated (74.8 % of the number of contracts), although contracts with a value between EUR 2,500 and EUR 5,000 represented the biggest share in terms of contractual amount (37.1 %).
Graph 42 - Breakdown of contracts under simplified direct award, per ranges of contractual amounts
Source: BASE portal (March 2013)
Number % Amount %50 Repair and maintenance services 34,962 12.3% 22,068,948 € 14.6%33 Medical equipments, pharmaceuticals and personal care products 19,247 6.8% 18,313,191 € 12.1%79 Business services: law, marketing, consulting, recruitment, printing and security 12,014 4.2% 11,560,907 € 7.6%
44Construction structures and materials; auxiliary products to construction (except electric apparatus)
28,034 9.9% 10,487,250 € 6.9%
30Office and computing machinery, equipment and supplies except furniture and software packages
17,899 6.3% 6,972,647 € 4.6%
39Furniture (incl. Office furniture), furnishings, domestic appliances (excl. lighting) and cleaning products
14,098 5.0% 5,690,211 € 3.8%
92 Recreational, cultural and sporting services 6,076 2.1% 5,419,078 € 3.6%31 Electrical machinery, apparatus, equipment and consumables; Lighting 10,485 3.7% 4,261,482 € 2.8%34 Transport equipment and auxiliary products to transportation 12,424 4.4% 3,915,236 € 2.6%09 Petroleum products, fuel, electricity and other sources of energy 9,177 3.2% 3,891,260 € 2.6%22 Printed matter and related products 11,013 3.9% 3,858,153 € 2.5%60 Transport services (excl. waste transportation) 7,204 2.5% 3,648,265 € 2.4%71 Architectural, construction, engineering and inspection services 3,802 1.3% 3,554,483 € 2.3%15 Food, beverages, tobacco and related products 16,969 6.0% 3,392,811 € 2.2%80 Education and training services 4,135 1.5% 3,213,548 € 2.1%72 IT services: consulting, software development, Internet and support 2,884 1.0% 3,033,906 € 2.0%
73,215 25.8% 38,138,185 € 25.2%
283,638 100% 151,419,559.81 € 100%
Contractual values
Others
Total
CPV Code CPV DescriptionNumber of contracts
74.8%
10.6%
8.8%
5.6%
0.3%
Number of contracts
17.2%
13.2%
24.4%
37.1%
8.1%
Contractual amounts
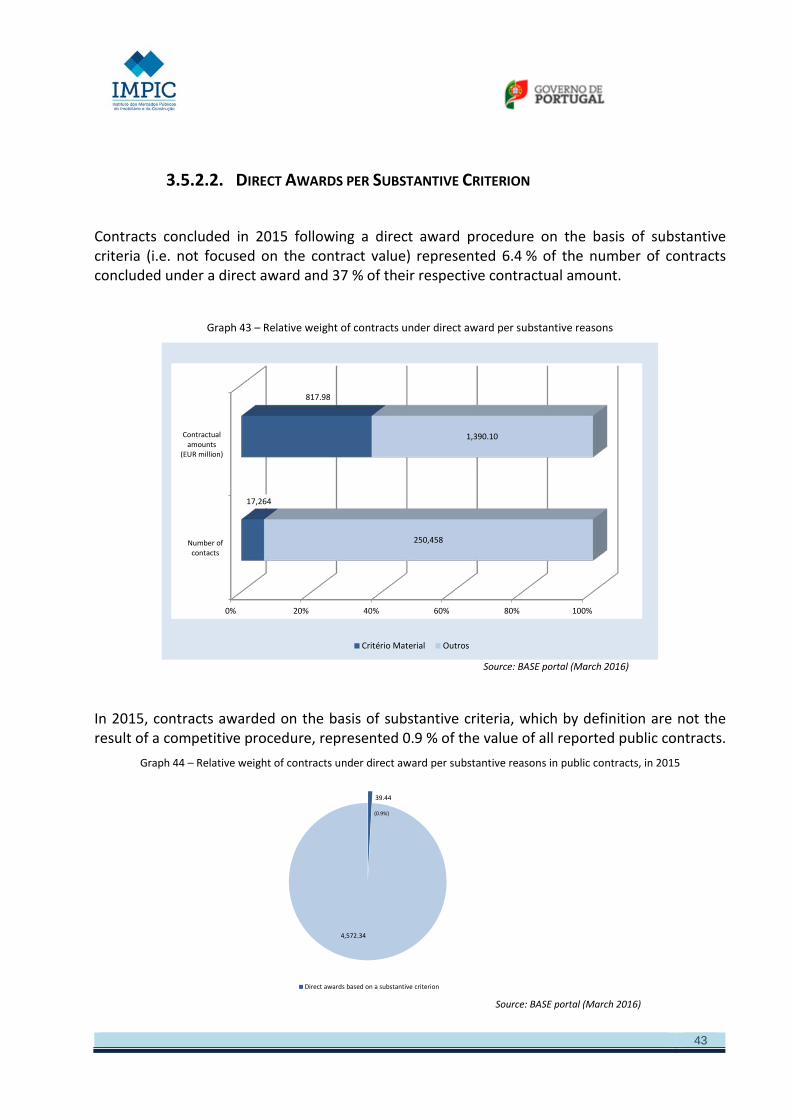
43
3.5.2.2. DIRECT AWARDS PER SUBSTANTIVE CRITERION
Contracts concluded in 2015 following a direct award procedure on the basis of substantive criteria (i.e. not focused on the contract value) represented 6.4 % of the number of contracts concluded under a direct award and 37 % of their respective contractual amount.
Graph 43 – Relative weight of contracts under direct award per substantive reasons
Source: BASE portal (March 2016)
In 2015, contracts awarded on the basis of substantive criteria, which by definition are not the result of a competitive procedure, represented 0.9 % of the value of all reported public contracts.
Graph 44 – Relative weight of contracts under direct award per substantive reasons in public contracts, in 2015
Source: BASE portal (March 2016)
0% 20% 40% 60% 80% 100%
Number ofcontacts
Contractualamounts
(EUR million)
17,264
817.98
250,458
1,390.10
Critério Material Outros
39.44
4,572.34
Direct awards based on a substantive criterion
(0.9%)

44
Compared to 2014, the number of contracts concluded following a direct award procedure on the basis of substantive criteria increased by +18.6%. This variation was due to an increase in the number of contracts related to goods and services (+19.2%, corresponding to +2,762 contracts), as there was a decrease in the number of public works contracts (-30.1 %, corresponding to -50 contracts).
Graph 45 - Changes in the number of contracts concluded on the basis of a substantive criterion in 2015
Source: BASE portal (March 2016)
As regards the contractual amounts involved, there was a general upward trend (+6.2 %, corresponding to +EUR 48 million), both for goods and services (+5.9%, corresponding to +EUR 44 million than in 2014), and for public works (+12.0 %, corresponding to +EUR 3 million).
Graph 46 - Changes in the contractual amount of contracts concluded on the basis of a substantive criterion in 2015
0
2,500
5,000
7,500
10,000
12,500
15,000
17,500
Goods and services Public works Total
10,843
1,413
12,256
15,042
314
15,356
14,386
166
14,552
17,148
116
17,264
Num
ber o
f con
trac
ts
2012 2013 2014 2015
0
100
200
300
400
500
600
700
800
900
Goods and services Public works Total
423
112
535
658
146
804
746
25
770790
28
818
EUR
mill
ion
2012 2013 2014 2015

45
Source: BASE portal (March 2016)
Most contracts for goods and services concluded in 2015 on the basis of a substantive criterion (65.5%) had a contractual price of less than EUR 10,000, while around ⅘ (79.5 %) had a contractual price of less than EUR 25,000.
Graph 47 - Breakdown of the contracts for goods and services concluded on the basis of a substantive criterion in 2015
Source: BASE portal (March 2016)
On the other hand, considering the contractual amounts involved, contracts with a contractual price of more than EUR 150,000 was more significant: 65.2 % of the overall contractual value of contracts concluded on the basis of substantive criteria related to contracts with a contractual price over that amount, but it should be highlighted that the contracts with a contractual price of more than EUR 200,00021 represented 53.8 % of the overall contractual amount.
In the case of public works, if we consider the number of contracts concluded following a direct award procedure on the basis of substantive criteria, the contractual value was less than EUR 25,000 in 43.1 % of the contracts and less than EUR 75,000 in 62.9 %. As regards the contractual amounts, 67.7 % corresponded to contracts with a contractual price of more than EUR 500,000.
21 This roughly corresponds to the Community threshold for the publication of procurement procedures relating to goods and services in the OJEU.
0.1% 0.2% 0.6% 1%4% 9%
16%
21%25%
30%35%
46%
100%
21%
29%
39%
48%
66%
80%
88%
92%94% 96%
97% 99% 100%
0%
10%
20%
30%
40%
50%
60%
70%
80%
90%
100%
[0 ; 500] ]500 ;1,000]
]1,000 ;2,500]
]2,500 ;5,000]
]5,000 ;10,000]
]10,000 ;25,000]
]25,000 ;50,000]
]50,000 ;75,000]
]75,000 ;100,000]
]100,000 ;150,000]
]150,000 ;200,000]
]200,000 ;500,000]
]500,000 ; ∞ [
Montantes Contratuais Número de contratos
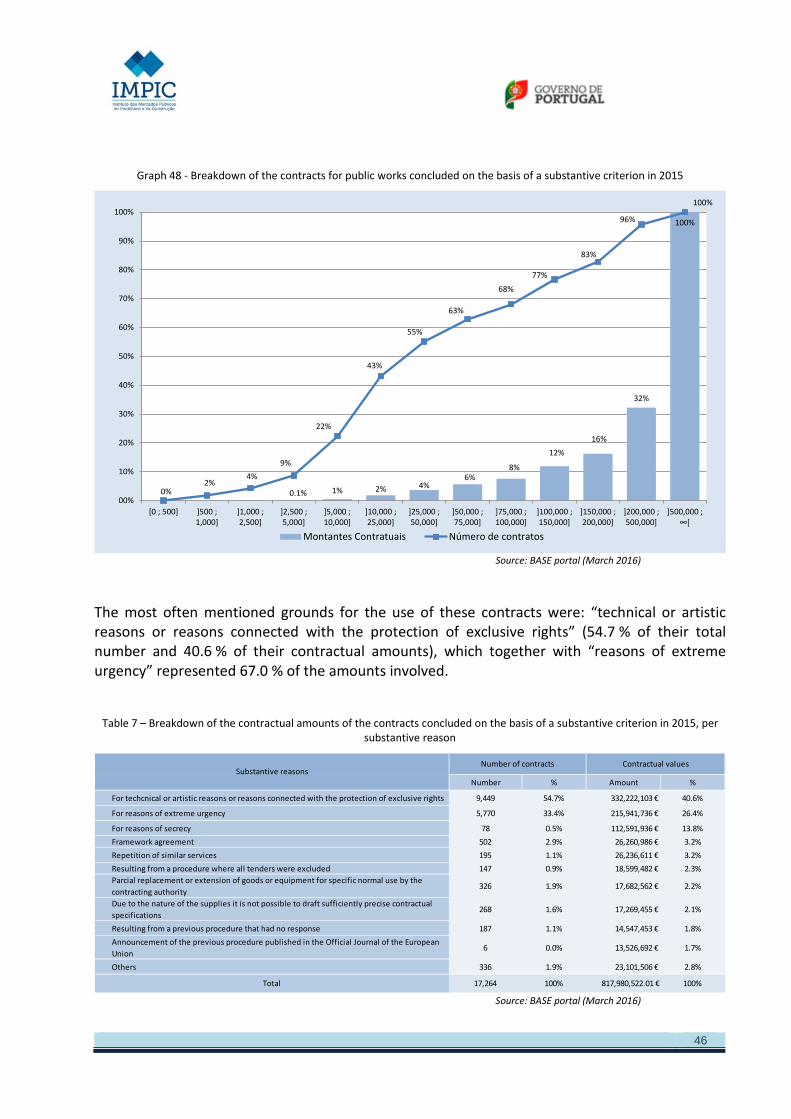
46
Graph 48 - Breakdown of the contracts for public works concluded on the basis of a substantive criterion in 2015
Source: BASE portal (March 2016)
The most often mentioned grounds for the use of these contracts were: “technical or artistic reasons or reasons connected with the protection of exclusive rights” (54.7 % of their total number and 40.6 % of their contractual amounts), which together with “reasons of extreme urgency” represented 67.0 % of the amounts involved.
Table 7 – Breakdown of the contractual amounts of the contracts concluded on the basis of a substantive criterion in 2015, per
substantive reason
Source: BASE portal (March 2016)
0.1% 1% 2% 4%6%
8%
12%16%
32%
100%
0%2%
4%9%
22%
43%
55%
63%
68%
77%
83%
96%
100%
00%
10%
20%
30%
40%
50%
60%
70%
80%
90%
100%
[0 ; 500] ]500 ;1,000]
]1,000 ;2,500]
]2,500 ;5,000]
]5,000 ;10,000]
]10,000 ;25,000]
]25,000 ;50,000]
]50,000 ;75,000]
]75,000 ;100,000]
]100,000 ;150,000]
]150,000 ;200,000]
]200,000 ;500,000]
]500,000 ; ∞[
Montantes Contratuais Número de contratos
Number % Amount %
For techcnical or artistic reasons or reasons connected with the protection of exclusive rights 9,449 54.7% 332,222,103 € 40.6%
For reasons of extreme urgency 5,770 33.4% 215,941,736 € 26.4%
For reasons of secrecy 78 0.5% 112,591,936 € 13.8%Framework agreement 502 2.9% 26,260,986 € 3.2%Repetition of similar services 195 1.1% 26,236,611 € 3.2%Resulting from a procedure where all tenders were excluded 147 0.9% 18,599,482 € 2.3%Parcial replacement or extension of goods or equipment for specific normal use by the contracting authority
326 1.9% 17,682,562 € 2.2%
Due to the nature of the supplies it is not possible to draft sufficiently precise contractual specifications
268 1.6% 17,269,455 € 2.1%
Resulting from a previous procedure that had no response 187 1.1% 14,547,453 € 1.8%Announcement of the previous procedure published in the Official Journal of the European Union
6 0.0% 13,526,692 € 1.7%
Others 336 1.9% 23,101,506 € 2.8%
Total 17,264 100% 817,980,522.01 € 100%
Substantive reasonsNumber of contracts Contractual values

47
Compared to 2014, there was in 2015 an increase in the predominance of “technical or artistic reasons or reasons connected with the protection of exclusive rights” (+1,324 contracts, corresponding however to a decrease of EUR 54 million in contractual values), which represented the majority of this type of procedure (54.7 %), with a variation of -1.1 pp. It should also be noted the increased reference to “reasons of extreme urgency”, which was used in more 2,982 contracts than in 2014 (+EUR 95.5 million), thus representing 33.4 % of the contracts based on substantive reasons.
Graph 49 - Breakdown of the number of contracts concluded on the basis of a substantive criterion: from 2012 to 2015
Source: BASE portal (March 2016)
As far as the type of expenditure is concerned, if we consider the contractual amount and the CPV, substantive reasons were given mainly for the purchase of “Medical equipments, pharmaceuticals and personal care products” (27.9 %) and “Public utilities”, which together corresponded to a 38.9 % “share”.
42,7%
57,3% 55,8% 54,7%
12,1%
20,2%19,2%
33,4%
22,8%
7,9%6,8%
2,9%
2,9%
3,8%6,9%
1,9%
2,7%
3,1% 2,2%
1,6%16,8%
7,7% 9,2%5,5%
0%
10%
20%
30%
40%
50%
60%
70%
80%
90%
100%
2012 2013 2014 2015
Number of contracts
Others Due to the nature of the supplies it is not possible to draft sufficiently precise contractual specifications
Parcial replacement or extension of goods or equipment for specific normal use by the contracting authority Framework agreement
For reasons of extreme urgency For techcnical or artistic reasons or reasons connected with the protection of exclusive rights

48
Graph 50 - Breakdown of the contractual amounts of the contracts concluded on the basis of a substantive criterion in 2015, per CPV: comparing 2013 and 2014
Source: BASE portal (March 2016)
_______________________ * __________________________
25.8%
19.2%
27.9%
9.4%
17.9%
5.6%
5.7%
8.8%
5.4%
3.8%
5.9%
5.8%
2.7%
6.5%
11.0%
52.6%
41.7%
44.2%
0% 10% 20% 30% 40% 50% 60% 70% 80% 90% 100%
2013
2014
2015
Medical equipments, pharmaceuticals and personal care products Repair and maintenance services
IT services: consulting, software development, Internet and support Business services: law, marketing, consulting, recruitment, printing and security
Public utilities Others

49
4. FORECAST FOR CHARGES ARISING FROM CONCLUDED CONTRACTS
Most of the contracts concluded in 2015 were planned to be performed during the same year.
Graph 51 – Forecast for charges arising from contracts concluded in 2015 (EUR million)
Source: BASE portal (March 2016)
In the graph below we can see not only that 59.5 % of the value of the concluded contracts have an expected duration of less than one year, but also that 83.9 % of the value of all these contracts was expected to be executed until the second calendar year, i.e. until the end of 2016.
Graph 52 – Planned implementation rate for contracts concluded in 2015 (EUR million)
Source: BASE portal (March 2016)
59.5%
24.4%
9.4%
4.5% 2.2%
0%
10%
20%
30%
40%
50%
60%
70%
2015 2016 2017 2018 >= 2019
EUR
mill
ion
60%
84%
93%
98%
100%
50%
55%
60%
65%
70%
75%
80%
85%
90%
95%
100%
2015 2016 2017 2018 >= 2019
EUR
mill
ion

50
Since the Public Contracts Code establishes that, as a rule, a public contract should have a maximum duration of 3 years22, it was planned that only 6.7% of the value of contracts concluded in 2015 would go beyond the end of 2017. Therefore, public contacts are basically short-term contracts.
There are, however, some variations as regards the expected charges over time, in particular if we consider the type of expenditure.
Therefore, if we look at the contracts taking into account the CPV codes, we can see that the most significant in terms of contractual amounts were: “33 - Medical equipments, pharmaceuticals and personal care products” (89 %), “45 - Construction work” (71 %), “71 – Architectural, construction, engineering and inspection services” (66 %), “72 - IT services: consulting, software development, Internet and support” (54%), as well as the other codes not included in the “top 10” (55 %). These groups had the highest forecast rates of performance in the same year when the contract was concluded (2015).
On the contrary, since the forecast rate for the performance of contracts in the same year of conclusion (2015) was less significant (lower than 50 %) for codes “65 – Public utilities” (24 %), “09 - Petroleum products, fuel, electricity and other sources of energy” (36 %), “55 - Hotel, restaurant and retail trade services” (37 %) and “90 - Sewage, refuse, cleaning and environmental services” (40%), it was in these headings that multi-annual contracts were more predominant.
22 See Article 48 of the PCC. A duration of more than 3 years must be substantiated.

51
Graph 53 – Forecast of charges arising from contracts concluded in 2015, per CPV
Source: BASE portal (March 2016)
An analysis of the type of procedure underlying the contract leads to the conclusion that contracts under direct award tended to be executed within a shorter period of time: 72% of the value of these contracts was expected to be executed during 2015.
On the contrary, the execution of contracts resulting from competitive procedures was expected to spread over a longer period: 23% of the contracts resulting from a public tender and 19% of the contracts preceded by a restricted procedure were expected to be executed in 2017 and in the following years.
36%
89%
71%
53%
37%
24%
66%
54% 53%
40%
55%
33%
9%
24%
24%
33%
34%
26%
30%29%
28%
25%
20%
0.9% 4%
13%20%
26%
6%
9% 13%
13%
10%
10%
1.1% 0.4%
11% 10%
16%
2%7% 5%
19%
10%
0%
10%
20%
30%
40%
50%
60%
70%
80%
90%
100%
09 - Petroleumproducts, fuel,
electricity and othersources of energy
33 - Medicalequipments,
pharmaceuticals andpersonal care
products
45 - Construction work 50 - Repair andmaintenance services
55 - Hotel, restaurantand retail trade
services
65 - Public utilities 71 - Serviços dearquitectura,construção,
engenharia einspecção
72 - IT services:consulting, software
development, Internetand support
79 - IT services:consulting, software
development, Internetand support
90 - Sewage, refuse,cleaning and
environmentalservices
Others
2015 2016 2017 >=2018

52
Graph 54 – Forecast of charges arising from contracts concluded in 2015, per type of procedure
Source: BASE portal (March 2016)
A similar analysis per type of contract shows that, in the breakdown of charges over the years of performance of the contract, the concentration of the performance in the same year in which the contract was concluded is higher for public works (71.1 %) than for goods and services (55.8 %).
72%
52%
34%
49%
19%
29%
47%
28%
6%
13%
15%
12%
4%
6%
4%
11%
0% 10% 20% 30% 40% 50% 60% 70% 80% 90% 100%
Direct award
Framework agreements
Restricted procedure
Open procedure
2015 2016 2017 >=2018

53
Graph 55 - Forecast of charges arising from contracts concluded in 2015, per type of contract
Source: BASE portal (March 2016)
Considering the multi-annual nature of contracts concluded in 2015 per type of authority, we can conclude that most short-term contracts (until late 2015) tended to be awarded by “Other Contracting Authorities” (74 %), “Other bodies governed by public law” (69%) and “Local Authorities” (62%).
“Regional Authorities” (36 %), “National Authorities” (25 %) and “Entities operating in the special sectors” (20 %) show an opposite trend, as their most significant contracts are to be performed in 2017 and beyond.
56%
71%
60%
24%
24%
24%
11.0%
4.3%
9.4%
8.7%
0.4%
6.7%
0% 10% 20% 30% 40% 50% 60% 70% 80% 90% 100%
Goods and services
Public works
Total
2015 2016 2017 >=2018

54
Graph 56- Forecast of charges arising from contracts concluded in 2015, per type of contracting authority
Source: BASE portal (March 2016)
If we use the contract value as a criterion, we can conclude that, for purchases of goods and services, the increase in the number of multi-annual contracts is in line with the increase in contractual amounts. Among the contracts with a value of less than EUR 5,000, it was expected that 87% of their contractual would be executed in 2015, while in the case of contracts with a value of more than EUR 200,000 only 40% of their value was planned to be executed in the same year.
49% 51%
62%
29%
74%69%
26%29%
25%
35%
21%
20%14%
13%
8%
14%
4%
7%11%
7% 5%
22%
1%4%
0%
10%
20%
30%
40%
50%
60%
70%
80%
90%
100%
National authority Entity operating in a special sector Local authority Regional authority Other contracting authority Other body governed by public law
2015 2016 2017 >=2018

55
Graph 57 – Forecast of charges arising from contracts concluded in 2015, per range of contractual value – goods and services
Source: BASE portal (March 2016)
We can see the same trend in the case of public works, but it is not so clear-cut. In any event, in the contracts with a value of more than EUR 5 million, less than a half of the contractual value was planned to be executed in 2015.
87%
81%76%
73%69%
66%
40%
56%
12%
16%
19%21%
24%25%
29%
24%
1%2%
4% 5% 5%6%
17%
11%
1%1% 2% 2% 3%
15%
9%
0%
10%
20%
30%
40%
50%
60%
70%
80%
90%
100%
[0 ; 5,000] ]5,000 ; 25,000] ]25,000 ; 50,000] ]50,000 ; 75,000] ]75,000 ; 100,000] ]100,000 ; 200,000] ]200,000 ; ∞[ Grand total
2015 2016 2017 >= 2018

56
Graph 58 – Forecast of charges arising from contracts concluded in 2015, per range of contractual value – public works
Source: BASE portal (March 2016)
_______________________ * __________________________
93%
88%
80%
73%
59%
33%
55%
7%
12%
19%
26%
34%
49%
25%
0.1% 1.0% 0.8%
6%
18%
10%
0.9%1%
10%
0%
10%
20%
30%
40%
50%
60%
70%
80%
90%
100%
[0 ; 75,000] ]75,000 ; 150,000] ]150,000 ; 500,000] ]500,000 ; 1,000,000] ]1,000,000 ; 5,000,000] ]5,000,000 ; 25,000,000] Grand total
2015 2016 2017 >= 2018

57
5. THE AVERAGE LENGTH OF PROCUREMENT PROCEDURES
As regards the length of pre-contractual procedures, when considered as the number of days from the beginning of the procedure (publication of the notice or dispatch of the invitation) to the conclusion of the contract, we see that most procedures (68.5 %) took up to 4 days until the corresponding decision was made, which appears to represent greater efficiency in the conduct of the procedures than in 2013 (52 %).
Graph 59- Length of procedures related to contracts concluded in 2015, per range and per type of contract (all contracts except
simplified direct awards)
Source: BASE portal (March 2016)
Nevertheless, the length of procedures varied according to the type of contract: in the case of goods and services 68.7 % of the procedures took less than 4 days (below the level of 72.4% in 2014), while in the case of public works, in the same period, 21.5% of the procedures were completed, a higher performance than in 2014 (5.5 %).
68.7%
77.1%84.5%
92.2%
95.6%
99.2%
100% 100%
21.5%26.2%
32.3%
50.8%
67.7%
93.8%
100% 100%68.5%
76.9%
84.3%
92.1%95.5%
99.2% 100% 100%
0%
10%
20%
30%
40%
50%
60%
70%
80%
90%
100%
Up to 4 days 5 - 14 days 15 - 29 days 30 - 59 days 60 - 89 days 90 - 179 days 180 - 360 days Over 360 days
Goods and services Public works Total

58
The above mentioned figures are affected by the proportion of the number of procedures under direct award in the number of contracts reported, as direct award procedures tend to be swifter than competitive ones. However, the average time limits for the completion of procedures for contracts preceded by an open or restricted tender procedure were similar.
Graph 60- Length of procedures related to contracts concluded in 2015, per time range and per type of contract (contracts
resulting from competitive procedures)
Source: BASE portal (March 2016)
Notwithstanding the foregoing, the results obtained only for competitive procedures continue to show a noticeable degree of efficiency: 83.2% of the contracts for goods and services e 22.2% of the contracts for public works have been concluded within less than 60 days from the beginning of the procedure.
_______________________ * __________________________
65.7%
75.5%82.4%
90.7%
94.3%
99.0%100% 100%
25.0%30.4%
33.9%
53.6%
67.9%
94.6%
100% 100%
63.4%
72.9%
79.6%
88.5%
92.8%
98.8% 100% 100%
0%
10%
20%
30%
40%
50%
60%
70%
80%
90%
100%
Up to 4 days 5 - 14 days 15 - 29 days 30 - 59 days 60 - 89 days 90 - 179 days 180 - 360 days Over 360 days
Goods and services Public works Total

59
6. NUMBER OF COMPETITORS BY PROCEDURE
In order to assess the level of competition in public procurement, we analyzed a sample of 30,95323procedures carried out through electronic platforms, whose contracts were reported to the BASE portal.
The number of tenders received for each procurement procedure averaged 2.5, although there is a difference between contracts for goods and services (2.3) and contracts for public works (3.4).
Graph 61- Average number of tenders per procedure (2015)
Source: BASE portal (March 2016)
As might be expected, the number of competitors per procedure was higher in the case of competitive procedures (5.9 competitors per procedure) than in the other cases (1.7 and 4.5, respectively, in direct awards and framework agreements).
Considering the type of contracts, it is worth noting that competition in the area of public works (3.4 competitors per procedure) is greater than in goods and services (2.3). This difference is particularly obvious in competitive procedures, where the average number of competitors in the case of public works is 10.5, against 4.4 in the case of goods and services.
23 Of which 24,094 negotiated/direct award procedures, 4,008 open procedures and 170 restricted procedures.
0
2
4
6
8
10
12
Competitive procedures Direct award Framework agreement Total
4.4
1.6
4.5
2.3
10.5
2.0
0.0
3.4
5.9
1.7
4.5
2.5
Goods and services Public works Geral

60
Compared to 2014, there was a decrease in the number of competitors per procedure. Overall the number of competitors decreased by 0.1 (from 2.6 to 2.5).
Graph 62- Average number of tenders per procedure: changes from 2012 to 2015
Source: BASE portal (March 2016)
As for the competitive procedures, there was an overall decrease of 0.4 competitors, with a decrease in the average number of competitors in the case of contracts for goods and services (0.5 competitors) and a slight increase in the case of public works contracts (+0.2 competitors).
Graph 63- Average number of tenders per procedure: changes from 2012 to 2015
Source: BASE portal (March 2016)
0
2
4
6
8
10
12
14
Goods and services Public works General
4.13.4 3.12.4
3.32.62.4
3.72.62.3
3.42.5
2012 2013 2014 2015
0
2
4
6
8
10
12
14
Goods and services Public works General
7.4
12.5
9.5
6.0
10.5
7.3
4.9
10.3
6.3
4.4
10.5
5.9
2012 2013 2014 2015

61
As fas as direct award procedures are concerned, the average number of competitors fell from 1.9 to 1.7 per procedure.
Graph 64- Average number of tenders per direct award procedure: changes from 2012 to 2015
Source: BASE portal (March 2016)
A further analysis of competitive procedures shows that in 83.2% of the procedures for the purchase of goods and services and in 97.7% of the procedures concerning public works, at least two proposals were submitted for consideration by the contracting authority.
Graph 65- Number of tenders per procedure: competitive procedures (2014)
Source: BASE portal (March 2016)
0
2
4
6
8
10
12
14
Goods and services Public works General
3.02.1
3.02.0 1.9 2.01.8 2.1 1.9
1.6 2.0 1.7
2012 2013 2014 2015
2.3%2.2%
5.2%
6.1%
6.5%
77.7% 22.3%
Public works
16.8%
17.3%
16.7%14.2%
9.8%
25.3%
24.0%
Goods and services

62
Additionally, more than five tenders were submitted in a significant number of procedures, especially for public works (77.7% of the procedures), although this was also relevant for goods and services (25.3%).
In the case of direct awards for the purchase of goods and services, only one tender was submitted in 64.3% of the procedures.
The weight of contracts resulting from procedures in which only one tender was submitted decreased in line with the contractual value: while 67.8% of the procedures with a basic price of less than EUR 25,000 received only one tender, in the case of procedures with a basic price of more than EUR 50,000 that share was lower (55.0%), corresponding to a decrease of 12.8 pp.
Graph 66- Number of tenders per procedure: direct awards for the purchase of goods and services (2015)
Source: BASE portal (March 2016)
_______________________ * __________________________
0%
10%
20%
30%
40%
50%
60%
70%
80%
90%
100%
Less than EUR 25,000 Between EUR 25,000and EUR 50,000
Over EUR 50,000 Grand total
67.8%59.4%
55.0%64.3%
16.9%
18.6%
16.3%
17.1%
9.4%12.1%
14.7%
10.7%
3.0%4.4%
5.8%3.7%
1.5% 2.5% 3.9% 2.1%1.3% 3.1% 4.5% 2.1%
1 2 3 4 5 >5

63
7. AWARD CRITERIA
7.1. “LOWEST PRICE” VS “MOST ECONOMICALLY ADVANTAGEOUS TENDER”
The Public Contracts Code provides for two distinct award criteria24: i) the most economically advantageous tender for the contracting authority, and ii) the lowest price.
In a sample of 6,28725 competitive procedures, it was found that the award criterion “the lowest price” provided for in Article 74(1)(c) was used in 71.5 % (4,494) of the contracts concluded in 2015. These contracts corresponded to 47.9 % of the contractual amounts.
Graph 67- Award criteria in open procedures (public procedures and restricted procedures)
Source: BASE portal (March 2016)
The trend observed in previous years (except in 2014), towards an increasing use of “the lowest price” as the award criterion, continued in 2015. While the use of this criterion was minority (47.7 %) in 2011, it represented almost ¾ (71.5 %) of the number of contracts concluded in 2015.
24 See Article 74(1) of the Public Contracts Code. 25 Procurement procedures for which it was possible to identify the type of criterion that was used and its weight, where applicable, excluding direct award procedures. This sample represents 89.6% of the competitive procedures launched in 2015 and 90.1% of the corresponding contractual amounts.
1,793
4,494
Number of contracts
839.15
769.99
Contractual amounts (EUR million)

64
Graph 68 – Relative weight of the award criteria per number of contracts: changes from 2011 to 2015
Source: BASE portal (March 2016)
Public procurement in Portugal – 2014
Regarding the contractual amounts involved, from 2014 to 2015, the predominance of contracts concluded on the basis of the “lowest price” when compared with those based on the “most economically advantageous tender” increased by 11.9 pp to 47.9 %.
Graph 69– Relative weight of the award criteria per contractual amounts: changes from 2012 to 2015
Source: BASE portal (March 2016)
Public procurement in Portugal – 2013
00% 10% 20% 30% 40% 50% 60% 70% 80% 90% 100%
2011
2012
2013
2014
2015
48%
54%
71%
68%
71%
52%
46%
29%
32%
29%
Lowest price Most economically advantageous tender
00% 10% 20% 30% 40% 50% 60% 70% 80% 90% 100%
2012
2013
2014
2015
51%
60%
36%
48%
49%
40%
64%
52%
Lowest price Most economically advantageous tender

65
Graph 70– Average value of the contracts preceded by a competitive procedure, per type of award criterion: changes from 2012 to 2015
Source: BASE portal (March 2016)
Public procurement in Portugal – 2013
From 2014 to 2015, there was an increase in the average contractual value for contracts awarded on the basis of the “lowest price” (+9.9 %, now amounting to EUR 171,337), and a decrease in the case of contracts awarded on the basis of the “most economically advantageous tender” (-21.1 %, now amounting to EUR 468,013). The average value of the latter contracts in 2015 was 173% higher than the average value of the former ones (in 2014, that ratio was 281%).
7.2. “MOST ECONOMICALLY ADVANTAGEOUS TENDER”: WEIGHT OF THE PRICE FACTOR
If we consider only those contracts awarded on the basis of the “most economically advantageous tender” (1,793), we can observe the predominance of the price factor (or the like26) in the use of this criterion.
As shown in the graph below, the weight of the price factor, or the like, was higher than 50 % in 56.25 % of the competitive procedures launched in 2015 and included in the processed sample.
26 “The like” means the economic factor (financial burden, rents payable, etc.) of the contract.
0 €
100,000 €
200,000 €
300,000 €
400,000 €
500,000 €
600,000 €
2012 2013 2014 2015
367,523 €
276,831 €
155,883 € 171,337 €
455,897 € 462,505 €
593,141 €
468,013 €
Lowest price Most economically advantageous tender

66
Graph 71- Breakdown of the weight of the “price” factor, or the like, when assessing tenders submitted under open procedures in 2015
Source: BASE portal (March 2016)
Graph 72- Cumulative breakdown of the weight of the price factor, or the like, when assessing tenders: from 2011 to 2015
0%
5%
10%
15%
20%
25%
30%
]0% ; 10%] ]10% ; 20%] ]20% ; 30%] ]30% ; 40%] ]40% ; 50%] ]50% ; 60%] ]60% ; 70%] ]70% ; 80%] ]80% ; 90%] ]90% ; 100%]
0.83% 1.42%
7.71%
16.48%17.31%
27.98%
9.72%
13.87%
2.55% 2.13%
Relative weight ranges for the "price" factor
0%
20%
40%
60%
80%
100%
]0% ; 10%] ]10% ; 20%] ]20% ; 30%] ]30% ; 40%] ]40% ; 50%] ]50% ; 60%] ]60% ; 70%] ]70% ; 80%] ]80% ; 90%] ]90% ; 100%]2011 1% 2% 5% 17% 32% 63% 79% 92% 97% 100%
2012 0% 2% 6% 17% 31% 62% 75% 91% 97% 100%
2013 0% 4% 9% 25% 38% 70% 81% 95% 98% 100%
2014 2% 4% 12% 31% 51% 75% 83% 96% 99% 100%
2015 1% 2% 10% 26% 44% 72% 81% 95% 98% 100%
2011 2012 2013 2014 2015

67
Source: BASE portal (March 2016)
If we add the procedures in which the main factor for assessing the tenders was the “lowest price” to those procedures in which the price factor, while not being the only assessment factor, represented more than a half of the weighting, we find that in 87.5 % of the competitive procedures the price was the most important and dominant weighting factor and was even reinforced when compared to 2014.
Graph 73 – Percentage of the number of contracts in which the price factor, or the like, was largely dominant
Source: BASE portal (March 2016)
7.3. ABNORMALLY LOW PRICES
In the current economic and fiscal context, procurement procedures are particularly price-sensitive. For competitors, the need to maintain their activity in a context of low (if not negative) economic growth made them submit tenders whose value was below the prices they used to apply formerly, to the detriment of their profit margin. For contracting authorities, the fiscal constraints reflected not only in the size of their budgets but also in the administrative barriers (for instance, the available funds) led to a general decrease in the basic prices of procedures, thus “smashing” potential competitors, and favoured the economic factor, by assigning it a greater weight than would be the case in a different context.
80%
82%
84%
86%
88%
90%
2012 2013 2014 2015
85.9%
89.0%
83.8%
87.5%

68
Another way to examine and quantify this issue is to look at the final value of the contract taking into account the basic price27 and the abnormally low price28.
When we consider contracts for goods and services (including those related to public works), regardless of the type of procedure, we see that in 13.8 % of the sample contracts29 the final contractual amounts were close to or even lower than the abnormally low price calculated by reference to the basic price. Their representativeness in terms of overall contractual amounts is slightly lower (6.1%).
Graph 74 - The ratio between the basic price and the contractual price, per contractual price range, of contracts for goods and services (including those related to public works) in 2015
Source: BASE portal (March 2016)
Comparing to the contracts concluded in 2014 and considering the legal criterion used to identify (possible) abnormally low prices, we can see in 2015 an increase of -5 pp (from 19% to 14%) in the number of contracts and -5 pp (from 11% to 6%) in contractual amounts.
Graph 75 - The ratio between the basic price and the contractual price, per contractual price range, of contracts for goods and services (including those related to public works): changes from 2012 to 2015
Source: BASE portal (March 2016)
27 This is an innovative concept in the Portuguese legal framework that corresponds to the… maximum price the contracting authority is willing to pay for the performance of all the services constituting the subject-matter of the contract … (Article 47 of the PCC). 28 According to Article 69(1) of the Public Contracts Code, the total price resulting from a tender shall be considered as abnormally low if it is: (a) lower than or equal to 40 % of the basic price indicated in the specifications, when the procurement procedure is designed for public works contracts; (b) lower than or equal to 50 % of the basic price indicated in the specifications, when the procurement procedure is designed for other contracts. 29 We took into account 30.8% of the contracts, corresponding to 90.1% of the contractual amounts.
13.84%1.84%2.02%
2.98%
5.41%
73.92%
Number of contracts
6.08% 2.57%3.20%
4.53%
10.02%
73.59%
Contractual amounts
<=50
]50-60]
]60-70]
]70-80]
]80-90]
]90-100]
11%
10%
19%
14%
2%
2%
2%
2%
3%
2%
2%
2%
4%
4%
3%
3%
9%
7%
6%
5%
71%
76%
67%
74%
2012
2013
2014
2015
0% 10% 20% 30% 40% 50% 60% 70% 80% 90% 100%
Number of contracts
12%
7%
11%
6%
2%
2%
2%
3%
5%
3%
7%
3%
8%
6%
5%
5%
9%
10%
10%
10%
64%
72%
65%
74%
2012
2013
2014
2015
0% 10% 20% 30% 40% 50% 60% 70% 80% 90% 100%
Contractual amounts
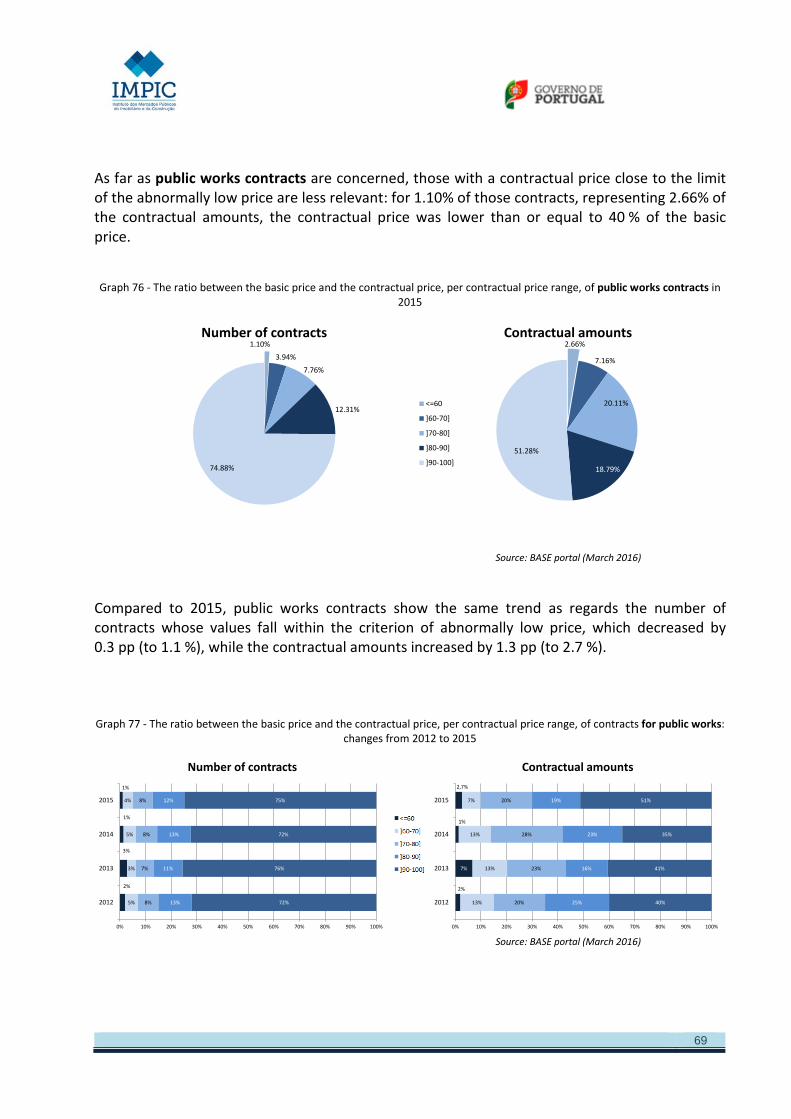
69
As far as public works contracts are concerned, those with a contractual price close to the limit of the abnormally low price are less relevant: for 1.10% of those contracts, representing 2.66% of the contractual amounts, the contractual price was lower than or equal to 40 % of the basic price.
Graph 76 - The ratio between the basic price and the contractual price, per contractual price range, of public works contracts in
2015
Source: BASE portal (March 2016)
Compared to 2015, public works contracts show the same trend as regards the number of contracts whose values fall within the criterion of abnormally low price, which decreased by 0.3 pp (to 1.1 %), while the contractual amounts increased by 1.3 pp (to 2.7 %).
Graph 77 - The ratio between the basic price and the contractual price, per contractual price range, of contracts for public works:
changes from 2012 to 2015
Source: BASE portal (March 2016)
1.10%
3.94%
7.76%
12.31%
74.88%
Number of contracts2.66%
7.16%
20.11%
18.79%
51.28%
Contractual amounts
<=60
]60-70]
]70-80]
]80-90]
]90-100]
2%
3%
1%
1%
5%
3%
5%
4%
8%
7%
8%
8%
13%
11%
13%
12%
72%
76%
72%
75%
2012
2013
2014
2015
0% 10% 20% 30% 40% 50% 60% 70% 80% 90% 100%
Number of contracts
2%
7%
1%
2,7%
13%
13%
13%
7%
20%
23%
28%
20%
25%
16%
23%
19%
40%
41%
35%
51%
2012
2013
2014
2015
0% 10% 20% 30% 40% 50% 60% 70% 80% 90% 100%
Contractual amounts

70
Graph 78 - Deviation between the basic price and the contractual price, per contractual price range, of the contracts for goods and services (including those related to public works) resulting from competitive procedures in 2015
Source: BASE portal (March 2016)
The same happens with public works contracts, where we can see that 4.86 % of the number of contracts and 3.83 % of the contractual amounts concerned were awarded for a lower value than the reference value for the abnormally low price.
Graph 79 - Deviation between the basic price and the contractual price, per contractual price range, of public works contracts resulting from competitive procedures in 2015
Source: BASE portal (March 2016)
_______________________ * __________________________
44.53%
5.43%5.09%
7.46%
10.35%
27.13%
Number of contracts
9.47%5.09%
6.80%
8.63%
21.11%
48.89%
Contractual amounts
<=50
]50-60]
]60-70]
]70-80]
]80-90]
]90-100]
4.86%
18.79%
29.07%26.29%
21.00%
Number of contracts3.83%
10.05%
28.31%
21.54%
36.27%
Contractual amounts
<=60
]60-70]
]70-80]
]80-90]
]90-100]

71
8. CONTRACTS CLASSIFIED ACCORDING TO THE “COMMON PROCUREMENT VOCABULARY“ (CPV)
A short analysis on the basis of the CPV classification shows that public works predominate over the remaining expenditure, mainly because of “Construction work”, which represents 22.5 % of the overall contractual value.
Table 8 – Breakdown of contracts per CPV
Source: BASE portal (March 2016)
A comparison with 2014 figures shows distinct variations. Table 9 – Breakdown of contracts per CPV: comparing 2014 and 2015
Source: Public procurement in Portugal – 2013
On the one hand, we see negative variations in the areas of “Hotel, restaurant and retail trade services” (-41.2 %), “Repair and maintenance services” (-33.9 %) and “Construction works” (-33.5 %). On the other hand, we see significant increases in the areas of “Transport services (excl. Waste transport)” (+212.4 %), “Public utilities” (+28.9 %) and “Petroleum products, fuel, electricity and other sources of energy” (+21.9 %).
Number % Amount %45 Construction work 11,151 3.8% 1,038,995,850 € 22.5%33 Medical equipments, pharmaceuticals and personal care products 20,936 7.1% 536,437,931 € 11.6%60 Transport services (excl. waste transportation) 1,621 0.5% 261,488,701 € 5.7%
79 Business services: law, marketing, consulting, recruitment, printing and security 5,757 1.9% 260,767,288 € 5.7%
09 Petroleum products, fuel, electricity and other sources of energy 1,267 0.4% 237,949,859 € 5.2%90 Sewage-, refuse-, cleaning-, and environmental services 2,209 0.7% 189,031,325 € 4.1%50 Repair and maintenance services 7,206 2.4% 187,461,972 € 4.1%65 Public utilities 560 0.2% 156,560,602 € 3.4%55 Hotel, restaurant and retail trade services 1,164 0.4% 153,716,153 € 3.3%72 IT services: consulting, software development, Internet and support 3,343 1.1% 143,160,862 € 3.1%
241,573 81.4% 1,446,209,094 € 31.4%
296,787 100% 4,611,779,636.37 € 100%Total
CPV Code CPV DescriptionNumber of contracts Contractual amounts
Others
Amount % Amount % Amount ∆ %Construction work 1,561,442,383 € 31.6% 1,038,995,850 € 22.5% - 522,446,533 € -33.5%Medical equipments, pharmaceuticals and personal care products 555,171,615 € 11.2% 536,437,931 € 11.6% - 18,733,683 € -3.4%Transport services (excl. waste transportation) 83,707,635 € 1.7% 261,488,701 € 5.7% 177,781,065 € 212.4%Business services: law, marketing, consulting, recruitment, printing and security
256,499,505 € 5.2% 260,767,288 € 5.7% 4,267,783 € 1.7%
Petroleum products, fuel, electricity and other sources of energy 195,173,780 € 4.0% 237,949,859 € 5.2% 42,776,078 € 21.9%Sewage-, refuse-, cleaning-, and environmental services 174,660,710 € 3.5% 189,031,325 € 4.1% 14,370,615 € 8.2%Repair and maintenance services 283,428,118 € 5.7% 187,461,972 € 4.1% - 95,966,146 € -33.9%Public utilities 121,431,888 € 2.5% 156,560,602 € 3.4% 35,128,714 € 28.9%Hotel, restaurant and retail trade services 261,353,129 € 5.3% 153,716,153 € 3.3% - 107,636,976 € -41.2%IT services: consulting, software development, Internet and support 182,940,164 € 3.7% 143,160,862 € 3.1% - 39,779,302 € -21.7%
Others 1,264,551,047 € 25.6% 1,446,209,094 € 31.4% 181,658,047 € 14.4%
4,940,359,974 € 100% 4,611,779,636 € 100% -328,580,337 € -7%
2014 2015 VariationDescrição CPV

72
As a result of these variations, there has been a change in the structure of expenditure, where the move of “Transport services (excl. Waste transport)” into third place and the drop of “Repair and maintenance services” from third to seventh should be highlighted.

73
9. STAKEHOLDERS IN PUBLIC PROCUREMENT PROCEDURES
9.1. CONTRACTING AUTHORITIES
9.1.1. THE CONTRACTING AUTHORITIES UNIVERSE
In 2015, the number of authorities that reported contracts to the BASE portal was 2,922. This represents a decrease of 740 (-20.2 %) and 790 (-21. 3%) in the number of contracting authorities, respectively over 2014 and 2013.
Graph 80 – Number of contracting authorities having reported contracts: changes from 2011 to 2015
Source: BASE portal (March 2016)
A breakdown per type of contracting authorities shows that the “Regional and Local Authorities” group is the largest one (916), followed by “Other bodies governed by public law” (758), “National Authorities” (700), “Other contracting authorities” (477) and “Entities operating in the special sectors” (71).
0
500
1,000
1,500
2,000
2,500
3,000
3,500
4,000
2011 2012 2013 2014 2015
3,0273,383
3,712 3,662
2,922

74
Graph 81 - Number of contracting authorities per type of authority (2015)
Source: BASE portal (March 2016)
Compared to 2014, there was a decrease in the number of entities in all segments, with a stronger negative variation in the “Other contracting authorities” group.
Graph 82- Number of contracting authorities per type of authority: changes from 2012 to 2015
Source: BASE portal (March 2016)
Public procurement in Portugal – 2014
700
916
758
477
71
National authority
Regional and local authority
Other body governed by public law
Other contracting authority
Entity operating in a special sector
0
200
400
600
800
1,000
1,200
National authority Regional and localauthority
Other body governed bypublic law
Other contractingauthority
Entity operating in aspecial sector
734
856
528
1,187
78
826
972
784
1,047
83
781
951 949898
83
700
916
758
477
71
2012 2013 2014 2015

75
The decrease in the number of reporting authorities confirms that continues to appear to fall short of the entire group of contracting authorities covered by the Public Contracts Code and hence required to report their procedures and contracts to the BASE portal.
Since competitive procedures must be carried out through electronic platforms, which ensure the communication with the portal, this under-representation of reporting authorities tends to be linked to the fact that some contracting authorities have only used the direct award procedure.
Furthermore, 23.2 % of the contracting authorities (677) only reported 1 contract under direct award.
Graph 83 - Number of contracting authorities that reported only one contract or zero contracts under direct award, but did
report other contracts
Source: BASE portal (March 2016)
This situation casts ever more doubts on whether all contracting authorities are complying with the provisions of the Public Contracts Code according to which reporting a contract to the BASE portal …, whether or not written down, is a pre-requisite to ensure its effectiveness, namely for payment purposes30.
This situation was common to all groups of contracting authorities. Although we can understand it in the case of “Other contracting authorities” (38.2%) and “Entities operating in special sectors” (12.7 %), it is something that would not be expected for “Local authorities” (25.8 %), “Regional authorities” (16.7 %), “National authorities” (15.9 %) and “Other bodies governed by public law” (19.3 %). 30 Article 127(3) of the Public Contracts Code.
2,245
677
Contracting authorities Contracting authorities having reported only 1 direct award
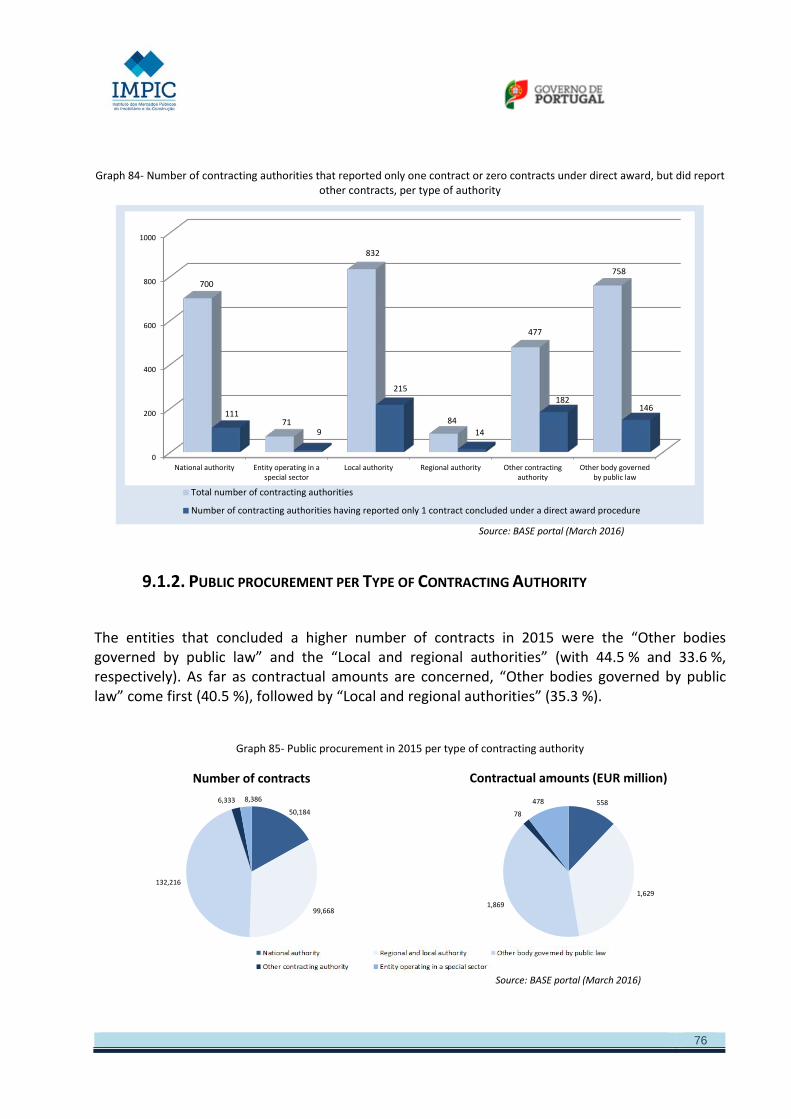
76
Graph 84- Number of contracting authorities that reported only one contract or zero contracts under direct award, but did report other contracts, per type of authority
Source: BASE portal (March 2016)
9.1.2. PUBLIC PROCUREMENT PER TYPE OF CONTRACTING AUTHORITY
The entities that concluded a higher number of contracts in 2015 were the “Other bodies governed by public law” and the “Local and regional authorities” (with 44.5 % and 33.6 %, respectively). As far as contractual amounts are concerned, “Other bodies governed by public law” come first (40.5 %), followed by “Local and regional authorities” (35.3 %).
Graph 85- Public procurement in 2015 per type of contracting authority
Source: BASE portal (March 2016)
0
200
400
600
800
1000
National authority Entity operating in aspecial sector
Local authority Regional authority Other contractingauthority
Other body governedby public law
700
71
832
84
477
758
111
9
215
14
182146
Total number of contracting authorities
Number of contracting authorities having reported only 1 contract concluded under a direct award procedure
50,184
99,668
132,216
6,333 8,386
Number of contracts
558
1,6291,869
78
478
Contractual amounts (EUR million)

77
Compared to 2014, the greatest variation in the number of contracts was in the “Entities operating in a special sector” (-43.4 %, corresponding to -6,435 contracts), while the “Local and Regional Entities” are first as regards the contractual amounts (+21.2 %, representing + EUR 284 million).
Graph 86- Public procurement per type of authority: changes from 2012 to 2015
Source: BASE portal (March 2016)
When we try to establish a profile per type of authority, we find some differences, namely that “Other bodies governed by public law” stand out if we consider the average number of contracts per contracting authority (174 contracts, well above the general average of 102 contracts per contracting authority). As regards the average contractual amounts, “Entities operating in a special sector” stand out as they reported contracts with an average value of EUR 57,017, well above the general average (EUR 15,539).
Graph 87 – Procurement profile in 2015 per type of authority
Source: BASE portal (March 2016)
The top 10 (ten) contracting authorities as regards the contractual amounts correspond to EUR 996 million, i.e. 21.6 % of the total value of contracts reported to the BASE portal. This figure is well above the value reached in 2014, when the top 10 (ten) contracting authorities as regards the procurement volume represented 25.3 % of the value reached in that same year.
0
20.000
40.000
60.000
80.000
100.000
120.000
140.000
160.000
Nationalauthority
Regional andlocal authority
Other bodygoverned by
public law
Othercontractingauthority
Entity operatingin a special
sector2012 15.375 44.586 42.092 7.921 5.0902013 22.209 46.021 78.975 6.763 3.8072014 64.899 155.275 155.274 9.109 14.8212015 50.184 99.668 132.216 6.333 8.386
Number of contracts
0
200
400
600
800
1.000
1.200
1.400
1.600
1.800
2.000
National authority Regional and localauthority
Other bodygoverned by
public law
Other contractingauthority
Entity operating ina special sector
2012 333 1.360 874 369 5412013 481 1.268 1.705 187 5132014 589 1.344 1.989 221 7972015 558 1.629 1.869 78 478
Contractual amounts (EUR million)
0
20
40
60
80
100
120
140
160
180
Nationalauthority
Local authority Regionalauthority
Other bodygoverned by
public law
Other contractingauthority
Entity operatingin a special sector
72
93
110
174
13
118
Average number of contracts
102
- €
10000.0 €
20000.0 €
30000.0 €
40000.0 €
50000.0 €
60000.0 €
Nationalauthority
Local authority Regionalauthority
Other bodygoverned by
public law
Other contractingauthority
Entity operatingin a special sector
11,113 €
43,356 €
14,038 € 14,137 € 12,309 €
57,017 €
Average value of contracts
15,539€
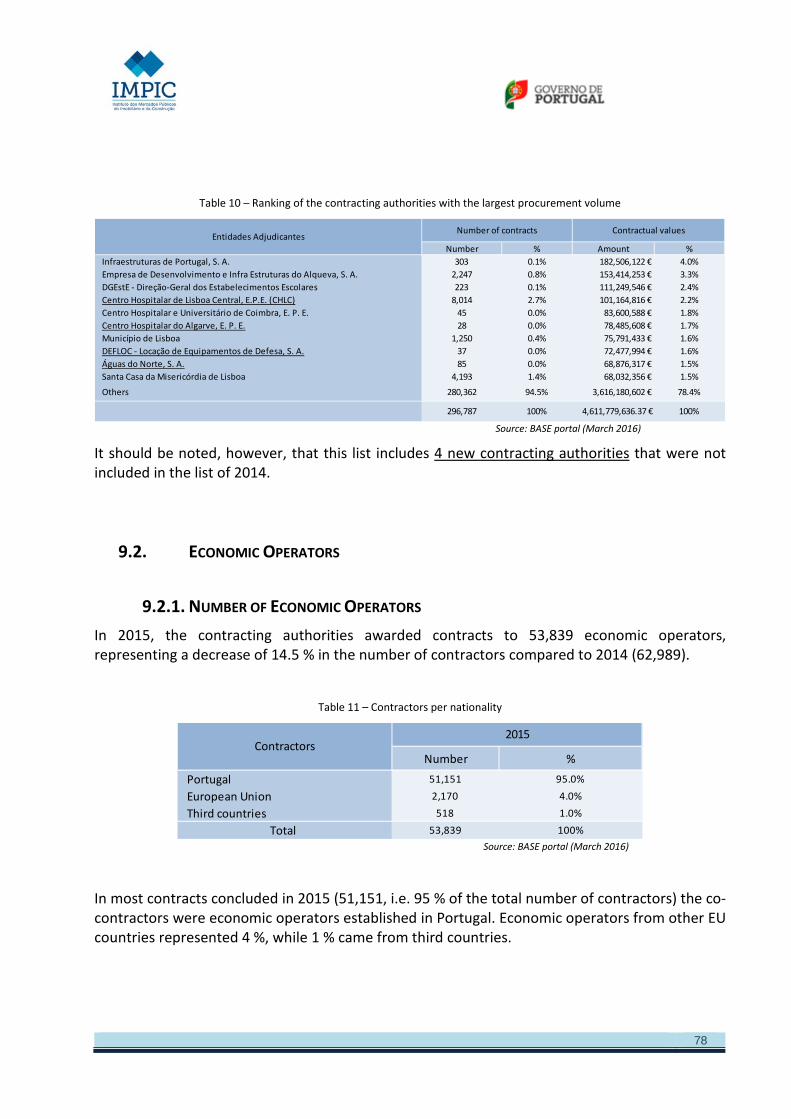
78
Table 10 – Ranking of the contracting authorities with the largest procurement volume
Source: BASE portal (March 2016)
It should be noted, however, that this list includes 4 new contracting authorities that were not included in the list of 2014.
9.2. ECONOMIC OPERATORS
9.2.1. NUMBER OF ECONOMIC OPERATORS In 2015, the contracting authorities awarded contracts to 53,839 economic operators, representing a decrease of 14.5 % in the number of contractors compared to 2014 (62,989).
Table 11 – Contractors per nationality
Source: BASE portal (March 2016)
In most contracts concluded in 2015 (51,151, i.e. 95 % of the total number of contractors) the co-contractors were economic operators established in Portugal. Economic operators from other EU countries represented 4 %, while 1 % came from third countries.
Number % Amount %Infraestruturas de Portugal, S. A. 303 0.1% 182,506,122 € 4.0%Empresa de Desenvolvimento e Infra Estruturas do Alqueva, S. A. 2,247 0.8% 153,414,253 € 3.3%DGEstE - Direção-Geral dos Estabelecimentos Escolares 223 0.1% 111,249,546 € 2.4%Centro Hospitalar de Lisboa Central, E.P.E. (CHLC) 8,014 2.7% 101,164,816 € 2.2%Centro Hospitalar e Universitário de Coimbra, E. P. E. 45 0.0% 83,600,588 € 1.8%Centro Hospitalar do Algarve, E. P. E. 28 0.0% 78,485,608 € 1.7%Município de Lisboa 1,250 0.4% 75,791,433 € 1.6%DEFLOC - Locação de Equipamentos de Defesa, S. A. 37 0.0% 72,477,994 € 1.6%Águas do Norte, S. A. 85 0.0% 68,876,317 € 1.5%Santa Casa da Misericórdia de Lisboa 4,193 1.4% 68,032,356 € 1.5%
Others 280,362 94.5% 3,616,180,602 € 78.4%
296,787 100% 4,611,779,636.37 € 100%
Entidades AdjudicantesNumber of contracts Contractual values
Number %
Portugal 51,151 95.0%
European Union 2,170 4.0%
Third countries 518 1.0%
Total 53,839 100%
Contractors2015

79
Graph 88 – Contractors per nationality
Source: BASE portal (March 2016)
The trend was reversed as far as the number of national economic operators is concerned, with 9,389 less companies (-15.5 %) with which contracts were concluded, while the number of operators from the European area (+111 operators, i.e. +5.4 %) saw an increase. We can also see an increase in the number of third country companies (+126, i.e. +32.1 %).
9.2.2. CHARACTERIZATION OF NATIONAL ECONOMIC OPERATORS
Based on a sample of 17,510 companies (32.5 % of the companies with which public contracts were concluded), representing 63.3 % of the number of contracts and 74.6 % of the contractual value, it was possible to characterize31 the business sector of the economic operators with which at least one contract was concluded in 2015.
Most economic operators to which public contracts were awarded in 2015 were micro enterprises32 (57.9 %). However, they only represented 31.1 % of all contracts concluded and only 11.9 % of the contractual amounts.
On the other hand, small and medium-sized enterprises (SMEs)33, representing 39.4 % of the economic operators, accounted for nearly half of the contracts (49.9 %), corresponding to nearly ½ of the contractual amounts (47.5 %).
31 Characterization according to the criteria laid down in Decree-Law No 372/2007 of 6 November 2007. 32 Companies with less than 10 employees and a turnover of EUR 2 million. 33 Including small enterprises (companies with less than 50 employees and a turnover of less than EUR 10 million) and medium-sized enterprises (companies with less than 250 employees and a turnover of less than EUR 50 million).
93.5%
95.6%
96.1%
95.0%
6.0%
3.7%
3.3%
4.0%
0.5%
0.7%
0.6%
1.0%
90% 91% 92% 93% 94% 95% 96% 97% 98% 99% 100%
2012
2013
2014
2015
Portugal European Union Third countries

80
Lastly, large enterprises34 represented just 2.7 % of all economic operators, having concluded 18.9 % of the contracts, which correspond to more than ⅖ (40.6 %) of the contractual amounts.
Graph 89 – Contractors representativeness, per company size
Source: BASE portal (March 2016)
If we look only at contracts for goods and services, we see that SMEs have a more significant weight, representing 49.2 % of the number of contracts and 38.4 % of the contractual amounts. Large enterprises obtained 19.8 % of the contracts, which together represented 50.4 % of the contractual amounts.
Graph 90 – Contractors representativeness per company size – Goods and services
34 Companies with at least 250 employees and a turnover of EUR 50 million.
03%
19%
41%
08%
18%
23%
31%
32%
25%
58%
31%
12%
0%
20%
40%
60%
80%
100%
Number of companies Number of contracts Contractual values
Large Medium-sized Small Micro
47.5%
49.9%
39.4%

81
Source: BASE portal (March 2016)
As regards public procurement related to public works, SMEs accounted for a significant share (61.8 % of the contracts and 76.4 % of the contractual amounts), and surpassed even large companies in the amounts involved (9.5 % of the contractual amounts, corresponding to 3.8 % of the number of contracts).
Graph 91 – Contractors representativeness per company size – Public works
Source: BASE portal (March 2016)
20%
50%18%
19%
32%
20%
31%
11%
0%
20%
40%
60%
80%
100%
Number of contracts Contractual values
Large Medium-sized Small Micro
49.2%
38.4%
4%10%
18%
37%
44%
39%
34%
14%
0%
20%
40%
60%
80%
100%
Number of contracts Contractual values
Large Medium-sized Small Micro
76.4%
61.8%

82
If we look at the structure of the concluded contracts taking into account the company size and the classification according to the Common Procurement Vocabulary (CPV), but only considering the categories (CPV division) with a share of more than 5 % in some of the size segments, we can see a few differences.
First of all, we see that diversity increases when the size of the company decreases. In fact, the contracts covered by the 10 codes of the CPV35 represented together 73.2 % of the contracts concluded with large enterprises, 74.0 % with medium-sized enterprises, 65.7 % with small enterprises and 56.0 % with micro-enterprises. Therefore, as the company size increases, the contracts tend to focus on certain types of purchases.
Graph 92 – Pubic contracts structure per company size and per CPV
Source: BASE portal (March 2016)
Although the category “Construction work” concentrates the highest number of contracts regardless of the company size, its weight is however more significant for medium-sized enterprises (37.8 %) and small enterprises (37.4 %), than for the others (5.5 % and 26.8 %, respectively for large and micro-enterprises). Linked to this category of contracts, category
35 09 - Petroleum products, fuel, electricity and other sources of energy; 33 - Medical equipments, pharmaceuticals and personal care products; 45 – Construction work; 50 - Repair and maintenance services; 55 - Hotel, restaurant and retail trade services; 65 – Public utilities; 71 - Architectural, construction, engineering and inspection services; 72 – IT services: consulting, software development, Internet and support; 79 - Business services: law, marketing, consulting, recruitment, printing and security; 90 - Sewage, refuse, cleaning and environmental services
13.7%
0.6%
0.4%
0.7%
5.9%
16.0%
17.2%
8.1%
4.8%
13.0%
5.5%
37.8%
37.4%
26.8%
23.3%
2.5%
3.4%
9.6%
5.2%
4.8%
7.4%
1.6%
0.2%
0.5%
3.5%
10.3%
0.2%
0.2%
0.5%
4.3%
1.2%
1.8%
2.7%
6.5%
2.3%
3.3%
4.0%
2.7%
3.3%
3.3%
8.1%
3.2%
2.6%
6.1%
5.4%
5.3%
4.2%
1.9%
1.7%
3.8%
26.8%
26.0%
34.3%
44.0%
30.5%
0% 20% 40% 60% 80% 100%
Large
Medium-sized
Small
Micro
General
Petroleum products, fuel, electricity and other sources of energy Medical equipments, pharmaceuticals and personal care products Construction work Repair and maintenance services
Hotel, restaurant and retail trade services Public utilities Architectural, construction, engineering and inspection services IT services: consulting, software development, Internet and support
Business services: law, marketing, consulting, recruitment, printing and security Sewage-, refuse-, cleaning-, and environmental services Others

83
“Architectural, construction, engineering and inspection services” is relevant for the micro–enterprises segment (6.5%), but less so for the remaining ones.
Category “Medical equipments, pharmaceuticals and personal care products” is quite relevant in terms of contracts for all company size-types, with the exception of micro-enterprises where it represented only 4.8%.
Table 12 – Public contracts structure, per company size and per CPV
Source: BASE portal (March 2016)
Some contract categories are relevant as regards the contract structure of large enterprises, even though this can be considered as less relevant for the other segments; that would apply to “Petroleum products, fuel, electricity and other sources of energy”, “Hotel, restaurant and retail trade services”, and “Public utilities”.
9.2.3. PUBLIC CONTRACTS SHARE IN ECONOMIC OPERATORS TURNOVER
Seeking to analyze the possible impact of pubic contracts on economic operators, in a sample of 191,211 contractual relations between contracting authorities and economic operators36, the share of the contracts concluded in 2015 with a given contracting authority represented less than 20 % of the economic operator’s turnover in 97.8 % of the cases. 36 i.e. 191,211 contracts concluded between a given contracting authority and a specific economic operator, regardless of the number of contracts they might have concluded.
Grande Média Pequena Micro Geral09 Petroleum products, fuel, electricity and other sources of energy 13.7% 0.6% 0.4% 0.7% 5.9%33 Medical equipments, pharmaceuticals and personal care products 16.0% 17.2% 8.1% 4.8% 13.0%45 Construction work 5.5% 37.8% 37.4% 26.8% 23.3%50 Repair and maintenance services 2.5% 3.4% 9.6% 5.2% 4.8%55 Hotel, restaurant and retail trade services 7.4% 1.6% 0.2% 0.5% 3.5%65 Public utilities 10.3% 0.2% 0.2% 0.5% 4.3%71 Architectural, construction, engineering and inspection services 1.2% 1.8% 2.7% 6.5% 2.3%72 IT services: consulting, software development, Internet and support 3.3% 4.0% 2.7% 3.3% 3.3%79 Business services: law, marketing, consulting, recruitment, printing and security 8.1% 3.2% 2.6% 6.1% 5.4%90 Sewage-, refuse-, cleaning-, and environmental services 5.3% 4.2% 1.9% 1.7% 3.8%- Others 26.8% 26.0% 34.3% 44.0% 30.5%
Código CPV

84
Graph 93– Number of situations in which the weight of the contracts concluded with a given contracting authority in 2015
represented more than 20 % of the economic operator’s turnover in 2014
Source: BASE portal (March 2016)
Considering the other situations, it is worth noting that for 2015 it was possible to identify 773 cases where the value of the contracts awarded by contracting authorities was higher than the contractors’ turnover. Most of these companies (77.1 %) were micro-enterprises.
Graph 94- Classification per type of the companies whose turnover was lower than the value of the public contracts they
concluded (2015)
Source: BASE portal (March 2016)
9.2.4. ORIGIN OF NON-DOMESTIC ECONOMIC OPERATORS
2,051
704
400237
773
0
200
400
600
800
1000
1200
1400
1600
1800
2000
2200
]20% - 40%] ]40% - 60%] ]60% - 80%] ]80% - 100%] ]100% - ∞ [
0.1% 0.3%
77%
5%
18%
Large
Medium-sized
Micro
Small
Not characterized

85
Graph 95- Number of contractors, per country (2015)
Source: BASE portal (March 2016)
Considering the origin of economic operators, the country with the largest number of enterprises with which at least one contract was concluded was Spain (772), followed by the United Kingdom (343), Germany (297) and the United States (225). It is also worth noting that contracts were concluded with 207 enterprises from France.
Among the third-country contractors (518), 36 are from member countries of the Community of Portuguese-Speaking Countries (CPLP – Comunidade dos Países de Língua Portuguesa):
Graph 96 – Contractors from the Community of Portuguese-Speaking Countries
Source: BASE portal (March 2016)
The top 10 (ten) economic operators as regards the number of contracts concluded in 2015 represented 16.3 % of the overall amount of contracts reported to the BASE portal during that same year (EUR 4,611 million). Among those enterprises, 6 (seven) were not listed in the 2014 ranking.
772
343
297225
207
844Spain
United Kingdom
Germany
United States of America
France
Others
17
7
4
3
3
2
Brazil
Angola
Cape Verde
Mozambique
São Tomé e Príncipe
Guinea Bissau

86
Table 13 – Ranking of contractors with the largest procurement volume
Source: BASE portal (March 2016)
9.3. ELECTRONIC PLATFORMS
9.3.1. CONTRACTS CONCLUDED IN 2015 WITH ELECTRONIC PLATFORMS FOR THE PURCHASE OF ELECTRONIC PROCUREMENT PLATFORM SERVICES
Public procurement electronic platforms are a key tool in public purchasing, as competitive procedures are mandatorily carried out through them. As we saw37, in 2015 they were responsible for carrying out 14.3 % of the procedures launched in the same year, corresponding to 67.4 % of the underlying basic price.
Looking at the contracts concluded in 2015 for the purchase of services relating to the conduct of competitive procedures through a certified electronic platform, we can see four suppliers with a market share of more than 20 % – Construlink (Gatewit), Saphety Level, S.A. (saphetygov), ANO - Sistemas de Informática e Serviços, Lda e Vortal - Comércio Eletrónico, Consultadoria e Multimédia, S.A. (vortalGOV) – accounting for 85,9 % of the total number of new contracts.
37 See item 2.1.
Number % Amount %SATA 92 0.0% 150,015,135 € 3.3%Edp 953 0.3% 146,357,185 € 3.2%GILEAD SCIENCES LDA 403 0.1% 100,835,140 € 2.2%Imprensa Nacional - Casa da Moeda, S.A. 1,032 0.3% 84,992,411 € 1.8%PETRÓLEOS DE PORTUGAL - Petrogal , S.A. 612 0.2% 83,725,495 € 1.8%Everjets Aviação Executiva, SA 2 0.0% 48,147,120 € 1.0%GERTAL - Companhia Geral de Restaurantes e Alimentação Lda. 136 0.0% 37,073,030 € 0.8%ArcelorMittal Espanã SA 3 0.0% 36,515,000 € 0.8%ITEN SOLUTIONS 457 0.2% 34,346,340 € 0.7%Galp Power, S.A. 160 0.1% 30,376,100 € 0.7%Others 292,937 98.7% 3,859,396,680 83.7%
296,787 100% 4,611,779,636.37 € 100%
ContractorsNumber of contracts Contractual values

87
Graph 97- Breakdown of the contracts concluded with electronic platforms for the conduct of procedures, per certified entity
Source: BASE portal (March 2016)
Comparing to the previous years, it appears that the market of public procurement electronic platforms has evolved towards a greater distribution.
Graph 98- Breakdown of the contracts concluded with electronic platforms for the conduct of procedures, per certified entity:
changes from 2012 to 2015
Source: BASE portal (March 2016)
21%
25%
23%
21%
9% 1%
Vortal - Comércio Eletrónico, Consultadoria eMultimédia, S.A.Construlink, S.A.
Saphety Level, S.A.
ANO - Sistemas de Informática e Serviços, Lda
Acin-icloud Solutions, Lda
Miroma, Serviços e Gestão de Participações Lda
32% 28%24% 21%
44%
27%
20% 25%
11%
21%
23% 22%
6%
16%
14%21%
5% 6%18%
9%
2% 2% 1% 1%
0%
20%
40%
60%
80%
100%
2012 2013 2014 2015Vortal - Comércio Eletrónico, Consultadoria e Multimédia, SA ConstrulinkSaphety Level- Trusted Services, S.A. ANO - Sistemas de Informática e Serviços, ldaAcin-icloud Solutions, L.da Outros

88
9.3.2. CONTRACTS CONCLUDED IN 2015, PER PLATFORM THROUGH WHICH PROCEDURES WERE CARRIED OUT
As regards the relative weight of the number of contracts and contractual amounts carried out through each platform, in a sample of 33,534 contracts concluded in 2015 we can see a concentration in two platforms (Gatewit and Vortalgov), which ensured 73.5 % of the contracts reported to the BASE portal and represented 67.7 % of the overall contractual amount.
Graph 99- Breakdown of the number of contracts and the contractual amounts carried out per platform
Source: BASE portal (March 2016)
Depending on whether we look at the number of contracts or their respective contractual amounts, the platforms keep their relative positioning.
Compared to 2014, there was a slight decrease in the joint relevance of these two platforms in relation to the global market. As regards the number of contracts, their share decreased by 3.6 pp.
A similar situation was found for the contractual amounts, where both platforms lost 5.2 pp of their market share.
45%
29%
9%
10.2%
7% 0.4%
Number of contracts
35%
32%
10%
11.6%
11% 0.2%
Contractual amounts
Gatewit
VortalGov
acinGov
bizGov
anoGov
Infosistemas DL - Compras AP

89
Graph 100- Breakdown of the contractual amounts, per platform: changes from 2012 to 2015
Source: BASE portal (March 2016)
As regards the type of procedure, the largest shares belong to Gatewit for the number of contracts under direct award procedure (45.1 %) and to Vortal, for contractual amounts under the same type of procedure (40.9 %).
Graph 101- Breakdown of the number of contracts and the contractual amounts carried out per platform in 2015
Source: BASE portal (March 2016)
33% 34%41%
35%
49% 47% 32%
33%
11.0%2.8%
5.9%9.7%
2.0%10.6%
8.1% 11.6%
4.0% 5.1%12.8% 10.8%
1.0% 0.2% 0.3% 0.2%
0%
20%
40%
60%
80%
100%
2012 2013 2014 2015
Gatewit VortalGov acinGov bizGov anoGov Infosistemas DL - Compras AP
45%
32%
45%35%
24%
39%
29%
41%
27%
33%
41%
26%
09% 08% 10%10% 11% 09%
10% 10% 11%12% 11% 14%
7% 8% 7% 11% 12% 12%
0.4% 0.5% 0.4% 0.2% 0.2% 0.3%
0%
20%
40%
60%
80%
100%
Number Number (Competitiveprocedures)
Number (direct awards) Contractual amounts Contractual amounts(competitive procedures)
Contractual amounts(direct awards)
Gatewit VortalGov acinGov bizGov anoGov Infosistemas

90
10. CONTRACT PERFORMANCE
10.1. PRICE DEVIATION38
When data collection for this report took place, 75.4 % (223,660) of the concluded contracts had already an indication of the actual total price. The recorded completion rate was higher for goods and services (77.0 %, corresponding to 219,310 contracts) than for public works (35.8 %, corresponding to 4,350 contracts).
Graph 102- Contracts indicating the actual total price
Source: BASE portal (March 2016)
When we compare the actual total value of each contract with the contractual price, we see that only 0.23 % of the contracts for goods and services had a final total price higher than the value established in the contract.
38 It should be noted that the price deviation in this context corresponds to the difference between the actual total price of the contract and the contractual price. The nature of extra costs is not considered; for lack of information, these deviations may be due to more and/or less work than expected, to default interest, etc.
00% 20% 40% 60% 80% 100%
Public works
Goods and services
77%
36%
23%
64%
Completed Underway

91
Graph 103- Price deviations per range: Goods and services
Source: BASE portal (March 2016)
As for public works, the weight of contracts in a similar situation is slightly higher, but the proportion is very low: the final value was higher than the contractual value in only 1.16% of the contracts relating to public works.
Graph 104- Price deviations per range: Public works
Source: BASE portal (March 2016)
99.77%
0.11%
0.03%
0.02%0.01% 0.01%
0.04%
0.23%
Goods and services
Until 100% ]100;110] ]110;120] ]120;130] ]130;140] ]140;150] ]150, ∞ [
98.84%
0.77%
0.21% 0.05%
0.06%
0.07%1.16%
Public works
Until 100% ]100;110] ]110;120] ]120;130] ]130;140] ]150, ∞ [

92
Among the contracts concluded in 2015 with an actual total price higher than the contractual price, 82.2 % concerned the purchase of goods and services, corresponding to 33.7 % of the contractual amounts.
Graph 105 - Contracts with an actual price higher than the contractual price, per type of contract
Source: BASE portal (March 2016)
An analysis per type of procedure shows that most contracts (96.3 %) and near ⅖ of the contractual amount (41.9 %) concerned direct award procedures.
Graph 106 - Contracts with an actual price higher than the contractual price, per type of procedure
Source: BASE portal (March 2016)
Considering the type of contracting authorities that concluded contracts whose final actual price was higher than the contractual value, that was the case with “Other bodies governed by public law” (49.3 % of the contracts and 31.3 % of the contractual amounts) and “National Authorities” (24.0 % of the contracts and 8.2 % of the contractual amounts).
82.2%
17.8%
Number of contracts
33.7%
66.3%
Contractual amounts
3.7%
96.3%
Number of contracts
58.1%
41.9%
Contractual amounts

93
Graph 107 - Contracts with an actual price higher than the contractual price, per type of contracting authority
Source: BASE portal (March 2016)
As regards the type of expenditure, the largest number of contracts can be found in “Construction works” (17.3 %), followed by “Food, beverages, tobacco and related products” (14.5 %) and “Medical equipment, pharmaceuticals and personal care products” (13.6 %).
Graph 108 - Contracts with an actual price higher than the contractual price, per CPV (number of contracts)
Source: BASE portal (March 2016)
24.0%
1.4%
18.4%49.3%
4.3% 2.6%
Number of contracts
8.2%0.3%
16.4%
31.3%
2.4%
41.4%
Contractual amounts
17.3%
14.5%
13.6%
4.8%4.5%3.7%
41.6% Construction work
Food, beverages, tobacco and related products
Medical equipments, pharmaceuticals and personal care products
Health and social services
Repair and maintenance services
Office and computing machinery, equipment and supplies
Others

94
10.2. DEADLINE DEVIATION
When data for drafting this report were collected, 74.0% of the concluded contracts mentioned the actual duration of the contracts (77.1% in the case of contracts for the purchase of goods and services and 1.9% in the case of contracts relating to public works).
Table 14 – Contracts indicating the final deadline
Source: BASE portal (March 2016)
As regards compliance with the deadline established in the contract for its completion, in the case of goods and services that deadline was not met in 41.1% of the contracts. However, that deadline was exceeded by more than 60 days in only 7.7% of the contracts.
Graph 109 – Deadline deviations per range: Goods and services
Source: BASE portal (March 2016)
ContractsNumber of contracts
TotalNumber of contracts
CompletedWeight
Goods and services 284,650 219,431 77.1%
Public works 12,137 227 1.9%
Total 296,787 219,658 74.0%
58.9%25.6%
7.8%
3.4%3.5% 0.8%
Within the deadline ]0;30] ]30;60] ]60;90] ]90;180] ]180, ∞ [

95
In the case of public works, most contracts were not completed within the established deadline: the deadline was met in only 16.4% of the contracts, and it was even exceeded by more than 60 days in 47.8% of the contracts.
Graph 110 – Deadline deviations per range: Public works
Source: BASE portal (March 2016)
16.4%
17.9%
17.9%16.4%
25.4%
6.0%
Within the deadline ]0;30] ]30;60] ]60;90] ]90;180] ]180, ∞ [
96
11. FINAL CONSIDERATIONS
1.ª - Portugal’s good performance as regards the Manchester commitment on electronic public procurement was confirmed once again in 2015. In fact, 93% of the contracts concluded in Portugal in 2015 with a value above the Community thresholds were carried out electronically.
Portugal’s record remained well above the target established by Member States for the electronic conduct of procedures with a value above the Community thresholds (50 %), which proves the consistency of the Portuguese option for e-procurement.
2.ª - The Portuguese electronic public procurement index (ICPEP) has also recorded a very
positive value (67 %), thus reversing the trend observed in the previous year. 3.ª - Both above mentioned indicators depend on the options made by the contracting
authority on the use of authorized electronic platforms to carry out public procurement procedures for direct awards.
Whereas the use of such platforms brings more transparency and probably more competition to public purchasing, an extension of their mandatory use to direct award procedures - at least to those above a certain threshold - can be beneficial.
4.ª - The value of reported public contracts may be below the actual value of public contracts
in general, if we consider its relatively low share in relation to gross domestic product - 2.6 %, while the European Commission estimate for 2014 was 9.8 % - and to budgetary implementation (27.23 %).
5.ª - The value of contracts concluded in 2015 and reported to the BASE portal amounted to
EUR 4,612 million, representing a decrease of 6.7 % over 2014 (-EUR 329 million than in 2014).
6.ª - The average value of contracts increased in the case of goods and services (+44.5 %), but they decreased in the case of public works (-38.4 %).
7.ª - The purchase of goods and services in 2015 represented 76.9% of the contractual
amounts, thus reinforcing its weight against public works. Between 2010 and 2015 there

97
was a reversal in terms of relative weight: in 2010, it was public works that represented 61 % of the contractual amounts.
8.ª - Direct award procedures were the basis for 90.2 % of the contracts concluded in 2015,
corresponding to 47.9 % of the contractual amounts.
On the other hand, competitive procedures were the basis for 2.4 % of the contracts concluded in the same year, accounting for 38.7 % of the contractual amounts.
9.ª - Simplified direct awards reported to the BASE portal represented 62.1% of the number of
contracts under direct award, corresponding to 2.3% of the contractual amounts. However, only 735 contracting authorities (26.4% of all reporting contracting authorities) reported such contracts.
10.ª - Direct awards on the grounds of substantive criteria represented 0.9% of the total value
of public contracts reported to the BASE portal, where the most often mentioned criterion was “Technical or artistic reasons or reasons connected with the protection of exclusive rights”.
11.ª - Most of the EUR 4,612 million worth public contracts concluded in 2015 (59.5 %) were planned to be executed during the same year. It was expected that only 15.4% of that amount would be executed beyond 2017.
12.ª - In the case of contracts for goods and services, most procedures (68.7%) on which they were based took up to 4 days. In the case of contracts for public works, 32.3% of the procedures took up to 30 days.
13.ª - The number of competitors per procedure was 0.9 and 2.4, respectively for goods and services and public works. In the case of contracts based on competitive procedures, the average number of competitors (2.5 for goods and services and 6.4 for public works) was higher than for contracts resulting from direct award procedures (0.6 and 1.5, respectively).
14.ª - The most used criterion for assessing tenders is the lowest price. It was used in 71.5% of
the competitive procedures. In 56.3% of the competitive procedures, the weight of the price factor (or the like) was higher than 50 %.

98
15.ª - In 13.4 % of the contracts for the purchase of goods and services and in 1.1 % of the contracts for public works, the established contractual price was lower than the threshold below which a tender price can be considered as abnormally low (less than 40 % and 50 % of the basic price, respectively for goods and services and for public works).
This phenomenon is more frequent in competitive procedures, where it occurred in 44.5 % and 4.9 % of the procedures relating to goods and services and to public works, respectively.
16.ª - In 2015, the number of entities having reported contracts to the BASE portal amounted to 2,779, representing a decrease of 20.2 % over 2014. Besides the fact that this is a relatively low figure in view of what could be expected, 677 of these entities reported only 1 contract resulting from a direct award procedure.
17.ª - The number of economic operators that concluded contracts with contracting authorities amounted to 53,839.
Among these operators, 95 % were domestic, 4 % from other EU countries and 1 % from third countries.
18.ª - From the domestic companies, 57.9% were micro enterprises, 39.4% were small and medium-sized enterprises and only 2.7% were large enterprises.
Small and medium-sized enterprises accounted for 49.9% of all concluded contracts, followed by micro enterprises (31.1%) and large enterprises (18.9%).
In terms of contractual amounts, near a half (47.5%) related to contracts concluded by small and medium-sized enterprises, followed by large enterprises (40.6%) and micro enterprises (11.9%).
19.ª - The electronic platform market for public procurement is still dominated by two
platforms – Gatewit and Vortal –, which together represent 73.5% of all contracts and 67.7% of the respective contractual amounts.
20.ª - As regards the financial implementation of contracts, from the sample concerned, only
0.23 % of the contracts for goods and services and 1.16 % of the contracts for public works showed deviations in relation to their contractual value.

99
21.ª - As for the deadline for the performance of the contract, it should be noted that it was not met in 41.1 % of the cases (goods and services).
_______________________ * __________________________