public policy and the creation of active venture capital markets1
TRANSCRIPT

WORKING PAPER SER IES
NO. 430 / JANUARY 2005
PUBLIC POLICY ANDTHE CREATION OF ACTIVE VENTURE CAPITAL MARKETS
by Marco Da Rin,Giovanna Nicodano and Alessandro Sembenelli
ECB-CFS RESEARCH NETWORK ONCAPITAL MARKETS AND FINANCIALINTEGRATION IN EUROPE

In 2005 all ECB publications will feature
a motif taken from the
€50 banknote.
WORK ING PAPER S ER I E SNO. 430 / J ANUARY 2005
This paper can be downloaded without charge from http://www.ecb.int or from the Social Science Research Network
electronic library at http://ssrn.com/abstract_id=634025.
ECB-CFS RESEARCH NETWORK ONCAPITAL MARKETS AND FINANCIALINTEGRATION IN EUROPE
PUBLIC POLICY ANDTHE CREATION OF ACTIVE VENTURE
CAPITAL MARKETS 1
by Marco Da Rin 2,Giovanna Nicodano 3
and Alessandro Sembenelli 4
1 We thank Giulio de Caprariis at Confindustria, Didier Guennoc at EVCA, and Tim Rice, Roderick Roman, and Angela Vuono atErnst&Young for providing us with data. Douglas Cumming, Heather Gibson, Leon de Haan, Ulf von Kalckreuth, Dima
Leshchinskii, Dorothée Rivaud-Danset, Javier Suarez, and Reinhilde Veugelers provided useful comments, as well as participants at the ECB-CFS Third Workshop on Capital Markets and Financial Integration, at the 6th Bundesbank Spring Conference, at the
European Finance Association 2004 Meetings, at the European Commission, at the EconChange London 2004 workshop,and at seminar at Gerzensee and St.Gallen.Antonella Borra and Marina Di Giacomo provided excellent research assistance.
Financial support from the European Commission (grant HPSE-CT-2002-00140) and from Turin University is gratefully acknowledged.We remain responsible for all errors.
2 University of Turin, Department of Economics and Finance, Corso Unione Sovetica, 218 bis, 10134 Torino, Italy;tel.: +39 011 670 6088; e-mail: [email protected]
3 University of Turin, Department of Economics and Finance, Corso Unione Sovetica, 218 bis, 10134 Torino, Italy;tel.: +39 011 670 6073; e-mail: [email protected]
4 University of Turin, Department of Economics and Finance, Corso Unione Sovetica, 218 bis, 10134 Torino, Italy;tel.: +39 011 670 6059; e-mail: [email protected]

© European Central Bank, 2005
AddressKaiserstrasse 2960311 Frankfurt am Main, Germany
Postal addressPostfach 16 03 1960066 Frankfurt am Main, Germany
Telephone+49 69 1344 0
Internethttp://www.ecb.int
Fax+49 69 1344 6000
Telex411 144 ecb d
All rights reserved.
Reproduction for educational and non-commercial purposes is permitted providedthat the source is acknowledged.
The views expressed in this paper do notnecessarily reflect those of the EuropeanCentral Bank.
The statement of purpose for the ECBWorking Paper Series is available from theECB website, http://www.ecb.int.
ISSN 1561-0810 (print)ISSN 1725-2806 (online)
ECB-CFS Research Network on “Capital Markets and Financial Integration in Europe”
This paper is part of the research conducted under the ECB-CFS Research Network on “Capital Markets and Financial Integration in Europe”. The Network aims at stimulating top-level and policy-relevant research, significantly contributing to the understanding of the current and future structure and integration of the financial system in Europe and its international linkages with the United States and Japan. After two years of work, the ECB Working Paper Series is issuing a selection of papers from the Network. This selection is covering the priority areas “European bond markets”, “European securities settlement systems”, “Bank competition and the geographical scope of banking activities”, “international portfolio choices and asset market linkages” and “start-up financing markets”. It also covers papers addressing the impact of the euro on financing structures and the cost of capital. The Network brings together researchers from academia and from policy institutions. It has been guided by a Steering Committee composed of Franklin Allen (University of Pennsylvania), Giancarlo Corsetti (European University Institute), Jean-Pierre Danthine (University of Lausanne), Vítor Gaspar (ECB), Philipp Hartmann (ECB), Jan Pieter Krahnen (Center for Financial Studies), Marco Pagano (University of Napoli “Federico II”) and Axel Weber (CFS). Mario Roberto Billi, Bernd Kaltenhäuser (both CFS), Simone Manganelli and Cyril Monnet (both ECB) supported the Steering Committee in its work. Jutta Heeg (CFS) and Sabine Wiedemann (ECB) provided administrative assistance in collaboration with staff of National Central Banks acting as hosts of Network events. Further information about the Network can be found at http://www.eu-financial-system.org. The joint ECB-CFS Research Network on "Capital Markets and Financial Integration in Europe" aims at promoting high quality research. The Network as such does not express any views, nor takes any positions. Therefore any opinions expressed in documents made available through the Network (including its web site) or during its workshops and conferences are the respective authors' own and do not necessarily reflect views of the ECB, the Eurosystem or CFS.

3ECB
Working Paper Series No. 430January 2005
CONTENT S
Abstract 4
Non-technical summary 5
1 Introduction 7
2 Public policy for active venture capital markets 9
3 A model of venture capital markets 11
3.1 Direct finance 12
3.2 Venture capital finance 12
3.3 Equilibrium 13
3.4 The innovation ratios 14
3.5 Equilibrium with excess supply ofventure capital 14
3.6 Taking the model to the data 15
4 Data and empirical strategy 16
4.1 Data sources and description 16
4.1.1 Dependent variables 16
4.1.2 Independent variables 17
4.2 Empirical strategy 19
4.3 Descriptive statistics 20
5 Regression results 21
5.1 Main results 21
5.2 Extentions and robustness checks 22
6 Conclusion 25
References 26
Appendix 31
Figures and tables 32
European Central Bank working paper series 43

Abstract
We study how public policy can contribute to increase the share of early stage andhigh-tech venture capital investments, thus helping the development of active venturecapital markets. A simple extension of the seminal model by Holmstrom and Tirole(1997) provides a theoretical base for our analysis. We then explore a unique panelof data for 14 European countries between 1988 and 2001. We have several novelfindings. First, the opening of stock markets targeted at entrepreneurial companiespositively affects the shares of early stage and high-tech venture capital investments;reductions in capital gains tax rates have a similar, albeit weaker, effect. Second, areduction in labor regulation creases the share of high-tech investments. Finally, wefind no evidence of a shortage of supply of venture capital funds, and no evidence ofan effect of increased public R&D spending on the share of high-tech or early stageventure capital investments.
Keywords: Venture Capital; Capital Gains Tax; Public R&D Expenditure; Barriers to Entrepre-neurship; Stock Markets; Public Policy.
JEL classification: G10, G24. H20, O30.
4ECBWorking Paper Series No. 430January 2005

Non-technical summary
The creation of 'active' venture capital markets, i.e. venture capital markets
which provide strong support for early stage and high-tech ventures, has received a high
priority by economic policy. As economies become ever more dependent on innovation
and entrepreneurship for achieving sustained growth, governments around the world
have been trying to replicate the diffusion and success that venture capital has achieved
in the United States. These attempts absorb large sums of public money. Yet, we still
know little about what policies can help create active venture capital markets, and our
study contributes a step towards filling this gap.
We first introduce the notion of 'innovation ratios,' defined as the ratio of early
stage (or high-tech) investments to total venture investments. These ratios measure the
extent to which venture capital markets are active. A simple extension of the model of
Holmstrom and Tirole (1997) points to determinants of these ratios which are under the
influence of policy-makers. The first is the supply of venture capital funds, which is
shown to affect innovation ratios only if there are binding credit constraints. Then there
are factors which may impact project's expected returns. Exit markets for venture
investments and the level of capital gains taxation affect the capital gains that investors
and entrepreneurs can reap when they succeed. Technological advances can be turned
into commercially valuable ventures. Finally, barriers to entrepreneurship may affect
expected returns by influencing the cost of creating a new venture.
Starting with Gompers and Lerner (1998) several empirical studies have looked
at the development of venture capital markets and their determinants. Our paper
advances the literature on several counts. First, we use a model to guide our empirical
investigation, which is based on ratios instead of levels of demand and supply. Our
panel approach, based on data for 14 European countries over 1988 to 2001, is another
innovation. Previous studies either lacked panel data or examined the determinants of
cross-country variation in the levels of venture capital. We focus instead on the
determinants of active venture capital in each country over time, being interested in the
effects of government policy. Moreover, our study relies on panel data for all policy
variables, including the taxation of capital gains and barriers to entrepreneurship.
Our results provide several insights. First, we look at the opening of 'New' stock
markets target at entrepreneurial companies, and find that it considerably increases both
the early stage and high-tech innovation ratios. Our panel setting thus provides strong
5ECB
Working Paper Series No. 430January 2005

and Gilson (1998) and Michelacci and Suarez (2004). Second, we find that a reduction
in capital gains taxation increases both the high-tech and early stage ratios, albeit the
economic effect is not very large. Third, we consider several alternative measures of
barriers to entrepreneurship, and find that those related to labor regulations have a
significantly negative effect on the share of high-tech investments. These results are
consistent with our model, which suggests that a higher expected rate of return makes
more venture funds available for companies with lower collateral, such as those in high-
tech and early stage, and thus results in an increase of the innovation ratios.
Last but not least, our data do not provide any evidence of a shortage of venture
capital funds for European companies, contrary to what assumed by the prevailing
policy approach. Nor we find evidence that public expenditure in research and
development (R&D) favors the innovation ratios through the creation of better
entrepreneurial opportunities.
6ECBWorking Paper Series No. 430January 2005
support for the importance of an exit option for venture capital, as suggested by Black

1 Introduction
Venture capital is a form of intermediation particularly well suited to support the creationand growth of innovative, entrepreneurial companies (Hellmann and Puri (2000, 2002),Kortum and Lerner (2000)). It specializes in financing and nurturing companies at anearly stage of development (’start-ups’) that operate in high-tech industries. For thesecompanies the expertise of the venture capitalist, its knowledge of markets and of theentrepreneurial process, and its network of contacts are most useful to help unfold theirgrowth potential (Bottazzi, Da Rin and Hellmann (2004), Gompers (1995), Hellmann andPuri (2002), Lerner (1994, 1995), and Lindsey (2003)). By contrast, when venture capitalis applied to companies at a later stage of their growth, or in companies which operatein technologically mature industries, it has less of an opportunity to ’make a difference’(Michelacci and Suarez (2004)). Economics thus points to the relevance of providing anadequate share of venture investments in high-tech and early stage companies.
The creation of ’active’ venture capital markets, i.e. venture capital markets whichprovide strong support for early stage and high-tech ventures has received a high priorityby economic policy, which appreciates its importance for achieving continued economicgrowth and job creation ((Bottazzi and Da Rin (2002a), European Commission (2003),OECD (2001)). As economies become ever more dependent on innovation and entrepre-neurship for achieving sustained growth (Bottazzi, Da Rin, and Giavazzi (2003), Nelsonand Romer (1996), OECD (2001)), governments around the world have been trying toreplicate the diffusion and success that venture capital has achieved in the United States(Megginson (2004)). These attempts absorb large sums of public money. Yet, we stillknow very little about what policies can help create active venture capital markets, andour study contributes a first step towards filling this gap.
We start by providing a simple extension of the seminal model of Holmstrom andTirole (1997) which helps us focus on the determinants of the distribution of financingbetween early and late stage, and between high-tech and low-tech, investments. We extendthe model by Holmstrom and Tirole by allowing for the possibility of an excess supply offunds. As in the original model, firms are heterogeneous in their ability to pledge collateralagainst borrowing, but we also assume that this ability is higher for firms that possessmore tangible assets, which are more easily accepted as collateral than intangible assets.As firms mature from start-ups to later stage ventures, they can rely more on tangibleassets. Likewise, firms in high-tech industries make more use of intangible assets thanthose in traditional industries. This creates a ’pecking order’ in firms’ ability to pledgecollateral against loans.
We use this framework to introduce the notion of ’innovation ratios,’ defined to be theratio of early stage (or high-tech) investments to total venture investments. These ratiosprovide a measure of the extent to which venture capital markets are active. They areuseful for studying how policy can make venture capital markets not only larger but alsofocussed on those firms which can most benefit from the support of a venture capitalist.
While simple, this framework is rich enough to point to several potential drivers ofactive venture capital markets which are under the influence of policy-makers. The firstis the sheer supply of funds available for investment, which could ease binding credit
7ECB
Working Paper Series No. 430January 2005

constraints. Second, there are factors which directly affect project’s expected returns: theexistence of exit markets for venture investments and the level of capital gains taxation,both of which affect the capital gains that investors and entrepreneurs can reap when theysucceed; and the existence of good technology, which can be turned into commerciallyvaluable ventures. Third, there are factors which affect expected returns by determiningthe cost of creating a new venture, namely barriers to entrepreneurship.
Starting with Gompers and Lerner (1998) several previous studies have looked at thedevelopment of venture capital markets and their determinants. Our approach allows usto advance the literature on several counts. First, we use a simple model to guide ourempirical approach, which is based on ratios instead of levels of demand and supply–unlike previous analyses.
Our panel approach, based on data for 14 European countries over 1988 to 2001, isanother innovation. Previous studies either lacked panel data or focussed on ’between’country estimators. Jeng and Wells (2000), for example, use a panel of OECD country-level data for 1986-95, and focus on cross-country analysis; their approach raises issuesof unobserved heterogeneity, that our panel approach can address adequately. Based onour comprehensive set of policy variables, we choose to provide an answer to the questionof what can governments do to increase the innovation ratios rather than understandingcross-country variation in the levels of the ratios; we thus focus on estimating ’within’country effects. Our choice is motivated also by the nature of our data, which come froma rather homogeneous set of developed economies.
One notable exception to pure cross-country comparisons is Gompers and Lerner(1998), who use a panel of U.S. state-level variables for examining the effect of varia-tions in taxation during the 1976-94 period.1 However, ours is the first study to analyzeall policy variables with a panel dimension. Our results provide several novel insights.
First, we look at the opening of ’New’ stock markets target at entrepreneurial compa-nies, and find that it considerably increases both the early stage and high-tech innovationratios. Our panel setting thus provides strong support for the importance of an exit optionfor venture capital, as suggested by Black and Gilson (1998) and Michelacci and Suarez(2004).
Second, we examine the taxation of capital gains, which has recently received con-siderable attention in theoretical studies of venture capital (e.g., Keuschingg and Nielsen(2003, 2004)). Previous empirical analyses looked at cross-sectional comparisons of taxa-tion across OECD countries (e.g., Armour and Cummings (2003)). We extend them bycollecting a panel of country-level data which goes back to 1988. We find that a reductionin capital gains taxation increases both the high-tech and early stage ratios, albeit theeconomic effect is not very large.
Third, we consider the effects of a reduction in barriers to entrepreneurship. Like inthe case of taxation, we believe we are the first to introduce a panel dimension into theanalysis. We consider several alternative measures of such barriers, and find that thoserelated to labor regulations have a significantly negative effect on the share of high-tech
1See also Armour and Cumming (2003), who develop an original measure of the leniency of bankruptcylaws across 15 European and North American countries over 1990-2002.
8ECBWorking Paper Series No. 430January 2005
investments.

These results are consistent with our model, which suggests that a higher expected rateof return makes more venture funds available for companies with lower collateral, such asthose in high-tech and early stage, and thus results in an increase of the innovation ratios.
Finally, our data do not provide any evidence of a shortage of venture capital funds forEuropean companies, contrary to what assumed by the prevailing policy approach. Norwe find evidence that public expenditure in research and development (R&D) favors theinnovation ratios through the creation of better entrepreneurial opportunities.
Overall, the European experience we analyze thus suggests that the creation of activeventure capital markets might depend crucially on providing investors and entrepreneurswith the possibility to reap the benefits of their efforts, rather than on providing themwith more funds.
The rest of the paper is organized as follows. Section 2 briefly describes recent policyprogrammes for venture capital markets. Section 3 presents our model. Section 4 describesour data and empirical strategy. Section 5 reports our results, and is followed by a briefconclusion.
2 Public policy for active venture capital markets
To the extent that growth depends on innovation and creative destruction, and that inno-vative firms suffer from credit constraints because of asymmetric information, one couldthink of fostering productivity by channeling more funds into venture financing of techno-logically innovative companies. This reasoning has in fact held sweeping influence on policy.While venture capital was born in the U.S. out of private initiative (Gompers (1994)), itsexpansion benefited from the Small Business Innovation Research (SBIR) programme inthe 1980s (Gans and Stern (2003), Lerner (1999)). Interestingly, the SBIR programme,which pioneered public policy towards venture capital by investing several billion dollars,was largely motivated by the fear that insufficient financing was available to innovativesmall firms.
The perceived need to overcome this market failure by increasing the supply of riskcapital is probably the main motivation for public policy in favor of venture capital mar-kets. Such an approach has also informed recent public policy initiatives, most notably inIsrael and Europe. In Israel, the Yozma programme, started in 1992, provided 100 milliondollars of public funding to attract private funds for over 150 millions (Avnimelech andTeubal (2002)). Yozma helped create ten private venture capital firms and to jump-starta successful and active venture capital market. In 2001, the European Commission trans-formed the European Investment Fund (EIF) into Europe’s largest venture investor withan injection of more than 2 billion euros (EIF (2002)), making the increase of the supplyof risk capital one priority of its policy towards innovation and capital markets (EuropeanCommission (1998, 2003)).
This approach is shared by many other large national programmes, from Germany’sfederal and regional schemes for innovative companies (German Federal Ministry for Eco-nomics and Technology (1999)), to the French ’Plan Innovation’ (French Ministry of In-
9ECB
Working Paper Series No. 430January 2005

dustry (2003)), to the decision to turn the Danish Growth Fund into a public venturefund in 2001 (Danish Growth Fund (2003)), and to the creation of the UK High Technol-ogy Fund (HM Treausury (2003)). Public programmes aimed at increasing the supply ofventure capital have also been implemented in several emerging economies, from Chile toIndia (Carter, Barger, and Kuczynski (1996), Gilson (2003), Lerner and Schoar (2004)).
The economics foundations for such policies are however still unchecked. While venturecapital is widely thought to foster the creation of particularly innovative and dynamic com-panies, this does not imply that more funds would directly translate into a larger numberof successful companies. Theory warns about the value-reducing effects of increasing thesupply of funds to the venture capital industry when competition for good projects is high(Inderst and Müller (2004)). In such an environment, promoting innovation by increasingresearch and development (R&D) expenditure would be more effective than stimulatingthe funding of the venture capital industry.
Recent empirical work also casts doubts on the hope to increase investment into newventures simply by increasing the supply of risk capital. Looking at U.S. sector-level data,Hirukawa and Ueda (2003) argue that, at the aggregate level, it may be innovation activityto lead the development of venture capital, and not vice versa. Also Gompers and Lerner(1998) emphasize the role of R&D expenditure in the development of the U.S. venturecapital industry.
The view that factors other than the supply of funds may be important for the creationof active venture capital markets has also yielded influence over policy. For example, theincrease in R&D expenditure is seen as one of the main factors lying behind the discoveryof new technology, and thus to the arrival of new entrepreneurial opportunities. On thesebases, the Barcelona European Council of March 2002 set the objective to increase theaverage investment in R&D in Europe from 1.9% to 3.0% by 2010, of which two thirds tobe funded by the private sector (European Commission (2002)).
Three other factors have held influence over policies toward active venture capitalmarkets. One is the need to offer an exit option to venture capital investors. The realizationof a large capital gain when bringing a company public is arguably the greatest incentiveto venture investing. Moreover, venture capital should benefit from the ability to exitfrom investments before the marginal value of their time and money starts to decrease.Michelacci and Suarez (2004) formalize this notion, and show that active stock marketsinduce the development of a vibrant venture capital industry. The Risk Capital ActionPlan adopted by the European Commission in 1998, subscribed to this view and greatlyinfluenced national policies in the late 1990s (European Commission (1998)). The recentdemise of the Neuer Markt and other European ’new’ markets, however, cast serious doubtson the positive effect of this approach (Bottazzi and Da Rin (2004)).
Second, the taxation of capital gains has long been pointed to as a driver of bothentrepreneurship and venture capital investment (Poterba (1989a,b), Gompers and Lerner(1998)). Recent theories argue in favor of reductions of capital gains tax rates on theground of incentive effects for the provision of effort by venture capitalists (Keuschnigg andNielsen (2001) and Keuschnigg (2004)). Capital gains taxation has been recently reducedin several countries (EVCA (2003)). For example, investment vehicles with a favorabletaxation have been introduced in 1995 in the UK (’Venture Capital Trust’) and in 1997
10ECBWorking Paper Series No. 430January 2005

in France (’Fonds Communs de Placement dans l’Innovation’—FCPI). Reforms aimed atlowering the effective taxation have also been enacted in Germany (1998 and 2000), theNetherlands (1996), Spain (1996 and 2001).
Finally, barriers to entrepreneurship–which range from the formalities needed to es-tablish a corporation, to regulatory and administrative opacity and barriers to competition–are another important hindrance to the formation of new companies. The reduction of suchbarriers has thus been advocated as a major step towards the creation of entrepreneur-ial companies, and has been object of recent empirical analyses (see Alesina et al. (2003),Klapper, Laeven, and Rajan (2004) and Scarpetta et al. (2002) among others). One impor-tant finding which motivates our interest is the decrease in business regulations in severalEuropean countries over the 1990s, documented in a series of OECD studies reviewed inNicoletti and Scarpetta (2003).
Which of these approaches, if any, receive support from the data is however unclear.This study provides new evidence in this respect.
3 A model of venture capital markets
In this section we provide a simple extension of the seminal double moral hazard modelof financial intermediation by Holmstrom and Tirole (1997) to study the structure ofventure capital investment.2 We start by summarizing the key ingredients of the model,which formalizes the idea that the ability to pledge collateral determines both the amountand the type of financing that a firm can obtain. We refer the reader to the original articlefor further details. We then use the model to define the concept of innnovation ratio, andwe extend the model to the case of excess supply of venture capital.
The model lasts two periods. In the first period financial contracts are signed andinvestments are implemented. In the second period uncertainty about project returnsis resolved and payments are made. There is a continuum of firms–or, equivalently,entrepreneurs–which have access to a project that delivers a payoff equal to R> 0 withprobability pH and to 0 otherwise. The cost of the investment is I. Firms need to borrowthe amount I − A > 0, where A denotes a firm’s own equity capital which is pledged ascollateral. We denote by G(A) the cumulative uniform density of collateral for all firms,which we assume to be continuous. Entrepreneurs are able to divert resources from theproject and extract private benefits equal to B > 0, which reduces the probability ofsuccess to pL<pH .
Firms can borrow from arms’ length (’uninformed’) investors or from (’informed’) fi-nancial intermediaries. Uninformed investors simply provide funds and require a return γ,which reflects their opportunity cost of funds. In addition to providing funds, financial in-termediaries can also monitor, which reduces private benefits to 0<b<B and mitigates the
2The double moral hazard model, where both the entrepreneur and the venture capitalist exert non-contractible effort, has become the workhorse of the theoretical venture capital literature (see Casamatta(2003), Inderst and Müller (2004), Repullo and Suarez (2004), Schindele (2004), and Schmidt (2003) amongothers).
11ECB
Working Paper Series No. 430January 2005

entrepreneur’s moral hazard problem. In our setting, we identify financial intermediarieswith venture capital firms.
Finally, we assume that only the good project is economically viable, which we canwrite as: pHR− γI > 0 > pLR− γI +B.
3.1 Direct finance
It is easy to show that some firms with low equity capital will not be financed by unin-formed investors, because their capital is not enough to generate the correct incentivesfor entrepreneurs to behave diligently. Let Rf be the share of the payoff retained by thefirm, and Ru=R−Rf the share paid out to uninformed investors. A necessary conditionto obtain finance is that the entrepreneur prefers not to shirk, i.e. pHRf ≥pLRf+B.
A necessary and sufficient condition to obtain finance from uninformed investors isthen:
γ(I −A) ≤ pHRu = pH
∙R− ( B
pH − pL)
¸
which says that the market value of the loan (the left hand side) cannot exceed thefirm’s expected income (the right-hand side). Firms are then able to raise finance fromuninformed investors if and only if:
A ≥ A(γ) = I − (pHγ)
∙R− B
pH − pL
¸where A is increasing in γ.
3.2 Venture capital finance
Credit rationing of firms with A<A creates a role for monitoring by venture capital firms.In this case, a monitored entrepreneur chooses not to shirk only if pHRf ≥pLRf+b.
Let Rvc be the share of the payoff paid out to the venture capital firm. We assumethat monitoring has a private cost c>0, so that the venture capitalist will monitor only ifher expected payoff compensates for the private cost of monitoring: pHRvc−c≥pLRvc.
The rate of return to venture capital, denoted by β, is given by β = pHRvc/Ivc, whereIvc is the amount of funds borrowed by monitored firms. We then see that the value of Ivcadjusts to satisfy the incentive compatibility constraint of the venture capitalist, so that:
Ivc(β) ≥cpH
β(pH − pL)
Venture finance costs more than uniformed capital, since it must compensate for moni-toring effort. It follows that in equilibrium Ivc takes the lowest possible value which allowsventure capitalists to recover the monitoring costs, the residual financing needs of a firmbeing served by cheaper uninformed capital. The above equation thus holds as an equality.
12ECBWorking Paper Series No. 430January 2005

A necessary and sufficient condition for a firm to be financed by both uninformedinvestors and venture capitalists is then:
A ≥ A(γ, β) = I − Ivc(β)− (pHγ)
∙R− b+ c
pH − pL
¸where it can be shown thatA increases in both its arguments, so that more credit constrainsbecome tighter as the rate of return required by either type of investor increases. Panel (a)of Figure 1 represents the firms ’financing choices, depending on their own equity capital.
3.3 Equilibrium
The aggregate demand for uninformed capital, denoted by Du(γ, β) is the sum of twocomponents. The first is the demand from firms which can afford not to borrow venturecapital , i.e. firms with A>A(γ). This amounts to (I −A). The second component is thedemand from firms which also receive venture capital, i.e. firms with A(γ, β)<A<A(γ).This amounts to (I −A− Ivc). Their sum is given by:
Du(γ, β) =
Z A(γ)
A(γ,β)[I −A− Ivc(β)] dG(A) +
Z ∞
A(γ)[I −A] dG(A)
The market for uninformed capital clears when demand equals supply:
Du(γ, β) = S(γ) (1)
where S(γ) denotes the supply of uninformed capital, with S0(γ) > 0. The aggregatedemand for venture capital is given by:
Dvc(γ, β) =£G(A(γ))−G(A(γ, β))
¤Ivc(β) (2)
which is increasing in pH and decreasing in β. In equilibrium, this is equal to the supplyof venture capital, Kvc, which we take to be fixed in the short run, as in Holmstrom andTirole (1997). This assumption is similar to that of limited supply of venture capitalistsimposed by Michelacci and Suarez (2003). It reflects the notion that it takes time toincrease the supply of specialized intermediaries. While ’money is green,’ venture capitalrequires considerable experience and skills (Bottazzi, Da Rin, and Hellmann (2004)), whichneed time to accumulate. Panel (b) of Figure 1 represents the venture capital marketequilibrium.
To characterize the equilibrium we notice that the market clearing condition for alltypes of external finance is:
Du(γ, β) +Dvc(γ, β)) ≡Z ∞
A(γ,β)[I −A] dG(A) = S(γ) +Kvc (3)
Panel (c) of Figure 1 represents the equilibrium of financial markets when the supply ofuninformed capital is infinitely elastic. This is not an unrealistic case because the market
13ECB
Working Paper Series No. 430January 2005

for venture capital is small relatively to that for uninformed capital–hence the return touninformed capital may well be insensitive to the return to private equity. This assumptionis maintained below to simplify our proofs, which are found in the Appendix. Our resultscarry over to the case of an elastic supply of uninformed capital3.
3.4 The innovation ratios
We denote by Divc the demand for innovative venture capital investments, where i =
ES,HT , ES stands for early stage investments, and HT for high-tech investments. Wedefine Di
vc as innovative investment, characterized by collateral lower than a constant A∗,
with A ≤ A∗ ≤ A:
Divc(γ, β) = [G(A
∗)−G(A(γ, β))] Ivc(β) (4)
and study the structure of venture capital investment. To this purpose we define the ’in-novation ratios’ as the ratios of innovative investment to total venture capital investment:
Divc
Dvc(γ, β) ≡ [G(A∗)−G(A(γ, β))]£
G(A(γ))−G(A(γ, β))¤ (5)
Our first results then characterizes the effects of changing market conditions on the equi-librium value of the innovation ratios:
Proposition 1 The innovation ratios decrease following a reduction in either the supply
of venture capital funds (Kvc) or projects’ expected return (R), as firms with low own
equity capital are denied credit.
These two cases are portrayed in Panels (d) and (e) of Figure 1, respectively. Thisproposition establishes that innovative investment–being characterized by lower collateral–is sensitive to variations in the supply of private equity capital and in project returns.
3.5 Equilibrium with excess supply of venture capital
The occurrence of excess supply of venture capital may not be unrealistic, since there isevidence pointing to a ’money chasing deals’ phenomenon in both the 1980s and 1990s inthe U.S. industry (see Gompers and Lerner (2000) and Kaplan and Stein (1993)). We thusconsider the case when the supply of venture capital exceeds its demand at the minimumrate of return acceptable to a venture firm.4 This rate is given by β = γ pH
pL, and is the lowest
3Restrictions must then ensure that the supply of capital to firms is more sensitive to shocks whencollateral is lower.
4This case is not discussed by Holmstrom and Tirole (1997), who focus on asymmetric responses of βand γ to credit crunches. These rates always move together when there is excess supply of venture capitalfunds.
14ECBWorking Paper Series No. 430January 2005

return such that venture capitalists have an incentive to monitor rather than becoming anuninformed investor. It is thus increasing in γ.
The market clearing condition for all types of funds becomes:Z ∞
A(γ,β)[I −A] dG(A) =
Z ∞
A(γ)[I −A] dG(A) = S(γ) +Kvc (6)
where A(γ)≡A(γ,β) is increasing in γ, so that the total demand for funds is decreasingin γ. This condition uniquely determines the equilibrium rate of return on uninformedcapital. Notice that the lowest possible value of A(γ, β) is reached when β=β, everythingelse being constant. The largest number of firms is thus getting financed by venture capitalin the case of an excess supply of funds, since A(γ) is independent of β. The excess supplyof venture capital funds, Kvc−Dvc(γ,β), is invested in firms with own capital above A,earning a return γ.
We now examine the effects of an increase in Kvc on the equilibrium allocation whenKvc>Dvc at β=β.
Proposition 2 (i) A contraction in the supply of venture capital funds does not affect the
innovation ratios; (ii) a reduction in project return R decreases the innovation ratios.
We refer the reader to Figure 2.5
3.6 Taking the model to the data
Our empirical strategy attempts to assess, with the guidance of our model, the effectsof alternative policies on the innovation ratios. We consider two different types of poli-cies. First, we look at the amount of funds channeled to venture capital markets, whichprovides the empirical counterpart of Kvc. Second, we look at policies which may affectthe innovation ratios through their influence on the return to a project, R. We considerpolicies which affect returns either directly, like the taxation of capital gains, the existenceof a stock market for entrepreneurial companies, or public expenditure on R&D; and welook at policies which affect returns indirectly, by determining the cost of creating a newventure, namely the reduction of barriers to entrepreneurship.
After describing our data, in Section 4.2 below we spell out in more detail our empiricalstrategy.
5These results can be shown to hold also when projects are less than perfectly correlated and whenmonitoring effort or cost are not fixed.
15ECB
Working Paper Series No. 430January 2005

4 Data and empirical strategy
4.1 Data sources and description
Our analysis is based on a panel of data gathered from several sources. We consider datafor the following 14 European countries: Austria, Belgium, Denmark, Finland, France,Germany, Greece, Ireland, Italy, the Netherlands, Portugal, Spain, Sweden, and the UKover the years between 1988 and 2001.6
These countries constitute an ideal set of countries to look at for our purposes. Theyform a relatively homogeneous group of economies which share broadly similar institu-tions and are linked by a common market. At the same time, there has been a substantialvariation over time in the evolution of the venture capital markets, which have maturedsubstantially over the 1990s (Bottazzi and Da Rin (2004)). And variation has been notice-able also in our explanatory variables: the availability of stock markets for entrepreneurialcompanies, taxation of capital gains, the intensity of barriers to entrepreneurship, andpublic R&D spending.
4.1.1 Dependent variables
Our source for the dependent variables is the European Venture Capital Association(EVCA), whose yearbooks are compiled from an extensive yearly survey of member andnon-member firms.7 Yearbooks report data on a number of variables, organized by country.For each year and country, we look at the reported amount of total funds invested. This isdivided into five categories: seed, start-up, expansion, replacement capital, and buyouts.We define venture capital (VC) to be the sum of the first four categories, and non-ventureprivate equity to equal the last one. The sum of venture and non-venture private equityinvestments is referred to as (total) private equity (PE). We then partition venture capitalinvestments into early stage (ES)–equal to the sum of seed and start-up investments–andlate stage (LS)–equal to expansion investments and replacement capital.
We then define high-tech investments (HT) as the sum of investments in the followingsectors: communications, computer related, other electronics related, biotechnology, med-ical and health related. Low-tech investments (LT) are the investments in the remainingsectors: energy, consumer related, industrial products and services, chemicals, industrialautomation, other manufacturing, transportation, financial and other services, agriculture,and construction. Finally, we define the Early Stage Ratio as the ratio of ES to VC, andthe High-Tech Ratio as the ratio of HT to PE.8 These two ratios form the empiricalcorrespondent of the innovation ratios we defined in the model.
6We do not include in our analysis the US in order to avoid mismeasurement errors. While the USconstitute the world’s largest private equity market, the venture capital data collected by the NationalVenture Capital Association (NVCA) are coded with different definitions than those of the EVCA.
7For details on the EVCA database, and for definitions of variables, see the methodology section ofEVCA (2001).
8 Ideally, we would like to be able to measure the High-Tech Ratio as the ratio of HT to VC. A limitationof the EVCA data is that they do not provide a separate sectoral disaggregation for venture and non-ventureprivate equity.
16ECBWorking Paper Series No. 430January 2005

4.1.2 Independent variables
We then consider our independent variables. Our measure of the funds raised by venturecapital firms is the total amount of funds raised from all sources by a country’s private eq-uity firms in given year.9 We express all values in euros, using the synthetic euro exchangerate of Datastream for the conversion. From Datastream we also download population andprice indices for all countries. We use population to express values in per capita terms,and price indices to obtain constant 2000 values.
Our measure for the incremental exit opportunity is the existence of a stock markettargeted at entrepreneurial companies, since several European countries opened such trad-ing segments within their stock markets during the 1990s (Bottazzi and Da Rin (2002b)).For all European ’New’ stock markets we obtain the date of opening from the respectivestock exchanges.
We then introduce two new variables to this literature: a panel of capital gains taxrates and a panel of measures of barriers to entrepreneurship.
We obtain our measures of capital gains taxation from the Worldwide Corporate TaxGuide, published by Ernst&Young, a leading tax consulting firm. Each year, the Guidereports for over 140 countries the main corporate tax rates, including capital gains. Coun-try information is compiled by Ernst&Young local offices, which ensures high professionalstandards and consistency, both over time and across countries.
Barriers to entrepreneurship might affect innovation ratios if early stage and high-tech investments are particularly sensitive to bureaucratic impediments. We collect ourmeasures of barriers to entrepreneurship from yearly issues of the World CompetitivenessYearbook compiled by IMD, the business school, since 1989. The Yearbook provides 241country-level quantitative and qualitative measures of competitiveness assembled frompublic data and surveys of local business leaders in 60 countries.
From the Yearbook we obtain seven measures of potential barriers to entrepreneurship.These are the following: (1) the extent to which anti-trust laws prevent unfair competition;(2) the extent to which bureaucracy hinders business development; (3) the extent to whichimproper business practices (e.g., corruption) prevail in the public sphere; (4) the extentto which access to foreign capital markets is restricted for domestic companies; (5) theflexibility of hiring and firing practices; (6) the extent to which immigration laws preventthe employment of foreign skills; and (7) the extent to which foreign investors are freeto acquire control of a domestic company. All measures are normalized to lie between 0and 10, with a higher value corresponding to a weaker barrier. We use both the individualmeasures and their unweighted average.
To measure the arrival of entrepreneurial opportunities, we use the amount of publicR&D expenditure. From the OECD Main Science and Technology Indicators database weobtain data on country-level total research and development (R&D) expenditure, businessand government R&D, and R&D in higher-education. In the Appendix we describe the
9Note that while funds invested are recorded according to which countries they go into (the ’country ofdestination’ criterion), funds raised are recorded by the country where the venture firm is based (the ’coun-try of management criterion,’ see EVCA (2001)). Baygan and Freudenberg (2000) discuss the importanceof cross-border capital flows, which in Europe–while increasing over time–remains relatively small.
17ECB
Working Paper Series No. 430January 2005

perpetual inventory methodology we use to derive from these data the stock of publicR&D for each country and year.
The following are formal definitions for all the variables we use in the analysis:
• PRIVATE EQUITY (PE it) is the amount of funds invested in private equity incountry i at year t. It includes both venture capital and non-venture private equityinvestments.
• VENTURE CAPITAL (VC it) is the amount of funds invested in venture privateequity in country i at year t.
• EARLY STAGE (ES it) is the amount of funds invested in early stage venture privateequity in country i at year t.
• HIGH-TECH (HT it) is the amount of funds invested in high-tech private equity incountry i at year t.
• ES-RATIO (ESRit)is the ratio of ES it toVC it .
• HT-RATIO (HTRit)is the ratio of HT it toPE it .
• SUPPLY OF FUNDS (SF it) is the amount of funds raised by the private equityindustry in country i in year t. It is normalized by the country’s population in yeart.
• NEWMARKET (NM it) is a dummy that takes value 1 if a ’New Market’ is availablefor firms to list in country i at year t.
• CAPITAL GAINS TAX RATE (CGT it) is the capital gains tax rate in country i atyear t.
• BARRIERS (BARRit) is the value of our synthetic measure of the barriers to en-trepreneurship in country i at year t.
• BARRIER (BARR—J it) is the value of each measure of the barriers to entrepre-neurship in country i at year t, where J=AT (anti-trust laws), BUR (bureaucracy),COR (corruption and improper business practices), FCM (access to foreign capitalmarkets), HF (flexibility of hiring and firing practices), IMM (immigration laws),FAQ (feasibility of foreign acquisitions)
• PUBLIC R&D STOCK (RD it) is the stock of public and academic expenditure inR&D in country i in year t. It is normalized by the country’s population in year t.In the Appendix we describe the methodology we use to build RD it .
18ECBWorking Paper Series No. 430January 2005

4.2 Empirical strategy
The innovation ratios form the cornerstone of our analysis. The first reason for this is thatwe are interested not in the size of venture capital markets per se, but in the extent towhich increasing the size of venture capital markets translates proportionately more intoearly stage and high-tech investments. The ratios capture precisely this effect.
There are also methodological reasons for our emphasis on ratios. As it is well known(see Hellmann (1998)) estimating a structural model of demand and supply is made veryproblematic by both the unobservability of the rate of return on venture capital invest-ments and the difficulty to convincingly identify observable variables which affect onlydemand or only supply. For this reason most previous studies chose to estimate reducedform equations where the level of venture capital investment is regressed against a set of(typically time invariant) observable factors which in general are expected to affect bothsupply and demand. This estimation strategy, however, is likely to suffer from seriousomitted variable problems.
Our panel estimation methodology allows us to disregard country-specific and time-invariant factors. However, it does not protect us from the effects of unobservable time-varying factors. Since our panel is relatively long (fourteen years), and contains a periodwhen several economic reforms have been implemented, we run the risk that some timevarying policy variables which affect the level of venture capital investing–like general re-forms in product or factor markets–may have changed considerably. Our focus on ratiosminimizes this mispecification risk, since it allows to omit time-varying country-specificexplanatory variables to the extent that they equally affect the numerator and the denom-inator of the innovation ratios.
More generally our approach exploits the time-series dimension (’within’ estimates) ofour data, and asks which genuinely time-varying factors are responsible for the evolutionof the innovation ratios, and thus for the development of active venture capital markets.We then use country fixed effects to identify time-invariant factors such as the industrialspecialization of individual countries.
Our model suggests that an increase in the innovation ratios could be achieved in twoways. First, by increasing projects’ expected return, and second, if there is no excess supplyof monitoring capital, by channeling more funds towards the private equity industry. Weaddress the empirical relevance of these two channels by estimating several versions of thefollowing panel data equation:
yit = x0itβ + y
0dt + εit (7)
εit = ηi + νit (8)
where yit denotes either the early stage or the high-tech ratio, and xit is a vector oftime varying country specific characteristics including the supply of funds (SF it), thelevel of the capital gains tax rate (CGT it), the barriers to entrepreneurship (BARRit andBARR-J it), the availability of a ’New’ stock market (NM it), and the stock of public R&D(RD it). As discussed in Sections 3.2 and 3.3, the first variable is expected to be positively
19ECB
Working Paper Series No. 430January 2005

signed only if there is no excess supply of informed capital; the other four variables shouldaffect our ratios through projects’ expected return–the second negatively and the lastthree positively. To control for common aggregate effects we also include a full set of timedummies, where dt is a T×1 vector with 1 in the t-th position and 0 otherwise. Finally, wemodel the error term, εit as the sum of an individual country’s heterogeneity component,ηi and an idiosyncratic error term, νit.
We recover estimates of the parameters of interest by applying the so-called within-group estimator. This estimation method allows individual (country) heterogeneity to becorrelated with the observable components of the model. As we have noticed, this is partic-ularly important in our case since there are country specific time invariant unobservablevariables that are potentially correlated with some of the regressors. On the other hand,the identification of structural effects through regression coefficients in deviations fromcountry-specific means depends on the lack of correlation between the regressors and theidiosyncratic error term at all leads and lags. This strict exogeneity assumption rules outthe possibility that current values of some of the variables in the x vector are influencedby past idiosyncratic errors.
In our context, this does not seem an unrealistic assumption, since a transitory shockto the innovation ratios is unlikely to affect present and future institutional decisions oncapital gains taxation, on public R&D expenditures, on the regulation of business activity,or on the opening of a local ’New’ stock market.10 Notice also that, in order to respectthe requirement of strict exogeneity of the regressors, we normalize RD it and SF it bypopulation and not by GDP, which is the measure of country size typically used in theliterature. Finally, the strict exogeneity requirement is also the reason why we employpublic R&D rather than business (or total) R&D expenditure.
4.3 Descriptive statistics
We start exploring our data by looking at the facts which motivate our analysis. Table1 shows descriptive statistics for our main variables. It should be noted that less than aquarter of venture capital investment goes to early stage projects, and less than a third ofthe total private equity investment is in high-tech projects.
Two Figures look at the evolution over time for the aggregate of the 14 countries weconsider. Figure 3 plots the two private equity ratios, and Figure 4 the total supply offunds into private equity. What stands out is the sharp upturn in the supply of fundsstarting in 1996 and its equally sharp fall since 2001, which is mirrored in the sharp dropin all the two private equity ratios. At first sight, this evidence suggests that the supplyof funds may in fact pose a binding constraint on investment.
For each country, Figure 5 then reports 3-year moving averages of the innovationsratios, which provide further evidence of the pattern shown by Figure 3. For both innova-tion ratios, we notice some variability across countries. While such cross-country variability
10 In particular, the creation of ’New’ stock markets started in 1997 and was completed by 1999 in mostcountries. As our descriptive statistics below make clear, this should dispel concerns for endogeneity, sincethe opening of these markets predates the increase in supply of venture capital which took place startingfrom 1998.
20ECBWorking Paper Series No. 430January 2005

naturally asks for an explanation, this would require suitable data to identify the deter-minants of variations between countries. Given the difficulty to identify, and even moreobtain, such variables, we prefer to explore the time dimension of the data and control forcountry-specific factors by using time-invariant country-level effects.
Overall, these Figures provide evidence of a positive relationship over time between thesupply of private equity funds and the early stage and high-tech ratios. Whether this visualevidence can be given a structural interpretation is a task we pick up in our regressions.
5 Regression results
5.1 Main results
Results from the estimation of our basic specification for equation (7) are presented inTables 2 and 3. Each Table refers to a specific ratio, and reports estimated coefficientstogether with the corresponding standard errors. In each Table three sets of estimates arereported which include one of our three chosen measures of the barriers to entrepreneur-ship. We first use our summary measure (the average value of our seven measures). Wethen run the basic specification with each measure in turn, but we report only the twowhich turns out to be significant.
Notice that, since (unreported) time dummies are included in all equations, our esti-mates genuinely pick the effects of changes in our explanatory variables. For example, theeffects of the availability of a ’New’ stock market targeted at entrepreneurial companiesare captured beyond what one might fear is a common cyclical trend.
Our main results can be summarized as follow. We find convincing evidence that threetypes of policy have an important effect on the innovation ratios: the opening of ’New’ stockmarkets, the taxation of capital gains, and the reduction of barriers to entrepreneurship.First, the coefficients of the capital gains tax have a negative effect on the ratios which ishighly statistically significant in all specifications. The economic effect is however small:moving the capital gains tax rate from the lower tail (5th percentile ) to its higher tail(95th percentile) raises the high-tech ratio by about 0.003 (or 1%) and the early stageratio by about 0.001 (or 0.5%).
The intuition behind this result is that an increase in the rate of return on ventureinvestment (Rvc) makes it possible for companies with high collateral to obtain financefrom uninformed investors. thus freeing up venture capital (monitored) funds for earlystage and high-tech companies. This result corroborates that by Gompers and Lerner(1998), who looked at U.S. data. However, their finding was based on a panel of U.S.state-level data, where the variation in capital gains tax rates is very small; therefore theymainly relied on a short time-series of federal-level variations in capital gains taxation.Our data provide a more comforting setting for a panel analysis.
Second, we also find the opening of a ’New’ market to have a positive and significanteffect on both the early stage and the high-tech ratios. The economic effect in this case isalso noticeable, as the opening of a ’New’ market raises the high-tech ratio by about 10%and the early stage ratio by nearly 9%. This is consistent with the model’s predictions if
21ECB
Working Paper Series No. 430January 2005

IPOs provide larger capital gains than acquisitions or a ’trade sales’–a fact documentedby Brau, Francis and Kohers (2002) and Gompers and Lerner (1997).
It also suggests a more sobering approach to the critiques of the recent experience ofthe ’New’ stock markets, which often focus on the issue of losses to individual investors.Our results provide a different perspective.
Third, the average indicator of reduction of the barriers to entrepreneurship turnsout to be positive but not statistically significant at conventional levels. However, thereduction of two of the barriers have a positive and significant effect on the high-techratio. This effect is also economically very large. Moving either the hiring and firing or theimmigration laws measure from their 5th to its 95th percentile raises the high-tech ratioby between 0.190 and 0.240 (or 65% to 80%). This result is particularly telling, since it isarguable that lower barriers to the hiring of foreign skills are particularly important forhigh-technology companies. Also the reduction in hiring and firing barriers is likely to berelevant for these companies. Notice that the early stage ratio is unaffected by these policymeasures. Our interpretation is that early stage companies are less dependent on skilledworkers than high-tech ones, and that they are likely–almost by definition–to have alow level of employment, and so be exempt from many hiring and firing restrictions.Noticealso that many high-tech companies in our sample are not early stage, and many earlystage companies are not high-tech–dispelling the seeming contradiction of the results onthe effects of the barriers to entrepreneurship on the two innovation ratios.
Fourth, in all reported equations the supply of funds variables are never statisticallydifferent from zero. This holds for both innovation ratios; it is also robust to severalalternative definitions and time/country stability assumptions, which we describe in thenext section. Therefore we do not find evidence supporting the ’no excess supply’ of venturecapital hypothesis in Europe during our sample period.
Finally, the stock of public R&D capital is also found to have a negligible, statisticallyinsignificant, effect on the innovation ratios.11 This suggests that increasing public R&Ddoes not result in a higher return of entrepreneurial ventures.
5.2 Extentions and robustness checks
In this Section we extend our results, especially by delving more deeply into the lack ofevidence for a role of the supply of funds, and address several methodological concerns.First of all, we explore different definitions of the supply of funds, and report our mainextensions in Tables 4 and 5. Columns (i), (iv), and (vii) of both Tables take care ofthe well known fact that the funds raised by venture capital companies in one particularyear are not necessarily invested in the same year (Gompers and Lerner(2000)). This maysuggest that our baseline static model suffers from a dynamic misspecification problem. Toaddress this additional concern we rerun all our equations after including the once laggedvariable, SFit−1 to the original specification. While we lose some observations due to theuse of a lagged variable, this does not alter significantly our overall results.
11As a check on the robustness of this result, we also use the stock of total R&D, which includes private(business) R&D, despite the fact that it clearly fails the strict exogeneity requirement.
22ECBWorking Paper Series No. 430January 2005

A second extension is suggested by the fact that the ’bubble years’ of the late 1990smight affect the significance of the effect of the supply of funds. Our results in Tables 1and 2 might therefore suffer from pooling together two different regimes. Columns (ii),(v), and (viii) of Tables 3 and 4 report our results, where we identify the ’bubble’ yearswith 1997 through 2000. We find no evidence of a different role of the supply of funds inthe two periods.
Another possibility we wish to examine is that different countries may experience adifferent effect of the supply of funds depending on their stage of development. Arguably,countries where venture capital markets are less developed may also experience a lackof professional expertise which might have an adverse effect on the innovation ratios.Columns (iii), (vi), and (ix) of Tables 3 and 4 report our results on this issue. What wedo here is to allow for a different effect of the supply of funds depending on the fact that aparticular venture capital market is ’developed’ or not–where we define ’developed’ to bea country with a (per capita) supply of funds higher than the median at the start of ourpanel (1988).12 With these equations we want to explore the possibility that evidence infavour of the ’no excess supply’ of venture capital hypothesis is more likely to be found incountries with a less mature venture capital industry. One readily sees that this extensionhas no material effect on our estimates.13
We then turn to several possible methodological concerns, for which we estimate, butdo not report, additional variations of our basic specification.
First, our findings might not be robust to alternative definitions for some of the inno-vation ratios. In particular, it might be argued that the replacement capital componentshould be excluded from the pure venture capital activity. This, in turn, would alter thedenominator of the early stage to venture capital ratio, ESR. To address this legitimateconcern we rerun all our reported equations after redefining the relevant ratios. Our find-ings are virtually unaltered. We also check the robustness of our results when the supplyof funds variable include realized capital gains, and find comforting evidence.
The same occurs if we disaggregate the effects of different sources of funds to single outthe funds supplied by institutional investors and by the government.14 It can be arguedthat these two categories may have different goals than other investors, and thereforeinstruct venture fund managers to comply with different objectives (see Mayers, Schoors,and Yafeh (2002)). In particular, institutional investors have a longer run perspective thanothers, and the government may also be more interested in the creation of long-run growthopportunities than the sheer maximization of profits. However, when we separate thesetwo categories from the total supply of funds, we do not find any significant changes, andthe significance of these two new variables is far from any acceptable level.
An important assumption in our analysis so far has been that the presence of a New
12The countries which turn out to have a relatively less mature venture capital equity industry (in 1988)are Austria, Belgium, Finland, Germany, Greece, Italy, Portugal and Spain.13 In unreported regressions, we also check that this results does not change if we allow a country to
switch between ’developed’ and ’not developed’ each year.14The EVCA data breaks the sources of funds into the following categories: realized capital gains,
corporations, individuals, government agencies, banks, pension funds, insurance companies, funds of funds,academic institutions, capital markets.
23ECB
Working Paper Series No. 430January 2005
stock market is by itself sufficient to affect the innovation ratios–i.e., that investors arealways willing to buy shares of companies which go public. However, it is well know thatthe markets for Initial Public Offerings (IPOs) experience cycles which bring them overwaves of ’hot’ or ’cold’ investor appetite. In other words, the availability of an institutionmay by itself not be enough. To explore this possibility we introduce in the analysis apanel of stock market indices. For each country, we obtain from Datastream the yearlyaverage of the MSCI (Morgan Stanley Capital International) stock market index for themain stock market. We take the MSCI index to be a measure of investors’ appetite forstocks. Notice that we employ the MSCI index for the main market rather than for any’New’ market–or the number of IPOs in the current or previous year–in order to abide bythe strict exogeneity condition. We then estimate a set of equations where we include theMSCI index as an explanatory variable. We introduce this variable both with an additiveand a multiplicative term. In either case, it turns out that this variable is not significant,and in particular that it does not affect the magnitude or significance of the coefficient forthe New markets.
We also explore in our context the result of Gompers and Lerner (1998) on the role ofpension funds. They show that the clarification of the ’prudent man rule’ in the contextof the Employment Retirement Income Security Act brought to a surge of pension fundinvestments in venture capital. To date, pension funds remain the largest single source ofventure capital in the U.S. (NVCA (2003)). Several countries in Europe began reformingthe structure of their social security system from pay-as-you-go to funded in the 1990s.As a consequence, the financial assets of pension funds have increased. This may have asubstantial impact on the funding of venture capital, if pension funds are allowed to investin it. In EU member states the dominant principle governing asset allocation of pensionfunds is the prudent man rule. Thus these institutions are allowed to invest in venturecapital, as long as adequate diversification is maintained. Member states are allowed toimpose quantitative limits to investments and several do regulate portfolio shares allocatedto closed funds. We then isolate the supply of venture capital which comes from pensionfunds. We find no evidence of a distinct role of pension funds in our data.
An important concern is that the real bottleneck is not money but people. Michelacciand Suarez (2004) do stress the human factor in financial intermediation, whose empiricalimportance is documented in Bottazzi, Da Rin, and Hellmann (2004). To address thisissue, we construct a variable consisting, for each country and year, of the number ofventure capital firms which are members of the European Venture Capital Association.We then use this variable in alternative to the supply of funds. The resulting estimatesconfirm our main results by not showing any sign of a shortage.
One specific concern can be raised in relation to the Early Stage Ratio. It is well knownthat venture-backed companies typically receive staged financing (Gompers (1995)). Thismeans that the company will receive funds over several rounds across a few years. Sincethe company would then progressively mature from the seed or start-up stages to laterstage deals there is clear suspicion that the figures for late stage financing simply reflect’life-cycle’ effects and not investment decisions by the venture capitalists. We can controlfor this important observation by including in our regressions for the ES Ratio the laggedvalue of the absolute amount of early stage investments. We are comforted by noticing
24ECBWorking Paper Series No. 430January 2005
that our results are unchanged.

Finally, one could be concerned that our results are driven by a single country. Wecan easily discard this possibility by re-running our regressions excluding one country at atime. Overall, therefore, our results appear to be consistently robust to a variety of checks.
6 Conclusion
In this paper we use a panel data analysis to study how public policy can contribute to thecreation of active venture capital markets. We base our analysis on a simple extension ofthe seminal model of Holstron and Tirole (1997), which allows us to formalize the notionof ’innovation ratios’ and explore the possibility of excess supply of venture capital. Theresults we obtain from a panel of European country-level data over 1988-2001 provide newinsights on the effects of alternative policies.
The prevailing policy approach does not receive support from the data. Our resultscast more than a passing doubt on the attempt to increase the share of early stage andhigh-tech venture investments by channeling more funds into venture capital markets,consistent with a ’money chasing deals’ situation (Gompers and Lerner (2000)).
Rather, we find that policies aimed at increasing the expected return of projects aremore succeful in altering the composition of venture capital markets towards projects withless collateral, namely early stage projects and projects in high-tech industries. The avail-ability of stock markets targeted at entrepreneurial companies–which provide a lucrativeexit channel–and a decrease in capital gains taxation both raise the share of early stageand high-tech investments. Interestingly, we find that a reduction in some barriers to en-trepreneurship leads to a large increase in the high-tech ratio. By contrast, the stock ofpublic R&D holds no effect on the innovation ratios.
These results also suggest a novel interpretation of the ’European Paradox’ (EuropeanCommission (1994))–the fact that Europe suffers from an inability to turn scientific com-petence into successful ventures. In the light of our findings, the Paradox seems to be duenot to a lack of funding or of attractive technological opportunities, but rather to thebarriers to create new companies and make large profits from them, consistent with recentmodels of entrepreneurship (e.g., Gromb and Scharfstein (2002)).
Our findings also have implications for policy-makers in countries with emerging ven-ture capital markets, where the impact of policy early in their development might beparticularly important. Even if they reflect the European experience, we believe our re-sults have a clear message: sensible policy should consider a wider set of policies thansimply channeling more funds into venture capital.
While we cannot offer a conclusive cost-benefit analysis of alternative policies, we hopeour study of the benefits of a comprehensive set of them may nonetheless offer a valuablecontribution to policy evaluation.
25ECB
Working Paper Series No. 430January 2005

References
[1] Alesina, Alberto, Silvia Ardagna, Giuseppe Nicoletti, and Fabio Schiantarelli (2003)’Regulation and Investment,’ NBER WP n.9560.
[2] Armour, John, and Douglas Cumming (2003) ’The Legal Road to Replicating SiliconValley,’ mimeo.
[3] Avnimemelech, Gil, and Morris Teubal (2002) ’Israel’s Venture Capital Industry:Emergence, Operation and Impact,’ in David Citendamar (ed.) The Growth of Ven-ture Capital: A Cross Cultural Analysis, Westport, Praeger.
[4] Baygan, Gunseli and Michael Freudenberg (2000) ’The Internationalisation of Ven-ture Capital Activity in OECD Countries: Implications for Measurement and Policy,’OECD-STI Working Paper n.7.
[5] Black, Bernard, and Ronald Gilson (1998) ’Venture Capital and the Structure ofFinancial Markets: Banks versus Stock Markets,’ Journal of Financial Economics,47 (1), 243—77.
[6] Bottazzi, Laura, and Marco Da Rin (2002a) ’Venture Capital in Europe: Euro.nmand the Financing of European Innovative Firms,’ Economic Policy, 17 (1), 229—69.
[7] Bottazzi, Laura, and Marco Da Rin (2002b) ’Europe’s ’New’ Stock Markets,’ CEPRDiscussion Paper n. 3521.
[8] Bottazzi, Laura, and Marco Da Rin (2004) ’Financing European EntrepreneurialFirms: Facts, Issues and Research Agenda’ forthcoming in Christian Keuschnigg andVesa Kanniainen (eds.) Venture Capital, Entrepreneurship and Public Policy, Cam-bridge, MA, MIT Press.
[9] Bottazzi, Laura, Marco Da Rin, and Francesco Giavazzi (2003) ’Research, Patents,and the Financing of Ideas: Why is the EU Growth Potential so Low?’ in André Sapirand Mario Nava (eds) Economic Policy-Making in the European Union, Brussels,European Commission.
[10] Bottazzi, Laura, Marco Da Rin, and Thomas Hellmann (2004) ’Active Financial In-termediation: Evidence on the Role of Organizational Specialization and Human Cap-ital,’ RICAFE WP n.12.
[11] Brau, James, Bill Francis and Ninon Kohers (2003) ‘The Choice of IPO versusTakeover: Empirical Evidence,’ Journal of Business, 76 (4), 583—612.
[12] Carter, Lawrence, Teresa Barger, and Irving Kuczynski (1996) ’Investment Funds inEmerging Markets,’ Washington, D.C., International Finance Corporation.
[13] Casamatta, Catherine, Financing and Advising: Optimal Financial Contracts withVenture Capitalists (2003), Journal of Finance, 58, 5, 2059-20.
26ECBWorking Paper Series No. 430January 2005
[14] Danish Growth Fund (2003) ’Vaekstfonden: Background and Overview,’ mimeo,Copenhagen.
[15] European Commission (1994) European Report on Science and Technology Indica-tors, EUR 15897, Brussels.
[16] European Commission (1998) Risk Capital: A Key to Job Creation in the EuropeanUnion, COMM(1998)522, Brussels.
[17] European Commission (2002) More Research for Europe: Towards 3% of GDP,COMM(2002)499, Brussels.
[18] European Commission (2003) Communication on the Implemenation of the Risk Cap-ital Action Plan, COMM(2003)654, Brussels.
[19] European Investment Fund (2002) ’Annual Report 2001,’ Luxembourg.
[20] EVCA - European Venture Capital Association (2001) ’2001 Yearbook’, Zaventem.
[21] EVCA - European Venture Capital Association (2003) ’Benchmarking European Taxand Legal Environments,’ Benchmarking Paper, Zaventem.
[22] French Ministry of Industry (2003) ’Plan Innovation,’ Paris.
[23] Gans, Joshua, and Scott Stern (2003) ’When does Funding Research from SmallerFirms Bring Fruit? Evidence from the SBIR Programme,’ Economics of Innovationand New Technology 12 (4), 361—384.
[24] German Federal Ministry of Economy and Techonology (1999) ’Innovation and Jobs,’Bonn.
[25] Gilson, Ronald (2003) ’Engineering an Venture Capital Market: Lessons from theAmerican Experience,’ Stanford Law Review 55 (4), 1067-1104.
[26] Gompers, Paul (1994) ’The Rise and Fall of Venture Capital,’ Business and EconomicHistory, 23 (2), 1—26.
[27] Gompers, Paul (1995) ’Optimal Investment, Monitoring, and the Staging of VentureCapital,’ Journal of Finance, 50 (4), 1461—90.
[28] Gompers, Paul, and Josh Lerner (1997) ’Risk and Reward in Private Equity Invest-ments: The Challenge of Performance Assessment,’ Journal of Private Equity 1 (2),5—12.
[29] Gompers, Paul, and Josh Lerner (1998) ’What Drives Venture Capital Foundraising?,’Brookings Papers on Economic Activity -Microeconomics, 149—92.
[30] Gompers, Paul, and Josh Lerner (2000) ’Money chasing deals? The impact of fundinflows on private equity valuations,’ Journal of Financial Economics, 55 (1), 281—325.
27ECB
Working Paper Series No. 430January 2005

[31] Gromb, Denis, and David Scharfstein (2002) ’Entrepreneurship in Equilibrium’ CEPRDP 3652.
[32] Hellman, Thomas (1998) ’Comment on ’What Drives Venture Capital Fundraising?’Brookings Papers on Economic Activity - Microeconomics, 1998, 197-203.
[33] Hellmann, Thomas, and Manju Puri (2000) ’The Interaction between Product Marketand Financing Strategy: The Role of Venture Capital,’ Review of Financial Studies,13 (4), 959—84.
[34] Hellmann, Thomas, and Manju Puri (2002) ’Venture Capital and the Professionaliza-tion of Start-up Firms: Empirical Evidence,’ Journal of Finance, 57 (1), 169—97.
[35] HM Treausury (2003) ’Bridging the Finance Gap: A Consultation on Improving Ac-cess to Growth Capital for Small Businesses,’ London.
[36] Hirukawa, Masayuki, and Masako Ueda (2003) ’Venture Capital and Productivity,’mimeo, University of Wisconsin-Madison.
[37] Holmstrom, Bengt, and Jean Tirole (1997) ’Financial Intermediation, LoanableFunds, and the Real Sector,’ Quarterly Journal of Economics, 112 (3) 663—691.
[38] Inderst, Roman, and Holger Müller (2004) ’The Effects of Capital Market Charac-teristics on the Value of Start-up Firms,’ Journal of Financial Economics, 72 (2),319—56.
[39] Jeng, Leslie, and Philippe Wells (2000) ’The Determinants of Venture Capital Fund-ing: Evidence Across Countries,’Journal of Corporate Finance, 6 (1), 241—89.
[40] Kaplan, Steven, and Jeremy Stein (1993) ’ The evolution of buyout pricing and fi-nancial structure in the 1980s,’ Quarterly Journal of Economics, 108 (1), 313—358.
[41] Keuschnigg, Christian (2004) ’Taxation of a Venture Capitalist with a Portfolio ofFirms,’ Oxford Economic Papers 56 (1), 285—306.
[42] Keuschnigg, Christian, and Soren Bo Nielsen (2001) ’Public Policy for Venture Cap-ital,’International Tax and Public Finance, 8 (4), 557—72.
[43] Keuschnigg, Christian, and Soren Bo Nielsen (2003) ’Tax Policy, Venture Capital,and Entrepreneurship,’ Journal of Public Economics, 87 (1), 175—203.
[44] Keuschnigg, Christian, and Soren Bo Nielsen (2004) ’Start-ups, Venture Capitalits,and the Capital Gains Tax,’ Journal of Public Economics, 88 (5), 1011—1042.
[45] Klapper, Leora, Luc Laeven, and Raghuram Rajan (2004) ’Business Environment andFirm Entry: Evidence from International Data,’ NBER WP n.10380.
[46] Kortum, Samuel, and Josh Lerner (2000) ’Assessing the Contribution of VentureCapital to Innovation, Rand Journal, 31 (4), 674—692.
28ECBWorking Paper Series No. 430January 2005

[47] Lerner, Josh (1994) ’Venture Capitalists and the Decision to go Public,’ Journal ofFinancial Economics, 35 (1), 293—316.
[48] Lerner, Josh (1995) ’Venture Capitalists and the Oversight of Private Firms,’ Journalof Finance, 50 (1), 301—18.
[49] Lerner, Josh (1999) ’The Government as a Venture Capitalist: The Long-run Impactof the SBIR Program,’ Journal of Business, 72 (3), 285—318.
[50] Lerner, Josh, and Antoinette Schoar (2004) ’Does Legal Enforcement Affect FinancialTransactions? The Contractual Channel in Private Equity,’ forthcoming in QuarterlyJournal of Economics.
[51] Lindsey, Laura (2003) ’The Venture Capital Keiretsu Effect: An Empirical Analysisof Strategic Alliances among Portfolio Firms,’ mimeo, Stanford University.
[52] Megginson, William (2004) ’Towards a Global Model of Venture Capital?’ Journal ofApplied Corporate Finance, 17 (1), 8—26.
[53] Mayer, Colin, Koen Schoors, and Yishay Yafeh (2002) ’Sources of Funds and Invest-ment Activities of Venture Capital Funds: Evidence from Germany, Israel, Japan, andthe UK,’ forthcoming in Journal of Corporate Finance.
[54] Michelacci, Claudio, and Javier Suarez (2004) ’Business Creation and the Stock Mar-ket,’ Review of Economic Studies, 71 (2), 459—81.
[55] Nelson, Richard, and Paul Romer (1996) ’Science, Economic Growth, and Public Pol-icy,’ in Bruce Smith and Claude Barfield (eds.) Technology, R&D, and the Economy,Washington, DC, Brookings Institution.
[56] National Venture Capital Association (2003) The 2003 Yearbook, Arlington.
[57] Nicoletti, Giuseppe, and Stefano Scarpetta (2003) ’Regulation, Productivity, andGrowth: OECD Evidence,’ OECD Economics WP n.347.
[58] OECD (2001) Drivers of Growth, Paris.
[59] Poterba, James (1989a) ’Venture Capital and Capital Gains Taxation’ in Larry Sum-mers (ed.) Tax Policy and the Economy, Cambridge, MIT Press, 47—67.
[60] Poterba, James (1989b) ’Capital Gains Tax policy Toward Entrepreneurship’ NationalTax Journal, 42 (3), 375—90.
[61] Repullo, Rafael, and Javier Suarez (2004) ’Venture Capital Finance: A Security DesignApproach,’ The Review of Finance, 8 (1), 75—108.
[62] Scarpetta, Stefano, Phillip Hemmings, Thierry Tressel, and Jaejoon Woo (2002) ’TheRole of Policy and Institutions for Productivity and Firm Dynamis: Evidence fromMicro and Industry Data,’ OECD Economics WP n.329.
29ECB
Working Paper Series No. 430January 2005

[63] Schindele, Ibolya (2003) ’Advice and Monitoring: Venture Financing with MultipleTasks,’ mimeo, Amsterdam University.
[64] Schmidt, Klaus (2003) ’Convertible Securities and Venture Capital Finance,’ Journalof Finance, 58 (3), 1139—66.
30ECBWorking Paper Series No. 430January 2005
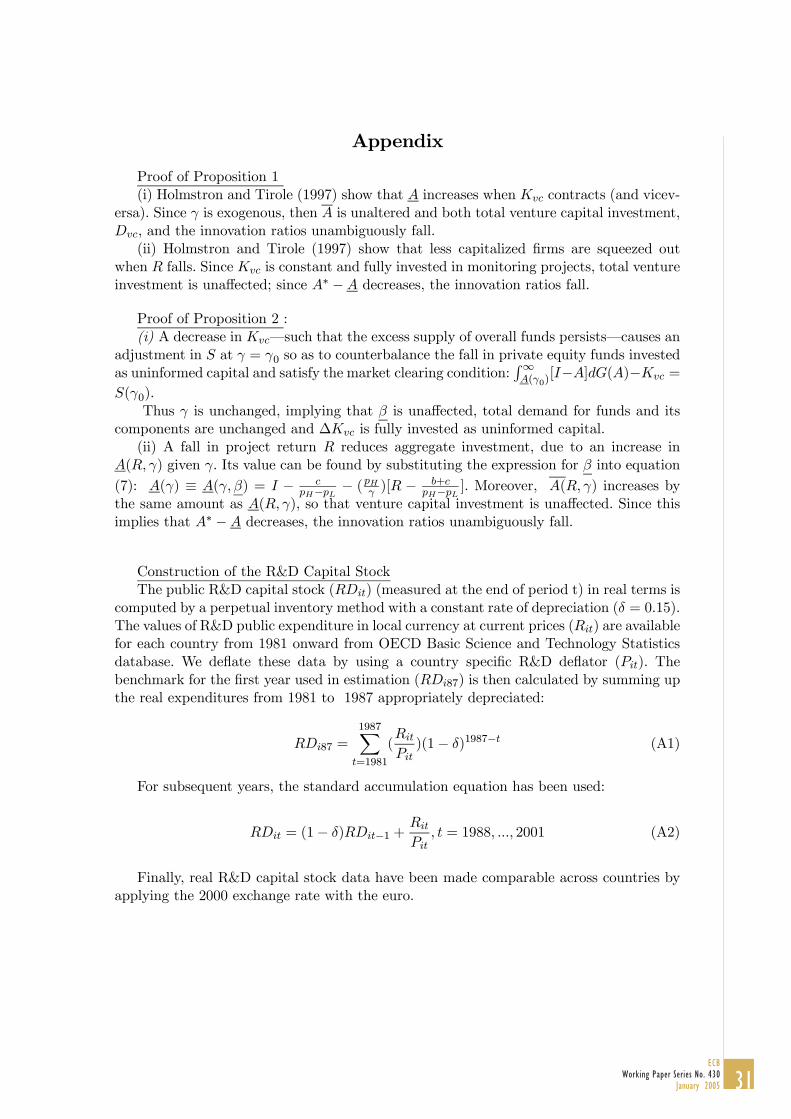
Appendix
Proof of Proposition 1(i) Holmstron and Tirole (1997) show that A increases when Kvc contracts (and vicev-
ersa). Since γ is exogenous, then A is unaltered and both total venture capital investment,Dvc, and the innovation ratios unambiguously fall.
(ii) Holmstron and Tirole (1997) show that less capitalized firms are squeezed outwhen R falls. Since Kvc is constant and fully invested in monitoring projects, total ventureinvestment is unaffected; since A∗ −A decreases, the innovation ratios fall.
Proof of Proposition 2 :(i) A decrease in Kvc–such that the excess supply of overall funds persists–causes an
adjustment in S at γ = γ0 so as to counterbalance the fall in private equity funds investedas uninformed capital and satisfy the market clearing condition:
R∞A(γ0)
[I−A]dG(A)−Kvc =
S(γ0).Thus γ is unchanged, implying that β is unaffected, total demand for funds and its
components are unchanged and ∆Kvc is fully invested as uninformed capital.(ii) A fall in project return R reduces aggregate investment, due to an increase in
A(R, γ) given γ. Its value can be found by substituting the expression for β into equation(7): A(γ) ≡ A(γ, β) = I − c
pH−pL − (pHγ )[R −
b+cpH−pL ]. Moreover, A(R, γ) increases by
the same amount as A(R, γ), so that venture capital investment is unaffected. Since thisimplies that A∗ −A decreases, the innovation ratios unambiguously fall.
Construction of the R&D Capital StockThe public R&D capital stock (RDit) (measured at the end of period t) in real terms is
computed by a perpetual inventory method with a constant rate of depreciation (δ = 0.15).The values of R&D public expenditure in local currency at current prices (Rit) are availablefor each country from 1981 onward from OECD Basic Science and Technology Statisticsdatabase. We deflate these data by using a country specific R&D deflator (Pit). Thebenchmark for the first year used in estimation (RDi87) is then calculated by summing upthe real expenditures from 1981 to 1987 appropriately depreciated:
RDi87 =1987X
t=1981
(Rit
Pit)(1− δ)1987−t (A1)
For subsequent years, the standard accumulation equation has been used:
RDit = (1− δ)RDit−1 +Rit
Pit, t = 1988, ..., 2001 (A2)
Finally, real R&D capital stock data have been made comparable across countries byapplying the 2000 exchange rate with the euro.
31ECB
Working Paper Series No. 430January 2005

Figure 1
This figure shows the equilibrium in financial markets when the supply of funds to venture capital is fully invested in monitored finance. A represents firm equity capital, γ is the rate of return to uninformed
financing, β is the rate of return to venture capital, R is the return on investments, Dvc and Kvc are the demand and supply of venture capital, S is the supply of uninformed capital.
Panel (a). Firms’ financing choice as a function of their equity capital, A.
0 A(γ0, β0, R0) A* Ā(γ0, R0) A Venture Capital Uninformed Investors Panel (b). Equilibrium in the venture capital market when Kvc is fully invested in monitored finance.
β β0 β Dvc(β, γ0, R0) 0 Kvc
Panel (c). Financial market equilibrium when S(γ) is infinitely elastic at γ0.
γ γo S(γ) + Kvc Du(γ) + Dvc(β0, γ, R0) 0 S+K
32ECBWorking Paper Series No. 430January 2005

Panel (d). A reduction in Kvc is associated with an increase in β and a reduction in aggregate investment. Moreover the innovation ratios fall because A increases with constant Ā. This brings about a reduction in the innovation ratios.
0 A(γ0, β0, R0) A(γ0, β1, R0) A* Ā(γ0, R0) β γ K’vc Kvc Du(γ)+Dvc(γ,β0) β1 β0 Dvc(γ0, β, R0) γ0 S(γ)+ Kvc β1 Du(γ)+Dvc(γ,β1 )
Panel (e). A reduction in R causes an increase in both A and Ā, a reduction in β1 and an associated reduction in the innovation ratio.
0 A(γ0, β0, R0) A(γ0, β1, R1) A* Ā(γ0, R0) Ā(γ0, R1) Kvc Du(γ, R0)+Dvc(γ, β0,R0 ) β0 β1 Dvc(γ0, β, R0) γ0 S(γ)+ Kvc β Dvc (γ0, β, R1) Du(γ,R1)+Dvc(γ,β1,R1 )
33ECB
Working Paper Series No. 430January 2005

Figure 2 This figure show the equilibrium in financial markets when there is an excess supply of venture capital funds.
Panel (a). When Kvc falls and the excess supply persists, the allocation of venture capital funds, and therefore the innovation ratios, remain unchanged.
0 A(γ0, β0, R0) A* Ā(γ0, R0) A β γ K’vc Kvc β0 γ0 S(γ)+ Kvc Dvc(γ0, R0) Du(γ0,R0)+Dvc(γ0,β0,R0 )
Panel (b). Effects of a reduction in R.
0 A(γ0, β0, R0) A(γ0, β0, R1) A* Ā(γ0, R0) Ā(γ0, R1) A β γ Kvc Du(γ0, R0)+Dvc (γ0, β0,R0 ) β0 γ0 S(γ)+ Kvc Dvc(γ0, R0) Du(γ0,R1)+Dvc(γ0,β0,R1 ) Dvc(γ0, R1)
34ECBWorking Paper Series No. 430January 2005

Figure 3: Innovation ratios over time
0.000
0.100
0.200
0.300
0.400
0.500
0.600
1988 1990 1992 1994 1996 1998 2000 2002
HT ratio ES ratio
Figure 4: Supply of funds over time
0
0.2
0.4
0.6
0.8
1
1.2
1988 1990 1992 1994 1996 1998 2000 2002
Note: All Ratios are computed for the aggregate of the 14 countries we consider. The ES Ratio isdefined as the ratio of ES t to VC t . The HT Ratio is defined as the ratio of HT t to PEt . TheSupply of Funds is the amount of funds raised by the European private equity industry. It is
normalized by the European population.
35ECB
Working Paper Series No. 430January 2005

Figure 5: Innovation ratios over time by country
Finland
0
0.2
0.4
0.6
0.8
1
88-90 90-92 92-94 94-96 96-98 98-00 00-02
Austria
0
0.2
0.4
0.6
0.8
1
88-90 90-92 92-94 94-96 96-98 98-00 00-02
Belgium
0
0.2
0.4
0.6
0.8
1
88-90 90-92 92-94 94-96 96-98 98-00 00-02
Denmark
0
0.2
0.4
0.6
0.8
1
88-90 90-92 92-94 94-96 96-98 98-00 00-02
France
0
0.2
0.4
0.6
0.8
1
88-90 90-92 92-94 94-96 96-98 98-00 00-02
Germany
0
0.2
0.4
0.6
0.8
1
88-90 90-92 92-94 94-96 96-98 98-00 00-02
Greece
0
0.2
0.4
0.6
0.8
1
95-97 97-99 99-01
Ireland
0
0.2
0.4
0.6
0.8
1
88-90 90-92 92-94 94-96 96-98 98-00 00-02
36ECBWorking Paper Series No. 430January 2005
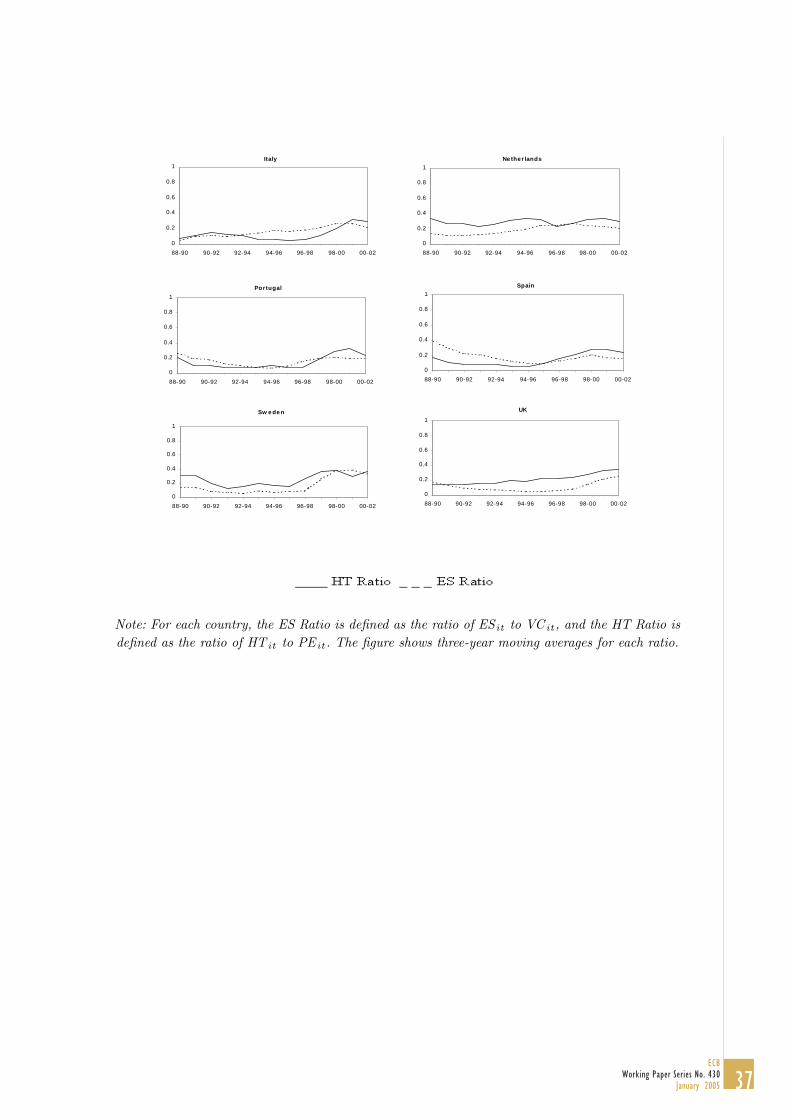
Italy
0
0.2
0.4
0.6
0.8
1
88-90 90-92 92-94 94-96 96-98 98-00 00-02
Ne the r lands
0
0.2
0.4
0.6
0.8
1
88-90 90-92 92-94 94-96 96-98 98-00 00-02
Portugal
0
0.2
0.4
0.6
0.8
1
88-90 90-92 92-94 94-96 96-98 98-00 00-02
Spain
0
0.2
0.4
0.6
0.8
1
88-90 90-92 92-94 94-96 96-98 98-00 00-02
Sw e de n
0
0.2
0.4
0.6
0.8
1
88-90 90-92 92-94 94-96 96-98 98-00 00-02
UK
0
0.2
0.4
0.6
0.8
1
88-90 90-92 92-94 94-96 96-98 98-00 00-02
Note: For each country, the ES Ratio is defined as the ratio of ES it to VC it , and the HT Ratio isdefined as the ratio of HT it to PE it . The figure shows three-year moving averages for each ratio.
37ECB
Working Paper Series No. 430January 2005

Table 1: Aggregate descriptive statistics
Mean Std. Dev. Median 5th Perc. 95th Perc. ObsHigh-tech ratio 0.294 0.205 0.249 0.049 0.686 187Early stage ratio 0.218 0.151 0.187 0.036 0.515 187Capital Gain Tax Rate 0.348 0.060 0.350 0.250 0.450 187Public R&D stock 17.720 12.131 18.191 2.256 37.210 187Supply of Funds 0.296 0.638 0.093 0.002 1.162 187New Market dummy 0.257 — — — — 187Barriers to Entrepreneurship 6.299 0.976 6.353 4.657 7.940 187
Note: High-tech ratio is the ratio of high-tech to total private equity investments. Early stage ratiois the ratio of early stage to total venture investments. The Capital Gain Tax Rate is the rateapplied to short term capital gains. Public R&D Stock is the stock of public expenditure in researchand development per inhabitant, as defined in the Appendix. Supply of Funds is the per capitasupply of funds, measured in millions of year 2000 euros. The New Market dummy equals onefor all country-years for which a ’new market’ is open for companies to list; for this variable theMean column reports the frequency. The measure of Barriers to entrepreneurship is computed asan unweighted average of seven competitiveness indicators reported in the 1989-2002 editions of theWorld Competitiveness Yearbook (1: Competition law is efficient in preventing unfair competition,2: Bureaucracy does not hinder business development, 3: Improper practices such as bribing orcorruption do not prevail in the public sphere, 4: Access to foreign capital markets is not restrictedfor domestic companies, 5: Hiring and firing practises are flexible enough, 6: Immigration laws donot prevent companies from employing foreign skills, 7: Foreign investors are free to acquire controlin a domestic company). Each indicator varies from 0 (very high barrier) to 10 (very low barrier).
38ECBWorking Paper Series No. 430January 2005

Table 2: Estimated Equations for the HT—RATIO (HTRit)
(i) (ii) (iii)NMit 0.104**
(0.046)
0.098**(0.045)
0.102**(0.045)
CGTit —0.014***(0.003)
—0.013***(0.003)
—0.016***(0.003)
RDit —0.001(0.006)
0.001(0.006)
0.001(0.006)
SFit —0.011(0.028)
—0.013(0.027)
—0.021(0.027)
BARRit 0.048(0.036)
BARR−HFit 0.044**(0.019)
BARR− IMMit 0.055**(0.022)
Time dummies included Yes Yes YesF-test on regressors [0.00] [0.00] [0.00]F-test on time dummies [0.03] [0.09] [0.01]F-test on individual effects [0.00] [0.00] [0.00]Number of observations 187 187 187
Note: CGT it denotes the capital gain tax rate in country i at time t. NM it is a dummy variablewhich takes value 1 if a ’New Market’ is available for firms to list in country i at time t and zerootherwise. RD it is the per capita stock of public R&D expenditure in country i at time t, measuredin millions of 2000 euros. SF it is the per capita supply of funds in country i and time t netof capital gains, measured in millions of 2000 euros. BARRit is a barrier indicator computed asan unweighted average of seven indicators, BARR −HF it is the barrier indicator which measureshiring and firing restrictions, BARR − IMM it is the barrier indicator which measures immigrationlaw. Time dummies included in all equations. Standard errors (probability levels) in round (squared)brackets. *, **, and *** denote 0.10, 0.05, and 0.01 significance levels.
39ECB
Working Paper Series No. 430January 2005

Table 3: Estimated Equations for the ES—RATIO (ESRit)
(i) (ii) (iii)NMit 0.088**
(0.035)
0.092**(0.035)
0.091**(0.036)
CGTit —0.005**(0.002)
—0.006***(0.002)
—0.006**(0.003)
RDit 0.003(0.005)
0.003(0.005)
0.003(0.005)
SFit 0.010(0.022)
0.014(0.021)
0.016(0.021)
BARRit —0.029(0.028)
BARR−HFit —0.012(0.015)
BARR− IMMit —0.000(0.017)
Time dummies included Yes Yes YesF-test on regressors [0.00] [0.00] [0.00]F-test on time dummies [0.01] [0.00] [0.00]F-test on individual effects [0.00] [0.00] [0.00]Number of observations 187 187 187
Note: CGT it denotes the capital gain tax rate in country i at time t. NM it is a dummy variablewhich takes value 1 if a ’New Market’ is available for firms to list in country i at time t and zerootherwise. RD it is the per capita stock of public R&D expenditure in country i at time t, measuredin millions of 2000 euros. SFit is the per capita supply of funds in country i and time t netof capital gains, measured in millions of 2000 euros. BARRit is a barrier indicator computed asan unweighted average of seven indicators, BARR −HF it is the barrier indicator which measureshiring and firing restrictions, BARR − IMM it is the barrier indicator which measures immigrationlaw. Time dummies included in all equations. Standard errors (probability levels) in round (squared)brackets. *, **, and *** denote 0.10, 0.05, and 0.01 significance levels.
40ECBWorking Paper Series No. 430January 2005

Table4:AdditionalEstimated
EquationsfortheHT—RATIO
(HTRit)
(i)
(ii)
(iii)
(iv)
(v)
(vi)
(vii)
(viii)
(ix)
NM
it0.090*
(0.046)
0.106**
(0.046)
0.099**
(0.046)
0.085*
(0.045)
0.101**
(0.046)
0.094**
(0.045)
0.088*
(0.046)
0.104**
(0.046)
0.096**
(0.045)
CGTit
—0.014***
(0.003)
—0.014***
(0.003)
—0.013***
(0.003)
—0.012***
(0.003)
—0.013***
(0.003)
—0.012***
(0.003)
—0.015***
(0.003)
—0.016***
(0.003)
—0.016***
(0.003)
RDit
—0.004
(0.006)
—0.001
(0.006)
—0.002
(0.006)
—0.001
(0.006)
0.001
(0.006)
0.001
(0.006)
—0.002
(0.006)
0.001
(0.006)
0.001
(0.006)
SFit
—0.013
(0.039)
—0.017
(0.034)
—0.024
(0.030)
—0.011
(0.038)
—0.020
(0.032)
0.024
(0.029)
—0.022
(0.038)
—0.027
(0.032)
—0.034
(0.028)
SFit−1
0.006
(0.048)
—0.004
(0.048)
0.001
(0.048)
SFit∗B
it0.014
(0.041)
0.016
(0.040)
0.014
(0.040)
SFit∗D
it—0.302
(0.215)
—0.241
(0.215)
—0.298
(0.212)
BARRit
0.060
(0.038)
0.047
(0.036)
0.048
(0.036)
BARR−HFit
0.044**
(0.019)
0.044**
(0.019)
0.042**
(0.019)
BARR−IMM
it0.050**
(0.023)
0.055**
(0.022)
0.055**
(0.022)
Timedummiesincluded
Yes
Yes
Yes
Yes
Yes
Yes
Yes
Yes
Yes
F-testonregressors
[0.00]
[0.00]
[0.00]
[0.00]
[0.00]
[0.00]
[0.00]
[0.00]
[0.00]
F-testontimedummies
[0.04]
[0.03]
[0.02]
[0.13]
[0.10]
[0.02]
[0.07]
[0.01]
[0.00]
F-testonindividualeffects
[0.00]
[0.00]
[0.00]
[0.00]
[0.00]
[0.00]
[0.00]
[0.01]
[0.00]
Numberofobservations
171
187
187
171
187
187
171
187
187
Note:CGTitdenotesthecapitalgaintaxrateincountryiattimet.NMitisadummywhichtakesvalue1ifa’NewMarket’isavailableforfirmstolistin
countryiattimetandzerootherwise.RDitisthepercapitastockofpublicR&Dexpenditureincountryiattimet,measuredinmillionsof2000euros.SF
itis
thepercapitasupplyoffundsincountryiandtimetnetofcapitalgains,measuredinmillionsof2000euros.Bitisadummywhichtakesvalue0intheyears
between1997and2000,and1otherwise.Ditisadummyvariablewhichtakesvalue0forthosecountrieswheretheventurecapitalindustryisperceivedas
relativelymatureand1otherwise.BARRij itisabarrierindicatorwithj=UA(unweightedaverageofsevenindicators),HF(hiringandfiringindicatoronly),IL
(immigrationlawindicatoronly).Timedummiesincludedinallequations.Standarderrors(probabilitylevels)inround(squared)brackets.*,**,and***denote
0.10,0.05,and0.01significancelevels.
41ECB
Working Paper Series No. 430January 2005
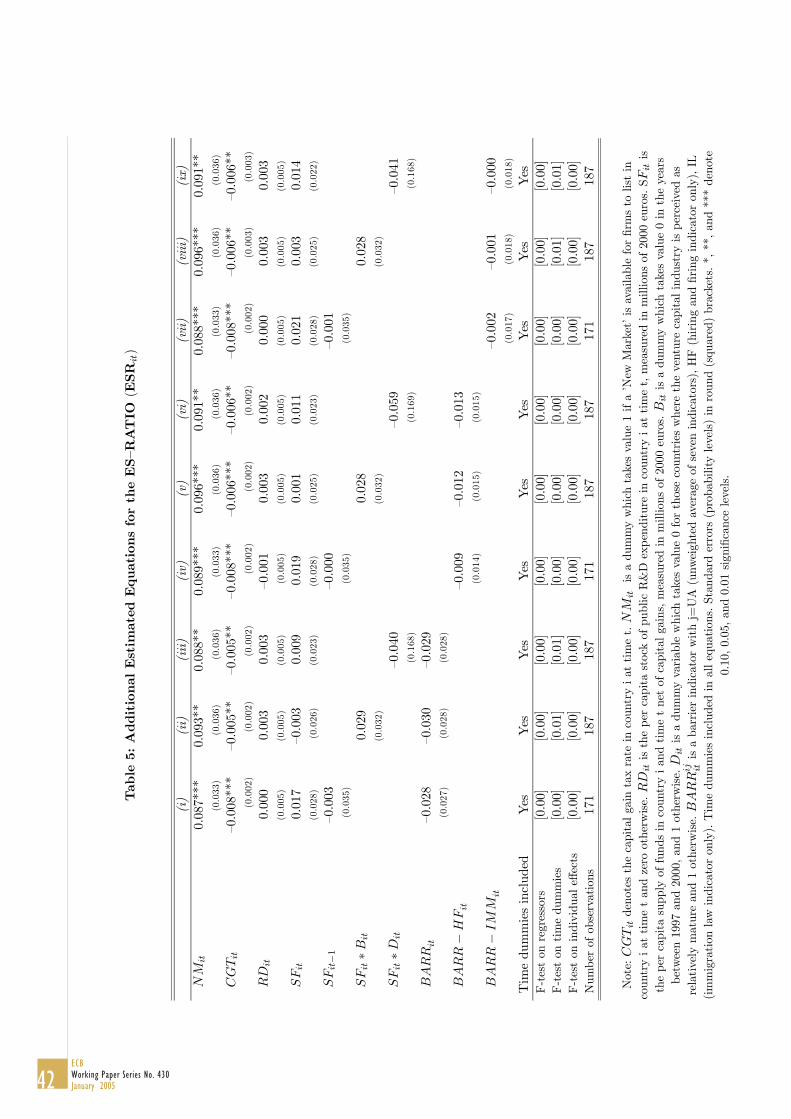
Table5:AdditionalEstimated
EquationsfortheES—RATIO
(ESRit)
(i)
(ii)
(iii)
(iv)
(v)
(vi)
(vii)
(viii)
(ix)
NM
it0.087***
(0.033)
0.093**
(0.036)
0.088**
(0.036)
0.089***
(0.033)
0.096***
(0.036)
0.091**
(0.036)
0.088***
(0.033)
0.096***
(0.036)
0.091**
(0.036)
CGTit
—0.008***
(0.002)
—0.005**
(0.002)
—0.005**
(0.002)
—0.008***
(0.002)
—0.006***
(0.002)
—0.006**
(0.002)
—0.008***
(0.002)
—0.006**
(0.003)
—0.006**
(0.003)
RDit
0.000
(0.005)
0.003
(0.005)
0.003
(0.005)
—0.001
(0.005)
0.003
(0.005)
0.002
(0.005)
0.000
(0.005)
0.003
(0.005)
0.003
(0.005)
SFit
0.017
(0.028)
—0.003
(0.026)
0.009
(0.023)
0.019
(0.028)
0.001
(0.025)
0.011
(0.023)
0.021
(0.028)
0.003
(0.025)
0.014
(0.022)
SFit−1
—0.003
(0.035)
—0.000
(0.035)
—0.001
(0.035)
SFit∗B
it0.029
(0.032)
0.028
(0.032)
0.028
(0.032)
SFit∗D
it—0.040
(0.168)
—0.059
(0.169)
—0.041
(0.168)
BARRit
—0.028
(0.027)
—0.030
(0.028)
—0.029
(0.028)
BARR−HFit
—0.009
(0.014)
—0.012
(0.015)
—0.013
(0.015)
BARR−IMM
it—0.002
(0.017)
—0.001
(0.018)
—0.000
(0.018)
Timedummiesincluded
Yes
Yes
Yes
Yes
Yes
Yes
Yes
Yes
Yes
F-testonregressors
[0.00]
[0.00]
[0.00]
[0.00]
[0.00]
[0.00]
[0.00]
[0.00]
[0.00]
F-testontimedummies
[0.00]
[0.01]
[0.01]
[0.00]
[0.00]
[0.00]
[0.00]
[0.01]
[0.01]
F-testonindividualeffects
[0.00]
[0.00]
[0.00]
[0.00]
[0.00]
[0.00]
[0.00]
[0.00]
[0.00]
Numberofobservations
171
187
187
171
187
187
171
187
187
Note:CGTitdenotesthecapitalgaintaxrateincountryiattimet.NMitisadummywhichtakesvalue1ifa’NewMarket’isavailableforfirmstolistin
countryiattimetandzerootherwise.RDitisthepercapitastockofpublicR&Dexpenditureincountryiattimet,measuredinmillionsof2000euros.SF
itis
thepercapitasupplyoffundsincountryiandtimetnetofcapitalgains,measuredinmillionsof2000euros.Bitisadummywhichtakesvalue0intheyears
between1997and2000,and1otherwise.Ditisadummyvariablewhichtakesvalue0forthosecountrieswheretheventurecapitalindustryisperceivedas
relativelymatureand1otherwise.BARRij itisabarrierindicatorwithj=UA(unweightedaverageofsevenindicators),HF(hiringandfiringindicatoronly),IL
(immigrationlawindicatoronly).Timedummiesincludedinallequations.Standarderrors(probabilitylevels)inround(squared)brackets.*,**,and***denote
0.10,0.05,and0.01significancelevels.
42ECBWorking Paper Series No. 430January 2005

43ECB
Working Paper Series No. 430January 2005
European Central Bank working paper series
For a complete list of Working Papers published by the ECB, please visit the ECB’s website(http://www.ecb.int)
395 “Fiscal sustainability and public debt in an endogenous growth model”by J. Fernández-Huertas Moraga and J.-P. Vidal, October 2004.
396 “The short-term impact of government budgets on prices: evidence from macroeconomicmodels” by J. Henry, P. Hernández de Cos and S. Momigliano, October 2004.
397 “Determinants of euro term structure of credit spreads” by A. Van Landschoot, October 2004.
398 “Mergers and acquisitions and bank performance in Europe: the role of strategic similarities”by Y. Altunbas and D. Marqués Ibáñez, October 2004.
399 “Sporadic manipulation in money markets with central bank standing facilities”by C. Ewerhart, N. Cassola, S. Ejerskov and N. Valla, October 2004.
400 “Cross-country differences in monetary policy transmission” by R.-P. Berben, A. Locarno,J. Morgan and J. Valles, October 2004.
401 “Foreign direct investment and international business cycle comovement” by W. J. Jansenand A. C. J. Stokman, October 2004.
402 “Forecasting euro area inflation using dynamic factor measures of underlying inflation”by G. Camba-Méndez and G. Kapetanios, November 2004.
403 “Financial market integration and loan competition: when is entry deregulation sociallybeneficial?” by L. Kaas, November 2004.
404 “An analysis of systemic risk in alternative securities settlement architectures” by G. Iori,November 2004.
405 “A joint econometric model of macroeconomic and term structure dynamics” by P. Hördahl,O. Tristani and D. Vestin, November 2004.
406 “Labour market reform and the sustainability of exchange rate pegs” by O. Castrén, T. Takaloand G. Wood, November 2004.
407 “Banking consolidation and small business lending” by E. Takáts, November 2004.
408 “The great inflation, limited asset markets participation and aggregate demand: FED policy wasbetter than you think” by F. O. Bilbiie, November 2004.
409 “Currency mismatch, uncertainty and debt maturity structure” by M. Bussière, M. Fratzscherand W. Koeniger, November 2004.
410 “Do options-implied RND functions on G3 currencies move around the times of interventionson the JPY/USD exchange rate? by O. Castrén, November 2004.
411 “Fiscal discipline and the cost of public debt service: some estimates for OECD countries”by S. Ardagna, F. Caselli and T. Lane, November 2004.
412 “The real effects of money growth in dynamic general equilibrium” by L. Graham andD. J. Snower, November 2004.
413 “An empirical analysis of price setting behaviour in the Netherlands in the period1998-2003 using micro data” by N. Jonker, C. Folkertsma and H. Blijenberg, November 2004.

44ECBWorking Paper Series No. 430January 2005
414 “Inflation persistence in the European Union, the euro area, and the United States”by G. Gadzinski and F. Orlandi, November 2004.
415 “How persistent is disaggregate inflation? An analysis across EU15 countries andHICP sub-indices” by P. Lünnemann and T. Y. Mathä, November 2004.
416 “Price setting behaviour in Spain: stylised facts using consumer price micro data”by L. J. Álvarez and I. Hernando, November 2004.
417 “Staggered price contracts and inflation persistence: some general results”by K. Whelan, November 2004.
418 “Identifying the influences of nominal and real rigidities in aggregate price-setting behavior”by G. Coenen and A. T. Levin, November 2004.
419 “The design of fiscal rules and forms of governance in European Union countries”by M. Hallerberg, R. Strauch and J. von Hagen, December 2004.
420 “On prosperity and posterity: the need for fiscal discipline in a monetary union” by C. Detken,V. Gaspar and B. Winkler, December 2004.
421 “EU fiscal rules: issues and lessons from political economy” by L. Schuknecht, December 2004.
422 “What determines fiscal balances? An empirical investigation in determinants of changes inOECD budget balances” by M. Tujula and G. Wolswijk, December 2004.
423 “Price setting in France: new evidence from survey data” by C. Loupias and R. Ricart,December 2004.
424by F. Breedon and P. Vitale, December 2004.
425January 2005.
426and J. J. Puthenpurackal, January 2005.
427 “Interlinking securities settlement systems: a strategic commitment?” by K. Kauko, January 2005.
428by V. Pons-Sanz, January 2005.
429 “Cross-border diversification in bank asset portfolios” by C. M. Buch, J. C. Driscolland C. Ostergaard, January 2005.
430 “Public policy and the creation of active venture capital markets” by M. Da Rin,G. Nicodano and A. Sembenelli, January 2005.
“Security fungibility and the cost of capital: evidence from global bonds” by D. P. Miller
“Geographic versus industry diversification: constraints matter” by P. Ehling and S. B. Ramos,
“An empirical study of liquidity and information effects of order flow on exchange rates”
“Who benefits from IPO underpricing? Evidence form hybrid bookbuilding offerings”
