public officials and their institutional environment: an ... · public officials and their...
TRANSCRIPT

Public officials and their institutional environment:An analytical model for assessing the impact of institutional
change on public sector performance
Nick Manning, Ranjana Mukherjee and Omer Gokcekus
Nick Manning is Senior Public Sector Reform Specialist in the Public Sector group ofPREM network. Ranjana Mukherjee is a consultant in the Public Sector group of PREMnetwork. Omer Gokcekus is Assistant Professor of Economics at North Carolina CentralUniversity and Scholar-in-Residence at Economics Department of Duke University.
The authors wish to specially thank Gary Reid (ECSPE) and Yasuhiko Matsuda (LCSPS)for their review of this paper and their very helpful suggestions. The report benefitedfrom discussions with Meta de Coquereaumont (DECRA), Steve Knack (PRMPS), JeffRinne (PRMPS) and Adeel Malik (PRMPS). Yasuhiko Matsuda (LCSPS) contributed tothe conceptualization of the institutional environment in Section 2.

ii
Summary
This paper sets out the analytical framework that was used in designing a series ofsurveys of the views of public officials concerning their institutional environment and inanalyzing the information that was generated in 15 countries. It describes how the surveyresults help to map the strengths and weaknesses of a public sector, and offers anapproach for identifying potential pay-offs from reform interventions. Above all, theframework emphasizes the heterogeneity of incentives and institutional arrangementswithin the public sector – and the need for policy makers to have information that movesbeyond generalities and indicates what is most likely to work and where.
In building on the premise that public officials’ actions – and hence the performance oftheir organizations – depend upon the institutional environment in which they findthemselves, this framework avoids any simplistic anti-government positions, withoutattempting a defensive justification for poor performance. This framework offers anapproach for understanding both good and bad performance and for presenting the resultsto policy makers in a format that lead to more informed choices about reforminterventions.
The analytical framework responds to concerns in many recent reviews of public sectorreform interventions. The surveys and analyses were financed under the Bank-Netherlands Partnership Program (BNPP). This paper will be accompanied by countryreports that set out the distinctive findings resulting from the application of the surveys,and aspects of this methodology, in each of the countries studied.
iii
Abbreviations and Acronyms
BNPP Bank Netherlands Partnership ProgramCAPAM Commonwealth Association for Public Administration and ManagementDECRA Research Advisory, Development Economics and Chief EconomistECSPE Europe and Central Asia, Poverty Reduction and Economic ManagementHRMIS Human Resource Management Information SystemINE Instituto Nacional de EstadisticaIRR Institutional Rate of ReturnLCSPS Latin America and Caribbean Region, Public SectorOED Operations Evaluation DepartmentOLS Ordinary Least SquaresOECD Organization for Economic Cooperation in DevelopmentNGO Non Governmental OrganizationPREM Poverty Reduction and Economic ManagementSURE Seemingly Unrelated Regression Equations

iv
Table of Contents
1. Introduction................................................................................................................. 1
2. Conceptual Framework ............................................................................................... 3
2.1 What is meant by institutional environment?.......................................................... 32.2 How can institutional environment be measured? .................................................. 72.3 How can performance be measured? ...................................................................... 82.4 Whose performance? – different units of analysis................................................ 11
3. Survey methodology ................................................................................................. 14
3.1 Questionnaire design............................................................................................. 143.2 Sampling methodology ......................................................................................... 15
4. Construction of Indicators for Institutional Environment......................................... 17
5. Construction of Indicators for Performance.............................................................. 20
6. The Connection between Performance and Institutional Environment .................... 22
7. Presenting Opportunities for Reforms....................................................................... 24
7.1 Step 1 – it’s the institutions not the people ........................................................... 247.2 Step 2 – encourage contestation in interpretation................................................. 257.3 Step 3 – challenge prior assumptions .................................................................... 257.4 Step 4 – encourage informed speculation on performance pay-offs..................... 26
8. Summary................................................................................................................... 34
Selected Bibliography....................................................................................................... 36
Appendices........................................................................................................................ 41
Appendix 1: Illustrative questions to probe for dimensions of the institutionalenvironment 41Appendix 2: Institutional environment indicators in the East Caribbean States........ 46Appendix 3: Illustrative questions to probe for dimensions of performance............. 48Appendix 4: Performance indicators in the East Caribbean States............................ 54Appendix 5: Connection between performance and institutional environment......... 56Appendix 6: Econometric and analytical issues......................................................... 59
v
Index of Figures
Figure 1. Analytical model for BNPP-funded surveys ....................................................... 3Figure 2. Credible rules, credible policy and predictable resourcing constitute the
institutional environment within any perspective............................................... 8Figure 3 The main components of government employment .......................................... 11Figure 4. Officials say that the whole government is much more corrupt than their own
organization. ..................................................................................................... 15Figure 5. Construction of indicators for institutional environment in East Caribbean
states................................................................................................................. 17Figure 6. Construction of indicators for performance in East Caribbean states .............. 20Figure 7. Performance and Institutional Environment in sampled Bolivian public sector
organizations..................................................................................................... 23Figure 8. Rule complexity affects performance in Albania............................................. 25Figure 9. Expected impact of reforms on components of performance in Bolivia.......... 32Figure 10.Effect of institutional environment on results focus in Bolivia........................ 56Figure 11.Effect of institutional environment on accountability in Bolivia ..................... 57Figure 12.Effect of institutional environment on employee morale in Bolivia ................ 58Figure 13.Expected impact of reforms on different components of performance in Bolivia
Central Administrations.................................................................................... 65
Index of Tables
Table 1 Illustrative prior assertions tested against survey evidence .............................. 26Table 2 Reform Interventions and anticipated performance pay offs in the Bolivian
public sector...................................................................................................... 31Table 3 Reform Interventions and anticipated performance pay offs in Bolivia Central
Administrations ................................................................................................ 64
Statistical Table 1 Rule credibility indicator and components (East Caribbean)............ 46Statistical Table 2 Policy credibility indicator and components (East Caribbean) ......... 46Statistical Table 3 Indicator of resource adequacy and predictability and components
(East Caribbean) ............................................................................................... 46Statistical Table 4 Indicator of overall institutional environment and components (East
Caribbean) ........................................................................................................ 47Statistical Table 5 Results focus indicator and components (East Caribbean) ............... 54Statistical Table 6 Accountability indicator and components (East Caribbean)............. 54Statistical Table 7 Employee morale indicator and components (East Caribbean) ........ 54Statistical Table 8 Overall performance indicator and components (East Caribbean) ... 55Statistical Table 9 Calculating the IRRs (Bolivia).......................................................... 63

1
1. Introduction
This paper lays down the analytical framework that was used in designing a series ofsurveys of the views of public officials concerning their institutional environment and inanalyzing the information that was generated in 15 countries. It describes how the surveyresults help to challenge preconceptions, map the strengths and weaknesses of a publicsector, and identify potential pay-offs from reform interventions.
The need for an analytical framework emerged from the lessons of past experience in theWorld Bank. The Operations Evaluation Department reported that during 1980-97, onlyone-third of the Bank’s closed civil service reform interventions had successfuloutcomes.1 Other reviews of the Bank’s public sector reform efforts have identifiedshortcomings of the Bank’s approach in this area, pointing out the risks of a narrow and‘technocratic’ view of what is needed for public sector reform, and of a reliance on ‘bestpractice’ models that have not been feasible in the particular country setting.2 TheBank’s most recent strategy for reforming public institutions has identified that for theapproach to be effective:
“… we need to work with our partners to understand and address the broad range ofincentives and pressures – both inside and outside of government – that affect publicsector performance.” 3
The strategy paper also points out that for the analytic work to be useful:
“We need to start with a thorough understanding of what exists on the ground andemphasize good fit rather than any one-size-fits-all notion of best practice. And we needto work with our clients and other partners to develop and apply analytic toolseffectively.”
The framework laid out in this paper addresses both these needs. Public officials are notinherently rapacious rent-seekers; they respond to the incentive structure they face.There is ample evidence, both theoretical and empirical, to suggest that the performanceof public officials is greatly determined by the institutional environment that they findthemselves in. The framework recognizes that incentive systems are different in differentcountries – and vary across types of organizations and types of officials in the samecountry. Recognizing this, it offers a method for designing surveys that uncover thesanctions and rewards that drive behavior from those who may be subjected to them – thepublic officials themselves.
Surveys were designed to cover several areas. They elicit a contextual description of thepublic sector, including characteristics of respondents, their reasons for joining the publicsector and the length of time worked in government. Second, they offer the possibility of
1 World Bank (1999).2 World Bank (2000). http://www-wbweb.worldbank.org/prem/prmps/3 Ibid, p.4-5.
2
presenting policy-makers with robust confirmation of the theory-based assertion that it isthe institutional environment in general, and rule credibility, policy credibility, andresource adequacy and predictability in particular, which drive performance. Third, theyprovide an opportunity to inform in-country reform discussions with current data.
Fourth, the surveys also allow country-specific hypotheses to be tested. Many widelyheld views on public officials are often repeated but without substantive evidence – moreakin to "urban myths" than to empirical observations. The surveys allow such assertionsto be tested and supported or refuted.
Finally, the surveys allow some assessment of which aspects of institutional environmentare impacting on performance. It suggests those reform actions that seem most promisingfor higher performance, given the country’s existing public sector conditions.
The surveys and analyses were financed under the Bank-Netherlands PartnershipProgram (BNPP). Surveys of public officials funded by the BNPP have been completedin Albania, Argentina, Bangladesh, Bolivia, East Caribbean States, Guyana andIndonesia. Surveys are in progress or are being initiated in Bulgaria, Cameroon, India,Kenya, Macedonia, and Moldova. This program has provided funds for data analysis of aseparate survey of public officials in Armenia, and another data analysis exercise is alsoplanned for an ongoing survey in Benin. The survey instruments were based on a modeldesigned in collaboration with Professor Bert Rockman of the University of Pittsburgh.World Bank staff working on a particular country tailored this basic questionnaireaccording to country-specific background and issues in public sector reform.
This paper summarizes the premises on which the surveys were designed and analyzed,and the analytical framework. In explaining that analytical framework, examples havebeen used whenever it was considered their use would help make ideas clear. Theexamples have been drawn from survey experience during 1999 and 2000, and countrydata in Albania, Armenia, Bolivia, Guyana, Macedonia, and five countries in the EastCaribbean region. The selection of examples was guided by their usefulness inillustrating the steps in the analytical framework, and not to point out any strengths orweaknesses of any country’s public sector.
Section 2 lays out the conceptual framework. Section 3 summarizes the surveymethodology. Section 4 describes the approach for measuring the institutionalenvironment using the East Caribbean example as an illustration. The approach formeasuring aspects of performance is described in section 5, again using the sameexample of East Caribbean states. The relationship between performance and institutionalenvironment is described in section 6, using the illustration of the Bolivian public sector.The Bolivian example was also used in Section 7 to show how survey results can be usedto identify promising prospects for reform.
Section 8 concludes with an overview of how the analytical framework is being used inpractice.

3
2. Conceptual Framework
Public officials in developing countries are often viewed as unskilled, poorly educatedand poorly motivated to perform their official tasks. The assumption is frequently madethat public officials are primarily motivated to exploit any official privileges that theirpositions give them to engage in opportunistic behaviors. Given the poor performance ofpublic bureaucracies in many developing countries, and the undeniable reality of the lowpublic sector salaries, such an assumption may not be wholly unrealistic. Yet, there aremany public officials who, despite such a poor incentive environment, may perform theirtasks without shirking, stealing or subverting in spite of overwhelming incentives foropportunism. For every rent-seeking or poorly motivated public official, there may beanother who is providing a valuable service under extremely adverse circumstances.There is perhaps more to be learnt from an examination of why some public officialsperform against the odds than from reciting the standard litany of failing public services.
This paper starts from the premise that public officials’ actions – and hence theperformance of their organizations – depend upon the institutional environment in whichthey find themselves. In this way the analytical framework avoids the anti-governmentbias that pervades much of the literature on the public sector in developing countries,without attempting a defensive justification for poor performance.4 The analytical modelallows verification of the assumption that it is the institutional environment that impactson the performance of organizations in the public sector rather than the waywardness ormalfeasance of officials. Accordingly, this model suggests that reform interventions thatimprove any or all aspects of the institutional environment will result in higherperformance of some or all of the areas in which performance is measured.
Figure 1. Analytical model for BNPP-funded surveys
Institutional environment: Performance:• policy credibility • results focus• rule credibility • accountability• resource adequacy and
predictability• employee morale
2.1 What is meant by institutional environment?5
Institutions are the humanly devised constraints, or set of relational contracts that guidepublic officials’ activities. They are made up of formal constraints (e.g. rules, laws,constitutions), informal constraints (e.g. norms of behavior, conventions, codes ofconduct), and their enforcement characteristics. For public officials, formal rules are laid
4 See Tendler (1997) for a summary of these perspectives.5 This section was developed in collaboration with Yasuhiko Matsuda of LCSPS.

4
down in their code of conduct and operation manuals, in the budget documents, and inthe many decrees, directives and instructions through which policy is conveyed. Theinformal rules are what the officials collectively understand as appropriate behavior,‘how we do things around here’. For example, not vigorously implementing theminister’s newly announced scheme might result in a transfer to a position in a remoteand inaccessible area.
Institutions provide the incentives that provoke or prohibit certain actions. Rules andregulations, formal and informal, together define the incentive structure of publicofficials within their organization, or within their peer group, or across the public sectoras a whole. 6 Fundamentally then, this institutional environment shapes the expectationsof public officials. If there is a rule about the management of records in the organization,or about methods of performance appraisal, then behavior will vary according to whetherthe official believes that breaches of these rules really will be punished. Similarly,willingness to gear actions to support Ministerial policies is somewhat greater if officialsbelieve that policies will remain in force for a period of time, and will not be underminedby other policies of equal force. Expectations that policies are likely to be soon reversedlead, at best, to second-guessing of what the next ones might look like. At worst theylead to cynical disregard for any announced policy.
The principal-agent perspective assumes incompatibility of interests between theprincipal and the agent.7 The consequent pursuit of private interests can take variousforms including shirking (i.e., under-production of outputs desired by the principal),stealing (i.e., embezzlement and other forms of bureaucratic corruption), andsabotage/subversion (i.e., pursuit of objectives that are blatantly against theorganization’s goals).
The relationship between the principal and the agent thus conceptualized is a contractualone, whereby the agent agrees to perform certain tasks, which he/she would not havedone without the “contract,” in exchange for a set of positive incentives to be provided bythe principal. The principal enforces the contract through the monitoring mechanisms.In this perspective, an organization is a chain of voluntary contracts in a hierarchicalstructure.8 Suggested performance improvements emerging from this perspective tend torefer to increases in official salaries, greater contestability in public service provision, andstiff penalties for rule breaking. 9
6 See Horn (1995)7 The principal-agent theory is not the only application of economic theories to the study oforganizations. For a more thorough and nuanced treatment of the ‘new economics of organization,’ seeMoe (1984). For a systematic application of the transactions cost approach to explaining structures ofpublic bureaucracies, see Horn (1995). More generally, for an application of principal-agent theory to thesubject of state reform, see Przeworski (1999).8 The logic of principal-agent relations can be extended beyond a particular organizational boundaryto include an analysis of the relationship between a bureaucratic organization (as represented by its head)and government (i.e., minister) or politicians (i.e., president, legislature). Examples include Weingast andMoran (1983), McCubbins and Schwartz (1984), and McCubbins, Noll, and Weingast (1987, 1989).9 See, for example, Klitgaard (1997).

5
While persuasive, there are some limitations to this model. First, the economic theoriestend to focus on formal institutions (e.g., official wages, as opposed to careerpossibilities, as an incentive; formal auditing, as opposed to social/peer pressure, as amonitoring mechanism).10 Second, crude economic theories may draw our attentiondisproportionately to the “minimal state” agenda with its accompanying mantra of“reduce bureaucratic discretion”. Third, the whole rationale of the principal-agent theorybreaks down if we accept that part of the bureaucracy’s functions is to protect long-termpublic interests by not being fully responsive to particular short-term concerns of thegovernment of the day. 11 Finally, unlike profit-seeking private firms that presumablyoperate with a clear ownership pattern and an unambiguous line of accountability, publicbureaucracies usually operate under supervision from multiple principals.12
In sum, the principal-agent perspective emphasizes:1. Monetary incentives;2. Mechanisms for monitoring contracts; and3. Clarity of agency mission.
Critics complain that such economic theories offer relatively little in the way ofexplanations for non-opportunistic behavior in the public bureaucracy. 13 Such seeminglyselfless actions are perplexing within the principal-agent perspective. However, theperspective is also limited by its focus on performance that can be observed andmeasured. Some other tasks require such a high level of discretion with virtually nopossibility of effective monitoring that the principal cannot rely on economic incentives.Other non-monetary incentives, such as identification with the agency’s mission or withthe agency itself as well as esprit de corps, must be considered.
The principled-agent perspective purports to offer more empirically accurate account oforganizational dynamics and bureaucratic behavior, but at the same time its analyticalpower is somewhat more limited than that of the principal-agent theories. Leadership isseen to be key14, as is “a strong sense of mission, effective managerial practice, and highexpectations about employee performance”. 15 The perspective builds on the sociologicaltraditions that have tended to see organization as an organic entity and have emphasized
10 See Heyman (1988) and Miller (1994).11 A large-scale survey-based study of senior bureaucrats and politicians in five western countriesfound that “policymaking by bureaucrats is characterized by continuity, stability, and predictability” inclear distinction to the views of politicians who see themselves as “advocates, partisans, and tribunes”(Aberbach, Putnam, and Rockman, 1981, p. 256-7).12 See Moe (1984), Moe (1990), Simon (1991), and Fukuyama (1995).13 They are “far better at explaining why bureaucrats shirk, subvert, or steal than they are atexplaining why bureaucrats behave as ‘principled agents’ – workers who do not shirk, subvert, or steal onthe job even when the pecuniary and other tangible incentives to refrain from these behaviors are weak ornonexistent” (DiIulio, 1994, p. 277). Herbert Simon also provides a critique of the principal-agent variantlabeled transactions cost analysis (Simon 1991).14 DiIulio (1994). Other influential organization theorists including Selznick (1957) and Wilson(1989) have also underscored critical roles of leadership in accounting for organizational performance.15 See Grindle (1997, p.491).

6
culture, leadership, and styles of authority and power16, and that emphasize the limitationsof formal contracts. 17
There is a sizeable literature that sees officials’ identification with organizationalobjectives as key to their “principled” behaviors. Another source of motivation is publicofficials’ long-term career paths. When bureaucratic career paths are fairly well definedand predictable, they induce a particular range of behaviors from public officials who areinterested in improving their career prospects. Recruitment and promotion processeswork as socialization mechanisms that selectively preserve particular types ofindividuals.18
One key to performance within the principled-agent perspective is that career paths arelong term, allowing reputational rewards to be developed.19
Thus the principled-agent perspective emphasizes:1. Clarity of agency mission;2. Organizational culture and trust; and3. Long-term career paths.
Some political scientists see public sector organizations, not exclusively in developingcountries, as webs of patron-client networks.20 This perspective observes the patron-client relationship as based more on trust and loyalty than short-term, transaction-specificutility-maximizing calculation and bargaining by both parties.
Unlike a typical principal-agent relationship marked by incentive incompatibilitybetween the two actors, a patron-client relationship is based on the recognition of mutual(albeit unequal) benefits that the two actors derive from the relationship. Furthermore, tothe extent that incentive incompatibility threatens the possibility of mutual gains, thepersonal and long-term nature of the relationship between the patron and the clientreduces the monitoring costs of the client’s behavior, and thus mitigates the agencyproblems. The client is bound by the sense of loyalty and obligation as well as motivatedby the expectation of present and future benefits from the continued participation in therelationship.
16 See Weber (1946), Selznick (1957), and Simon (1974).17 An interesting point is that Williamson’s (1975) seminal study of the economics of organizationfinds the superiority of internal organizations (hierarchies) over markets because of the former’s greaterability to control opportunism.18 Aberbach, Putnam, and Rockman (1981) provide an example of this impact on a range of attitudesand behaviors observed among bureaucrats at senior levels, and Schneider (1993) provides an example ofthe reverse.19 OECD (1994a) also notes that in some countries “the official doctrine is that public servantsreceive a means of subsistence to enable them to serve the state”. The strongest expression of this particularincentive logic is to be found in the German pay policy for established civil servants, Beamte. For thisgroup, traditionally, pay “is not regarded as remuneration for work performed or for performance offunction, but as a means of livelihood linked to office. (The remuneration) is intended to enable Beamte, togive full commitment to duty of service to state and to live at appropriate standard for service rank and (to)be independent”.20 See Dresang (1974), and Schneider (1991).

7
This perspective assumes that it is more than likely that the loyalty to the patron willoverwhelm the client’s identification with the organizational objectives. This militatesagainst effective organizational performance if the patron utilizes employmentopportunities in the public sector as a means to reward political supporters. Thisperspective also requires that career paths are long term, although in this case the reasonis that the currency of jobs in which the patron rewards the client holds little value if jobscan be withdrawn at any moment.
Patron-client relations require extensive informality. Comprehensive, formal rules withclear policy objectives and restraints on the ability of the principal to micro-managewould remove the ability of the patron to reap the rewards from having placed theirclients in key positions.
The patron-client perspective emphasizes:1. Long term career paths; and2. Informality.
2.2 How can institutional environment be measured?
These perspectives emphasize different sets of arrangements and consequently they directattention to different potential levers for improving performance. Whatever perspectiveis adopted on the motivation of public officials, three particular sets of concerns stand outas fundamental – the nature of the rules that constrain the behavior of public officials, thenature of the policies that they are asked to implement, and the manner in which they areprovided with resources. As shown in Figure 2, these are always the ingredients in theincentive mix, whatever the assumed recipe.21 Within these dimensions, the institutionalenvironment shapes expectations of future constraints and incentives. An official, whohas come to expect that rules will not be enforced, works in an environment of low rulecredibility. His or her behavior is shaped by the expectation that the rules for personneland budget management will not be enforced in the future.22
The three dimensions of the institutional environment – rule credibility; policycredibility; and resource adequacy and predictability – represent measures of theexpectations of public officials concerning the future.
21 See Manning and James (2000) for a discussion of credible regulation within the public sector.See Evans and Manning (2000) for a discussion of policy credibility.22 This point that institutional arrangements impact individuals' actions in the present by shapingtheir expectations about the future is made extensively in the institutional literature. See, for example,Bendor and Mookherjee (1987) and Mnookin and Kornhauser (1989). It is consistent with an assertion thatthe problem facing both public and private sector managers is one of maintaining their collective reputationas a relevant actor among their staff (See Seabright 1993). More generally, the literature on cooperation inthe absence of third-party enforcement emphasizes that "the shadow of the future" (i.e., the degree to whichactors expect to interact again under similar circumstances) significantly determines behavior in the present(See Axelrod and Keohane, 1985).

8
Figure 2. Credible rules, credible policy and predictable resourcing constitutethe institutional environment within any perspective
expectations ofrule enforcement
expectations of policy expectations offuture resourceflows
com
preh
ensi
ve s
et o
ffo
rmal
rule
s in
pla
ce
rule
s ar
e fa
ir a
nd le
adto
pre
dict
able
car
eer
path
s
polic
ies
are
cons
iste
nt
polic
y ob
ject
ives
clea
rly
set o
ut
polic
ies
gain
the
supp
ort o
f pub
licof
fici
als
deta
iled
impl
emen
tatio
n is
left
to o
ffic
ials
sala
ries
pro
vide
d on
time
prog
ram
bud
gets
relia
bly
prov
ided
monetaryincentives
empha-sized
empha-sized
contractenforcement
empha-sized
empha-sized
principal-agentperspective
clarity ofagencymission
empha-sized
empha-sized
empha-sized
culture andmutual trust
empha-sized
empha-sized
empha-sized
empha-sized
empha-sized
empha-sized
principled-agentperspective
long termcareers
empha-sized
empha-sized
empha-sized
patron-clientperspective
informality opposed opposed opposed
Against this context, the study has adopted a framework for measuring the institutionalenvironment built around measurement of these three factors that constitute theinstitutional environment. Accordingly, indicators are constructed to measure how muchrule credibility, policy credibility and resource adequacy and predictability theinstitutional arrangements are providing.
2.3 How can performance be measured?
In addition to the well-recognized difficulties in assessing organizational performance,quantifying performance of public organizations runs into two main problems.23 First,unlike private organizations, public organizations have no single performance indicatorthat can compare across different types of organization and products, such as profitsearned or market share. In the public sector, only a few organizations work for profit.
23 Acs and Gerlowski (1996) list the classic difficulties including measurement errors, randomeffects, and factors outside the control of the organization. Carter, Klein, and Day (1995) lists ownership,trading/non-trading, competition, accountability, heterogeneity, complexity, and uncertainty as theorganizational dimensions and argue that these dimensions show huge variation among publicorganizations. They also point out the difficulty in measuring the quality of service delivery.

9
Outputs of many organizations such as the audit body or the planning division of theMinistry of Finance are used only by other organizations within the public sector.
Second, public sector organizations are often dealing in goods of both low contestabilityand measurability. 24 In such circumstances it is generally impossible to find performancemeasures of the public sector that satisfy the ideal qualities of consistency, comparability,clarity, controllability, comprehensiveness, boundedness, relevance, and feasibility. 25
For instance, when public agencies' performance is measured, the metrics are distinctlyorganization or service-specific. The waiting time for a patient to see a doctor is notreadily compared to performance in primary school enrolment. The current extensivedebate on performance in the public sector provides illustrations of benchmarks that canbe applied over time, but has done little to solve the problem of comparability betweendiverse agencies and sectors.26
Nevertheless, performance needs to be measured. The analytical framework described inthe following pages introduces a new approach to measure performance of publicorganizations. In particular, it suggests that there are some common assertions that liebehind currently used diverse measures of performance. In particular it identifies threedimensions that are key to any conceptualization of performance: how focused officialshave been on results, their accountability for adherence to formal rules, and theirmorale.27
Results focus is prima facie evidence that public officials are striving to achieveorganizational goals and clearly lies behind consideration of organizational efficiency andeffectiveness. It is a reasonable, although empirically testable, proposition that rewardinggood performance and punishing bad performance encourages a results focus.
Accountability is performance in the distinctive sense of having adhered to the formalrules and so enabling actual behavior to be tested against mandated standards. For publicsector organizations, which work with public funds, accountability is an importantelement of performance. Corruption is a symptom of poor accountability performance –but the notion of accountability adopted for this study is wider than corruption. 28
Accountability in this sense rests on the past enforcement of regulations. This measure isof course different from an assessment of the existence of credible and appropriate rulesand regulations, which is an aspect of the institutional environment. This notion ofaccountability includes transparency in decision-making and allocation of governmentresources. This refers, for example, not only to the audit of public accounts and making
24 See Girishankar (1999).25 See Shand (1997).26 See for example OECD (1994b), Public Service and Merit Protection Commission, Australia(1998), Gore (1993) and Osborne and Plastrik (1997).27 A study by the authors of this paper is in progress to empirically examine the link between theseperformance measures and conventional output and outcome indicators, and its findings will be available in2000.28 See World Bank (1998).

10
the audit report available to legislature, but also to a history of regular consultations withthe private sector, citizens’ groups and NGOs.
Finally, employee morale is also identified as a component of organizationalperformance. This is both a performance goal in its own right, and a contributor toorganizational effectiveness and efficiency as identified in Australian and Canadianstudies of public employees of the 1980s.29 Employee morale is raised by job satisfactionand reduced by the orientational and attitudinal disconnect that managers have with theirstaff. 30 This latter concept of a disconnect between the managers of organizations andother officials working in them has been usefully termed 'vertical solitude'.31 It is theorientational and attitudinal disconnect that managers have with officials below them. Asmanagers rise in the hierarchy, two factors cause them to become “impersonal.” First,they become increasingly aware that they are no longer managing front-line staff, butother people who think like them. Therefore, their thought patterns and worldviewincreasingly diverge from that of their staff. Second, as they rise, the units they managebecome larger until it becomes impossible to personally know everyone who works forthem. 32 As a result, communication between the managers and general officials in anorganization deteriorates. The general officials are in more regular contact with the publicand client groups, but do not clearly understand the expectations of their ministers andmanager who set the tone and direction in their departments.33
It should be emphasized that these are intermediate measures of performance. Given theheterogeneity of organizational outputs it is only at this intermediate level that measurescan be found that contribute to how effectively those heterogeneous outputs are producedin different organizations, but which are homogenous enough to permit measurement andcomparability across disparate public agencies. The key feature of these measures ofperformance is that they refer to perceptions of past events. While the institutionalenvironment shapes expectations of the future, performance refers to past behavior.
The conceptual framework described above proposes that performance is a function ofthe institutional environment. To test this, indicators were constructed that allowmeasurement of the degree of results focus, accountability and employee morale. It thusbecomes a testable proposition that performance improves as the institutionalenvironment improves.34
29 See Jans and Frazer-Jans (1989) and Zussman and Jabes (1989).30 See also Schein (1996).31 See Zussman and Jabes (1989).32 Schein (1996).33 Zussman, and Jabes (1989).34 Leadership as a determinant of organizational performance has been considered in a 1999 study ofUS Federal Executives (PricewaterhouseCoopers 2000) and a 1987 study of the Canadian federal publicservice (Zussman and Jabes 1989).

11
2.4 Whose performance? – different units of analysis
In addressing the key question about whose performance we are interested in, thisanalysis slices the public sector in three related ways. First, it examines someperformance questions at the whole of government level. Second, it examines whatneeds to be done to get a particular group of officials to perform more effectively. Third,it asks what can be done to improve the performance of some particular agencies ororganizations within the public sector. Disaggregating the public sector by type ofofficial and by type of agency is a pragmatic judgment, and ultimately in this and thecountry reports the determination was made largely on the basis of custom and practice –how commentators refer to units or groups within government in this setting.
However, it is worth exploring briefly the challenges that lie behind this simpleclassification exercise.
Groups of officials
The terms ‘public sector employees’ and ‘civil service’ are often used to describe anyonewho is paid by government. However, this is a very heterogeneous group and in realitycomprises: an inner core of administrators; members of the armed forces; officialsemployed by productive enterprises that are majority-owned, directly or indirectly, by thestate; health workers of any level of government; primary, secondary, or universityteachers paid by government; employees of sub-national governments, etc.
Figure 3 The main components of government employment35
Error! Unknown switch argument.
The surveys seek a country-specific approach to distinguishing between groups ofofficials. In the case of Bolivia, for example, officials from central administrations,decentralized institutions, regional administrations were surveyed and the analysisdistinguished between consultants and other public officials. In Bangladesh, the analysisdistinguished between officials of ministries, autonomous corporations and district-levelofficials. In the East Caribbean states, perceptions of managers, middle-level officials andgeneral officials were differentiated.
35 For further details see Cross-National Data on Government Employment and Wages, on the WorldBank Administrative and Civil Service Reform web site athttp://www1.worldbank.org/publicsector/test/civilservice/cross.htm. See also Stevens (1994).

12
Types of agency
The characteristics of the goods that the agency produces, or the features of its tasks, arelikely to have important effects on the way public officials behave. Some tasks naturallyinvolve a greater level of discretion by front-line officials, while others are moreamenable to strict standard operating procedures. Wilson (1989) has developed atypology of agencies according to varying characteristics along two dimensions: whetheragency outputs are observable or not, and whether agency outcomes are observable ornot. Agency outputs may not be observable simply because the agency’s bureaucraticoperators conduct their duties out of view of the manager (e.g., police officers on thebeat, teachers in classrooms). They may also be “unobservable” because what theoperators do is esoteric (e.g., a professor developing a hypothesis in a shower).
In more formal terms, four broad categories of agency can be identified.
Ministries are in a legal or constitutional sense indistinguishable from the state as theyoften have no specific primary legislative basis and their assets are the general propertyof the state. Their functions and objectives are multi-purpose complex tasks andtraditionally defined by legislation (Continental European traditions) or determinedincrementally by Cabinet (UK and other Anglophone traditions). Their source of fundingis almost entirely the state budget and they usually have nil or very minor revenueearnings. As they have no corporate or legal identity separate from the state, they havegenerally no legal competence to enter into corporate contractual relationships withsuppliers.
The term autonomous agencies can be quite confusing because it may refer to two verydifferent things: "executing agencies" and "statutory commissions and independentregulators". Executing agencies reporting to Ministries (or reporting to Ministers butunder day to day supervision of a Ministry) are often in the same legal or constitutionalsense indistinguishable from the state. However, the relevant Minister generally definestheir objectives, perhaps in framework agreement, and their source of funding can includesome revenue earnings. They rarely have legal competence to enter into contractualrelationships with suppliers.
Some agencies are statutory commissions in that they do have a separate legislativeexistence. They can be non-asset owning (legally distinct but not able to own assets inany sense) or asset owning (legally distinct and the owner of its assets). Their objectivesare often enshrined in a charter and their functions are defined by the legislation,including the Minister’s powers of direction. They can often be budget dependent(subvented) with significant revenue earnings. They can have legal competence to enterinto contractual relationships. Such bodies tend to be established for regulatory purposes,although in some presidential systems they can also be service providing.
Trading bodies also have a separate legislative existence, and can be established undercommercial law in which case their charter and their articles of association definefunctions. They can be budget dependent, subsidized, but with significant revenue

13
earnings. They generally have full legal competence to enter into contractualrelationships - they can assume corporate liability and can be sued.
In the present series of BNPP surveys, those in Bangladesh, Bolivia, East Caribbean andGuyana covered officials from the first three types of organizations.
14
3. Survey methodology
The surveys were designed to elicit the perceptions of public sector officials. Allemployees employed in the organizations being surveyed were eligible and no controlgroup was included. As no ‘before and after’ information was sought, a cross sectionaldesign was selected.
3.1 Questionnaire design36
In drafting and pre-testing the questionnaires, care was taken to avoid: ambiguous wordsand phrases; questions asking two or more opinions simultaneously; words or phrasesthat could be expected to trigger off emotional responses; and information that couldmanipulate the respondent.37 Most pre-testing exercises pointed to excessive length of thequestionnaires. The rule of thumb applied was that it would be unlikely that a publicofficial could afford to spend longer than 45 minutes with an interviewer even assumingthat the surveyor could hold the official’s attention for longer.
Although the responses had to be converted to numbers for analysis, verbal responsescales were selected over numeric scales in most questionnaires. This happened becauseduring pre-testing, responses on a numerical scale tended to show responses clusteredclose to the middle of the scale.38 The advantage of using descriptive words for eachcategory of response was that each category could be relatively well defined. The numberof categories was kept low, to avoid loss of meaning in translation. The middle categorywas excluded to force respondents to express preferences even when they are indifferent.Pre-testing showed that including a middle category biased responses towards the middlecategory even when respondents had a slight preference one way or other. ‘Don’t know’as a response category did not appear in any survey questionnaire except in Indonesia.Thus the number of respondents expressing an opinion was biased upwards.
Filters and branches were used. Although filter questions added to the length of thequestionnaire, they were used to ask whether or not something was a problem beforeasking the degree of the problem. Most questionnaires began with ‘easy’ questions likehow long the respondent had been working with government or in the same position, ordetails about the personnel management system in place in the respondent’s organization.Questions on the same theme were grouped together. Listing all categories in the sameorder minimized any existing order effect within questions. In most questions categorieswere listed from low to high, and from bad to good.
Most surveys asked about corruption and other sensitive questions such as what anofficial did when he or she did not agree with a supervisor’s decision. Recognizing thatrespondents could be unwilling to admit incriminating behavior in face-to-face 36 The survey instruments are available onhttp://www1.worldbank.org/publicsector/test/civilservice/survey.htm.37 See Rea and Parker (1997).38 See Recantini, Wallsten, and Xu (2000).

15
interviews, the first few surveys introduced a self-administered component (containingsensitive questions) besides the main in-person interview. However, this method ran intologistical problems at the data entry stage. In the later surveys, sensitive questions wereasked towards the end of the interview by which time greater rapport would havedeveloped between the surveyor and respondent. Even if this made the respondentsuspicious in any way or unwilling to answer further questions, it did not bias the wholeinterview.
Some less direct questions were asked, such as “How serious is corruption in yourorganization?” instead of the more direct “What percent of officials in your organizationtake bribes?” Interestingly, in all surveys analyzed so far, officials admitted that theirown organization was corrupt, but less corrupt than the rest of government.
Figure 4. Officials say that the whole government is much more corrupt thantheir own organization.
40%
94%
44%
98%
0%
20%
40%
60%
80%
100%
my organizationArmenia
government my organizationBolivia
government
3.2 Sampling methodology
Probability sampling was the method employed in Bangladesh, Bolivia and Guyana.Stratified random sampling was utilized with the strata being the types of organizationsdescribed in Section 2.4.39 In East Caribbean countries, quota sampling was the methodchosen because the number of employees at each level was known accurately from the
39 However, in Bolivia, the strata employed were not the types of organizations but the hierarchicallevels in each organization. The number of different types of organizations chosen was “purposive” tomaintain some representativeness, and to ensure that certain agencies were included.
my organization government
Armenia
my organization government
Bolivia

16
1999 budget estimates available for these countries.40 Focus groups were mostly utilizedto pretest draft questionnaires.
Sample sizes in different countries had to be determined within the constraints of cost,time and the number of officials willing and available for interviews. Samples varied insize from 62 in St. Kitts and Nevis (population 41,000; size of public sector 3,000) to 823in Bangladesh (population 126 million; size of public sector more than 100,000). Indetermining sample size, the number of subgroups to be included, and a 0.05 level ofsignificance of the null hypothesis for the mean of the population, were both kept inmind. The sampling unit was the individual official, while the unit of analysis was anorganization. In the case of East Caribbean countries, the unit of analysis was the wholepublic sector.
The response rate in the data sets received thus far was between 80% and 100%. Therewas some item non-response in several countries. For example, item non-responses were50% in Bangladesh when officials were asked what they did when they disagreed withthe opinions of their supervisors.
40 Fink (1995).

17
4. Construction of Indicators for Institutional Environment
The survey findings provide an opportunity to enrich the factual basis of national debateson public sector reform, and to support or refute prior assertions and hypotheses in thelight of the available data. Some other uses of the data require that indicators of theinstitutional environment and performance be constructed.
As explained in Section 2 outlining the conceptual framework, the institutionalenvironment was measured by considering officials' expectations of the incentives andconstraints that would apply in the future in terms of rule credibility, policy credibilityand resource adequacy and predictability. Indicators were constructed with rulecredibility, policy credibility and resource adequacy and predictability measured in termsof these indicators on scales that ranged from 0 to 10, with 0 being the worst and 10being the best. Questions addressed both personnel and expenditure management.
The figure below shows how responses to questions were grouped in constructing theinstitutional environment indicators in East Caribbean countries.41
Figure 5.Construction of indicators for institutional environment in EastCaribbean states
in recordmanagement
in internalaudit
in performanceappraisal (of
individual officials)
in projectevaluation
rule credibility
policyconsistency
policycoordination
politicalmicro-
management
policy credibility
seasonalabsences
necessaryskills
institutionalcapacity
resourceadequacy &predictability
institutional environment
41 In the East Caribbean states, public officials were surveyed in Antigua & Barbuda, Grenadines, St.Kitts & Nevis, St. Lucia and St. Vincent & Grenadines. The same questionnaire was administered in allthese countries. In all settings, the rules for allocating questions were:Does this question capture expectations of current or future constraints and incentives? If not, then it is notsuitable for inclusion in an indicator of the institutional environment. If it does, then does the questioncapture expectations of: (i) rule enforcement in relation to budget or personnel management; (ii) bindingpolicy direction; or (iii) adequacy and predictability of financial and personnel resources?

18
Relevant and related questions were grouped under the same category as shown in theabove figure. Since the responses were all on a verbal scale, they were converted to thesame numerical scale. For uniformity, qualitative responses from all questions wereconverted into numbers on the scale of 0 to 10. For example, yes/no questions wereconverted into “0” and “10”. For questions with four qualitative responses such asalways (1), generally (2), occasionally (3), almost never or never (4), the followingformula was used for the conversion:42
Scaled response = 40/3 – (Un-scaled response)*10/3
After the conversion, the following steps were taken to calculate rule credibility, policycredibility, resource adequacy and predictability, and eventually the institutionalenvironment indicators.43
First, the simple arithmetic average of all responses regarding the same specific aspect ofthe institutional environment (i.e. average of all questions in the same box in Figure 5above) were calculated. Second, after converting responses into numbers on a 0-10 scalemeasures of policy consistency, policy coordination, and political micro-managementwere derived by taking the simple average of the aspects of the institutional environmentunder the same component. Finally, the institutional environment indicator for the wholepublic sector was derived as a simple arithmetic average of the three components of theinstitutional environment.
In more detail, in the East Caribbean example shown in Figure 5, rule credibility wasmeasured by creating an indicator covering the existence and perceived quality of formalrules in four areas: record management, internal audit, performance appraisal, and projectevaluation. 44 Six questions from the survey were utilized. Questions used in that and othersurveys to probe for the dimensions of the institutional environment are set out inAppendix 1. Appendix 2 shows how the environment indicators were constructed forthe East Caribbean states.
42 For consistency, always the positive, e.g., useful, helpful, working, responses were converted to“10,” and negative, e.g., not useful, not helpful, not-working, responses were converted into “0”. Forexample, in the question “Are job openings advertised?” “Yes” was converted into “10,” and “No” wasconverted into “0.” Similarly, in the question “How consistent are the various policies your organization?’“Very consistent” was converted into “10”; “more consistent than consistent” into “6.7”; “moreinconsistent than consistent” into “3.3”; and “very inconsistent” into “0”.43 Aggregating data for indicators entails a delicate tradeoff. All data sets on public officialperceptions are unreliable individually to some degree - and by aggregating several subjective measuresfrom various sources, we can reduce this measurement error somewhat. However, the gain in reliabilityfrom aggregation comes at the expense of a loss in conceptual precision. In other words, the tradeoff isbetween emphasizing individual data sets that may have inaccuracies, and aggregating them to gainaccuracy but with the risk that they become more blunt. This paper seeks to balance the risks involved byaggregating the data within indicators at this point, but subsequently to use the disaggregated data, albeitcautiously, in considering potential reform payoffs (see section 7.4) The risks of aggregation are in anycase less severe in this approach as it entails using data from different questions but within the same survey.44 Later surveys are emphasizing the degree to which the rules are structured to requirecontestability.

19
Policy credibility was measured by creating an indicator covering three dimensions:whether policies were consistent; whether they are coordinated between the units ofgovernment e.g. ministries; and whether political interference/micro- management wasfelt likely. Responses from six questions were used to calculate the policy credibilityindicator as described in Appendix 2.
Resource adequacy and predictability was measured by creating an indicatorcompounded from six questions about: unpredictable seasonal absences of personnel dueto severe weather conditions e.g. hurricane; anticipated supply of necessary skills; andabout more general anticipated capacity. Appendix 2 provides details.
Using a similar method, an overall institutional environment indicator was alsoconstructed on a scale of 0 to 10 (0 = worst, 10 = best) by taking the simple arithmeticmean of the rule credibility, policy credibility and resource adequacy and predictabilityindicators. In this way, as Appendix 2 illustrates, an overall institutional environmentindicator was calculated for the entire public sector of each of the East Caribbean states.
Using this approach, it is possible to measure rule credibility, policy credibility orresource adequacy and predictability of a particular organization (e.g. Finance Ministry)or by types of organizations (e.g. regional administrations) when sufficient data isavailable for each type of organization. This was possible in the Argentina, Bolivia,Guyana and Indonesia data sets, and such calculations were made.

20
5. Construction of Indicators for Performance
Performance was measured in terms of results focus, accountability and employee moraleby asking public officials questions that probed their perceptions of these dimensions ofperformance. To measure how much results focus, accountability and employee morale,relevant indicators were constructed with scales which ranged from 0 to 10 – with 0being the worst and 10 being the best.45 As with the institutional environment indicators,the performance indicators drew on considerations of both personnel management andexpenditure management. Although combined within the indicator, they permitdisaggregated analyses to be undertaken subsequently.
Figure 6. Construction of indicators for performance in East Caribbean states
up-to-dateinformation
trainingeffective
geared toorganization's
objectives
efficiency
merit-basedreward andpunishment
results-focus
in recordmanagement
in projectevaluation
in internalaudit
in performanceappraisal
enforceabilityof regulations
delegation
civil society parliament
to the publicat large
accountability
satisfaction
employeemorale
performance
In the East Caribbean, the degree of results-focus was measured by creating an indicatorcovering: whether an organization’s activities were geared to its objectives; whether theorganization was considered efficient; and whether a merit-based reward and punishmentsystem was in place. Seven questions were utilized. Questions used in that and other
45 In all settings, the rules for allocating questions were:Does this question capture perceptions of past performance? If not, then it is not suitable for inclusion inan indicator of performance. If it does, then does the question capture perceptions of: (i) the degree towhich a concern for results or outputs shaped behavior; (ii) rule-based behavior in relation to budget orpersonnel management; (iii) morale and job satisfaction. In addition, a measure of vertical solitude wasconstructed from the differences in perceptions concerning the environment between managers and theirstaff?
21
surveys to probe for the dimensions of performance are set out in Appendix 3. Appendix4 shows how the performance indicators were constructed for the East Caribbean states.
Accountability was measured by using 15 questions to create an indicator covering, interalia, enforcement of regulations; demonstrated accountability to the public at large, andto civil society and parliament. In assessing the institutional environment, the existenceof credible rules was tested in four areas: record management, project evaluation, internalaudit and performance appraisal. In measuring performance, the past enforcement ofthese rules was tested in the same four areas.
Appendix 4 shows how the performance indicators, including that for accountability,were constructed for the East Caribbean states.
Employee morale was measured by creating an indicator covering employee satisfactionand vertical solitude. Four questions were used to calculate satisfaction indicator asshown in Appendix 4.
Vertical solitude was defined in Section 2.3 above. The indicator for vertical solitude wascalculated by first scoring managers’ perception of each aspect of the institutionalenvironment and then the general officials’ perceptions of the same. Then, the (absolutevalue) difference of these scores in each aspect was averaged to yield an indicator ofvertical solitude.46
The overall performance indicator was calculated by taking the simple arithmetic mean ofthe results-focus, accountability, and employee morale.
46 This formula was adopted from suggestions by Jeff Rinne of PRMPS.

22
6. The Connection between Performance and Institutional Environment
To describe and quantify the relationship between performance and institutionalenvironment, a simple model was used. Aggregate performance and its threecomponents, i.e., results focus, accountability for formal rules, and employee moralewere regressed on institutional environment. Accordingly, performance, Yi, was modeledas a function of institutional environment (IEi), and an error term ei
47:
Yi = a + b IEi + ei
On current assumptions, for the Bolivian public sector there is a statistically significantpositive relationship between institutional environment and performance indicators. Theestimation result for Bolivia was the following:48
Aggregate Performance = 0.47 + 0.74 (Institutional Environment)
t-value = 5.54R2 = 0.70Number of observations = 15
Figure 7 is the result of cross-tabulation of institutional environment and aggregateperformance indicators for 15 different public organizations in Bolivia. It shows therelationship between performance and institutional environment. Similarly, the effect ofinstitutional environment on each performance area was tested. Strong relations existedbetween the institutional environment and each area of performance. The associatedcharts are provided in Appendix 5.
47 An error term was attached to capture measurement errors, random variations, as well as otherdeterminants that have been omitted from the equation.48 It is important to note that the aggregation of questions to construct the indicators is a question ofjudgment, although simple and explicit rules are used to minimize variations. These results may change asthe country papers are prepared if the grouping of questions is altered.

23
Thus there is empirical evidence that:• Institutions do indeed matter; 49 and• Some performance areas are more susceptible to the institutional environment than
others.50
Figure 7. Performance and Institutional Environment in sampled Bolivianpublic sector organizations
PERFORMANCE: INSTITUTIONAL ENVIRONMENT
agrarian reform
audit
central bank
telecom-regulation
banking-regulation
labor
ine
education
Santa Cruz
road
agriculturecustoms
tax
finance
udape
y = 0.7429x + 0.4709R
2 = 0.7026
4
5
6
7
8
5 6 7 8 9
institutional environment
perf
orm
ance
49 This assertion was based on differences in the estimated coefficients, i.e., slope, and in goodness-of-fit measures, i.e. R2, for the relationships between institutional environment and three differentcomponents of performance—which are presented in Appendix 5.50 This same relationship is being tested using data sets from the public sectors of Armenia, Bolivia,East Caribbean states, and Guyana. Results of these tests will provide more empirical evidence.

24
7. Presenting Opportunities for Reforms
To offer some options for consideration by policy-makers, four steps were taken asdescribed below. The first step emphasizes the importance of presenting policy-makerswith robust confirmation of the theory-based assertion that it is the institutionalenvironment in general, and rule credibility, policy credibility, and resource adequacyand predictability in particular, which drive performance.
Having made this point and having attracted attention to the question of how and whenthat environment can be changed, the second step is to maximize access to the data toencourage policy-makers and advisers to contest possible interpretations and to suggestlocally appropriate reform interventions. The contextual description of the public sector,including characteristics of respondents, their reasons for joining the public sector and thelength of time worked in government, enrich the factual basis of these discussions.
The third step is to examine any prior assertions and topical reforms in light of theavailable data. In testing country-specific hypotheses, myths that have been consolidatedthrough repetition rather than observation can be supported with evidence or refuted.
Finally, where feasible, as an encouragement to further debate, a particular heuristicapproach is employed to move beyond theory into an empirical investigation of whichinstitutions matter in particular and where might the largest "performance pay offs" befound.
7.1 Step 1 – it’s the institutions not the people
In all settings where the surveys have been undertaken, a summary country report sets outthe evidence that supports the theory-based assertion that it is the institutionalenvironment in general, and rule credibility, policy credibility, and resource adequacyand predictability in particular, which drive performance.
In making this point, the intention is to deter simplistic denigration of government orpublic officials. Although there is every reason to be concerned about poor performanceand rent-seeking by some public officials, there are as many reasons to be impressed bythe selflessness and determination of others working under conditions of extremedifficulty. Setting out the evidence offers an approach for understanding both good andbad performance and for presenting the results to policy makers in a format that lead tomore informed choices about reform interventions.
25
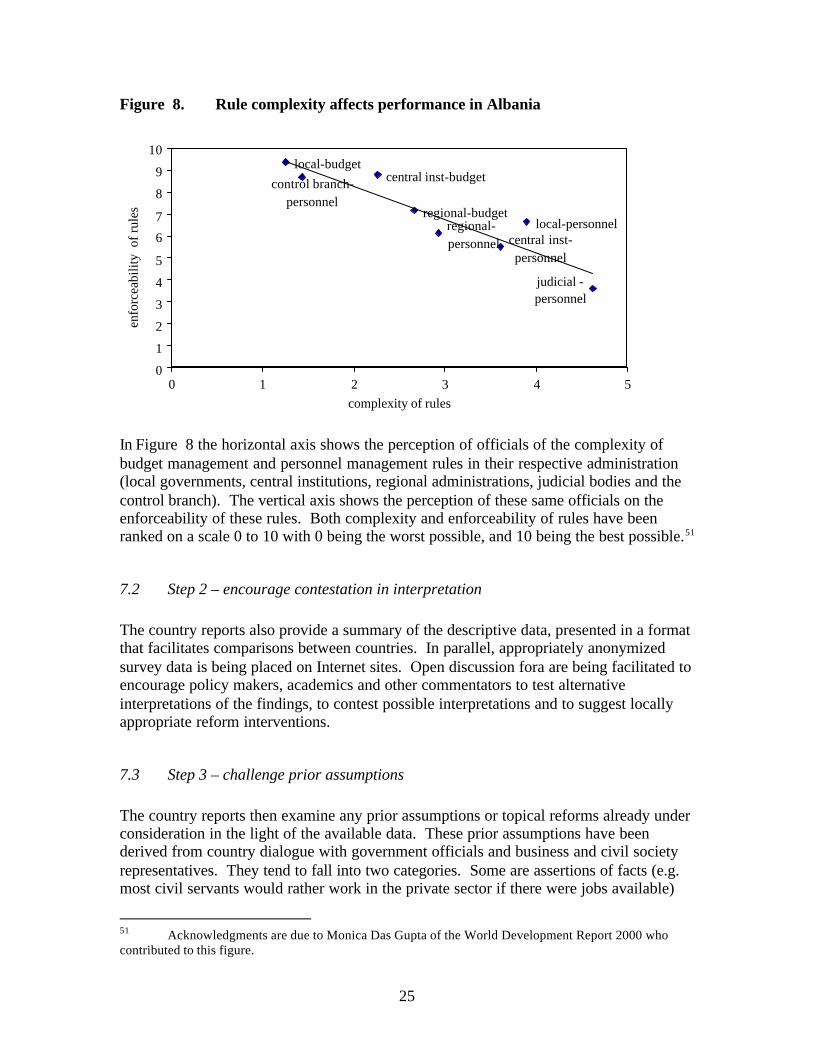
Figure 8. Rule complexity affects performance in Albania
local-budget
regional-budget
central inst-budget
local-personnelregional-personnel central inst-
personnel
control branch-personnel
judicial -personnel
0
1
2
3
4
5
6
7
8
9
10
0 1 2 3 4 5complexity of rules
enfo
rcea
bilit
y o
f rul
es
In Figure 8 the horizontal axis shows the perception of officials of the complexity ofbudget management and personnel management rules in their respective administration(local governments, central institutions, regional administrations, judicial bodies and thecontrol branch). The vertical axis shows the perception of these same officials on theenforceability of these rules. Both complexity and enforceability of rules have beenranked on a scale 0 to 10 with 0 being the worst possible, and 10 being the best possible.51
7.2 Step 2 – encourage contestation in interpretation
The country reports also provide a summary of the descriptive data, presented in a formatthat facilitates comparisons between countries. In parallel, appropriately anonymizedsurvey data is being placed on Internet sites. Open discussion fora are being facilitated toencourage policy makers, academics and other commentators to test alternativeinterpretations of the findings, to contest possible interpretations and to suggest locallyappropriate reform interventions.
7.3 Step 3 – challenge prior assumptions
The country reports then examine any prior assumptions or topical reforms already underconsideration in the light of the available data. These prior assumptions have beenderived from country dialogue with government officials and business and civil societyrepresentatives. They tend to fall into two categories. Some are assertions of facts (e.g.most civil servants would rather work in the private sector if there were jobs available)
51 Acknowledgments are due to Monica Das Gupta of the World Development Report 2000 whocontributed to this figure.
26
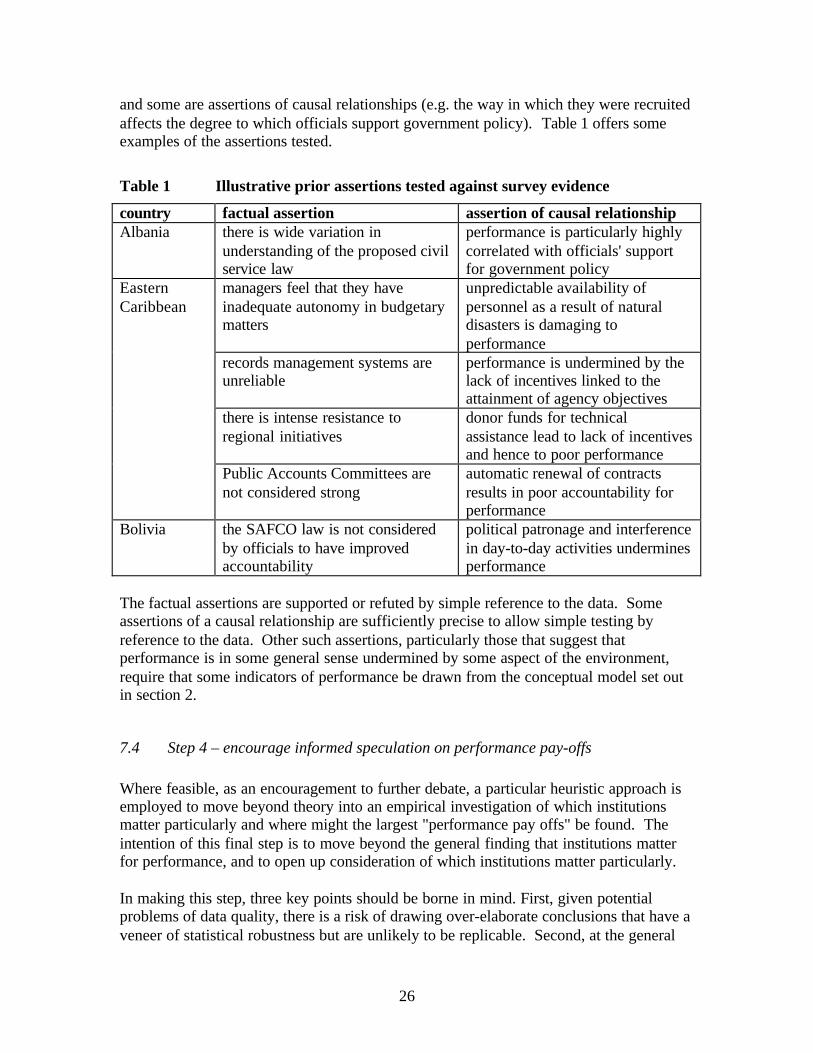
and some are assertions of causal relationships (e.g. the way in which they were recruitedaffects the degree to which officials support government policy). Table 1 offers someexamples of the assertions tested.
Table 1 Illustrative prior assertions tested against survey evidence
country factual assertion assertion of causal relationshipAlbania there is wide variation in
understanding of the proposed civilservice law
performance is particularly highlycorrelated with officials' supportfor government policy
managers feel that they haveinadequate autonomy in budgetarymatters
unpredictable availability ofpersonnel as a result of naturaldisasters is damaging toperformance
records management systems areunreliable
performance is undermined by thelack of incentives linked to theattainment of agency objectives
there is intense resistance toregional initiatives
donor funds for technicalassistance lead to lack of incentivesand hence to poor performance
EasternCaribbean
Public Accounts Committees arenot considered strong
automatic renewal of contractsresults in poor accountability forperformance
Bolivia the SAFCO law is not consideredby officials to have improvedaccountability
political patronage and interferencein day-to-day activities underminesperformance
The factual assertions are supported or refuted by simple reference to the data. Someassertions of a causal relationship are sufficiently precise to allow simple testing byreference to the data. Other such assertions, particularly those that suggest thatperformance is in some general sense undermined by some aspect of the environment,require that some indicators of performance be drawn from the conceptual model set outin section 2.
7.4 Step 4 – encourage informed speculation on performance pay-offs
Where feasible, as an encouragement to further debate, a particular heuristic approach isemployed to move beyond theory into an empirical investigation of which institutionsmatter particularly and where might the largest "performance pay offs" be found. Theintention of this final step is to move beyond the general finding that institutions matterfor performance, and to open up consideration of which institutions matter particularly.
In making this step, three key points should be borne in mind. First, given potentialproblems of data quality, there is a risk of drawing over-elaborate conclusions that have aveneer of statistical robustness but are unlikely to be replicable. Second, at the general

27
level, interpretation of the survey data is strongly guided by theory. As section 2indicates, theory gives us every reason to believe that institutions affect performance andthat rule credibility, policy credibility, and resource adequacy and predictability arestrongly implicated. However, theory provides no guidance on which of theseinstitutional arrangements matter most and the findings at this disaggregated level arepurely empirical. Finally, the model that has been developed is plausible but only onefrom very many that could have been constructed. In the country studies that offerdetailed results, the model is only used to develop one set of interpretations wheredialogue with government and World Bank operational staff suggest that this is useful.
The key stages in making an informed speculation on performance pay-offs are asfollows:
Stage 1 - Develop an appropriate model
Model I
Performance = f (Institutional Environment).
This model has already been estimated in the previous section. It showed that predictedcorrelations are high when simple averages of the elements of institutional environment isregressed against aggregate performance as well as its three main components.
However, this information by itself is not enough for decision-makers in governments.They already know that performance is sometimes low because of weaknesses in theinstitutional environment; and if they could improve the whole institutional environment,the overall performance would improve. They need more precision. The logical next stepis to move from Model I towards one in which the institutional environment isdisaggregated into its components.
Model II
Performance = g (Rule Credibility, Policy Credibility, Resource Adequacy andPredictability).
Estimating Model II will also not give enough detailed information. Decision-makers ingovernment will agree that improving policy credibility can improve performance, butthey will still ask what specifically they need to do to improve performance.Accordingly, a third model is required to capture the relationship between performanceand particular elements of the institutional environment. This third model needs to bedisaggregated enough to provide input for reform interventions. Improving theinstitutional environment as a method for improving performance is a practical strategyonly if we can assess which particular elements of the institutional environment reallymatter. In other words, decision-makers are looking for reliable answers on the followingquestions:
28
• Which reform efforts are most likely to succeed?• Will the same intervention be equally effective across the whole public sector or even
within the same sorts of organizations?
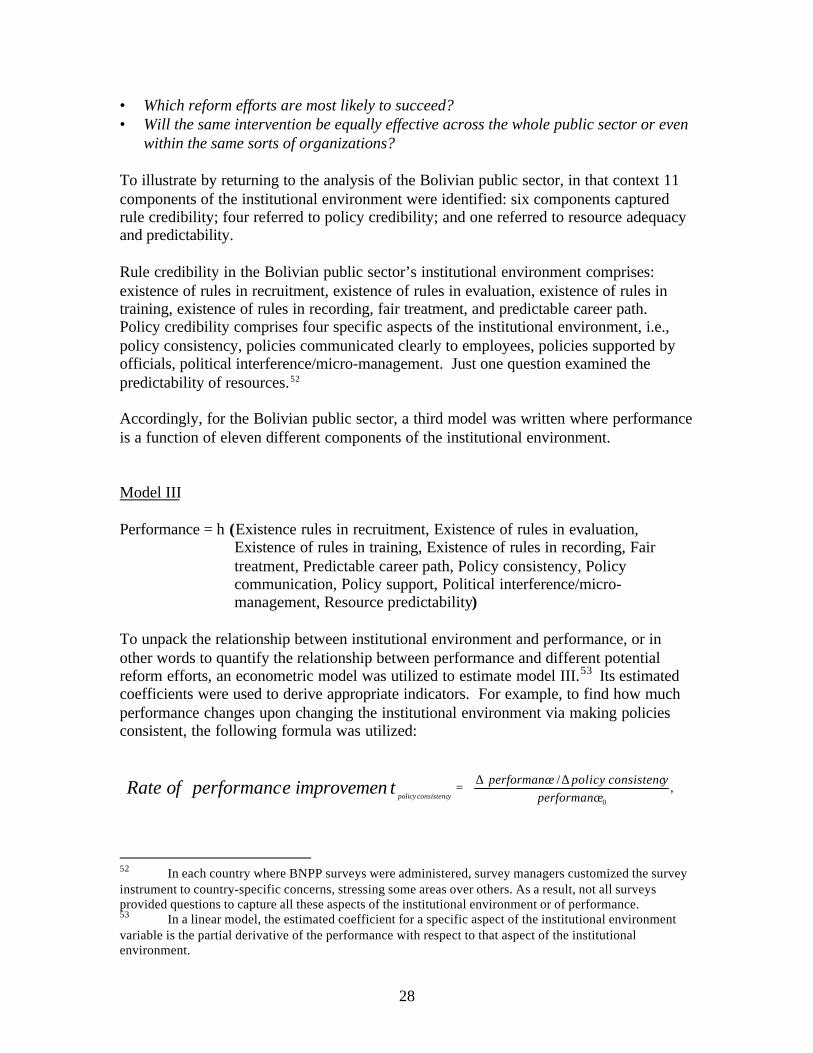
To illustrate by returning to the analysis of the Bolivian public sector, in that context 11components of the institutional environment were identified: six components capturedrule credibility; four referred to policy credibility; and one referred to resource adequacyand predictability.
Rule credibility in the Bolivian public sector’s institutional environment comprises:existence of rules in recruitment, existence of rules in evaluation, existence of rules intraining, existence of rules in recording, fair treatment, and predictable career path.Policy credibility comprises four specific aspects of the institutional environment, i.e.,policy consistency, policies communicated clearly to employees, policies supported byofficials, political interference/micro-management. Just one question examined thepredictability of resources.52
Accordingly, for the Bolivian public sector, a third model was written where performanceis a function of eleven different components of the institutional environment.
Model III
Performance = h (Existence rules in recruitment, Existence of rules in evaluation,Existence of rules in training, Existence of rules in recording, Fairtreatment, Predictable career path, Policy consistency, Policycommunication, Policy support, Political interference/micro-management, Resource predictability)
To unpack the relationship between institutional environment and performance, or inother words to quantify the relationship between performance and different potentialreform efforts, an econometric model was utilized to estimate model III.53 Its estimatedcoefficients were used to derive appropriate indicators. For example, to find how muchperformance changes upon changing the institutional environment via making policiesconsistent, the following formula was utilized:
52 In each country where BNPP surveys were administered, survey managers customized the surveyinstrument to country-specific concerns, stressing some areas over others. As a result, not all surveysprovided questions to capture all these aspects of the institutional environment or of performance.53 In a linear model, the estimated coefficient for a specific aspect of the institutional environmentvariable is the partial derivative of the performance with respect to that aspect of the institutionalenvironment.
,/
0eperformancyconsistencpolicyeperformanctimprovemeneperformancofRate
yconsistencpolicy
∆∆=

29
.
,/,
0 leveleperformancinitialeperformanc
andyconsistencpolicy
eperformancyconsistencpolicyeperformancwhere
=∂
∂=∆∆
Stage 2 – examine institutional rates of return
The illustrative equation below shows the percentage change in performance throughmaking policies consistent. In that sense, it is the rate of return on reform effort to makepolicies consistent. Therefore, it is called the institutional rate of return of policyconsistency (or policy consistency IRR):
In general, a comparatively high-value IRR for any reform effort means that theintervention is more likely to have a bigger impact on performance than another withlow-value. A comparatively low value would indicate that the effort is less likely to haveimpact and should not be taken up if considerable results are desired. IRRs can becalculated for each of the eleven reform interventions listed above in the Bolivianexample.
A detailed econometric model specification, the estimation method, regression results,and how the estimated coefficients were used in deriving IRRs for the Bolivian publicsector (based on this formula which was described above) are all presented in Appendix6. Since all the input variables are capturing institutional environment, it is theoreticallypossible that the input variables are correlated. For example, rule credibility could beassociated with resource predictability. However, two factors ensure thatmulticollinearity is not a serious problem. First, as the model is offered as a heuristicdevice for attracting policy-makers attention to particular points of entry to reform, this isnot a particular drawback provided that any correlation is positive. If policy credibilitywere to deteriorate as resource predictability improved, the resulting combined effectwould be hard to interpret. However, in all the survey results analyzed to date thecorrelation where it exists has been positive. Second, multicollinearity is a samplephenomenon as well as a theoretical one. A good rule of thumb is to find variables thatare theoretically relevant (for meaningful interpretation) and that are also statistically nonmulti-collinear (for meaningful inference). As the correlation matrix in Appendix 6shows, the correlation coefficients between the explanatory variables in the Bolivia dataare low. 54
The term "Institutional Rate of Return" has been coined deliberately to echo the morecommon Internal Rate of Return. Its purpose is to draw attention to the heterogeneous
54 In addition to presenting this matrix, Appendix 6 further explains how survey responses wereconverted to a binary mode thus lowering correlation among the explanatory variables.
0
/eperformanc
yconsistencpolicyeperformancIRR yconsistencpolicy
∆∆=

30
results that are likely to be obtained from varying different elements of the institutionalenvironment. It should not however be taken to imply greater accuracy than is actuallypossible at the present stage of development of this methodology. Given the imprecisionof the measure, IRRs are used to rank order expected payoffs by type of intervention orchange in institutional arrangements or practices, rather than to predict exact performanceimprovements.
Stage 3 - Identify anticipated performance pay offs
As noted, IRRs are intended to draw attention to the varying results that are anticipatedfrom different interventions, but given their probable imprecision it is the generalmagnitude of the pay off rather than the exact value that is relevant for policy makers.
The following table presents the potential reform interventions to improve institutionalperformance in the public sector of Bolivia. Only those reform interventions where IRRswere statistically significant for one-tailed test are identified. (For details, see Appendix6.) Reform interventions with statistically significant IRRs are classified according towhether they are likely to impact on one, two or three areas of performance.

31
Table 2 Reform Interventions and anticipated performance pay offs in theBolivian public sector55
Reform Intervention Improvement in PerformanceNumberof areasaffected
Resultsfocus
Accountability
EmployeeMorale
Strengthening the credibility of rules forevaluation 3 ü ü ü Strengthening the credibility of rules forrecord management 3 ü ü ü Ensuring that staff support governmentpolicy 3 ü ü ü
Strengthening the credibility of rules fortraining 2 ü ü Preventing political interference/micro-management 2 ü ü Assuring staff that they are treated fairly
2 ü ü
Strengthening the credibility of rules forrecruitment 1 ü Making government policies consistent
1 ü
Figure 9 demonstrates how these anticipated payoffs accumulate to distinguish betweenthe degrees to which each reform intervention is expected to impact on performance.
55 See footnote 48.

32
Figure 9. Expected impact of reforms on components of performance inBolivia56
Reform Interventions affecting three performance areas.
13%
13%
17%
11%
14%
7%
6%
8%
7%
0% 10% 20% 30% 40%
strengthening credibility ofrules for evaluation
strengthening credibility ofrules for record management
ensuring staff support forgovernment policies
Reform Intervention
Percentage increase in present level of performance
results focus accountability employee morale
Reform Interventions affecting two performance areas.
9%
8%
15%
7%
2%
18%
0% 10% 20% 30%
strengthening credibilityof rules for training
preventing politicalintervention/micro-
management
assuring staff of fairtreatment
Reform Intervention
Percentage increase in present level of performance
Reform Interventions affecting one performance area.
3%
3%
0% 3% 5%
strengthening credibility ofrules for recruitment
Reform Intervention
Percentage increase in present level of performance
56 The unit of measurement for the improvement in the performance due to a reform intervention isthe percentage change in the present level of performance. For details, see Appendix A6.4.

33
Decision-makers in government having limited resources to invest in public sector reformwill want to be in a position to choose interventions that will probably result in betterperformance. The information presented in Table 2 and Figure 9 allows them toprioritize among possible interventions. Available resources can be concentrated on thoseinterventions that affect all three or at least two areas of performance. Bolivian decision-makers would probably choose to strengthen rules in performance evaluation and recordkeeping and work to ensure that officials are committed to supporting governmentpolicies.
This same analysis can be performed for a type of organization (e.g. centralizedadministrations in Bolivia), a particular organization (e.g. the Ministry of Finance or aparticular group of officials such as consultants). Appendix 6 presents the findings forcentral administrations in Bolivia.57
57 For IRRs of all types of organizations and groups of officials, see forthcoming Bolivia countryreport by Yasuhiko Matsuda and the authors of this paper.
34
8. Summary
The public sector is a diverse environment in which to work. Although there are somegeneral conclusions that can be drawn, staff perform better or worse in different agenciesfor highly diverse reasons. The Anna Karenina principle applies: “all well-performingagencies are alike; there are so many preconditions for effective performance that everydysfunctional agency is dysfunctional in its own way”. 58
To perform well, public officials need to be confident about the future – not to the pointof smugness, but certainly to the point that they can see the relationship between theirefforts and any eventual outcome. The institutional environment within which they areworking shapes these expectations. If the rules are not credible, with little prospect ofenforcement, if they expect policies to be contradicted or resources to flow unpredictably,then they cannot envision any relationship between their effort and public sectorperformance. Rationally, there is little point in working purposefully as the results are souncertain.
This paper sets out an analytical framework that was used in designing a series of surveysof the views of public officials concerning their institutional environment and inanalyzing the information that was generated. It describes how the survey results help tomap the strengths and weaknesses of a public sector, and offers an approach foridentifying potential pay-offs from reform interventions. Above all, the frameworkemphasizes the heterogeneity of incentives and institutional arrangements within thepublic sector – and the need for policy makers to have information that moves beyondgeneralities and indicates what is most likely to work and where.
In building on the premise that public officials’ actions – and hence the performance oftheir organizations – depend upon the institutional environment in which they findthemselves, this framework avoids any simplistic anti-government positions, withoutattempting a defensive justification for poor performance. Although there is every reasonto be concerned about poor performance and rent-seeking by some public officials, thereare as many reasons to be impressed by the selflessness and determination of othersworking under conditions of extreme difficulty. This framework offers an approach forunderstanding both good and bad performance and for presenting the results to policymakers in a format that lead to more informed choices about reform interventions.
The methodology depended on use of indicators to measure both institutionalenvironment and performance, but the measures need to be interpreted with caution. Asin the design of any performance indicators, it is important to ask: who wants theindicators, who uses them and why. The reliability and the usefulness of indicatorsdepend on the credibility of the information on which they were built, on the accuracyand comprehensiveness of the data. Finally, indicators are not the ends, they are a meansfor decision makers to raise questions and highlight issues for further discussion andinvestigation in the light of local, country-specific knowledge. Indicators are not precise 58 Tolstoy’s original words were that “Happy families are all alike; every unhappy family is unhappyin its own way”. Gary Reid pointed out the relevance of the observation for public sector performance.

35
measures, they do not provide comprehensive coverage of all areas of an individual's oragency's work, and they can not tell the whole story.

36
Selected Bibliography
Aberbach, Joel D., Robert D. Putnam, and Bert A. Rockman. 1981. Bureaucrats andPoliticians in Western Democracies, Boston, MA.: Harvard University Press.
Acs Z. J., and D. A. Gerlowski. 1996. Managerial Economics. New Jersey, Prentice Hall.
Australian Public Service and Merit Protection Commission, 1998. State of the ServiceReport 1997-9, Canberra: Public Service Commissioner.
Axelrod, Robert, and Keohane, Robert. 1985. "Achieving Cooperation Under Anarchy:Strategies and Institutions". World Politics. 38-1: 226-254.
Bendor, Jonathan, and Mookherjee, Dilip. 1987. "Institutional Structure and the Logicof Ongoing Collective Action". The American Political Science Review. 81-1:129-154.
Carter, N, R. Klein, and P. Day (1995) How Organizations Measure Success: The Use ofPerformance Indicators in Government. London: Routledge.
DiIulio, Jr. John D. 1994. "Principled Agents: The Cultural Bases of Behavior in aFederal Government Bureaucracy." Journal of Public Administration Researchand Theory, 3: 277-318.
Evans Gord and Manning Nick. 2000. "A practical approach to assessing centralgovernment policy-making institutions in cabinet government: learning lessonsfrom recent World Bank institutional analyses". Unpublished World Bank paper,(http://www1.worldbank.org/publicsector/toolkits.htm)
Fink, Arlene. 1995. How to Sample Surveys. The Survey Kit, California: SagePublications.
Girishankar, Navin. 1999. Reforming Institutions for Service Delivery: A framework forDevelopment Assistance with an Application to the Health, Nutrition andPopulation Portfolio, Policy Research Working Paper No. 2039, WashingtonD.C., The World Bank.
Gore, Al. 1993. Creating a Government that Works better and Costs Less: The Report ofthe National Performance Review. New York: Plume.
Greene, William H. 2000. Econometric Analysis, Fourth Edition, New Jersey: PrenticeHall.
37
Grindle, Merilee S. 1997. (Editor) Getting Good Government: Capacity Building in thePublic Sectors of Developing Countries. Harvard Studies in InternationalDevelopment. Boston: Harvard Institute for International Development.
Heyman, David B. 1988. “Input Controls in the Public Sector: What Does EconomicTheory Offer?” IMF Working Paper, Washington D.C.: International MonetaryFund.
Horn, Murray J. 1995. The Political Economy of Public Administration: InstitutionalChoice in the Public Sector. New York: Cambridge University Press.
Jans, Nick and Frazer-Jans Judy. 1989. Careers and Culture in the SES, Canberra:Australian Government Publishing Service.
Kaufmann, Daniel, Sanjay Pradhan and Randi S. Ryterman. 1998. New Frontiers inDiagnosing and Combating Corruption. World Bank PREM Note No. 7:Washington, DC.
Kaufmann, Daniel, Aart Kraay and Pablo Zoido-Lobaton. 1999. AggregatingGovernance Indicators, and, Governance Matters. World Bank Policy ResearchWorking Papers Nos. 2195 & 2196: Washington D.C.www.worldbank.org/wbi/gac.
Klitgaard, Robert E. 1997. “Cleaning Up and Invigorating the Civil Service.” PublicAdministration and Development (U.K.) 17: 487 – 509.
Knack, Steve and Nick Manning. 2000. Policy attributes. Unpublished World Bankdocument.
McCubbins, Matthew D., and Thomas Schwartz. 1984. "Congressional OversightOverlooked: Police Patrols versus Fire Alarms." American Journal of PoliticalScience, 28: 165-79.
McCubbins, Matthew D., Roger G. Noll, and Barry R. Weingast. 1987. "AdministrativeProcedures as Instruments of Political Control." Journal of Law, Economics, andOrganization, 3: 243-77.
__________. 1989. "Structure and Process, Politics and Policy: AdministrativeArrangements and the Political Control of Agencies." Virginia Law Review, 75:431-482.
Manning, Nick and Oliver James. 2000. Regulation within the public sector- draftbackground paper. Unpublished World Bank document.
38
Manning, Nick, Ranjana Mukherjee, and Omer Gokcekus. March 2000. The experienceof public officials in Bolivia: What works in a weak institutional environment?Unpublished World Bank document.
Milgrom, Paul, and J. Roberts. 1992. Economics, Organization, Management, NewJersey: Prentice Hall.
Miller, Gary J. 1992. Managerial Dilemmas: The Political Economy of Hierarchy. NewYork: Cambridge University Press.
Mnookin and Kornhauser. 1988. "Bargaining in the Shadow of the Law: The Case ofDivorce," Yale Law Journal 88: 950-972
Moe, Terry M. 1984. "New Economics of Organization." American Journal of PoliticalScience, Vol. 28, No. 4. pp. 739-777.
__________. 1990. "The Politics of Structural Choice: Toward a Theory of PublicBureaucracy." In Oliver E. Williamson (ed.), Organization Theory: From Chester
Barnard to the Present and Beyond. New York: Oxford University Press.
Nunberg, Barbara, and John Nellis. 1995. Civil Service Reform and the World Bank.World Bank Discussion Papers; No. 161.
OECD, 1994a. Public Service Pay Determination and Pay Systems in OECD Countries,Paris: Organization for Economic and Cooperative Development.
__________. 1994b. Performance Management in Government: PerformanceMeasurement and Results- Oriented Government, Public ManagementOccasional Papers 1994 No. 3.
__________. 1999. Elements of Model Civil Service Laws for Developing Nations athttp://www.oecd.org/puma/sigmaweb/acts/civilservice/cslaws.htm; Civil ServiceLegislation: Checklist on Secondary Legislation (and other RegulatoryInstruments) at http://www.oecd.org/puma/sigmaweb/pubs/ENGPDF/sp14.pdf,both from OECD’s SIGMA program.
Osborne, David and Peter Plastrik. 1997. Banishing Bureaucracy: The Five strategies forReinventing Government. New York: Plume.
PricewaterhouseCoopers Endowment for the Business of Government. 2000. Results ofthe Government Leadership Survey: A 1999 Survey of Federal Executives athttp://www.pwcglobal.com/gx/eng/ins-sol/main/index.html
Przeworski, Adam. 1999. “On the Design of the State: A Principal-Agent Perspective” inLuiz Carlos Bresser Pereira and Peter Spink (eds.), Reforming the State:Managerial Public Administration in Latin America. Boulder. Colo.: LynneRienner.
39
Rea, Louis and Richard Parker. 1997. Designing and Conducting Survey Research: AComprehensive Guide, San Francisco: Jossey-Bass Publishers.
Recantini, Francesca, Scott Wallsten and Lixin Xu. 2000. “Surveying Surveys andQuestioning questions: Learning from the World Bank Experience”. World BankPolicy Research Working Paper No. 2307, Washington D.C.: The World Bank.
Seabright, Paul. 1993. "Managing Local Commons: theoretical issues in incentivedesign". The Journal of Economic Perspectives. 7-4: 113-134.
Schein, Edgar H. 1996. “Three Cultures of Management: The key to organizationalLearning” in Sloan Management Review, Fall 1996.
Selznick, Philip. 1957. Leadership in Administration: A Sociological Interpretation,University of California Press (1984, reprint version).
Simon, Herbert A., “Organizations and Markets,” Journal of Economic Perspectives,Vol. 5, No. 2 (Spring 1991): 25-44
Stevens, Mike 1994. Preparing for Civil Service pay and Employment: a Primer inRehabilitating Government: Pay and Employment Reform in Africa ed. David L.Lindauer and Barbara Nunberg, Washington D.C.: The World Bank.
Shand, D. 1997. The Role of performance Indicators in Public Expenditure Management,Unpublished IMF document.
Simon, Herbert A. 1974. Administrative Behavior: A study of decision-making processesin administrative organization, New York: Free Press.
__________. 1991. Organizations and Markets. Journal of Economic Perspectives, Vol.5, No. 2 (Spring 1991): 25-44.
Tendler, Judith. 1997. Good government in the tropics. Baltimore, Md.: Johns HopkinsUniversity Press.
Weingast, Barry R. and Mark J. Moran. 1983. "Bureaucratic Discretion or CongressionalControl? Regulatory Policymaking by the Federal Trade Commission" in Journalof Political Economy (U.S.); 91:765-800.
Williamson, Oliver E. 1975. Markets and Hierarchies, analysis and antitrustimplications: a study in the economics of internal organization, New York: FreePress.
Wilson, James Q., 1989. Bureaucracy: what government agencies do and why they do it,New York: Basic Books.
40
World Bank, 1994. Governance: the World Bank’s Experience. Washington D.C.: TheWorld Bank.
__________. 1998. New Frontiers in Diagnosing and Combating Corruption, PREMNotes Number 7, October 1998. Washington D.C., The World Bank.
__________. 1999. Report No. 19211 Civil Service Reform A Review of World BankAssistance April 27, 1999 Operations Evaluation Department.
__________. 2000. Reforming Public Institutions and Strengthening Governance: AWorld Bank Strategy. http://www-wbweb.worldbank.org/prem/prmps
Zussman, David and Jabes, Jak. 1989. The Vertical Solitude: Managing in the PublicSector, Halifax: The Institute for Research on Public Policy

41
Appendices
Appendix 1: Illustrative questions to probe for dimensions of the institutionalenvironment59
The test applied in grouping these questions was that these questions capture expectationsof current or future constraints and incentives - and thus the degree to which officials arediscounting the future and management is maintaining its reputation in relation to:
1. rule enforcement in relation to budget or personnel management;2. binding policy direction;3. adequacy and predictability of financial and personnel resources.
Rule Credibilitya. personnel management rules
Within an organization, different people are hired for different reasons. This survey is interested in learning aboutgeneral hiring trends. In your organization would you say that employees were hired more often for:1. good performance at entry2. test qualifications3. met job requirements4. personal connections5. political connections6. family status in community7. payment of gift to some8. public authorities9. knew a senior official
(Guyana)Does your organization have a system where annual objectives/ targets that are measurable are agreed to betweenemployees and supervisors at the beginning of every year? (yes/no)
(Guyana)What is your assessment of the existing formal, written guidelines related to personnel management? Please tell us theextent to which you agree with the following statements. Answer on a scale of 1 to 4, where 1 corresponds to ‘stronglydisagree’ and 4 corresponds to ‘strongly agree’1. relatively simple to understand and implement2. relatively flexible, providing our organization with a lot of discretion in their implementation3. helpful for effective personnel management
(Macedonia)Now, we will ask you a series of questions about all types of payments in addition to basic salary. Please answer foreach of the following types of payments. This type of payment is distributed on the basis of
1. Clear rules2. Rules that require/allow for some discretion3. Full discretion, not on the basis of any rules
____ (i) public transportation allowance____ (ii) food allowance____ (iii) holiday payment (K-15),____ (iv) payment for overtime work,____ (v) bonuses for innovation and rationalization,_____ (vi) membership in Boards of Managers____ (vii) other bonuses or premia
(Macedonia)
59 The questions themselves were developed by individual survey task managers and they may havedrawn from several different sources in preparing them. The sources are not all known and thus exactcitations can not be provided for each question.

42
Are positions like yours generally advertised to the public? (yes/no)(Bolivia)
In your organization, would you say that the employees are hired more often for:1. Performance on an examination2. Personal connections 3. Political connections4. Family relations5. Payment or gift to some public authorities6. Good CV
(Bolivia)Does your organization have Individual Annual Operations Plans (POAI) for its employees? (yes/no)
(Bolivia)Can an employee appeal a dismissal? (yes/no)
(Bolivia)Does your organization have a Human Resource Management Information System (HRMIS) containing records ofemployees? (yes/no)
(East Caribbean States)As far as you know, does your organization have a stated performance appraisal system? (yes/no)
(East Caribbean States)Are the criteria for appraisal known to you? (yes/no)
(East Caribbean States)
b. budget management rules
For each of the following aspects of budget management, does your organization have formal, written guidelinesdescribing how these functions are to be carried out. If so, are they carried out in full, in part, or not at all? Pleaseanswer on a scale of 1 to 4, where 1 corresponds to “not at all” and 4 corresponds to “yes, in full”� budget preparation� procurement� budget execution� audit� production of final end-of-year accounts
(Macedonia)What is your assessment of the existing formal, written guidelines related to budget management? Please tell us theextent to which you agree with the following statements. Answer on a scale of 1 to 4, where 1 corresponds to ‘stronglydisagree’ and 4 corresponds to ‘strongly agree’• relatively simple to understand• relatively flexible• helpful for effective and efficient planning of programs/activities
(Macedonia)Are there rules in place, which govern security, movement, and storage of financial records?
(Macedonia)Does your organization have an internal audit function? (yes/no)
(East Caribbean States)
c. general rules
Are there rules in place, which govern security, movement, and storage of records? (yes/no)(Macedonia)
Is there a formal system of evaluating programs/ projects being implemented by your organization? (yes/no)(East Caribbean States)
Policy Credibility
Agencies receive instructions and policies from different parts of the government, some complement each other, othersconflict. Overall, how do you see the relationship between these various instructions/ policies?1. very consistent2. more consistent than inconsistent
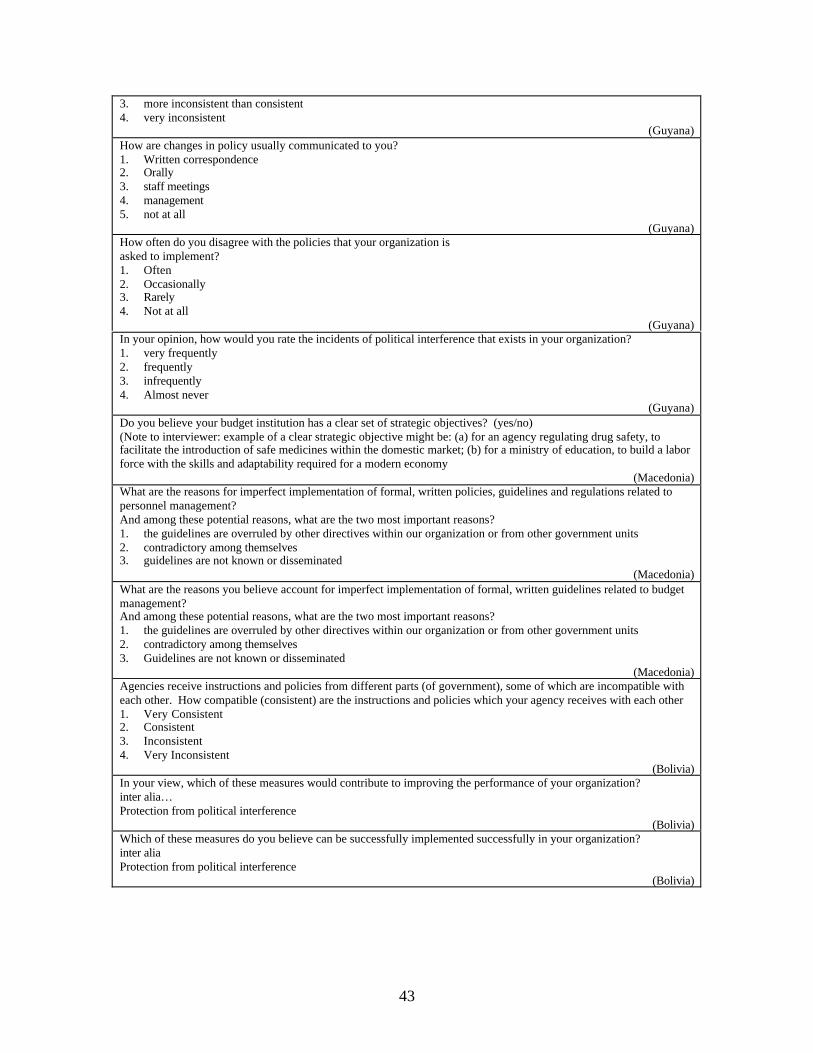
43
3. more inconsistent than consistent4. very inconsistent
(Guyana)How are changes in policy usually communicated to you?1. Written correspondence2. Orally3. staff meetings4. management5. not at all
(Guyana)How often do you disagree with the policies that your organization isasked to implement?1. Often2. Occasionally3. Rarely4. Not at all
(Guyana)In your opinion, how would you rate the incidents of political interference that exists in your organization?1. very frequently2. frequently3. infrequently4. Almost never
(Guyana)Do you believe your budget institution has a clear set of strategic objectives? (yes/no)(Note to interviewer: example of a clear strategic objective might be: (a) for an agency regulating drug safety, tofacilitate the introduction of safe medicines within the domestic market; (b) for a ministry of education, to build a laborforce with the skills and adaptability required for a modern economy
(Macedonia)What are the reasons for imperfect implementation of formal, written policies, guidelines and regulations related topersonnel management?And among these potential reasons, what are the two most important reasons?1. the guidelines are overruled by other directives within our organization or from other government units2. contradictory among themselves3. guidelines are not known or disseminated
(Macedonia)What are the reasons you believe account for imperfect implementation of formal, written guidelines related to budgetmanagement?And among these potential reasons, what are the two most important reasons?1. the guidelines are overruled by other directives within our organization or from other government units2. contradictory among themselves3. Guidelines are not known or disseminated
(Macedonia)Agencies receive instructions and policies from different parts (of government), some of which are incompatible witheach other. How compatible (consistent) are the instructions and policies which your agency receives with each other1. Very Consistent 2. Consistent3. Inconsistent 4. Very Inconsistent
(Bolivia)In your view, which of these measures would contribute to improving the performance of your organization?inter alia…Protection from political interference
(Bolivia)Which of these measures do you believe can be successfully implemented successfully in your organization?inter aliaProtection from political interference
(Bolivia)
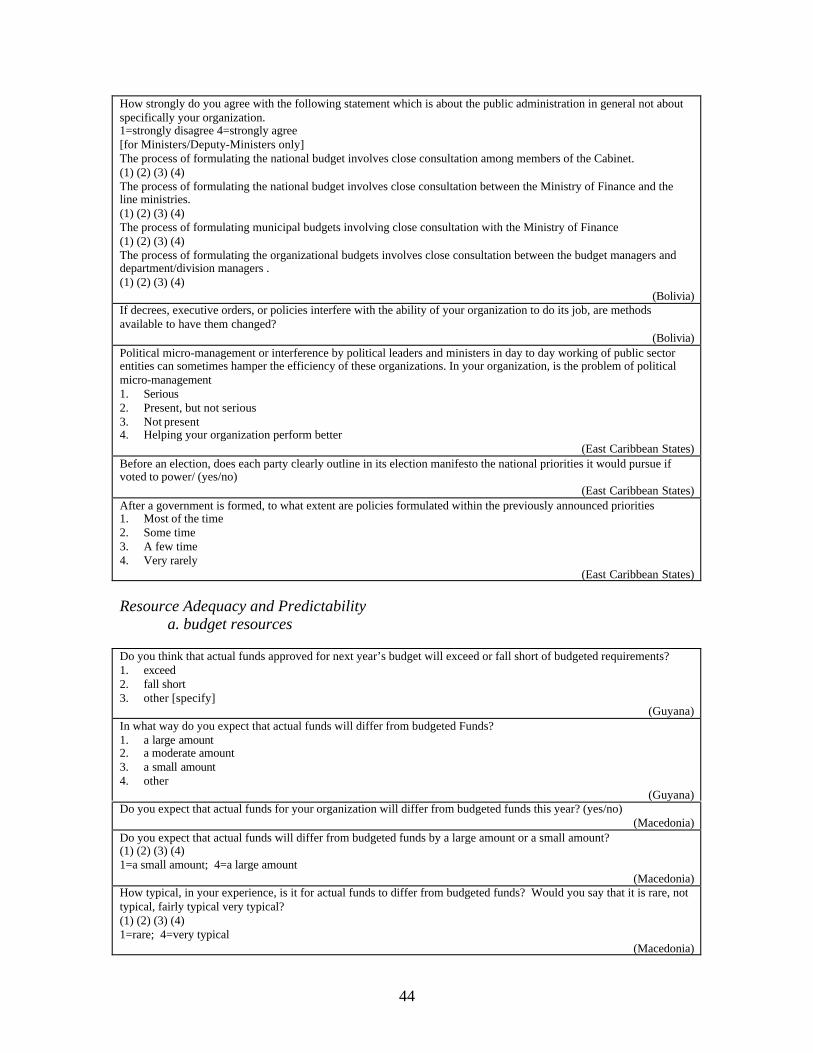
44
How strongly do you agree with the following statement which is about the public administration in general not aboutspecifically your organization.1=strongly disagree 4=strongly agree[for Ministers/Deputy-Ministers only]The process of formulating the national budget involves close consultation among members of the Cabinet.(1) (2) (3) (4)The process of formulating the national budget involves close consultation between the Ministry of Finance and theline ministries.(1) (2) (3) (4) The process of formulating municipal budgets involving close consultation with the Ministry of Finance(1) (2) (3) (4)The process of formulating the organizational budgets involves close consultation between the budget managers anddepartment/division managers .(1) (2) (3) (4)
(Bolivia)If decrees, executive orders, or policies interfere with the ability of your organization to do its job, are methodsavailable to have them changed?
(Bolivia)Political micro-management or interference by political leaders and ministers in day to day working of public sectorentities can sometimes hamper the efficiency of these organizations. In your organization, is the problem of politicalmicro-management1. Serious2. Present, but not serious3. Not present4. Helping your organization perform better
(East Caribbean States)Before an election, does each party clearly outline in its election manifesto the national priorities it would pursue ifvoted to power/ (yes/no)
(East Caribbean States)After a government is formed, to what extent are policies formulated within the previously announced priorities1. Most of the time2. Some time3. A few time4. Very rarely
(East Caribbean States)
Resource Adequacy and Predictabilitya. budget resources
Do you think that actual funds approved for next year’s budget will exceed or fall short of budgeted requirements?1. exceed2. fall short3. other [specify]
(Guyana)In what way do you expect that actual funds will differ from budgeted Funds?1. a large amount2. a moderate amount3. a small amount4. other
(Guyana)Do you expect that actual funds for your organization will differ from budgeted funds this year? (yes/no)
(Macedonia)Do you expect that actual funds will differ from budgeted funds by a large amount or a small amount?(1) (2) (3) (4)1=a small amount; 4=a large amount
(Macedonia)How typical, in your experience, is it for actual funds to differ from budgeted funds? Would you say that it is rare, nottypical, fairly typical very typical?(1) (2) (3) (4)1=rare; 4=very typical
(Macedonia)
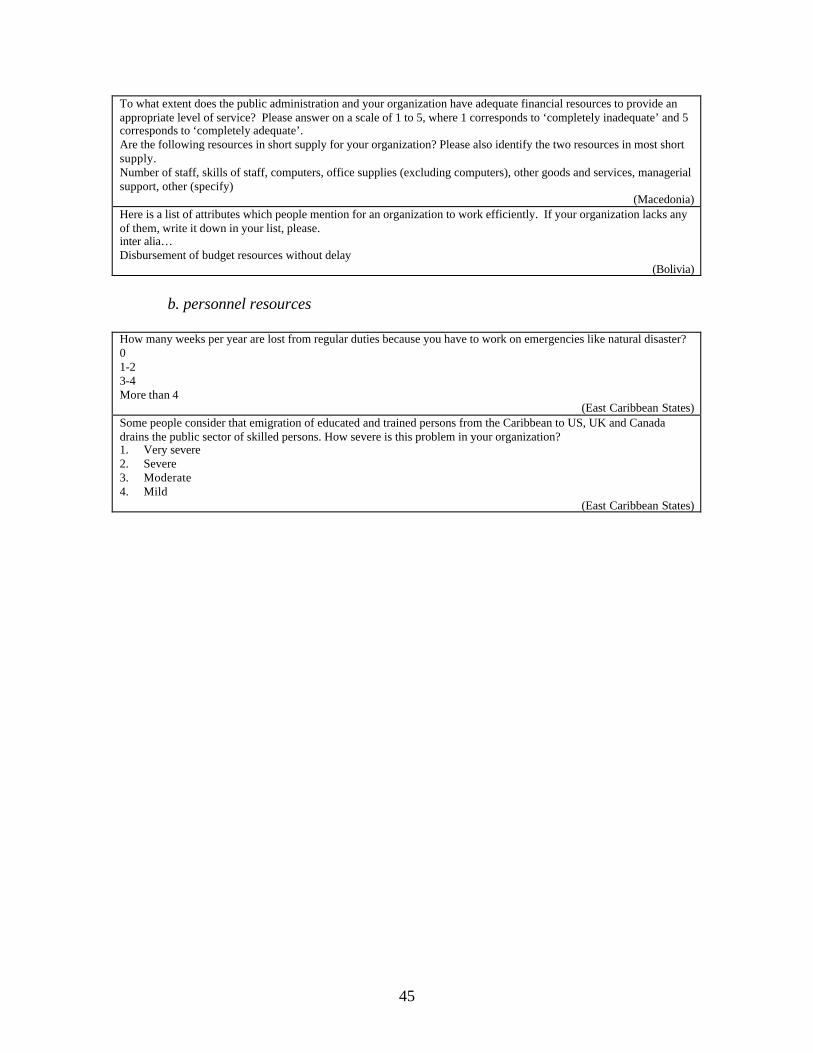
45
To what extent does the public administration and your organization have adequate financial resources to provide anappropriate level of service? Please answer on a scale of 1 to 5, where 1 corresponds to ‘completely inadequate’ and 5corresponds to ‘completely adequate’.Are the following resources in short supply for your organization? Please also identify the two resources in most shortsupply.Number of staff, skills of staff, computers, office supplies (excluding computers), other goods and services, managerialsupport, other (specify)
(Macedonia)Here is a list of attributes which people mention for an organization to work efficiently. If your organization lacks anyof them, write it down in your list, please.inter alia…Disbursement of budget resources without delay
(Bolivia)
b. personnel resources
How many weeks per year are lost from regular duties because you have to work on emergencies like natural disaster?01-23-4More than 4
(East Caribbean States)Some people consider that emigration of educated and trained persons from the Caribbean to US, UK and Canadadrains the public sector of skilled persons. How severe is this problem in your organization?1. Very severe2. Severe3. Moderate4. Mild
(East Caribbean States)

46
Appendix 2: Institutional environment indicators in the East Caribbean States60
Statistical Table 1 Rule credibility indicator and components (East Caribbean)
Recordmanagement
Internalaudit
Performanceappraisal
Projectevaluation
RuleCredibility
Antigua and Barbuda 8.4 3.5 4.3 3.7 5.0
Grenada 8.8 3.6 9.3 6.1 6.9
St. Kitts and Nevis 7.1 6.5 5.6 5.0 6.1
St. Lucia 8.6 5.5 8.1 4.1 6.6
St. Vincent And Grenadines 8.9 6.9 4.2 5.1 6.3
East Caribbean 8.6 5.2 6.6 4.7 6.3
Statistical Table 2 Policy credibility indicator and components (East Caribbean)
Consistency Policycoordination
Micro-management
PolicyCredibility
Antigua and Barbuda 4.1 5.3 4.2 4.5
Grenada 3.7 5.4 3.8 4.3
St. Kitts and Nevis 7.3 6.9 3.3 5.8
St. Lucia 6.0 6.4 3.5 5.3
St. Vincent And Grenadines 4.2 5.1 3.8 4.4
East Caribbean 4.8 5.7 3.7 4.8
Statistical Table 3 Indicator of resource adequacy and predictability andcomponents (East Caribbean)
Lost man-daysfrom naturaldisasters
skillsavailable
Institutionalcapacity
Resourceadequacy andpredictability
Antigua and Barbuda 4.1 5.5 7.7 5.8
Grenada 3.9 7.4 7.9 6.4
St. Kitts and Nevis 5.3 5.9 7.4 6.2
St. Lucia 5.3 6.5 6.2 6.0
St. Vincent And Grenadines 5.3 6.1 6.3 5.9
East Caribbean 4.5 6.3 7.1 6.0
60 See footnote 48.

47
Statistical Table 4 Indicator of overall institutional environment and components(East Caribbean)
RuleCredibilityfrom StatisticalTable 1
PolicyCredibilityfrom StatisticalTable 2
Resourcepredictabilityfrom StatisticalTable 3
OverallInstitutionalEnvironment
Antigua and Barbuda 5.0 4.5 5.8 5.1
Grenada 6.9 4.3 6.4 5.9
St. Kitts and Nevis 6.1 5.8 6.2 6.0
St. Lucia 6.6 5.3 6.0 5.9
St. Vincent And Grenadines 6.3 4.4 5.9 5.5
East Caribbean 6.3 4.8 6.0 5.7

48
Appendix 3: Illustrative questions to probe for dimensions of performance61
Test applied:These question capture perceptions of past performance and of:
1. the degree to which a concern for results or outputs shaped behavior;2. rule-based behavior in relation to budget or personnel management;3. morale and job satisfaction.
Results Focus
Are there documented work / performance standards for each function in your organization? (yes/no)Are they generally achieved?
(Guyana)In your opinion, to what extent would you say that your organization has realized its mission?0 to 25%26% to 50%51% to 75%76% to 100%
(Guyana)In the past year have staff in your organization been rewarded for any of the following reasons?
1. Taking prompt action on customers / Clients/ end users’ requests or complaints2. Providing outstanding service3. Improving qualifications4. Excellent attendance record5. Consistent courtesy
Overall, do you think these rewards were justified?1. always2. generally3. occasionally4. almost never5. never
(Guyana)Across individuals within your budget institution, all types of bonuses and similar payments are
1. very unequally distributed2. unequally distributed3. equally distributed4. distributed on the basis of performance
(Macedonia)In the past year, has anyone in your organization been the subject of the following types of sanctions for poorperformance or unprofessional conduct?1. Dismissal2. Demotion3. Salary decrease for a specified length of time4. Suspension of duties with withdrawal of salary5. Postponement of promotion or pay increases6. Public censure and reprimand7. Warning8. Initiating criminal proceedings
(Macedonia)
61 The questions themselves were developed by individual survey task managers and they may havedrawn from several different sources in preparing them. The sources are not all known and thus exactcitations can not be provided for each question.

49
What were the causes of the disciplinary actions?1. Poor work performance2. Unauthorized absence3. Working on a second job during official work hours4. Soliciting or accepting bribe5. Embezzlement6. Conflict with supervisor
(Macedonia)During the past two years, has your organization received any sanctions or measures for not performing well?If yes, which of the following measures?
1. Our budget was reduced2. Our budget was increased3. Responsible staff was disciplined4. We received a warning5. other (specify)
(Macedonia)In the past year, have staff in your organization been recognized/rewarded for any of the following reasons?
1. Taking prompt action on consumer requests or complaints2. Providing outstanding service3. Other4. No recognition/reward
(Bolivia)How many employees of your organization with excellent performance have not received recognition/reward?1. Many2. Some3. A few4. No one has received recognition
(Bolivia)Overall, do you think that these rewards were justified?
1. Always 2. Generally3. Occasionally4. Almost never or never
(Bolivia)At the end of the year, are physical outputs of your organization measured and evaluated against the expenditureincurred?1. Most of the time2. Frequently3. A few times4. Very rarely
(East Caribbean States)In the past year, how many employees in your organization received?
Reward or recognition for good performance?• 0%• about 10%• about 25%• about 50%
Some kind of penalty for non-performance?• 0%• about 10%• about 25%• about 50%
(East Caribbean States)In your performance evaluation, how much importance is laid on your achievement of your targets1. a lot2. some3. a little4. not at all
(East Caribbean States)

50
Accountability
When you first joined the government, were you assured that you would get the job? (yes/no)(Guyana)
Before you applied for your current job were you assured that you would get the job? (yes/no)(Guyana)
When was your performance last appraised by your supervisor?1. last quarter2. mid year3. end of first quarter4. one year ago5. two years ago6. three years ago7. more than three years ago8. performance not appraised
(Guyana)How difficult is it to obtain adequate and timely information from the records management system in yourorganization?� very difficult � difficult � very easy � easy
(Guyana)In your opinion, to what extent is corruption a significant problem in the public sector as a whole?
1. very significant2. significant 3. somewhat significant4. not significant at all
(Guyana)How often are cases of corruption, generally, reported to the proper authorities?
1. Almost always2. Frequently3. Occasionally4. Almost never
(Guyana)In the past year, has anyone in your organization been the subject of the following types of sanctions for poorperformance or unprofessional conduct?
1. Dismissal2. Demotion3. Salary decrease for a specified length of time4. Suspension of duties with withdrawal of salary5. Postponement of promotion or pay increases6. Public censure and reprimand7. Warning8. Initiating criminal proceedings
(Macedonia)What were the causes of the disciplinary actions?
1. Poor work performance2. Unauthorized absence3. Working on a second job during official work hours4. Soliciting or accepting bribe5. Embezzlement6. Conflict with supervisor
(Macedonia)For each of the following aspects of budget management, does your organization have formal, written guidelinesdescribing how these functions are to be carried out. If so, are they carried out in full, in part, or not at all? Pleaseanswer on a scale of 1 to 4, where 1 corresponds to “not at all” and 4 corresponds to “yes, in full”.
(Macedonia)Is there a problem of finding important financial records in your organization?(1) (2) (3) (4) (5)1=extremely problematic 5=no problem at all
(Macedonia)

51
Please evaluate the following opposing statements about practice in monitoring commitments and managingaggregate expenditure.
In your organization, a system for monitoring and controlling the total stock of expenditure commitments incurred is• not present• present• present and moderately effective• present and highly effective
In your organization the total stock of expenditure commitments is monitored frequently throughout the year andcontrols are in place to ensure that total commitments do not exceed total budget authorization(1) (2) (3) (4)(1) totally disagree (4) totally agree
(Macedonia)How easy is it to find necessary records in your department? Please answer on a scale from 1 to 4, where 1corresponds to “extremely difficult” and 4 corresponds to “very easy”.
(Macedonia)In general, cases of corruption are always, frequently, occasionally or never reported to proper authorities?1. Always2. Frequently3. Occasionally4. Almost never or never
(Bolivia)Would you say that, in your organization, corruption is a
1. very serious problem,2. a serious problem,3. a somewhat serious problem, or4. not a serious problem at all?
(Bolivia)How difficult is to obtain information from those records?
1. Very difficult2. Difficult3. Easy4. Very easy
(Bolivia)How reliable is the information contained in your organization’s HRMIS?
1. Very reliable2. Reliable3. Not reliable4. Completely unreliable
(East Caribbean States)Does your organization’s HRMIS contain the following?1. Updated records of all training you attended2. The dates when you got increment or moved from one scale to another3. Performance evaluation reports4. The date you will retire from service
(East Caribbean States)When were your own records last updated on HRMIS?1. In 20002. In 19993. In 19984. Do not know when the records were updated
(East Caribbean States)How easy or difficult is to obtain for official purposes records of employees in your organization?1. Very easy2. Easy3. Difficult4. Very difficult
(East Caribbean States)

52
Have you ever met with associations / groups of citizens who are the users, consumers of the services produced byyour organization? (yes/no)
(East Caribbean States)Are you obliged to share official information, especially that related to performance of your organization, with them?(yes/no)
(East Caribbean States)Is your organization’s audit report required to be presented to parliament? (yes/no)
(East Caribbean States)If yes, how effective is the internal audit in ensuring compliance with internal control systems?1. Very effective.2. Effective.3. Partially effective.4. Ineffective
(East Caribbean States)How long ago was your last appraisal conducted?1. Less than 6 months ago2. Less than a year ago3. More than a year ago4. I have never been appraised
(East Caribbean States)
Employee Morale62
Is your salary sufficient to meet your living expenses? (yes/no)(Guyana)
Would you describe the quality of life that you have maintained over the past year as:1. Unacceptable2. Acceptable3. Good
(Guyana)During periods of economic difficulty and austerity, some people talk about decreasing the size of the government asa means of saving money. Decreasing the size of the government would, in some areas, entail organizationstreamlining and staff cutbacks. Given that, how worried are you about losing your job sometime in the near future?
1. Very Worried2. Somewhat Worried3. Not At All Worried
(Guyana)How often do you receive salary or wages late?
1. very often2. a few times3. sometimes4. no time at all
(Guyana)How worried are you about losing your job some time in the near future?
1. very worried2. somewhat worried3. not very worried4. not at all worried
(Macedonia)In what year did you receive your last promotion?When do you expect to be considered for your next promotion?• Don’t know• Don’t expect to be considered for promotion
(Macedonia)Would you describe the quality of life that you have maintained over the past year as unacceptable, acceptable, goodor excellent?
(Macedonia)
62 To further assess performance, a measure of vertical solitude was also constructed from thedifferences in perceptions concerning the environment between managers and their staff.

53
Are your earnings from your job in the public administration (including base salary and other payments) sufficient topay your living expenses? (yes/no)
(Bolivia)How probable is it that in the near future you will become unemployed?
1. Very probable2. Somewhat probable3. Not very probable4. Not at all probable
(Bolivia)Do you feel that you are contributing to your organization’s performance? (yes/no)
(East Caribbean States)Do you enjoy your work? (yes/no)
(East Caribbean States)How probable is it that in the near future you will lose your job?1. Very likely2. Likely3. Unlikely4. Very unlikely
(East Caribbean States)

54
Appendix 4: Performance indicators in the East Caribbean States63
Statistical Table 5 Results focus indicator and components (East Caribbean)Geared toorganization’sobjectives
Efficiency merit based reward& punishment
Results focus
Antigua and Barbuda 6.0 3.6 0.7 3.6
Grenada 6.7 4.9 1.7 5.1
St. Kitts and Nevis 7.4 5.4 2.0 5.2
St. Lucia 6.9 4.1 1.3 5.0
St. Vincent And Grenadines 6.9 4.5 1.2 5.2
East Caribbean 6.8 4.4 1.3 4.9
Statistical Table 6 Accountability indicator and components (East Caribbean)
Enforcement of regulations in Accountability to
Record-
keeping
Projectevaluation
Internal audit
Performance
appraisal
Enforceability
of Regulations
(from previous
4 columns)
Delegation
Civil society
Parliament
Accountabilityfromprevioustwocolumns
Antigua andBarbuda
5.4 7.7 4.6 5.6 5.8 5.0 4.4 6.2 5.4
Grenada 4.7 8.1 6.0 7.4 6.5 4.5 4.6 7.3 5.7St. Kitts andNevis
6.1 9.2 7.4 5.7 7.1 5.9 4.6 7.3 6.2
St. Lucia 5.1 7.9 5.5 6.5 6.3 5.9 4.4 7.2 5.9St. VincentAndGrenadines
4.8 7.6 5.4 4.5 5.6 5.5 4.1 7.4 5.7
East Caribbean 5.1 8.0 5.7 6.1 6.2 5.3 4.4 6.2 5.5
Statistical Table 7 Employee morale indicator and components (East Caribbean)
Country Employee morale
Antigua and Barbuda 8.0Grenada 7.8St. Kitts and Nevis 8.5St. Lucia 7.6St. Vincent And Grenadines 8.2East Caribbean region 8.0
63 See footnote 48.

55
Statistical Table 8 Overall performance indicator and components (EastCaribbean)
Results-focusfrom StatisticalTable 5
Accountabilityfrom StatisticalTable 6
Employee Moralefrom StatisticalTable 7
Performance
Antigua and Barbuda 3.6 5.4 8.0 5.7
Grenada 5.1 5.7 7.8 6.2
St. Kitts and Nevis 5.2 6.2 8.5 6.6
St. Lucia 5.0 5.9 7.6 6.2
St. Vincent And Grenadines 5.2 5.7 8.2 6.4
East Caribbean 4.9 5.5 8.0 6.1
No measure of vertical solitude was calculated in the East Caribbean. The veryconsiderable differences in the perceptions of managers prevented the establishment ofany single reference point against which other staff's perceptions could be tested.However, in other country reports where indicators could be calculated at organizationallevel, an indicator of vertical solitude was constructed.

56
Appendix 5: Connection between performance and institutional environment64
Figure 10. Effect of institutional environment on results focus in Bolivia
agrarian reform
audit
central bank
telecom-regulation
banking-regulation
labor
ine
education
Santa Cruz
road
agriculture
customs
tax
finance
Chuquisaca
result focus = 0.5419 IE + 0.7997R
2 = 0.2853
2
3
4
5
6
7
5 6 7 8 9
institutional environment
resu
lt f
ocus
64 See footnote 48.

57
Figure 11. Effect of institutional environment on accountability in Bolivia
Chuquisaca
udape
finance
tax
customs
agriculture
road
Santa Cruz
educationine
labor
banking-regulation
telecom-regulationcentral bank
audit
agrarian reform
accountability = 1.043 IE - 1.0788R
2 = 0.741
4
5
6
7
8
9
5 6 7 8 9
institutitonal environment
acco
unta
bilit
y
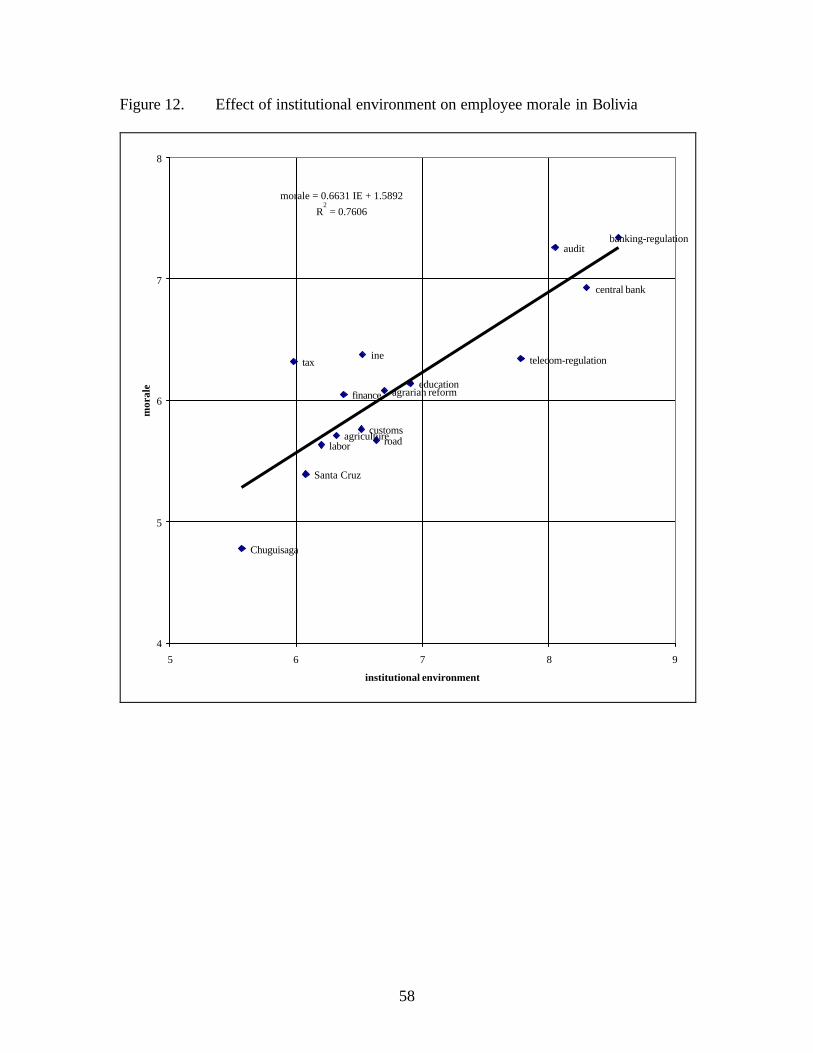
58
Figure 12. Effect of institutional environment on employee morale in Bolivia
agrarian reform
audit
central bank
telecom-regulation
banking-regulation
labor
ine
education
Santa Cruz
roadagriculturecustoms
tax
finance
Chuguisaga
morale = 0.6631 IE + 1.5892R
2 = 0.7606
4
5
6
7
8
5 6 7 8 9
institutional environment
mor
ale
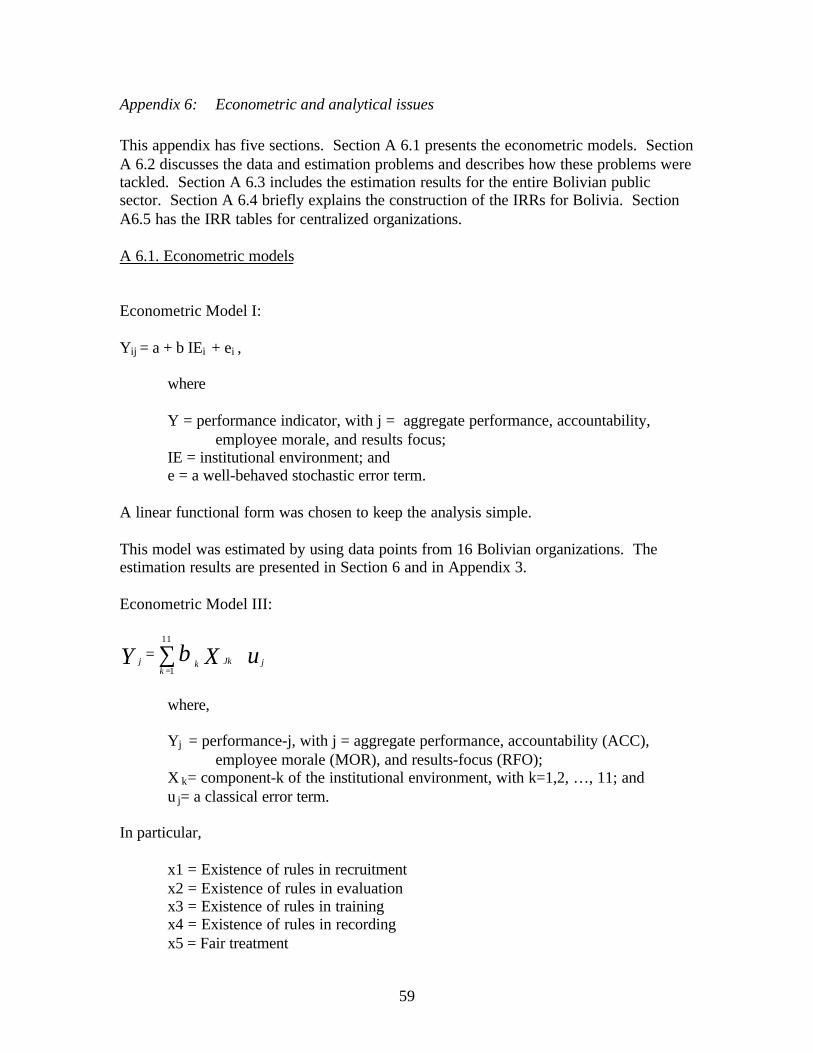
59
Appendix 6: Econometric and analytical issues
This appendix has five sections. Section A 6.1 presents the econometric models. SectionA 6.2 discusses the data and estimation problems and describes how these problems weretackled. Section A 6.3 includes the estimation results for the entire Bolivian publicsector. Section A 6.4 briefly explains the construction of the IRRs for Bolivia. SectionA6.5 has the IRR tables for centralized organizations.
A 6.1. Econometric models
Econometric Model I:
Yij = a + b IEi + ei ,
where
Y = performance indicator, with j = aggregate performance, accountability,employee morale, and results focus;
IE = institutional environment; ande = a well-behaved stochastic error term.
A linear functional form was chosen to keep the analysis simple.
This model was estimated by using data points from 16 Bolivian organizations. Theestimation results are presented in Section 6 and in Appendix 3.
Econometric Model III:
uXY jJkk
kj += ∑=
11
1β
where,
Yj = performance-j, with j = aggregate performance, accountability (ACC),employee morale (MOR), and results-focus (RFO);
X k= component-k of the institutional environment, with k=1,2, …, 11; andu j= a classical error term.
In particular,
x1 = Existence of rules in recruitmentx2 = Existence of rules in evaluationx3 = Existence of rules in trainingx4 = Existence of rules in recordingx5 = Fair treatment

60
x6 = Predictable career pathx7 = Policy consistencyx8 = Policy communicationx9 = Policy supportx10 = Political interference/micro-managementx11 = Resource predictability
A 6.2. Dealing with data and estimation problems: the example of Bolivia
Number of observations
Having 11 independent variables (and a constant term), and only 15 organizations, i.e.,data points was a problem. In order to calculate IRRs for different organizations anddifferent groups of public officials, responses from each public official were utilized inrunning regressions. That basically gave (after some data cleaning) 690 observationpoints for the entire Bolivia; and 240 for central administration, and so on.
Collinearity among independent variables
Rather than doing nothing or changing the functional form, explanatory variables weretransformed into binary responses: an indicator which is less than 5 out of 10 points wereconverted into zero, otherwise into one. This transformation also allowed theinterpretation of the estimated coefficients in a more sensible way. Instead of referringto increasing policy credibility by one or by a certain amount, it was possible to refer tomaking policies credible. Similarly, instead of referring to two public officials whobelieve that rules in place 72.4% or 39.8%, it is possible to refer to distinguish betweenpublic officials who believe and don’t believe respectively that rules are in place.
Correlation coefficients for the (converted) institutional environment indicators (Bolivia)
x1 x2 x3 x4 x5 x6 x7 x8 x9 x10 x11x1 1.00x2 0.13 1.00x3 0.05 0.03 1.00x4 0.09 0.05 0.05 1.00x5 0.04 0.10 0.07 0.05 1.00x6 0.21 0.08 0.09 0.12 0.20 1.00x7 0.12 0.06 0.03 0.07 0.03 0.14 1.00x8 -0.09 0.00 0.00 -0.03 0.01 -0.03 -0.02 1.00x9 0.11 0.05 0.13 0.09 0.06 0.19 0.13 -0.04 1.00
x10 0.31 0.10 0.08 0.12 0.14 0.47 0.09 -0.07 0.23 1.00x11 0.14 -0.01 0.07 0.03 0.03 0.10 0.13 -0.04 0.03 0.09 1.00
61
Correlation among the error terms of different performance regression equations
In the left hand side of Model III, there are three specific performance indicators, namelyResults-focus (RF) Accountability (ACC), and Morale (MOR) as a function of elevendifferent aspects of the institutional environment (IE). In other words, we are saying thatmuch of the systematic component of these three different performances will consist ofthe same type of variation—variation due to the aspects of the institutional environment.But, it is also likely because of the matching across public officials that randomcomponents of the performances will be related. Thus, some knowledge of the randomcomponent of RF variations would give us some predictive insight into the randomcomponent of ACC variations. Consequently, it is reasonable to expect that the errors ofthese three regression equations--RF= a(IE), ACC= v(IE), MOR= c(IE)--may becorrelated across equations. However, when the errors are correlated across theequations, OLS results in biased variance estimates. Therefore, to improve efficiency,Seemingly Unrelated Regression Equations (SURE) approach was used in theestimations. If the errors of the equations were not correlated, then SURE results andOLS results became the same.

62
A 6.3 SURE Estimation results for the Bolivian public sector
Estimates for equation: Results-focus N=690 ---------------------------------------------------------------------Variable Coefficient Standard Error z=b/s.e. P[¦Z¦=z] Mean of X --------------------------------------------------------------------- X1 0.1843148 0.23181 0.795 0.42654 0.4725 X2 0.6025640 0.27018 2.230 0.02573 0.2072 X3 -0.7502945E-02 0.27814 -0.027 0.97848 0.1913 X4 0.5985908 0.27651 2.165 0.03040 0.8058 X5 0.3981092 0.22865 1.741 0.08165 0.6232 X6 -0.2858045 0.26078 -1.096 0.27309 0.6420 X7 -0.5335056E-01 0.31301 -0.170 0.86466 0.8536 X8 -0.1540673 0.31894 -0.483 0.62905 0.8667 X9 0.7550640 0.24320 3.105 0.00191 0.6870 X10 0.5296796E-02 0.25926 0.020 0.98370 0.4130 X11 -0.3912180E-01 0.26093 -0.150 0.88082 0.7681 Constant 3.411840 0.50980 6.692 0.00000 Model test: F[ 11, 678] = 2.52, Prob value = 0.00421 ---------------------------------------------------------------------
Estimates for equation: Accountability ---------------------------------------------------------------------Variable Coefficient Standard Error z=b/s.e. P[¦Z¦=z] Mean of X --------------------------------------------------------------------- X1 0.3022615E-01 0.12985 0.233 0.81593 0.4725 X2 0.6108728 0.15134 4.036 0.00005 0.2072 X3 0.4409731 0.15580 2.830 0.00465 0.1913 X4 0.7030247 0.15489 4.539 0.00001 0.8058 X5 0.1116405 0.12808 0.872 0.38338 0.6232 X6 0.5904624 0.14607 4.042 0.00005 0.6420 X7 0.1345138 0.17533 0.767 0.44296 0.8536 X8 -0.2312646 0.17865 -1.294 0.19550 0.8667 X9 0.3926405 0.13623 2.882 0.00395 0.6870 X10 0.9710046 0.14522 6.686 0.00000 0.4130 X11 0.1574662 0.14616 1.077 0.28133 0.7681 Constant 4.051039 0.28556 14.186 0.00000 Model test: F[ 11, 678] = 22.58, Prob value = 0.00000---------------------------------------------------------------------
Estimates for equation: Employee Morale --------------------------------------------------------------------- Variable Coefficient Standard Error z=b/s.e. P[¦Z¦=z] Mean of X --------------------------------------------------------------------- X1 0.2087146 0.70065E-01 2.979 0.00289 0.4725 X2 0.3327698 0.81663E-01 4.075 0.00005 0.2072 X3 -0.6659126E-01 0.84071E-01 -0.792 0.42831 0.1913 X4 0.4759933 0.83577E-01 5.695 0.00000 0.8058 X5 1.095540 0.69109E-01 15.852 0.00000 0.6232 X6 0.4592120 0.78821E-01 5.826 0.00000 0.6420 X7 0.1867915 0.94608E-01 1.974 0.04834 0.8536 X8 -0.8713628E-01 0.96401E-01 -0.904 0.36605 0.8667 X9 0.4057072 0.73509E-01 5.519 0.00000 0.6870 X10 0.1470672 0.78362E-01 1.877 0.06055 0.4130 X11 0.2771287E-02 0.78869E-01 0.035 0.97197 0.7681 Constant 4.136974 0.15409 26.848 0.00000 Model test: F[ 11, 678] = 54.36, Prob value = 0.00000---------------------------------------------------------------------

63
A 6.4 Constructing the IRR indicators
The following is a demonstration of how an IRR was constructed by using the estimatedcoefficients—which were reported in the previous section.
Based on the following formula, which was explained in section 7, particularly for policyconsistency, two pieces of information were required to construct a specific IRR.
For instance, to construct Results-focus IRRs
(1) we need estimated partial derivatives of the results focus with respect toparticular potential reform interventions—i.e., the coefficient of the relatedvariable from Model III. Yet, for statistical significance of the constructedIRR, only the estimated coefficients, which were statistically significant forone-tailed test, were used in the construction of the indicators.
(2) we need the initial level of the results-focus indicator.
As the reported regression results show, four of the estimated coefficients werestatistically significant for one-tailed test. The initial level of the result focus-indicatorwas 4.481. Thus, the IRRs were constructed as shown in the following table.
Statistical Table 9 Calculating the IRRs (Bolivia)
Institutionalenvironmentk )(
)(
ktenvironmennalinstitutiofocusresults
∂∂
Results focus0 Results focus-IRRk
Rules in evaluation 0.603 4.481 13.4%Rules in recording 0.599 4.481 13.4%Fair treatment 0.398 4.481 8.9%Policy support 0.755 4.481 16.9%
,/
0eperformancyconsistencpolicyeperformanc
IRR yconsistencpolicy
∆∆=
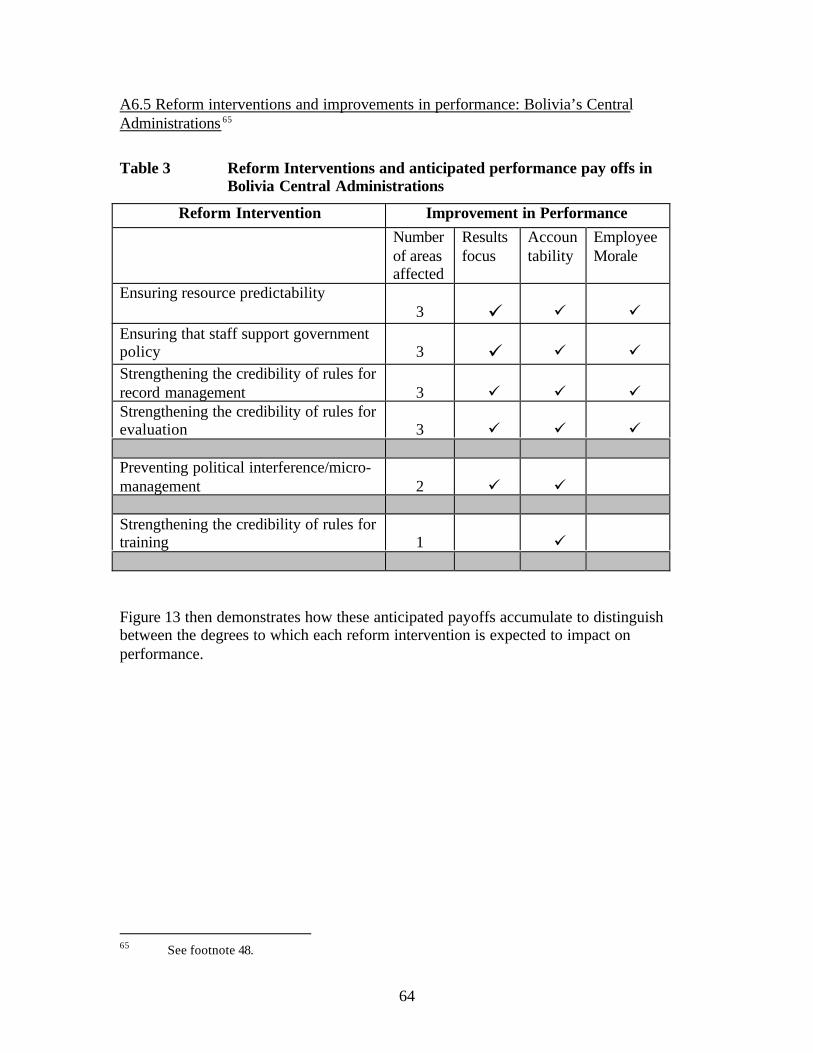
64
A6.5 Reform interventions and improvements in performance: Bolivia’s CentralAdministrations 65
Table 3 Reform Interventions and anticipated performance pay offs inBolivia Central Administrations
Reform Intervention Improvement in PerformanceNumberof areasaffected
Resultsfocus
Accountability
EmployeeMorale
Ensuring resource predictability3 ü ü ü
Ensuring that staff support governmentpolicy 3 ü ü ü Strengthening the credibility of rules forrecord management 3 ü ü ü Strengthening the credibility of rules forevaluation 3 ü ü ü
Preventing political interference/micro-management 2 ü ü
Strengthening the credibility of rules fortraining 1 ü
Figure 13 then demonstrates how these anticipated payoffs accumulate to distinguishbetween the degrees to which each reform intervention is expected to impact onperformance.
65 See footnote 48.

65
Figure 13. Expected impact of reforms on different components of performancein Bolivia Central Administrations 66
66 As explained above, the unit of measurement for the improvement in the performance due to areform intervention is the percentage change in the present level of performance.
Reform Interventions impacting three performance areas.
23%
14%
23%
21%
10%
8%
8%
5%
9%
7%
8%
3%
0% 10% 20% 30% 40% 50%
strengtheningcredibility of rules for
evaluation
strengtheningcredibility of rules for
record management
ensuring staff supportfor government
policies
ensuring resourcepredictability
Reform Intervention
Percentage increase in present level of performance
results focus accountability employee morale
Reform Interventions impacting one or two performance areas.
20%
9%
15%
0% 10% 20% 30% 40%
preventing politicalintervention/micro-
management
strengthening credibilityof rules for training
Reform Intervention
Percentage increase in present level of performance