public health trust financial recovery board · public health trust financial recovery board...
TRANSCRIPT

PUBLIC HEALTH TRUST FINANCIAL RECOVERY BOARD
COMMITTEE MEETINGS AGENDAS May 23, 2013
Ira C. Clark Diagnostic Treatment Center 1080 N. W. 19th Street Miami, Florida 33128

PUBLIC HEALTH TRUST FINANCIAL RECOVERY BOARD
COMMITTEE MEETINGS SCHEDULE
May 23, 2013
LOCATION SITE Ira C. Clark Diagnostic Treatment Center
1080 N. W. 19th Street Miami, Florida 33128
The Audit and Compliance Subcommittee meeting is scheduled from 7:30 a.m. to 8:30 a.m. in Conference Room 259, located in the Ira C. Clark Diagnostic Treatment Center (DTC). A special PHT Financial Recovery Board (PHT FRB) meeting is scheduled to begin at 8:30 a.m. in DTC 259. The Pension Plan Subcommittee meeting will follow the Special PHT FRB meeting and the Purchasing and Facilities Subcommittee meeting will follow the Pension Plan Subcommittee meeting in DTC Conference Room 259, which will then be followed by the standing committee meetings. A closed session Joint Conference and Efficiencies Committee will follow the Fiscal Committee meeting in DTC 259, which will then be followed by a closed session PHT FRB in DTC 259.
Thursday, May 23, 2013 Subcommittees Time Location Site Audit and Compliance Subcommittee 7:30 a.m. to 8:30 a.m. DTC 259 Special PHT FRB 8:30 a.m. to adjournment DTC 259 Pension Plan Subcommittee Following the Special PHT FRB DTC 259 Purchasing and Facilities Subcommittee Following the Pension Plan DTC 259 Subcommittee meeting Standing Committees Fiscal Committee Following the Purchasing and DTC 259 Facilities Subcommittee meeting Closed Session Following the Fiscal Committee DTC 259 Joint Conference and meeting Efficiencies Committee Closed Session PHT FRB Following the closed session Joint DTC 259 Conference and Efficiencies Committee Joint Conference and Following the closed session PHT FRB DTC 259 Efficiencies Committee Strategy and Growth Following the Joint Conference and DTC 259 Committee and Efficiencies Committee meeting As of May 21, 2013

PENSION PLAN SUBCOMMITTEE

PUBLIC HEALTH TRUST BOARD OF TRUSTEES Pension Plan Subcommittee Darryl K. Sharpton, Chairperson
Mojdeh L. Khaghan Carlos A. Migoya Stephen S. Nuell Mark T. Knight Duane J. Fitch Peter L. Bermont
Date, Time and Location May 23, 2013 – 7:15 a.m. to 8:30 a.m. Ira C. Clark Diagnostic Treatment Center Conference Room 259
AGENDA 1. Approval of the Previous Meeting Minutes
(Darryl K. Sharpton, Chairperson, Pension Plan Subcommittee)
(a) *Meeting Minutes as of January 30, 2013 2. PHT Defined Benefit Retirement Plan Performance Report (Quarter Ending 3-31-13) (Becky King and Nathalie Luke, EnnisKnupp)
(a) *Quarterly Executive Summary (b) *Quarterly Investment Review
3. *Investment Manager Fund Search to Replace iShares Ressell 1000 Value Fund ETF (Becky King and Nathalie Luke, EnnisKnupp) Agenda items noted with an asterisk (*) indicate the supporting documents are attached.

1. Approval of the Previous Meeting Minutes

PUBLIC HEALTH TRUST FINANCIAL RECOVERY BOARD Pension Plan Subcommittee Darryl K. Sharpton, Chairperson Joaquin del Cueto
Mojdeh L. Khaghan Carlos A. Migoya Mark T. Knight Duane J. Fitch Peter L. Bermont
Date, Time and Location January 30, 2013 – 3:00 p.m. to 4:15 p.m. Ira C. Clark Diagnostic Treatment Center Conference Room 259 1080 N. W. 19th Street Miami, FL 33128
ATTENDANCE
Pension Plan Subcommittee Darryl K. Sharpton Joaquin del Cueto Mojdeh L. Khaghan Carlos A. Migoya Mark T. Knight Peter L. Bermont Excused
Duane J. Fitch
Jackson Health System Brian Dean Tala Teymour Maria Huot-Barrientos Hewitt EnnisKnupp, Inc.
Rebecca King Nathalie Luke Armand Yambao Miami-Dade County Attorney
Christopher kokoruda Eugene Shy, Jr.

Pension Plan Subcommittee Meeting January 30, 2013 Page 2 Meeting Call to Order With a quorum being present, the Pension Plan Subcommittee meeting was called to order at 3:10 p.m. by Darryl K. Sharpton, Chairperson. Introduction of Peter L. Bermont Mr. Sharpton introduced and welcomed Peter L. Bermont who was appointed to serve as a Member-at-Large of the Pension Plan Subcommittee. 1. Approval of the Previous Meeting Minutes
(a) Meeting Minutes as of November 29, 2012
Mr. Sharpton requested a motion approving the meeting minutes as of November 29, 2012. Mr. del Cueto moved approval; seconded by Ms. Khaghan, and carried without dissent.
2. PHT Defined Benefit Retirement Plan Performance Report for 4th Quarter Ending 12/31/12
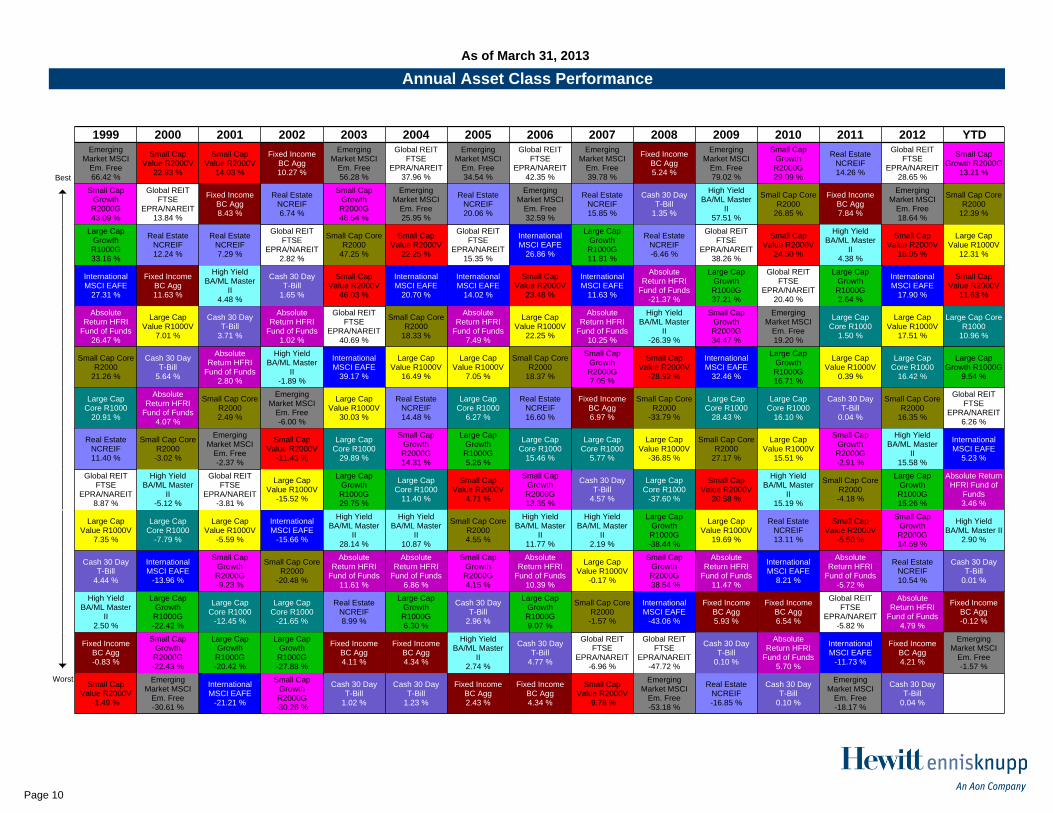
Becky King, Hewitt EnnisKnupp, presented the quarterly Executive Summary of the PHT Defined Benefit Retirement Plan Performance Report for 4th Quarter ending 12/31/12. Ms. King began the presentation with a review of the quarterly Executive Summary which highlighted the following: performance benchmarks and returns of the major capital markets, U.S. fixed income markets which showed a positive return and a periodic table that showed the best and worst of the annual asset class performance from 1998 to 2012. For the calendar year 2012 nearly all of the PHT Pension Plan investment policy guidelines were satisfied. A review of the Fund Managers was presented which is referred to as the red light/green light chart under the watch list criteria, a pie chart presentation showed the break down of the assets allocated by the investment managers which totaled $473,239,727 at the end of the calendar year, a review of the total plan comparative performance which is made up of three different calculations (trailing returns, calendar year results, and 3-year rolling returns) used to compute performance, and a detailed overview of the asset allocation and performance of the various Fund Managers. With regards to the U.S. Fixed income segment, all three fixed income managers (Newfleet, Taplin, PIMCO) performed within the top 20% of their peer group for the quarter and ranked in the top 14% of their peer group for the year. Based on the completion of the asset allocation study which was presented at the previous meeting, the Victory fund which represents the convertibles strategy has been targeted for termination. Ms. King stated that at the next meeting the Subcommittee will be presented with improved and less expensive options available to replace Russell 1000 Value ETF.

Pension Plan Subcommittee Meeting January 30, 2013 Page 3 3. Watch List Criteria/Fund Evaluation Overview
In terms of a broader look at Fund Manager’s performance (Fund Evaluations Versus Policy Guidelines), Natalie Luke, Hewitt EnnisKnupp, presented a report showing targeted Fund Managers based on performance and policy guidelines. The Subcommittee was reminded that Northern Trust was selected as a temporary replacement for Artio International Fund until a permanent equity fund can be identified. The following recommendations were presented: Fund Manager Asset Class Recommendations Victory Convertibles Securities Fixed Income: Convertibles Remove Horizon U.S. Equities: Large Cap Value Watch iShares Russell 1000 Value Fund U.S. Equities: Large Cap Value Replace Advisory Research U.S. Equities: Small Cap Value Retain Northern Trust Foreign Equities: Core Replace For purposes of conducting a qualitative and quantitative performance review of the Fund Managers, Ms. Luke stated that going forward all of the Fund Managers will be included in the Fund Evaluations Versus Policy Guidelines report and reported on based on performance and policy guidelines.
4. Investment Policy Statement – Appendix A Discussion
The Subcommittee engaged in a discussion regarding proposed changes to the Investment Policy and the necessary action to move forward. Mark T. Knight, Chief Financial Officer stated that at this time there are no recommendations or suggestions being made to change the Watch List Appendix A. Mr. Sharpton requested that the recommended changes to the Watch List Appendix A be included as part of the next meeting agenda. Mr. Dean stated that the new Watch List Compliance Report will be reviewed to determine whether or not there is a need for a revision to the Investment Policy Statement. For informational purposes the Investment Policy Statement that was approved at the previous meeting was included in the agenda packet.
5. Investment Manager Presentation - Horizon Based on the performance of Horizon and the request of the Subcommittee, Andrea DeMichele, Vice President, Client Portfolio Manager, Horizon Kinetics, presented an overview of the Horizon portfolio, current year versus the previous year performance, annual returns based on the previous five years, and description of how Horizon is positioning itself for improved performance moving forward. With regards to reflections of Horizon performance, Mr. Bermont questioned the appropriateness of the index that is being used to measure Horizon’s performance. In agreement with Mr. Bermont and for the benefit of Ms. DeMichele, Mr. Knight stated that there needs to be some comparative tool. He pointed out that Ms. DeMichele did a good job explaining Horizon’s performance in year 2012. He questioned if the same performance demonstrated in year 2012 will carry Horizon through year 2013 and drive a similar type of return. In a response to the questioned raised by Mr. Knight, Ms. DeMichele replied yes because the same market forces are continuing to drive performance.
Pension Plan Subcommittee Meeting January 30, 2013 Page 4
Mr. Sharpton recommended that on a quarterly basis a fund manager is invited to present an overview of its portfolio, discuss innovative things that are being done and review their performance. In response to the question raised at the previous meeting by Mr. Fitch regarding the fee structure, Mr. Sharpton requested Mr. Knight to provide an explanation of the fee structure process. In a response to Mr. Fitch’s question regarding fee structure particularly having to do with mutual fund fees as well as more blatant fees, Mr. Knight circulated information highlighting what the management fees are. Mr. Knight stated that the Subcommittee will continue to be provided with a summary showing the current fees.
6. Investment Manager Search Update Report Ms. King presented a detailed Manager Search Report that included strategies approved in the recent asset-liability study for the plan. In addition, the Search Report identified a permanent replacement to the Artio International Equity Fund (Artio). Due to poor performance and a resulting loss of assets, Artio was terminated in November 2012 and replaced with the Northern Trust Fund on a temporary basis. Ms. King stated that each of the candidates listed below went through a full due diligence process and were Hewitt EnnisKnupp approved and forwarded to the Subcommittee for consideration and acceptance: High Yield International TIPS Fixed Income Fixed Income Equity__ Global REIT DFA Inflation-Protected MacKay Shields Harding Loevner European Securities (MF) High Yield Active International Investors Global Core (CF) Equity (CF) Real Estate Securities (CF) Following the review of the Manager Search Report and discussion, Mr. Sharpton requested a motion to accept the Investment Manager Search Report and accept the recommendations to fill the new asset classes and permanent replacement to the International Equity Fund as presented.
Mr. Migoya moved approval; seconded by Mr. Knight, and carried without dissent. When there is information as extensive as the Investment Manager Search Update Report, Mr. Bermont requested that it be provided to the Subcommittee prior to the meeting. Mr. Migoya requested that all support documents be forwarded electronically to the Subcommittee in advance to the meetings. The item will be forwarded to the February 21, 2013 Fiscal Committee for consideration and approval.

Pension Plan Subcommittee Meeting January 30, 2013 Page 5 7. Schedule of the Remaining 2013 Pension Plan Subcommittee Meetings
The Subcommittee agreed that the remaining 2013 Pension Plan Subcommittee meetings would be held on a quarterly basis with the next meeting tentatively scheduled for May, 2013.
Adjournment The Pension Plan Subcommittee meeting adjourned at 4:58 p.m. Transcribed by Ivenette Cobb, Executive Assistant Public Health Trust Financial Recovery Board

2. PHT Defined Benefit Retirement Plan Performance Report

Quarterly Executive Summary
Public Health Trust/Jackson Health System | First Quarter 2013

Consultant Analyst Rebecca M. King, CEBS Sean Lynch, CFA, CAIA Hewitt EnnisKnupp Hewitt EnnisKnupp 4130 Parklake Avenue 4130 Parklake Avenue Suite 110 Suite 110 Raleigh, NC 27612 Raleigh, NC 27612 Phone: (919) 786-6270 Phone: (919) 786-6257 Fax: (847) 953-2543 Fax: (847) 953-4951 [email protected] [email protected] Note: The data and other information presented in this report have been obtained, either directly or indirectly, from the custodian and/or investment manager. HEK believes the information to be accurate and has compared this information to the managers’ reported returns. HEK has not conducted any type of additional audit to ensure the information’s accuracy and cannot warrant its accuracy or completeness. Additionally, Russell Investment Group is the source and owner of Russell index data contained or reflected in this material and all trademarks and copyrights related thereto. The Russell material may contain confidential information and unauthorized use, disclosure, copying, dissemination or redistribution of Russell data is strictly prohibited. This is an HEK presentation of the data. Russell Investment Group is not responsible for the formatting or configuration of this material or for any inaccuracy in presentation thereof.

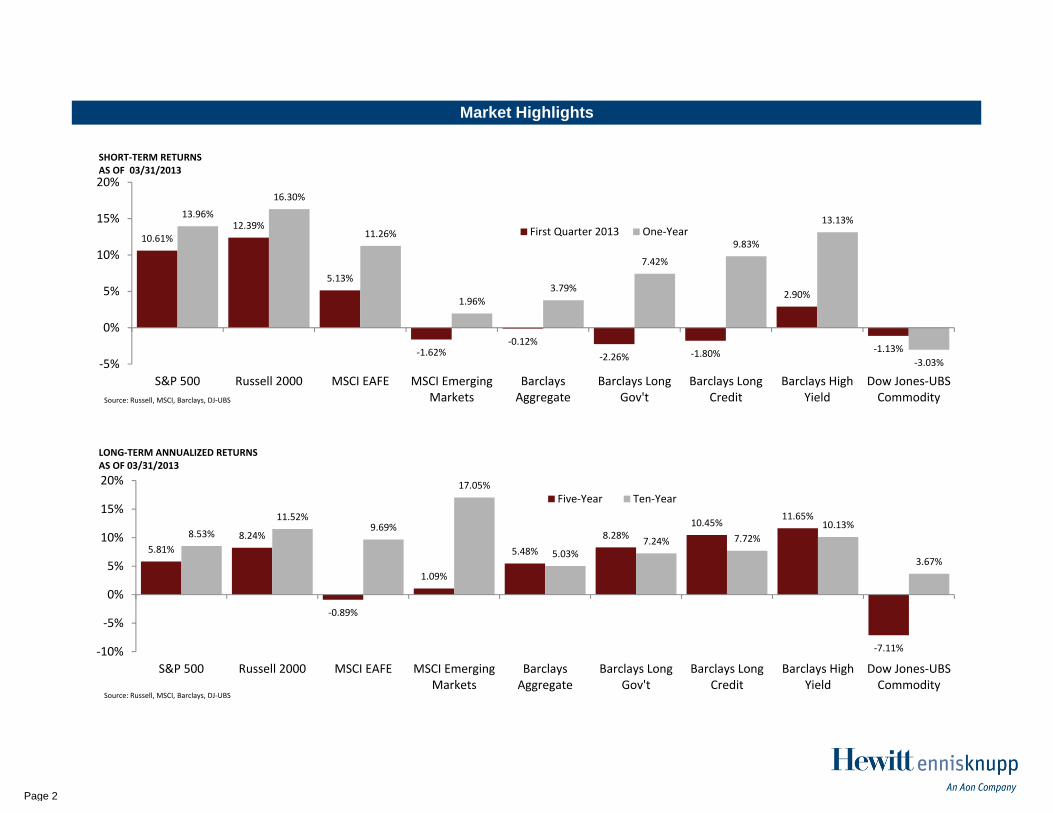
Market Highlights
FirstQuarter
Year‐to‐Date 1‐Year 3‐Year1 5‐Year1 10‐Year1
EquityMSCI All Country World IMI 6.90% 6.90% 10.95% 8.13% 2.58% 9.87%MSCI All Country World 6.50% 6.50% 10.55% 7.78% 2.06% 9.36%Dow Jones U.S. Total Stock Market 11.07% 11.07% 14.49% 13.08% 6.48% 9.43%Russell 3000 11.07% 11.07% 14.57% 12.97% 6.32% 9.15%S&P 500 10.61% 10.61% 13.96% 12.68% 5.81% 8.53%Russell 2000 12.39% 12.39% 16.30% 13.45% 8.24% 11.52%MSCI All Country World ex‐U.S. IMI 3.57% 3.57% 8.62% 4.71% ‐0.03% 11.33%MSCI All Country World ex‐U.S. 3.17% 3.17% 8.36% 4.41% ‐0.39% 10.93%MSCI EAFE 5.13% 5.13% 11.26% 5.00% ‐0.89% 9.69%MSCI EAFE (100% Hedged) 8.79% 8.79% 13.27% 1.59% ‐1.75% 5.22%MSCI EAFE (Local Currency) 9.67% 9.67% 16.73% 4.34% 0.74% 7.46%MSCI Emerging Markets ‐1.62% ‐1.62% 1.96% 3.27% 1.09% 17.05%Fixed IncomeBarclays Global Aggregate ‐2.10% ‐2.10% 1.25% 4.52% 3.65% 5.47%Barclays Aggregate ‐0.12% ‐0.12% 3.79% 5.54% 5.48% 5.03%Barclays Long Gov't ‐2.26% ‐2.26% 7.42% 12.39% 8.28% 7.24%Barclays Long Credit ‐1.80% ‐1.80% 9.83% 12.05% 10.45% 7.72%Barclays Long Gov't/Credit ‐1.98% ‐1.98% 8.94% 12.31% 9.55% 7.52%Barclays US TIPS ‐0.37% ‐0.37% 5.67% 8.56% 5.88% 6.32%Barclays High Yield 2.90% 2.90% 13.13% 11.24% 11.65% 10.13%SSB Non‐U.S. WGBI ‐3.83% ‐3.83% ‐2.16% 3.33% 2.28% 5.58%JP Morgan EMBI Global (Emerging Markets) ‐2.30% ‐2.30% 10.44% 10.55% 9.81% 10.59%CommoditiesDow Jones‐UBS Commodity ‐1.13% ‐1.13% ‐3.03% 1.42% ‐7.11% 3.67%Goldman Sachs Commodity 0.55% 0.55% ‐4.96% 3.04% ‐9.74% 2.34%Hedge FundsHFRI Fund‐Weighted Composite2 3.81% 3.81% 5.46% 4.05% 3.02% 6.99%HFRI Fund of Funds2 3.36% 3.36% 4.78% 2.10% ‐0.24% 3.85%Real EstateNAREIT U.S. Equity REITS 8.19% 8.19% 15.29% 17.17% 6.83% 12.44%NCREIF ODCE3 2.69% 2.69% 10.79% 15.13% ‐0.84% 6.80%Private EquityThomson Reuters VentureXpert4 3.75% 9.11% 13.49% 13.63% 4.47% 12.54%InfrastructureMacquarie Global Infrastructure ‐ North America 12.00% 12.00% 16.68% 16.37% 7.28% 13.47%
MSCI Indices and NCREIF ODCE show net retuns.MSCI EAFE (100% Hedged) shows price return.All other indices show total returns.1 Periods are annualized.2 Latest 5 months of HFR data are estimated by HFR and may change in the future.3 First quarter results are preliminary.4 Benchmark is as of 09/30/2012.
Periods Ending 03/31/2013Returns of the Major Capital Markets
Page 1
Market Highlights
5.81%8.24%
‐0.89%
1.09%
5.48%8.28%
10.45%11.65%
‐7.11%
8.53%
11.52%9.69%
17.05%
5.03%7.24% 7.72%
10.13%
3.67%
‐10%
‐5%
0%
5%
10%
15%
20%
S&P 500 Russell 2000 MSCI EAFE MSCI EmergingMarkets
BarclaysAggregate
Barclays LongGov't
Barclays LongCredit
Barclays HighYield
Dow Jones‐UBSCommodity
LONG‐TERM ANNUALIZED RETURNSAS OF 03/31/2013
Five‐Year Ten‐Year
Source: Russell, MSCI, Barclays, DJ‐UBS
10.61%12.39%
5.13%
‐1.62%‐0.12%
‐2.26% ‐1.80%
2.90%
‐1.13%
13.96%
16.30%
11.26%
1.96%3.79%
7.42%
9.83%
13.13%
‐3.03%‐5%
0%
5%
10%
15%
20%
S&P 500 Russell 2000 MSCI EAFE MSCI EmergingMarkets
BarclaysAggregate
Barclays LongGov't
Barclays LongCredit
Barclays HighYield
Dow Jones‐UBSCommodity
SHORT‐TERM RETURNSAS OF 03/31/2013
First Quarter 2013 One‐Year
Source: Russell, MSCI, Barclays, DJ‐UBS
Page 2

Global Equity Markets
6.90%3.57%
10.81%
2.89%
12.27%
0.66%
7.22%
3.05%6.99%
‐0.95%
10.95%8.62%
13.62%10.80%
9.00%
2.31% 1.50%
11.06%
18.54%
2.78%
‐10%
0%
10%
20%
30%
40%
50%
ACWI IMI 52.2%ACWI ex‐U.S. IMI
47.8%USA IMI
7.9%UK IMI
8.0%Japan IMI
4.0%Canada IMI
0.2%Israel IMI
14.8%Europe ex‐UK IMI
5.2%Pacific ex‐Japan IMI
12.1%EmergingMarketsIMI
GLOBAL MSCI IMI INDEX RETURNSAS OF 03/31/2013
First Quarter 2013One‐Year
Source: MSCI
Equity markets posted positive returns during the quarter despite Eurozone worries resulting from an Italian election in which no party claimed a majority, corruption allegations in Spain, and a Cypriot bailout. Equity markets were pushed higher by positive U.S. economic data and the U.S. fiscal cliff deal that was reached at the beginning of the quarter.
Japan proved to be the best performing region as investors were pleased with the Prime Minister’s ongoing pressure to increase the money supply. The worst performing region was Emerging Markets.
Page 3

Global Equity Markets
USA47.8%
UK7.9%
Canada4.0%
Pacific ex‐Japan5.2% Japan
8.0%
Europe ex‐UK14.8%
Israel0.2%
Latin America2.5%
Asia7.5%
Eastern Europe, Middle East &
Africa2.0%
EmergingMarkets12.1%
MSCI ALL COUNTRY WORLD IMI INDEXGEOGRAPHIC ALLOCATION AS OF 03/31/2013
Source: MSCI
UK15.1%
Canada7.7%
Pacific ex‐Japan10.0%
Japan15.3%
Europe ex‐UK28.4%
Israel0.4%
Latin America4.8%
Asia14.4%
Eastern Europe, Middle East &
Africa3.9%
EmergingMarkets23.1%
MSCI ALL COUNTRY WORLD EX‐U.S. IMI INDEXGEOGRAPHIC ALLOCATION AS OF 03/31/2013
Source: MSCI
The two exhibits on this slide illustrate the percentage that each country/region represents of the global equity market as measured by the MSCI All Country World IMI Index and the MSCI All Country World ex U.S. IMI Index.
Page 4

U.S. Equity Markets
11.07% 12.25%10.57%
14.59%12.04%
15.70%12.23%
5.39% 5.24%8.62%
13.38%14.57%
19.97%
10.26%
19.98%18.34%
24.94%
17.39%
‐0.53%
10.00%
24.84%
17.66%
‐10%
0%
10%
20%
30%
40%
50%
Russell3000
12.5%Cons. Disc.
9.9%Energy
9.5%Cons. Stap.
17.2%Financials
12.3%Healthcare
11.3%Industrials
17.3%IT
3.9%Materials
2.6%Telecomms
3.5%Utilities
RUSSELL GICS SECTOR RETURNSAS OF 03/31/2013
First Quarter 2013One‐Year
Source: Russell Indexes
11.07% 11.45%8.77%
14.21%11.51% 11.63%
13.21%14.57%
17.49%
9.06%
21.49%
12.76%
18.09%
14.52%
0%
10%
20%
30%
40%
50%
Russell 3000 32.8%Large Value
31.5%Large Growth
15.1%Medium Value
12.8%Medium Growth
4.0%Small Value
3.7%Small Growth
RUSSELL STYLE RETURNSAS OF 03/31/2013
First Quarter 2013One‐Year
Source: Russell Indexes
2013 started strong for U.S. equities as Congress acted to delay negotiations regarding the debt ceiling. The rally continuedthrough the second half of the quarter as fourth quarter earnings proved to be strong with roughly three-fourths of companies meeting or beating expectations.
The Russell 3000 rose 11.07% during the quarter and returned 14.57% over the one-year period.
The Healthcare, Utilities, Consumer Discretionary, and Industrial sectors were the best performing sectors during the first quarter, posting returns of 15.70%, 13.38%, 12.25%, and 12.23%, respectively. The Information Technology and Materials sectors were the worst performing areas, producing returns of 5.39% and 5.24%, respectively, during the first quarter.
Overall, mid cap outperformed both small cap and large cap during the first quarter. Value outperformed growth in the large and mid cap sectors but growth prevailed amongst small cap stocks during the quarter.
Page 5

U.S. Fixed Income Markets
‐0.12% ‐0.16% ‐0.11% ‐0.05%
0.05% 0.13%
3.77%
3.01%
7.47%
1.97%
2.85%
6.14%
‐1%
0%
1%
2%
3%
4%
5%
6%
7%
8%
Barclays Agg.Bond
46.8%Gov't
21.7%Corp.
29.3%MBS
0.3%ABS
1.8%CMBS
BARCLAYS AGGREGATE RETURNS BY SECTORAS OF 03/31/2013
First Quarter 2013One‐Year
Source: Barclays Live
‐0.11%
0.08%
‐0.26% ‐0.15%
2.89%2.60%
4.27%
7.13%
8.57%
13.13%
‐2%
0%
2%
4%
6%
8%
10%
12%
14%
Aaa Aa A Baa High Yield
BARCLAYS AGGREGATE RETURNS BY QUALITY AND HIGH YIELD RETURNSAS OF 03/31/2013
First Quarter 2013One‐Year
Source: Barclays Live
0.19% 0.26% 0.09%
‐0.39%
‐1.99%
1.09%
2.38%
4.09%
6.42%
8.93%
‐4%
‐2%
0%
2%
4%
6%
8%
10%
1‐3 Yr. 3‐5 Yr. 5‐7 Yr. 7‐10 Yr. >10 Yr.
BARCLAYS AGGREGATE RETURNS BY MATURITYAS OF 03/31/2013
First Quarter 2013One‐Year
Source: Barclays Live
The Barclays Aggregate Bond Index returned -0.12% in the first quarter.
Commercial mortgage-backed securities and asset-backed securities were the strongest performing sectors, returning 0.13% and 0.05%, respectively, over the course of the first quarter.
In the investment grade market, higher quality bonds outperformed lower quality bonds during the first quarter.
High-yield bonds outperformed investment grade bonds as investors sought yield in a low interest rate environment.
From a maturity perspective, shorter term bonds outperformed, with the 1-3 yr. and 3-5 yr. posting positive returns of 0.19% and 0.26%, respectively, during the first quarter.
Page 6

U.S. Fixed Income Markets
‐2.0%
‐1.0%
0.0%
1.0%
2.0%
3.0%
4.0%
5.0%
6.0%
Mar 03 Mar 04 Mar 05 Mar 06 Mar 07 Mar 08 Mar 09 Mar 10 Mar 11 Mar 12 Mar 13
U.S. 10‐YEAR TREASURY AND TIPS YIELDS10Y TIPS Yield
10Y Treasury Yield
Source: U.S. Department of Treasury
0.0%
0.5%
1.0%
1.5%
2.0%
2.5%
3.0%
3.5%
4.0%
0 5 10 15 20 25 30
Maturity (Years)
U.S. TREASURY YIELD CURVE
3/31/2012
12/31/2012
3/31/2013
Source: U.S. Department of Treasury
The Treasury yield curve steepened during the quarter; both the intermediate (1 to 10 years) and the long-term segments of the yield curve rose.
The 10-year U.S. Treasury yield ended the quarter at a yield of 1.87%, roughly 9 basis points higher than its level at the beginning of the quarter.
10-year TIPS yields remained in negative territory, but rose by 3 basis points to -0.64% over the quarter.
Page 7

Commodities
‐1.13%
‐5.08%
7.12%
‐7.84%
‐5.46%
‐3.16%
‐3.20%
‐3.74%
‐6.43%
‐3.03%
‐6.30%
3.39%
‐12.28%
‐7.40%
‐2.41%
‐23.19%
7.87%
‐4.81%
‐25% ‐20% ‐15% ‐10% ‐5% 0% 5% 10%
DJ‐UBS Commodity Index
Ex‐Energy
Energy
Industrial Metals
Prec. Metals
Agric.
Softs
Grains
Livestock
COMMODITY RETURNSAS OF 03/31/2013
First Quarter 2013One‐Year
Source: Dow Jones‐UBS
Driven by negative returns across most market sectors, the Dow Jones-UBS Commodity Index decreased by 1.13% during the first quarter.
The strongest and only positive performing segment of the market was Energy with a return of 7.12% during the quarter.
Industrial Metals and Livestock were the worst performing sectors of the market during the first quarter with returns of -7.84% and -6.43%, respectively.
Page 8

U.S. Commercial Real Estate Markets
Apartments
Hotels
Office
Industrial
Retail
CURRENT POSITION IN REAL ESTATE RECOVERY CYCLE
Net Absorption Turns Positive
Declining Vacancy
Growth in Rental Rates
Construction Reignites
Demand Drivers Rebound
2.69%
10.79%
15.13%
‐0.84%
6.80%
8.19%
15.29%
17.17%
6.83%
12.44%
‐2%
0%
2%
4%
6%
8%
10%
12%
14%
16%
18%
20%
Fourth Quarter 2012 1‐Year 3‐Years 5‐Years 10‐Years
PRIVATE VS. PUBLIC REAL ESTATE RETURNSAS OF 03/31/2013
Private (NFI‐ODCE Gross)*
Public (NAREIT Gross)
*Fourth quarter returns are preliminarySources: NCREIF, NAREIT
2013 U.S. Real Estate Outlook:U.S. economy expected to remain in slow-growth mode for much of 2013, though still strong enough to support continued measuredimprovements in real estate fundamentalsNew supply expected to become more noticeable in 2013, first in apartments with some uptick in industrial as well; other new property typedeliveries are still well restrainedCurrent low interest rate environment continues to support price recovery/growth– Relative value of Real Estate versus other asset classes remains attractive
Core rebound is mature and returns are expected to continue to moderate (consensus NPI forecast range is 6–9%...generally in line withlong-term average)– Still solid investment option for long-term investors seeking diversification and yield– Consider debt plays as a substitute for Core returns (also good alternative for fixed income)
Non Core opportunities remain in the sector’s sweet spot, with above average return potential– Distress, recapitalization, lease up, repositioning, even some development attractive
Headwinds remain, both domestic and global, thus do not discount the potential for above average volatility in the sector to continue
Page 9
1999 2000 2001 2002 2003 2004 2005 2006 2007 2008 2009 2010 2011 2012 YTD
Best
EmergingMarket MSCI
Em. Free66.42 %
Small CapValue R2000V
22.83 %
Small CapValue R2000V
14.03 %
Fixed IncomeBC Agg10.27 %
EmergingMarket MSCI
Em. Free56.28 %
Global REITFTSE
EPRA/NAREIT37.96 %
EmergingMarket MSCI
Em. Free34.54 %
Global REITFTSE
EPRA/NAREIT42.35 %
EmergingMarket MSCI
Em. Free39.78 %
Fixed IncomeBC Agg5.24 %
EmergingMarket MSCI
Em. Free79.02 %
Small CapGrowthR2000G29.09 %
Real EstateNCREIF14.26 %
Global REITFTSE
EPRA/NAREIT28.65 %
Small CapGrowth R2000G
13.21 %
5 Small CapGrowthR2000G43.09 %
Global REITFTSE
EPRA/NAREIT13.84 %
Fixed IncomeBC Agg8.43 %
Real EstateNCREIF6.74 %
Small CapGrowthR2000G48.54 %
EmergingMarket MSCI
Em. Free25.95 %
Real EstateNCREIF20.06 %
EmergingMarket MSCI
Em. Free32.59 %
Real EstateNCREIF15.85 %
Cash 30 DayT-Bill
1.35 %
High YieldBA/ML Master
II57.51 %
Small Cap CoreR2000
26.85 %
Fixed IncomeBC Agg7.84 %
EmergingMarket MSCI
Em. Free18.64 %
Small Cap CoreR2000
12.39 %
Large CapGrowthR1000G33.16 %
Real EstateNCREIF12.24 %
Real EstateNCREIF7.29 %
Global REITFTSE
EPRA/NAREIT2.82 %
Small Cap CoreR2000
47.25 %
Small CapValue R2000V
22.25 %
Global REITFTSE
EPRA/NAREIT15.35 %
InternationalMSCI EAFE
26.86 %
Large CapGrowthR1000G11.81 %
Real EstateNCREIF-6.46 %
Global REITFTSE
EPRA/NAREIT38.26 %
Small CapValue R2000V
24.50 %
High YieldBA/ML Master
II4.38 %
Small CapValue R2000V
18.05 %
Large CapValue R1000V
12.31 %
InternationalMSCI EAFE
27.31 %
Fixed IncomeBC Agg11.63 %
High YieldBA/ML Master
II4.48 %
Cash 30 DayT-Bill
1.65 %
Small CapValue R2000V
46.03 %
InternationalMSCI EAFE
20.70 %
InternationalMSCI EAFE
14.02 %
Small CapValue R2000V
23.48 %
InternationalMSCI EAFE
11.63 %
AbsoluteReturn HFRI
Fund of Funds-21.37 %
Large CapGrowthR1000G37.21 %
Global REITFTSE
EPRA/NAREIT20.40 %
Large CapGrowthR1000G2.64 %
InternationalMSCI EAFE
17.90 %
Small CapValue R2000V
11.63 %
AbsoluteReturn HFRI
Fund of Funds26.47 %
Large CapValue R1000V
7.01 %
Cash 30 DayT-Bill
3.71 %
AbsoluteReturn HFRI
Fund of Funds1.02 %
Global REITFTSE
EPRA/NAREIT40.69 %
Small Cap CoreR2000
18.33 %
AbsoluteReturn HFRI
Fund of Funds7.49 %
Large CapValue R1000V
22.25 %
AbsoluteReturn HFRI
Fund of Funds10.25 %
High YieldBA/ML Master
II-26.39 %
Small CapGrowthR2000G34.47 %
EmergingMarket MSCI
Em. Free19.20 %
Large CapCore R1000
1.50 %
Large CapValue R1000V
17.51 %
Large Cap CoreR1000
10.96 %
Small Cap CoreR2000
21.26 %
Cash 30 DayT-Bill
5.64 %
AbsoluteReturn HFRI
Fund of Funds2.80 %
High YieldBA/ML Master
II-1.89 %
InternationalMSCI EAFE
39.17 %
Large CapValue R1000V
16.49 %
Large CapValue R1000V
7.05 %
Small Cap CoreR2000
18.37 %
Small CapGrowthR2000G7.05 %
Small CapValue R2000V
-28.92 %
InternationalMSCI EAFE
32.46 %
Large CapGrowthR1000G16.71 %
Large CapValue R1000V
0.39 %
Large CapCore R1000
16.42 %
Large CapGrowth R1000G
9.54 %
Large CapCore R1000
20.91 %
AbsoluteReturn HFRI
Fund of Funds4.07 %
Small Cap CoreR20002.49 %
EmergingMarket MSCI
Em. Free-6.00 %
Large CapValue R1000V
30.03 %
Real EstateNCREIF14.48 %
Large CapCore R1000
6.27 %
Real EstateNCREIF16.60 %
Fixed IncomeBC Agg6.97 %
Small Cap CoreR2000
-33.79 %
Large CapCore R1000
28.43 %
Large CapCore R1000
16.10 %
Cash 30 DayT-Bill
0.04 %
Small Cap CoreR2000
16.35 %
Global REITFTSE
EPRA/NAREIT6.26 %
Real EstateNCREIF11.40 %
Small Cap CoreR2000-3.02 %
EmergingMarket MSCI
Em. Free-2.37 %
Small CapValue R2000V
-11.43 %
Large CapCore R1000
29.89 %
Small CapGrowthR2000G14.31 %
Large CapGrowthR1000G5.26 %
Large CapCore R1000
15.46 %
Large CapCore R1000
5.77 %
Large CapValue R1000V
-36.85 %
Small Cap CoreR2000
27.17 %
Large CapValue R1000V
15.51 %
Small CapGrowthR2000G-2.91 %
High YieldBA/ML Master
II15.58 %
InternationalMSCI EAFE
5.23 %
Global REITFTSE
EPRA/NAREIT8.87 %
High YieldBA/ML Master
II-5.12 %
Global REITFTSE
EPRA/NAREIT-3.81 %
Large CapValue R1000V
-15.52 %
Large CapGrowthR1000G29.75 %
Large CapCore R1000
11.40 %
Small CapValue R2000V
4.71 %
Small CapGrowthR2000G13.35 %
Cash 30 DayT-Bill
4.57 %
Large CapCore R1000
-37.60 %
Small CapValue R2000V
20.58 %
High YieldBA/ML Master
II15.19 %
Small Cap CoreR2000-4.18 %
Large CapGrowthR1000G15.26 %
Absolute ReturnHFRI Fund of
Funds3.46 %
Large CapValue R1000V
7.35 %
Large CapCore R1000
-7.79 %
Large CapValue R1000V
-5.59 %
InternationalMSCI EAFE
-15.66 %
High YieldBA/ML Master
II28.14 %
High YieldBA/ML Master
II10.87 %
Small Cap CoreR20004.55 %
High YieldBA/ML Master
II11.77 %
High YieldBA/ML Master
II2.19 %
Large CapGrowthR1000G-38.44 %
Large CapValue R1000V
19.69 %
Real EstateNCREIF13.11 %
Small CapValue R2000V
-5.50 %
Small CapGrowthR2000G14.59 %
High YieldBA/ML Master II
2.90 %
Cash 30 DayT-Bill
4.44 %
InternationalMSCI EAFE
-13.96 %
Small CapGrowthR2000G-9.23 %
Small Cap CoreR2000
-20.48 %
AbsoluteReturn HFRI
Fund of Funds11.61 %
AbsoluteReturn HFRI
Fund of Funds6.86 %
Small CapGrowthR2000G4.15 %
AbsoluteReturn HFRI
Fund of Funds10.39 %
Large CapValue R1000V
-0.17 %
Small CapGrowthR2000G-38.54 %
AbsoluteReturn HFRI
Fund of Funds11.47 %
InternationalMSCI EAFE
8.21 %
AbsoluteReturn HFRI
Fund of Funds-5.72 %
Real EstateNCREIF10.54 %
Cash 30 DayT-Bill
0.01 %
High YieldBA/ML Master
II2.50 %
Large CapGrowthR1000G-22.42 %
Large CapCore R1000
-12.45 %
Large CapCore R1000
-21.65 %
Real EstateNCREIF8.99 %
Large CapGrowthR1000G6.30 %
Cash 30 DayT-Bill
2.96 %
Large CapGrowthR1000G9.07 %
Small Cap CoreR2000-1.57 %
InternationalMSCI EAFE
-43.06 %
Fixed IncomeBC Agg5.93 %
Fixed IncomeBC Agg6.54 %
Global REITFTSE
EPRA/NAREIT-5.82 %
AbsoluteReturn HFRI
Fund of Funds4.79 %
Fixed IncomeBC Agg-0.12 %
6
Fixed IncomeBC Agg-0.83 %
Small CapGrowthR2000G-22.43 %
Large CapGrowthR1000G-20.42 %
Large CapGrowthR1000G-27.88 %
Fixed IncomeBC Agg4.11 %
Fixed IncomeBC Agg4.34 %
High YieldBA/ML Master
II2.74 %
Cash 30 DayT-Bill
4.77 %
Global REITFTSE
EPRA/NAREIT-6.96 %
Global REITFTSE
EPRA/NAREIT-47.72 %
Cash 30 DayT-Bill
0.10 %
AbsoluteReturn HFRI
Fund of Funds5.70 %
InternationalMSCI EAFE
-11.73 %
Fixed IncomeBC Agg4.21 %
EmergingMarket MSCI
Em. Free-1.57 %
WorstSmall Cap
Value R2000V-1.49 %
EmergingMarket MSCI
Em. Free-30.61 %
InternationalMSCI EAFE
-21.21 %
Small CapGrowthR2000G-30.26 %
Cash 30 DayT-Bill
1.02 %
Cash 30 DayT-Bill
1.23 %
Fixed IncomeBC Agg2.43 %
Fixed IncomeBC Agg4.34 %
Small CapValue R2000V
-9.78 %
EmergingMarket MSCI
Em. Free-53.18 %
Real EstateNCREIF-16.85 %
Cash 30 DayT-Bill
0.10 %
EmergingMarket MSCI
Em. Free-18.17 %
Cash 30 DayT-Bill
0.04 %
Annual Asset Class Performance
As of March 31, 2013
Page 10

Russell 1000 Russell 2000
0%
10%
20%
30%
40%
-10 %
-20 %
-30 %
-40 %
-50 %
4/93 4/95 4/97 4/99 4/01 4/03 4/05 4/07 4/09 4/11 3/13
Russell 1000 Growth Russell 1000 Value
0%
10%
20%
30%
40%
-10 %
-20 %
-30 %
-40 %
-50 %
4/93 4/95 4/97 4/99 4/01 4/03 4/05 4/07 4/09 4/11 3/13
Russell 1000 Barclays Aggregate
0%
10%
20%
30%
40%
-10 %
-20 %
-30 %
-40 %
-50 %
4/93 4/95 4/97 4/99 4/01 4/03 4/05 4/07 4/09 4/11 3/13
Russell 1000 MSCI EAFE Index
0%
10%
20%
30%
40%
-10 %
-20 %
-30 %
-40 %
-50 %
4/93 4/95 4/97 4/99 4/01 4/03 4/05 4/07 4/09 4/11 3/13
1 Year Rolling Return Comparison
As of March 31, 2013
Page 11

Recent Developments & Recommendations
In February 2013, Victory Capital Management announced that the employees of the firm had partnered with Crestview Partners, a leading private equity firm, to acquire all of KeyCorp’s interest in Victory. Upon completion of the transaction, Victory will be an independent firm with the senior management team, portfolio managers and other employees owning a significant amount of the outstanding equity.
In February 2013, Advisory Research announced that Chris Crawshaw will replace Brien O’Brien as CEO. Mr. O’Brien will remain as Chairman. The transition is scheduled to take place throughout 2013.
In January 2013, BlackRock announced plans to buy Credit Suisse’s ETF business. The terms of the deal were not disclosed. The deal would give BlackRockcontrol of nearly three quarters of the physical ETF market in Europe.
In November 2012, David Albrycht, previously CIO of Newfleet, was given the newly created title of president and the responsibility of overseeing the growth of the firm. In January 2013, Bob Bishop was promoted to CIO and portfolio strategist of the firm. He will continue to work closely with the remaining portfolio managers on the firm’s Core Fixed Income strategy.
At the January 2013 meeting, HEK presented a search report for the additional asset classes selected as part of the asset liability modeling (ALM) study. The Committee selected DFA, MacKay Shields, Harding Loevner and European Investors to fill the TIPS fixed income, high yield fixed income, international equity and global REIT mandates, respectively. The transition is currently in progress and expected to be completed at the beginning of June 2013.
HEK recommended that the Victory Convertible Securities account be terminated in order to fund the new asset classes.
Due to sustained underperformance and the resulting loss of assets, the Committee elected to replace the Artio International Equity Fund. In November 2012, assets were transferred to the Northern Trust ACWI ex-US – Non-Lending Fund on a temporary basis. At the last meeting, the Harding Loevner International Equity strategy was selected as the permanent replacement for the Artio fund and the transition is expected to be completed at the beginning of June 2013.
HEK recommended that the iShares Russell 1000 Value Index Fund be replaced with a lower cost index product and has prepared a search report highlighting lower cost options in this asset class.
Asset Allocation As of March 31, 2013, the total assets of the Plan were approximately $506.6 million. The Plan had $0.6 million (0.1 percent) in cash equivalents, $163.9 million (32.4 percent) in core fixed income, $50.9 million (10.0 percent) in convertible securities, $249.0 million (49.2 percent) in domestic equities and $42.2 million (8.3 percent) in international equities.
Total Plan PerformanceFor the first quarter of 2013, the Plan returned 6.1 percent, underperforming the return of the Policy Index by 36 basis points. While absolute performance of the Plan’s investment managers was positive, poor relative results from a majority of the Plan’s actively-managed domestic and international equity managers led to underperformance this quarter. For the one-year period ending March 31, 2013, the Plan outpaced the Policy Index by 181 basis points.
Since inception in September 2001, the Plan’s return of 6.2 percent on an annualized basis trails the 6.5 percent return of the Policy Index.
Public Health Trust/Jackson Health SystemFor Quarter Ending March 31, 2013
Executive Summary
Page 12

Trailing 4Quarters
InvestmentObjectives
PerformanceResults
7.5%
9.1%Total Fund Total Composite Index: 11.0%
60% S&P 500 / 40% Barclays Agg: 9.9%
12.8%Trailing Five Year Return (annualized) 5.2%
Equity & Cash Equity Composite Index: 14.9%S&P 500: 10.6%
15.3%6.2%
Fixed & Cash Fixed Composite Index: 3.8%Barclays Aggregate: 3.8%
9.0%
Strategic Current Qtr End Overall Fixed Income Investment grade: No ViolationsRanges(1) Targets(2) Allocation Fixed Income max of 10% in one issue:
Total Equity max of 5% in one issue: No ViolationsTotal Equity 60% - 80% 70.0% 57.5% Total Equity max of 25% in one sector:
Domestic Large Cap 35% - 45% 40.0% 28.5%Domestic Small/Mid Cap 5% - 15% 10.0% 20.7%International 15% - 25% 20.0% 8.3%
Trailing 3 ActualTotal Fixed & Cash 25% - 35% 30.0% 32.5% Years Volatility
Total Other 0% - 25% 0.0% 10.0% Total Fund volatility maximum = 120% of comp. = 11.8% 10.0%Total Equity volatility maximum = 120% of comp. = 20.2% 16.4%
Total Fund 100.0% 100.0% Total Fixed volatility maximum = 120% of comp. = 2.9% 3.0%(1) Strategic Ranges are approved by the Board of Trustees and establish the minimum &maximum allowable allocations. Changes to the ranges require Board approval
(2) The Current Target percentages are established and modified by the investmentSub-Committee and must fall within the Board approved Strategic Ranges.
Volatility GuidelinesAnnualized Std. Deviation
Performance Results Relative to Actuarial Objective:
Public Health Trust/Jackson Health SystemInvestment Policy Review
March 31, 2013
No Violations
No Violations
Trailing Three Year Return (annualized)
Annualized Return Since Inception (8/9/01)
Investment Guidelines and Policy Appendix APortfolio Diversification
Page 13

Investment Dollar Percent of Target Strategy/Prof. Trailing 4 Qtr. Rolling 3 Year Perf. Rolling 3 Year Perf. Rolling 5 Year Perf. Rolling 5 Year Perf.Manager Allocation Total Allocation Changes (Mgr. v. Index) vs. Bench. (6/12) vs. Peer Median (6/12) vs. Bench. (6/12) vs. Peer Median (6/12)
Sands Select Growth - LCG $32,778,516 6.5% 10.0% None 1.9% Pass Pass Pass Pass
Northern Trust - LCG 1 $39,939,631 7.9% 10.0% None -3.7% Fail Pass Pass Pass
Horizon - LCV $36,167,112 7.1% 10.0% None 4.5% Fail Fail Fail Fail
Russell 1000 Value ETF - LCV $35,370,520 7.0% 10.0% None -0.4% Fail Pass Fail Fail
IronBridge Capital - SCC 1 $43,587,160 8.6% 3.8% None -3.2% Fail Fail Pass Pass
Advisory Research - SCV 1,2 $61,155,089 12.1% 6.3% None -4.5% Fail Fail Pass Fail
NT ACWI ex-US - IE 3 $20,435,889 4.0% 10.0% None -0.1% Fail Fail Fail Fail
Thornburg Intl. - IE $21,718,266 4.3% 10.0% None -4.5% Pass Pass Pass Pass
Newfleet - CB 1 $54,596,488 10.8% 10.0% None 2.3% Pass Pass Pass Fail
Taplin, Canida, Habacht - CB 1 $58,559,624 11.6% 10.0% None 5.2% Pass Pass Pass Pass
PIMCO - CB 1 $50,773,585 10.0% 10.0% None 4.2% Pass Pass Pass Pass
Victory Capital - Conv 1 $50,865,648 10.1% 0.0% None 1.1% Pass Fail Fail Fail
1 Upon completion of the Asset-Liability Study, these strategies will be liquidated or reduced to provide funds for new allocations.2 Relative performance of the account was negatively impacted in 2009 and 2010 due to the manager's preference for high quality companies while lower quality issues rallied during the market rec3 The Artio Fund was liquidated in November 2012 and the proceeds transitioned to the Northern Trust ACWI ex-US commingled fund temporarily.
Watchlist Performance Criteria
Public Health Trust/Jackson Health SystemInvestment Manager Review (net of fees)
March 31, 2013
Page 14

On the following pages is a summary and detailed analysis of the Public Health Trust’s (PHT) investment managers, showing the overall health of each fund. The analysis demonstrates how each fund measures up to the criteria established in the PHT’s investment policy
Public Health TrustFund Evaluation Overview
health of each fund. The analysis demonstrates how each fund measures up to the criteria established in the PHT s investment policy statement and HEK’s standard selection criteria.
In the following grid, a check mark (√) indicates that the fund is meeting objective criteria. A comment (C) indicates that there is an issue to be noted, while an exception (E) indicates the fund does not meet criteria. In either case, relevant issues would be described on the following pages of this report. Below are the guidelines for each criteria reviewed.
Organizational Stability: The investment management organization should have a stable corporate structure.
Management Team Stability: The specific team managing a strategy for the PHT should have consistent manager tenure.
Diversification: Investment managers should not invest more than 5% of the PHT’s total equity portfolio in the stock of one company, except to the extent a higher percentage of the same issue is included in a nationally-recognized market index and is otherwise permissible under the Florida Statues. Moreover, not more than 25% of the PHT’s total equity portfolio shall be invested in a single economic sector unless authorized by the PHT. For fixed income securities, other than AAA-rated sovereign debt and Agency obligations, investment managers should not invest more than 5% of the PHT’s fixed income portfolio in the securities of a single issuer at market, unless authorized by the PHT.
Quality: At least 90% of the PHT’s core fixed income portfolio should be classified as investment grade at time of purchase. However, aninvestment in high yield securities may be permissible in so far that it does not exceed allowances outlined in the Florida Statutes.
Consistency of Style: The investment style of a strategy used in the PHT should be consistent with the desired asset class.
Performance, Benchmark Index and Peer Group: An active investment manager's performance should be equal to or above an appropriate benchmark index and peer group median over the majority of rolling five-year periods under review. In addition, an active investment manager’s performance should be competitive relative to the benchmark index and peer group median over rolling three-year periods. An active investment manager will be placed on formal watch status should rolling three-year performance fail to meet the criteria stated above. An index manager’s performance should be competitive with that of the respective benchmark index.
Risk: Investment managers are expected to have a level of risk that is similar to or less than the benchmark index, which is defined in the PHT’s Investment Policy Statement as less than 120% of the standard deviation of an appropriate benchmark index. Risk is generally defined as the volatility or standard deviation of returns.
Page 15

Public Health Trust/Jackson Health SystemFund Evaluations Versus Policy Guidelines
As of March 31, 2013
Recomm
endation
Organizational
Stability
Managem
ent
Team Stability
DiversificationQuality
Consistency of
Style
Index - 5 Yr
Rolling 1Benchm
ark
Index - 3 Yr
Rolling 1Benchm
ark5 Yr Rolling 1Peer Group3 Yr Rolling 1Peer Group -
Risk
People Process PerformanceFund Asset Class
Newfleet Fixed Income: Core Retain C √ √ √ √ 92% √ 100% √ 33% √ 83% √ √
Taplin, Canida &Habacht Fixed Income: Core Retain √ √ √ √ √ 100% √ 100% √ 100% √ 100% √ √
PIMCO Total Return Inst Fixed Income: Core Retain √ √ √ √ √ 100% √ 92% √ 100% √ 100% √ √
Victory Convertible SecuritiesFixed Income: Convertibles Remove E √ √ √ √ 0% E 50% √ 0% E 0% E √
HorizonU.S. Equities: Large Cap Value Watch √ √ C N/A √ 0% E 8% E 0% E 17% E √
iShares Russell 1000 Value Fund2U.S. Equities: Large Cap Value Replace C √ √ N/A √ - √ - √ - √ - √ √
Northern Trust Large Cap GrowthU.S. Equities: Large Cap Growth Retain √ √ C N/A √ 83% √ 25% √ 83% √ 75% √ √
Sands Capital ManagementU.S. Equities: Large Cap Growth Retain √ √ C N/A √ 100% √ 100% √ 100% √ 100% √ √
Advisory ResearchU.S. Equities: Small Cap Value Retain C √ √ N/A √ 58% √ 8% E 0% E 0% E √
IronBridge Capital ManagementU.S. Equities: Small Cap Core Retain √ √ √ N/A √ 75% √ 25% √ 75% √ 8% √ √
Northern Trust ACWI ex-US Fund3 Foreign Equities Replace √ √ √ N/A √ - √ - √ - √ - √ √
Thornburg International Value I Foreign Equities Retain √ √ √ N/A √ 100% √ 100% √ 100% √ 83% √ √
E: Exception noted; C: Comment Noted.√: Meeting policy review guidelines%: % of rolling periods above objective1 Performance composites used for products with insufficent history within the PHT2 Replace with less expensive, passively managed fund.3 The Northern Trust ACWI ex-US Fund was selected as a temporary replacement for the Artio International Fund.
People Process Performance
Page 16

Market Value PHT FRS Pension FRS Investment Plan$506.6 Million $133.6 Billion $7.9 Billion
Annualized Net Performance PHT FRS Pension FRS Investment Plan1 Year 12.8% 10.9% 8.3%
3 Year 9.1% 9.4% 7.6%
5 Year 5.2% 4.8% 4.3%
10 Year 8.7% 8.6% 7.5%
Broad Asset Allocation PHT FRS Pension FRS Investment PlanGlobal Equity 57.5% 57.6% n/a
Fixed Income & Cash 32.5% 25.0% n/aInv. Grade Convertibles 10.0% 0.0% n/a
Real Estate 0.0% 7.6% n/aPrivate Equity 0.0% 5.0% n/a
Strategic (e.g. Hedge Funds, Etc.) 0.0% 4.8% n/a100.0% 100.0% n/a
Public Health Trust/Florida Retirement System ComparisonInformation as of March 31, 2013
Page 17

March 31, 2013 : $506,584,635
SegmentsMarket Value
($)Allocation
(%)
¢£ Domestic Equity 239,962,272.51 47.37
¢£ International Equity 42,152,555.00 8.32
¢£ Domestic Fixed Income 158,033,304.64 31.20
¢£ Convertible 47,501,399.24 9.38
¢£ Cash 18,935,103.54 3.74
Public Health Trust/Jackson Health System
Asset Allocation by SegmentTotal DB Plan
Page 18

March 31, 2013 : $506,584,635
Market Value($)
Allocation(%)
¢£ Advisory Research 61,155,088.56 12.07
¢£ Taplin, Canida & Habacht 58,559,624.47 11.56
¢£ Newfleet 54,596,488.04 10.78
¢£ Victory 50,865,648.28 10.04
¢£ PIMCO Total Return Inst 50,773,584.82 10.02
¢£ IronBridge Capital Management 43,587,160.13 8.60
¢£ Northern Trust LCG 39,939,630.88 7.88
¢£ Horizon 36,167,111.94 7.14
¢£ iShares Russell 1000 Value 35,370,520.38 6.98
¢£ Sands Capital Management 32,778,515.76 6.47
¢£ Thornburg International Value I 21,718,266.07 4.29
¢£ Northern Trust ACWI ex-US 20,435,888.88 4.03
¢£ Cash 637,106.72 0.13
Public Health Trust/Jackson Health System
Asset Allocation By Manager
Page 19

March 31, 2013
Target Allocation Actual Allocation Allocation Differences
0.0% 5.0% 10.0% 15.0% 20.0% 25.0% 30.0% 35.0% 39.7%-5.0 %-10.0 %-15.0 %
Cash$637,107
International Equity$42,154,155
IronBridge Capital Management$43,587,160
Advisory Research$61,155,089
Sands Capital Management$32,778,516
Northern Trust$39,939,631
iShares Russell 1000 Value$35,370,520
Horizon$36,167,112
Victory$50,865,648
Fixed Income$163,929,697
0.0%
20.0%
3.8%
6.3%
10.0%
10.0%
10.0%
10.0%
0.0%
30.0%
0.1%
8.3%
8.6%
12.1%
6.5%
7.9%
7.0%
7.1%
10.0%
32.4%
0.1%
-11.7 %
4.9%
5.8%
-3.5 %
-2.1 %
-3.0 %
-2.9 %
10.0%
2.4%
Public Health Trust/Jackson Health System
Asset Allocation vs. Target AllocationTotal DB Plan vs. Policy Index
Page 20

Comparative Performance
Comparative Performance
Comparative Performance
Total DB Plan Policy Index
0.0
5.0
10.0
15.0
Re
turn
(%
)
1Quarter
YearTo
Date
1Year
3Years
5Years
7Years
10Years
6.5 6.5
11.09.4
5.7 5.2
8.7
6.1 6.1
12.8
9.1
5.2 5.0
8.7
Total DB Plan Policy Index
0.0
30.0
-30.0
Re
turn
(%
)
YearTo
Date
2012 2011 2010 2009 2008 2007 2006 2005 2004
6.512.1
0.7
13.420.0
-23.8
5.214.7
5.612.5
6.115.3
-2.0
12.319.4
-24.9
8.2 12.77.5
13.4
Total DB Plan Policy Index
0.0
11.0
18.0
-11.0
Re
turn
(%
)
3
Years
3
Years
Ending
Dec-2012
3
Years
Ending
Sep-2012
3
Years
Ending
Jun-2012
3
Years
Ending
Mar-2012
3
Years
Ending
Dec-2011
3
Years
Ending
Sep-2011
3
Years
Ending
Jun-2011
3
Years
Ending
Mar-2011
3
Years
Ending
Dec-2010
3
Years
Ending
Sep-2010
3
Years
Ending
Jun-2010
3
Years
Ending
Mar-2010
3
Years
Ending
Dec-2009
3
Years
Ending
Sep-2009
3
Years
Ending
Jun-2009
3
Years
Ending
Mar-2009
3
Years
Ending
Dec-2008
3
Years
Ending
Sep-2008
3
Years
Ending
Jun-2008
9.4 8.6 9.011.5
16.5
11.1
4.0 5.3 4.61.2
-1.2-3.5
-0.5 -1.3 -0.3-2.9
-6.7
-2.8
2.15.6
9.1 8.3 8.810.7
15.2
9.5
3.0 4.2 3.90.2
-2.0-4.1
-0.6 -1.0
0.2
-2.5
-6.6-2.9
1.7
6.4
Public Health Trust/Jackson Health System
Total Plan Comparative Performance
As of March 31, 2013
Page 21

Allocation
MarketValue($000)
%
Performance(%)
1Quarter
1Year
3Years
5Years
10Years
SinceInception
InceptionDate
Total DB Plan 506,584.63 100.00 6.14 (16) 12.84 (9) 9.10 (67) 5.18 (60) 8.74 (45) 6.24 (63) 09/01/2001
Policy Index 6.50 (10) 11.03 (43) 9.35 (60) 5.73 (46) 8.72 (46) 6.51 (52)
All Corporate Plans ($250M to $1B)-Total Fund Median 4.36 10.82 9.61 5.49 8.47 6.58
U.S. Fixed Income 163,929.70 32.36
Newfleet 54,596.49 10.78 0.35 (23) 6.04 (19) 6.87 (23) 6.88 (27) 5.66 (37) 6.05 (35) 08/01/2001
Barclays Aggregate Index -0.12 (88) 3.77 (93) 5.52 (89) 5.47 (90) 5.03 (86) 5.51 (88)
IM U.S. Broad Market Core Fixed Income (SA+CF) Median 0.11 4.89 6.20 6.24 5.46 5.88
Taplin, Canida & Habacht 58,559.62 11.56 0.40 (19) 8.97 (3) 8.39 (2) 8.95 (1) N/A 7.38 (2) 10/01/2005
Barclays Aggregate Index -0.12 (88) 3.77 (93) 5.52 (89) 5.47 (90) 5.03 (86) 5.53 (83)
IM U.S. Broad Market Core Fixed Income (SA+CF) Median 0.11 4.89 6.20 6.24 5.46 6.02
PIMCO Total Return Inst 50,773.58 10.02 0.61 (10) 7.99 (8) 6.94 (22) 7.74 (7) N/A 7.39 (4) 10/01/2005
Barclays Aggregate Index -0.12 (81) 3.77 (83) 5.52 (72) 5.47 (65) 5.03 (41) 5.53 (43)
IM U.S. Broad Market Core Fixed Income (MF) Median 0.16 5.37 6.10 5.94 4.84 5.37
Convertibles 50,865.65 10.04
Victory 50,865.65 10.04 6.97 (29) 8.96 (63) 7.01 (91) 3.31 (100) N/A 3.04 (100) 03/01/2007
BofAML Convertible Bonds, U.S. Investment Grade 6.55 (47) 7.86 (73) 6.05 (100) 6.19 (73) 5.96 (100) 5.82 (69)
IM U.S. Convertible Bonds (SA+CF) Median 6.37 9.79 8.80 8.28 8.55 6.80
U.S. Equity 248,998.03 49.15
Horizon 36,167.11 7.14 12.44 (31) 23.29 (3) 13.90 (23) -0.05 (100) N/A 4.04 (92) 03/01/2005
Russell 1000 Value Index 12.31 (36) 18.77 (19) 12.74 (45) 4.85 (75) 9.18 (75) 5.05 (79)
IM U.S. Large Cap Value Equity (SA+CF) Median 11.56 15.85 12.49 6.01 10.04 6.08
iShares Russell 1000 Value 35,370.52 6.98 11.85 (26) 18.34 (7) 12.22 (13) N/A N/A 24.51 (8) 03/01/2009
Russell 1000 Value Index 12.31 (14) 18.77 (5) 12.74 (6) 4.85 (35) 9.18 (20) 23.77 (11)
IM U.S. Large Cap Value Equity (MF) Median 11.27 15.25 10.55 4.17 8.24 21.21
Northern Trust LCG 39,939.63 7.88 7.63 (82) 6.36 (79) 11.97 (58) 5.96 (62) N/A 4.19 (34) 11/01/2007
Russell 1000 Growth Index 9.54 (43) 10.09 (43) 13.06 (34) 7.30 (38) 8.62 (66) 3.83 (40)
IM U.S. Large Cap Growth Equity (SA+CF) Median 9.24 9.04 12.25 6.63 9.09 3.34
Sands Capital Management 32,778.52 6.47 7.23 (86) 11.95 (26) N/A N/A N/A 10.52 (66) 03/01/2012
Russell 1000 Growth Index 9.54 (43) 10.09 (43) 13.06 (34) 7.30 (38) 8.62 (66) 12.59 (42)
IM U.S. Large Cap Growth Equity (SA+CF) Median 9.24 9.04 12.25 6.63 9.09 11.88
Advisory Research 61,155.09 12.07 11.09 (76) 13.63 (84) 10.80 (89) 5.40 (97) 11.79 (86) 9.28 (78) 08/01/2001
Russell 2000 Value Index 11.63 (65) 18.09 (50) 12.12 (82) 7.29 (85) 11.29 (91) 8.30 (90)
IM U.S. Small Cap Value Equity (SA+CF) Median 12.56 18.09 14.11 9.78 13.45 10.54
IronBridge Capital Management 43,587.16 8.60 13.21 (42) 13.15 (83) 12.96 (86) 7.67 (83) N/A 8.30 (62) 05/01/2004
Russell 2000 Index 12.39 (58) 16.30 (50) 13.45 (81) 8.24 (74) 11.52 (83) 7.55 (81)
IM U.S. Small Cap Core Equity (SA+CF) Median 12.63 16.24 15.69 9.28 12.85 8.86
Public Health Trust/Jackson Health System
Asset Allocation & Performance
As of March 31, 2013
Gross-of-Fees
Returns for PIMCO, iShares, Artio and Thornburg are reported net of fees.Returns are expressed as percentages and annualized for periods greater than one year.
Page 22
Public Health Trust/Jackson Health System
Asset Allocation & Performance
As of March 31, 2013
Gross-of-Fees
Allocation
MarketValue($000)
%
Performance(%)
1Quarter
1Year
3Years
5Years
10Years
SinceInception
InceptionDate
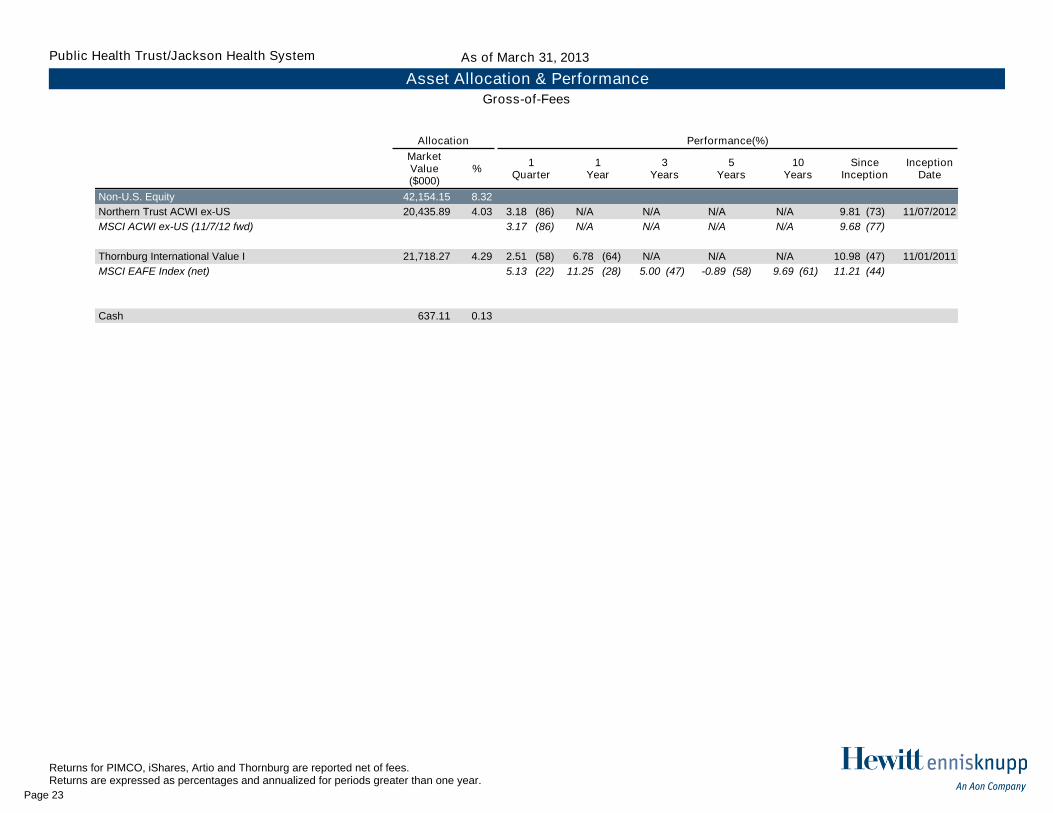
Non-U.S. Equity 42,154.15 8.32
Northern Trust ACWI ex-US 20,435.89 4.03 3.18 (86) N/A N/A N/A N/A 9.81 (73) 11/07/2012
MSCI ACWI ex-US (11/7/12 fwd) 3.17 (86) N/A N/A N/A N/A 9.68 (77)
IM International Large Cap Core Equity (SA+CF) Median 4.92 12.11 6.84 0.45 11.06 10.84
Thornburg International Value I 21,718.27 4.29 2.51 (58) 6.78 (64) N/A N/A N/A 10.98 (47) 11/01/2011
MSCI EAFE Index (net) 5.13 (22) 11.25 (28) 5.00 (47) -0.89 (58) 9.69 (61) 11.21 (44)
IM International Equity (MF) Median 3.03 8.44 4.79 -0.40 10.58 10.54
Cash 637.11 0.13
Returns for PIMCO, iShares, Artio and Thornburg are reported net of fees.Returns are expressed as percentages and annualized for periods greater than one year.
Page 23

Allocation
MarketValue($000)
%
Performance(%)
1Quarter
1Year
3Years
5Years
10Years
SinceInception
InceptionDate
Total DB Plan 506,584.63 100.00 6.03 (16) 12.50 (12) 8.99 (71) 5.12 (60) 8.70 (46) 6.21 (64) 09/01/2001
Policy Index 6.50 (10) 11.03 (43) 9.35 (60) 5.73 (46) 8.72 (46) 6.51 (52)
All Corporate Plans ($250M to $1B)-Total Fund Median 4.36 10.82 9.61 5.49 8.47 6.58
U.S. Fixed Income 163,929.70 32.36
Newfleet 54,596.49 10.78 0.24 (31) 5.70 (26) 6.76 (27) 6.81 (30) 5.62 (40) 6.03 (38) 08/01/2001
Barclays Aggregate Index -0.12 (88) 3.77 (93) 5.52 (89) 5.47 (90) 5.03 (86) 5.51 (88)
IM U.S. Broad Market Core Fixed Income (SA+CF) Median 0.11 4.89 6.20 6.24 5.46 5.88
Taplin, Canida & Habacht 58,559.62 11.56 0.34 (23) 8.76 (3) 8.32 (2) 8.91 (1) N/A 7.35 (2) 10/01/2005
Barclays Aggregate Index -0.12 (88) 3.77 (93) 5.52 (89) 5.47 (90) 5.03 (86) 5.53 (83)
IM U.S. Broad Market Core Fixed Income (SA+CF) Median 0.11 4.89 6.20 6.24 5.46 6.02
PIMCO Total Return Inst 50,773.58 10.02 0.61 (10) 7.99 (8) 6.94 (22) 7.74 (7) N/A 7.39 (4) 10/01/2005
Barclays Aggregate Index -0.12 (81) 3.77 (83) 5.52 (72) 5.47 (65) 5.03 (41) 5.53 (43)
IM U.S. Broad Market Core Fixed Income (MF) Median 0.16 5.37 6.10 5.94 4.84 5.37
Convertibles 50,865.65 10.04
Victory 50,865.65 10.04 6.84 (31) 8.54 (68) 6.88 (92) 3.23 (100) N/A 2.98 (100) 03/01/2007
BofAML Convertible Bonds, U.S. Investment Grade 6.55 (47) 7.86 (73) 6.05 (100) 6.19 (73) 5.96 (100) 5.82 (69)
IM U.S. Convertible Bonds (SA+CF) Median 6.37 9.79 8.80 8.28 8.55 6.80
U.S. Equity 248,998.03 49.15
Horizon 36,167.11 7.14 12.27 (36) 22.73 (3) 13.72 (25) -0.14 (100) N/A 3.98 (93) 03/01/2005
Russell 1000 Value Index 12.31 (36) 18.77 (19) 12.74 (45) 4.85 (75) 9.18 (75) 5.05 (79)
IM U.S. Large Cap Value Equity (SA+CF) Median 11.56 15.85 12.49 6.01 10.04 6.08
iShares Russell 1000 Value 35,370.52 6.98 11.85 (26) 18.34 (7) 12.22 (13) N/A N/A 24.51 (8) 03/01/2009
Russell 1000 Value Index 12.31 (14) 18.77 (5) 12.74 (6) 4.85 (35) 9.18 (20) 23.77 (11)
IM U.S. Large Cap Value Equity (MF) Median 11.27 15.25 10.55 4.17 8.24 21.21
Northern Trust LCG 39,939.63 7.88 7.63 (82) 6.36 (79) 11.97 (58) 5.96 (62) N/A 4.19 (34) 11/01/2007
Russell 1000 Growth Index 9.54 (43) 10.09 (43) 13.06 (34) 7.30 (38) 8.62 (66) 3.83 (40)
IM U.S. Large Cap Growth Equity (SA+CF) Median 9.24 9.04 12.25 6.63 9.09 3.34
Sands Capital Management 32,778.52 6.47 7.04 (91) 11.32 (33) N/A N/A N/A 9.95 (73) 03/01/2012
Russell 1000 Growth Index 9.54 (43) 10.09 (43) 13.06 (34) 7.30 (38) 8.62 (66) 12.59 (42)
IM U.S. Large Cap Growth Equity (SA+CF) Median 9.24 9.04 12.25 6.63 9.09 11.88
Advisory Research 61,155.09 12.07 10.83 (78) 12.82 (86) 10.53 (90) 5.24 (98) 11.71 (87) 9.22 (79) 08/01/2001
Russell 2000 Value Index 11.63 (65) 18.09 (50) 12.12 (82) 7.29 (85) 11.29 (91) 8.30 (90)
IM U.S. Small Cap Value Equity (SA+CF) Median 12.56 18.09 14.11 9.78 13.45 10.54
IronBridge Capital Management 43,587.16 8.60 12.94 (46) 12.31 (85) 12.68 (87) 7.51 (86) N/A 8.21 (62) 05/01/2004
Russell 2000 Index 12.39 (58) 16.30 (50) 13.45 (81) 8.24 (74) 11.52 (83) 7.55 (81)
IM U.S. Small Cap Core Equity (SA+CF) Median 12.63 16.24 15.69 9.28 12.85 8.86
Public Health Trust/Jackson Health System
Asset Allocation & Performance
As of March 31, 2013
Net-of-Fees
Returns are expressed as percentages and annualized for periods greater than one year.Net of fees performance began being tracked in July 2012.
Page 24

Public Health Trust/Jackson Health System
Asset Allocation & Performance
As of March 31, 2013
Net-of-Fees
Allocation
MarketValue($000)
%
Performance(%)
1Quarter
1Year
3Years
5Years
10Years
SinceInception
InceptionDate
Non-U.S. Equity 42,154.15 8.32
Northern Trust ACWI ex-US 20,435.89 4.03 3.18 (86) N/A N/A N/A N/A 9.81 (73) 11/07/2012
MSCI ACWI ex-US (11/7/12 fwd) 3.17 (86) N/A N/A N/A N/A 9.68 (77)
IM International Large Cap Core Equity (SA+CF) Median 4.92 12.11 6.84 0.45 11.06 10.84
Thornburg International Value I 21,718.27 4.29 2.51 (58) 6.78 (64) N/A N/A N/A 10.98 (47) 11/01/2011
MSCI EAFE Index (net) 5.13 (22) 11.25 (28) 5.00 (47) -0.89 (58) 9.69 (61) 11.21 (44)
IM International Equity (MF) Median 3.03 8.44 4.79 -0.40 10.58 10.54
Cash 637.11 0.13
Returns are expressed as percentages and annualized for periods greater than one year.Net of fees performance began being tracked in July 2012.
Page 25

Quarterly Investment Review
Public Health Trust/Jackson Health System | First Quarter 2013

1 Executive Summary
2 Total Fund
3 U.S. Fixed Income
4 U.S. Equity
5 Non-U.S. Equity
6 Market Environment
7 Investment Analysis Highlights

Executive Summary
Page 1

Market Highlights
FirstQuarter
Year‐to‐Date 1‐Year 3‐Year1 5‐Year1 10‐Year1
EquityMSCI All Country World IMI 6.90% 6.90% 10.95% 8.13% 2.58% 9.87%MSCI All Country World 6.50% 6.50% 10.55% 7.78% 2.06% 9.36%Dow Jones U.S. Total Stock Market 11.07% 11.07% 14.49% 13.08% 6.48% 9.43%Russell 3000 11.07% 11.07% 14.57% 12.97% 6.32% 9.15%S&P 500 10.61% 10.61% 13.96% 12.68% 5.81% 8.53%Russell 2000 12.39% 12.39% 16.30% 13.45% 8.24% 11.52%MSCI All Country World ex‐U.S. IMI 3.57% 3.57% 8.62% 4.71% ‐0.03% 11.33%MSCI All Country World ex‐U.S. 3.17% 3.17% 8.36% 4.41% ‐0.39% 10.93%MSCI EAFE 5.13% 5.13% 11.26% 5.00% ‐0.89% 9.69%MSCI EAFE (100% Hedged) 8.79% 8.79% 13.27% 1.59% ‐1.75% 5.22%MSCI EAFE (Local Currency) 9.67% 9.67% 16.73% 4.34% 0.74% 7.46%MSCI Emerging Markets ‐1.62% ‐1.62% 1.96% 3.27% 1.09% 17.05%Fixed IncomeBarclays Global Aggregate ‐2.10% ‐2.10% 1.25% 4.52% 3.65% 5.47%Barclays Aggregate ‐0.12% ‐0.12% 3.79% 5.54% 5.48% 5.03%Barclays Long Gov't ‐2.26% ‐2.26% 7.42% 12.39% 8.28% 7.24%Barclays Long Credit ‐1.80% ‐1.80% 9.83% 12.05% 10.45% 7.72%Barclays Long Gov't/Credit ‐1.98% ‐1.98% 8.94% 12.31% 9.55% 7.52%Barclays US TIPS ‐0.37% ‐0.37% 5.67% 8.56% 5.88% 6.32%Barclays High Yield 2.90% 2.90% 13.13% 11.24% 11.65% 10.13%SSB Non‐U.S. WGBI ‐3.83% ‐3.83% ‐2.16% 3.33% 2.28% 5.58%JP Morgan EMBI Global (Emerging Markets) ‐2.30% ‐2.30% 10.44% 10.55% 9.81% 10.59%CommoditiesDow Jones‐UBS Commodity ‐1.13% ‐1.13% ‐3.03% 1.42% ‐7.11% 3.67%Goldman Sachs Commodity 0.55% 0.55% ‐4.96% 3.04% ‐9.74% 2.34%Hedge FundsHFRI Fund‐Weighted Composite2 3.81% 3.81% 5.46% 4.05% 3.02% 6.99%HFRI Fund of Funds2 3.36% 3.36% 4.78% 2.10% ‐0.24% 3.85%Real EstateNAREIT U.S. Equity REITS 8.19% 8.19% 15.29% 17.17% 6.83% 12.44%NCREIF ODCE3 2.69% 2.69% 10.79% 15.13% ‐0.84% 6.80%Private EquityThomson Reuters VentureXpert4 3.75% 9.11% 13.49% 13.63% 4.47% 12.54%InfrastructureMacquarie Global Infrastructure ‐ North America 12.00% 12.00% 16.68% 16.37% 7.28% 13.47%
MSCI Indices and NCREIF ODCE show net retuns.MSCI EAFE (100% Hedged) shows price return.All other indices show total returns.1 Periods are annualized.2 Latest 5 months of HFR data are estimated by HFR and may change in the future.3 First quarter results are preliminary.4 Benchmark is as of 09/30/2012.
Periods Ending 03/31/2013Returns of the Major Capital Markets
Page 2

Market Highlights
5.81%8.24%
‐0.89%
1.09%
5.48%8.28%
10.45%11.65%
‐7.11%
8.53%
11.52%9.69%
17.05%
5.03%7.24% 7.72%
10.13%
3.67%
‐10%
‐5%
0%
5%
10%
15%
20%
S&P 500 Russell 2000 MSCI EAFE MSCI EmergingMarkets
BarclaysAggregate
Barclays LongGov't
Barclays LongCredit
Barclays HighYield
Dow Jones‐UBSCommodity
LONG‐TERM ANNUALIZED RETURNSAS OF 03/31/2013
Five‐Year Ten‐Year
Source: Russell, MSCI, Barclays, DJ‐UBS
10.61%12.39%
5.13%
‐1.62%‐0.12%
‐2.26% ‐1.80%
2.90%
‐1.13%
13.96%
16.30%
11.26%
1.96%3.79%
7.42%
9.83%
13.13%
‐3.03%‐5%
0%
5%
10%
15%
20%
S&P 500 Russell 2000 MSCI EAFE MSCI EmergingMarkets
BarclaysAggregate
Barclays LongGov't
Barclays LongCredit
Barclays HighYield
Dow Jones‐UBSCommodity
SHORT‐TERM RETURNSAS OF 03/31/2013
First Quarter 2013 One‐Year
Source: Russell, MSCI, Barclays, DJ‐UBS
Page 3

Executive Summary
Recent Developments & RecommendationsIn February 2013, Victory Capital Management announced that the employees of the firm had partnered with Crestview Partners, a leading private equity firm, to acquire all of KeyCorp’s interest in Victory. Upon completion of the transaction, Victory will be an independent firm with the senior management team, portfolio managers and other employees owning a significant amount of the outstanding equity.
In February 2013, Advisory Research announced that Chris Crawshaw will replace Brien O’Brien as CEO. Mr. O’Brien will remain as Chairman. The transition is scheduled to take place throughout 2013.
In January 2013, BlackRock announced plans to buy Credit Suisse’s ETF business. The terms of the deal were not disclosed. The deal would give BlackRock control of nearly three quarters of the physical ETF market in Europe.
In November 2012, David Albrycht, previously CIO of Newfleet, was given the newly created title of president and the responsibility of overseeing the growth of the firm. In January 2013, Bob Bishop was promoted to CIO and portfolio strategist of the firm. He will continue to work closely with the remaining portfolio managers on the firm’s Core Fixed Income strategy.
At the January 2013 meeting, HEK presented a search report for the additional asset classes selected as part of the asset liability modeling (ALM) study. The Committee selected DFA, MacKay Shields, Harding Loevner and European Investors to fill the TIPS fixed income, high yield fixed income, international equity and global REIT mandates, respectively. The transition is currently in progress and expected to be completed at the beginning of June 2013.
HEK recommended that the Victory Convertible Securities account be terminated in order to fund the new asset classes.
Due to sustained underperformance and the resulting loss of assets, the Committee elected to replace the Artio International Equity Fund. In November 2012, assets were transferred to the Northern Trust ACWI ex-US – Non-Lending Fund on a temporary basis. At the last meeting, the Harding Loevner International Equity strategy was selected as the permanent replacement for the Artio fund and the transition is expected to be completed at the beginning of June 2013.
HEK recommended that the iShares Russell 1000 Value Index Fund be replaced with a lower cost index product and has prepared a search report highlighting lower cost options in this asset class.
Asset Allocation & PerformanceTotal Pension Plan assets as of March 31, 2013 were $506.6 million.
The Plan’s asset allocation at the end of the first quarter was as follows: 0.1 percent in cash, 32.4 percent in domestic fixed income, 49.2 percent in domestic equity, 8.3 percent in international equity and 10.0 percent in convertible securities.
The Plan returned 6.1 percent for the first quarter of 2013, underperforming the return of the Policy Index by 36 basis points.
In spite of underperformance this quarter, the Plan outpaced the Policy Index by 181 basis points for the one-year period ending March 31, 2013.
Page 4

Return Summary
Quarterly Excess Performance - 3 Years Ratio of Cumulative Wealth - 5 Years
Total DB Plan Policy Index
0.0
3.0
6.0
9.0
12.0
15.0
17.6
Re
turn
(%
)
1Quarter
1Year
3Years
5Years
10Years
6.5
11.0
9.4
5.7
8.7
6.1
12.8
9.1
5.2
8.7
Total DB Plan Benchmark
0.94
0.96
0.98
1.00
1.02
1.03
3/08 9/08 3/09 9/09 3/10 9/10 3/11 9/11 3/12 9/12 3/13
0.97
Quarterly Out Performance
Quarterly Under Performance
0.0%
1.0%
2.0%
3.0%
3.5%
-1.0 %
-2.0 %
-2.9 %
6/10 12/10 6/11 12/11 6/12 12/12 3/13
Total Plan Performance Summary
As of March 31, 2013Public Health Trust/Jackson Health System
Page 5

Allocation
MarketValue($000)
%
Performance(%)
1Quarter
1Year
3Years
5Years
10Years
SinceInception
InceptionDate
Total DB Plan 506,584.63 100.00 6.14 (16) 12.84 (9) 9.10 (67) 5.18 (60) 8.74 (45) 6.24 (63) 09/01/2001
Policy Index 6.50 (10) 11.03 (43) 9.35 (60) 5.73 (46) 8.72 (46) 6.51 (52)
All Corporate Plans ($250M to $1B)-Total Fund Median 4.36 10.82 9.61 5.49 8.47 6.58
U.S. Fixed Income 163,929.70 32.36
Newfleet 54,596.49 10.78 0.35 (23) 6.04 (19) 6.87 (23) 6.88 (27) 5.66 (37) 6.05 (35) 08/01/2001
Barclays Aggregate Index -0.12 (88) 3.77 (93) 5.52 (89) 5.47 (90) 5.03 (86) 5.51 (88)
IM U.S. Broad Market Core Fixed Income (SA+CF) Median 0.11 4.89 6.20 6.24 5.46 5.88
Taplin, Canida & Habacht 58,559.62 11.56 0.40 (19) 8.97 (3) 8.39 (2) 8.95 (1) N/A 7.38 (2) 10/01/2005
Barclays Aggregate Index -0.12 (88) 3.77 (93) 5.52 (89) 5.47 (90) 5.03 (86) 5.53 (83)
IM U.S. Broad Market Core Fixed Income (SA+CF) Median 0.11 4.89 6.20 6.24 5.46 6.02
PIMCO Total Return Inst 50,773.58 10.02 0.61 (10) 7.99 (8) 6.94 (22) 7.74 (7) N/A 7.39 (4) 10/01/2005
Barclays Aggregate Index -0.12 (81) 3.77 (83) 5.52 (72) 5.47 (65) 5.03 (41) 5.53 (43)
IM U.S. Broad Market Core Fixed Income (MF) Median 0.16 5.37 6.10 5.94 4.84 5.37
Convertibles 50,865.65 10.04
Victory 50,865.65 10.04 6.97 (29) 8.96 (63) 7.01 (91) 3.31 (100) N/A 3.04 (100) 03/01/2007
BofAML Convertible Bonds, U.S. Investment Grade 6.55 (47) 7.86 (73) 6.05 (100) 6.19 (73) 5.96 (100) 5.82 (69)
IM U.S. Convertible Bonds (SA+CF) Median 6.37 9.79 8.80 8.28 8.55 6.80
U.S. Equity 248,998.03 49.15
Horizon 36,167.11 7.14 12.44 (31) 23.29 (3) 13.90 (23) -0.05 (100) N/A 4.04 (92) 03/01/2005
Russell 1000 Value Index 12.31 (36) 18.77 (19) 12.74 (45) 4.85 (75) 9.18 (75) 5.05 (79)
IM U.S. Large Cap Value Equity (SA+CF) Median 11.56 15.85 12.49 6.01 10.04 6.08
iShares Russell 1000 Value 35,370.52 6.98 11.85 (26) 18.34 (7) 12.22 (13) N/A N/A 24.51 (8) 03/01/2009
Russell 1000 Value Index 12.31 (14) 18.77 (5) 12.74 (6) 4.85 (35) 9.18 (20) 23.77 (11)
IM U.S. Large Cap Value Equity (MF) Median 11.27 15.25 10.55 4.17 8.24 21.21
Northern Trust LCG 39,939.63 7.88 7.63 (82) 6.36 (79) 11.97 (58) 5.96 (62) N/A 4.19 (34) 11/01/2007
Russell 1000 Growth Index 9.54 (43) 10.09 (43) 13.06 (34) 7.30 (38) 8.62 (66) 3.83 (40)
IM U.S. Large Cap Growth Equity (SA+CF) Median 9.24 9.04 12.25 6.63 9.09 3.34
Sands Capital Management 32,778.52 6.47 7.23 (86) 11.95 (26) N/A N/A N/A 10.52 (66) 03/01/2012
Russell 1000 Growth Index 9.54 (43) 10.09 (43) 13.06 (34) 7.30 (38) 8.62 (66) 12.59 (42)
IM U.S. Large Cap Growth Equity (SA+CF) Median 9.24 9.04 12.25 6.63 9.09 11.88
Advisory Research 61,155.09 12.07 11.09 (76) 13.63 (84) 10.80 (89) 5.40 (97) 11.79 (86) 9.28 (78) 08/01/2001
Russell 2000 Value Index 11.63 (65) 18.09 (50) 12.12 (82) 7.29 (85) 11.29 (91) 8.30 (90)
IM U.S. Small Cap Value Equity (SA+CF) Median 12.56 18.09 14.11 9.78 13.45 10.54
IronBridge Capital Management 43,587.16 8.60 13.21 (42) 13.15 (83) 12.96 (86) 7.67 (83) N/A 8.30 (62) 05/01/2004
Russell 2000 Index 12.39 (58) 16.30 (50) 13.45 (81) 8.24 (74) 11.52 (83) 7.55 (81)
IM U.S. Small Cap Core Equity (SA+CF) Median 12.63 16.24 15.69 9.28 12.85 8.86
Public Health Trust/Jackson Health System
Asset Allocation & Performance
As of March 31, 2013
Gross-of-Fees
Returns for PIMCO, iShares, Artio and Thornburg are reported net of fees.Returns are expressed as percentages and annualized for periods greater than one year.
Page 6

Public Health Trust/Jackson Health System
Asset Allocation & Performance
As of March 31, 2013
Gross-of-Fees
Allocation
MarketValue($000)
%
Performance(%)
1Quarter
1Year
3Years
5Years
10Years
SinceInception
InceptionDate
Non-U.S. Equity 42,154.15 8.32
Northern Trust ACWI ex-US 20,435.89 4.03 3.18 (86) N/A N/A N/A N/A 9.81 (73) 11/07/2012
MSCI ACWI ex-US (11/7/12 fwd) 3.17 (86) N/A N/A N/A N/A 9.68 (77)
IM International Large Cap Core Equity (SA+CF) Median 4.92 12.11 6.84 0.45 11.06 10.84
Thornburg International Value I 21,718.27 4.29 2.51 (58) 6.78 (64) N/A N/A N/A 10.98 (47) 11/01/2011
MSCI EAFE Index (net) 5.13 (22) 11.25 (28) 5.00 (47) -0.89 (58) 9.69 (61) 11.21 (44)
IM International Equity (MF) Median 3.03 8.44 4.79 -0.40 10.58 10.54
Cash 637.11 0.13
Returns for PIMCO, iShares, Artio and Thornburg are reported net of fees.Returns are expressed as percentages and annualized for periods greater than one year.
Page 7

Allocation
MarketValue($000)
%
Performance(%)
1Quarter
1Year
3Years
5Years
10Years
SinceInception
InceptionDate
Total DB Plan 506,584.63 100.00 6.03 (16) 12.50 (12) 8.99 (71) 5.12 (60) 8.70 (46) 6.21 (64) 09/01/2001
Policy Index 6.50 (10) 11.03 (43) 9.35 (60) 5.73 (46) 8.72 (46) 6.51 (52)
All Corporate Plans ($250M to $1B)-Total Fund Median 4.36 10.82 9.61 5.49 8.47 6.58
U.S. Fixed Income 163,929.70 32.36
Newfleet 54,596.49 10.78 0.24 (31) 5.70 (26) 6.76 (27) 6.81 (30) 5.62 (40) 6.03 (38) 08/01/2001
Barclays Aggregate Index -0.12 (88) 3.77 (93) 5.52 (89) 5.47 (90) 5.03 (86) 5.51 (88)
IM U.S. Broad Market Core Fixed Income (SA+CF) Median 0.11 4.89 6.20 6.24 5.46 5.88
Taplin, Canida & Habacht 58,559.62 11.56 0.34 (23) 8.76 (3) 8.32 (2) 8.91 (1) N/A 7.35 (2) 10/01/2005
Barclays Aggregate Index -0.12 (88) 3.77 (93) 5.52 (89) 5.47 (90) 5.03 (86) 5.53 (83)
IM U.S. Broad Market Core Fixed Income (SA+CF) Median 0.11 4.89 6.20 6.24 5.46 6.02
PIMCO Total Return Inst 50,773.58 10.02 0.61 (10) 7.99 (8) 6.94 (22) 7.74 (7) N/A 7.39 (4) 10/01/2005
Barclays Aggregate Index -0.12 (81) 3.77 (83) 5.52 (72) 5.47 (65) 5.03 (41) 5.53 (43)
IM U.S. Broad Market Core Fixed Income (MF) Median 0.16 5.37 6.10 5.94 4.84 5.37
Convertibles 50,865.65 10.04
Victory 50,865.65 10.04 6.84 (31) 8.54 (68) 6.88 (92) 3.23 (100) N/A 2.98 (100) 03/01/2007
BofAML Convertible Bonds, U.S. Investment Grade 6.55 (47) 7.86 (73) 6.05 (100) 6.19 (73) 5.96 (100) 5.82 (69)
IM U.S. Convertible Bonds (SA+CF) Median 6.37 9.79 8.80 8.28 8.55 6.80
U.S. Equity 248,998.03 49.15
Horizon 36,167.11 7.14 12.27 (36) 22.73 (3) 13.72 (25) -0.14 (100) N/A 3.98 (93) 03/01/2005
Russell 1000 Value Index 12.31 (36) 18.77 (19) 12.74 (45) 4.85 (75) 9.18 (75) 5.05 (79)
IM U.S. Large Cap Value Equity (SA+CF) Median 11.56 15.85 12.49 6.01 10.04 6.08
iShares Russell 1000 Value 35,370.52 6.98 11.85 (26) 18.34 (7) 12.22 (13) N/A N/A 24.51 (8) 03/01/2009
Russell 1000 Value Index 12.31 (14) 18.77 (5) 12.74 (6) 4.85 (35) 9.18 (20) 23.77 (11)
IM U.S. Large Cap Value Equity (MF) Median 11.27 15.25 10.55 4.17 8.24 21.21
Northern Trust LCG 39,939.63 7.88 7.63 (82) 6.36 (79) 11.97 (58) 5.96 (62) N/A 4.19 (34) 11/01/2007
Russell 1000 Growth Index 9.54 (43) 10.09 (43) 13.06 (34) 7.30 (38) 8.62 (66) 3.83 (40)
IM U.S. Large Cap Growth Equity (SA+CF) Median 9.24 9.04 12.25 6.63 9.09 3.34
Sands Capital Management 32,778.52 6.47 7.04 (91) 11.32 (33) N/A N/A N/A 9.95 (73) 03/01/2012
Russell 1000 Growth Index 9.54 (43) 10.09 (43) 13.06 (34) 7.30 (38) 8.62 (66) 12.59 (42)
IM U.S. Large Cap Growth Equity (SA+CF) Median 9.24 9.04 12.25 6.63 9.09 11.88
Advisory Research 61,155.09 12.07 10.83 (78) 12.82 (86) 10.53 (90) 5.24 (98) 11.71 (87) 9.22 (79) 08/01/2001
Russell 2000 Value Index 11.63 (65) 18.09 (50) 12.12 (82) 7.29 (85) 11.29 (91) 8.30 (90)
IM U.S. Small Cap Value Equity (SA+CF) Median 12.56 18.09 14.11 9.78 13.45 10.54
IronBridge Capital Management 43,587.16 8.60 12.94 (46) 12.31 (85) 12.68 (87) 7.51 (86) N/A 8.21 (62) 05/01/2004
Russell 2000 Index 12.39 (58) 16.30 (50) 13.45 (81) 8.24 (74) 11.52 (83) 7.55 (81)
IM U.S. Small Cap Core Equity (SA+CF) Median 12.63 16.24 15.69 9.28 12.85 8.86
Public Health Trust/Jackson Health System
Asset Allocation & Performance
As of March 31, 2013
Net-of-Fees
Returns are expressed as percentages and annualized for periods greater than one year.Net of fees performance began being tracked in July 2012.
Page 8

Public Health Trust/Jackson Health System
Asset Allocation & Performance
As of March 31, 2013
Net-of-Fees
Allocation
MarketValue($000)
%
Performance(%)
1Quarter
1Year
3Years
5Years
10Years
SinceInception
InceptionDate
Non-U.S. Equity 42,154.15 8.32
Northern Trust ACWI ex-US 20,435.89 4.03 3.18 (86) N/A N/A N/A N/A 9.81 (73) 11/07/2012
MSCI ACWI ex-US (11/7/12 fwd) 3.17 (86) N/A N/A N/A N/A 9.68 (77)
IM International Large Cap Core Equity (SA+CF) Median 4.92 12.11 6.84 0.45 11.06 10.84
Thornburg International Value I 21,718.27 4.29 2.51 (58) 6.78 (64) N/A N/A N/A 10.98 (47) 11/01/2011
MSCI EAFE Index (net) 5.13 (22) 11.25 (28) 5.00 (47) -0.89 (58) 9.69 (61) 11.21 (44)
IM International Equity (MF) Median 3.03 8.44 4.79 -0.40 10.58 10.54
Cash 637.11 0.13
Returns are expressed as percentages and annualized for periods greater than one year.Net of fees performance began being tracked in July 2012.
Page 9

Performance(%)
2012 2011 2010 2009 2008 2007 2006 2005 2004 2003
Total DB Plan 15.3 (18) -2.0 (95) 12.3 (80) 19.4 (62) -24.9 (43) 8.2 (46) 12.7 (65) 7.5 (53) 13.4 (13) 26.8 (14)
Policy Index 12.1 (67) 0.7 (61) 13.4 (58) 20.0 (57) -23.8 (33) 5.2 (93) 14.7 (27) 5.6 (91) 12.5 (37) 26.3 (15)
All Corporate Plans ($250M to $1B)-Total Fund Median 13.4 2.0 13.6 20.7 -26.1 7.8 13.2 7.7 12.0 22.3
U.S. Fixed Income
Newfleet 7.6 (13) 7.0 (81) 8.2 (26) 10.8 (39) 1.5 (59) 6.1 (70) 4.7 (32) 2.3 (92) 4.6 (44) 5.8 (14)
Barclays Aggregate Index 4.2 (91) 7.8 (52) 6.5 (86) 5.9 (88) 5.2 (32) 7.0 (45) 4.3 (69) 2.4 (83) 4.3 (71) 4.1 (67)
IM U.S. Broad Market Core Fixed Income (SA+CF) Median 5.9 7.8 7.2 9.8 3.0 6.9 4.5 2.7 4.5 4.5
Taplin, Canida & Habacht 9.9 (4) 8.9 (10) 8.4 (21) 17.0 (8) 0.8 (59) 4.9 (90) 4.7 (28) - - -
Barclays Aggregate Index 4.2 (91) 7.8 (52) 6.5 (86) 5.9 (88) 5.2 (32) 7.0 (45) 4.3 (69) 2.4 (83) 4.3 (71) 4.1 (67)
IM U.S. Broad Market Core Fixed Income (SA+CF) Median 5.9 7.8 7.2 9.8 3.0 6.9 4.5 2.7 4.5 4.5
PIMCO Total Return Inst 10.4 (5) 4.2 (91) 8.9 (24) 13.9 (46) 4.5 (15) 9.0 (1) 3.9 (54) - - -
Barclays Aggregate Index 4.2 (86) 7.8 (11) 6.5 (76) 5.9 (92) 5.2 (9) 7.0 (11) 4.3 (31) 2.4 (15) 4.3 (33) 4.1 (59)
IM U.S. Broad Market Core Fixed Income (MF) Median 6.8 6.6 7.5 13.3 -3.7 5.2 3.9 1.8 4.0 4.4
Convertibles
Victory 9.8 (76) -3.1 (46) 10.1 (90) 24.8 (95) -27.5 (49) - - - - -
BofAML Convertible Bonds, U.S. Investment Grade 10.0 (75) -3.6 (53) 7.4 (95) 28.6 (86) -15.2 (11) 7.9 (70) 7.3 (99) 0.9 (91) 4.7 (91) 11.5 (96)
IM U.S. Convertible Bonds (SA+CF) Median 11.2 -3.3 16.4 39.6 -27.8 8.8 11.3 3.7 7.4 22.5
U.S. Equity
Horizon 27.3 (2) -8.3 (95) 16.8 (27) 21.8 (71) -53.7 (99) 19.2 (3) 26.3 (3) - - -
Russell 1000 Value Index 17.5 (29) 0.4 (50) 15.5 (41) 19.7 (80) -36.8 (63) -0.2 (77) 22.2 (16) 7.1 (63) 16.5 (37) 30.0 (56)
IM U.S. Large Cap Value Equity (SA+CF) Median 15.8 0.2 14.5 25.7 -35.5 4.0 18.9 8.4 15.1 30.7
iShares Russell 1000 Value 17.4 (26) 0.0 (29) 14.9 (23) - - - - - - -
Russell 1000 Value Index 17.5 (24) 0.4 (25) 15.5 (17) 19.7 (73) -36.8 (49) -0.2 (64) 22.2 (6) 7.1 (28) 16.5 (13) 30.0 (37)
IM U.S. Large Cap Value Equity (MF) Median 15.6 -2.2 12.9 24.1 -36.9 1.6 18.0 5.1 12.9 28.5
Northern Trust LCG 15.5 (49) 0.6 (45) 15.5 (57) 32.8 (59) -37.8 (45) - - - - -
Russell 1000 Growth Index 15.3 (52) 2.6 (27) 16.7 (46) 37.2 (35) -38.4 (48) 11.8 (61) 9.1 (53) 5.3 (69) 6.3 (79) 29.7 (46)
IM U.S. Large Cap Growth Equity (SA+CF) Median 15.3 0.0 16.2 34.5 -38.6 13.5 9.4 7.5 9.3 28.6
Sands Capital Management - - - - - - - - - -
Russell 1000 Growth Index 15.3 (52) 2.6 (27) 16.7 (46) 37.2 (35) -38.4 (48) 11.8 (61) 9.1 (53) 5.3 (69) 6.3 (79) 29.7 (46)
IM U.S. Large Cap Growth Equity (SA+CF) Median 15.3 0.0 16.2 34.5 -38.6 13.5 9.4 7.5 9.3 28.6
Advisory Research 11.7 (91) -3.1 (49) 21.9 (85) 10.7 (100) -24.1 (7) 0.1 (40) 18.4 (52) 14.5 (9) 25.9 (27) 36.4 (86)
Russell 2000 Value Index 18.1 (48) -5.5 (66) 24.5 (73) 20.6 (88) -28.9 (25) -9.8 (83) 23.5 (16) 4.7 (74) 22.2 (51) 46.0 (47)
IM U.S. Small Cap Value Equity (SA+CF) Median 17.6 -3.3 27.8 34.3 -33.0 -2.1 18.5 8.2 22.3 45.4
IronBridge Capital Management 13.7 (79) -2.6 (61) 23.0 (91) 24.8 (74) -31.1 (18) 10.4 (12) 15.3 (59) 3.4 (89) - -
Russell 2000 Index 16.3 (54) -4.2 (73) 26.9 (65) 27.2 (64) -33.8 (35) -1.6 (62) 18.4 (25) 4.6 (82) 18.3 (70) 47.3 (31)
IM U.S. Small Cap Core Equity (SA+CF) Median 16.7 -1.5 28.3 29.8 -36.0 -0.2 16.2 8.0 20.7 44.6
Public Health Trust/Jackson Health System
Calendar Year Performance
As of March 31, 2013
Gross-of-Fees
Returns for PIMCO, iShares, Artio and Thornburg are reported net of fees.Returns are expressed as percentages.
Page 10

Public Health Trust/Jackson Health System
Calendar Year Performance
As of March 31, 2013
Gross-of-Fees
Performance(%)
2012 2011 2010 2009 2008 2007 2006 2005 2004 2003
Non-U.S. Equity
Northern Trust ACWI ex-US - - - - - - - - - -
MSCI ACWI ex-US (11/7/12 fwd) - - - - - - - - - -
IM International Large Cap Core Equity (SA+CF) 19.1 -12.0 11.1 32.4 -43.6 12.7 27.2 16.4 19.5 37.0
Thornburg International Value I 15.8 (75) - - - - - - - - -
MSCI EAFE Index (net) 17.3 (64) -12.1 (27) 7.8 (80) 31.8 (64) -43.4 (33) 11.2 (63) 26.3 (48) 13.5 (67) 20.2 (38) 38.6 (51)
IM International Equity (MF) Median 18.6 -14.9 13.0 36.3 -46.0 13.3 26.2 15.7 18.6 38.6
Returns for PIMCO, iShares, Artio and Thornburg are reported net of fees.Returns are expressed as percentages.
Page 11

Performance(%)
2012 2011 2010 2009 2008 2007 2006 2005 2004 2003
Total DB Plan 15.1 (19) -2.0 (95) 12.3 (80) 19.4 (62) -24.9 (43) 8.2 (46) 12.7 (65) 7.5 (53) 13.4 (13) 26.8 (14)
Policy Index 12.1 (67) 0.7 (61) 13.4 (58) 20.0 (57) -23.8 (33) 5.2 (93) 14.7 (27) 5.6 (91) 12.5 (37) 26.3 (15)
All Corporate Plans ($250M to $1B)-Total Fund Median 13.4 2.0 13.6 20.7 -26.1 7.8 13.2 7.7 12.0 22.3
U.S. Fixed Income
Newfleet 7.3 (16) 7.0 (81) 8.2 (26) 10.8 (39) 1.5 (59) 6.1 (70) 4.7 (32) 2.3 (92) 4.6 (44) 5.8 (14)
Barclays Aggregate Index 4.2 (91) 7.8 (52) 6.5 (86) 5.9 (88) 5.2 (32) 7.0 (45) 4.3 (69) 2.4 (83) 4.3 (71) 4.1 (67)
IM U.S. Broad Market Core Fixed Income (SA+CF) Median 5.9 7.8 7.2 9.8 3.0 6.9 4.5 2.7 4.5 4.5
Taplin, Canida & Habacht 9.8 (5) 8.9 (10) 8.4 (21) 17.0 (8) 0.8 (59) 4.9 (90) 4.7 (28) - - -
Barclays Aggregate Index 4.2 (91) 7.8 (52) 6.5 (86) 5.9 (88) 5.2 (32) 7.0 (45) 4.3 (69) 2.4 (83) 4.3 (71) 4.1 (67)
IM U.S. Broad Market Core Fixed Income (SA+CF) Median 5.9 7.8 7.2 9.8 3.0 6.9 4.5 2.7 4.5 4.5
PIMCO Total Return Inst 10.4 (5) 4.2 (91) 8.9 (24) 13.9 (46) 4.5 (15) 9.0 (1) 3.9 (54) - - -
Barclays Aggregate Index 4.2 (86) 7.8 (11) 6.5 (76) 5.9 (92) 5.2 (9) 7.0 (11) 4.3 (31) 2.4 (15) 4.3 (33) 4.1 (59)
IM U.S. Broad Market Core Fixed Income (MF) Median 6.8 6.6 7.5 13.3 -3.7 5.2 3.9 1.8 4.0 4.4
Convertibles
Victory 9.5 (82) -3.1 (46) 10.1 (90) 24.8 (95) -27.5 (49) - - - - -
BofAML Convertible Bonds, U.S. Investment Grade 10.0 (75) -3.6 (53) 7.4 (95) 28.6 (86) -15.2 (11) 7.9 (70) 7.3 (99) 0.9 (91) 4.7 (91) 11.5 (96)
IM U.S. Convertible Bonds (SA+CF) Median 11.2 -3.3 16.4 39.6 -27.8 8.8 11.3 3.7 7.4 22.5
U.S. Equity
Horizon 26.9 (2) -8.3 (95) 16.8 (27) 21.8 (71) -53.7 (99) 19.2 (3) 26.3 (3) - - -
Russell 1000 Value Index 17.5 (29) 0.4 (50) 15.5 (41) 19.7 (80) -36.8 (63) -0.2 (77) 22.2 (16) 7.1 (63) 16.5 (37) 30.0 (56)
IM U.S. Large Cap Value Equity (SA+CF) Median 15.8 0.2 14.5 25.7 -35.5 4.0 18.9 8.4 15.1 30.7
iShares Russell 1000 Value 17.4 (26) 0.0 (29) 14.9 (23) - - - - - - -
Russell 1000 Value Index 17.5 (24) 0.4 (25) 15.5 (17) 19.7 (73) -36.8 (49) -0.2 (64) 22.2 (6) 7.1 (28) 16.5 (13) 30.0 (37)
IM U.S. Large Cap Value Equity (MF) Median 15.6 -2.2 12.9 24.1 -36.9 1.6 18.0 5.1 12.9 28.5
Northern Trust LCG 15.5 (49) 0.6 (45) 15.5 (57) 32.8 (59) -37.8 (45) - - - - -
Russell 1000 Growth Index 15.3 (52) 2.6 (27) 16.7 (46) 37.2 (35) -38.4 (48) 11.8 (61) 9.1 (53) 5.3 (69) 6.3 (79) 29.7 (46)
IM U.S. Large Cap Growth Equity (SA+CF) Median 15.3 0.0 16.2 34.5 -38.6 13.5 9.4 7.5 9.3 28.6
Sands Capital Management - - - - - - - - - -
Russell 1000 Growth Index 15.3 (52) 2.6 (27) 16.7 (46) 37.2 (35) -38.4 (48) 11.8 (61) 9.1 (53) 5.3 (69) 6.3 (79) 29.7 (46)
IM U.S. Large Cap Growth Equity (SA+CF) Median 15.3 0.0 16.2 34.5 -38.6 13.5 9.4 7.5 9.3 28.6
Advisory Research 11.1 (91) -3.1 (49) 21.9 (85) 10.7 (100) -24.1 (7) 0.1 (40) 18.4 (52) 14.5 (9) 25.9 (27) 36.4 (86)
Russell 2000 Value Index 18.1 (48) -5.5 (66) 24.5 (73) 20.6 (88) -28.9 (25) -9.8 (83) 23.5 (16) 4.7 (74) 22.2 (51) 46.0 (47)
IM U.S. Small Cap Value Equity (SA+CF) Median 17.6 -3.3 27.8 34.3 -33.0 -2.1 18.5 8.2 22.3 45.4
IronBridge Capital Management 13.1 (84) -2.6 (61) 23.0 (91) 24.8 (74) -31.1 (18) 10.4 (12) 15.3 (59) 3.4 (89) - -
Russell 2000 Index 16.3 (54) -4.2 (73) 26.9 (65) 27.2 (64) -33.8 (35) -1.6 (62) 18.4 (25) 4.6 (82) 18.3 (70) 47.3 (31)
IM U.S. Small Cap Core Equity (SA+CF) Median 16.7 -1.5 28.3 29.8 -36.0 -0.2 16.2 8.0 20.7 44.6
Public Health Trust/Jackson Health System
Calendar Year Performance
As of March 31, 2013
Net-of-Fees
Returns are expressed as percentages.Net of fees performance began being tracked in July 2012.
Page 12

Public Health Trust/Jackson Health System
Calendar Year Performance
As of March 31, 2013
Net-of-Fees
Performance(%)
2012 2011 2010 2009 2008 2007 2006 2005 2004 2003
Non-U.S. Equity
Northern Trust ACWI ex-US - - - - - - - - - -
MSCI ACWI ex-US (11/7/12 fwd) - - - - - - - - - -
IM International Large Cap Core Equity (SA+CF) 19.1 -12.0 11.1 32.4 -43.6 12.7 27.2 16.4 19.5 37.0
Thornburg International Value I 15.8 (75) - - - - - - - - -
MSCI EAFE Index (net) 17.3 (64) -12.1 (27) 7.8 (80) 31.8 (64) -43.4 (33) 11.2 (63) 26.3 (48) 13.5 (67) 20.2 (38) 38.6 (51)
IM International Equity (MF) Median 18.6 -14.9 13.0 36.3 -46.0 13.3 26.2 15.7 18.6 38.6
Returns are expressed as percentages.Net of fees performance began being tracked in July 2012.
Page 13

This Page Left Blank Intentionally
Page 14

Total Fund
Page 15
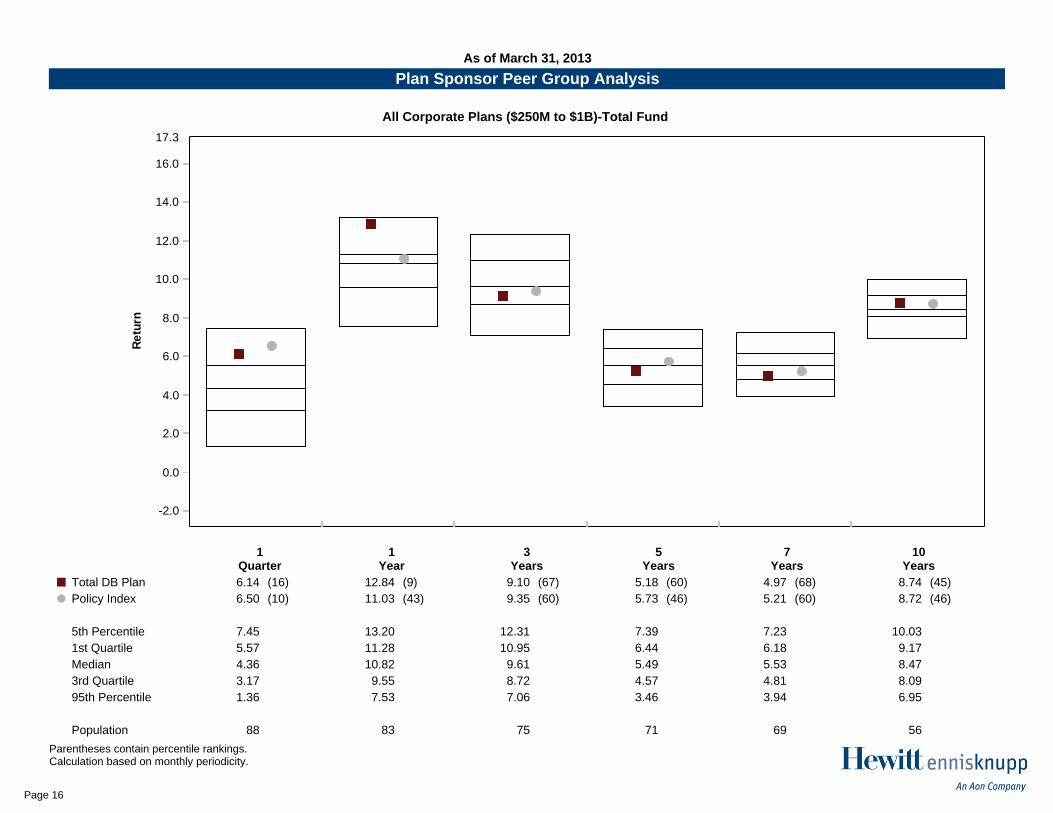
-2.0
0.0
2.0
4.0
6.0
8.0
10.0
12.0
14.0
16.0
17.3R
etu
rn
1Quarter
1Year
3Years
5Years
7Years
10Years
¢ Total DB Plan 6.14 (16) 12.84 (9) 9.10 (67) 5.18 (60) 4.97 (68) 8.74 (45)
Å Policy Index 6.50 (10) 11.03 (43) 9.35 (60) 5.73 (46) 5.21 (60) 8.72 (46)
5th Percentile 7.45 13.20 12.31 7.39 7.23 10.03
1st Quartile 5.57 11.28 10.95 6.44 6.18 9.17
Median 4.36 10.82 9.61 5.49 5.53 8.47
3rd Quartile 3.17 9.55 8.72 4.57 4.81 8.09
95th Percentile 1.36 7.53 7.06 3.46 3.94 6.95
Population 88 83 75 71 69 56
Plan Sponsor Peer Group Analysis
All Corporate Plans ($250M to $1B)-Total Fund
As of March 31, 2013
Parentheses contain percentile rankings.Calculation based on monthly periodicity.
Page 16

Total Value Added:-0.4 %
0.0% 0.1%-0.1 %-0.2 %-0.3 %-0.4 %
Other
Manager Value Added
Asset Allocation
0.0%
-0.3 %
-0.1 %
Total Fund Performance
0.0% 3.0% 6.0% 9.0%-2.9 %
Total Fund
Total Fund Benchmark
Total Value Added
6.1%
6.5%
-0.4 %
Total Manager Value Added:-0.3 %
Manager Value Added
0.0% 0.3% 0.4%-0.3 %
0.0%
-0.2 %
0.1%
-0.1 %
-0.1 %
-0.1 %
0.0%
0.0%
0.0%
0.2%
Asset Allocation Value Added
0.00% 0.40%-0.40 %
-0.01 %
0.15%
0.26%
0.27%
-0.11 %
-0.07 %
-0.19 %
-0.18 %
0.05%
-0.25 %
Total Asset Allocation:-0.1 %
Average Active Weight
0.0% 14.0%-14.0 %
Cash
International Equity
IronBridge Capital Management
Advisory Research
Sands Capital Management
Northern Trust
iShares Russell 1000 Value
Horizon
Victory
Fixed Income
0.1%
-11.4 %
4.5%
5.5%
-3.5 %
-2.2 %
-3.2 %
-3.1 %
10.0%
3.4%
Public Health Trust/Jackson Health System
Total Fund Attribution
1 Quarter Ending March 31, 2013
Total DB Plan vs. Policy Index
Page 17

Annualized Return vs. Annualized Standard Deviation5 Years
Rolling 5 Years Standard Deviation
5 Years Historical Statistics
Total DB Plan Policy Index
5.0
6.0
7.0
8.0
9.0
10.0
11.0
12.0
13.0
14.0
15.0
7/06 4/07 1/08 10/08 7/09 4/10 1/11 10/11 7/12 3/13Total DB Plan Policy Index
Citigroup 3 Month T-Bill
-1.0
0.0
1.0
2.0
3.0
4.0
5.0
6.0
7.0
7.6
Re
turn
(%
)
-3.0 0.0 3.0 6.0 9.0 12.0 15.0 17.3Risk (Standard Deviation %)
ActiveReturn
TrackingError
InformationRatio
R-SquaredSharpeRatio
Alpha Beta ReturnStandardDeviation
ActualCorrelation
Total DB Plan -0.54 1.76 -0.31 0.98 0.44 -0.43 0.98 5.18 12.72 0.99
Policy Index 0.00 0.00 N/A 1.00 0.48 0.00 1.00 5.73 12.83 1.00
Citigroup 3 Month T-Bill -6.13 12.87 -0.48 0.10 N/A 0.33 0.00 0.30 0.15 -0.31
Total DB Plan Risk Profile
As of March 31, 2013Public Health Trust/Jackson Health System
Page 18

March 31, 2013
Target Allocation Actual Allocation Allocation Differences
0.0% 5.0% 10.0% 15.0% 20.0% 25.0% 30.0% 35.0% 39.7%-5.0 %-10.0 %-15.0 %
Cash$637,107
International Equity$42,154,155
IronBridge Capital Management$43,587,160
Advisory Research$61,155,089
Sands Capital Management$32,778,516
Northern Trust$39,939,631
iShares Russell 1000 Value$35,370,520
Horizon$36,167,112
Victory$50,865,648
Fixed Income$163,929,697
0.0%
20.0%
3.8%
6.3%
10.0%
10.0%
10.0%
10.0%
0.0%
30.0%
0.1%
8.3%
8.6%
12.1%
6.5%
7.9%
7.0%
7.1%
10.0%
32.4%
0.1%
-11.7 %
4.9%
5.8%
-3.5 %
-2.1 %
-3.0 %
-2.9 %
10.0%
2.4%
Public Health Trust/Jackson Health System
Asset Allocation vs. Target AllocationTotal DB Plan vs. Policy Index
Page 19

This Page Left Blank Intentionally
Page 20

U.S. Fixed Income
Page 21

Return Summary
Quarterly Excess Performance - 3 Years Ratio of Cumulative Wealth - 5 Years
Account Information
As of March 31, 2013
Newfleet Performance Summary
Newfleet
Newfleet Barclays Aggregate Index
0.0
2.0
4.0
6.0
8.0
9.5
-2.0
Re
turn
(%
)
1Quarter
YearTo
Date
1Year
3Years
5Years
10Years
-0.1 -0.1
3.8
5.5 5.55.0
0.3 0.3
6.0
6.9 6.9
5.7
Account Name: Newfleet
Inception Date: 08/01/2001
Account Structure: Separate Account
Asset Class: US Fixed Income
Benchmark: Barclays Aggregate Index
Peer Group: IM U.S. Broad Market Core Fixed Income (SA+CF)
Quarterly Out Performance Quarterly Under Performance
0.0%
0.4%
0.8%
1.2%
1.6%
2.0%
2.4%
2.8%
6/10 12/10 6/11 12/11 6/12 12/12 3/13
Newfleet Benchmark
0.96
0.98
1.00
1.02
1.04
1.06
1.08
1.10
3/08 9/08 3/09 9/09 3/10 9/10 3/11 9/11 3/12 9/12 3/13
1.07
Page 22

As of March 31, 2013
Peer Group Analysis
Newfleet
IM U.S. Broad Market Core Fixed Income (SA+CF)
-3.0
-2.0
-1.0
0.0
1.0
2.0
3.0
4.0
5.0
6.0
7.0
8.0
9.0
10.0
10.6R
etu
rn
1Quarter
YearTo
Date
1Year
3Years
5Years
7Years
10Years
¢ Newfleet 0.35 (23) 0.35 (23) 6.04 (19) 6.87 (23) 6.88 (27) 6.58 (39) 5.66 (37)
Å Barclays Aggregate Index -0.12 (88) -0.12 (88) 3.77 (93) 5.52 (89) 5.47 (90) 5.94 (83) 5.03 (86)
5th Percentile 0.79 0.79 7.41 7.80 7.67 7.58 6.35
1st Quartile 0.29 0.29 5.71 6.82 6.90 6.80 5.87
Median 0.11 0.11 4.89 6.20 6.24 6.44 5.46
3rd Quartile -0.05 -0.05 4.32 5.84 5.83 6.12 5.24
95th Percentile -0.23 -0.23 3.67 5.33 5.27 5.25 4.62
Page 23

5 Years Historical Statistics
Rolling 5 Years Standard DeviationAnnualized Return vs. Annualized Standard Deviation
5 Years
5 Years Ending March 31, 2013
Newfleet Risk Profile
Newfleet
Newfleet Barclays Aggregate Index
Citigroup 3 Month T-Bill
-1.0
0.0
1.0
2.0
3.0
4.0
5.0
6.0
7.0
8.0
9.0
Re
turn
(%
)
-1.0 0.0 1.0 2.0 3.0 4.0 4.8Risk (Standard Deviation %)
Newfleet Barclays Aggregate Index
2.8
2.9
3.0
3.1
3.2
3.3
3.4
3.5
3.6
3.7
3.8
3.9
4.0
4.1
4/08 10/08 4/09 10/09 4/10 10/10 4/11 10/11 4/12 10/12 3/13
ActiveReturn
TrackingError
InformationRatio
R-SquaredSharpeRatio
Alpha Beta ReturnStandardDeviation
ActualCorrelation
Newfleet 1.34 1.77 0.76 0.77 1.76 1.88 0.90 6.88 3.60 0.88
Barclays Aggregate Index 0.00 0.00 N/A 1.00 1.44 0.00 1.00 5.47 3.50 1.00
Citigroup 3 Month T-Bill -5.09 3.53 -1.44 0.04 N/A 0.35 -0.01 0.30 0.15 -0.21
Page 24

Return Summary
Quarterly Excess Performance - 3 Years Ratio of Cumulative Wealth - 5 Years
Account Information
As of March 31, 2013
Taplin, Canida & Habacht Performance Summary
Taplin, Canida & Habacht
Taplin, Canida & Habacht Barclays Aggregate Index
0.0
3.0
6.0
9.0
12.0
-3.0
Re
turn
(%
)
1Quarter
YearTo
Date
1Year
3Years
5Years
10Years
-0.1 -0.1
3.8
5.5 5.55.0
0.4 0.4
9.08.4
8.9
Account Name: Taplin, Canida & Habacht
Inception Date: 09/01/2005
Account Structure: Separate Account
Asset Class: US Fixed Income
Benchmark: Barclays Aggregate Index
Peer Group: IM U.S. Broad Market Core Fixed Income (SA+CF)
Quarterly Out Performance Quarterly Under Performance
0.0%
1.0%
2.0%
3.0%
4.0%
5.0%
6.0%
7.0%
6/10 12/10 6/11 12/11 6/12 12/12 3/13
Taplin, Canida & Habacht Benchmark
0.90
0.95
1.00
1.05
1.10
1.15
1.20
1.25
3/08 9/08 3/09 9/09 3/10 9/10 3/11 9/11 3/12 9/12 3/13
1.18
Page 25

As of March 31, 2013
Peer Group Analysis
Taplin, Canida & Habacht
IM U.S. Broad Market Core Fixed Income (SA+CF)
-3.0
-2.0
-1.0
0.0
1.0
2.0
3.0
4.0
5.0
6.0
7.0
8.0
9.0
10.0
11.0
12.0R
etu
rn
1Quarter
YearTo
Date
1Year
3Years
5Years
7Years
10Years
¢ Taplin, Canida & Habacht 0.40 (19) 0.40 (19) 8.97 (3) 8.39 (2) 8.95 (1) 7.77 (2) N/A
Å Barclays Aggregate Index -0.12 (88) -0.12 (88) 3.77 (93) 5.52 (89) 5.47 (90) 5.94 (83) 5.03 (86)
5th Percentile 0.79 0.79 7.41 7.80 7.67 7.58 6.35
1st Quartile 0.29 0.29 5.71 6.82 6.90 6.80 5.87
Median 0.11 0.11 4.89 6.20 6.24 6.44 5.46
3rd Quartile -0.05 -0.05 4.32 5.84 5.83 6.12 5.24
95th Percentile -0.23 -0.23 3.67 5.33 5.27 5.25 4.62
Page 26

5 Years Historical Statistics
Rolling 5 Years Standard DeviationAnnualized Return vs. Annualized Standard Deviation
5 Years
5 Years Ending March 31, 2013
Taplin, Canida & Habacht Risk Profile
Taplin, Canida & Habacht
Taplin, Canida & Habacht Barclays Aggregate Index
Citigroup 3 Month T-Bill
-2.0
0.0
2.0
4.0
6.0
8.0
10.0
12.0
Re
turn
(%
)
-1.0 0.0 1.0 2.0 3.0 4.0 5.0 6.0 6.5Risk (Standard Deviation %)
Taplin, Canida & Habacht Barclays Aggregate Index
2.5
3.0
3.5
4.0
4.5
5.0
5.5
5.7
4/08 10/08 4/09 10/09 4/10 10/10 4/11 10/11 4/12 10/12 3/13
ActiveReturn
TrackingError
InformationRatio
R-SquaredSharpeRatio
Alpha Beta ReturnStandardDeviation
ActualCorrelation
Taplin, Canida & Habacht 3.32 2.98 1.12 0.63 1.72 2.80 1.10 8.95 4.86 0.79
Barclays Aggregate Index 0.00 0.00 N/A 1.00 1.44 0.00 1.00 5.47 3.50 1.00
Citigroup 3 Month T-Bill -5.09 3.53 -1.44 0.04 N/A 0.35 -0.01 0.30 0.15 -0.21
Page 27
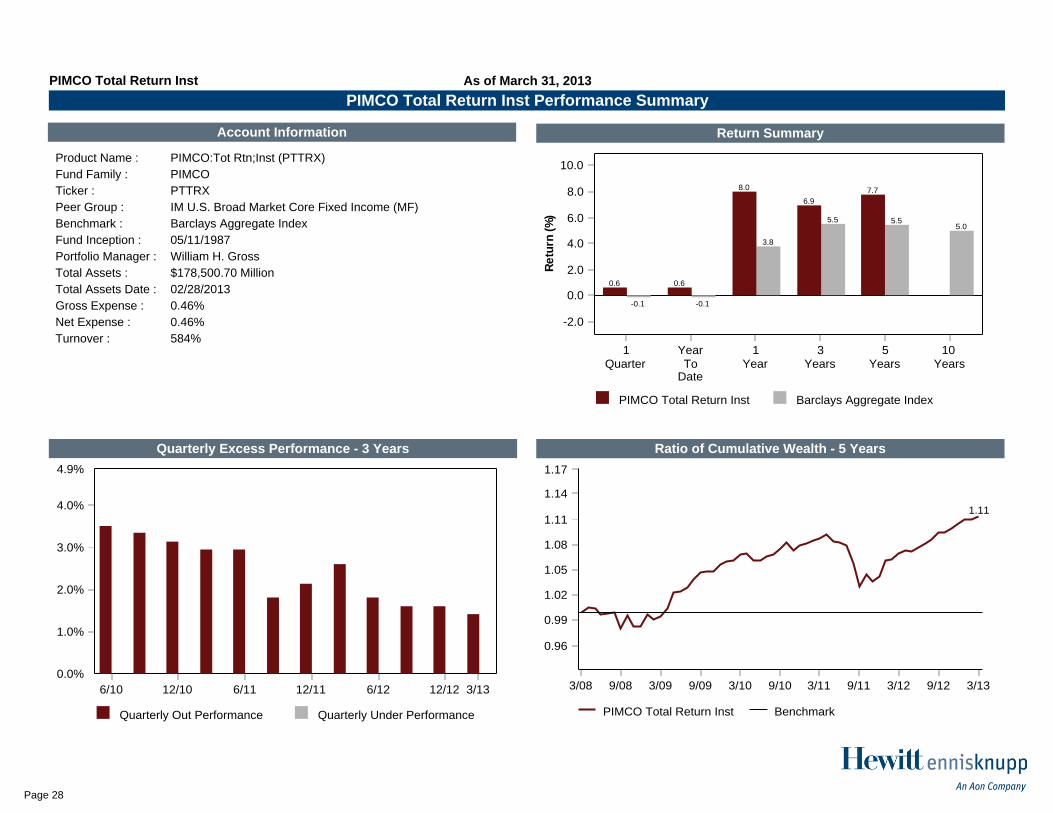
Return Summary
Quarterly Excess Performance - 3 Years Ratio of Cumulative Wealth - 5 Years
Account Information
As of March 31, 2013
PIMCO Total Return Inst Performance Summary
PIMCO Total Return Inst
PIMCO Total Return Inst Barclays Aggregate Index
0.0
2.0
4.0
6.0
8.0
10.0
-2.0
Re
turn
(%
)
1Quarter
YearTo
Date
1Year
3Years
5Years
10Years
-0.1 -0.1
3.8
5.5 5.55.0
0.6 0.6
8.0
6.9
7.7
Product Name : PIMCO:Tot Rtn;Inst (PTTRX)
Fund Family : PIMCO
Ticker : PTTRX
Peer Group : IM U.S. Broad Market Core Fixed Income (MF)
Benchmark : Barclays Aggregate Index
Fund Inception : 05/11/1987
Portfolio Manager : William H. Gross
Total Assets : $178,500.70 Million
Total Assets Date : 02/28/2013
Gross Expense : 0.46%
Net Expense : 0.46%
Turnover : 584%
Quarterly Out Performance Quarterly Under Performance
0.0%
1.0%
2.0%
3.0%
4.0%
4.9%
6/10 12/10 6/11 12/11 6/12 12/12 3/13
PIMCO Total Return Inst Benchmark
0.96
0.99
1.02
1.05
1.08
1.11
1.14
1.17
3/08 9/08 3/09 9/09 3/10 9/10 3/11 9/11 3/12 9/12 3/13
1.11
Page 28

As of March 31, 2013
Peer Group Analysis
PIMCO Total Return Inst
IM U.S. Broad Market Core Fixed Income (MF)
-3.0
-2.0
-1.0
0.0
1.0
2.0
3.0
4.0
5.0
6.0
7.0
8.0
9.0
10.0
11.0
11.7R
etu
rn
1Quarter
YearTo
Date
1Year
3Years
5Years
7Years
10Years
¢ PIMCO Total Return Inst 0.61 (10) 0.61 (10) 7.99 (8) 6.94 (22) 7.74 (7) 7.96 (4) N/A
Å Barclays Aggregate Index -0.12 (81) -0.12 (81) 3.77 (83) 5.52 (72) 5.47 (65) 5.94 (44) 5.03 (41)
5th Percentile 0.79 0.79 8.55 8.33 8.08 7.65 6.56
1st Quartile 0.40 0.40 6.53 6.77 6.70 6.43 5.53
Median 0.16 0.16 5.37 6.10 5.94 5.81 4.84
3rd Quartile -0.08 -0.08 4.28 5.39 5.10 5.14 4.27
95th Percentile -0.32 -0.32 2.83 4.30 3.21 3.03 2.71
Page 29

5 Years Historical Statistics
Rolling 5 Years Standard DeviationAnnualized Return vs. Annualized Standard Deviation
5 Years
5 Years Ending March 31, 2013
PIMCO Total Return Inst Risk Profile
PIMCO Total Return Inst
PIMCO Total Return Inst Barclays Aggregate Index
Citigroup 3 Month T-Bill
-2.0
-1.0
0.0
1.0
2.0
3.0
4.0
5.0
6.0
7.0
8.0
9.0
10.0
Re
turn
(%
)
-1.0 0.0 1.0 2.0 3.0 4.0 5.0 5.4Risk (Standard Deviation %)
PIMCO Total Return Inst Barclays Aggregate Index
2.6
2.8
3.0
3.2
3.4
3.6
3.8
4.0
4.2
4.4
4.6
4.8
4/08 10/08 4/09 10/09 4/10 10/10 4/11 10/11 4/12 10/12 3/13
ActiveReturn
TrackingError
InformationRatio
R-SquaredSharpeRatio
Alpha Beta ReturnStandardDeviation
ActualCorrelation
PIMCO Total Return Inst 2.16 2.74 0.79 0.55 1.78 2.98 0.86 7.74 4.03 0.74
Barclays Aggregate Index 0.00 0.00 N/A 1.00 1.44 0.00 1.00 5.47 3.50 1.00
Citigroup 3 Month T-Bill -5.09 3.53 -1.44 0.04 N/A 0.35 -0.01 0.30 0.15 -0.21
Page 30

As of March 31, 2013
Mutual Fund Attributes
PIMCO Total Return Inst
Fund Characteristics As of 12/31/2012
Avg. Coupon 3.55 %
Nominal Maturity 6.09 Years
Effective Maturity N/A
Duration 4.77 Years
SEC 30 Day Yield 2.44
Avg. Credit Quality N/A
Asset Allocation As of 06/30/2012
0.0% 20.0% 40.0% 60.0% 80.0% 100.0% 120.0% 135.0%
Other
Intl. Equity
US Equity
Cash
Fixed Income
0.0%
0.0%
0.0%
0.0%
100.0%
Maturity Distribution As of 12/31/2012
0.0% 10.0% 20.0% 30.0% 40.0% 50.0% 55.4%
>30Yrs
<1Yr
20-30Yrs
Other
10-20Yrs
3-5Yrs
5-10Yrs
1-3Yrs
0.0%
0.0%
0.9%
6.0%
8.5%
16.0%
28.2%
40.4%
Sector/Quality Allocation As of 12/31/2010
0.0% 20.0% 40.0% 60.0% 80.0% 90.0%
CCC, CC AND C rated
Equities/Other
BB AND B Rated
AA Rated
BBB Rated
Foreign Securities
Government/AAA
0.8%
4.0%
8.4%
18.5%
10.9%
13.0%
44.3%
Page 31

Return Summary
Quarterly Excess Performance - 3 Years Ratio of Cumulative Wealth - 5 Years
Account Information
As of March 31, 2013
Victory Performance Summary
Victory
Victory
BofAML Convertible Bonds, U.S. Investment Grade
0.0
3.0
6.0
9.0
12.0
Re
turn
(%
)
1Quarter
YearTo
Date
1Year
3Years
5Years
10Years
6.6 6.6
7.9
6.1 6.2 6.0
7.0 7.0
9.0
7.0
3.3
Account Name: Victory
Inception Date: 02/01/2007
Account Structure: Separate Account
Asset Class: US Fixed Income
Benchmark: BofAML Convertible Bonds, U.S. Investment G
Peer Group: IM U.S. Convertible Bonds (SA+CF)
Quarterly Out Performance
Quarterly Under Performance
0.0%
2.0%
4.0%
6.0%
-2.0 %
-4.0 %
-6.0 %
-8.0 %
-9.3 %
6/10 12/10 6/11 12/11 6/12 12/12 3/13
Victory Benchmark
0.75
0.80
0.85
0.90
0.95
1.00
1.05
1.09
3/08 9/08 3/09 9/09 3/10 9/10 3/11 9/11 3/12 9/12 3/13
0.87
Page 32

As of March 31, 2013
Peer Group Analysis
Victory
IM U.S. Convertible Bonds (SA+CF)
0.0
2.0
4.0
6.0
8.0
10.0
12.0
14.0
16.0
18.0
Re
turn
1Quarter
YearTo
Date
1Year
3Years
5Years
7Years
10Years
¢ Victory 6.97 (29) 6.97 (29) 8.96 (63) 7.01 (91) 3.31 (100) N/A N/A
Å BofAML Convertible Bonds, U.S. Investment Grade 6.55 (47) 6.55 (47) 7.86 (73) 6.05 (100) 6.19 (73) 5.90 (75) 5.96 (100)
5th Percentile 9.34 9.34 14.41 12.52 11.78 9.33 11.47
1st Quartile 7.02 7.02 11.74 9.71 10.10 8.96 9.62
Median 6.37 6.37 9.79 8.80 8.28 7.11 8.55
3rd Quartile 5.18 5.18 7.78 7.37 6.07 5.88 7.58
95th Percentile 2.43 2.43 6.44 6.76 4.38 4.68 6.26
Page 33

5 Years Historical Statistics
Rolling 5 Years Standard DeviationAnnualized Return vs. Annualized Standard Deviation
5 Years
5 Years Ending March 31, 2013
Victory Risk Profile
Victory
Victory
BofAML Convertible Bonds, U.S. Investment Grade
Citigroup 3 Month T-Bill
-1.0
0.0
1.0
2.0
3.0
4.0
5.0
6.0
7.0
8.0
Re
turn
(%
)
-3.0 0.0 3.0 6.0 9.0 12.0 15.0 16.8Risk (Standard Deviation %)
Victory
BofAML Convertible Bonds, U.S. Investment Grade
2.0
3.0
4.0
5.0
6.0
7.0
8.0
9.0
10.0
11.0
12.0
13.0
14.0
15.0
4/08 10/08 4/09 10/09 4/10 10/10 4/11 10/11 4/12 10/12 3/13
ActiveReturn
TrackingError
InformationRatio
R-SquaredSharpeRatio
Alpha Beta ReturnStandardDeviation
ActualCorrelation
Victory -2.50 4.31 -0.58 0.90 0.30 -3.44 1.15 3.31 12.46 0.95
BofAML Convertible Bonds, U.S. Investment Grade 0.00 0.00 N/A 1.00 0.61 0.00 1.00 6.19 10.23 1.00
Citigroup 3 Month T-Bill -6.26 10.28 -0.61 0.11 N/A 0.33 0.00 0.30 0.15 -0.33
Page 34

U.S. Equity
Page 35

Return Summary
Quarterly Excess Performance - 3 Years Ratio of Cumulative Wealth - 5 Years
Account Information
As of March 31, 2013
Horizon Performance Summary
Horizon
Horizon Russell 1000 Value Index
0.0
6.0
12.0
18.0
24.0
30.0
-6.0
Re
turn
(%
)
1Quarter
YearTo
Date
1Year
3Years
5Years
10Years
12.3 12.3
18.8
12.7
4.8
9.2
12.4 12.4
23.3
13.9
0.0
Account Name: Horizon
Inception Date: 03/01/2005
Account Structure: Separate Account
Asset Class: US Equity
Benchmark: Russell 1000 Value Index
Peer Group: IM U.S. Large Cap Value Equity (SA+CF)
Quarterly Out Performance
Quarterly Under Performance
0.0%
3.0%
5.7%
-3.0 %
-6.0 %
-9.0 %
-12.0 %
6/10 12/10 6/11 12/11 6/12 12/12 3/13
Horizon Benchmark
0.70
0.80
0.90
1.00
1.10
1.14
3/08 9/08 3/09 9/09 3/10 9/10 3/11 9/11 3/12 9/12 3/13
0.79
Page 36

As of March 31, 2013
Peer Group Analysis
Horizon
IM U.S. Large Cap Value Equity (SA+CF)
-7.0
-4.0
-1.0
2.0
5.0
8.0
11.0
14.0
17.0
20.0
23.0
26.0
29.0
31.5R
etu
rn
1Quarter
YearTo
Date
1Year
3Years
5Years
7Years
10Years
¢ Horizon 12.44 (31) 12.44 (31) 23.29 (3) 13.90 (23) -0.05 (100) 2.19 (96) N/A
Å Russell 1000 Value Index 12.31 (36) 12.31 (36) 18.77 (19) 12.74 (45) 4.85 (75) 4.19 (74) 9.18 (75)
5th Percentile 14.70 14.70 21.46 15.79 9.97 8.21 12.63
1st Quartile 12.69 12.69 18.07 13.70 7.20 6.28 10.94
Median 11.56 11.56 15.85 12.49 6.01 5.17 10.04
3rd Quartile 10.62 10.62 13.77 10.74 4.69 4.13 9.07
95th Percentile 9.15 9.15 10.21 8.28 2.73 2.33 7.59
Page 37

5 Years Historical Statistics
Rolling 5 Years Standard DeviationAnnualized Return vs. Annualized Standard Deviation
5 Years
5 Years Ending March 31, 2013
Horizon Risk Profile
Horizon
Horizon Russell 1000 Value Index
Citigroup 3 Month T-Bill
-1.0
0.0
1.0
2.0
3.0
4.0
5.0
6.0
6.6
Re
turn
(%
)
-4.0 0.0 4.0 8.0 12.0 16.0 20.0 24.0 28.0 30.7Risk (Standard Deviation %)
Horizon Russell 1000 Value Index
4.0
6.0
8.0
10.0
12.0
14.0
16.0
18.0
20.0
22.0
24.0
26.0
28.0
29.6
4/08 10/08 4/09 10/09 4/10 10/10 4/11 10/11 4/12 10/12 3/13
ActiveReturn
TrackingError
InformationRatio
R-SquaredSharpeRatio
Alpha Beta ReturnStandardDeviation
ActualCorrelation
Horizon -4.17 8.77 -0.48 0.85 0.10 -4.43 1.05 -0.05 22.81 0.92
Russell 1000 Value Index 0.00 0.00 N/A 1.00 0.32 0.00 1.00 4.85 20.06 1.00
Citigroup 3 Month T-Bill -6.51 20.10 -0.32 0.08 N/A 0.32 0.00 0.30 0.15 -0.29
Page 38

Top Ten Equity Holdings
PortfolioWeight
(%)
BenchmarkWeight
(%)
ActiveWeight
(%)
QuarterlyReturn
(%)
Liberty Media Corp 8.95 0.14 8.81 N/A
Jarden Corp 8.53 0.05 8.48 24.32
Howard Hughes Corp (The) 6.61 0.03 6.58 14.78
Brookfield Asset Management Inc 5.38 0.00 5.38 -0.06
AutoNation Inc 5.27 0.01 5.26 10.20
JARDINE STRATEGIC HLDGS LTD 4.78 0.00 4.78 N/A
Liberty Media Corp 4.08 0.03 4.05 51.99
Leucadia National Corp 4.02 0.09 3.93 18.75
Wendy's Co 3.63 0.02 3.61 21.62
Rouse Properties Inc 3.44 0.00 3.44 7.39
% of Portfolio 54.69 0.37
Portfolio Characteristics
Portfolio Benchmark
Wtd. Avg. Mkt. Cap ($M) 20,142 95,813
Median Mkt. Cap ($M) 3,785 5,792
Price/Earnings ratio 18.08 15.05
Price/Book ratio 1.77 1.94
5 Yr. EPS Growth Rate (%) 16.78 -1.07
Current Yield (%) 1.03 2.35
Beta (5 Years, Monthly) 1.05 1.00
Number of Stocks 47 695
Distribution of Market Capitalization (%)
Horizon Russell 1000 Value Index
0.0
20.0
40.0
60.0
80.0
100.0
115.0
>3 Bil 1 Bil - 3 Bil
500 Mil - 1 Bil
200 Mil - 500 Mil
0 - 100 Mil
97.5
2.50.0 0.0 0.0
74.0
18.9
4.50.1
2.4
Sector Weights (%)
Horizon
Russell 1000 Value Index
0.0 10.0 20.0 30.0 40.0 50.0 60.0
Other
Utilities
Telecommunication Services
Materials
Information Technology
Industrials
Health Care
Financials
Energy
Consumer Staples
Consumer Discretionary
2.4
0.0
0.0
2.6
1.0
8.1
0.0
28.9
2.7
0.1
54.2
0.0
6.6
3.2
3.6
6.7
9.1
11.8
27.5
15.8
7.4
8.3
Public Health Trust/Jackson Health System
Portfolio CharacteristicsHorizon vs. Russell 1000 Value Index
As of March 31, 2013
Page 39

Return Summary
Quarterly Excess Performance - 3 Years Ratio of Cumulative Wealth - Since Inception
Account Information
As of March 31, 2013
iShares Russell 1000 Value Performance Summary
iShares Russell 1000 Value
iShares Russell 1000 Value Russell 1000 Value Index
0.0
4.0
8.0
12.0
16.0
20.0
24.0
27.0
Re
turn
(%
)
1Quarter
YearTo
Date
1Year
3Years
5Years
10Years
12.3 12.3
18.8
12.7
4.8
9.2
11.8 11.8
18.3
12.2
Product Name : iShares:Russ 1000 Vl Idx (IWD)
Fund Family : BlackRock Fund Advisors
Ticker :
Peer Group : IM U.S. Large Cap Value Equity (MF)
Benchmark : Russell 1000 Value Index
Fund Inception : 05/22/2000
Portfolio Manager : Team Managed
Total Assets : $16,954.60 Million
Total Assets Date : 03/31/2013
Gross Expense : 0.21%
Net Expense : 0.21%
Turnover : 21%
Quarterly Out Performance
Quarterly Under Performance
0.0%
0.2%
-0.2 %
-0.4 %
-0.6 %
-0.8 %
3/12 6/12 9/12 12/12 3/13
iShares Russell 1000 Value Benchmark
0.99
1.00
1.01
1.02
1.03
1.04
1.05
1.06
1.07
2/09 8/09 2/10 8/10 2/11 8/11 2/12 8/12 3/13
1.02
Page 40

As of March 31, 2013
Peer Group Analysis
iShares Russell 1000 Value
IM U.S. Large Cap Value Equity (MF)
-4.0
-2.0
0.0
2.0
4.0
6.0
8.0
10.0
12.0
14.0
16.0
18.0
20.0
22.0
24.025.0
Re
turn
1Quarter
YearTo
Date
1Year
3Years
5Years
7Years
10Years
¢ iShares Russell 1000 Value 11.85 (26) 11.85 (26) 18.34 (7) 12.22 (13) N/A N/A N/A
Å Russell 1000 Value Index 12.31 (14) 12.31 (14) 18.77 (5) 12.74 (6) 4.85 (35) 4.19 (37) 9.18 (20)
5th Percentile 12.75 12.75 18.61 13.02 6.62 5.74 10.29
1st Quartile 11.88 11.88 16.49 11.67 5.29 4.58 8.95
Median 11.27 11.27 15.25 10.55 4.17 3.65 8.24
3rd Quartile 10.59 10.59 13.81 9.20 2.89 2.54 7.28
95th Percentile 9.58 9.58 10.90 7.29 1.39 0.84 5.93
Page 41

Since Inception Historical Statistics
Rolling 5 Years Standard DeviationAnnualized Return vs. Annualized Standard Deviation
Since Inception
Since Inception Ending March 31, 2013
iShares Russell 1000 Value Risk Profile
iShares Russell 1000 Value
iShares Russell 1000 Value Russell 1000 Value Index
Citigroup 3 Month T-Bill
-8.0
-4.0
0.0
4.0
8.0
12.0
16.0
20.0
24.0
28.0
32.0
Re
turn
(%
)
-4.0 0.0 4.0 8.0 12.0 16.0 20.0 22.1Risk (Standard Deviation %)
No data found.
ActiveReturn
TrackingError
InformationRatio
R-SquaredSharpeRatio
Alpha Beta ReturnStandardDeviation
ActualCorrelation
InceptionDate
iShares Russell 1000 Value 0.69 2.43 0.28 0.98 1.43 0.12 1.02 24.51 16.37 0.99 03/01/2009
Russell 1000 Value Index 0.00 0.00 N/A 1.00 1.43 0.00 1.00 23.77 15.80 1.00 03/01/2009
Citigroup 3 Month T-Bill -22.65 15.80 -1.43 0.09 N/A 0.09 0.00 0.10 0.02 0.29 03/01/2009
Page 42

As of March 31, 2013
Mutual Fund Attributes
iShares Russell 1000 Value
Fund Characteristics As of 02/28/2013
Total Securities 698
Avg. Market Cap $90,509.36 $M
P/E 18.87
P/B 2.02
Div. Yield 2.70%
Annual EPS 11.41
5Yr EPS 0.48
3Yr EPS Growth 15.33
Asset Allocation As of 02/28/2013
0.0% 20.0% 40.0% 60.0% 80.0% 100.0% 120.0% 135.0%
Fixed Income
Convertibles
Cash
Other
Equities
0.0%
0.0%
0.0%
0.2%
99.7%
Sector/Quality Allocation As of 02/28/2013
0.0% 10.0% 20.0% 30.0% 40.0% 50.0% 60.0%
Telecommunication Services
Materials
Information Technology
Utilities
Consumer Discretionary
Consumer Staples
Industrials
Health Care
Energy
Financials
3.3%
3.4%
6.0%
6.6%
7.9%
8.1%
10.0%
11.3%
15.7%
27.6%
Top Ten Securities As of 02/28/2013
Exxon Mobil Corp ORD 5.21 %
General Electric Co ORD 3.06 %
Chevron Corp ORD 2.87 %
AT&T Inc ORD 2.62 %
Pfizer Inc ORD 2.55 %
Procter & Gamble Co ORD 2.41 %
JPMorgan Chase & Co ORD 2.32 %
Berkshire Hathaway Inc ORD 2.26 %
Wells Fargo & Co ORD 2.14 %
Johnson & Johnson ORD 2.01 %
Page 43

Return Summary
Quarterly Excess Performance - 3 Years Ratio of Cumulative Wealth - 5 Years
Account Information
As of March 31, 2013
Northern Trust LCG Performance Summary
Northern Trust LCG
Northern Trust LCG Russell 1000 Growth Index
0.0
3.0
6.0
9.0
12.0
15.0
18.0
Re
turn
(%
)
1Quarter
YearTo
Date
1Year
3Years
5Years
10Years
9.5 9.510.1
13.1
7.3
8.6
7.6 7.6
6.4
12.0
6.0
Account Name: Northern Trust LCG
Inception Date: 11/01/2007
Account Structure: Separate Account
Asset Class: US Equity
Benchmark: Russell 1000 Growth Index
Peer Group: IM U.S. Large Cap Growth Equity (SA+CF)
Quarterly Out Performance
Quarterly Under Performance
0.0%
0.9%
-1.0 %
-2.0 %
-3.0 %
-3.4 %
12/10 3/11 6/11 9/11 12/11 3/12 6/12 9/12 12/12 3/13
Northern Trust LCG Benchmark
0.93
0.96
0.99
1.02
1.05
1.07
3/08 9/08 3/09 9/09 3/10 9/10 3/11 9/11 3/12 9/12 3/13
0.94
Page 44

As of March 31, 2013
Peer Group Analysis
Northern Trust LCG
IM U.S. Large Cap Growth Equity (SA+CF)
-2.0
0.0
2.0
4.0
6.0
8.0
10.0
12.0
14.0
16.0
18.0
20.0
21.3R
etu
rn
1Quarter
YearTo
Date
1Year
3Years
5Years
7Years
10Years
¢ Northern Trust LCG 7.63 (82) 7.63 (82) 6.36 (79) 11.97 (58) 5.96 (62) N/A N/A
Å Russell 1000 Growth Index 9.54 (43) 9.54 (43) 10.09 (43) 13.06 (34) 7.30 (38) 6.08 (42) 8.62 (66)
5th Percentile 12.49 12.49 16.34 15.68 10.50 8.47 12.13
1st Quartile 10.27 10.27 12.00 13.58 7.89 6.80 10.26
Median 9.24 9.24 9.04 12.25 6.63 5.74 9.09
3rd Quartile 8.08 8.08 6.92 11.01 5.20 4.74 8.32
95th Percentile 6.05 6.05 2.25 8.03 2.18 2.50 6.99
Page 45

5 Years Historical Statistics
Rolling 5 Years Standard DeviationAnnualized Return vs. Annualized Standard Deviation
5 Years
5 Years Ending March 31, 2013
Northern Trust LCG Risk Profile
Northern Trust LCG
Northern Trust LCG Russell 1000 Growth Index
Citigroup 3 Month T-Bill
-2.0
-1.0
0.0
1.0
2.0
3.0
4.0
5.0
6.0
7.0
8.0
9.0
9.8
Re
turn
(%
)
-4.0 0.0 4.0 8.0 12.0 16.0 20.0 24.0Risk (Standard Deviation %)
Northern Trust LCG Russell 1000 Growth Index
6.0
8.0
10.0
12.0
14.0
16.0
18.0
20.0
22.0
23.9
4/08 10/08 4/09 10/09 4/10 10/10 4/11 10/11 4/12 10/12 3/13
ActiveReturn
TrackingError
InformationRatio
R-SquaredSharpeRatio
Alpha Beta ReturnStandardDeviation
ActualCorrelation
Northern Trust LCG -1.18 3.60 -0.33 0.97 0.38 -1.23 1.01 5.96 19.31 0.98
Russell 1000 Growth Index 0.00 0.00 N/A 1.00 0.45 0.00 1.00 7.30 18.87 1.00
Citigroup 3 Month T-Bill -8.59 18.92 -0.45 0.11 N/A 0.32 0.00 0.30 0.15 -0.32
Page 46

Top Ten Equity Holdings
PortfolioWeight
(%)
BenchmarkWeight
(%)
ActiveWeight
(%)
QuarterlyReturn
(%)
Apple Inc 5.62 5.37 0.25 -16.35
Google Inc 4.94 2.67 2.27 12.27
MasterCard Inc 2.73 0.76 1.97 10.21
Celgene Corp 2.66 0.66 2.00 47.71
QUALCOMM Inc. 2.39 1.49 0.90 8.62
Amazon.com Inc 2.36 1.25 1.11 6.23
Biogen Idec Inc 2.10 0.60 1.50 31.60
PepsiCo Inc 2.03 1.61 0.42 16.43
Kansas City Southern 1.95 0.12 1.83 33.12
Whole Foods Market Inc 1.90 0.21 1.69 -4.62
% of Portfolio 28.68 14.74
Portfolio Characteristics
Portfolio Benchmark
Wtd. Avg. Mkt. Cap ($M) 76,101 91,768
Median Mkt. Cap ($M) 29,567 7,092
Price/Earnings ratio 22.05 18.76
Price/Book ratio 4.22 4.23
5 Yr. EPS Growth Rate (%) 19.17 13.78
Current Yield (%) 1.02 1.74
Beta (5 Years, Monthly) 1.01 1.00
Number of Stocks 71 574
Distribution of Market Capitalization (%)
Northern Trust LCG Russell 1000 Growth Index
0.0
20.0
40.0
60.0
80.0
100.0
115.0
>3 Bil 1 Bil - 3 Bil
200 Mil - 500 Mil
98.8
1.2 0.0
98.4
1.6 0.0
Sector Weights (%)
Northern Trust LCG
Russell 1000 Growth Index
0.0 5.0 10.0 15.0 20.0 25.0 30.0 34.5
Utilities
Telecommunication Services
Materials
Information Technology
Industrials
Health Care
Financials
Energy
Consumer Staples
Consumer Discretionary
0.0
1.9
3.7
29.4
11.1
18.9
5.6
4.8
6.7
17.9
0.2
2.3
3.9
28.9
12.9
12.8
4.9
4.2
12.9
16.9
Public Health Trust/Jackson Health System
Portfolio CharacteristicsNorthern Trust LCG vs. Russell 1000 Growth Index
As of March 31, 2013
Page 47

Return Summary
Quarterly Excess Performance - 3 Years Ratio of Cumulative Wealth - Since Inception
Account Information
As of March 31, 2013
Sands Capital Management Performance Summary
Sands Capital Management
Sands Capital Management Russell 1000 Growth Index
0.0
3.0
6.0
9.0
12.0
15.0
18.0
Re
turn
(%
)
1Quarter
YearTo
Date
1Year
3Years
5Years
10Years
9.5 9.510.1
13.1
7.3
8.6
7.2 7.2
11.9
Account Name: Sands Capital Management
Inception Date: 03/01/2012
Account Structure: Separate Account
Asset Class: US Equity
Benchmark: Russell 1000 Growth Index
Peer Group: IM U.S. Large Cap Growth Equity (SA+CF)
No data found.
Sands Capital Management Benchmark
0.95
0.96
0.97
0.98
0.99
1.00
1.01
1.02
1.03
2/12 5/12 8/12 11/12 2/13 3/13
0.98
Page 48

As of March 31, 2013
Peer Group Analysis
Sands Capital Management
IM U.S. Large Cap Growth Equity (SA+CF)
-2.0
0.0
2.0
4.0
6.0
8.0
10.0
12.0
14.0
16.0
18.0
20.0
21.3
Re
turn
1Quarter
YearTo
Date
1Year
3Years
5Years
7Years
10Years
¢ Sands Capital Management 7.23 (86) 7.23 (86) 11.95 (26) N/A N/A N/A N/A
Å Russell 1000 Growth Index 9.54 (43) 9.54 (43) 10.09 (43) 13.06 (34) 7.30 (38) 6.08 (42) 8.62 (66)
5th Percentile 12.49 12.49 16.34 15.68 10.50 8.47 12.13
1st Quartile 10.27 10.27 12.00 13.58 7.89 6.80 10.26
Median 9.24 9.24 9.04 12.25 6.63 5.74 9.09
3rd Quartile 8.08 8.08 6.92 11.01 5.20 4.74 8.32
95th Percentile 6.05 6.05 2.25 8.03 2.18 2.50 6.99
Page 49

Since Inception Historical Statistics
Rolling 5 Years Standard DeviationAnnualized Return vs. Annualized Standard Deviation
Since Inception
Since Inception Ending March 31, 2013
Sands Capital Management Risk Profile
Sands Capital Management
Sands Capital Management Russell 1000 Growth Index
Citigroup 3 Month T-Bill
-4.0
-2.0
0.0
2.0
4.0
6.0
8.0
10.0
12.0
14.0
16.017.0
Re
turn
(%
)
-3.0 0.0 3.0 6.0 9.0 12.0 15.0Risk (Standard Deviation %)
No data found.
ActiveReturn
TrackingError
InformationRatio
R-SquaredSharpeRatio
Alpha Beta ReturnStandardDeviation
ActualCorrelation
InceptionDate
Sands Capital Management -1.73 6.69 -0.26 0.65 0.94 -0.81 0.93 10.52 11.25 0.81 03/01/2012
Russell 1000 Growth Index 0.00 0.00 N/A 1.00 1.26 0.00 1.00 12.59 9.78 1.00 03/01/2012
Citigroup 3 Month T-Bill -12.30 9.78 -1.26 0.03 N/A 0.10 0.00 0.10 0.01 -0.19 03/01/2012
Page 50

Top Ten Equity Holdings
PortfolioWeight
(%)
BenchmarkWeight
(%)
ActiveWeight
(%)
QuarterlyReturn
(%)
Visa Inc 8.49 1.15 7.34 12.28
Google Inc 8.40 2.67 5.73 12.27
Amazon.com Inc 7.89 1.25 6.64 6.23
salesforce.com inc 7.20 0.34 6.86 6.38
Allergan Inc. 4.95 0.44 4.51 21.75
Priceline.Com Inc 4.15 0.44 3.71 10.92
Schlumberger Ltd 3.80 1.30 2.50 8.49
Chipotle Mexican Grill Inc 3.75 0.13 3.62 9.55
ASML Holding NV 3.45 0.00 3.45 5.59
Cerner Corp 3.32 0.18 3.14 22.23
% of Portfolio 55.40 7.90
Portfolio Characteristics
Portfolio Benchmark
Wtd. Avg. Mkt. Cap ($M) 66,711 91,768
Median Mkt. Cap ($M) 28,934 7,092
Price/Earnings ratio 28.11 18.76
Price/Book ratio 5.37 4.23
5 Yr. EPS Growth Rate (%) 22.15 13.78
Current Yield (%) 1.10 1.74
Beta N/A 1.00
Number of Stocks 31 574
Distribution of Market Capitalization (%)
Sands Capital Management Russell 1000 Growth Index
0.0
20.0
40.0
60.0
80.0
100.0
115.0
>3 Bil 1 Bil - 3 Bil
200 Mil - 500 Mil
98.8
1.2 0.0
100.0
0.0 0.0
Sector Weights (%)
Sands Capital Management
Russell 1000 Growth Index
0.0 10.0 20.0 30.0 40.0 47.2
Utilities
Telecommunication Services
Materials
Information Technology
Industrials
Health Care
Financials
Energy
Consumer Staples
Consumer Discretionary
0.0
0.0
2.9
40.3
0.0
20.3
0.0
11.6
0.0
24.9
0.2
2.3
3.9
28.9
12.9
12.8
4.9
4.2
12.9
16.9
Public Health Trust/Jackson Health System
Portfolio CharacteristicsSands Capital Management vs. Russell 1000 Growth Index
As of March 31, 2013
Page 51

Return Summary
Quarterly Excess Performance - 3 Years Ratio of Cumulative Wealth - 5 Years
Account Information
As of March 31, 2013
Advisory Research Performance Summary
Advisory Research
Advisory Research Russell 2000 Value Index
0.0
4.0
8.0
12.0
16.0
20.0
24.0
Re
turn
(%
)
1Quarter
YearTo
Date
1Year
3Years
5Years
10Years
11.6 11.6
18.1
12.1
7.3
11.311.1 11.1
13.6
10.8
5.4
11.8
Account Name: Advisory Research
Inception Date: 08/01/2001
Account Structure: Separate Account
Asset Class: US Equity
Benchmark: Russell 2000 Value Index
Peer Group: IM U.S. Small Cap Value Equity (SA+CF)
Quarterly Out Performance
Quarterly Under Performance
0.0%
2.0%
3.4%
-2.0 %
-4.0 %
-6.0 %
-8.0 %
6/10 12/10 6/11 12/11 6/12 12/12 3/13
Advisory Research Benchmark
0.85
0.90
0.95
1.00
1.05
1.10
1.15
1.18
3/08 9/08 3/09 9/09 3/10 9/10 3/11 9/11 3/12 9/12 3/13
0.91
Page 52

As of March 31, 2013
Peer Group Analysis
Advisory Research
IM U.S. Small Cap Value Equity (SA+CF)
-4.0
-1.0
2.0
5.0
8.0
11.0
14.0
17.0
20.0
23.0
26.0
29.0
32.0
35.0R
etu
rn
1Quarter
YearTo
Date
1Year
3Years
5Years
7Years
10Years
¢ Advisory Research 11.09 (76) 11.09 (76) 13.63 (84) 10.80 (89) 5.40 (97) 4.26 (85) 11.79 (86)
Å Russell 2000 Value Index 11.63 (65) 11.63 (65) 18.09 (50) 12.12 (82) 7.29 (85) 3.87 (88) 11.29 (91)
5th Percentile 16.13 16.13 27.40 20.00 15.12 10.48 17.19
1st Quartile 13.94 13.94 21.10 15.90 11.93 7.79 14.78
Median 12.56 12.56 18.09 14.11 9.78 6.52 13.45
3rd Quartile 11.10 11.10 15.20 12.80 8.02 4.96 12.39
95th Percentile 8.26 8.26 9.00 9.06 5.85 2.84 10.59
Page 53
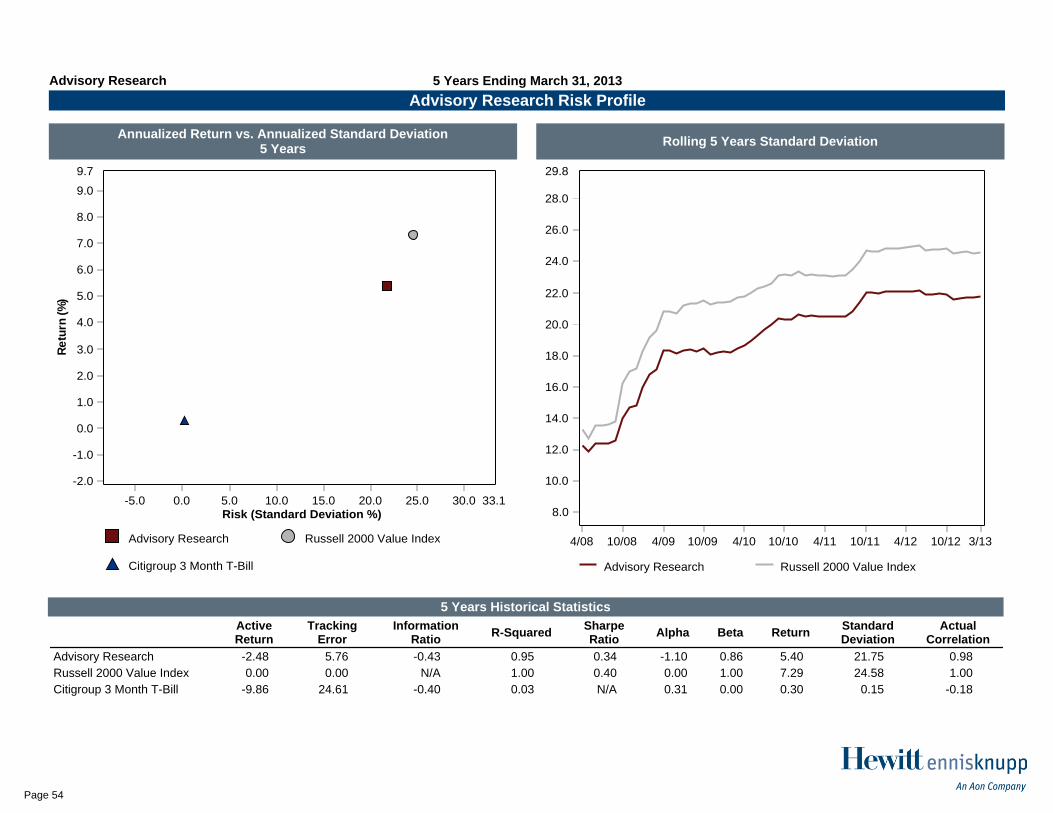
5 Years Historical Statistics
Rolling 5 Years Standard DeviationAnnualized Return vs. Annualized Standard Deviation
5 Years
5 Years Ending March 31, 2013
Advisory Research Risk Profile
Advisory Research
Advisory Research Russell 2000 Value Index
Citigroup 3 Month T-Bill
-2.0
-1.0
0.0
1.0
2.0
3.0
4.0
5.0
6.0
7.0
8.0
9.0
9.7
Re
turn
(%
)
-5.0 0.0 5.0 10.0 15.0 20.0 25.0 30.0 33.1Risk (Standard Deviation %)
Advisory Research Russell 2000 Value Index
8.0
10.0
12.0
14.0
16.0
18.0
20.0
22.0
24.0
26.0
28.0
29.8
4/08 10/08 4/09 10/09 4/10 10/10 4/11 10/11 4/12 10/12 3/13
ActiveReturn
TrackingError
InformationRatio
R-SquaredSharpeRatio
Alpha Beta ReturnStandardDeviation
ActualCorrelation
Advisory Research -2.48 5.76 -0.43 0.95 0.34 -1.10 0.86 5.40 21.75 0.98
Russell 2000 Value Index 0.00 0.00 N/A 1.00 0.40 0.00 1.00 7.29 24.58 1.00
Citigroup 3 Month T-Bill -9.86 24.61 -0.40 0.03 N/A 0.31 0.00 0.30 0.15 -0.18
Page 54

Top Ten Equity Holdings
PortfolioWeight
(%)
BenchmarkWeight
(%)
ActiveWeight
(%)
QuarterlyReturn
(%)
Deltic Timber Corp 3.47 0.00 3.47 -2.55
Gulfport Energy Corp 3.42 0.34 3.08 19.91
Glatfelter 3.26 0.12 3.14 34.41
Vail Resorts Inc. 3.23 0.21 3.02 15.60
Leucadia National Corp 3.16 0.00 3.16 18.75
Trinity Industries Inc. 3.13 0.00 3.13 26.93
M.D.C. Holdings Inc. 3.02 0.20 2.82 -0.30
Symetra Financial Corp 2.90 0.15 2.75 3.91
Core Mark Holding Co Inc 2.83 0.07 2.76 8.36
Casey's General Stores Inc. 2.77 0.00 2.77 10.13
% of Portfolio 31.19 1.09
Portfolio Characteristics
Portfolio Benchmark
Wtd. Avg. Mkt. Cap ($M) 2,160 1,360
Median Mkt. Cap ($M) 1,249 510
Price/Earnings ratio 17.93 15.81
Price/Book ratio 1.77 1.60
5 Yr. EPS Growth Rate (%) 6.06 1.42
Current Yield (%) 1.13 2.01
Beta (5 Years, Monthly) 0.86 1.00
Number of Stocks 48 1,403
Distribution of Market Capitalization (%)
Advisory Research Russell 2000 Value Index
0.0
10.0
20.0
30.0
40.0
50.0
60.0
69.0
>3 Bil 1 Bil - 3 Bil
500 Mil - 1 Bil
200 Mil - 500 Mil
100 Mil - 200 Mil
0 - 100 Mil
4.5
55.1
23.1
13.5
3.6
0.2
21.3
49.6
25.8
3.3
0.0 0.0
Sector Weights (%)
Advisory Research
Russell 2000 Value Index
0.0 10.0 20.0 30.0 40.0 46.0
Utilities
Telecommunication Services
Materials
Information Technology
Industrials
Health Care
Financials
Energy
Consumer Staples
Consumer Discretionary
0.0
0.0
17.2
7.8
17.3
0.0
26.6
9.1
7.9
14.1
6.1
0.5
5.5
11.7
12.6
4.4
37.8
6.5
2.6
12.2
Public Health Trust/Jackson Health System
Portfolio CharacteristicsAdvisory Research vs. Russell 2000 Value Index
As of March 31, 2013
Page 55

Return Summary
Quarterly Excess Performance - 3 Years Ratio of Cumulative Wealth - 5 Years
Account Information
As of March 31, 2013
IronBridge Capital Management Performance Summary
IronBridge Capital Management
IronBridge Capital Management
Russell 2000 Index
0.0
4.0
8.0
12.0
16.0
20.0
23.0
Re
turn
(%
)
1Quarter
YearTo
Date
1Year
3Years
5Years
10Years
12.4 12.4
16.3
13.5
8.2
11.5
13.2 13.2 13.2 13.0
7.7
Account Name: IronBridge Capital Management
Inception Date: 05/01/2004
Account Structure: Separate Account
Asset Class: US Equity
Benchmark: Russell 2000 Index
Peer Group: IM U.S. Small Cap Core Equity (SA+CF)
Quarterly Out Performance
Quarterly Under Performance
0.0%
1.0%
2.0%
3.0%
4.0%
-1.0 %
-2.0 %
-3.0 %
6/10 12/10 6/11 12/11 6/12 12/12 3/13
IronBridge Capital Management
Benchmark
0.94
0.96
0.98
1.00
1.02
1.04
1.06
1.07
3/08 9/08 3/09 9/09 3/10 9/10 3/11 9/11 3/12 9/12 3/13
0.97
Page 56

As of March 31, 2013
Peer Group Analysis
IronBridge Capital Management
IM U.S. Small Cap Core Equity (SA+CF)
-4.0
-1.0
2.0
5.0
8.0
11.0
14.0
17.0
20.0
23.0
26.0
29.0
32.0
Re
turn
1Quarter
YearTo
Date
1Year
3Years
5Years
7Years
10Years
¢ IronBridge Capital Management 13.21 (42) 13.21 (42) 13.15 (83) 12.96 (86) 7.67 (83) 6.16 (42) N/A
Å Russell 2000 Index 12.39 (58) 12.39 (58) 16.30 (50) 13.45 (81) 8.24 (74) 4.59 (70) 11.52 (83)
5th Percentile 16.57 16.57 24.57 20.48 13.28 9.73 15.20
1st Quartile 13.88 13.88 18.87 17.56 10.83 7.04 13.88
Median 12.63 12.63 16.24 15.69 9.28 5.69 12.85
3rd Quartile 11.75 11.75 14.08 13.84 8.14 4.27 11.91
95th Percentile 9.43 9.43 10.16 11.30 6.27 2.61 10.82
Page 57

5 Years Historical Statistics
Rolling 5 Years Standard DeviationAnnualized Return vs. Annualized Standard Deviation
5 Years
5 Years Ending March 31, 2013
IronBridge Capital Management Risk Profile
IronBridge Capital Management
IronBridge Capital Management
Russell 2000 Index
Citigroup 3 Month T-Bill
-2.0
0.0
2.0
4.0
6.0
8.0
10.0
11.0
Re
turn
(%
)
-5.0 0.0 5.0 10.0 15.0 20.0 25.0 30.0Risk (Standard Deviation %)
IronBridge Capital Management
Russell 2000 Index
10.0
12.0
14.0
16.0
18.0
20.0
22.0
24.0
26.0
28.0
29.2
4/08 10/08 4/09 10/09 4/10 10/10 4/11 10/11 4/12 10/12 3/13
ActiveReturn
TrackingError
InformationRatio
R-SquaredSharpeRatio
Alpha Beta ReturnStandardDeviation
ActualCorrelation
IronBridge Capital Management -0.85 4.14 -0.21 0.97 0.43 -0.12 0.93 7.67 22.92 0.99
Russell 2000 Index 0.00 0.00 N/A 1.00 0.44 0.00 1.00 8.24 24.22 1.00
Citigroup 3 Month T-Bill -10.65 24.25 -0.44 0.04 N/A 0.32 0.00 0.30 0.15 -0.21
Page 58

Top Ten Equity Holdings
PortfolioWeight
(%)
BenchmarkWeight
(%)
ActiveWeight
(%)
QuarterlyReturn
(%)
Mid-America Apartment Communities Inc. 2.06 0.00 2.06 7.79
Owens & Minor Inc. 2.01 0.15 1.86 15.08
Alleghany Corp 1.89 0.00 1.89 18.04
Cullen/Frost Bankers Inc 1.77 0.00 1.77 16.14
LifePoint Hospitals Inc. 1.66 0.00 1.66 28.37
UGI Corp 1.64 0.00 1.64 18.22
Redwood Trust Inc. 1.61 0.14 1.47 38.92
Esterline Technologies Corp. 1.60 0.17 1.43 19.01
American Financial Group Inc 1.58 0.00 1.58 20.45
Ingredion Inc 1.53 0.00 1.53 12.84
% of Portfolio 17.35 0.46
Portfolio Characteristics
Portfolio Benchmark
Wtd. Avg. Mkt. Cap ($M) 2,805 1,555
Median Mkt. Cap ($M) 2,248 570
Price/Earnings ratio 18.34 18.30
Price/Book ratio 2.23 2.23
5 Yr. EPS Growth Rate (%) 8.61 5.74
Current Yield (%) 1.32 1.41
Beta (5 Years, Monthly) 0.93 1.00
Number of Stocks 106 1,952
Distribution of Market Capitalization (%)
IronBridge Capital Management
Russell 2000 Index
0.0
10.0
20.0
30.0
40.0
50.0
60.0
69.0
>3 Bil 1 Bil - 3 Bil
500 Mil - 1 Bil
200 Mil - 500 Mil
100 Mil - 200 Mil
0 - 100 Mil
8.3
57.7
20.4
10.8
2.50.2
38.3
51.0
10.1
0.6 0.0 0.0
Sector Weights (%)
IronBridge Capital Management
Russell 2000 Index
0.0 4.0 8.0 12.0 16.0 20.0 24.0 28.0
Utilities
Telecommunication Services
Materials
Information Technology
Industrials
Health Care
Financials
Energy
Consumer Staples
Consumer Discretionary
4.6
0.0
5.9
15.0
16.9
13.3
24.5
5.0
2.3
12.5
3.3
0.6
5.3
16.4
15.3
12.2
23.3
6.1
3.6
13.8
Public Health Trust/Jackson Health System
Portfolio CharacteristicsIronBridge Capital Management vs. Russell 2000 Index
As of March 31, 2013
Page 59

This Page Left Blank Intentionally
Page 60
Non-U.S. Equity
Page 61

Return Summary
Quarterly Excess Performance - 3 Years Ratio of Cumulative Wealth - Since Inception
Account Information
As of March 31, 2013
Northern Trust ACWI ex-US Performance Summary
Northern Trust ACWI ex-US
Northern Trust ACWI ex-US
MSCI ACWI ex-US (11/7/12 fwd)
0.0
1.0
2.0
3.0
4.0
Re
turn
(%
)
1Quarter
YearTo
Date
1Year
3Years
5Years
10Years
3.2 3.23.2 3.2
Account Name: Northern Trust ACWI ex-US
Inception Date: 11/01/2012
Account Structure: Commingled Fund
Asset Class: International Equity
Benchmark: MSCI AC World ex U.S. Index (Net)
Peer Group: IM International Large Cap Core Equity (SA+CF)
No data found.
Northern Trust ACWI ex-US Benchmark
0.9996
0.9999
1.0002
1.0005
1.0008
1.0011
1.0014
1.0016
10/12 11/12 12/12 1/13 2/13 3/13
1.0012
Page 62

Since Inception Historical Statistics
Rolling 5 Years Standard DeviationAnnualized Return vs. Annualized Standard Deviation
Since Inception
Since Inception Ending March 31, 2013
Northern Trust ACWI ex-US Risk Profile
Northern Trust ACWI ex-US
Northern Trust ACWI ex-US
MSCI ACWI ex-US (11/7/12 fwd)
Citigroup 3 Month T-Bill
-2.0
0.0
2.0
4.0
6.0
8.0
10.0
12.0
13.2
Re
turn
(%
)
-0.5 0.0 0.5 1.0 1.5 2.0 2.5Risk (Standard Deviation %)
No data found.
ActiveReturn
TrackingError
InformationRatio
R-SquaredSharpeRatio
Alpha Beta ReturnStandardDeviation
ActualCorrelation
InceptionDate
Northern Trust ACWI ex-US 0.02 0.03 0.70 1.00 0.96 0.02 1.00 9.81 1.98 1.00 11/07/2012
MSCI ACWI ex-US (11/7/12 fwd) 0.00 0.00 N/A 1.00 0.95 0.00 1.00 9.68 1.97 1.00 11/07/2012
Citigroup 3 Month T-Bill -1.88 1.97 -0.95 0.55 N/A 0.01 0.00 0.04 0.00 0.74 11/07/2012
Page 63

Return Summary
Quarterly Excess Performance - 3 Years Ratio of Cumulative Wealth - Since Inception
Account Information
As of March 31, 2013
Thornburg International Value I Performance Summary
Thornburg International Value I
Thornburg International Value I
MSCI EAFE Index (net)
0.0
4.0
8.0
12.0
16.0
-4.0
Re
turn
(%
)
1Quarter
YearTo
Date
1Year
3Years
5Years
10Years
5.1 5.1
11.3
5.0
-0.9
9.7
2.5 2.5
6.8
Product Name : Thornburg Intl Val;I (TGVIX)
Fund Family : Thornburg Investment Management Inc
Ticker : TGVIX
Peer Group : IM International Equity (MF)
Benchmark : MSCI EAFE Index (net)
Fund Inception : 03/30/2001
Portfolio Manager : Trevisani/Fries/Wang
Total Assets : $13,979.40 Million
Total Assets Date : 03/31/2013
Gross Expense : 0.88%
Net Expense : 0.88%
Turnover : 18%
No data found.
Thornburg International Value I
Benchmark
0.98
1.00
1.02
1.04
1.06
1.08
1.10
10/11 1/12 4/12 7/12 10/12 1/13 3/13
1.00
Page 64

As of March 31, 2013
Peer Group Analysis
Thornburg International Value I
IM International Equity (MF)
-10.0
-7.0
-4.0
-1.0
2.0
5.0
8.0
11.0
14.0
17.0
20.0
23.0
26.0
Re
turn
1Quarter
YearTo
Date
1Year
3Years
5Years
7Years
10Years
¢ Thornburg International Value I 2.51 (58) 2.51 (58) 6.78 (64) N/A N/A N/A N/A
Å MSCI EAFE Index (net) 5.13 (22) 5.13 (22) 11.25 (28) 5.00 (47) -0.89 (58) 1.61 (60) 9.69 (61)
5th Percentile 9.06 9.06 17.18 10.94 5.27 8.34 18.02
1st Quartile 4.70 4.70 11.81 6.67 1.42 4.66 13.72
Median 3.03 3.03 8.44 4.79 -0.40 2.24 10.58
3rd Quartile 0.53 0.53 4.81 2.93 -1.98 0.67 8.74
95th Percentile -4.12 -4.12 -2.98 -1.89 -4.94 -1.51 6.79
Page 65

Since Inception Historical Statistics
Rolling 5 Years Standard DeviationAnnualized Return vs. Annualized Standard Deviation
Since Inception
Since Inception Ending March 31, 2013
Thornburg International Value I Risk Profile
Thornburg International Value I
Thornburg International Value I
MSCI EAFE Index (net)
Citigroup 3 Month T-Bill
-2.0
0.0
2.0
4.0
6.0
8.0
10.0
12.0
14.0
15.1
Re
turn
(%
)
-3.0 0.0 3.0 6.0 9.0 12.0 15.0 18.0 20.2Risk (Standard Deviation %)
No data found.
ActiveReturn
TrackingError
InformationRatio
R-SquaredSharpeRatio
Alpha Beta ReturnStandardDeviation
ActualCorrelation
InceptionDate
Thornburg International Value I -0.56 6.01 -0.09 0.85 0.89 2.20 0.77 10.98 12.52 0.92 11/01/2011
MSCI EAFE Index (net) 0.00 0.00 N/A 1.00 0.78 0.00 1.00 11.21 14.98 1.00 11/01/2011
Citigroup 3 Month T-Bill -11.75 14.97 -0.78 0.00 N/A 0.08 0.00 0.08 0.02 0.06 11/01/2011
Page 66

As of March 31, 2013
Mutual Fund Attributes
Thornburg International Value I
Fund Characteristics As of 01/31/2013
Total Securities 103
Avg. Market Cap $69,717.12 $M
P/E 18.53
P/B 4.23
Div. Yield 2.44%
Annual EPS 17.95
5Yr EPS 11.77
3Yr EPS Growth 22.48
Asset Allocation As of 01/31/2013
0.0% 20.0% 40.0% 60.0% 80.0% 100.0% 120.0%
Fixed Income
Cash
Other
US Equity
Intl. Equity
0.0%
1.4%
4.6%
6.8%
87.3%
Regional Allocation As of 01/31/2013
0.0% 20.0% 40.0% 60.0% 80.0%
Emg. MidEast, Africa, Europe
Other
Emerging Latin America
Emerging Asia
Pacific Basin
North America
Europe
1.8%
2.0%
3.7%
7.4%
12.8%
14.5%
56.9%
Top Ten Securities As of 01/31/2013
Novo Nordisk A/S ORD 2.71 %
Mitsubishi UFJ Financial Group Inc ORD 2.66 %
LVMH Moet Hennessy Louis Vuitton SA ORD 2.64 %
Reckitt Benckiser Group PLC ORD 2.52 %
Toyota Motor Corp ORD 2.41 %
Schlumberger NV ORD 2.40 %
Standard Chartered PLC ORD 2.13 %
HSBC Holdings PLC ORD 2.12 %
CNOOC Ltd ORD 2.09 %
Volkswagen AG PFD 2.05 %
Page 67

This Page Left Blank Intentionally
Page 68

Market Environment
Page 69

Global Equity Markets
6.90%3.57%
10.81%
2.89%
12.27%
0.66%
7.22%
3.05%6.99%
‐0.95%
10.95%8.62%
13.62%10.80%
9.00%
2.31% 1.50%
11.06%
18.54%
2.78%
‐10%
0%
10%
20%
30%
40%
50%
ACWI IMI 52.2%ACWI ex‐U.S. IMI
47.8%USA IMI
7.9%UK IMI
8.0%Japan IMI
4.0%Canada IMI
0.2%Israel IMI
14.8%Europe ex‐UK IMI
5.2%Pacific ex‐Japan IMI
12.1%EmergingMarketsIMI
GLOBAL MSCI IMI INDEX RETURNSAS OF 03/31/2013
First Quarter 2013One‐Year
Source: MSCI
Equity markets posted positive returns during the quarter despite Eurozone worries resulting from an Italian election in which no party claimed a majority, corruption allegations in Spain, and a Cypriot bailout. Equity markets were pushed higher by positive U.S. economic data and the U.S. fiscal cliff deal that was reached at the beginning of the quarter.
Japan proved to be the best performing region as investors were pleased with the Prime Minister’s ongoing pressure to increase the money supply. The worst performing region was Emerging Markets.
Page 70

Global Equity Markets
USA47.8%
UK7.9%
Canada4.0%
Pacific ex‐Japan5.2% Japan
8.0%
Europe ex‐UK14.8%
Israel0.2%
Latin America2.5%
Asia7.5%
Eastern Europe, Middle East &
Africa2.0%
EmergingMarkets12.1%
MSCI ALL COUNTRY WORLD IMI INDEXGEOGRAPHIC ALLOCATION AS OF 03/31/2013
Source: MSCI
UK15.1%
Canada7.7%
Pacific ex‐Japan10.0%
Japan15.3%
Europe ex‐UK28.4%
Israel0.4%
Latin America4.8%
Asia14.4%
Eastern Europe, Middle East &
Africa3.9%
EmergingMarkets23.1%
MSCI ALL COUNTRY WORLD EX‐U.S. IMI INDEXGEOGRAPHIC ALLOCATION AS OF 03/31/2013
Source: MSCI
The two exhibits on this slide illustrate the percentage that each country/region represents of the global equity market as measured by the MSCI All Country World IMI Index and the MSCI All Country World ex U.S. IMI Index.
Page 71

U.S. Equity Markets
11.07% 12.25%10.57%
14.59%12.04%
15.70%12.23%
5.39% 5.24%8.62%
13.38%14.57%
19.97%
10.26%
19.98%18.34%
24.94%
17.39%
‐0.53%
10.00%
24.84%
17.66%
‐10%
0%
10%
20%
30%
40%
50%
Russell3000
12.5%Cons. Disc.
9.9%Energy
9.5%Cons. Stap.
17.2%Financials
12.3%Healthcare
11.3%Industrials
17.3%IT
3.9%Materials
2.6%Telecomms
3.5%Utilities
RUSSELL GICS SECTOR RETURNSAS OF 03/31/2013
First Quarter 2013One‐Year
Source: Russell Indexes
11.07% 11.45%8.77%
14.21%11.51% 11.63%
13.21%14.57%
17.49%
9.06%
21.49%
12.76%
18.09%
14.52%
0%
10%
20%
30%
40%
50%
Russell 3000 32.8%Large Value
31.5%Large Growth
15.1%Medium Value
12.8%Medium Growth
4.0%Small Value
3.7%Small Growth
RUSSELL STYLE RETURNSAS OF 03/31/2013
First Quarter 2013One‐Year
Source: Russell Indexes
2013 started strong for U.S. equities as Congress acted to delay negotiations regarding the debt ceiling. The rally continuedthrough the second half of the quarter as fourth quarter earnings proved to be strong with roughly three-fourths of companies meeting or beating expectations.
The Russell 3000 rose 11.07% during the quarter and returned 14.57% over the one-year period.
The Healthcare, Utilities, Consumer Discretionary, and Industrial sectors were the best performing sectors during the first quarter, posting returns of 15.70%, 13.38%, 12.25%, and 12.23%, respectively. The Information Technology and Materials sectors were the worst performing areas, producing returns of 5.39% and 5.24%, respectively, during the first quarter.
Overall, mid cap outperformed both small cap and large cap during the first quarter. Value outperformed growth in the large and mid cap sectors but growth prevailed amongst small cap stocks during the quarter.
Page 72

U.S. Fixed Income Markets
‐0.12% ‐0.16% ‐0.11% ‐0.05%
0.05% 0.13%
3.77%
3.01%
7.47%
1.97%
2.85%
6.14%
‐1%
0%
1%
2%
3%
4%
5%
6%
7%
8%
Barclays Agg.Bond
46.8%Gov't
21.7%Corp.
29.3%MBS
0.3%ABS
1.8%CMBS
BARCLAYS AGGREGATE RETURNS BY SECTORAS OF 03/31/2013
First Quarter 2013One‐Year
Source: Barclays Live
‐0.11%
0.08%
‐0.26% ‐0.15%
2.89%2.60%
4.27%
7.13%
8.57%
13.13%
‐2%
0%
2%
4%
6%
8%
10%
12%
14%
Aaa Aa A Baa High Yield
BARCLAYS AGGREGATE RETURNS BY QUALITY AND HIGH YIELD RETURNSAS OF 03/31/2013
First Quarter 2013One‐Year
Source: Barclays Live
0.19% 0.26% 0.09%
‐0.39%
‐1.99%
1.09%
2.38%
4.09%
6.42%
8.93%
‐4%
‐2%
0%
2%
4%
6%
8%
10%
1‐3 Yr. 3‐5 Yr. 5‐7 Yr. 7‐10 Yr. >10 Yr.
BARCLAYS AGGREGATE RETURNS BY MATURITYAS OF 03/31/2013
First Quarter 2013One‐Year
Source: Barclays Live
The Barclays Aggregate Bond Index returned -0.12% in the first quarter.
Commercial mortgage-backed securities and asset-backed securities were the strongest performing sectors, returning 0.13% and 0.05%, respectively, over the course of the first quarter.
In the investment grade market, higher quality bonds outperformed lower quality bonds during the first quarter.
High-yield bonds outperformed investment grade bonds as investors sought yield in a low interest rate environment.
From a maturity perspective, shorter term bonds outperformed, with the 1-3 yr. and 3-5 yr. posting positive returns of 0.19% and 0.26%, respectively, during the first quarter.
Page 73

U.S. Fixed Income Markets
‐2.0%
‐1.0%
0.0%
1.0%
2.0%
3.0%
4.0%
5.0%
6.0%
Mar 03 Mar 04 Mar 05 Mar 06 Mar 07 Mar 08 Mar 09 Mar 10 Mar 11 Mar 12 Mar 13
U.S. 10‐YEAR TREASURY AND TIPS YIELDS10Y TIPS Yield
10Y Treasury Yield
Source: U.S. Department of Treasury
0.0%
0.5%
1.0%
1.5%
2.0%
2.5%
3.0%
3.5%
4.0%
0 5 10 15 20 25 30
Maturity (Years)
U.S. TREASURY YIELD CURVE
3/31/2012
12/31/2012
3/31/2013
Source: U.S. Department of Treasury
The Treasury yield curve steepened during the quarter; both the intermediate (1 to 10 years) and the long-term segments of the yield curve rose.
The 10-year U.S. Treasury yield ended the quarter at a yield of 1.87%, roughly 9 basis points higher than its level at the beginning of the quarter.
10-year TIPS yields remained in negative territory, but rose by 3 basis points to -0.64% over the quarter.
Page 74

European Fixed Income Markets
0%
5%
10%
15%
20%
25%
30%
35%
40%
45%
Mar 08
Jun 08
Sep 08
Dec 08
Mar 09
Jun 09
Sep 09
Dec 09
Mar 10
Jun 10
Sep 10
Dec 10
Mar 11
Jun 11
Sep 11
Dec 11
Mar 12
Jun 12
Sep 12
Dec 12
Mar 13
EUROZONE PERIPHERAL BOND SPREADS(10‐YEAR SPREADS OVER GERMAN BUNDS)
Spain ItalyPortugal GreeceIreland
Source: DataStream
Cyprus was one of the focal points of the Eurozone debt crisis during the quarter as issues arose around the terms of the lossesthat depositors should face in the country’s bailout. By the end of the quarter, Cyprus re-opened its banks after accepting €10 billion of financial aid under the condition that Cypriot bank depositors with deposits over €100,000 would bear significant losses.
Page 75
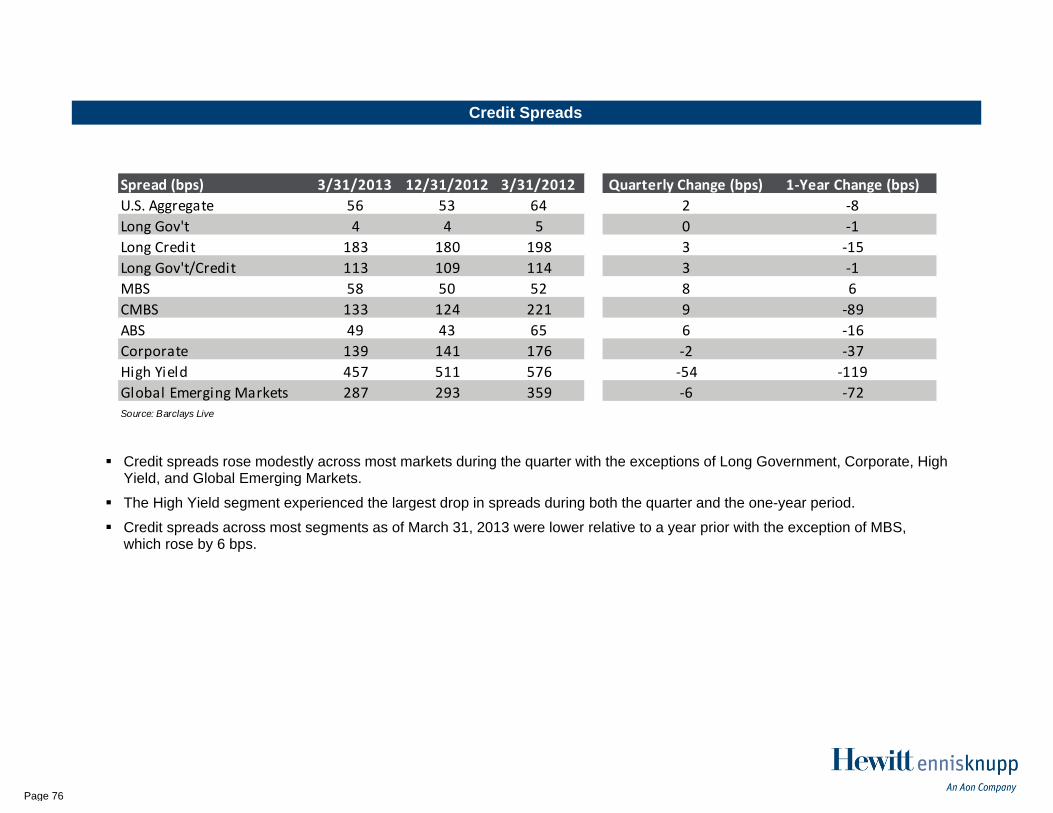
Credit Spreads
Spread (bps) 3/31/2013 12/31/2012 3/31/2012 Quarterly Change (bps) 1‐Year Change (bps)U.S. Aggregate 56 53 64 2 ‐8Long Gov't 4 4 5 0 ‐1Long Credit 183 180 198 3 ‐15Long Gov't/Credit 113 109 114 3 ‐1MBS 58 50 52 8 6CMBS 133 124 221 9 ‐89ABS 49 43 65 6 ‐16Corporate 139 141 176 ‐2 ‐37High Yield 457 511 576 ‐54 ‐119Global Emerging Markets 287 293 359 ‐6 ‐72Source: Barclays Live
Credit spreads rose modestly across most markets during the quarter with the exceptions of Long Government, Corporate, High Yield, and Global Emerging Markets.
The High Yield segment experienced the largest drop in spreads during both the quarter and the one-year period.
Credit spreads across most segments as of March 31, 2013 were lower relative to a year prior with the exception of MBS, which rose by 6 bps.
Page 76

Commodities
‐1.13%
‐5.08%
7.12%
‐7.84%
‐5.46%
‐3.16%
‐3.20%
‐3.74%
‐6.43%
‐3.03%
‐6.30%
3.39%
‐12.28%
‐7.40%
‐2.41%
‐23.19%
7.87%
‐4.81%
‐25% ‐20% ‐15% ‐10% ‐5% 0% 5% 10%
DJ‐UBS Commodity Index
Ex‐Energy
Energy
Industrial Metals
Prec. Metals
Agric.
Softs
Grains
Livestock
COMMODITY RETURNSAS OF 03/31/2013
First Quarter 2013One‐Year
Source: Dow Jones‐UBS
Driven by negative returns across most market sectors, the Dow Jones-UBS Commodity Index decreased by 1.13% during the first quarter.
The strongest and only positive performing segment of the market was Energy with a return of 7.12% during the quarter.
Industrial Metals and Livestock were the worst performing sectors of the market during the first quarter with returns of -7.84% and -6.43%, respectively.
Page 77

Currency
90
95
100
105
110
115
120
Mar 08
Jun 08
Sep 08
Dec 08
Mar 09
Jun 09
Sep 09
Dec 09
Mar 10
Jun 10
Sep 10
Dec 10
Mar 11
Jun 11
Sep 11
Dec 11
Mar 12
Jun 12
Sep 12
Dec 12
Mar 13
TRADE WEIGHTED U.S. DOLLAR INDEX(1997 = 100)
Source: Federal Reserve
‐9.68%
‐5.50%
11.24%
18.98%
8.07%
‐15.79%
7.01%5.72%
‐3.39%
5.98%
2.06%
‐0.06% ‐0.24%
‐4.41% ‐5.49%
0.27%
‐2.11%
1.56%
‐20%
‐15%
‐10%
‐5%
0%
5%
10%
15%
20%
25%
2000
2001
2002
2003
2004
2005
2006
2007
2008
2009
2010
2011
2012 YTD
1‐Year
3‐Years
5‐Years
10‐Years
DIFFERENCE BETWEEN MSCI EAFE UNHEDGED AND HEDGED INDICESAS OF 03/31/2013
Source: MSCI
UNHEDGED OUTPERFORMS
HEDGED OUTPERFORMS
As measured through the broad trade weighted U.S. dollar index, the U.S. dollar appreciated during the quarter and the one year period.
The MSCI EAFE Unhedged Index significantly underperformed the MSCI EAFE 100% Hedged Index during the year-to-date period reflecting the appreciation of the U.S. dollar. The Unhedged index underperformed the Hedged index during the trailing1- and 5-year periods.
Page 78

Hedge Fund Markets Overview
All major hedge fund strategies types posted positive returns in the first quarter and one-year period. The HFRI Fund-Weighted Composite Index and the HFRI Fund of Funds Composite Index produced returns of 3.87% and 3.46%, respectively, during the first quarter.
Equity Hedge and Distressed-Restructuring strategies were the strongest performers during the quarter gaining 5.29% and 4.37%, respectively.
2.85%
1.37%
5.23%
2.81%
3.90%
4.55%
3.27%
3.81%
3.36%
5.06%
0.62%
5.75%
5.76%
7.89%
9.82%
9.69%
5.46%
4.78%
0% 2% 4% 6% 8% 10% 12%
Fixed Income/Convertible Arb.
Global Macro
Equity Hedge
Emerging Markets
Event‐Driven
Distressed‐Restructuring
Relative Value
Fund‐Weighted Composite Index
Fund of Funds Composite Index
HEDGE FUND PERFORMANCEAS OF 03/31/2013
First Quarter 2013One‐Year
Note: Latest 5 months of HFR data are estimated by HFR and may change in the future.Source: HFR
Page 79

Private Equity Market Overview – Fourth Quarter 2012
Fundraising: $265 billion was raised in 2012, which is flat with 2011. This is a healthy but not excessive level and is the well below the peak pre-crisis levels ($490.0 billion). Dry powder available to invest is significant ($789.0 billion), but decreasing and resides primarily within large cap and mega funds.Buyout: The number and value of deals completed is trending up but is 33.5% below the ten-year average. Some mega deals are getting done, although small and middle market deals comprise bulk of the number of deals. Purchase price multiples remained relatively steady for last three years; European and U.S. large cap prices are above their 10-year average while middle market is at its 10-year average. Europe activity remains slow due to economic uncertainty.Venture capital: $25.5 billion was invested in new deals, lagging the solid $29.0 billion in 2011. Pre money valuations stabilized with exception of series B valuations which increased 34% to levels not seen since 2007. Exit activity was slightly lower than 2011 due to reduced M&A activity and poor performance of consumer technology IPO’s.Mezzanine: U.S. mezzanine lenders are getting squeezed out of larger transactions due to robust and less expensive high yield market. In smaller deals mezzanine is facing competition from senior lenders who are beginning to provide higher levels of leverage.Distressed Debt: Investment activity remains low due to high refinance activity and continued low high yield default rates; looking forward to 2013-2014 attractive opportunities exist primarily in mid to lower cap market and in Europe where bulk of troubled situations have yet to be resolved.Secondaries: $20.0 billion raised which is the highest level since 2008. $24.0 billion of deals was completed, the second highest level for this strategy. Purchase prices for buyout funds increased to 90% of value due to improving valuations, increased expected liquidity and higher levels of capital raised. Venture pricing fell to 69% of value, but is largely contingent on the specific fund being priced. Solid activity expected in 2013 but smaller transactions and lessor quality assets.Infrastructure: $23.2 billion raised, 5% greater than 2011. Infrastructure debt funds are being raised to replace the void left by the banks . Activity plateaued at lower levels due debt availability and increased regulation in Europe.
0
1,000
2,000
3,000
4,000
5,000
6,000
$0
$200
$400
$600
$800
$1,000
$1,200
1Q07
2Q07
3Q07
4Q07
1Q08
2Q08
3Q08
4Q08
1Q09
2Q09
3Q09
4Q09
1Q10
2Q10
3Q10
4Q10
1Q11
2Q11
3Q11
4Q11
1Q12
2Q12
3Q12
4Q12
LTM GLOBAL SPONSOR M&A DEAL VOLUME AND VALUE(TRAILING 12 MONTH DATA)
Value ($ billions), LHS
Number of Deals, RHS
Source: ThomsonOne
6.6 x7.1 x 7.3 x
8.4 x8.4 x
9.7 x9.1 x
7.7 x
8.5 x 8.8 x 8.7 x
0 x
2 x
4 x
6 x
8 x
10 x
12 x
2002 2003 2004 2005 2006 2007 2008 2009 2010 2011 2012
PURCHASE PRICE MULTIPLES Others
Equity/EBITDA
Sub Debt/EBITDA
Senior Debt/EBITDA
Source: S&P
Page 80

U.S. Commercial Real Estate Markets
Apartments
Hotels
Office
Industrial
Retail
CURRENT POSITION IN REAL ESTATE RECOVERY CYCLE
Net Absorption Turns Positive
Declining Vacancy
Growth in Rental Rates
Construction Reignites
Demand Drivers Rebound
2.69%
10.79%
15.13%
‐0.84%
6.80%
8.19%
15.29%
17.17%
6.83%
12.44%
‐2%
0%
2%
4%
6%
8%
10%
12%
14%
16%
18%
20%
Fourth Quarter 2012 1‐Year 3‐Years 5‐Years 10‐Years
PRIVATE VS. PUBLIC REAL ESTATE RETURNSAS OF 03/31/2013
Private (NFI‐ODCE Gross)*
Public (NAREIT Gross)
*Fourth quarter returns are preliminarySources: NCREIF, NAREIT
2013 U.S. Real Estate Outlook:U.S. economy expected to remain in slow-growth mode for much of 2013, though still strong enough to support continued measuredimprovements in real estate fundamentalsNew supply expected to become more noticeable in 2013, first in apartments with some uptick in industrial as well; other new property typedeliveries are still well restrainedCurrent low interest rate environment continues to support price recovery/growth– Relative value of Real Estate versus other asset classes remains attractive
Core rebound is mature and returns are expected to continue to moderate (consensus NPI forecast range is 6–9%...generally in line withlong-term average)– Still solid investment option for long-term investors seeking diversification and yield– Consider debt plays as a substitute for Core returns (also good alternative for fixed income)
Non Core opportunities remain in the sector’s sweet spot, with above average return potential– Distress, recapitalization, lease up, repositioning, even some development attractive
Headwinds remain, both domestic and global, thus do not discount the potential for above average volatility in the sector to continue
Page 81

This Page Left Blank Intentionally
Page 82

Investment Analysis Highlights
Page 83

Newfleet Core Fixed Income Portfolio (Core Fixed Income Separate Account)As of March 31, 2013, the portfolio was valued at $54.6 million (10.8 percent of total Plan assets). For the first quarter of the year, the account’s return of 0.4 percent outperformed the Barclays Aggregate Index by 47 basis points and ranked in the top quartile of core fixed income managers. An allocation to high yield bonds as well as an overweight position in asset-backed and commercial mortgage backed securities accounted for a majority of the portfolio’s outperformance this quarter. The account also bests the benchmark and places in the top quartile of the universe for the one-year period ending March 31, 2013, returning 6.0 percent compared to a gain of 3.8 percent for the index. Recent outperformance as well as in the market rebound of 2009 and 2010 has benefited long-term performance comparisons as the portfolio outperforms the benchmark for the seven most recent rolling three-year periods, ranking above median in the peer group for the five most recent observations. It also outperforms the index and places in the top half of the peer group for the three-, five-, seven- and ten-year periods ending March 31, 2013.
In November 2012, David Albrycht, previously CIO of Newfleet, was given the newly created title of president and the responsibility of overseeing the growth of the firm. In January 2013, Bob Bishop was promoted to CIO and portfolio strategist of the firm. He will continue to work closely the remaining portfolio managers on the firm’s Core Fixed Income strategy.
Taplin, Canida & Habacht Core Fixed Income Portfolio (Core Fixed Income Separate Account)At the end of the first quarter, $58.6 million (11.6 percent of total Plan assets) were invested in a core fixed income portfolio managed by Taplin, Canida & Habacht. The account’s return of 0.4 percent in the most recent quarter outperformed the -0.1 percent return of the Barclays Aggregate Index and ranked in the top quartile of the peer group. The portfolio’s sizeable allocation to financial issues led to outperformance this quarter as it was one of the few sectors of the index which recorded positive performance. The account’s return of 9.0 percent return for the one-year period ending March 31, 2013 exceeded the return of the benchmark by 520 basis points and ranked near the top of the core fixed income manager universe. Long-term performance of the account is also strong. It bests the benchmark and ranks in the top quartile of the peer group for the eight most recent rolling three-year periods. In addition, it outpaced the index and placed near the top of the universe for the three-, five- and seven-year periods ending March 31, 2013.
PIMCO Total Return Fund (Core Fixed Income Mutual Fund)At the end of March, $50.8 million (10.0 percent of total Plan assets) were invested in the PIMCO Total Return Fund. The fund outperformed the Barclays Aggregate Index and ranked in the top decile of the peer group for the first quarter, returning 0.6 percent versus a loss of 0.1 percent for the benchmark and a gain of 0.2 percent for the median manager. For the quarter, the fund’s focus on intermediate maturities added value as these outperformed their longer-dated counterparts. In addition, exposures to non-agency mortgage and taxable municipal issues contributed to outperformance. The fund also outpaced the index by a wide margin for the one-year period ending March 31, 2013 and ranked in the top decile of the peer group. Longer-term comparisons of the mutual fund are also strong as it has outpaced the benchmark and placed in the top decile of the universe of other core bond funds for the five-, seven-, and ten-year periods ending March 31, 2013. The fund also outpaced the benchmark and ranked in the top half of the peer group for all rolling three-year periods measured semi-annually.
Public Health Trust/Jackson Health SystemFor Quarter Ending March 31, 2013
Executive Summary
Page 84

Victory Convertible Securities Portfolio (Convertible Security Separate Account)At the end of the first quarter, $50.9 million (10.0 percent of total Plan assets) were invested in a convertible securities portfolio managed by Victory. The account’s return of 7.0 percent for the most recent quarter outperformed the 6.6 percent return of the Bank of America Merrill Lynch Convertible Bonds Index and placed in the top half of the peer group. The portfolio’s delta, which was higher than that of the benchmark, led to outperformance in this quarter of sharply rising equity prices. Performance over the one-year period ending March 31, 2013 was mixed as the account outpaced the index by 110 basis points, but placed in the bottom half of the peer group. Poor relative performance in 2008, when the separate account composite lagged the benchmark by 1,111 basis points, weighs heavily on long-term comparisons. The composite lags the benchmark for a majority of rolling three-year periods, placing in the bottom half of the peer group for all but one of those same observations. It outperforms the index for the three- and ten-year periods ending March 31, 2013; however, it places in the bottom third of the peer group for the three-, five-, seven- and ten-year periods.
In February 2013, Victory Capital Management announced that the employees of the firm had partnered with Crestview Partners, a leading private equity firm, to acquire all of KeyCorp’s interest in Victory. Upon completion of the transaction, Victory will be an independent firm with the senior management team, portfolio managers and other employees owning a significant amount of the outstanding equity. Under the new ownership structure, Dave Brown will assume the role of Chief Executive Officer and Chris Ohmacht will assume the role of President. There will be no changes to the individual Chief Investment Officers, investment teams or their investment process as a result of this transaction.
HEK recommends that the portfolio be terminated in order to fund the new asset classes.
Horizon Core Value Portfolio (Large Cap Value Separate Account)As of March 31, 2013, $36.2 million (7.1 percent of total Plan assets) were invested in a large cap value domestic equity portfolio managed by Horizon. The account again outperformed the Russell 1000 Value Index and ranked in the top third of large cap value managers for the first quarter, returning 12.4 percent compared to a gain of 12.3 percent for the benchmark and 11.5 percent for the peer group median manager. The portfolio continued to benefit from a large overweight allocation to the consumer discretionary sector this quarter and the account’s holdings in that sector also outpaced their benchmark counterparts. At the end of the quarter, the portfolio’s weighting to the consumer discretionary sector was 54.2 percent of assets, more than 6 times the representation in the Russell 1000 Value Index. The account also bests the benchmark and ranks near the top of the peer group for the one-year period ending March 31, 2013. Poor relative performance in 2008 and 2011 has impacted long-term comparisons. The account trails the index and places in the bottom decile of the peer group for nearly all rolling three-year periods. It also underperforms the index and places in the bottom decile of the peer group for the trailing five- and seven-year periods ending March 31, 2013.
Public Health Trust/Jackson Health SystemFor Quarter Ending March 31, 2013
Executive Summary
Page 85

iShares Russell 1000 Value Index Fund (Large Cap Value Index Exchange Traded Fund)$35.4 million (7.0 percent of total Plan assets) were invested in the iShares Russell 1000 Value Index exchange traded fund at the end of March. The fund has successfully tracked the Russell 1000 Value Index since being added to the Plan and long-tem performance of the exchange traded fund has demonstrated the ability to consistently replicate the performance of the benchmark.
The fund’s expense ratio of 0.21 percent, not including brokerage commissions on the purchase of shares, is high for a passively-managed product. HEK recommended that the fund be replaced with a lower cost index product and has prepared a search report highlighting lower cost options in this asset class.
In January 2013, BlackRock announced plans to buy Credit Suisse’s ETF business. The terms of the deal were not disclosed. The deal would give BlackRockcontrol of nearly three quarters of the physical ETF market in Europe. In June 2012, Chief Equity Strategist and lead portfolio manager of BlackRock’s Large Cap Series portfolios Bob Doll retired. In May 2012, Barclays announced its intention to sell its 19.7 percent stake in BlackRock through a public secondary offering. On the same day, BlackRock announced that it would repurchase $1 billion in stock directly from Barclays.
Northern Trust Large Cap Growth Portfolio (Large Cap Growth Separate Account)At the end of March, $39.9 million (7.9 percent of total Plan assets) were invested in a large cap growth domestic equity portfolio managed by Northern Trust. The account underperformed the Russell 1000 Growth Index and placed in the bottom quartile of large cap growth managers in the first quarter, returning 7.6 percent versus a gain of 9.5 percent for the index and 9.3 percent for the peer group median manager. Stock selection accounted for the portfolio’s underperformance this quarter with holdings in the information technology, consumer staples and consumer discretionary sectors being the most notable laggards. Poor performance in the last two quarters causes the account to trail the benchmark by 373 basis points for the one-year period ending March 31, 2013 and rank in the bottom quartile of the peer group. Recent underperformance combined with poor relative performance from 2009 through 2011 is affecting long-term comparisons of the separate account composite. While it continues to place in the top half of the peer group for a majority of rolling three-year periods, it only bests the benchmark for half of those same observations. The composite also lags the index for the three-, five- and seven-year period ending March 31, 2013; however, it ranks above median in the universe for the three-, seven- and ten-year periods. At the end of the first quarter, Apple comprised 5.6 percent of the account’s assets; however, this same holding represented 5.4 percent of the Russell 1000 Growth Index on March 31, 2013.
Sands Select Growth Portfolio (Large Cap Growth Separate Account)At the end of the first quarter, $32.8 million (6.5 percent of total Plan assets) were invested in a large cap growth domestic equity portfolio managed by Sands. The account’s return of 7.2 percent for the most recent quarter underperformed the Russell 1000 Growth Index by 231 basis points and ranked in the bottom quartile of large cap growth managers. Both sector allocation and stock selection decisions detracted from relative performance this quarter. The portfolio’s consumer discretionary holdings lagged their benchmark counterparts by the widest margin. In addition, the account’s overweight allocation to information technology holdings weighed on results. In spite of recent underperformance, the account’s return of 12.0 percent for the one-year period ending March 31, 2013 outpaced the 10.1 percent return of the Russell 1000 Growth Index and ranked in the top third of the peer group. Long-term performance of the separate account composite is also excellent as it bests the benchmark and ranks in the top quartile of the peer group for the eight most recent rolling three-year periods. Trailing returns are similar as the composite outpaced the index and ranked in the top decile of the peer group for the three-, five-, seven- and ten-year periods ending March 31, 2013. At the end of March, four holdings each accounted for more than 5 percent of portfolio assets. Those positions were Visa at 8.5 percent, Google at 8.4 percent, Amazon.com at 7.9 percent and Salesforce.com at 7.2 percent. During the first quarter, the amount of assets in the top ten holdings of the portfolio declined to 55.4 percent.
Public Health Trust/Jackson Health SystemFor Quarter Ending March 31, 2013
Executive Summary
Page 86
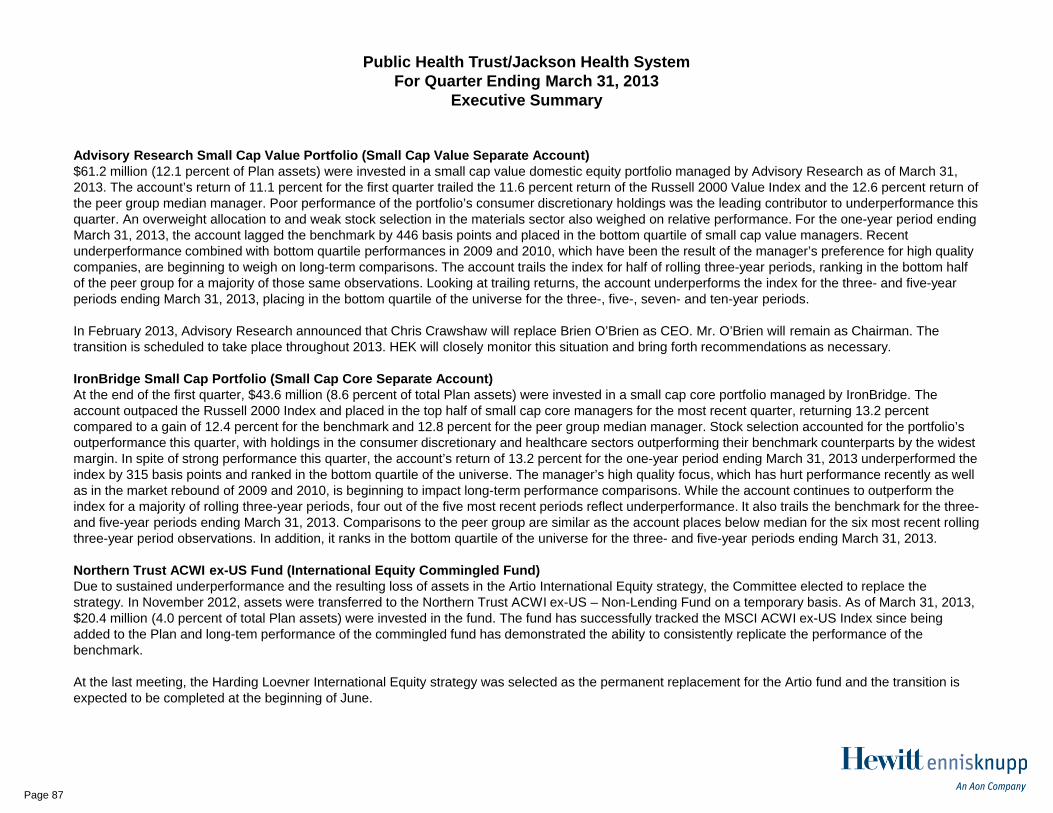
Advisory Research Small Cap Value Portfolio (Small Cap Value Separate Account)$61.2 million (12.1 percent of Plan assets) were invested in a small cap value domestic equity portfolio managed by Advisory Research as of March 31, 2013. The account’s return of 11.1 percent for the first quarter trailed the 11.6 percent return of the Russell 2000 Value Index and the 12.6 percent return of the peer group median manager. Poor performance of the portfolio’s consumer discretionary holdings was the leading contributor to underperformance this quarter. An overweight allocation to and weak stock selection in the materials sector also weighed on relative performance. For the one-year period ending March 31, 2013, the account lagged the benchmark by 446 basis points and placed in the bottom quartile of small cap value managers. Recent underperformance combined with bottom quartile performances in 2009 and 2010, which have been the result of the manager’s preference for high quality companies, are beginning to weigh on long-term comparisons. The account trails the index for half of rolling three-year periods, ranking in the bottom half of the peer group for a majority of those same observations. Looking at trailing returns, the account underperforms the index for the three- and five-year periods ending March 31, 2013, placing in the bottom quartile of the universe for the three-, five-, seven- and ten-year periods.
In February 2013, Advisory Research announced that Chris Crawshaw will replace Brien O’Brien as CEO. Mr. O’Brien will remain as Chairman. The transition is scheduled to take place throughout 2013. HEK will closely monitor this situation and bring forth recommendations as necessary.
IronBridge Small Cap Portfolio (Small Cap Core Separate Account)At the end of the first quarter, $43.6 million (8.6 percent of total Plan assets) were invested in a small cap core portfolio managed by IronBridge. The account outpaced the Russell 2000 Index and placed in the top half of small cap core managers for the most recent quarter, returning 13.2 percent compared to a gain of 12.4 percent for the benchmark and 12.8 percent for the peer group median manager. Stock selection accounted for the portfolio’s outperformance this quarter, with holdings in the consumer discretionary and healthcare sectors outperforming their benchmark counterparts by the widest margin. In spite of strong performance this quarter, the account’s return of 13.2 percent for the one-year period ending March 31, 2013 underperformed the index by 315 basis points and ranked in the bottom quartile of the universe. The manager’s high quality focus, which has hurt performance recently as well as in the market rebound of 2009 and 2010, is beginning to impact long-term performance comparisons. While the account continues to outperform the index for a majority of rolling three-year periods, four out of the five most recent periods reflect underperformance. It also trails the benchmark for the three-and five-year periods ending March 31, 2013. Comparisons to the peer group are similar as the account places below median for the six most recent rolling three-year period observations. In addition, it ranks in the bottom quartile of the universe for the three- and five-year periods ending March 31, 2013.
Northern Trust ACWI ex-US Fund (International Equity Commingled Fund)Due to sustained underperformance and the resulting loss of assets in the Artio International Equity strategy, the Committee elected to replace the strategy. In November 2012, assets were transferred to the Northern Trust ACWI ex-US – Non-Lending Fund on a temporary basis. As of March 31, 2013, $20.4 million (4.0 percent of total Plan assets) were invested in the fund. The fund has successfully tracked the MSCI ACWI ex-US Index since being added to the Plan and long-tem performance of the commingled fund has demonstrated the ability to consistently replicate the performance of the benchmark.
At the last meeting, the Harding Loevner International Equity strategy was selected as the permanent replacement for the Artio fund and the transition is expected to be completed at the beginning of June.
Public Health Trust/Jackson Health SystemFor Quarter Ending March 31, 2013
Executive Summary
Page 87

Thornburg International Value Fund (International Equity Mutual Fund)At the end of March, $21.7 million (4.3 percent of total Plan assets) were invested in the Thornburg International Value Fund. The fund again underperformed the MSCI EAFE Index for the most recent quarter, returning 2.5 percent compared to a gain of 5.1 percent for the benchmark. It also ranked in the bottom half of the peer group for that same timeframe. The fund’s underweight allocation to Japan led to underperformance as did out of benchmark allocations to Canada and China. On a sector basis, the fund’s holdings in the consumer discretionary and financials sectors were the most notable laggards. The fund also trailed the index and ranked in the bottom half of the peer group for the one-year period ending March 31, 2013. In spite of recent underperformance, long-term performance of the fund is strong as it outperforms the benchmark for all rolling three-year periods, placing in the top half of the peer group for all but one of those same observations. In addition, the fund bests the benchmark and ranks above median in the universe for the three-, five-, seven- and ten-year periods ending March 31, 2013.
Public Health Trust/Jackson Health SystemFor Quarter Ending March 31, 2013
Executive Summary
Page 88

Trailing 4Quarters
InvestmentObjectives
PerformanceResults
7.5%
9.1%Total Fund Total Composite Index: 11.0%
60% S&P 500 / 40% Barclays Agg: 9.9%
12.8%Trailing Five Year Return (annualized) 5.2%
Equity & Cash Equity Composite Index: 14.9%S&P 500: 10.6%
15.3%6.2%
Fixed & Cash Fixed Composite Index: 3.8%Barclays Aggregate: 3.8%
9.0%
Strategic Current Qtr End Overall Fixed Income Investment grade: No ViolationsRanges(1) Targets(2) Allocation Fixed Income max of 10% in one issue:
Total Equity max of 5% in one issue: No ViolationsTotal Equity 60% - 80% 70.0% 57.5% Total Equity max of 25% in one sector:
Domestic Large Cap 35% - 45% 40.0% 28.5%Domestic Small/Mid Cap 5% - 15% 10.0% 20.7%International 15% - 25% 20.0% 8.3%
Trailing 3 ActualTotal Fixed & Cash 25% - 35% 30.0% 32.5% Years Volatility
Total Other 0% - 25% 0.0% 10.0% Total Fund volatility maximum = 120% of comp. = 11.8% 10.0%Total Equity volatility maximum = 120% of comp. = 20.2% 16.4%
Total Fund 100.0% 100.0% Total Fixed volatility maximum = 120% of comp. = 2.9% 3.0%(1) Strategic Ranges are approved by the Board of Trustees and establish the minimum &maximum allowable allocations. Changes to the ranges require Board approval
(2) The Current Target percentages are established and modified by the investmentSub-Committee and must fall within the Board approved Strategic Ranges.
Volatility GuidelinesAnnualized Std. Deviation
Performance Results Relative to Actuarial Objective:
Public Health Trust/Jackson Health SystemInvestment Policy Review
March 31, 2013
No Violations
No Violations
Trailing Three Year Return (annualized)
Annualized Return Since Inception (8/9/01)
Investment Guidelines and Policy Appendix APortfolio Diversification
Page 89

Investment Dollar Percent of Target Strategy/Prof. Trailing 4 Qtr. Rolling 3 Year Perf. Rolling 3 Year Perf. Rolling 5 Year Perf. Rolling 5 Year Perf.Manager Allocation Total Allocation Changes (Mgr. v. Index) vs. Bench. (6/12) vs. Peer Median (6/12) vs. Bench. (6/12) vs. Peer Median (6/12)
Sands Select Growth - LCG $32,778,516 6.5% 10.0% None 1.9% Pass Pass Pass Pass
Northern Trust - LCG 1 $39,939,631 7.9% 10.0% None -3.7% Fail Pass Pass Pass
Horizon - LCV $36,167,112 7.1% 10.0% None 4.5% Fail Fail Fail Fail
Russell 1000 Value ETF - LCV $35,370,520 7.0% 10.0% None -0.4% Fail Pass Fail Fail
IronBridge Capital - SCC 1 $43,587,160 8.6% 3.8% None -3.2% Fail Fail Pass Pass
Advisory Research - SCV 1,2 $61,155,089 12.1% 6.3% None -4.5% Fail Fail Pass Fail
NT ACWI ex-US - IE 3 $20,435,889 4.0% 10.0% None -0.1% Fail Fail Fail Fail
Thornburg Intl. - IE $21,718,266 4.3% 10.0% None -4.5% Pass Pass Pass Pass
Newfleet - CB 1 $54,596,488 10.8% 10.0% None 2.3% Pass Pass Pass Fail
Taplin, Canida, Habacht - CB 1 $58,559,624 11.6% 10.0% None 5.2% Pass Pass Pass Pass
PIMCO - CB 1 $50,773,585 10.0% 10.0% None 4.2% Pass Pass Pass Pass
Victory Capital - Conv 1 $50,865,648 10.1% 0.0% None 1.1% Pass Fail Fail Fail
1 Upon completion of the Asset-Liability Study, these strategies will be liquidated or reduced to provide funds for new allocations.2 Relative performance of the account was negatively impacted in 2009 and 2010 due to the manager's preference for high quality companies while lower quality issues rallied during the market rec3 The Artio Fund was liquidated in November 2012 and the proceeds transitioned to the Northern Trust ACWI ex-US commingled fund temporarily.
Watchlist Performance Criteria
Public Health Trust/Jackson Health SystemInvestment Manager Review (net of fees)
March 31, 2013
Page 90

On the following pages is a summary and detailed analysis of the Public Health Trust’s (PHT) investment managers, showing the overall health of each fund. The analysis demonstrates how each fund measures up to the criteria established in the PHT’s investment policy
Public Health TrustFund Evaluation Overview
health of each fund. The analysis demonstrates how each fund measures up to the criteria established in the PHT s investment policy statement and HEK’s standard selection criteria.
In the following grid, a check mark (√) indicates that the fund is meeting objective criteria. A comment (C) indicates that there is an issue to be noted, while an exception (E) indicates the fund does not meet criteria. In either case, relevant issues would be described on the following pages of this report. Below are the guidelines for each criteria reviewed.
Organizational Stability: The investment management organization should have a stable corporate structure.
Management Team Stability: The specific team managing a strategy for the PHT should have consistent manager tenure.
Diversification: Investment managers should not invest more than 5% of the PHT’s total equity portfolio in the stock of one company, except to the extent a higher percentage of the same issue is included in a nationally-recognized market index and is otherwise permissible under the Florida Statues. Moreover, not more than 25% of the PHT’s total equity portfolio shall be invested in a single economic sector unless authorized by the PHT. For fixed income securities, other than AAA-rated sovereign debt and Agency obligations, investment managers should not invest more than 5% of the PHT’s fixed income portfolio in the securities of a single issuer at market, unless authorized by the PHT.
Quality: At least 90% of the PHT’s core fixed income portfolio should be classified as investment grade at time of purchase. However, aninvestment in high yield securities may be permissible in so far that it does not exceed allowances outlined in the Florida Statutes.
Consistency of Style: The investment style of a strategy used in the PHT should be consistent with the desired asset class.
Performance, Benchmark Index and Peer Group: An active investment manager's performance should be equal to or above an appropriate benchmark index and peer group median over the majority of rolling five-year periods under review. In addition, an active investment manager’s performance should be competitive relative to the benchmark index and peer group median over rolling three-year periods. An active investment manager will be placed on formal watch status should rolling three-year performance fail to meet the criteria stated above. An index manager’s performance should be competitive with that of the respective benchmark index.
Risk: Investment managers are expected to have a level of risk that is similar to or less than the benchmark index, which is defined in the PHT’s Investment Policy Statement as less than 120% of the standard deviation of an appropriate benchmark index. Risk is generally defined as the volatility or standard deviation of returns.
Page 91

Public Health Trust/Jackson Health SystemFund Evaluations Versus Policy Guidelines
As of March 31, 2013
Recomm
endation
Organizational
Stability
Managem
ent
Team Stability
DiversificationQuality
Consistency of
Style
Index - 5 Yr
Rolling 1Benchm
ark
Index - 3 Yr
Rolling 1Benchm
ark5 Yr Rolling 1Peer Group3 Yr Rolling 1Peer Group -
Risk
People Process PerformanceFund Asset Class
Newfleet Fixed Income: Core Retain C √ √ √ √ 92% √ 100% √ 33% √ 83% √ √
Taplin, Canida &Habacht Fixed Income: Core Retain √ √ √ √ √ 100% √ 100% √ 100% √ 100% √ √
PIMCO Total Return Inst Fixed Income: Core Retain √ √ √ √ √ 100% √ 92% √ 100% √ 100% √ √
Victory Convertible SecuritiesFixed Income: Convertibles Remove E √ √ √ √ 0% E 50% √ 0% E 0% E √
HorizonU.S. Equities: Large Cap Value Watch √ √ C N/A √ 0% E 8% E 0% E 17% E √
iShares Russell 1000 Value Fund2U.S. Equities: Large Cap Value Replace C √ √ N/A √ - √ - √ - √ - √ √
Northern Trust Large Cap GrowthU.S. Equities: Large Cap Growth Retain √ √ C N/A √ 83% √ 25% √ 83% √ 75% √ √
Sands Capital ManagementU.S. Equities: Large Cap Growth Retain √ √ C N/A √ 100% √ 100% √ 100% √ 100% √ √
Advisory ResearchU.S. Equities: Small Cap Value Retain C √ √ N/A √ 58% √ 8% E 0% E 0% E √
IronBridge Capital ManagementU.S. Equities: Small Cap Core Retain √ √ √ N/A √ 75% √ 25% √ 75% √ 8% √ √
Northern Trust ACWI ex-US Fund3 Foreign Equities Replace √ √ √ N/A √ - √ - √ - √ - √ √
Thornburg International Value I Foreign Equities Retain √ √ √ N/A √ 100% √ 100% √ 100% √ 83% √ √
E: Exception noted; C: Comment Noted.√: Meeting policy review guidelines%: % of rolling periods above objective1 Performance composites used for products with insufficent history within the PHT2 Replace with less expensive, passively managed fund.3 The Northern Trust ACWI ex-US Fund was selected as a temporary replacement for the Artio International Fund.
People Process Performance
Page 92

NewfleetComment – Organizational Stability: In November 2012, David Albrycht, previously CIO of Newfleet, was given the newly created title of president and the responsibility of overseeing the growth of the firm. In January 2013, Bob Bishop was promoted to CIO and portfolio strategist of the firm. He will continue to work closely the remaining portfolio managers on the firm’s Core Fixed Income strategy.
VictoryException – Organizational Stability: In February 2013, Victory Capital Management announced that the employees of the firm had partnered with Crestview Partners, a leading private equity firm, to acquire all of KeyCorp’s interest in Victory. Upon completion of the transaction, Victory will be an independent firm with the senior management team, portfolio managers and other employees owning a significant amount of the outstanding equity. Under the new ownership structure, Dave Brown will assume the role of Chief Executive Officer and Chris Ohmacht will assume the role of President. There will be no changes to the individual Chief Investment Officers, investment teams or their investment process as a result of this transaction.
Exception – Benchmark Index and Peer Group: The account’s return of 7.0 percent for the most recent quarter outperformed the 6.6 percent return of the Bank of America Merrill Lynch Convertible Bonds Index and placed in the top half of the peer group. The portfolio’s delta, which was higher than that of the benchmark, led to outperformance in this quarter of sharply rising equity prices. Performance over the one-year period ending March 31, 2013 was mixed as the account outpaced the index by 110 basis points, but placed in the bottom half of the peer group. Poor relative performance in 2008, when the separate account composite lagged the benchmark by 1,111 basis points, weighs heavily on long-term comparisons. The composite lags the benchmark for all rolling five-year periods, placing in the bottom half of the peer group for all of those same observations. It outperforms the index for the three- and ten-year periods ending March 31, 2013; however, it places in the bottom third of the peer group for the three-, five-, seven- and ten-year periods.
HorizonComment – Diversification: At the end of the quarter, the portfolio’s weighting to the consumer discretionary sector was 54.2 percent of assets, more than 6 times the representation in the Russell 1000 Value Index.
Exception – Benchmark Index and Peer Group: The account again outperformed the Russell 1000 Value Index and ranked in the top third of large cap value managers for the first quarter, returning 12.4 percent compared to a gain of 12.3 percent for the benchmark and 11.5 percent for the peer group median manager. The portfolio continued to benefit from a large overweight allocation to the consumer discretionary sector this quarter and the account’s holdings in that sector also outpaced their benchmark counterparts. The account also bests the benchmark and ranks near the top of the peer group for the one-year period ending March 31, 2013. Poor relative performance in 2008 and 2011 has impacted long-term comparisons. The account trails the index and places in the bottom decile of the peer group for nearly all rolling three-year periods. It also underperforms the index and places in the bottom decile of the peer group for the trailing five- and seven-year periods ending March 31, 2013.
Public Health Trust/Jackson Health SystemDiscussion of Comments and Exceptions
For Period Ending March 31, 2013
Page 93
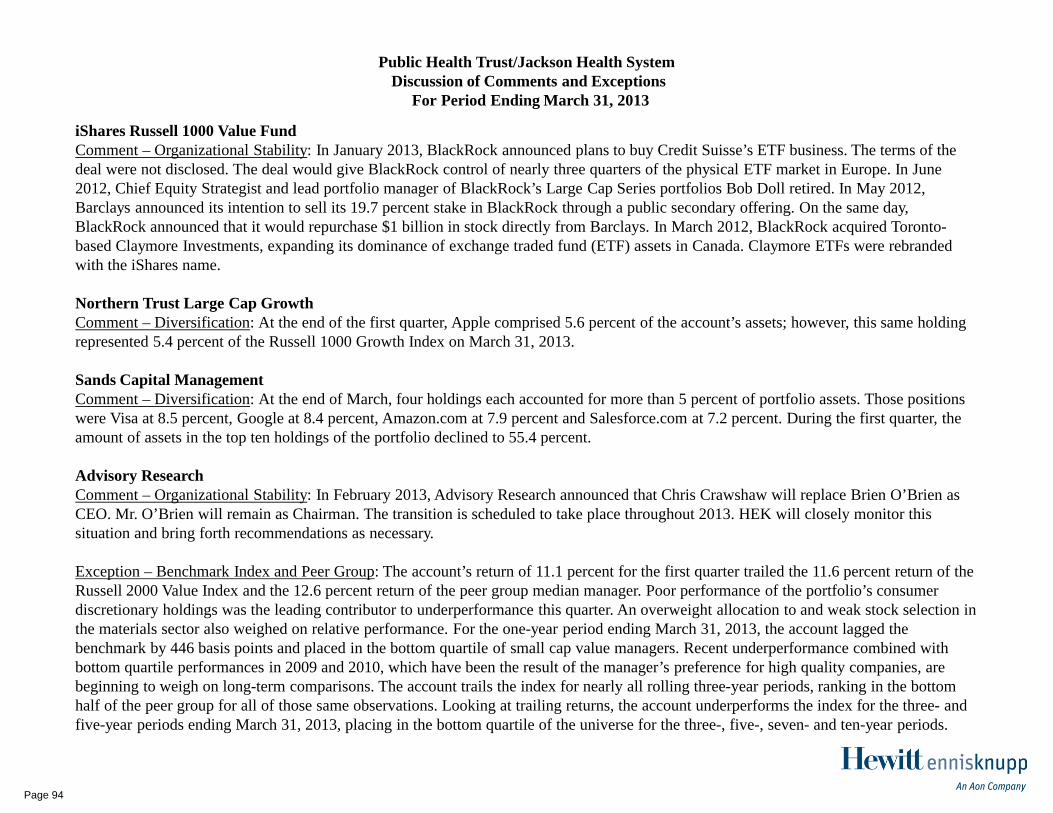
iShares Russell 1000 Value FundComment – Organizational Stability: In January 2013, BlackRock announced plans to buy Credit Suisse’s ETF business. The terms of the deal were not disclosed. The deal would give BlackRock control of nearly three quarters of the physical ETF market in Europe. In June 2012, Chief Equity Strategist and lead portfolio manager of BlackRock’s Large Cap Series portfolios Bob Doll retired. In May 2012, Barclays announced its intention to sell its 19.7 percent stake in BlackRock through a public secondary offering. On the same day, BlackRock announced that it would repurchase $1 billion in stock directly from Barclays. In March 2012, BlackRock acquired Toronto-based Claymore Investments, expanding its dominance of exchange traded fund (ETF) assets in Canada. Claymore ETFs were rebrandedwith the iShares name.
Northern Trust Large Cap GrowthComment – Diversification: At the end of the first quarter, Apple comprised 5.6 percent of the account’s assets; however, this same holding represented 5.4 percent of the Russell 1000 Growth Index on March 31, 2013.
Sands Capital ManagementComment – Diversification: At the end of March, four holdings each accounted for more than 5 percent of portfolio assets. Those positions were Visa at 8.5 percent, Google at 8.4 percent, Amazon.com at 7.9 percent and Salesforce.com at 7.2 percent. During the first quarter, the amount of assets in the top ten holdings of the portfolio declined to 55.4 percent.
Advisory ResearchComment – Organizational Stability: In February 2013, Advisory Research announced that Chris Crawshaw will replace Brien O’Brien as CEO. Mr. O’Brien will remain as Chairman. The transition is scheduled to take place throughout 2013. HEK will closely monitor this situation and bring forth recommendations as necessary.
Exception – Benchmark Index and Peer Group: The account’s return of 11.1 percent for the first quarter trailed the 11.6 percent return of the Russell 2000 Value Index and the 12.6 percent return of the peer group median manager. Poor performance of the portfolio’s consumer discretionary holdings was the leading contributor to underperformance this quarter. An overweight allocation to and weak stock selection in the materials sector also weighed on relative performance. For the one-year period ending March 31, 2013, the account lagged thebenchmark by 446 basis points and placed in the bottom quartile of small cap value managers. Recent underperformance combined with bottom quartile performances in 2009 and 2010, which have been the result of the manager’s preference for high quality companies, are beginning to weigh on long-term comparisons. The account trails the index for nearly all rolling three-year periods, ranking in the bottom half of the peer group for all of those same observations. Looking at trailing returns, the account underperforms the index for the three- and five-year periods ending March 31, 2013, placing in the bottom quartile of the universe for the three-, five-, seven- and ten-year periods.
Public Health Trust/Jackson Health SystemDiscussion of Comments and Exceptions
For Period Ending March 31, 2013
Page 94

Market Value PHT FRS Pension FRS Investment Plan$506.6 Million $133.6 Billion $7.9 Billion
Annualized Net Performance PHT FRS Pension FRS Investment Plan1 Year 12.8% 10.9% 8.3%
3 Year 9.1% 9.4% 7.6%
5 Year 5.2% 4.8% 4.3%
10 Year 8.7% 8.6% 7.5%
Broad Asset Allocation PHT FRS Pension FRS Investment PlanGlobal Equity 57.5% 57.6% n/a
Fixed Income & Cash 32.5% 25.0% n/aInv. Grade Convertibles 10.0% 0.0% n/a
Real Estate 0.0% 7.6% n/aPrivate Equity 0.0% 5.0% n/a
Strategic (e.g. Hedge Funds, Etc.) 0.0% 4.8% n/a100.0% 100.0% n/a
Public Health Trust/Florida Retirement System ComparisonInformation as of March 31, 2013
Page 95

Manager Search Report
Public Health Trust/Jackson Health System | First Quarter 2013

Consultant Analyst Rebecca M. King, CEBS Sean Lynch, CFA, CAIA Hewitt EnnisKnupp Hewitt EnnisKnupp 4130 Parklake Avenue 4130 Parklake Avenue Suite 110 Suite 110 Raleigh, NC 27612 Raleigh, NC 27612 Phone: (919) 786-6270 Phone: (919) 786-6257 Fax: (847) 953-2543 Fax: (847) 953-4951 [email protected] [email protected] Note: The data and other information presented in this report have been obtained, either directly or indirectly, from the custodian and/or investment manager. HEK believes the information to be accurate and has compared this information to the managers’ reported returns. HEK has not conducted any type of additional audit to ensure the information’s accuracy and cannot warrant its accuracy or completeness. Additionally, Russell Investment Group is the source and owner of Russell index data contained or reflected in this material and all trademarks and copyrights related thereto. The Russell material may contain confidential information and unauthorized use, disclosure, copying, dissemination or redistribution of Russell data is strictly prohibited. This is an HEK presentation of the data. Russell Investment Group is not responsible for the formatting or configuration of this material or for any inaccuracy in presentation thereof.

Table of Contents
Executive Summary Section 1
Large Cap Value Domestic Equity (Passive) Section 2

Executive Summary
Page 1

Due to the high expense ratio and commissions associated with trading the iShares Russell 1000 Value Index Fund, the Committee elected to replace the product. HEK has performed a search to identify lower-cost options. This report presents the results of our search.
HEK’s first goal in the screening process was to identify a list of superior managers for the asset class. We used the Manager Research Process criteria discussed on the following pages in order to identify an initial list of candidates for further investigation. The shorter list of candidates was then further evaluated on a qualitative and quantitative basis to identify finalist candidates. The following candidates are considered best-in-class for the asset class by HEK and are shown in alphabetical order. The terms Option 1 and Option 2 are not indications of preference by HEK:
Public Health Trust/Jackson Health SystemManager Search Report
Executive Summary
Asset Class Incumbent ProductFund Assets as of
March 31, 2013
Percentage of Plan Assets as of March 31, 2013
Large Cap Value Domestic Equity
(Passive)
iShares Russell 1000 Value Index
$35,370,520 7.0%
Asset Class Best-in-Class Option 1 Best-in-Class Option 2
Large Cap Value Domestic Equity (Passive)
BlackRock Russell 1000 Value Index (CF)
Vanguard Russell 1000 Value Index (MF)
Note: SA = Separate Account, CF = Commingled Fund, MF = Mutual Fund
Page 2
Hewitt EnnisKnupp’s Global Manager Research Team focuses the majority of its research budget on qualitative assessment, striving to thoroughly understand the organizations and teams that are responsible for investment performance. Special emphasis is placed on understanding the incentive structure and team dynamic to determine the likelihood of team stability. In addition, Hewitt EnnisKnupp’s Global Manager Research Team focuses on obtaining a thorough understanding of the research and investment process. In doing so, we are able to effectively evaluate periods of relative performance deviations thereby allowing for valuable proactive consulting for clients rather than a "chasing performance" mentality that plagues many investors. To truly understand investment management firms, it is the Global Manager Research Team’s belief that time must be spent face to face with the people at these organizations to determine their talent and commitment to client results.
Our researchers also spend a lot of time quantitatively analyzing managers. The quantitative analysis is not performance screening to find "hot" managers. The team utilizes a variety of proprietary and third-party databases to measure risk and performance to better understand how a product performs and if it is in line with the style of management it pursues. The team runs portfolio attribution at the holdings level in an attempt to better understand drivers of results and challenge portfolio managers on their research and portfolio positioning.
By evaluating these quantitative measures, the team gains a better understanding of how a manager may perform in a certain environment or how well a manager should fit within a portfolio context. Furthermore, an ongoing evaluation of qualitative and quantitative characteristics helps to evaluate if a manager continues to provide the benefits for which it was originally hired.
This dual evaluation allows the Global Manager Research Team to give clients a clear and accurate picture of the investment managers. Five areas of focus are extensively probed: organization, investment teams, investment process, risk considerations, and performance. This is accomplished via a lengthy on-site interview process by multiple researchers.
Hewitt EnnisKnupp’s Global Manager Research Team’s manager evaluation is depicted in a chart on the following page.
Manager Search ReportManager Research Process
Page 3

The chart above summarizes the systematic approach the team follows, which is an ongoing process of continually monitoring the fund management marketplace.
Manager Search ReportManager Research Process
Step 1:Initial inputs
• News flow• Quantitative screens• Independent analysis
of portfolios Step 2: Pre-meeting• Discuss key issues
• Set the agenda• Share with manager
Step 3:Manager visit
• We ask the questions• Listen to the answers
Step 4:Post meeting
• Do they do what they say they do?
• Rating recommendation
Step 5:Rating decision
• Full airing of issues with consultants and
specialists
Step 6:Rating sheet
• Review and update• Share with manager
Step 7:Consultant feedback
• Meetings• Manager selections
Global manager monitor database
Page 4

Manager Selection Process
When presenting clients with possible managers in which to invest, we select candidates from our approved/buy-rated list. In reviewing investment manager candidates for possible approval/buy-rated status, we focus on firms meeting the following criteria:
High caliber team with competitive advantageSound investment philosophy and processCompetitive feesStability and reputation of the organizationStability and reputation of the professionalsStrong risk control systemsRobust back office and operational controlsReasonable transparencyExperience managing institutional portfoliosAttractive performance recordOpen to new investors
Each of the candidates we are presenting have gone through our full due diligence process and are approved.
Manager Search ReportManager Research Process
Page 5

Large Cap Value Domestic Equity (Passive)
Page 6

Public Health Trust/Jackson Health SystemManager Search Report
Large Cap Value Domestic Equity (Passive)
HEK has performed a search in the Large Cap Value Domestic Equity asset class in order to identify lower-cost index fund candidates to replace the current iShares Russell 1000 Value Index Fund in the Plan.
Benchmark: The investment objective is to track the performance of the Russell 10000 Value Index, which measures the investment return of value-oriented large-capitalization stocks.
Investments: The portfolio will invest primarily in the common stocks of U.S. companies with capitalizations that mirror the cap range of companies included in the Russell 1000 Value Index.
Economic Sector Weights: The portfolio will generally maintain sector weights similar to the Russell 1000 Value Index. The portfolio should be diversified with respect to economic and industry sectors or individual holdings.
Primary Screening Criteria:
ØCostØTracking Error versus the Russell 1000 Value IndexØMinimum of 3 years’ performance history; 5 years preferredØFund managers in which HEK has confidenceØOpen for investment
The total investment in the incumbent fund is $35,370,520 or 7.0% of Plan assets as of March 31, 2013.
Page 7

Firm HistoryBlackRock is a premier provider of asset management, risk management, and advisory services to institutional, intermediary, and individual clients worldwide. As of 31 December 2012, the firm managed $3.79 trillion across equity, fixed income, real estate, liquidity, alternatives, and asset allocation/balanced strategies in separate accounts, mutual funds and other pooled investment vehicles, and the industry-leading iShares exchange-traded funds. Through BlackRock Solutions, the firm provides risk management and advisory services that combine capital markets expertise with proprietarily-developed systems and technology. Substantial resources are allocated to ongoing development of technology and analytical capabilities for internal users and external clients. BlackRock Solutions provides risk management and enterprise investment services for $13.7 trillion in assets.
BlackRock was founded in 1988 on the belief that experienced professionals using a disciplined investment process and sophisticated analytical tools can consistently add value to client portfolios. Within this framework, the firm has assembled teams of experienced investment professionals. The "One BlackRock" approach enables these teams to leverage resources of the organization worldwide to meet its clients' objectives. Investment capabilities are complemented by a senior-level commitment to client service. Since its founding, BlackRock has sought to better serve clients by anticipating and responding to changes and advances in the investment industry, and it continually seeks to broaden and deepen the firm's investment and risk management capabilities. The two most significant steps in this process have been the mergers with Merrill Lynch Investment Managers (MLIM) in 2006 and Barclays Global Investors (BGI) in 2009. Today's BlackRock combines the history, experience, and innovation of each of these firms.
BlackRock serves clients in North and South America, Europe, Asia, Australia, Africa, and the Middle East. Headquartered in New York, the firm has over 100 investment teams in in 28 countries. Clients include corporate, public, and union pension plans, insurance companies, mutual funds, endowments, foundations, charities, corporations, official institutions, and individuals worldwide.
Philosophy & ProcessBlackRock’s objective is to deliver high quality and cost effective index-based solutions to their clients. To accomplish this goal, BlackRock focuses on three objectives in the management of all of its index funds: minimizing tracking error, minimizing transaction costs, and minimizing investment and operational risks. BlackRock believes that superior investment outcomes can most reliably be achieved through Total Performance Management – the management of return, risk, and cost. Through all of their index funds, every single portfolio and investment process is constantly evaluated and re-evaluated with this philosophy in mind. They use quantitative management techniques to deliver superior returns to all their clients. Using sophisticated computer-driven techniques, they ensure that all their ideas are both theoretically sound and empirically valid.
In practice, Total Performance Management serves as a guiding principle in determining the most appropriate approach for managing assets against an index. The portfolio construction techniques that BlackRock employs are tailored to the specific benchmark and are designed to deliver a high level of diversification within and across markets, close benchmark tracking, low turnover, and minimal transactions costs. In short, their approach to index management is to create the best possible index fund, taking into account the costs and risks associated with implementing the strategy.
Public Health Trust/Jackson Health SystemManager Search Report
Large Cap Value Domestic Equity (Passive)BlackRock Russell 1000 Value Index
Page 8

Firm HistoryThe Vanguard Group began operations on May 1, 1975, with John C. Bogle at the helm, but their heritage extends back to 1929 with the inception of the Wellington Fund. Net assets grew from $1.8 billion in 1975 to more than $1.7 trillion as of December 2011. A company that began its operations with just 40 people on the payroll now has more than 13,000 dedicated staff members at 3 U.S. locations and 12 international offices.
Philosophy & ProcessThe Vanguard Russell 1000 Value Index Fund is designed for investors who want a low-cost method of consistently paralleling the return of the Russell 1000 Value Index. The portfolio provides its investors with broad diversification and significantly less specific risk than a more concentrated fund.
The Vanguard Russell 1000 Value Index Fund is passively administered using a “full replication” approach. Under this method, the portfolio holds all of the underlying securities in proportion to their weighting in the index. Full replication significantly reduces the risk that the portfolio will perform differently from the index.
The portfolio remains fully invested in equities at all times. The portfolio manager does not make judgment calls on the direction of the Russell 1000 Value Index. Because of this discipline, the Vanguard Russell 1000 Value Index Fund has closely tracked the index, even while accommodating cash flows.
Public Health Trust/Jackson Health SystemManager Search Report
Large Cap Value Domestic Equity (Passive)Vanguard Russell 1000 Value Index
Page 9

Public Health Trust/Jackson Health SystemManager Search Report
Large Cap Value Domestic Equity (Passive)As of March 31, 20131
Firm
StrategyVehicleInception DateStrategy Assets ($m)
Portfolio Manager(Tenure Managing Strategy)
FeePeer Group Fee:Average | Median2 0.58% 0.52% 0.58% 0.52% 0.58% 0.52%
Russell 1000 Value IndexCommingled FundNovember 1, 1991
BlackRock
iShares Russell 1000 Value IndexExchange Traded Fund (IWD)
May 22, 2000
BlackRock
Strategy Information
0.06% 0.20%3
$8,026
Corin Frost (15)Creighton Jue (13)
$16,950
Management Team (3)
0.08%
Vanguard
Russell 1000 Value IndexMutual Fund (VRVIX)September 22, 2010
$746
Michael Johnson (3)
1 Certain data may not be as of 3/31/2013.2 $ W i ht d A d $ W i ht d M di d E ti t d i M i t2 $ Weighted Average and $ Weighted Median used. Expense ratios were created using Morningstar data as of 12/31/12. For complete information on HEK methodologies and additional information on the expense ratio distributions, contact your investment consultant.3 Does not include additional commission of $.01 per share for every transaction.
Page 10

-4.0
-2.0
0.0
2.0
4.0
6.0
8.0
10.0
12.0
14.0
16.0
18.0
20.0
22.0
24.0
Re
turn
1Quarter
1Year
3Years
5Years
7Years
10Years
¢£ BlackRock Russell 1000 Value Index 12.30 (14) 18.80 (5) 12.87 (6) 5.02 (31) 4.34 (33) 9.30 (18)
� Vanguard Russell 1000 VaIue Index Inst 12.28 (15) 18.67 (5) N/A N/A N/A N/A
pr iShares Russell 1000 Value Index (ETF) 12.22 (18) 18.52 (6) 12.53 (7) 4.72 (40) 4.05 (39) 9.02 (25)
¿̄ Russell 1000 Value Index 12.31 (14) 18.77 (5) 12.74 (6) 4.85 (35) 4.19 (37) 9.18 (20)
5th Percentile 12.75 18.61 13.02 6.62 5.74 10.29
1st Quartile 11.88 16.49 11.67 5.29 4.58 8.95
Median 11.27 15.25 10.55 4.17 3.65 8.24
3rd Quartile 10.59 13.81 9.20 2.89 2.54 7.28
95th Percentile 9.58 10.90 7.29 1.39 0.84 5.93
Public Health Trust/Jackson Health System
Peer Group Analysis - Trailing Period PerformanceIM U.S. Large Cap Value Equity (MF)
As of March 31, 2013
Parentheses contain percentile rankings.Returns are annualized for periods greater than one year.
Page 11

-60.0
-40.0
-20.0
0.0
20.0
40.0
60.0
70.9
Re
turn
YearTo
Date2012 2011 2010 2009 2008 2007 2006 2005 2004
¢£ BlackRock Russell 1000 Value Index 12.30 (14) 17.59 (23) 0.48 (24) 15.71 (15) 20.12 (70) -36.75 (48) -0.02 (63) 22.25 (6) 7.15 (26) 16.51 (13)
� Vanguard Russell 1000 VaIue Index Inst 12.28 (15) 17.42 (25) 0.30 (26) N/A N/A N/A N/A N/A N/A N/A
pr iShares Russell 1000 Value Index (ETF) 12.22 (18) 17.28 (27) 0.21 (27) 15.30 (20) 19.64 (73) -36.83 (48) -0.29 (64) 22.00 (8) 6.92 (29) 16.28 (15)
¿̄ Russell 1000 Value Index 12.31 (14) 17.51 (24) 0.39 (25) 15.51 (17) 19.69 (73) -36.85 (49) -0.17 (64) 22.25 (6) 7.05 (28) 16.49 (13)
5th Percentile 12.75 19.44 5.82 17.90 39.87 -30.65 8.63 22.28 10.73 17.98
1st Quartile 11.88 17.40 0.31 14.72 27.72 -34.78 3.89 20.06 7.20 14.92
Median 11.27 15.63 -2.15 12.86 24.10 -36.91 1.57 17.98 5.06 12.94
3rd Quartile 10.59 13.85 -4.58 11.45 19.48 -40.30 -1.64 15.78 3.61 10.44
95th Percentile 9.58 9.37 -8.49 9.60 14.90 -48.76 -6.51 12.93 1.76 8.52
Population 481 472 477 495 497 536 517 506 485 437
Public Health Trust/Jackson Health System
Peer Group Analysis - Calendar Year PerformanceIM U.S. Large Cap Value Equity (MF)
As of March 31, 2013
Returns are expressed as percentages.
Page 12

BlackRock Russell 1000 Value Index iShares Russell 1000 Value Index (ETF) Russell 1000 Value Index
0.0
25.0
50.0
75.0
100.0
Re
turn
Pe
rce
nti
le R
an
k
6/08 9/08 12/08 3/09 6/09 9/09 12/09 3/10 6/10 9/10 12/10 3/11 6/11 9/11 12/11 3/12 6/12 9/12 12/12 3/13
Public Health Trust/Jackson Health System
Rolling Percentile RankingIM U.S. Large Cap Value Equity (MF)
12 Quarters Rolling Periods As of March 31, 2013
Vanguard Russell 1000 Value Index Fund not shown due to short history of the product.
Page 13

Peer Group Scattergram
Historical Statistics
0.0
2.0
4.0
6.0
8.0
10.0
12.0
13.8
Re
turn
(%
)
7.0 8.0 9.0 10.0 11.0 12.0 13.0 14.0 15.0 16.0 17.0 18.0 19.0
Risk (Standard Deviation %)
ReturnStandardDeviation
¢£ BlackRock Russell 1000 Value Index 11.64 14.31
� Vanguard Russell 1000 VaIue Index Inst 11.47 14.32
pr iShares Russell 1000 Value Index (ETF) 11.34 14.29
¿̄ Russell 1000 Value Index 11.56 14.32
¾ Median 9.26 15.02
ReturnStandardDeviation
Alpha Beta R-SquaredTracking
ErrorInformation
RatioSharpeRatio
DownsideRisk
BlackRock Russell 1000 Value Index 11.64 14.31 0.08 1.00 1.00 0.04 1.69 0.84 8.60
Vanguard Russell 1000 VaIue Index Inst 11.47 14.32 -0.08 1.00 1.00 0.03 -2.59 0.83 8.63
iShares Russell 1000 Value Index (ETF) 11.34 14.29 -0.17 1.00 1.00 0.04 -4.55 0.82 8.61
Russell 1000 Value Index 11.56 14.32 0.00 1.00 1.00 0.00 N/A 0.83 8.61
90 Day U.S. Treasury Bill 0.07 0.02 0.07 0.00 0.02 14.33 -0.83 N/A 0.01
Public Health Trust/Jackson Health System
Large Cap Value Domestic Equity (Passive)
2 Years Ending March 31, 2013
Page 14

Portfolio Behind
Months Benchmark Down(10)
Portfolio AheadFull Period Return
Months Benchmark Up(14)
Portfolio BehindPortfolio Ahead
Portfolio BenchmarkNo.
MonthsAverageAhead
No.Months
AverageBehind
No.Months
AverageAhead
No.Months
AverageBehind
BlackRock Russell 1000 Value Index 11.64 11.56 7 0.01 7 -0.01 9 0.01 1 -0.01
Vanguard Russell 1000 VaIue Index Inst 11.47 11.56 0 0.00 14 -0.01 2 0.00 8 -0.01
iShares Russell 1000 Value Index (ETF) 11.34 11.56 0 0.00 14 -0.02 1 0.01 9 -0.01
BlackRock Russell 1000 Value Index Vanguard Russell 1000 VaIue Index Inst iShares Russell 1000 Value Index (ETF)
99.2
99.4
99.6
99.8
100.0
100.2
100.3
Up
Ma
rke
t C
ap
ture
Ra
tio
(%
)
99.6 99.7 99.8 99.9 100.0 100.1 100.2 100.3 100.4
Down Market Capture Ratio (%)
Up Down Market Bar Chart
BlackRock Russell 1000 Value Index Vanguard Russell 1000 VaIue Index Inst
iShares Russell 1000 Value Index (ETF) Russell 1000 Value Index
0.0
2.0
4.0
6.0
-2.0
-4.0
-5.2
Ave
rag
e R
etu
rn (
%)
14 Up Months 10 Down Months
3.7
-2.8
3.7
-2.8
3.7
-2.8
3.7
-2.8
Public Health Trust/Jackson Health System
Up/Down MarketsVersus Russell 1000 Value Index
2 Years Ending March 31, 2013
Page 15

SPECIAL PUBLIC HEALTH TRUST FINANCIAL RECOVERY BOARD
PUBLIC HEALTH TRUST FINANCIAL RECOVERY BOARD
SPECIAL MEETING PUBLIC HEALTH TRUST FINANCIAL RECOVERY BOARD
Ira C. Clark Diagnostic Treatment Center
Conference Room 259 1080 N. W. 19th Street Miami, Florida 33128
May 23, 2013 – 8:30 a.m.
AGENDA 1. Special Meeting Call To Order (Marcos Jose Lapciuc, Chairperson, Public Health Trust Financial Recovery Board) 2. Resolution Recommended To Be Approved
(a) Resolution approving revised Public Health Trust Financial Recovery Board Committee
Assignments, as of April 23, 2013 (Marcos Jose Lapciuc, Chairperson, Public Health Trust Financial Recovery Board
3. Special Meeting Call To Adjourn
(Marcos Jose Lapciuc, Chairperson, Public Health Trust Financial Recovery Board)

1. Special Meeting Call To Order

2. Resolution Recommended To Be Approved

Agenda Item 2 (a) Special PHT Financial Recovery Board
May 23, 2013
RESOLUTION NO. PHT 05/13 –
RESOLUTION APPROVING REVISED PUBLIC HEALTH TRUST FINANCIAL RECOVERY BOARD COMMITTEE ASSIGNMENTS, AS OF MAY 23, 2013
(Marcos Jose Lapciuc, Chairperson, Public Health Trust Financial Recovery Board)
WHEREAS, in accordance with Section 25A-9 of the Code of Miami-Dade County, the Public Health Trust
Financial Recovery Board (“Financial Recovery Board”) have committees to assist in the work; and
WHEREAS, the Financial Recovery Board has created its committee structure and the Chairperson of the Board has
made revisions to the committee assignments as recommended in the attached Public Health Trust Financial Recovery Board 2013
Committee Assignments (revised May 23, 2013) and recommends approval.
NOW, THEREFORE, BE IT RESOLVED BY THE FINANCIAL RECOVERY BOARD OF THE PUBLIC
HEALTH TRUST OF MIAMI-DADE COUNTY, FLORIDA, that this Board hereby approves the revised committee assignments for
the Financial Recovery Board as submitted by its Chairperson, a copy of which is attached hereto and incorporated herein by
reference. The committee assignments shall become effective immediately.

PHT FINANCIAL RECOVERY BOARD 2013 COMMITTEE ASSIGNMENTS
OVERSIGHT
PLANNING
OVERSIGHT
QUALITY
OVERSIGHT
FINANCIAL OVERSIGHT
OPERATIONS OVERSIGHT
MANDATED BY TRUST
ORDINANCE
STANDING COMMITTEES (MEET MONTHLY)
STRATEGY &GROWTH Chairperson: Marcos J. Lapciuc Vice Chairperson: Mojdeh L. Khaghan Members: Joe Arriola Michael Bileca Irene Lipof Stephen S. Nuell Darryl K. Sharpton
JOINT CONFERENCE & EFFICIENCIES Chairperson: Stephen S. Nuell Vice Chairperson: Joe Arriola Members: Michael Bileca Mojdeh L. Khaghan Marcos J. Lapciuc Irene Lipof Darryl K. Sharpton
FISCAL Chairperson: Joe Arriola Vice Chairperson: Darryl K. Sharpton Members: Michael Bileca Mojdeh L. Khaghan Marcos J. Lapciuc Irene Lipof Stephen S. Nuell
Chapter 25 A Committees
UM ANNUAL OPERATING AGREEMENT (meet as needed) Chairperson: Joe Arriola Members: Mojdeh L. Khaghan Marcos J. Lapciuc FIU ANNUAL OPERATING AGREEMENT (meet as needed) Chairperson: Stephen S. Nuell Members: Mojdeh L. Khaghan Marcos J. Lapciuc
SUBCOMMITTEES AD HOC & OTHER COMMITTEES
AUDIT & COMPLIANCE Chairperson: Mojdeh L. Khaghan Vice Chairperson: Michael Bileca Members: Marcos J. Lapciuc PURCHASING & FACILITIES Chairperson: Darryl K. Sharpton Vice Chairperson: Stephen S. Nuell Members: Joe Arriola Michael Bileca Mojdeh L. Khaghan EXTERNAL AUDITOR SELECTION Chairperson: Joe Arriola Members: Michael Bileca Mojdeh L. Khaghan Marcos J. Lapciuc PENSION PLAN Chairperson: Darryl K. Sharpton Members: Mojdeh L. Khaghan Irene Lipof Carlos A. Migoya Mark T. Knight Duane J. Fitch Peter L.Bermont
JACKSON HEALTH SYSTEM HEALTH PLANS Chairperson: Joe Arriola Members: Michael Bileca Stephen S. Nuell
PHILANTHROPY Chairperson: Stephen S. Nuell Members: Joe Arriola Darryl K. Sharpton
NOTE: Marcos José Lapciuc, Chairperson or in the Chairperson’s absence Darryl K. Sharpton Vice Chairperson, PHT Financial Recovery Board, is an ex-officio voting member on all board committees. Revised: May 23, 2013

3. Special Meeting Call To Adjourn

AUDIT AND COMPLIANCE SUBCOMMITTEE

PUBLIC HEALTH TRUST FINANCIAL RECOVERY BOARD
Audit and Compliance Subcommittee Mojdeh L. Khaghan, Chairperson Michael Bileca, Vice Chairperson Marcos Jose Lapciuc
Date, Time and Location May 23, 2013 – Following the Special PHT Financial Recovery Board meeting Ira C. Clark Diagnostic Treatment Center Conference Room 259
AGENDA
1. Approval of the Previous Meeting Minutes
(Mojdeh L. Khaghan, Chairperson, Audit and Compliance Subcommittee)
(a) *Meeting Minutes as of April 18, 2013 2. *Review and Recommend Approval of KPMG FY12 Management Letter – Jackson Health Plan
(Karen Mitchell, Partner, KPMG and Mark T. Knight, Executive Vice President and Chief Financial Officer, Jackson Health System)
3. *Jackson Health Plan - Medicare Advantage Compliance Program – Board Education
(Diana Salinas, Corporate Director and Chief Compliance Officer, Compliance Department, Jackson Health System)
The agenda items(s) noted with an asterisk (*) indicate that the supporting documents are attached.

1. Approval of the Previous Meeting Minutes

PUBLIC HEALTH TRUST FINANCIAL RECOVERY BOARD Audit and Compliance Subcommittee Mojdeh L. Khaghan, Chairperson Michael Bileca, Vice Chairperson Marcos Jose Lapciuc Date, Time & Location April 18, 2013 – 7:15 a.m. to adjournment Ira C. Clark Diagnostic Treatment Center Conference Room 259
ATTENDANCE
Audit and Compliance Subcommittee Mojdeh L. Khaghan Marcos Jose Lapciuc Excused Michael Bileca Financial Recovery Board Members
Stephen S. Nuell
Jackson Health System Diana Salinas Stephen J. Weimer Mark T. Knight Don S. Steigman KPMG Karen Mitchell
Miami-Dade County Attorneys Valda Christian Christopher Kokoruda

Audit and Compliance Subcommittee Meeting April 18, 2013 Page 2 Meeting Call to Order With a quorum being present, the Audit and Compliance Subcommittee meeting was called to order at 7:19 a.m. by Mojdeh L. Khaghan, Chairperson, Audit and Compliance Subcommittee. 1. Approval of the Previous Meeting Minutes (a) Meeting Minutes as of March 14, 2013
Ms. Khaghan requested a motion to approve the meeting minutes as of March 14, 2013. Mr. Lapciuc moved approval; seconded by Ms. Khaghan, and carried without dissent.
2. Review and Approval of KPMG FY12 Audited Financial Statements – JMH Health Plan
Karen Mitchell, Partner, KPMG reviewed a draft version of the FY12 audited financial statements for the JMH Health Plan (Health Plan). Ms. Mitchell spoke about the minor changes to a couple of the sentences that will be added to some of the disclosures that were not included in the first draft version of the audited financial statements. She pointed out that the changes will not impact the numbers associated with the audited financial statements as well as a format change to the financial statements. Highlights from the audited financial statements included a report on the financial statements, management’s responsibility for the financial statements, auditor’s responsibility, basis for adverse opinion on U.S. Generally Accepted Accounting Principles, Adverse opinion on U.S. Generally Accepted Accounting Principles, opinion on Statutory Basis of Accounting, Emphasis Matter and other matters having to do with the purpose of forming an opinion on the financial statements. Net income from the Health Plan for FY12 totaled approximately $200,000.00, dividends paid were $20 million, and capital contributions were $2.1 million. Ms. Mitchell stated that the Management Letter which will include comments, management responses and corrective action plans will be presented at the next meeting. A detailed copy of the second draft version of the FY12 audited financial statements for the JMH Health Plan was distributed at the meeting. Ms. Khaghan questioned if the approved financial statements will be forwarded to the Office of Insurance Regulation (OIR). Mark T. Knight, Executive Vice President and Chief Financial Officer, replied yes.

Audit and Compliance Subcommittee Meeting April 18, 2013 Page 3
Following the review of the financial statements and discussion, Ms. Khaghan requested a motion to accept and approve the FY12 audited financial statements for the JMH Health Plan. Mr. Lapciuc moved approval; seconded by Ms. Khaghan Mr. Knight stated that in the preparation meeting with Mr. Arriola, who serves as Chairperson of the Fiscal Committee the Health Plan financial statements were discussed particularly as it related to the issuance, bottom line and compliance. The motion carried without dissent. The Subcommittee agreed to forward the FY12 audited financial statements for the JMH Health Plan to the Fiscal Committee with a recommendation to accept and approve.
Audit and Compliance Subcommittee Reporting Process Ms. Khaghan stated for the record that this month is the last month the Audit and Compliance Subcommittee will report in this format to the PHT Financial Recovery Board. The reporting process will be done on a bi-monthly basis unless there is a need to report on an item(s) during the month. Ms. Khaghan further stated that she will continue to meet with Ms. Salinas and Mr. Weimer on a monthly basis prior to the Subcommittee meeting. 3. Corporate Compliance Program Department Update
Diana Salinas, Corporate Director and Chief Compliance Officer, Compliance Department, Jackson Health System, presented the following updates and review of finalized audit:
(a) FY13 Audit Plan Update A summary of the Audit Plan was presented. The FY13 Audit Plan is 23% completed, as of March 31, 2013 one audit was completed and five audits are currently in progress.
(b) Review of Finalized Audit Report (1) #22 Physician Services – Quarter 1
The scope of the audit was to review professional coding and billing of Medicare and Medicaid for items or services not rendered or not provided, submitting claims for services that are not medically necessary or double billing, resulting in duplicate payment. Thirty (30) paid and/or denied Medicare and Medicaid primary encounters were extracted from a universe of claims for inpatient and/or outpatient services. The results of the 30 audits concluded with a zero percent payment error rate, no dollar amount resulted from Medicare or Medicaid underpayment or overpayment.

Audit and Compliance Subcommittee Meeting April 18, 2013 Page 4
(c) Recovery Audit Contractor (RAC) – Quarterly Update The RAC second quarter update showed JHS being in good standing. To date RAC requested 8 encounters which represents a low amount of dollars that are at risk.
(d) FY13 JHS Employee Sanction Report – Quarterly Update
The first quarter (October-December 2012) report showed JHS was 100% compliant. JHS is currently waiting on the second quarter results. As suggested by the Office of Inspector General, the JHS Employee Sanction Report was changed from reporting on an annual basis to a quarterly basis.
(h) JMH Health Plan Employee Monthly Sanction Report At the suggestion of the Office of Inspector General, the JMH Health Plan Employee Sanction Report will be presented on a monthly basis. As of March 2013 the report showed that the JMH Health Plan was 100% compliant.
(e) Hotline Report – Quarterly Report The second quarter report showed that 69 calls were received. Out of the 69 calls received 45 calls were informational and 24 calls resulted in investigation. Out of the 24 calls which resulted in an investigation 8 calls have been investigated and closed and 16 remain open. None of the investigated calls raised serious concern and did not require a report to the Subcommittee.
(f) Berkeley Research Group (BRG) Update The Subcommittee was reminded regarding an assessment from the prior year regarding physician contracting practices which resulted in some areas recommended for correction. A detailed summary of the BRG report was included with the agenda. In a response to the areas recommended for correction the following was completed:
• Implementation of a Third Party Risk Management Module of Compliance 360 (C360) Solution
• Single, Comprehensive Inventory of All Physician Arrangements • Additional Functionality (Easy, secure search and find capabilities for
quick retrieval of information, Automatic audit trail shows date, time and activity for each user including their access and changes to key information, and Configurable online dashboards and reports for monitoring activity and trends.
It is anticipated that the implementation process for improving the physician contracting practices will begin on May 1, 2013.
(g) JMH Health Plan Compliance Update As a result of the areas identified in the corrective action plan by CMS, the JMH Health Plan Executive Compliance Committee approved the JHP Compliance Program Plan, JHP Fraud, Waste and Abuse Program Plan, employed a Fraud, Waste and Abuse Officer, approved JHP Delegation Oversight Committee, approved updated Compliance Policies and Procedures, approved Marketing and Sales Policies and Procedures, and provided marketing sales and customer service required training. Effective April 10, 2013, 69% of the CMS corrective action plan items were completed. It is anticipated that the remaining items targeted for correction will be completed by May 20, 2013.

Audit and Compliance Subcommittee Meeting April 18, 2013 Page 5 4. Internal Audit Update
Stephen J. Weimer, Corporate Director, Internal Audit Department, Jackson Health System presented the following Internal Audit update reports:
(a) FY13 Internal Audit Plan Update
The FY13 Internal Audit Plan is 28% completed, 8 audits have been completed, and 6 audits are in progress. Out of the 6 audits that are in progress 4 will be completed by the end of April 2013. Currently on target to complete the FY13 Internal Audits by October 31, 2013.
(b) Review of Finalized Audit Reports (1) Patient Intake – JMH Operating Room
The objective of the audit was to evaluate the effectiveness and efficiency of internal controls for the first quarter of FY13, which included Admission and Registration, Financial Assessment, Clinical Documentation and Charge Capture. The overall rating based on issues identified was “needs improvement.” The results of the audit revealed potential ineffective controls and inefficiencies in the Charge Capture process. The current process design allows for the charging of medical supplies to patient accounts from two different systems which may result in duplicated and erroneous charges. The audit results included detailed observations, recommendations and management action plans as well as an outline identifying process improvement opportunities. Following the audit results, the Subcommittee was engaged in discussion having to do with inventory being controlled in the Operating Room by Omnicell and some items outside of the Omnicell control, development of a short term solution (discontinue the Omnicell charges and replace it with a manual process in the Operating Room) as well as plans to implement a long term solution (use of Surgi-track which is an outsourcing process), reduction in inventory spending, reduction in supply expenses, and quality and value analysis when switching from one system to another. With regards to maintaining the Operating Room inventory, Ms. Khaghan requested that when the process of maintaining the Operating Room inventory is switched from Omnicell to Surgi-track that the Subcommittee is presented with a formal analysis presentation for purposes of reviewing cost savings.
(2) Monthly Audit Finding Follow-up There was one (1) item listed on the report (Software License Compliance) with no significant information to report. There is a continued trend to review audits targeted for follow-up.

Audit and Compliance Subcommittee Meeting April 18, 2013 Page 6 Meeting Call to Adjourn The meeting of the Audit and Compliance Subcommittee adjourned at 7:46 a.m. Transcribed by Ivenette Cobb-Black Executive Assistant Public Health Trust Financial Recovery Board

DRAFT 5/9/2013 2:24 AM 166173_12_JMHHealthPlanPublicHealthTrust_MWL
April 22, 2013 The Audit Committee of the Financial Recovery Board of The Public Health Trust of Miami-Dade County, Florida Ladies and Gentlemen: We have audited the statutory financial statements of JMH Health Plan, a division of the Public Health Trust of Miami-Dade County, Florida (the Plan) as of and for the year ended December 31, 2012, and have issued our report thereon dated April 22, 2013. In planning and performing our audit of the statutory financial statements of the Plan, in accordance with auditing standards generally accepted in the United States of America, we considered the Plan’s internal control over financial reporting (internal control) as a basis for designing our auditing procedures for the purpose of expressing our opinion on the statutory financial statements, but not for the purpose of expressing an opinion on the effectiveness of the Plan’s internal control. Accordingly, we do not express an opinion on the effectiveness of the Plan’s internal control.
The maintenance of adequate internal control designed to fulfill control objectives is the responsibility of management. Because of inherent limitations in internal control, errors or fraud may nevertheless occur and not be detected. Also, controls found to be functioning at a point in time may later be found deficient because of the performance of those responsible for applying them, and there can be no assurance that controls currently in existence will prove to be adequate in the future as changes take place in the organization.
Our consideration of internal control was for the limited purpose described in the preceding paragraph and would not necessarily identify all deficiencies in internal control that might be or material weaknesses. However, as discussed below, we identified a certain deficiency in internal control that we consider to be a material weakness as of December 31, 2012.
A deficiency in internal control exists when the design or operation of a control does not allow management or employees, in the normal course of performing their assigned functions, to prevent or detect and correct misstatements on a timely basis. A significant deficiency is a deficiency, or combination of deficiencies, in internal control that is less severe than a material weakness, yet important enough to merit attention by those charged with governance.
A material weakness is a deficiency, or combination of deficiencies in internal control, such that there is a reasonable possibility that a material misstatement of the entity’s financial statements will not be prevented, or detected and collected on a timely basis. We consider the deficiency in Attachment A in the Plan’s internal control to be a material weakness as of December 31, 2012.

DRAFT 5/9/2013 2:24 AM 166173_12_JMHHealthPlanPublicHealthTrust_MWL
JMH Health Plan (a division of Miami-Dade County, Florida) April 22, 2013 Page 2 of 2
In addition, we identified certain observations during our audit which are presented in Appendix B, which are not considered significant deficiencies or material weaknesses.
This communication is intended solely for the information and use of the audit committee of the Financial Recovery Board of the Public Health Trust of Miami-Dade County, Florida and the Florida Department of Financial Services, Office of Insurance Regulation and is not intended to be and should not be used by anyone other than these specified parties.
Very truly yours,

DRAFT 5/9/2013 2:24 AM 166173_12_JMHHealthPlanPublicHealthTrust_MWL
Attachment A
Current Year’s Observation and Recommendation Material Weakness
2012-01 General and Administrative Expenses
Observation
During our testwork related to the general and administrative expense on the prepaid mental health program, we noted that management recorded an expense based upon a per member per month amount that was not supported by actual expenses incurred. This per member per month amount was paid to a related party during the year ended December 31, 2012. Based upon our further analysis, we noted that the recorded amount was overstated and required an adjustment in the amount of $1.3 million in order to properly reflect the actual costs incurred.
Recommendation
We recommend that when considering a per member month rate for general and administrative expenses, management should analyze the historical actual cost trends to ensure that the rate is reasonable based upon actual experience.
Management’s Response
Management received approval from the Office of Insurance Regulation (OIR) to add the Prepaid Mental Health Program (PMHP) line of business under the HMO for calendar year 2012 on January 24, 2013. Management has amended the Administrative Services Agreement between the JMH Health Plan and the Public Health Trust to include the services provided to the Prepaid Mental Health Program line of business at a rate reflective of actual experience. This amendment has been discussed and approved by the Office of Insurance Regulation.

DRAFT 5/9/2013 2:24 AM 166173_12_JMHHealthPlanPublicHealthTrust_MWL
Attachment B
Current Year’s Observation and Recommendation
2012-02 Information Technology General Controls
Condition Found
In the course of planning and throughout the 2012 audit, we discussed with management the progress made towards the remediation of certain material weakness related to general information technology general controls listed in our report to those charged with governance dated March 15, 2012. Management represented to us that the remediation took place throughout the fiscal year and as of October 1, 2012 all the remediation efforts were completed. As the remediation was not completed as of October 1, 2011, we did not test or rely on controls in performing our audit for the year ended September 30, 2012. However, we do note that management made significant efforts to strengthen internal controls over information technology throughout the fiscal year.
Based upon our discussions with management and corroborated by reading management prepared documents, we noted the following status of the remediation efforts during the fiscal year 2012:
Change Management
Management procured and implemented an ITIL compliant change management software on September 30, 2011; an integrated addition to the Trust’s service management application (Service Desk Express). Change management was tested by internal audit. In internal audit’s final report on change management dated April 6, 2012, internal audit concluded on an audit rating of satisfactory and Phase II of internal audit’s Change Management audit dated January 2, 2013, internal audit concluded on an audit rating of good.
Logical Access
Management strengthened password requirements for Active Directory in July 2011.
An automated process for disabling of dormant accounts was instituted, and a full audit of core system accounts with elevated access was conducted in order to address inappropriate levels of access.
A complete redesign of the account-provisioning and de-provisioning process was implemented in April 2012. The user account management process relies on Lawson employees’ job status and is tied directly to actions taken by JHS leaders in Manager Self Service (MSS) when an employee is hired, transferred, or separated.

DRAFT 5/9/2013 2:24 AM 166173_12_JMHHealthPlanPublicHealthTrust_MWL
For transferred employees, the automated process for removing all system access except for
AD, Lawson ESS, and Cerner (for 30-days) was implemented on October 1, 2012. Additionally, the Trust implemented a regularly-scheduled periodic review of user accounts and segregation of duties starting in November 2011.
A related finding on Data Center Access was immediately addressed in September 2010 by removing those without a justifiable business need to enter the data center, and in early 2012 as part of management’s data center rehabilitation project, management added tri-factor (proximity card reader/fingerprint/PIN) authentication for access in addition to deploying surveillance cameras as a detective control. Most of the financial related reporting applications are hosted by the vendor and do not reside on JHS datacenter.
Recommendation
We recommend that Management continue to comprehensively monitor and update the Trust’s policies and procedures associated with the IT general controls environment to ensure that the critical risks associated with information technology are adequately addressed. Furthermore, we recommend that the internal audit department consider conducting periodic audits on the effectiveness of the newly implemented controls.
Management’s Response
Management agrees with KPMG’s Current Year Observation and Recommendation, and will continue to monitor and update our policies and procedures associated with IT general controls. We will continue to work closely with internal audit to ensure that IT general controls are not only adequate, but continually improve as potential improvements are identified.

DRAFT 5/9/2013 2:24 AM 166173_12_JMHHealthPlanPublicHealthTrust_MWL
Attachment C
CommentComment Still Cleared
Description Relevant and Removed
2011-01 Information Technology General
Controls X

COPYRIGHT 2013, JMH HEALTH PLAN
1
Financial Recovery BoardAudit & Compliance Subcommittee
JMH Health Plan (JMH)Compliance Program

Purpose of Compliance Program
To prevent, detect and correct fraud, waste and abuse (FWA) and Medicare program non-compliance.
To promote a culture that encourages ethical conduct and compliance with all laws, regulations and internal policies, procedures and written standards.
2
COPYRIGHT 2013, JMH HEALTH PLAN

Why does JMH Need a Compliance Program?
As of January 1, 2011, Medicare Advantage Organizations(MAOs) and Prescriptions Drug Plans (PDPs) are requiredto establish and maintain effective compliance programs.
Compliance Programs must meet the regulatoryrequirements set forth in 42 C.F.R. §§422.503(b)(4)(vi),423.504(b)(4)(vi) and Chapter 21 of the Medicare ManagedCare Manual.
3
COPYRIGHT 2013, JMH HEALTH PLAN

7 Compliance Program Elements
1. Written Policies, Procedures and Standards of Conduct
2. Compliance Officer, Compliance Committee and High-Level Oversight
3. Effective Training and Education
4. Effective Lines of Communication
5. Well Publicized Disciplinary Standards
6. Effective System for Routine Monitoring and Identification of Compliance Risks
7. Procedures and System for Prompt Response to Compliance Issues
4
COPYRIGHT 2013, JMH HEALTH PLAN

Fraud, Waste and Abuse (FWA)
Medicare Advantage Organizations (MAOs) are required to prevent, detect and correct fraud, waste and abuse by:
Delivering FWA training at hire and annually thereafter.
Appointing a FWA Officer.
Establishing a Special Investigations Unit (SIU).
Ensuring employees and FDRs have a means to report FWA.
Auditing and monitoring to identify FWA.
Investigating all reports of potential FWA.
Referring all instances of potential FWA to the NBI MEDIC.
COPYRIGHT 2013, JMH HEALTH PLAN

Reporting Structure
COPYRIGHT 2013, JMH HEALTH PLAN
JMH Executive Compliance Committee
JHS Executive Compliance Committee
FRB Audit & Compliance Subcommittee

PURCHASING AND FACILITIES SUBCOMMITTEE

PUBLIC HEALTH TRUST FINANCIAL RECOVERY BOARD Purchasing and Facilities Subcommittee
Darryl K. Sharpton, Chairperson Stephen S. Nuell, Vice Chairperson Joe Arriola Michael Bileca Mojdeh L. Khaghan
Date, Time and Location May 23, 2013 – Following the Audit and Compliance Subcommittee Ira C. Clark Diagnostic Treatment Center Conference Room 259
AGENDA
1. Approval of the Previous Meeting Minutes (Darryl K. Sharpton, Chairperson, Purchasing and Facilities Subcommittee)
(a) * Meeting Minutes as of April 18, 2013
PURCHASING
2. Review and Recommend Approval of the Purchasing Report
(Rosa Costanzo, Vice President and Chief Procurement Officer, Strategic Sourcing and Supply Chain Management Division, Jackson Health System)
(a) * Purchasing Report as of May 2013
3. *Monthly Report of Competitive Contracts Awarded or Renewed Over the Chief Procurement Officer
Authority in Accordance to Procurement Regulations as of April 2013 (Fidel Alvarez, Manager, Procurement Management Department, Jackson Memorial Hospital)
4. *Monthly Report of Non-Competitive Contracts Awarded or Renewed Under $250,000 as of April 2013
(Fidel Alvarez, Manager, Procurement Management Department, Jackson Memorial Hospital) 5. *Key Performance Indicators (KPI) for Procurement Update (Rosa Costanzo, Vice President and Chief
Procurement Officer, Strategic Sourcing and Supply Chain Management Division, Jackson Health System) 6. *Direct Payments as Approved Pursuant to Resolution No. PHT 10/12-078 (Resolution authorizing and
approving the revision of the Procurement Policy/Regulation as amended on October 29, 2012) as of April 2013 (Rosa Costanzo, Vice President and Chief Procurement Officer, Strategic Sourcing and Supply Chain Management Division, Jackson Health System)

Purchasing and Facilities Subcommittee Agenda May 23, 2013 Page 2
FACILITIES
7. Financial and Budget Tracking Status Report as of March 2013 (Aurelio Gonzalez, Budget Director, Jackson Memorial Hospital)
(a) *Budget Tracking Summary Report (b) *Budget Tracking by Funding Source Report
8. *Construction Projects Update as of May 2013
(David Clark, Director, Capital Projects, Jackson Health System) 9. *Campus Wide Wayfinding Update (Matthew Pinzur, Associate Vice President, Communications and Outreach Division, Jackson Health System) The agenda items noted with an asterisk (*) indicate that the supporting documents are attached.

1. Approval of the Previous Meeting Minutes

PUBLIC HEALTH TRUST FINANCIAL RECOVERY BOARD
Purchasing & Facilities Subcommittee Darryl K. Sharpton, Chairperson Stephen S. Nuell, Vice Chairperson Joe Arriola Michael Bileca Mojdeh L. Khaghan
Date, Time and Place April 18, 2013 – Followed the Audit & Compliance Subcommittee meeting Ira C. Clark Diagnostic Treatment Center Conference Room 259
ATTENDANCE Purchasing & Facilities Subcommittee
Darryl K. Sharpton Joe Arriola Mojdeh L. Khaghan Stephen S. Nuell Marcos Jose Lapciuc Excused Michael Bileca
Jackson Health System Carlos A. Migoya
Don S. Steigman Rosa Costanzo David Clark Madeline Valdes Aurelio Gonzalez
Mark T. Knight Miami-Dade College Irene Lipof Miami-Dade County Attorney Eugene Shy, Jr. Christopher Kokoruda

Purchasing & Facilities Subcommittee Meeting April 18, 2013 Page 2 Meeting Call to Order With a quorum being present, the Purchasing & Facilities Subcommittee meeting was called to order at 8:02 a.m. by Darryl K. Sharpton, Chairperson, Purchasing and Facilities Subcommittee. 1. Approval of the Previous Meeting Minutes (a) Meeting Minutes as of March 14, 2013 Mr. Sharpton requested a motion approving the meeting minutes as of March 14, 2013. Mr. Arriola moved approval; seconded by Mr. Nuell, and
carried without dissent.
PURCHASING 7. Vendor and Contract Performance Monitoring Report
Rosa Costanzo, Vice President and Chief Procurement Officer, Strategic Sourcing and Supply Chain Management Division, Jackson Health System (JHS) presented a summary of the Annual Evaluation of Vendor Performance which highlighted sixty-five (65) contracts and seventy-one (71) evaluation forms that were received in order to monitor the vendor performance. The summary included ratings that have been received on the evaluation forms with addition of the estimated annual expense associated with the contracts. It is important to note that the largest vendor expense was Sodexo, Inc. (Sodexo) for a total amount of $9.2 million which represents approximately 20% of the total expense which is under review. With the removal of the $9.2 million that is associated with Sodexo makes the category of fair/poor only 1% of total spend that was evaluated. Detailed copies of the report were included with the agenda. Mr. Sharpton reminded everyone that the information presented is in response to a request made by the Subcommittee. It is a new schedule that shows more detail regarding the vendor performance and how it is associated with the estimated annual vendor performance as well as the evaluation of vendor performance. Mr. Sharpton questioned if remedial action is being taken with regards to those vendors with a rating of 1 to 2.5. Ms. Costanzo replied yes. She stated that remedial action is being taken with the departments and the vendors.

Purchasing & Facilities Subcommittee Meeting April 18, 2013 Page 3
Mr. Lapciuc questioned the performance of Sodexo. Don S. Steigman, Executive Vice President and Chief Operating Officer, Jackson Health System stated that the Sodexo contract is being evaluated for performance particularly as it relates to food quality, service, and staffing issues. Mr. Sharpton thanked Ms. Costanzo for the well done work regarding the development of the Contract Performance Monitoring Report summary and schedule. Mr. Sharpton stated that in the future the Subcommittee look forward to being provided with the same quality of information.
5. Key Performance Indicators (KPI) for Procurement Update At the request of the Subcommittee the explanation and definition of the KPI’s was included as part of the KPI report as well as the actual KPI indicators. Ms. Costanzo presented a summary of activity from April 2012 to March 2013 as it related to the Procurement’s KPI’s which included the number of completed contracts, average cycle time for the completed projects, and associated savings with the contracts. Ms. Costanzo pointed out that for the first six months of the reporting period showed that the average cycle time from the point of a contract request to execution improved from 43 days to 32 days. She also pointed out that from a Procurement process standpoint to be able to execute a contract(s) within 45 days is considered to be great work. The Subcommittee commended the Procurement Department staff for their good work and fine job. A detailed copy of the update report was included with the agenda. Mr. Sharpton reminded Ms. Costanzo to include as part of the KPI update report information pertaining to an average bar that he and she had previously discussed.
2. Review and Recommend Approval of the Purchasing Report
(a) Purchasing Report as of April 2013
Ms. Costanzo presented an overview including background information, highlights and key features of the April 2013 Purchasing Report. A detailed copy of the report was included with the agenda.
Following the overview presentation, Mr. Sharpton requested a motion approving the Purchasing Report as of April 2013.
Mr. Arriola moved approval; seconded by Mr. Nuell, and carried without dissent.
The Subcommittee will forward the April 2013 Purchasing Report to the Fiscal Committee with a recommendation for approval.

Purchasing & Facilities Subcommittee Meeting April 18, 2013 Page 4 3. Monthly Report of Competitive Contracts Awarded or Renewed Over the Chief
Procurement Officer Authority in Accordance to Procurement Regulations as of March 2013
There was no significant information to report. A detailed copy of the report was included with the agenda.
4. Monthly Report of Non-Competitive Contracts Awarded or Renewed Under $250,000 –
February 1 through February 28, 2013 There was no significant information to report. A detailed copy of the report was included with the agenda.
6. Direct Payments as Approved Pursuant to Resolution No. PHT 10/12-078 (Resolution authorizing and approving the revision of the Procurement Policy/Regulation as amended on October 29, 2012) as of March 2013 There was no significant information to report. A detailed copy of the report was included with the agenda.
FACILITIES
11. Resolution Recommended to be Approved
(a) Resolution authorizing the President or his designee to enter into a new Lease Agreement with Sikma Corporation, a Florida Corporation for the rental of three thousand eight hundred eighty-six (3,886) square feet of office space in Suite 230 at the Regency Medical Center Building, located at 9195 Sunset Drive, Miami, Florida 33173, for a period of four (4) years commencing September 1, 2012, with one a (1) four-year option to extend, for an annual payment of One Hundred Thirty-Three Thousand and Sixty-Seven Dollars ($133,067) with an annual increase in base rent of three percent (3%) (Madeline Valdes, Corporate Director, Property Management, Jackson Health System)
Madeline Valdes, Corporate Director, Property Management, Jackson Health System presented an overview of the proposed Lease Agreement with Sikma Corporation including background information and lease arrangements. A copy of the resolution and supporting document was included with the agenda. Mr. Lapciuc spoke briefly regarding the issues related to office space with the Regency Medical Center Building. He questioned the plans for office space for Jackson South Community Hospital (JSCH). Mr. Steigman stated that the office space for JSCH is under review. The goal is to take a further look at professional office space for JSCH, Jackson North Medical Center and the Main Campus.

Purchasing & Facilities Subcommittee Meeting April 18, 2013 Page 5
With regards to the Strategic Retreat, Mr. Lapciuc requested that a definitive facility component be incorporated in the agenda for discussion. Mr. Sharpton reminded everyone that an internal group has been created to make the necessary assessment and evaluations surrounding professional office space and real estate resources. He stated that the information will be included as part of the Strategic Retreat agenda with the assistance of David Clark, Director, Capital Projects, Jackson Health System who will take the lead regarding the innovations surrounding the campus-wide interactive map. Mr. Sharpton requested a motion for the item including the support document. Mr. Arriola moved approval; seconded by Ms. Khaghan, and carried without dissent.
9. Interactive Map Construction Projects Update as of April 2013
David Clark, Director, Capital Projects, Jackson Health System, presented an update regarding the capital projects as of April 2013. The update report included an overview of targeted capital projects totaling approximately $5.5 million in year 2013 and approximately $15.7 million is expected in year 2014, as well as a photo presentation showing conditions of some of the JHS facilities which highlighted the use and necessity for expenditure of funds for capital improvements. A detailed Construction Report and schedule describing the various projects to be completed was included with the agenda. With regards to the portal for the PHT Financial Recovery Board to be able to access the Interactive Map, Mr. Sharpton encouraged the members to begin utilizing the portal. He requested Mr. Clark to highlight in terms of red, yellow and green the status of certain JHS properties described in the portal, as well as in the future the Interactive Map to include the wish list of projects that staff is considering for upgrade. Mr. Sharpton questioned the cost to paint JNMC. Ms. Valdes stated that staff is currently obtaining the cost estimates from vendors to paint JNMC. She further stated that Mr. Sharpton would be advised in the near future regarding the recommended cost to paint JNMC.
Purchasing & Facilities Subcommittee Meeting April 18, 2013 Page 6 8. Financial and Budget Tracking Status Report as of February 2013
Aurelio Gonzalez, Budget Director, Jackson Memorial Hospital presented a summary of the Financial and Budget Tracking Status Report. As of February 28, 2013 active projects totaled $29.7 million. Out of the $29.7 million, $4.1 million was spent in prior years leaving approximately $25.6 million to be spent. Out of the $25.6 million to be spent, $15.6 million is expected to be spent during the current year with $558,506 being spent so far. Other reporting included a review of the Jackson Memorial Foundation funded projects, and 2014 Capital Budget update. As part of future reporting, the Subcommittee will be kept informed regarding the 2014 Capital Budget. A detailed copy of the Financial and Budget Tracking Status Report was included with the agenda. Mr. Sharpton requested that Mr. Migoya include as part of the Strategic Retreat a review and discussion regarding what the wish list looks like for capital improvements over a 5 to 10 year period of time.
10. Campus-Wide Way Finding Update The item was deferred.
Other Discussion
• Helipad and JNMC and JSCH Mr. Lapciuc questioned the status of the Helipad at JNMC and JSCH Mr. Migoya stated that the permission to move forward with the Helipad at JNMC was approved by the City of North Miami Beach, as well as approval by the FAA for a Helipad at JNMC and JSCH. The remaining pending item has to do with a review and approval by the Governmental Facilities of Miami Dade County and Board of County Commissioners (BCC) for a Helipad at JSCH. There will be scheduled a Public Hearing before the BCC regarding a Helipad at JSCH. The PHT Financial Recovery Board will be kept informed regarding the process to approve the Helipad at JSCH.
Meeting Call To Adjourn The meeting of the Purchasing & Facilities Subcommittee adjourned at 8:46 a.m. Transcribed by Ivenette Cobb-Black Executive Assistant Public Health Trust Financial Recovery Board

2. Review and Recommend Approval of the Purchasing Report

May 2013 PHT Financial Recovery Board 1
PUBLIC HEALTH TRUST FINANCIAL RECOVERY BOARD PURCHASING REPORT
May 31, 2013
TO: PUBLIC HEALTH TRUST FINANCIAL RECOVERY BOARD FROM: PROCUREMENT MANAGEMENT DEPARTMENT The following recommendations are made in accordance with the Trust’s “Procurement Policy” and it’s implementing “Procurement Regulation.” This report includes competitively solicited contract awards over $3,000,000, waivers of formal competition over $250,000 and other categories for Board approval as prescribed by the Procurement Regulation. The entire report has been screened and assembled by the Procurement Management Department with the direct participation of the Administrator and staff, all subject to review by the Vice President, Strategic Sourcing Division, consultation with the President as needed, and review for legal sufficiency by the County Attorney’s Office. SECTION I. AWARDS UNDER INVITATIONS TO BID (ITB’s) This section consists of awards under competitively solicited Invitations to Bid (ITB’s) over $3,000,000. No items to report SECTION II. AWARDS UNDER REQUESTS FOR PROPOSALS (RFP’s) This section consists of awards under competitively solicited Requests for Proposals (RFP’s) over $3,000,000. No items to report SECTION III. AWARDS UNDER THE COMPETITIVELY SOLICITED CONTRACTS OF OTHER PUBLIC PROCUREMENT ENTITIES This section consists of awards over $3,000,000 under competitively solicited (“ITB,” “RFP” or equivalent) contracts of other public and nonprofit entities. No items to report

May 2013 PHT Financial Recovery Board 2
SECTION IV. AWARDS UNDER GROUP PURCHASING ORGANIZATION (“GPO”) CONTRACTS This section consists of awards over $3,000,000 under Group Purchasing Organization (“GPO”) contracts. GPOs are organizations that aggregate the purchasing volume of their members consisting of hospitals and other health care providers to leverage discounts with manufacturers, distributors and other vendors to realize administrative savings and efficiencies. The Trust’s GPO is MedAssets. No items to report SECTION V. AWARDS UNDER A WAIVER OF FORMAL COMPETITION
This section consists of awards over $250,000 without the formal solicitation of competitive bids or proposals. All award recommendations in this section have the approval of the President, are based on a finding that the waiver of competitive bidding is in the best interests of the Public Health Trust, and require a two-thirds affirmative vote of the Trustees present for approval. A. Sole Source 1. (541114-TW) The Adult Respiratory Therapy Department requests approval of a one year contract to INO Therapeutics, LLC for Nitric Oxide inhalation gas therapy.
INO Therapeutics, LLC $930,380 dba Ikaria: (for one year) Total approved funding: $930,380
The Adult Respiratory Therapy department, in collaboration with the Procurement Management Department, conducted market research to determine the availability of competition. The team confirmed that the INO Therapeutics product remains the only turnkey solution available on the market today, making this a sole source procurement. Nitric Oxide inhalation therapy gas is used for treatment of cardio thoracic and transplant patients post surgery. The therapy gas is used for heart and lung patients requiring pulmonary vasodilatation, post pump, transplant and pulmonary hypertension therapies and has the least side effects. The cost of using Nitric Oxide is significantly lower than costs associated with a patient’s response to a 3-5 day alternative therapy. The proposed amount of $930,380 down from a spend of $1,141,860 for the expiring contract reflects a recent reduction in the hourly usage from approximately 15,300 hours to approximately 11,000 hours, thus, reducing the current spend by approximately $211,480.The vendor had initially proposed a new hourly rate of $88.39. Through negotiation, this rate was reduced to $84.58 an hour.

May 2013 PHT Financial Recovery Board 3
SECTION V. (cont’d.) INO Therapeutics is the only FDA approved vendor for this particular drug and its delivery system. The proposed contract can be terminated for convenience with a thirty (30) day notice and includes UAP and OIG provisions. The contract has been reviewed and approved by the County Attorney’s Office for legal sufficiency. A Sole Source Justification has been provided and Conflict of Interest Declarations have been signed by John Kimble, Adult Respiratory Manager and Lori Donahue, Contracts Administrator for INO therapeutics with no reported disclosures. ECRI stated that the rate being offered to the Trust is the lowest they have seen offered. MD Buyline reported that because each agreement in their database is unique, they were unable to identify any particular savings being offered with this contract. However, they do recommend a one year contract because “there are products under development that will bring competition to this niche market.” (Alex Contreras). B. Physician’s Preference Staff requests a waiver of formal competition for the contract items listed in this category because a physician or clinician has requested the particular item or service without which the physician or clinician cannot successfully and safely render patient care. 2. (534290-TW) Pathology Services Department requests funding to exercise the first of three one-year renewal options for the continuation of specialty diagnostic laboratory services.
ViraCor-IBT Laboratory, Inc.: $1,500,000
(For one year)
Total approved funding: $1,500,000
Background In April 2012, the Board approved a bid waiver (Physician Preference) contract award to ViraCor-IBT in the amount of $1,300,000 for a one-year period with three renewal options of one year each to be exercised at the discretion of the Trust. ViraCor-IBT provides quantitative real time bacterial and viral testing that is focused on molecular testing. The need for these services has increased considerably, as there has been an increase in test utilization by the Infectious Diseases, Transplant and Pediatrics departments. Although the Board approved $1,300,000 last year, the contract was modified for an additional $250,000

May 2013 PHT Financial Recovery Board 4
SECTION V. (cont’d.) to cover the last two months of the contract term due to increased usage. Based on current trends and patient care needs, it has been projected that this increased utilization will persist rather than decline. The estimated dollars requested will provide adequate funding for the new contract term assuming the current utilization trend. JHS pediatric and transplant physicians developed protocols that call for these tests on a regular basis for all patients. The physicians are pleased with the accuracy, reliability and turnaround time of the tests results, and Viracor remains their preference. The Pathology Department has confirmed that ViraCor-IBT is the only reference laboratory with the ability to deliver results of the labor-intensive quantitative Polymerase Chain Reaction (PCR) testing for viral markers within a 24 hour turn-around time of specimen receipt as required by JHS. ViraCor-IBT is the most qualified provider for this level of service. Recommendation Approval for this one year contract award for diagnostic testing services is requested to avoid disruption of the real-time bacterial and viral testing services which is highly utilized by Pediatrics and Transplant Departments. Physicians would not be able to diagnose, treat and discharge patients quickly and effectively without the continuation of this service. Although the vendor is not on the MedAssets contract, a market analysis was conducted as part of a MedAssets and Procurement Management (PDM) initiative for savings, and this determined the current competitive “benchmark” pricing. Negotiations with Viracor resulted in projected savings of approximately $150,000 for the expiring contract period. The vendor has agreed to forego its customary CPI increase and hold existing contract pricing for the proposed renewal as well as the two remaining one-year renewals, if the Trust opts to exercise them. In preparing this renewal, competitive pricing for the same test menu was secured from Quest Diagnostics (the current prime reference laboratory vendor on the MedAsset GPO). The price comparison showed savings to the Trust of $659,194 for one year if ViraCor is utilized for the tests. In addition, ViraCor will bear the cost of an interface currently being instituted with the Trust’s Lab (Pathology), providing cost avoidance to the Trust of $34,000. The Trust will realize cost avoidance of approximately $738,194 by renewing with ViraCor for the new contract term. This value to the Trust for the proposed one-year term is based on price comparison with Quest, the vendor foregoing its customary CPI increase ($45,000 for 2013) and also bearing the cost of the new interface. The contract can be cancelled for convenience with a thirty (30) day notice and includes the OIG and UAP provisions. The contract was approved by Risk Management as to insurance and liability and by the County Attorney’s Office for legal sufficiency.

May 2013 PHT Financial Recovery Board 5
SECTION V. (cont’d.) A Bid Waiver Justification has been provided and Conflict of Interest Declarations have been signed by Raul Cortes, JHS Senior Clinical Manager, Dr. Martin Andreansky, Pediatric BMT Director and Matthew Urbanek, CFO, ViraCor-IBT, Inc., with no reported disclosures. MD Buyline reported that the Viracor testing service is not currently covered and ECRI had no prior data with which to benchmark this service. (A. Contreras). C. Standardization Items in this category have been established as the Trust standard. No items to report D. Non-Competitive Cooperative Purchasing This subsection consists of awards under the contracts of other public entities that were not competitively solicited. No items to report E. Miscellaneous Bid Waiver This subsection consists of awards not falling in the other categories of waiver of formal competition but where waiver is deemed to be in the best interests of the Trust. No items to report SECTION VI. OPTIONS-TO-RENEW AND CONTRACT MODIFICATIONS FOR CONTRACTS THAT WERE COMPETITIVELY SOLICITED This section refers to existing contracts that were competitively bid (“ITB” or “RFP”) at their origin and consists of either (a) the exercise of established options-to renew or (b) the execution of contract modifications for which the Procurement Policy requires prior Board approval. No items to report SECTION VII. OPTIONS-TO-RENEW AND CONTRACT MODIFICATIONS FOR CONTRACTS THAT WERE AWARDED UNDER A WAIVER OF FORMAL COMPETITION

May 2013 PHT Financial Recovery Board 6
SECTION VII. (cont’d.) This section refers to existing contracts that were not competitively bid at their origin and consists of either (a) the exercise of established options-to renew or (b) the execution of contract modifications for which the Procurement Policy requires prior Board approval. All contracts in this section are renewals not previously authorized by the Board have the written approval of the President, are based on a finding that the waiver of full and competitive bidding is in the best interest of the Public Health Trust, and require a two-thirds affirmative vote of the Trustees present for approval. No items to report
SECTION VIII. MISCELLANEOUS
This section consists of procurement actions that require Board approval not included under any other section of the Purchasing Report. No items to report

Vendor Name DescriptionCost Center & Director/VP
Contract Number Contract Date Contract Value Contract Term Procurement Method UAP
Dn'A Design & ArchitectureDesign Services for Architectural Mechanical, Electrical, Plumbing , Fire Protection to Renovate the Main Corridor of Park Plaza East
94913 Madeline Valdes
410835 CAPS 4/1/2013 $ 134,026.00 One Time Miami Dade County
Equitable Distribution Program
Yes
Anf Group IncProject for the Helipad at Jackson South Community Hospital. ( the Helipad Component and an Elevator Component)
94913 Madeline Valdes
4101863 CAPS 4/12/2013 $ 801,680.72 Six Months Job Order Contract Yes
Cityworks Construction Llc
Construction Contractors to Provide Related Services for a Complete Interior Demolition and Renovation to the West Wing Transplant Patient Care Area
94913 Madeline Valdes
4101870 CAPS 4/15/2013 $ 1,929,830.00 Six Months ITB 12-10408-JE Yes
Dell Marketing LpIncidental Server and Storage Hardware for the IT Department
92818 Mike Garcia
8106941 SERV 4/4/2013 $ 225,000.00 Sixteen Months
State of Florida Western States
Contracting Alliance (WSCA) Contract # 250-
WSCA-10-ACS
Yes
Towers Watson Delaware IncConsultation and Advisory Services concerning PHT Benefit Plan for the Human Resource Department
96320 Maria Huot-
Barrientos8106961 SERV 4/12/2013 $ 305,000.00 One Year
RFP 09-5161 ( 1st OTR)
Yes
Ideal Personnel Services Llc Nursing Agency Services 94500
Maria Huot-Barrientos
8107032 SERV 4/30/2013 $ 200,000.00 Six Months RFQ 13-10888-CS Yes
Integrity Health Services Nursing Agency Services 94500
Maria Huot-Barrientos
8107033 SERV 4/30/2013 200,000.00$ Six Months RFQ 13-10888-CS Yes
Arjohuntleigh Inc.Rental of Specialty Beds For Jackson North Medical Center
57051 Sandy Sears
8301491 SERV 4/16/2013 216,000.00$ One Year Medassets BM05965 Yes
1. "MedAssets" is the Trust's primary "Group Purchasing Organization" (GPO)2. "State Contract" and "Miami-Dade Contract" mean a contract competively awarded by the State or County as a "cooperative contract".3. "US Communities" means a contract competively awarded by the U.S. Communities governmental purchasing alliance as a "cooperative contract".4. "OTR" means "Option to Renew".5. "Contract Value" corresponds to the fixed "Contract Term" that has been awarded or rewarded (not to future OTR's).6. "RFP" means competitive Request for Proposals (or Qualifications) procurement process performed by the JHS Procurement Management Department.7. "ITB" means competitive Invitation to Bid (or Quote) procurement process performed by the JHS Procurement Management Department.8. "UAP" means User Access ProgramE – Exclusion as per UAP program: ie, Federal Grant, etc.Yes – Incorporated into the purchase as either discount on invoice or discount upfrontN/A – No, did not apply to procurement. Either an emergency purchase or contract was executed or extended before UAP was implemented
Monthly Report of Competitive Contracts Awarded or Renewed under the Chief Procurement Officer Authority in Accordance to Procurement RegulationsApril 2013
For Information Only (Greater than $100K)

Monthly Report of Non-Competitive Contracts Awarded Under 250KApril 2013
For Information Only
Vendor DescriptionCost Center & Director/VP
Contract Number Contract Date Contract Value Contract Term Procurement
Method UAP
Accredo Health Hypertension medication (Flolan) for the Pharmacy73005
Alex Contreras8106942 SERV8106964 SERV
5-Apr-13 $ 83,330.00 One Time Sole Source N/A
Automed Technologies, Inc Annual maintenance contract for the Optifill II73006
Alex Contreras8106984 SERV 18-Apr-13 $ 81,145.96 1 Year Sole Source Yes
C T Mechanical, CoEmergency repairs for the ACC East Building 3rd Floor A/C units
80103Alex Contreras
4101849 CAPS 5-Apr-13 $ 60,000.00 One Time Emergency Yes
Cardiac Services Mobile, Inc Lease of a GE LVC Mobile Cardiac Cath Lab for JNMC57111
Sandy Sears8301515 SERV 30-Apr-13 $ 133,500.00 4 Months Emergency Yes
Emdeon Business ServicesEmdeon E-service and Medicare Secondary Payer Report for the JMH Health Plan
99420Brian Dean
8107001 SERV 22-Apr-13 $ 82,000.00 1 Year Bidwaiver Yes
Hanger Orthopedic Group, Inc Automated distributor system for DME for patients84610
Ana Sanchez / Rosa Costanzo
8106982 SERV 17-Apr-13 $ 125,000.00 4 months Sole Source N/A
Hayes, IncAnnual license fee for Hayes technology directory, news services and core clinical research support, generic test evaluation service.
99420Brian Dean
8106955 SERV 10-Apr-13 $ 14,900.00 1 Year Bidwaiver Yes
Intersystems CorporationPerpetual license for HealthShare Foundation (HSF) Software for IT department
400Mike Garcia
8107022 SERV 25-Apr-13 $ 238,113.25 1 Year Bidwaiver Yes
Kem Medical Products Corp Chemical Exposure Monitoring (system wide)80203
Mark Aprigliano8106948 SERV 8-Apr-13 $ 17,995.86 1 Year Bidwaiver Yes
Kratos Public Safety SecurityPro Watch Software Support for the Public Safety department
80202Mark Aprigliano
4101898 CAPS 23-Apr-13 $ 26,977.76 1 Year Bidwaiver Yes
Myers GroupSurveys for JMH Health Plan: 2013 Medicare CAHPS Survey & 2013 Health Outcomes Survey: JMHHP
99420Brian Dean
8106954 SERV 10-Apr-13 $ 19,650.00 One Time Sole Source Yes
Reliable Two Way Communication Hytera digital portable radios for Environmental services87007
Alex Contreras14670384 29-Apr-13 $ 18,783.00 One Time Standardization Yes
Siemens Medical Solutions USA Conversion fee to transfer from Suntrust to Wells Fargo90910
Carmen Pla8107019 SERV 25-Apr-13 $ 30,380.00 One Time Sole Source Yes
Southern Medical SystemsMaintenance supplies for Unit Dose machines for Pharmacy services
73005Alex Contreras
8107017 SERV 24-Apr-13 $ 25,000.00 1 Year Sole Source N/A
Trans Union Corp Patient credit checks for Revenue Cycle 93611
Carmen Pla8106929 SERV 2-Apr-13 $ 180,000.00 1 Year Bidwaiver Yes
Zoll Lifecor Corporation
Services provided to expedite discharge of unfunded Miami-Dade County homeless residents that otherwise would remain hospitalized for an extended period resulting in an increased length of stay.
71104Kevin Andrews
8106965 SERV 12-Apr-13 $ 155,400.00 One Time Sole Source Yes
Note: "Non-competitive" procurement category includes: Sole Source, Physician's Preference, Standardization, Non-Competitive Cooperate Purchasing, and Miscellaneous Bid Waiver.UAP - User Access Program:Exempt – Exclusion as per UAP program: i.e., Federal Grant, etc.Yes – Incorporated into the purchase as either discount on invoice or discount upfrontN/A – No, did not apply to procurement. Either an emergency purchase or contract was executed or extended before UAP was implemented

Procurement KPI
*Procurement process begins upon receipt of fully completed / approved documents, per Procurement Regulation
I. Purchase Order Activity (Monthly)a) 2012 PO's 2012 PO Lines
December January February March April Grand TotalAverage
PO'sDecember January February March April Grand Total
Average Lines
Optiflex & Omnicell Activity:
6,936 6,971 6,299 6,355 6,136 32,697 6,539 108,772 116,229 105,107 105,525 99,603 535,236 107,047
Total Buyers & Omnicell:
9,137 9,639 8,735 9,060 8,851 45,422 9,084 119,810 129,793 117,197 118,940 113,589 599,329 119,866
681 8,738
II. Contracting Activity (Weekly) III. Previous Activity# of
ContractsPending
Documents*Approved Documents
8-May-13 183 62 344-Apr-13 155 73 337-Mar-13 129 87 4012-Feb-13 140 90 398-Jan-13 110 102 415-Dec-12 128 77 31
27-Nov-12 135 77 3334 71 31 5-Nov-12 104 83 3323 98 42 25-Oct-12 125 75 3155 43 19 10-Oct-12 125 66 4113 83 56 4-Sep-12 129 65 358 23 156 31-Aug-12 129 65 356 149 84 31-Jul-12 121 66 388 122 3 4-Jul-12 118 62 324 76 0 27-Jun-12 130 56 38
Total: 151 5-Jun-12 119 57 32Average: 130 73 35
*Average cycle time for completed projects: 22 daysSavings: $429,108.20
Hospitals (JNMC/JSCH/Holtz)Information Technology
OR / Surgery / AnesthesiaRevenue Cycle
IV. April 2013 Contracts Completed: 32
Monthly Average Number of PO's by FTE for April = Monthly Average Number of PO's Lines by FTE for April =
2013PO's 2013 PO Lines
Long Term Care / Quality / Safety
Average # of Weekdays in Process with
Current Activity for the Week of 05/09/2013
# of Projects with Approved Documents*: 61# of Projects Pending Procurement Documents: 90
Average # of Weekdays in Process with
# of Contracts
Pending Documents
*Approved Documents
AdministrativeCapital / Support ServicesClinical Support Services
b)

Direct Payment as Approved Pursuant to Resolution No. PHT 10/12-078April 2013
Vendor DescriptionCost Code
VPPaid Amount
American Arbitration Association Arbitration services96316
Maria Huot-Barrientos
2,900.00$
DGL And Associates Consulting services/advisory services for MOB Feasibility Analysis for JSCH
83900Jay Miranda
13,643.28$
Edgar Consulting Group Consulting and staffing services for JMH Health Plan94420
Brian Dean242,358.00$
Edward Dugger Associates, PA Acoustical consulting services for JNMC57236
Sandy Sears8,800.00$
HMO Affiliates, LLC Consulting services/advisory services for ITN Advertisement # ACHA ITN 027-12/13 Version # 00
99301Mark Knight
67,920.00$
JL Media Inc Advertisement: Radio Media95714
Matt Pinzur9,091.50$
Kresse And Associates Inc Legal / hearing transcription95013
Jeff Crudele2,650.70$
Miami Parking Authority Parking Administration Services89502
Mark Aprigliano200,874.61$
Milyn Enterprises Inc Consulting services for JMH Health Plan's Medicare product line
94420Brian Dean
15,000.00$
Satellite Technology Heliport Consulting / inspection services for JSCH83900
Jay Miranda7,625.00$
Strategic Management Professional Services99420
Brian Dean70,000.00$

7. Financial and Budget Tracking Status Report as of March 2013

FINANCIAL & BUDGET TRACKING STATUS REPORT MARCH 2013 Capital Contribution (aka funded depreciation): The FY 2013 budget programs $20 million of expenditure to occur during the year for all Capital items funded with Capital Contribution. For the current month end FY 2013 active projects total $30 million. Of this amount, $4.1 million was spent in prior years leaving just over $25.9 million to be spent. Of that $15.6 million is expected to be spent this year with $695,113 spent in so far in FY 2013. Foundation: Active Foundation funded projects continue this year totaling $3 million of prior and current year funding commitments. The bulk of the project dollars are represented by the Holtz Pathology Lab Renovation at $2 million. $200,254 has been spent in the current FY on all projects with additional $903,575 left to spend. County GOB: Included in the report was a summary of active Building Better Communities General Obligation Bond funded projects which continue with an all years’ budget of $57 million. Prior years’ spending on these projects including Jackson South Community Hospital (JSCH) totals $33 million with $24 million left to spend. Series 2005 Revenue Bonds: Active Series 2005 projects total $13.7 million of which $4.9 million was spent in prior years leaving $8.8 million to spend this year. All of the funding is programmed and forecast to be spent by the end of the fiscal year. $393,244 was spent in the current month with the bulk of the spending made on the WW-6 modernization. Series 2009 Revenue Bonds: Active Series 2009 projects total $51.0 million of which $21.6 million was spent in prior years leaving $29.4 million left to spend. Of that amount, $449,642 was spent in the current month with the bulk of the spending made on the ADA compliance package. Trust Funds and Grants: The active budgets total $7.4 million with most of this resource represented by the ongoing Ryder Trauma Center Hardening project. Life to date spending as of the current month is $648,000 with an additional $6.8 million left to spend.

Page 1 of 6
Original Total Total Project V.P.# of NEW Project Budget Project Approval Fund. Project Project Exec. Total YTD Life to Date Amount left Proj. Proj.# Activity# Project Name Budget Changes Budget Date Source Manager Manager Spons. Mar.13 Mar.13 thru Mar.13 to Spend
MULTIFUNDING SOURCE PROJECTS
1 C P-00632 52005003 J.South Community Hptal 102,425,000 100,000 102,525,000 CO Aug-05 Multi Clark JMH Garcia (1,235) (154,843) 100,775,401 1,749,599
2 J P-00949 51009046 WW-B Pharmacy Phase I 250,927 583,669 834,596 CN May-09 Multi Arnaldo JMH Contreras 264 5,697 588,491 246,105
3 L P-00836 51007017 Rehab Building Renovation 16,670,411 (111,864) 16,558,547 HOLD Sep-07 Multi Frank JMH Contreras - - 158,547 16,400,000
4 M P-00904 51008026 C-4 Cath Lab #6 2,833,500 196,500 3,030,000 HOLD Jul-08 Multi Alana JMH Contreras - 995 103,272 2,926,728
5 O P-00566 51001001 Elevator Modernization 3,000,000 253,043 3,253,043 CN May-01 Multi Frank JMH Burghart - 15,797 2,188,067 1,064,976
6 R P-00763 59007009 JMT Elevator Modern#141-146 1,057,183 243,574 1,300,757 CN Jul-07 Multi Frank JMH Valdes - (139,789) 1,066,308 234,449
7 S P-00827 53008015 Jack.No Elevators 1 & 2 490,050 (431,070) 58,980 DEF Feb-08 Multi TBD JMH Sears - - 58,980 -
8 T P-00834 51008016 ADA Compl.#Pkg1 Restrooms 991,763 692,000 1,683,763 CN Oct-07 Multi Arnaldo JMH Valdes 307,178 593,741 1,348,958 334,806
9 U P-00854 53008020 Jack.No. Window Replacement 2,057,220 1,088,750 3,145,970 CN Jan-08 Multi Arnaldo JMH Sears 5,297 170,770 2,990,682 155,288
10 V P-00606 59004002 JMT Elevators Moderniz. 931,591 (30,291) 901,300 D May-04 Multi Frank JMH Valdes - 188,015 267,982 633,318
11 Y 51011105 Ryder Trauma Ext. Hardening 8,589,588 1,511,031 10,100,619 D Dec-10 Multi Clark JMH Valdes 11,794 138 624,872 9,475,747
12 AB PIP 31009002 Telecommunication 8,188,100 1,765,000 9,953,100 PIP Aug.09 Multi Overton JMH Garcia 99,205 154,782 9,392,906 560,194
13 AC P-00997 51009089 4160 Volt Oil Switch Repl 7,350,000 - 7,350,000 D Sep-09 Multi Douglas JMH Valdes 191 222,841 598,798 6,751,202
14 AD 51012109 DTC-1 Linear Accelerator Relo 692,228 - 692,228 D Sep-12 Multi Alana JMH Contreras 8,685 8,758 8,758 683,470
15 AE 52013100 Jackson South 2nd Cath Lab 692,307 - 692,307 D Oct-12 Multi Frank JMH Garcia - - - 692,307
16 AF 53012105 Jackson No.Helistop Reloc 82,841 917,159 1,000,000 D Jul-12 Multi Arnaldo JMH Sears 552 177,658 179,671 820,329
17 AG P-00996 53009088 JNMC Emer.Switchgear 1,650,000 5,700,000 7,350,000 D Sep-09 Multi Douglas JMH Sears 44,459 57,496 129,905 7,220,095
18 AH P-00978 51009072 Fire Sprinkler Upgrade Campus 2,000,000 316,000 2,316,000 D Sep-09 Multi Scott JMH Valdes - - 254,225 2,061,775
19 AI 51010100 CampusW Underg Utilities - 4,930,022 4,930,022 CO Jul-10 Multi Clark Heery Valdes 12,324 758,441 3,226,856 1,703,166
Total Mutifunding Source 159,952,709 17,723,523 177,676,232 488,715 2,060,496 123,962,677 53,713,555
CAPITAL CONTRIBUTION PROJECTS
1 O P-00566 51001001 Elevator Modernization 1,608,153 - 1,608,153 CN May-01 CC Frank JMH Burghart - - 1,608,153 (0)
2 P-00724 51007008 Kitchen Equipment Modification 79,485 - 79,485 DEF Nov-06 CC TBD JMH Valdes - - 79,485 (0)
3 T P-00834 51008016 ADA Compliance Package#1 378,757 - 378,757 CN Oct-07 CC Arnaldo JMH Valdes - - 378,757 -
4 AH P-00978 51009072 Fire Sprinkler Upgrade Campus - 316,000 316,000 D Sep-09 CC Scott JMH Valdes - - - 316,000
5 AC P-00997 51009089 4160 Volt Oil Switch Repl - 3,065,000 3,065,000 D Sep-09 CC Douglas JMH Valdes - - - 3,065,000
6 AI 51010100 CampusW Underg Utilities - 1,730,022 1,730,022 CO Jul-10 CC Clark Heery Valdes 12,324 26,856 26,856 1,703,166
7 51011100 Highland Prof.Financ.Assessm 740,000 - 740,000 HOLD Oct-10 CC Clark JMH Contreras - 19,697 317,015 422,985
8 51011104 WW-15 Nursing Unit Moder 2,588,568 - 2,588,568 D Dec-10 CC Clark JMH Contreras - 11,266 183,515 2,405,053
9 Y 51011105 Ryder Trauma Ext Hardening 2,147,397 1,511,031 3,658,428 D Dec-10 CC Clark JMH Valdes 11,794 8,880 165,063 3,493,365
10 51011106 Highland Prof.6thFl Transplant 542,625 (150,000) 392,625 CO Dec-10 CC Frank JMH Contreras 9,724 233,908 276,353 116,272
11 51011112 DTC PET Scan 2,467,000 (560,790) 1,906,210 CN Jan-11 CC Alana JMH Contreras 2,064 2,064 1,898,664 7,546
BUDGET TRACKING REPORT FY 2013BY FUNDING SOURCE
Stat
us
Actuals FY13

Page 2 of 6
Original Total Total Project V.P.# of NEW Project Budget Project Approval Fund. Project Project Exec. Total YTD Life to Date Amount left Proj. Proj.# Activity# Project Name Budget Changes Budget Date Source Manager Manager Spons. Mar.13 Mar.13 thru Mar.13 to Spend
BUDGET TRACKING REPORT FY 2013BY FUNDING SOURCE
Stat
us
Actuals FY13
12 51012100 Human Resources Relocation 300,000 - 300,000 CN Dec-11 CC Lourdes JMH Hout-Barriento - 62,594 248,134 51,866
13 51012106 Inst.Anne-5 Physician Svces 31,350 - 31,350 CO Jul-12 CC Diaz JMH Andrews 463 2,836 24,198 7,152
14 AD 51012109 DTC-1 Linear Accelerator Rel 213,328 - 213,328 D Sep-12 CC Alana JMH Contreras - - - 213,328
15 51013101 JMH Utility Ctr Wall Enclosure 62,805 15,000 77,805 D Dec.12 CC Scott JMH Camero - 2,000 2,000 75,805
16 51013103 PPW Installation 2 300K UPS 405,000 - 405,000 D Jan.13 CC Aponte JMH Mike Garcia - - - 405,000
17 51013104 ET-1 Admitting Modernization 532,203 - 532,203 D Jan.13 CC Aponte JMH Pla 975 975 975 531,228
18 51013108 T-4 Rehab 15 Beds 308,902 - 308,902 D Mar.13 CC Frank JMH Contreras - - - 308,902
19 51013109 WW-7 Modernizat.Neurological 1,357,904 - 1,357,904 D Mar.13 CC Armaldo JMH Marta Garcia - - - 1,357,904
20 C P-00632 52005003 J.South Community Hptal(661) 82,254 - 82,254 CO Aug-06 CC Clark JMH Garcia - - 82,254 -
21 52012104 Jackson South Helistop 137,101 1,321,971 1,459,072 D Jul-12 CC Clark JMH Garcia - 139,542 144,329 1,314,743
22 AE 52013100 Jackson South 2nd Cath Lab 492,307 - 492,307 D Oct-12 CC Frank JMH Garcia - - - 492,307
23 52013102 JSCH Behav.Health Stairwell#1 66,000 (15,000) 51,000 D Dec.12 CC Aponte JMH Garcia - - - 51,000
24 S P-00827 53008015 Jack.No Elevators 1 & 2 52,317 - 52,317 DEF Feb-08 CC TBD JMH Sears - - 52,317 -
25 U P-00854 53008020 Jack.No. Window Replacement 85,608 - 85,608 CN Jan-08 CC Arnaldo JMH Sears - - 85,608 -
26 AG P-00996 53009088 JNMC Emer.Switchgear - 5,605,000 5,605,000 D Sep-09 CC Douglas JMH Sears - - - 5,605,000
27 AF 53012105 Jackson No.Helistop Reloc 82,841 601,159 684,000 D Jul-12 CC Arnaldo JMH Sears - - - 684,000
28 53012108 JNMC Cardio Cath Lab Repl 1,170,431 - 1,170,431 D Sep-12 CC Arnaldo JMH Sears 59 29,624 29,624 1,140,807
29 53013105 JNMC Kitchen Hood Replacem 239,800 - 239,800 D Feb.13 CC Scott JMH Sears - - - 239,800
NEW 53013111 JNMC Pneumatic Tube System 314,820 314,820 D Apr.13 CC Scott JMH Sears - - 314,820
31 P-00655 56006004 JNCMHC Emerg. Generator 17,470 - 17,470 DEF Jul-06 CC Camero JMH Valdes - - 17,470 -
32 V P-00606 59004002 JMT Elevators Moderniz. 23,713 - 23,713 D May-04 CC Frank JMH Valdes - - 23,713 -
33 R P-00763 59007009 JMT Elevator Modern#141-146 24,135 - 24,135 CN Jul-07 CC Frank JMH Valdes - - 24,135 -
34 59012110 PPE Main Corridor Moderniz 152,222 - 152,222 D Sep-12 CC Frank JMH Valdes - 90 90 152,132
35 59013107 JMT West 8 & 14 Fl Mold Remed 105,600 - 105,600 D Mar.13 CC Scott JMH Valdes - - - 105,600
36 59013110 JMT Apartm Mold Remediation 122,650 - 122,650 D Mar.13 CC Scott JMH Valdes - - - 122,650
37 AB PIP 31009002 Telecommunication 2,000,000 - 2,000,000 PIP Aug.09 CC Overton JMH Garcia 99,205 154,782 1,439,806 560,194
18,932,746 13,439,393 32,372,139 136,608 695,113 7,108,515 25,263,624
CAPITAL CONTRIBUTION
CLOSED PROJECT FY 2012-2013
Total Capital Contribution

Page 3 of 6
Original Total Total Project V.P.# of NEW Project Budget Project Approval Fund. Project Project Exec. Total YTD Life to Date Amount left Proj. Proj.# Activity# Project Name Budget Changes Budget Date Source Manager Manager Spons. Mar.13 Mar.13 thru Mar.13 to Spend
BUDGET TRACKING REPORT FY 2013BY FUNDING SOURCE
Stat
us
Actuals FY13
- - - - - - -
37 SUB TOTAL CAPITAL CONTRIBUTION PROJECTS 18,932,746 13,439,393 32,372,139 136,608 695,113 7,108,515 25,263,624
FOUNDATION
1 P-00659 51006005 Holtz-2 Pathology Renovat 2,000,000 54,350 2,054,350 CO Jul-06 F Frank JMH Contreras - 85,894 1,964,871 89,479
2 51011117 DTC-1 Taylor Breast Ctr Reno 276,000 366,780 642,780 D Jul-11 F Alana JMH Contreras - 25,037 36,174 606,606
3 51011118 C-5 NICU Intermed.Modern 100,000 200,000 300,000 D Aug-11 F Alana JMH Burghart 1,568 89,323 92,510 207,490
2,376,000 621,130 2,997,130 1,568 200,254 2,093,555 903,575
GOB GENERAL OBLIGATION BONDS
1 L P-00836 51007017 Rehab Building Renovation 16,400,000 16,400,000 HOLD Sep-07 GOB JS Frank JMH Contreras - - 16,400,000
2 P-00867 51008024 Campus Wide Pneumatic Tube Syste 3,629,400 46,706 3,676,106 HOLD Apr-08 GOB ED Scott JMH Valdes (39,361) 1,639,676 2,036,430
3 M P-00904 51008026 C-4 Cath Lab # 6 2,833,500 86,645 2,920,145 HOLD Jul-08 GOB ED Alana JMH Contreras - - 2,920,145
4 P-00928 51008032 ET- 1 Ortho Suite & ERA 1,706,000 700,000 2,406,000 CN Sep-08 GOB ED Frank JMH Contreras 12,609 12,623 1,372,562 1,033,438
C P-00632 52005003 J.South Community Hptal 52,000,000 - 52,000,000 CO Aug-05 GOB JS Clark JMH Garcia (1,235) (154,843) 29,989,584 22,010,416
C P-00632 52005003 J.South Community Hptal (20,260,817) (20,260,817) CO Aug-05 GOB JS Clark JMH Garcia - - (20,260,817)
60,168,900 (3,027,466) 57,141,434 11,375 (181,581) 33,001,822 24,139,612
2005 REVENUE BOND
L P-00836 51007017 Rehab Building Renovation 16,670,411 (111,864) 16,558,547 HOLD Sep-07 RB REH Frank JMH Contreras - - 158,547 16,400,000
L P-00836 51007017 Rehab Building Renovation (16,400,000) (16,400,000) HOLD Sep-07 RB REH Frank JMH Contreras - - - (16,400,000)
M P-00904 51008026 C-4 Cath Lab # 6 109,855 109,855 HOLD Jul-08 IRB INTER Alana JMH Contreras - 995 103,272 6,583
1 P-00932 51009033 HCH ET-5 Intake, ET-7 BMT Ph.I 1,758,649 (141,649) 1,617,000 CO Dec-08 RB PEDI Alana JMH Burghart 0 100 1,520,550 96,450
2 P-00947 51009044 ET-5 Adolescen Unit 1,236,193 (167,000) 1,069,193 D May-09 RB REH Alana JMH Burghart 98,806 691,264 863,692 205,501
3 J P-00949 51009046 WW-B Pharmacy Phase I 250,927 470,000 720,927 CN May-09 RB ACU Arnaldo JMH Contreras 264 5,697 588,491 132,436
J P-00949 51009046 WW-B Pharmacy Phase I - 113,669 113,669 CN May-09 IRB INTER Arnaldo JMH Contreras - - - 113,669
4 P-00959 51009054 ET-4 LDOR Fetal Surg.OR's 2,083,950 - 2,083,950 D May-09 RB PEDI Alana JMH Burghart 2,675 12,425 414,279 1,669,671
5 51010096 WW-2 Angio Suite 2,000,000 2,000,000 D May-10 RB PEDI Alana JMH Contreras 1,085 7,891 1,329,371 670,629
Total Closed Capital Contribution
Total Foundation
Total GOB Bonds

Page 4 of 6
Original Total Total Project V.P.# of NEW Project Budget Project Approval Fund. Project Project Exec. Total YTD Life to Date Amount left Proj. Proj.# Activity# Project Name Budget Changes Budget Date Source Manager Manager Spons. Mar.13 Mar.13 thru Mar.13 to Spend
BUDGET TRACKING REPORT FY 2013BY FUNDING SOURCE
Stat
us
Actuals FY13
6 51010097 DTC new MRI 2,500,000 2,500,000 CN May-10 RB PEDI Alana JMH Contreras 11,224 2,173,710 2,391,117 108,883
7 51011116 C-4 Cath Lab #5 454,000 - 454,000 CN Apr.11 RB INTER Alana JMH Contreras 40,511 341,207 408,868 45,132
8 51012101 WW-6 Modernization 1,553,000 - 1,553,000 CN Feb.12 RB INTER Arnaldo JMH Contreras 192,731 342,649 389,628 1,163,373
9 51012102 SW-6 Modernization 482,320 (349,000) 133,320 CO Feb.12 RB INTER Alana JMH Contreras 223 38,456 131,128 2,192
C P-00632 52005003 J.South Community Hptal 50,000,000 - 50,000,000 CO Aug-05 RB JS Clark JMH Garcia - 50,000,000 (0)
C P-00632 52005003 J.South Community Hptal 16,400,000 16,400,000 CO Aug-05 RB REH Clark JMH Garcia - 16,400,000 (0)
C P-00632 52005003 J.South Community Hptal 210,817 210,817 CO Aug-05 RB ACU Clark JMH Garcia - 210,817 -
C P-00632 52005003 J.South Community Hptal 3,650,000 3,650,000 CO Aug-05 RB INTER Clark JMH Garcia - 3,650,000 0
C P-00632 52005003 J South Community Hptal 100,000 100,000 CO Aug-05 RB INTER Clark JMH Garcia - 100,000 -
AE 52013100 Jackson South 2nd Cath Lab 200,000 - 200,000 D Oct-12 RB Frank JMH Garcia - - 200,000
10 53010091 JN Pharmacy Clean Room - 361,000 361,000 CO Jan-10 RB INTER Arnaldo JMH Sears 8,167 348,493 12,507
AF 53012105 Jackson No.Helistop Reloc - 316,000 316,000 D Jul-12 RB Arnaldo JMH Sears 552 177,658 179,671 136,329
11 53012107 J.No. AHU Replacement 258,000 - 258,000 D Jul.12 RB Scott JMH Sears 5,439 5,494 252,506
12 PIP 31012001 Xcelera Enterprise Solution 150,000 - 150,000 D Feb.12 RB INTER Fuentes JMH Garcia 45,153 120,153 120,153 29,847
75,097,450 9,061,828 84,159,278 393,224 3,925,813 79,313,568 4,845,710
2009 INFRASTRUCTURE BOND
O P-00566 51001001 Elevator Modernization 1,391,847 253,043 1,644,890 CN May-01 IRB Frank JMH Burghart - 15,797 579,913 1,064,977
T P-00834 51008016 ADA Compliance Package#1 613,006 692,000 1,305,006 CN Oct-07 IRB Arnaldo JMH Valdes 307,178 593,741 970,200 334,806
1 P-00938 51009036 WW Fire Alarm 2,000,000 350,000 2,350,000 CO Apr-09 IRB Douglas JMH Valdes - 2,641 1,938,509 411,491
2 P-00958 51009053 ET A/C Repl177-180,181Inst 2,653,370 465,710 3,119,080 CO Sep-09 IRB Frank JMH Valdes - 1,781 3,071,541 47,539
3 P-00961 51009056 Replace Paralleling Gear 4,361,250 928,122 5,289,372 D Sep-09 IRB Douglas JMH Valdes 8,626 208,042 690,571 4,598,801
4 P-00962 51009057 Utility Ctr-2 Emerg.Generat 2,135,000 123,215 2,258,215 CO Sep-09 IRB Douglas JMH Valdes 762 10,241 2,212,665 45,550
5 P-00967 51009062 Fire Alarm Upgrade Campus 4,815,000 (385,505) 4,429,495 CN Sep-09 IRB Douglas JMH Valdes 17,204 403,668 701,460 3,728,035
6 P-00969 51009064 DTC,T,Rehab,WW&ACC-W AHU Rep 6,541,500 - 6,541,500 CN Sep-09 IRB Scott JMH Valdes 4,761 181,032 3,164,135 3,377,365
7 P-00974 51009069 Campus Wide Roofing Repl. 1,500,000 - 1,500,000 D Sep-09 IRB Scott JMH Valdes 800 16,085 394,505 1,105,495
AH P-00978 51009072 Fire Sprinkler Upgrade Campus 2,000,000 - 2,000,000 D Sep-09 IRB Scott JMH Valdes - - 254,225 1,745,775
8 P-00982 51009076 UC Emerg.Well Boilers 2,331,000 350,325 2,681,325 CO Sep-09 IRB Clark JMH Valdes - 133,317 2,657,737 23,588
9 P-00992 51009084 BackFl.&Byp.DomWater 250,000 117,000 367,000 D Sep-09 IRB Frank JMH Valdes - - 7,863 359,137
AC P-00997 51009089 4160 Volt Oil Switch Repl 7,350,000 (3,065,000) 4,285,000 D Sep-09 IRB Douglas JMH Valdes 191 222,841 598,798 3,686,202
10 51010099 Concrete Struct Tank Farm - 100,000 100,000 CO Jun-10 IRB Arnaldo JMH Valdes - 25,040 55,839 44,161
AI 51010100 CampusW Underg Utilities - 3,200,000 3,200,000 CO Jul-10 IRB Clark Heery Valdes - 731,586 3,200,000 -
11 51011113 Reduction of NAP Utilization 300,000 394,769 694,769 D Apr-11 IRB Frank JMH Garcia - 31,917 458,487 236,282
AD 51012109 DTC-1 Linear Accelerator Relo 478,900 - 478,900 D Sep-12 IRB Alana JMH Contreras 8,685 8,758 8,758 470,142
Total 2005 Revenue Bond

Page 5 of 6
Original Total Total Project V.P.# of NEW Project Budget Project Approval Fund. Project Project Exec. Total YTD Life to Date Amount left Proj. Proj.# Activity# Project Name Budget Changes Budget Date Source Manager Manager Spons. Mar.13 Mar.13 thru Mar.13 to Spend
BUDGET TRACKING REPORT FY 2013BY FUNDING SOURCE
Stat
us
Actuals FY13
C P-00632 52005003 J.South Community Hptal (661) 342,746 - 342,746 CO Aug-06 IRB Clark JMH Garcia - - 342,746 -
U P-00854 53008020 Jack.No. Window Replacement 1,971,612 1,088,750 3,060,362 CN Jan-08 IRB Arnaldo JMH Sears 5,297 170,770 2,905,074 155,288
12 P-00960 53009055 Main/JNMC-outside. lights 922,500 (141,820) 780,680 CN Sep-09 IRB Arnaldo JMH Valdes 1,521 1,521 142,212 638,468
13 P-00970 53009065 JNMC Hot Water/Boiler/Chiller 630,000 2,731,272 3,361,272 CN Sep-09 IRB Scott JMH Sears 183 155,005 1,913,634 1,447,638
14 P-00972 53009067 JNMC Remaining Roof 527,383 (427,071) 100,312 D Sep-09 IRB Scott JMH Sears 32,762 75,538 75,538 24,774
15 P-00989 53009081 JNMC ICU Commode Rep 52,500 400,000 452,500 CO Sep-09 IRB Arnaldo JMH Sears - - 447,232 5,268
AG P-00996 53009088 JNMC Emer.Switchgear 1,650,000 95,000 1,745,000 D Sep-09 IRB Douglas JMH Sears 44,459 57,496 129,905 1,615,095
16 53010101 JNMC 40 Year Certification - 185,000 185,000 D Jul-10 IRB Scott JMH Valdes 17,212 30,365 95,725 89,275
V P-00606 59004002 JMT Elevators Moderniz. 907,878 (30,291) 877,587 D May-04 IRB Frank JMH Valdes 188,015 244,269 633,318
R P-00763 59007009 JMT Elevator Modern#141-146 1,033,048 243,574 1,276,622 CN Jul-07 IRB Frank JMH Valdes (139,789) 1,042,173 234,449
AB PIP 31009002 Telecommunication 6,000,000 1,765,000 7,765,000 PIP Aug.09 IRB Overton JMH Garcia - 7,765,000 -
52,758,540 9,433,093 62,191,633 449,642 3,125,407 36,068,716 26,122,917
2009 INFRASTRUCTURE REVENUE BOND DEFERRED PROJECTS
1 P-00981 51009075 WW & C AHU Repl (14) 1,995,000 (1,899,074) 95,926 DEF Sep-09 IRB TBD JMH Valdes - - 95,926 (0)
S P-00827 53008015 Jack.No Elevators 1 & 2 437,733 (431,070) 6,663 DEF Feb-08 IRB TBD JMH Sears - - 6,663 -
2,432,733 (2,330,144) 102,589 - - 102,589 (0)
TRUST FUND / GRANTS
AB PIP 31009002 Telecommunication 188,100 - 188,100 PIP Aug.09 TF Overton JMH Garcia - - 188,100 -
1 51013106 Trauma-1 Conf Room T-121 167,182 - 167,182 D Mar.13 Red Light Frank JMH Janice G - - - 167,182
355,282 - 355,282 - - 188,100 167,182
FEMA Grants
IN CONSTRUCTION
Y 51011105 Ryder Trauma Ext Hardening 6,442,191 - 6,442,191 D Dec-10 FEMA Clark JMH Valdes - (8,742) 459,808 5,982,383
1 56012103 Jefferson Reaves Wind Retro 601,281 - 601,281 D Mar.12 FEMA Arnaldo JMH Valdes - - 140 601,141
Total Trust Fund
Total 2009 Infrastructure Rev.Bond
Total 2009 Infrastructure Rev.Bond DEFERRED

Page 6 of 6
Original Total Total Project V.P.# of NEW Project Budget Project Approval Fund. Project Project Exec. Total YTD Life to Date Amount left Proj. Proj.# Activity# Project Name Budget Changes Budget Date Source Manager Manager Spons. Mar.13 Mar.13 thru Mar.13 to Spend
BUDGET TRACKING REPORT FY 2013BY FUNDING SOURCE
Stat
us
Actuals FY13
7,043,472 - 7,043,472 - (8,742) 459,948 6,583,524
ALL OTHER FUNDING SOURCES
Closed/Cancelled and Partially Capitalized FY 11-12
51010098 Above Ground Tank Replacem - - - CAN Jun-10 CAN Camero JMH Valdes - - - -
- - - - - - -
37 OTHER FUNDINGS 200,232,377 13,758,441 213,990,818 855,808 7,061,151 151,228,299 62,762,520
74 GRAND TOTAL 219,165,123 27,197,834 246,362,958 992,416 7,756,264 158,336,814 88,026,144
LETTERS Denotes Multi Funding Sources (The sum of all sources equals the Total Funded Commitment or Total Project Budget)
New: Denotes a new project opened in the current month
Hold: Projects placed on hold by Capital Projects Department
Bold date: Denotes changes in the projected completion/ revised completion date in the current month
Status CAN Cancelled Project CL Closed CN Construction CO Close-OutD DesignDEF DeferredPC Partial Capitalization
Total FEMA Grants
Total Closed Other Fundings

JACKSON MEMORIAL HOSPITAL
MONTHLY STATUS REPORT
MAY 2013
CONSTRUCTION REPORT 51006005 EAST TOWER 2nd FLOOR PATHOLOGY LAB Funding Source: JMH Foundation Total Project Budget: $ 2,054,350 Anticipated substantial completion date: June 2013 Scope of the Work:
To upgrade and refurbish the existing Pathology Laboratory. Project Designed in Five (5) construction phases: 1.-UM Chairman Office/Bathroom, 2.-Conference Room, 3.-North Lab, 4.-South Lab/Grossing Stations 5.-Residencies Lab.
May 2013 • City of Miami CO • AHCA 80%
June 2013 • AHCA 100%
July 2013 • CLOSE OUT
51008032 EAST TOWER FLOOR – ER-RENOVATION Funding Source: GOB Total Project Budget: $ 2,406,000 Anticipated substantial completion date Phase 3: July 2013 PHASE 3 Scope of the Work:
To refurbish and upgrade the ER-B & ER-C Patient Units including all existing bathrooms within the Department, discharge/cashier’s office and staff lounge.
May 2013
• City of Miami CO June 2013
• AHCA 80%
July 2013 • AHCA 100%

JACKSON MEMORIAL HOSPITAL
MONTHLY STATUS REPORT
MAY 2013
51011117 TAYLOR BREAST CENTER RENOVATIONS Funding Source: JMH Foundation Total Project Budget: $276,000 Anticipated Construction Completion Date: July 2013 Scope of the Work: Work entails the renovation of the Taylor Breast Center located in the Diagnostic Treatment Center 1st floor. The upgrade will include renovation of the entrance / Reception Room. The Patient Changing Rooms will be relocated and converted into 3 Patient Intake areas. The Radiologist and Reading rooms will be relocated to accommodate new equipment. The upgrade will also include new furniture, paint, and lighting.
May 2013
• City of Miami building permit dry-run completed • Contractor Obtain Building Permit • Contractor Mobilization meeting
June 2013
• Begin Construction July 2013
• Construction Continues 51010096 WW-2 ANGIO SUITE Funding Source: 2005 RB Total Project Budget: $ 2,000,000 Anticipated substantial completion date: August 2013 Construction to be performed by JOC Scope of the Work: Removal of existing C-arm and replace with a new Siemens’ Zee in Interventional Radiology room #25. Renovation of abandoned Interventional Radiology area on WW2 to create a new recovery unit for Interventional Radiology. May 2013
• JOC Proposal Review with new JOC Contractor • Proposal reviewed and approved by A/E • Submit FAT to increase project budget
June 2013
• Project Pending construction start due to additional funding

JACKSON MEMORIAL HOSPITAL
MONTHLY STATUS REPORT
MAY 2013
51011118 NICU B, C AND INTERMEDIATE MODERNIZATION Funding Source: JMH Foundation Total Project Budget: $300,000 Anticipated Construction Completion Date: December 2013 Scope of the Work: The Scope of Work entails the modernization of the NICU B, C and Intermediate Units. This includes the complete renovation of the Nursing Stations, Refurbishment of Patient Bays and Replacement of flooring and Wall protection to match the existing NICU Unit A. May 2013
• Submit plans to City of Miami for dry-run • Plans approved at Miami Dade County DERM • Dade County project measures established • Design Presentation for Interior with end users
June 2013
• Procurement Prepare ITB for solicitation of contractors
51009054 ET-4 LABOR AND DELIVERY OPERATING ROOMS Funding Source: 2005 RB Total Project Budget: $2,083,950 Anticipated substantial completion date: August 2013 Scope of the Work: Scope of Work entails, remodeling and Renovation of 5 Labor and Delivery Operating Rooms and surrounding support areas at the East Tower 4th Floor – Holtz Children’s Hospital. Four (4) Operating Rooms will maintain the same size and configuration. Operating Room Five (5) will be demolished and redesigned to higher standards. Total Square footage under this contract is approximately 5,450 Sq. Ft. May 2013
• Meeting with Berchtold for finalization of drawings with clinical staff • Plans updated to incorporate City of Miami comments and resubmitted • Plans approved by DERM • City of Miami dry run complete • PO issued to contractor
June 2013
• Construction Mobilization Meeting • Storz and Berchtold Integration meeting • Mobilization meeting #1 • Permit obtain from City of Miami
July 2013
• Begin construction

JACKSON MEMORIAL HOSPITAL
MONTHLY STATUS REPORT
MAY 2013
53009055 MAIN CAMPUS / JNMC CAMPUS-WIDE LIGHTING UPGRADE Funding Source: IRB Total Project Budget: $ 780,680 Projected Construction Completion Date: September 2013 Percentage of Construction Completed 0% Scope of Work entails Campus wide outdoor lighting upgrade throughout the JMH main campus and the Jackson North Medical Center. The first phase of this project will cover the Alamo plaza and 16th street portion of the project. May 2013
• Construction Starts June 2013
• Construction Continues July 2013
• Construction Continues
51009053 EAST TOWER 2 FLOOR A/C REPLACEMENT Funding Source: IRB Total Project Budget: $ 3,119,080 Anticipated substantial completion date: April 2013 Scope of the Work:
To furnish the Five (5) custom Air Handling Units at the East Tower 2nd Floor of Holtz Children’s Hospital.
May 2013 • AHCA Architectural Comments
June 2013 • AHCA Electrical Comments
July 2013 • AHCA Survey Pick Up Comments

JACKSON MEMORIAL HOSPITAL
MONTHLY STATUS REPORT
MAY 2013
51009072 FIRE SPRINKLER UPGRADE CAMPUS WIDE Funding Source: IRB Total Project Budget: $2,316,000 Anticipated substantial completion date: March 2014 Scope of the Work The campus-wide fire protection upgrades are to address all existing NFPA fire sprinkler codes in addition to installing new automatic sprinkler systems and other system components for each building as determined deficient by state and local authority having jurisdiction. These main campus building include Central, East Tower, North Wing, Rehabilitation, South Wing, West Wing, and Utility buildings. May 2013
• Ongoing Construction – South Wing • Ongoing Construction – East Tower
June 2013 • Finish Construction – South Wing • Ongoing Construction – East Tower • Start Construction – West Wing
July 2013 • Ongoing Construction – West Wing • Ongoing Construction – East Tower
51011105 RYDER TRAUMA CENTER EXTERIOR HARDENING PROJECT Funding Source: FEMA (75%) / Capital Contribution (25%) Total Project Budget: $8,589,588 Anticipated substantial completion date: August 20, 2013 Scope of the Work The project scope of work is to structurally retrofit the building envelope. The project will be designed to install a wind abatement system of lightweight glass fiber reinforced concrete (GFRC) panels onto the Ryder Trauma Center. The components used for this wind retrofit project will meet the current Florida Building Code and Miami-Dade County specifications to withstand extreme hurricane conditions (Category IV storm conditions).
June 2013
• Time extension approved by FEMA • Final negotiations with the JOC contractor for the construction of the temporary helipad • Enter Lawson REQ and await issuance of PO to proceed with construction of the temporary helipad • Prepare solicitation documents for the RTC- Hardening project
July 2013
• Contractor mobilization for temporary helipad with a 90-day schedule • Release public solicitation for the RTC- Hardening project – Cone of Silence
August 2013
• Ongoing construction on the temporary helipad 60-day schedule • Ongoing release public solicitation for the RTC- Hardening project – Cone of Silence

JACKSON MEMORIAL HOSPITAL
MONTHLY STATUS REPORT
MAY 2013
51009069 CAMPUS WIDE ROOFING REPLACEMENT – EAST TOWER Funding Source: IRB Total Project Budget: $1,500,000 Projected Completion Date: December 2013 Scope of Work Replacement of East Tower Roof, approximately 90,000 SQFT May 2013
• Award project • Preconstruction Meetings
June 2013
• Permitting • Construction Begin
July 2013
• Continue Construction 51009046 WEST WING BASEMENT PHARMACY CLEANROOM PHASE I / CAROUSELS PHASE II Funding Source: 2005 RB Total Project Budget: $ 834,596 Projected Construction Completion Date: Phase I July 2011 / Phase II May 2013 Phase I Construction Status: 100% Phase II Construction Status: 10% Scope of Work:
Phase I: Installation of a new USP 797 complaint pharmacy clean-room in the West Wing basement. Phase II: Demolition of the old cleanroom to create an open space within the pharmacy to receive (3) new pharmaceutical carousel. This includes new finishes throughout the basement pharmacy.
May 2013
• Construction Substantial • Final AHCA and City of Miami Inspections
June 2013
• Project Closeout July 2013
• Project Closed. No Further Updates

JACKSON MEMORIAL HOSPITAL
MONTHLY STATUS REPORT
MAY 2013
53009065 JACKSON NORTH MEDICAL CENTER UTILITY PLANT REPLACEMENT Funding Source: IRB Total Project Budget: $3,100,000 Anticipated substantial completion date: December 2013 Scope of Work:
Replacement of three chillers, two boilers and supporting systems, installation of a new cooling tower. Installation of new energy management system.
May 2013
• Issue solicitation for remaining work June 2013
• Advertise Project • AHCA Approval
July 2013
• Equipment Ordering • Mobilization
51009089/E10-JMH-01 MEDIUM VOLTAGE OIL SWITCHES REPLACEMENT AND ELECTRICAL SWITCHGEARS AT CENTRAL AND SOUTH WING REPLACEMENT: Funding Source: IRB/CC Total project Budget: $7,350,000 Anticipated substantial completion date: July 2014
Scope of the Work Replace medium voltage oil switches in Central, South Wing, Institute, Rehabilitation and North Building. Central and South Wing: replace normal and emergency substations and main switchgears.
May 2013
• Phase-I: PMD is working on the ITB • Retrofill of main switchgears at Central and south Wing: scope of work is being prepared • The administration decided to reduce the SOW and existing contract/PO for WA, deleting (Phase 2 only) • WA is authorized to finish the fully designed set of construction documents per the project original design
intent, main electrical rooms for Central and South Wing
June 2013 • Phase-I: PMD is working on the ITB • Retrofill of main switchgears at Central and south Wing: scope of work is being prepared
July 2013
• Phase-I: Cone of silence • Retrofill of main switchgears at Central and south Wing: coordination procurement services with PMD

JACKSON MEMORIAL HOSPITAL
MONTHLY STATUS REPORT
MAY 2013
51009064 REPLACEMENT OF 30 AIR HANDLING UNITS Funding Source: IRB Total Project Budget: $6,541,500 Anticipated substantial completion date: September 2014 Scope of the Work:
To furnish and install thirty one (31) custom Air Handling Units:
May 2013 • Advertise project
June 2013 • Begin installation of AHU #9
July 2013
• Project Closeout
51009056/E10-JMH-02 ENERGY CENTER REPLACE PARALLELING GEAR AND NEW EMERGENCY GENERATORS Funding Source: IRB Total project Budget: $ 5,289,372 Anticipated substantial completion date: September 2014
Scope of the Work Replace paralleling system and emergency distribution switchboard; provide new engines with the capability to operate in dual-fuel mode (natural gas component). Ryder Trauma Center emergency power system will be increased, with the intention of having the entire building on emergency power.
May 2013
• UC-Integration of the Portable unit with ASCO essential gear (Phase-I): Close out • Correction of the problems found during the Integration of the Portable unit with ASCO. The three units
are working on parallel • ITB-Campus wide Energy Monitoring and Control System (EMCS) (Phase-II): being prepared by
Procurement • Consultant was instructed to finish construction plans for new generator at UC and emergency power
upgrades at Ryder Trauma (Phase-III) June 2013
• ITB-Campus wide Energy Monitoring and Control System (EMCS) (Phase-II): Cone of Silence • Continue with construction plans for new generator at UC and emergency power upgrades at Ryder Trauma
(Phase-III) July 2013
• ITB-Campus wide Energy Monitoring and Control System (EMCS) (Phase-II): select low bidder. • Continue with construction plans for new generator at UC and emergency power upgrades at Ryder Trauma
(Phase-III)

JACKSON MEMORIAL HOSPITAL
MONTHLY STATUS REPORT
MAY 2013
59007009 JMT ELEVATOR MODERNIZATIONS #141 TO #146 Funding Source: Capital Contribution / IRB Total Project Budget: $1,300,757 Projected Completion Date: March 2013 Scope of Work Modernization and cab upgrade to Elevators #141-146 in Jackson Medical Towers May 2013
• Close Out Project
51011104 WEST WING 15 NURSING UNIT MODERNIZATION Funding Source: Capital Contribution Total Project Budget: $2,588,568 Projected Completion Date: March 2014 Scope of Work entails The West Wing 15 Nursing Unit Modernization project has a vision towards creating a greater offering of single-occupancy rooms at Jackson Health System. The project’s interior renovation would create twenty-five (25) single-occupancy rooms, one (1) VIP room, and other clinical support areas to current codes, hospital standards, and modernized finishes. May 2013
• Pre-Construction Coordination June 2013
• Area move out • Abatement • Construction commencement
July 2013
• Construction

JACKSON MEMORIAL HOSPITAL
MONTHLY STATUS REPORT
MAY 2013
52012104 JSCH HELIPAD Funding Source: Capital Contribution Total Project Budget: $1,459,072 Projected Completion Date: October 2013 Scope of Work Design and installation of a new helipad platform above existing emergency department. Project also includes construction of a 2-level tower that will house a double patient bed capacity elevator to service the helipad. May 2013
• Obtain Building Permit • Commence Construction
June 2013
• Construction
July 2013 • Construction
51009036 WEST WING AND CENTRAL FIRE ALARM UPGRADE PROJECT Funding Source: IRB Total Project Budget: $2,350,000 Projected Completion Date June 2013 Scope of Work Design and upgrade of existing patient occupancy towers for: West Wing and Central buildings, replace all audio/visual devices provide new speakers, all older model addressable ceiling smoke detectors, heat sensors, manual pull station and duct detectors must be replaced, flow and tamper annunciation modules must be upgraded. Connect these building to the fire alarm loop/network. May 2013
• West Wing: Ongoing City of Miami Fire Marshall Inspections • Central building: Fire Smoke Dampers are being tested • Central building: fire inspections pending, will start upon final acceptance of West Wing tower by city
inspector June 2013
• West Wing: Ongoing City of Miami Fire Marshall inspections • Central Building fire inspections pending will start upon final acceptance of West Wing tower by city
inspector July 2013
• West Wing: begging demolition • Central Building: Ongoing City of Miami Fire Marshall inspections

JACKSON MEMORIAL HOSPITAL
MONTHLY STATUS REPORT
MAY 2013
51009062/E10-JMH-03 P-00967 FIRE ALARM UPGRADE AT JACKSON MEMORIAL HOSPITAL Funding Source: IRB Total project Budget: $ 4,429,495 Anticipated substantial completion date: March 2014
Scope of the Work Design and upgrade of existing hospital and business occupancy floor for: Rehabilitation, Trauma, Mental Health and Jackson Medical Towers buildings, replace all audio/visual devices provide new speakers, all older model addressable ceiling smoke detectors, heat sensors, manual pull station and duct detectors must be replaced, flow and tamper annunciation modules must be upgraded. Connect these building to the fire alarm loop/network. May 2013
• Ongoing Construction at Patient Towers: o NW is 100% installed, it is being inspected by Fire Inspector o Rehab is 90% installed, the following is a summary of the findings:
1. Basement installation 100% completed but not tested 2. First, Second and third floor installation 100% completed but not tested 3. Roof and upper areas 90% not tested 4. New Fire Panel is installed and operational, pending of final test 5. Contract drawings called for a new Electric Panel board to feed new NACs
o Mental Health: Programming is being completed o East Tower: permit plans being submitted o Trauma building: plans are done, NTP is not release pending SG close out North Wing
• Ongoing Design Services – Track the completion of non-patient towers: o Park Plaza East – Finished. o Park Plaza West – Finished. o Jackson Medical Towers – 50% CD
June 2013 • Ongoing Construction at Patient Towers:
o NW is 100% installed, Fire Inspector added comments o Rehab is 100% installed o Trauma is pending. NTP is not release pending SG close out North Wing o Mental Health: Programming is being completed o East Tower: permit plans being submitted
• Ongoing Design Services – Track the completion of non-patient towers: o Park Plaza East – Finished o Park Plaza West – Finished o Jackson Medical Towers – 50% CD
July 2013 • Ongoing Construction at Patient Towers:
o NW is 100% installed, Fire Inspector added comments o Rehab is 100% installed o Trauma is pending. NTP is not release pending SG close out North Wing o Mental Health: Programming is being completed o East Tower: permit plans being submitted
• Ongoing Design Services – Track the completion of non-patient towers: o Park Plaza East – Finished o Park Plaza West – Finished o Jackson Medical Towers – 50% CD

Campus Wayfinding Public Health Trust Financial Recovery Board
Facilities Subcommittee
Matthew I. Pinzur, Associate VP, Communication & Outreach Madeline Valdes, Corporate Director, Property Management
May 23, 2013

Timeline
Completed • Campus Map • Mass Transit Map
Final Development • Appointment Slip Maps
Phase I • FY 2013 • Major Building • Exterior Pedestrian
• Digital Monuments • Visitor-Friendly Entrances
Phase II • FY 2014-15 • Interior
• Entrances • Elevators
Ongoing •Road Signage
•Coordinated with City of Miami •Smartphone Wayfinding
•Integrated with app development in 2013-14

Campus Maps
Blank for reception employees to hand-write destination

Campus Maps

Appointment Slip Maps

Appointment Slip Maps

Appointment Slip Maps

Appointment Slip Maps

Appointment Slip Maps

Digital Wayfinding - Examples

Digital Wayfinding - Examples
Jackson Memorial
Hospital
Diagnostic & Treatment Center
West Wing
South Wing
Holtz Children’s
ACC Clinics
Emergency Rooms
Trauma Center
Behavioral Health
Park Plaza West (Green Garage)

Digital Wayfinding - Examples
HURRICANE INFORMATION
All clinics and elective
surgeries have been canceled through Friday. Please call
305-585-XXXX to reschedule.
All emergency rooms remain
open.
Stay Connected with Jackson
JacksonHealth
@JacksonHealth
Need Assistance?
Guest Services 305-585-XXXX
Security
305-585-XXXX

Digital Wayfinding - Locations

Visitor-Friendly Entrances
• Building Names On All Public Entrances
• Visitor-Friendly Rerouting on Staff-Only Doors
• West Wing Ambulance Bay
• Central Elevator Staff Entrance
• DTC – Behind Cafeteria

Major Building Signage
Visible & Useful
• Maximize Vehicular and Pedestrian Visibility
• Blue in daylight; illuminated white at night
• Brand Consistent
• Attractive
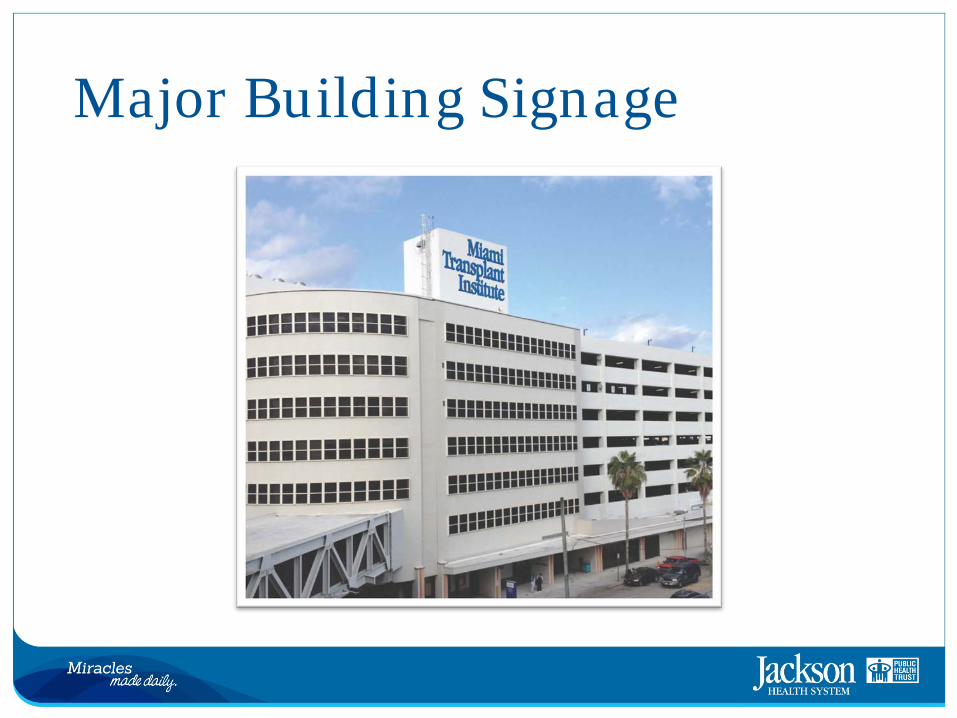
Major Building Signage

Major Building Signage

Major Building Signage

Major Building Signage
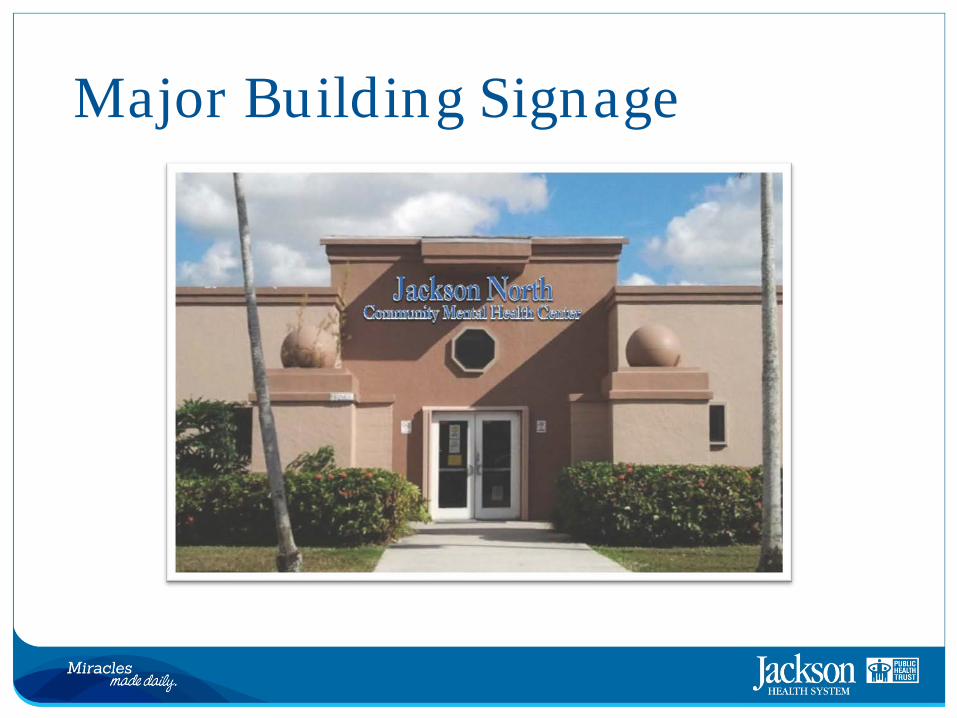
Major Building Signage

Interior Wayfinding
Directing Patients From Lobbies and Elevators
• User Friendly
• Digital
• Consistent

Questions?

FISCAL COMMITTEE

PUBLIC HEALTH TRUST FINANCIAL RECOVERY BOARD
Fiscal Committee Joe Arriola, Chairperson Darryl K. Sharpton, Vice Chairperson Michael Bileca Marcos Jose Lapciuc Stephen S. Nuell Mojdeh Khaghan Irene Lipof
Date , Time and Location May 23, 2013 – To follow the Purchasing and Facilities Subcommittee meeting Ira C. Clark Diagnostic Treatment Center Conference Room 259
AGENDA
1. Approval of the Previous Meeting Minutes (Joe Arriola, Chairperson)
(a) Meeting Minutes as of April 18, 2013
2. *KPMG Management Letter - JMH Health Plan (Mark T. Knight, Executive Vice President and Chief Financial Officer, Jackson Health System) 3. *Review of the Combined Financial Statements as of April 2013 (Mark T. Knight, Executive Vice President and Chief Financial Officer, Jackson Health System)
4. Cost Accounting Update
(Brian Dean, Senior Vice President, Finance Division, Jackson Health System) 5. *Accounts Receivable Aging Report as of April 2013 (Carmen Pla, Vice President, Patient Financial Services Division, Jackson Health System) 6. Review and Recommend Approval of the Following Resolutions for Contracts & Agreements:
(a) * Resolution approving Settlement of Complaint for damages in South Broward Hospital District D.B.A. Memorial Hospital Pembroke v. JMH Health Plan, filed Under Case No. COWE 13-003349 in the County Court in and for Broward County, Florida in the amount of $9,523.00 (Brian Dean, Senior Vice President, Finance Division, Jackson Health System)
(b) *Resolution approving Settlement of Small Claims Compliant for damages in South
South Broward Hospital District D.B.A. Memorial Regional Hospital v. Christian Rhau, Public Health Trust of Dade County D.B.A. Jackson Health Plan, filed under Case No. COWE 13-2972 in the County Court in and for Broward County, Florida in the amount of $3,086.00 (Brian Dean, Senior Vice President, Finance Division, Jackson Health System)

Fiscal Committee Meeting Agenda May 23, 2013 Page 2
(c) *Resolution authorizing Sandra L. Dorski, Director of Risk Management to direct the Trustees of the Public Health Trust’s Risk Management Liability Account to conduct business including payment of Tort Claims, as requested by the Trustee Agreement between Sun Trust Bank and the Public Health Trust, superseding prior resolutions (Mark T. Knight, Executive Vice President and Chief Financial Officer, Jackson Health System)
7. Purchasing and Facilities Subcommittee Report (Darryl K. Sharpton, Chairperson, Purchasing and Facilities Subcommittee)
(a) *Review and Recommend Approval of the May 2013 Purchasing Report The items noted with an asterisk (*) indicate that the supporting documents are attached.

1. Approval of the Previous Meeting Minutes

PUBLIC HEALTH TRUST FINANCIAL RECOVERY BOARD Fiscal Committee Joe Arriola, Chairperson Darryl K. Sharpton, Vice Chairperson Michael Bileca Mojdeh L. Khaghan Marcos Jose Lapciuc Stephen S. Nuell Date, Time and Location April 18, 2013 – Followed the Purchasing and Facilities Subcommittee meeting Ira C. Clark Diagnostic Treatment Center Conference Room 259
ATTENDANCE
Fiscal Committee Darryl K. Sharpton Stephen S. Nuell
Mojdeh L. Khaghan Marcos Jose Lapciuc Joe Arriola Excused Michael Bileca
Jackson Health System Carlos A. Migoya Brian Dean Carmen Pla Mark T. Knight Don S. Steigman Miami Dade College Irene Lipof
Miami-Dade County Attorneys
Eugene Shy, Jr. Christopher Kokoruda

Fiscal Committee Meeting April 18, 2013 Page 2 Meeting Called to Order With a quorum being present, the meeting of the Fiscal Committee was called to order at 8:54 a.m. by Joe Arriola, Chairperson, Fiscal Committee. 1. Approval of the Previous Meeting Minutes
(a) Meeting Minutes as of March 14, 2013.
Mr. Arriola requested a motion approving the meeting minutes of March 14, 2013. Mr. Nuell moved approval; seconded by Ms. Khaghan, and carried without dissent. 2. Review and Recommend to Accept the JMH Health Plan 2012 Audit
Mojdeh L. Khaghan, Chairperson, Audit and Compliance Subcommittee reported that the Subcommittee met on April 18, 2013. A presentation of the JMH Health Plan 2012 Audit was conducted by Karen Mitchell, Partner, KPMG. At the conclusion of the audit presentation the Subcommittee agreed that the information presented was sufficient and appropriate to provide a basis for acceptance. The Subcommittee approved to accept the JMH Health Plan 2012 Audit as presented and forward it to the Fiscal Committee for acceptance. A Copy of the JMH Health Plan 2012 Audit was included with the agenda. Mr. Arriola requested a motion to accept the JMH Health Plan 2012 Audit as presented. Ms. Khaghan moved approval; seconded by Mr. Nuell, and carried without dissent.
3. Financial Statements Report as of March 2013
Mark T. Knight, Executive Vice President and Chief Financial Officer, Jackson Health System (JHS) presented the results of the Financial Statements ending March 31, 2013. A review of the Financial Statements Report included Key Performance Indicators, Combined Balance Sheet, and Combined Statement of Revenue, and Expenses & Change in Fund Net Assets. A detailed copy of the Financial Statements was included with the agenda. Following the Financial Statements Report, there was some discussion regarding revenue over expense, length of stay and what is being done to better monitor as well as review initiatives and opportunities to reduce length of stay, costs related to Jackson Main, Jackson North Medical Center and Jackson South Community Hospital, ways to refine the productivity system, initiatives to reduce overtime, service line development, and focus on changes that would attract physicians.
• Monthly Line of Credit Activity Report As of March 31, 2013 the ending balance $11,325,227, periodic interest and fees for the month totaled $25,227. A payment of $2,775,227 was made on April 1, 2013 and will be reflected in the April report. A copy of the report was distributed at the meeting.
• Days in Accounts Payable Report Six months into FY 2013 the days in AR is 59.78 versus 94.13 from prior year. JMH Health Plan and University of Miami Annual Operating Agreement payments were included in the calculation. The daily spending rated is comprised of supplies, purchased services and other expenses. A copy of the reported was distributed at the meeting.

Fiscal Committee Meeting April 18, 2013 Page 3 6. Contracts and/or Agreements Recommended for Approval
(a) Lip Cost Limit Agreement
Resolution authorizing the President and CEO of the Public Health Trust to negotiate and execute an Interlocal Agreement between the Public Health Trust, South Broward Hospital District doing business as Memorial Health System, and North Broward Hospital District doing business as Broward Health, for purposes of designating Low Income Pool funds to those taxing districts for demonstration year 5 to resolve excess Low Income Pool payment reconciliation matters, with transaction costs not to exceed six million dollars ($6,000,000.00) (Mark T. Knight, Executive Vice President and Chief Financial Officer, Jackson Health System)
Mr. Knight presented for approval the LIP Cost Limit Agreement. Approval of the agreement would authorize the President to execute the Interlocal Agreement between the Trust, North Broward Hospital District and South Broward Hospital District for purposes of resolving excess payment reconciliation matters with transaction costs not to exceed $6,000,000.
Mr. Arriola requested a motion for the item.
Mr. Nuell moved approval; seconded by Mr. Sharpton, and carried without dissent.
(b) Conflict Waiver Request – Greenberg Traurig
Mr. Knight requested that the item be deferred. At 9:55 a.m. the Fiscal Committee ended in recess. The Fiscal Committee meeting resumed at 12:34 p.m. 4. Cost Accounting Update
Brian Dean, Senior Vice President, Finance Division, Jackson Health System reported that there were some program issues that were resolved. In an effort to refine costs individual meetings will be scheduled with service lines representatives. The Committee will be kept informed as the Cost Accounting System implementation process continues.
5. Accounts Receivable Aging Report as of March 2013
Carmen Pla, Vice President, Patient Financial Services, Jackson Health System, presented the Accounts Receivable Aging Report as of March 2013. Cash collections for the month was short of its goal, POS cash remains to be strong, Medicaid conversion showed a slight decrease, denials increased, and revenue integrity remain flat.

Fiscal Committee Meeting April 18, 2013 Page 4 7. Purchasing and Facilities Subcommittee Report
Darryl K. Sharpton, Chairperson, Purchasing and Facilities Subcommittee reported that the Subcommittee met on April 18, 2013. The Subcommittee received routine monthly reports, reviewed and approved the April 2013 Purchasing Report and reviewed and approved agenda items 7 (b) and 7 (c)) (Support document for agenda item 7 (b)) and forwarded them to the Fiscal Committee with a recommendation for approval. (a) Review and Recommend Approval of the Purchasing Report (1) Purchasing Report as of April 2013
Mr. Arriola requested a motion approving the April 2013 Purchasing Report.
Mr. Nuell moved approval; seconded by Mr. Sharpton
and carried without dissent.
(b) Resolution Recommended to be Approved
Resolution Authorizing the President or his designee to enter into a Lease Agreement With Sikma Corporation, a Florida Corporation for the Rental of three thousand eight hundred eighty six (3,886) square feet of office space in Suite 230 at the Regency Medical Center Building, located at 9195 Sunset Drive, Miami, Florida 33173 for a period of four years commencing on September 1, 2012, with a one (1) four year option to extend, for an annual payment of One Hundred Thirty-Three Thousand and Sixty Seven Dollars ($133,067) with an annual increase in base rent of three percent (3%) (Madeline Valdes, Corporate Director, Property Management Division, Jackson Health System)
(c) Support document for agenda item 7 (b) Mr. Arriola requested a motion approving agenda items 7 (b) and 7 (c). Mr. Nuell moved approval; seconded by Mr. Sharpton
and carried without dissent.
Meeting Call to Adjourn The meeting of the Fiscal Committee adjourned at 12:41 p.m. Transcribed by Ivenette Cobb-Black Executive Assistant Public Health Trust Financial Recovery Board


PUBLIC HEALTH TRUST
JACKSON HEALTH SYSTEM
COMBINED FINANCIAL STATEMENTS
April 30, 2013

PUBLIC HEALTH TRUST
JACKSON HEALTH SYSTEM
COMBINED FINANCIAL STATEMENTS
April 30, 2013
INDEX
1. Key Performance Indicators
2. Combined Balance Sheet
3. Combined Statement of Revenues, Expenses & Changes in Fund Net Assets
3A. Combined Statement of Revenues, Expenses & Changes in Fund Net Assets
excluding Division of Managed Care
4. P &L 12 Month Trend Analysis
5. Combining Statement of Revenue & Expense Reflecting Allocated Corporate
Overhead & Public Support Funding /Month
6. Combining Statement of Revenue & Expenses Reflecting Allocated
Corporate Overhead & Public Support Funding /YTD
7. Combining Statement of Revenue & Expenses by Company
8. Combined Statement of Unrestricted/Restricted Cash Flow
9. Consolidated Portfolio Inventory Summary by Security /Account Type
10. Sales Tax Monthly Income Trend Analysis
11. Payor Mix Patient Days as % of Total Fiscal Year 2011-2012

(a) (b) (f) (g) (h) (i) (j) (k)
YTD Apr-13 Apr-13 Apr-12 Mar-13 YTD YTD YTD
Benchmark Status Actual Budget Actual Budget Prior Budget Prior Actual Actual Budget 2012 Budget Prior Budget Prior
JHS Financial
(1) Net Patient Revenue 85,248 83,306 85,897 1,942 (649) 2.3% (0.8)% 80,424 580,305 590,410 583,183 (10,105) (2,878) (1.7)% (0.5)%
(2) Other Operating Revenue 14,742 14,648 15,076 94 (334) 0.6% (2.2)% 19,245 105,849 102,323 138,904 3,526 (33,055) 3.4% (23.8)%
(4) Total Operating Revenue 99,990 97,954 100,973 2,036 (983) 2.1% (1.0)% 99,669 686,154 692,733 722,087 (6,579) (35,933) (0.9)% (5.0)%
(6) Total Operating Expenses 125,978 124,528 129,912 (1,450) (3,934) (1.2)% (3.0)% 127,286 885,512 888,829 960,669 3,317 75,157 0.4% 7.8%
(7) Gain and (Loss) from Operations (25,988) (26,574) (28,939) 586 2,951 2.2% 10.2% (27,617) (199,358) (196,097) (238,581) (3,261) 39,223 (1.7)% 16.4%
(8) Total Net Non-operating Items (before GOB & Special Contributions) 30,214 29,247 28,976 967 1,238 3.3% 4.3% 30,799 213,423 211,559 209,561 1,863 3,862 0.9% 1.8%
(9) Excess of Revs Over (Under) Expenses before GOB & Special Contrib. 4,226 2,673 37 1,553 4,189 58.1% 11,321.6% 3,182 14,065 15,463 (29,020) (1,398) 43,085 (9.0)% 148.5%
(10) GOB & Special Contributions 1,700 - 806 1,700 894 0.0% 110.9% 437 3,969 - 8,499 3,969 (4,531) 0.0% (53.3)%
(11) Excess of Revenues Over (Under) Expenses 5,926 2,673 843 3,253 5,083 121.7% 603.0% 3,618 18,034 15,463 (20,522) 2,571 38,556 16.6% 187.9%
(12) Unrestricted Health Care Surtax 17,575 16,558 16,292 1,017 1,283 6.1% 7.9% 18,331 125,259 122,628 120,658 2,631 4,601 2.1% 3.8%
(13) Miami Dade County Unrestricted Funds 11,094 11,094 11,085 0 9 0.0% 0.1% 11,094 77,658 77,657 77,595 1 63 0.0% 0.1%
(14) Discharged Not Final Billed (DNFB) HIM 3,151 21,000 17,232 17,849 14,081 85.0% 81.7% 5,318 3,151 21,000 17,232 17,849 14,081 85.0% 81.7%
Financial Ratios
(15) Net Patient Revenue per Adjusted Patient Day 1,620 1,843 1,731 (224) (111) (12.1)% (6.4)% 1,648 1,772 1,869 1,833 (97) (61) (5.2)% (3.3)%
(16) Total Cost per Adjusted Patient Day 2,676 2,755 2,924 79 248 2.9% 8.5% 2,608 2,705 2,814 3,020 110 315 3.9% 10.4%
Liquidity Indicators
(17) Days Net in Receivable 45.9 50.97 39.45 48.15 (11.52) (2.82) (29.2)% (5.9)% 51.96 50.97 39.45 48.15 (11.52) (2.82) (29.2)% (5.9)%
(18) Days (Unrestricted) Cash on Hand 174.8 21.23 35.80 16.47 (14.57) 4.76 (40.7)% 28.9% 18.75 21.23 35.80 16.47 (14.57) 4.76 (40.7)% 28.9%
(19) Current Ratio 2.4 1.01 0.91 0.72 0.10 0.29 10.8% 40.7% 0.97 1.01 0.91 0.72 0.10 0.29 10.8% 39.8%
(20) Cash (Unrestricted) to Debt Ratio 1.29 0.23 0.24 0.19 (0.01) 0.04 (5.8)% 22.9% 0.20 0.23 0.24 0.19 (0.01) 0.04 (5.8)% 19.7%
Utilization
(21) Admissions excl. Newborn 4,847 5,117 4,872 (270) (25) (5.3)% (0.5)% 4,827 34,010 36,009 35,594 (1,999) (1,584) (5.6)% (4.5)%
(22) Admissions % through ED 63.85% N/A 68.31% (4.5)% 0.0% (6.5)% 64.80% 64.07% N/A 70.19% 0.0% 0.0%
(22) Observation Equivalent Days 1,312 835 1,009 477 303 57.1% 30.0% 1,352 8,407 5,861 6,044 2,546 2,363 43.4% 39.1%
(23) Hospital Patient Census Days excl. Newborn 32,510 31,758 30,966 752 1,544 2.4% 5.0% 34,296 231,195 222,511 223,033 8,684 8,162 3.9% 3.7%
(24) Average Length of Stay 4.5 6.71 6.21 6.36 (0.50) (0.35) (8.1)% (5.5)% 7.11 6.80 6.18 6.27 (0.62) (0.53) (10.0)% (8.4)%
(25) Outpatient Visits 30,417 27,320 28,960 3,097 1,457 11.3% 5.0% 28,132 197,915 196,074 194,833 1,841 3,082 0.9% 1.6%
(26) JMH Number of O/R Cases 1,230 1,249 1,186 (19) 44 (1.5)% 3.7% 1,116 8,058 8,919 8,446 (861) (388) (9.7)% (4.6)%
(27) Overtime % of Productive Hours 3.00% N/A N/A 3.55% 3.19% N/A N/A
FTE's
(28) JHS FTE per Adjusted Occupied Bed 6.65 6.29 6.39 6.91 0.10 0.62 1.5% 9.0% 6.31 6.41 6.44 6.76 0.03 0.35 0.5% 5.2%
(29) Jackson Health System FTE's 9,875 9,630 10,237 (245) 362 (2.5)% 3.5% 9,929 9,900 9,598 10,095 (302) 195 (3.1)% 1.9%
Payor Mix Self Pay Patient Days as % of Total
(30) Jackson Memorial Hospital 13.41% 16.90% 17.70% 3.49% 4.29% 20.7% 24.2% 13.80% 13.62% 17.02% 17.20% 3.40% 3.58% 20.0% 20.8%
(31) Jackson North 10.08% 14.05% 18.20% 3.97% 8.12% 28.3% 44.6% 10.50% 11.18% 14.06% 14.90% 2.88% 3.72% 20.5% 25.0%
(32) Jackson South 15.63% 19.34% 17.20% 3.71% 1.57% 19.2% 9.1% 14.50% 14.95% 19.19% 19.40% 4.24% 4.45% 22.1% 22.9%
(33) Inpatient Charges as Percent of Total 69.07% 70.27% 69.71% 1.20% 0.64% 1.7% 0.9% 70.27% 70.61% 70.45% 70.12% 0.16% 0.49% 0.2% 0.7%
(34) Realization Rate 25.29% 24.80% 25.96% -0.49% 0.67% (2.0)% 2.6% 23.15% 24.70% 24.88% 24.55% -0.18% 0.15% (0.7)% 0.6%
Key: Positive variance or no major concerns
Year-to-date numbers are ok or explained, but concern for future trend
Negative variance or area of current concern
Variance are Favorable (positive number) and Unfavorable (negative number)
(l)
$ Variance % Variance $ YTD Variance % YTD Variance
NEW KEY PERFORMANCE INDICATORS Fiscal Year 2012 - 2013
(Dollars in 000)
(e) (d) (e)
FS-1

Mar 13 Dollar Change Sep 12
72,200 9,235
21,444 3,335
15,129 28,567
671,900 1,604
(524,866) (4,892)
147,034 (3,287)
92,023 (41,969)
44,600 1,273
4,509 (389)
23,393 144
5,850 309
426,182 (2,782)
0 0
22,909 590
59,165 (823)
444,585 (1,739)
6,981 (25)
533,640 (1,996)
959,822$
7,325 0
120,333 (7,994)
124,162 4,869
117,866 (10,852)
18,614 (667)
6,078 51
43,384 (2,591)
437,762 (17,185)
350,598 29
71,293 6,451
859,653 (10,705)
(66,775) 1,973
163,185 3,501
3,758 452
100,168 5,926 88,059
959,822$
Notes* Reserves for AR is comprised of $348 million in cont. adjustments, $41 million in charity care
and $141 million in prov. for doubtful accounts.** Amounts due to the University total $29.3 million of which $18 million is reported in other current liab.
and the remaining $11.3 million is reported in other liabilities.
Public Health Trust of Miami-Dade County (Consolidated)
Combined Balance Sheet
April 2013
(Amounts in thousands)
Apr 13 Dollar Change
ASSETS:
Cash and Investments 81,436 51,148 30,288
Cash and Investments Restricted 24,779 18,204 6,574
Cash and Investments Limited as to Use 43,695 12,088 31,607
Gross Patient Accounts Receivable 673,504 675,129 (1,624)
Allowances for Contractuals and Bad Debt (529,758) (525,109) (4,649)
Net Accounts Receivable 143,746 150,019 (6,273)
Third Party Receivable 50,054 152,724 (102,670)
Due From Miami-Dade County 45,873 33,247 12,626
Other Receivables - Restricted 4,121 3,861 259
Inventories 23,537 23,854 (317)
Prepaid Expenses and Other Current Assets 6,159 5,079 1,080
Total Current Assets 423,400 450,224 (26,825)
Due From Restricted Funds 0 0 0
Cash and Investments Limited as to Use - LT 23,499 24,085 (586)
Cash and Investments Restricted - LT 58,342 66,575 (8,233)
Capital Assets, Net 442,846 462,237 (19,390)
Other Assets 6,956 6,925 31
Total Non-Current Assets 531,643 559,822 (28,178)
Total Assets 955,043$ (4,779)$ 1,010,046$ (55,003)$
Current Portion of Long Term Debt 7,325 7,325 0
Accounts Payable and Accrued Expenses 112,338 138,431 (26,093)
Accrued Salaries and Payroll Taxes Withheld 129,031 132,835 (3,803)
Due to Other Third Party 107,013 156,821 (49,808)
Due to Miami-Dade County 17,948 23,791 (5,844)
Other Restricted 6,128 6,696 (568)
Other Current Liabilities 40,793 29,458 11,335
Total Current Liabilities 420,577 495,358 (74,781)
Long Term Debts, Excluding Current Portion 350,627 350,425 201
Other Liabilities 77,744 76,203 1,541
Total Liabilities 848,948 921,987 (73,038)
NET ASSETS:
Unrestricted Net Assets (64,802) (100,850) 36,049
Invested in Capital Assets 166,686 185,409 (18,723)
Restricted Net Assets 4,210 3,501 709
Total Net Assets 106,095 18,035
FS-2
Total Liabilities & Net Assets 955,043$ (4,779)$ 1,010,046$ (55,003)$

April 2013
Combined Statement of Revenue, Expenses & Change in Fund Net AssetsPublic Health Trust of Miami-Dade County
(Amounts in thousands)
Apr 13
Actual
Apr 12
Actual
Apr 13
Budget
$ Variance
Month of April 2013
Apr 13 Actual
YTD
Apr 13
Budget YTD
Apr 12 Actual
YTD
7 Months Ended April 30, 2013
Budget Prior
% Variance
PriorBudget
$ Variance
PriorBudget
% Variance
PriorBudget
83,063 2,075 81,368 Hospital and physician services 564,974 574,039 (9,065) 559,070 80,988 5,904 1 %(2)% 1,695 3 % 2 %
226 Community Medical Practices 214 12 1,367 1,567 1,514 52 8,493 (6,926) (82)% 3 %(1,141) 5 % (83)%
Primary Care Centers 155 196 (41) 774 1,107 1,389 (282) 2,355 (1,248) (53)%(20)%(619) (21)% (80)%
1,804 Continuing Care (SNF) 1,907 (103) 2,388 12,659 13,468 (808) 13,266 (584) (5)% (24)% (606) (6)% (5)%
Net Patient Service Revenue 85,248 83,306 1,942 85,896 580,307 590,410 (10,103) 583,183 (2,876) 0 %(2)%(648) 2 % (1)%
Division of Managed Care 6,563 7,249 (686) 7,214 49,227 50,025 (798) 90,293 (651) (9)% (9)% (41,066) (2)% (45)%
1,502 (393) 1,882 Grants Revenue 12,083 13,393 (1,311) 12,920 1,895 (837) (6)%(10)%(380) (21)% (20)%
6,677 1,174 5,980 Other Operating Revenue 44,539 38,904 5,634 35,692 5,504 8,847 25 % 14 % 697 21 % 12 %
2,036 Total Operating Revenue (6,578) 99,990 97,954 100,973 686,155 692,733 722,088 (983) 2 % (1)% (35,933) (1)% (5)%
66,919 (3,201) 70,789 Salaries & Related Costs 468,860 448,358 (20,503) 509,512 63,718 40,652 8 %(5)% 3,870 (5)% 5 %
27,873 1,392 30,600 Contractual and Purchased Serv. 204,039 214,215 10,176 198,375 29,266 (5,665) (3)% 5 % 2,727 5 % 9 %
Division of Managed Care - Paid Claims 6,950 7,174 224 4,902 49,779 50,216 437 82,517 (2,048) 3 % (42)% 32,739 1 % 40 %
16,591 (823) 14,655 Supplies 109,442 111,780 2,338 104,856 15,769 (4,586) (4)% 2 %(1,936) (5)% (13)%
4,534 737 5,556 Depreciation 33,138 40,939 7,801 41,526 5,271 8,388 20 % 19 % 1,022 14 % 18 %
1,487 34 1,470 Interest 10,083 10,646 563 10,248 1,521 165 2 % 5 %(17) 2 % (1)%
1,623 188 1,940 Other Operating Expenses 10,171 12,675 2,504 13,635 1,811 3,464 25 % 20 % 317 10 % 16 %
125,978 124,528 (1,450) 129,912 Total Operating Expenses 885,512 888,829 3,317 960,669 3,935 (1)% 3 % 75,157 0 % 8 %
(25,988) (26,574) 586 Gain (Loss) From Operations (199,357) (196,097) (3,261)(238,581)(28,940) 2,952 2 % 10 % 39,224 (2)% 16 %
48 (30) 76 Investment Income 361 549 (187) 626 78 (264) (42)%(34)%(29) (39)% (38)%
1,498 (20) 1,524 Other Income 10,146 10,725 (579) 10,687 1,518 (540) (5)%(5)%(26) (1)% (2)%
11,094 0 11,085 Dade County Unrestricted Funds 77,657 77,657 0 77,594 11,094 64 0 % 0 % 9 0 % 0 %
17,575 1,017 16,292 Unrestricted Health Care Surtax 125,258 122,628 2,630 120,654 16,558 4,603 4 % 2 % 1,283 6 % 8 %
30,214 29,247 967 28,976 Total Non-Operating Gain Net 213,423 211,559 1,864 209,561 1,238 3 % 4 % 3,862 1 % 2 %
4,226 2,673 1,553 37 Revenue & Gain in Excess of Exp. & Loss 14,066 15,463 (1,397)(29,020) 4,190 58 %(11463)% 43,086 9 % 148 %
0 0 0 Capital Contributions – Grants and Other 0 0 0 0 0 0 0 % 0 % 0 0 % 0 %
1,700 1,700 0 JM Foundation 2,268 0 2,268 0 0 2,268 0 % 0 % 1,700 0 % 0 %
0 0 806 Miami Dade County GOB 1,701 0 1,701 8,499 0 (6,798) (80)% 0 %(806) 0 % (100)%
5,926 2,673 3,253 843 Revenue & Gain after Extraordinary Loss 18,035 15,463 2,572 (20,521) 5,083 122 % (603)% 38,556 (17)% 188 %
FS-3
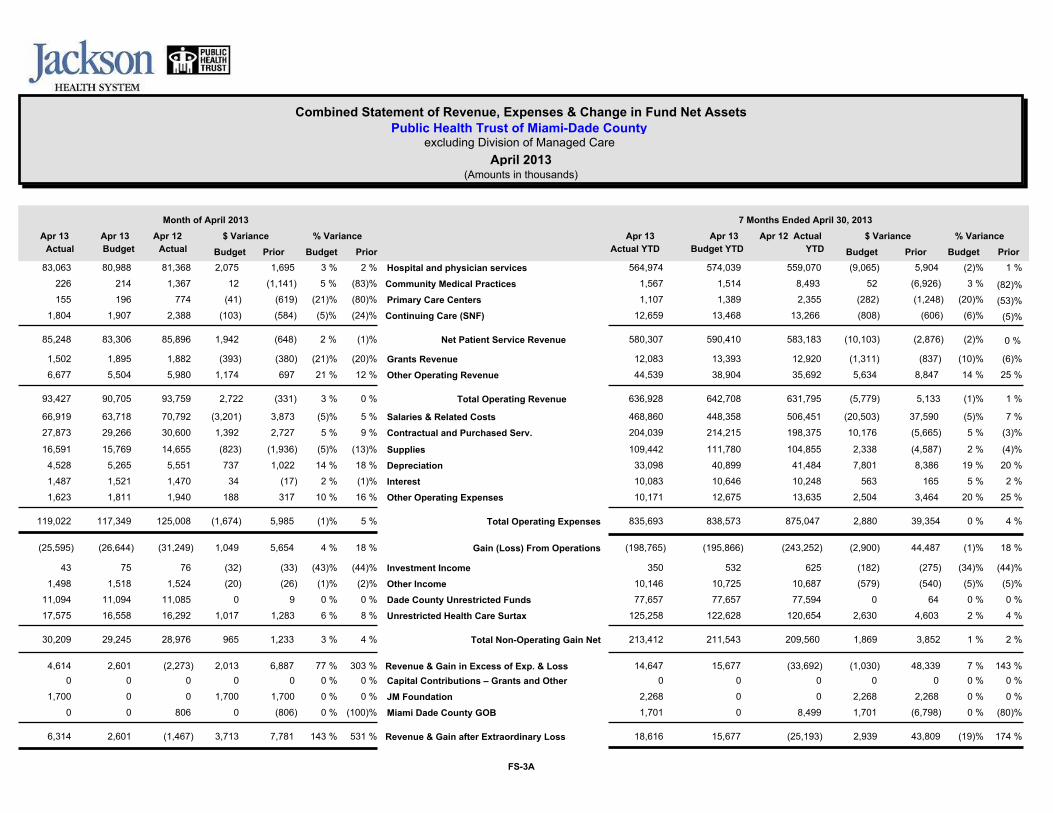
April 2013
Combined Statement of Revenue, Expenses & Change in Fund Net AssetsPublic Health Trust of Miami-Dade County
(Amounts in thousands)
excluding Division of Managed Care
Apr 13
Actual
Apr 12
Actual
Apr 13
Budget
$ Variance
Month of April 2013
Apr 13
Actual YTD
Apr 13
Budget YTD
Apr 12 Actual
YTD
7 Months Ended April 30, 2013
Budget Prior
% Variance
PriorBudget
$ Variance
PriorBudget
% Variance
PriorBudget
83,063 2,075 81,368 Hospital and physician services 564,974 574,039 (9,065) 559,070 80,988 5,904 1 %(2)% 1,695 3 % 2 %
226 Community Medical Practices 214 12 1,367 1,567 1,514 52 8,493 (6,926) (82)% 3 %(1,141) 5 % (83)%
Primary Care Centers 155 196 (41) 774 1,107 1,389 (282) 2,355 (1,248) (53)%(20)%(619) (21)% (80)%
1,804 Continuing Care (SNF) 1,907 (103) 2,388 12,659 13,468 (808) 13,266 (584) (5)% (24)% (606) (6)% (5)%
Net Patient Service Revenue 85,248 83,306 1,942 85,896 580,307 590,410 (10,103) 583,183 (2,876) 0 %(2)%(648) 2 % (1)%
1,502 (393) 1,882 Grants Revenue 12,083 13,393 (1,311) 12,920 1,895 (837) (6)%(10)%(380) (21)% (20)%
6,677 1,174 5,980 Other Operating Revenue 44,539 38,904 5,634 35,692 5,504 8,847 25 % 14 % 697 21 % 12 %
2,722 Total Operating Revenue (5,779) 93,427 90,705 93,759 636,928 642,708 631,795 (331) 3 % 0 % 5,133 (1)% 1 %
66,919 (3,201) 70,792 Salaries & Related Costs 468,860 448,358 (20,503) 506,451 63,718 37,590 7 %(5)% 3,873 (5)% 5 %
27,873 1,392 30,600 Contractual and Purchased Serv. 204,039 214,215 10,176 198,375 29,266 (5,665) (3)% 5 % 2,727 5 % 9 %
16,591 (823) 14,655 Supplies 109,442 111,780 2,338 104,855 15,769 (4,587) (4)% 2 %(1,936) (5)% (13)%
4,528 737 5,551 Depreciation 33,098 40,899 7,801 41,484 5,265 8,386 20 % 19 % 1,022 14 % 18 %
1,487 34 1,470 Interest 10,083 10,646 563 10,248 1,521 165 2 % 5 %(17) 2 % (1)%
1,623 188 1,940 Other Operating Expenses 10,171 12,675 2,504 13,635 1,811 3,464 25 % 20 % 317 10 % 16 %
119,022 117,349 (1,674) 125,008 Total Operating Expenses 835,693 838,573 2,880 875,047 5,985 (1)% 5 % 39,354 0 % 4 %
(25,595) (26,644) 1,049 Gain (Loss) From Operations (198,765) (195,866) (2,900)(243,252)(31,249) 5,654 4 % 18 % 44,487 (1)% 18 %
43 (32) 76 Investment Income 350 532 (182) 625 75 (275) (44)%(34)%(33) (43)% (44)%
1,498 (20) 1,524 Other Income 10,146 10,725 (579) 10,687 1,518 (540) (5)%(5)%(26) (1)% (2)%
11,094 0 11,085 Dade County Unrestricted Funds 77,657 77,657 0 77,594 11,094 64 0 % 0 % 9 0 % 0 %
17,575 1,017 16,292 Unrestricted Health Care Surtax 125,258 122,628 2,630 120,654 16,558 4,603 4 % 2 % 1,283 6 % 8 %
30,209 29,245 965 28,976 Total Non-Operating Gain Net 213,412 211,543 1,869 209,560 1,233 3 % 4 % 3,852 1 % 2 %
4,614 2,601 2,013 (2,273) Revenue & Gain in Excess of Exp. & Loss 14,647 15,677 (1,030)(33,692) 6,887 77 % 303 % 48,339 7 % 143 %
0 0 0 Capital Contributions – Grants and Other 0 0 0 0 0 0 0 % 0 % 0 0 % 0 %
1,700 1,700 0 JM Foundation 2,268 0 2,268 0 0 2,268 0 % 0 % 1,700 0 % 0 %
0 0 806 Miami Dade County GOB 1,701 0 1,701 8,499 0 (6,798) (80)% 0 %(806) 0 % (100)%
6,314 2,601 3,713 (1,467) Revenue & Gain after Extraordinary Loss 18,616 15,677 2,939 (25,193) 7,781 143 % 531 % 43,809 (19)% 174 %
FS-3A

April 2013
P & L 12 Month Trend Analysis
Public Health Trust of Miami-Dade County
Apr 13 Mar 13 Feb 13 Jan 13 Dec 12 Nov 12 Oct 12 Sep 12 Aug 12 Jul 12 Jun 12 May 12
232,799 Inpatient Services 244,119 226,302 251,495 232,232 233,610 238,341 222,392 237,745 233,008 226,910 236,055
104,258 Ambulatory Services 103,280 93,105 100,923 91,335 93,994 103,439 96,082 101,763 96,816 97,900 108,562
Gross Patient Service Revenue 337,057 347,398 319,406 352,418 323,567 341,780 318,474 339,509 329,824 324,810 327,604 344,616
186,441 Contractual Adjustments 195,560 181,026 193,444 181,197 184,877 190,412 387,022 177,993 175,101 172,262 182,144
Charity Care 31,720 32,153 27,261 30,416 27,873 29,693 32,713 29,139 34,824 30,236 31,075 34,709
Net Patient Revenue Adjustment 0 0 0 0 0 0 0 0 0 0 0 0
33,648 Provision for Doubtful Accounts 39,261 33,268 41,338 31,904 31,317 33,403 22,027 36,824 36,728 41,478 37,229
251,809 Total Deductions From Revenue 266,974 241,555 265,198 240,974 245,886 256,529 438,188 249,641 242,065 244,815 254,082
Net Patient Service Revenue 80,424 77,851 87,220 82,593 81,718 85,251 (119,714) 89,867 87,760 79,995 90,534 85,248
6,563 Division of Managed Care 6,547 7,458 6,610 7,423 7,229 7,398 7,351 7,006 8,298 7,167 7,347
6,677 Other Operating Revenue 10,757 5,657 5,447 4,904 6,242 4,855 223,884 6,114 4,708 11,206 5,535
1,502 Grants Revenue 1,941 2,041 2,217 1,581 1,094 1,707 1,357 1,535 1,617 2,525 2,146
99,990 Total Operating Revenue 99,669 93,006 101,495 96,501 96,282 99,211 112,879 104,522 102,384 100,894 105,562
66,919 Salaries & Related Costs 69,234 63,648 65,753 69,628 64,674 69,004 64,361 69,882 69,747 66,184 70,679
Contractual and Purchased Services 27,873 30,595 28,942 30,468 25,832 29,320 31,009 32,754 30,962 31,021 32,715 31,499
16,591 Supplies 15,039 15,596 16,239 14,492 16,380 15,105 13,522 16,712 16,255 17,524 17,785
Division of Managed Care Paid Claims 6,950 6,335 7,357 6,540 8,432 7,022 7,143 5,036 4,703 6,023 4,854 5,023
1,487 Interest 1,274 1,490 1,461 1,462 1,453 1,455 1,396 1,897 1,479 1,361 1,545
535 Provision for Self-Insured Claims 368 703 535 535 535 535 (3,942) 583 583 595 577
1,090 Public Med/Assist. Trust F. Assess (199) 1,090 1,096 1,090 1,102 1,141 1,245 821 1,203 1,358 1,358
4,534 Depreciation 4,641 4,684 4,684 4,648 4,688 5,259 4,451 4,666 4,947 5,035 5,690
(1)Other Operating Expenses 0 4 0 0 0 13 1 1 6 0 (5)
125,978 Total Operating Expenses 123,513 127,286 126,776 126,120 125,175 130,665 118,823 130,227 131,262 129,626 134,151
(25,988)Gain (Loss) From Operations (27,617) (30,507) (25,281) (29,618) (28,893) (31,454) (5,944) (25,704) (28,878) (28,732) (28,589)
1,271 Med. Edu. and Tert. Care Fund 1,162 1,289 1,289 1,157 1,355 1,355 621 1,355 1,355 1,355 1,355
48 Interest Income - Non. Operating 56 57 31 47 52 76 (360) 53 82 76 64
(1)Unrealized Gains and Losses (1) (1) (1) (1) (1) (1) (65) (1) (1) (1) (1)
228 Other Non-Operating 156 211 163 167 175 171 (415) 202 188 164 157
11,094 Dade County Unrestricted Funds 11,094 11,094 11,094 11,094 11,094 11,094 11,429 11,085 11,085 11,085 11,085
17,575 Unrestricted Health Care Surtax 18,331 20,878 17,855 16,172 18,144 16,304 15,853 15,895 16,256 16,571 17,252
TOTAL Non-Operating Gain Net 30,214 30,799 33,527 30,431 28,636 30,818 28,998 27,063 28,588 28,964 29,249 29,912
4,226 Revenue & Gain in Excess of Exp. & Loss 3,181 3,020 5,150 (982) 1,925 (2,456) 21,119 2,884 86 516 1,322
0 Capital Contributions – Grants and Other 0 0 0 0 0 0 0 0 0 0 0
1,700 JM Contributions 437 0 77 0 54 0 0 0 0 200 0
0 Miami Dade Cty. GOB 0 1,321 285 5 90 0 1,479 298 466 350 0
5,926 Revenue & Gain after Extraordinary Loss 3,618 4,342 5,512 (977) 2,070 (2,456) 22,598 3,182 552 1,066 1,322
FS-4

Jackson Health System Jackson Health SystemApril 2013 Actual April 2013 YTD Actual
Combining Statement of Revenue & Expense Reflecting Allocated Corporate Overhead & Public Support Funding
Jackson
Memorial
Hospital
Jackson
South
Jackson
North
Physician
Services
JHS
Health Plan
Nursing
Homes
Primary
Care
Corrections
Health
Services
Jackson
Medical
Towers Total
Total Gross Inpatient Revenue 178,344 20,293 31,126 3,036 1 232,799Total Gross Outpatient Revenue 76,819 12,669 11,702 1,103 355 1,611 104,258
Total Gross Revenue 255,163 32,961 42,828 1,103 3,391 1,612 337,057
Total Deductions from Revenue -189,042 -25,166 -33,681 -877 -1,587 -1,457 -251,809
Total Net Patient Revenue 66,121 7,796 9,146 226 1,804 155 85,248
Other Operating Revenue 4,884 269 93 779 242 33 378 6,677
Managed Care Revenue 6,563 6,563
Grant Revenue 1,502 1,502
Total Other Operating Revenue 6,385 269 93 779 6,563 242 33 378 14,742
Total Revenue 72,506 8,065 9,239 1,005 6,563 2,047 188 378 99,990
Operating Expenses
Salaries & Wages 44,003 3,605 3,558 964 -1 1,562 659 1,397 44 55,792
Benefits 9,000 632 617 145 1 372 116 238 6 11,127
Total Salaries & Benefits 53,002 4,237 4,175 1,109 1,934 776 1,635 51 66,919
Purchased Services 13,627 1,312 2,759 708 547 324 588 299 95 20,256
Managed Care Paid Claims 1 6,403 6,404
UM AOA Purchased Service 8,402 -1 6 8 8,415
Total Purchased Service 22,030 1,312 2,758 708 6,950 329 596 299 95 35,076
Supplies 14,289 1,070 732 31 289 56 -138 10 16,339
Total Direct Operating Cost 89,322 6,620 7,665 1,847 6,950 2,552 1,427 1,796 155 118,333
Depreciation 3,359 844 237 4 6 51 10 4 19 4,534
Interest 1,456 2 30 1,487
Self Insurance 421 21 91 2 535
HCCB Assessment 857 93 140 1,090
Other Operating Expense 1 -2 -1
Total Other Operating Cost 6,094 956 469 4 6 51 12 4 48 7,645
Total Operating Expenses Before
Allocations 95,416 7,576 8,134 1,851 6,955 2,603 1,439 1,799 203 125,978
Allocated Corporate Services:
Clinical Trials Office -19 -2 -2 -1 -1 -26Corporate Administration 1,648 174 187 43 13 60 33 41 5 2,203
Financial Services 520 55 59 13 4 19 10 13 1 695Human Resources 1,259 91 91 13 64 16 37 2 1,573
Integrity 135 14 15 3 1 5 3 3 180Information Technology 3,613 446 580 7 6 7 22 7 6 4,694
Public Safety 590 80 105 35 56 866Revenue Cycle Management 2,848 368 478 18 3,711
Strategic Sourcing 1,005 86 126 27 20 22 23 6 4 1,317
Total Allocated Corporate Services 11,599 1,312 1,638 105 44 210 180 107 19 15,213Total Expenses Subject to Allocation -15,213 -15,213
Total Operating Expenses Including
Allocations 91,801 8,888 9,772 1,956 6,999 2,814 1,620 1,906 222 125,978
Excess of Operating Revenue over
(under) Operating Expenses -19,295 -823 -533 -952 -436 -767 -1,431 -1,906 156 -25,988
Non Operating Revenue and Expenses
Investment Income 44 5 48
Unrestricted Health Care Surtax 17,575 17,575
Miami Dade County Unrestricted Funds 11,094 11,094
Other Income 1,266 14 217 1,497
JMH Foundation 1,700 1,700
Total Non Operating Revenue 31,678 14 5 217 31,914
Redistribution of Revenue -5,323 2,567 2,135 278 343
Total Non Operating Revenue After
Redistribution 26,355 2,581 2,135 5 278 343 217 31,914
Excess of Revenue over (under)
Expenses before GOB and County
Special Contributions 7,060 1,758 1,601 -952 -432 -489 -1,088 -1,906 373 5,926
Miami Dade County GOB Contributions
Miami Dade County Special Contributions
Total Miami Dade GOB and Special
Contributions
Excess of Revenue over (under)
Expenses 7,060 1,758 1,601 -952 -432 -489 -1,088 -1,906 373 5,926
FS-5 FS-6

Jackson Health SystemApril 2013 YTD Actual
Combining Statement of Revenue & Expense Reflecting Allocated Corporate Overhead & Public Support Funding
Jackson
Memorial
Hospital
Jackson
South
Jackson
North
Physician
Services
JHS
Health Plan
Nursing
Homes
Primary
Care
Corrections
Health
Services
Jackson
Medical
Towers Total
Total Gross Inpatient Revenue 1,269,799 135,994 231,727 21,375 4 1,658,898Total Gross Outpatient Revenue 503,518 88,272 78,807 7,714 2,121 9,903 690,333
Total Gross Revenue 1,773,316 224,265 310,533 7,714 23,496 9,906 2,349,232
Total Deductions from Revenue -1,339,952 -167,232 -235,958 -6,148 -10,837 -8,799 -1,768,925
Total Net Patient Revenue 433,364 57,034 74,576 1,567 12,659 1,107 580,307
Other Operating Revenue 33,902 1,756 694 4,447 838 316 7 2,579 44,539
Managed Care Revenue 49,227 49,227
Grant Revenue 11,926 157 12,083
Total Other Operating Revenue 45,828 1,756 694 4,447 49,227 995 316 7 2,579 105,848
Total Revenue 479,192 58,789 75,270 6,014 49,227 13,654 1,423 7 2,579 686,155
Operating Expenses
Salaries & Wages 309,086 25,100 25,827 6,280 -8 10,852 4,090 9,490 321 391,038
Benefits 62,558 4,542 4,519 1,061 8 2,687 700 1,693 55 77,822
Total Salaries & Benefits 371,644 29,642 30,346 7,340 13,538 4,790 11,183 376 468,860
Purchased Services 96,890 8,684 19,047 4,451 2,696 2,502 4,283 591 651 139,795
Managed Care Paid Claims 1 47,083 47,084
UM AOA Purchased Service 67,017 2 40 129 67,188
Total Purchased Service 163,908 8,686 19,047 4,451 49,779 2,543 4,412 591 651 254,067
Supplies 89,006 8,527 8,963 143 1,785 259 447 59 109,189
Total Direct Operating Cost 624,558 46,855 58,356 11,935 49,779 17,866 9,462 12,221 1,086 832,116
Depreciation 24,651 5,920 1,918 29 40 356 71 26 131 33,141
Interest 9,862 14 207 10,083
Self Insurance 2,954 144 635 14 3,748
HCCB Assessment 4,994 552 863 6,409
Other Operating Expense 1 15 16
Total Other Operating Cost 42,462 6,632 3,429 29 40 356 85 26 338 53,396
Total Operating Expenses Before
Allocations 667,019 53,487 61,785 11,963 49,819 18,221 9,546 12,247 1,424 885,512
Allocated Corporate Services:
Clinical Trials Office 256 28 32 6 1 10 5 6 1 346Corporate Administration 11,415 1,251 1,445 280 64 425 220 286 33 15,420
Financial Services 3,021 331 382 74 17 113 58 76 9 4,081Human Resources 7,215 519 541 73 1 362 78 204 13 9,005
Integrity 1,070 117 135 26 6 40 21 27 3 1,446Information Technology 23,769 2,869 3,970 46 44 47 128 46 44 30,965
Public Safety 5,075 808 1,054 351 562 7,852Revenue Cycle Management 25,853 3,270 4,527 144 33,795
Strategic Sourcing 6,710 621 1,011 166 97 155 164 37 26 8,988
Total Allocated Corporate Services 84,384 9,815 13,099 671 231 1,503 1,381 683 129 111,896Total Expenses Subject to Allocation -111,896 -111,896
Total Operating Expenses Including
Allocations 639,507 63,302 74,884 12,635 50,050 19,724 10,927 12,930 1,553 885,512
Excess of Operating Revenue over (under)
Operating Expenses -160,316 -4,513 386 -6,621 -823 -6,070 -9,504 -12,923 1,026 -199,357
Non Operating Revenue and Expenses
Investment Income 356 11 368
Unrestricted Health Care Surtax 125,258 125,258
Miami Dade County Unrestricted Funds 77,657 77,657
Other Income 9,417 9 715 10,140
JMH Foundation 2,268 2,268
Total Non Operating Revenue 214,956 9 11 715 215,691
Redistribution of Revenue -40,378 18,576 17,427 2,076 2,298
Total Non Operating Revenue After
Redistribution 174,579 18,585 17,427 11 2,076 2,298 715 215,691
Excess of Revenue over (under) Expenses
before GOB and County Special
Contributions 14,263 14,072 17,813 -6,621 -812 -3,994 -7,206 -12,923 1,741 16,334
Miami Dade County GOB Contributions
Miami Dade County Special Contributions 1,701 1,701
Total Miami Dade GOB and Special
Contributions 1,701 1,701
Excess of Revenue over (under) Expenses 15,964 14,072 17,813 -6,621 -812 -3,994 -7,206 -12,923 1,741 18,035
FS-6

Combining Statement of Revenue & Expenses by Company
Public Health Trust of Miami-Dade County Consolidated
(Amounts in thousands)
Month of April 2013
Jackson
SouthJackson
Memorial
Jackson
North
Physician
Services
JHS Health
Plan
Primary
Care
Centers
Corrections
Health
Services
Skilled
Nursing
Facilities
Jackson
Medical
Towers Total
Prior
Year
Actual
Revenue
178,344 230,623 20,293 31,126 Inpatient Revenue 0 0 1 0 3,036 0 232,799
76,819 100,215 12,669 11,702 Outpatient Revenue 1,103 0 1,611 0 355 0 104,258
330,838 Gross Patient Service Revenue 32,961 42,828 1,103 0 1,612 0 3,391 0 337,057 255,163
Deductions From Revenue:
139,885 164,165 17,887 26,576 Contractual Adjustments 877 0 461 0 755 0 186,441
Provisions For Charity Care 26,823 1,922 1,284 0 0 996 0 694 0 31,720 31,803
Net Patient Revenue Adjustment 0 0 0 0 0 0 0 0 0 0 0
22,334 48,973 5,357 5,821 Provision for Doubtful Accounts 0 0 0 0 137 0 33,648
189,042 244,941 Total Deductions From Revenue 25,166 33,681 877 0 1,457 0 1,587 0 251,809
66,121 85,896 Net Patient Service Revenue 7,796 9,146 226 0 155 0 1,804 0 85,248
0 7,214 0 0 Division of Managed Care 0 6,563 0 0 0 0 6,563
4,884 5,980 269 93 Other Operating Revenue 779 0 33 0 242 378 6,677
1,502 1,882 0 0 Grants Revenue 0 0 0 0 0 0 1,502
72,506 100,973 Total Operating Revenue 8,065 9,239 1,005 6,563 188 0 2,047 378 99,990
Operating Expenses
53,002 70,789 4,237 4,175 Salaries & Related Costs 1,109 0 776 1,635 1,934 51 66,919
22,030 35,502 1,312 2,758 Contractual and Purchased Services 708 6,950 596 46 329 95 34,823
14,289 14,655 1,070 732 Supplies 31 0 56 115 289 10 16,591
1,456 1,470 0 2 Interest 0 0 0 0 0 30 1,487
3,359 5,556 844 237 Depreciation 4 6 10 4 51 19 4,534
1,278 1,940 112 231 Other Operating Expenses 0 0 2 0 0 0 1,623
95,415 129,912 Total Operating Expenses 7,576 8,134 1,851 6,955 1,440 1,799 2,603 203 125,978
(28,940)Excess of operating revenue over (under)
operating expenses 489 1,105 (847) (393) (1,252) (1,799) (557) 175 (25,988)(22,909)
Other Revenues (Expenses)
44 76 (1) 0 Investment Income 0 5 0 0 0 0 48
17,575 16,292 0 0 Unrestricted Health Care Surtax 0 0 0 0 0 0 17,575
11,094 11,085 0 0 Miami Dade County Unrestricted Funds 0 0 0 0 0 0 11,094
1,266 1,524 15 0 Other Income 0 0 0 0 0 217 1,498
0 0 0 0 Miami Dade County Special Contributions 0 0 0 0 0 0 0
1,700 0 0 0 JM Foundation 0 0 0 0 0 0 1,700
0 806 0 0 Miami Dade County GOB Contributions 0 0 0 0 0 0 0
Total Other Revenues (expenses) 31,678 14 0 0 5 0 0 0 217 31,914 29,783
8,769 843 Excess of revenues over (under) expenses 502 1,105 (847) (388) (1,252) (1,799) (557) 392 5,926
FS-7

Unaudited Current Month Year to Date Year to Date
April 30, 2013 April 30, 2013 September 30, 2012Cash generated (used) by operations:Funds available for working capital/facilities improvements $5,926 $18,035 $8,200Non cash expenses:
Depreciation 4,534 33,138 66,316 Loss on disposal of capital assets (15) (65) 791
Total 10,445 51,108 75,307
Cash provided (used) for current assets:Decreases (increases) in:
Patient Receivable and Other Third Party payor 43,984 96,317 (73,668) Cash and Invst. Restricted - - - Cash and Invst. Limited as to Use (28,566) (31,607) 28,181
Inventories, Prepaid Expenses and Other Receivables (65) (1,023) (1,132)
Total 15,353 63,687 (46,619) Cash provided (used) for current liabilities: Increases (decreases) in:
Current Installment of Long Term Debt - - 305 Accounts Payable and Accrued Expenses (3,126) (29,897) (73,894) Due to other third party (11,519) (55,651) 46,128
Other Liabilities (2,591) 11,335 (12,146) Other- Restricted 50 (568) (5,531)
Total (17,186) (74,781) (45,138)
Decreases (increases) in:Cash and Invst. Limited as to Use (590) 586 8,982 Cash and Invst. Restricted 823 8,233 20,755
Long Term Investment - - - - -
Cash provided (used) for Other Assets 25 (31) 695 -
Cash provided (used) for Long Term Liabilities: - Increases (decreases) in: -
Long Term Debt 30 203 (6,980) Other Liabilities 6,451 1,540 (5,245)
Total 6,481 1,743 (12,225)
Cash provided (used) for Prop., Plant and Equipment:Purchases of Prop. Plant and Equipment (2,780) (13,682) (27,697)
- -
Total (2,780) (13,682) (27,697)
- - -
Net Increase in Cash and Cash Equivalents 12,571 36,863 (25,940) -
Cash, beginning of period 93,644 69,352 95,292
Cash, end of period 106,215 106,215 69,352
Public Health Trust
Jackson Health System
Combined Statement of Unrestricted / Restricted Cash FlowAs of April 30, 2013
FS-8

PUBLIC HEALTH TRUSTCONSOLIDATED PORTFOLIO INVENTORY SUMMARY BY SECURITY/ACCOUNT TYPE
April 30, 2013
# of Investments Description Par Value Avg. Interest Rate Market Value
2 Money Markets 13,534,523$ 0.010% 13,534,523
2 Total Investments Portfolio 13,534,523
Non-interest bearing account - Restricted 0.000% 1,194,844
Wells Fargo interest bearing accts 0.250% 144,864,454
Bond Proceeds Invested at Miami-Dade County 0.435% 72,156,765
Total Cash and Investments 231,750,585$
FS-9

PUBLIC HEALTH TRUSTSALES TAX
MONTHLY INCOME STATEMENT TREND ANALYSIS
FISCAL YEAR 2011
Oct-10 Nov-10 Dec-10 Jan-11 Feb-11 Mar-11 Apr-11 May-11 Jun-11 Jul-11 Aug-11 Sep-11
monthly est 13,824,281 14,678,092 16,682,866 13,920,256 14,838,038 16,271,145 14,306,810 13,703,273 14,469,444 14,750,928 13,821,758 14,713,753
mo portion of qtly est: 1,000,647 1,000,647 1,000,647 1,028,196 1,028,196 1,028,196 1,059,468 1,059,468 1,059,468 1,065,225 1,065,225 1,065,225
State revision to Sales Tax Projection
+/-est vs. actual rec'd; mo of (517,641) 101,749 25,778 192,040 (226,996) (267,975) 667,173 576,264 (49,580) (574,440)
+/-est vs. actual rec'd; qt of 236,771 457,528 - - 304,129
Monthly Revenue 14,824,928 15,678,739 17,165,872 15,286,972 15,892,012 17,491,381 15,139,283 14,952,294 16,196,085 16,392,417 15,141,532 15,204,538
FISCAL YEAR 2012
Oct-11 Nov-11 Dec-11 Jan-12 Feb-12 Mar-12 Apr-12 May-12 Jun-12 Jul-12 Aug-12 Sep-12
monthly est 14,482,634 14,779,176 17,607,553 15,330,625 15,914,413 17,395,891 15,855,155 15,355,434 15,563,007 14,907,488 15,041,626 14,844,604
mo portion of qtly est: 1,079,571 1,079,571 1,079,571 1,180,705 1,180,705 1,180,705 1,160,844 1,160,844 1,160,844 1,143,468 1,143,468 1,143,468
State revision to Sales Tax Projection 500,000
+/-est vs. actual rec'd; mo of 10,720 1,238,686 671,986 (106,944) (724,478) 335,025 (153,187) (295,446) (757,063) 16,220
+/-est vs. actual rec'd; qt of 257,405 400,370 466,672
Monthly Revenue 15,562,205 15,858,747 18,697,844 17,750,016 18,024,509 18,469,652 16,291,521 17,251,673 16,570,664 16,255,510 15,894,703 16,004,292
FISCAL YEAR 2013
Oct-12 Nov-12 Dec-12 Jan-13 Feb-13 Mar-13 Apr-13 May-13 Jun-13 Jul-13 Aug-13 Sep-13
monthly est 15,096,482 16,870,407 15,156,957 15,600,201 15,600,201 15,600,201 15,600,201
mo portion of qtly est: 1,207,668 1,273,109 1,273,109 1,273,109 1,273,109 1,273,109 1,273,109
State revision to Sales Tax Projection
+/-est vs. actual rec'd; mo of (257,802) 981,343 3,665,869 1,457,919 701,194
+/-est vs. actual rec'd; qt of 338,409
Monthly Revenue 16,304,150 18,143,516 16,172,264 17,854,653 20,877,588 18,331,229 17,574,504 - - - - -
Comments:
• Estimate was calculated based on same month prior year adjusted for percentage change of recent receipts
vs. recent estimates.
FS-10

Actual Budget % Variance Actual Actual Budget % Variance
FC Group Apr-13 Apr-13 Budget Mar-13 YTD YTD Budget
Jackson Health System
Combined percentages:
Commercial 1.76% 2.33% -0.57% 1.74% 1.53% 2.34% -0.81%
Medicaid 17.27% 16.11% 1.16% 16.83% 17.16% 16.19% 0.97%
Medicare 18.00% 17.78% 0.22% 17.41% 17.02% 17.89% -0.87%
Other 4.48% 2.60% 1.88% 4.30% 3.41% 2.62% 0.79%
Managed Care 27.17% 26.10% 1.07% 26.99% 27.58% 26.22% 1.36%
Self Pay 13.16% 16.75% -3.59% 13.40% 13.39% 16.83% -3.44%
Potential Medicaid 18.16% 18.33% -0.17% 19.33% 19.91% 17.91% 2.00%
Total 100.00% 100.00% 0.00% 100.00% 100.00% 100.00% 0.00%
Jackson Memorial Hospital
Combined percentages:
Commercial 2.13% 2.74% -0.61% 2.06% 1.79% 2.76% -0.97%
Medicaid 19.38% 17.26% 2.12% 18.09% 18.82% 17.38% 1.44%
Medicare 15.43% 14.45% 0.98% 15.29% 14.46% 14.55% -0.09%
Other 5.33% 3.02% 2.31% 5.04% 3.94% 3.04% 0.90%
Managed Care 25.00% 24.53% 0.47% 25.17% 25.55% 24.71% 0.84%
Self Pay 13.41% 16.90% -3.49% 13.77% 13.62% 17.02% -3.40%
Potential Medicaid 19.32% 21.10% -1.78% 20.58% 21.82% 20.54% 1.28%
Total 100.00% 100.00% 0.00% 100.00% 100.00% 100.00% 0.00%
Jackson South
Combined percentages:
Commercial 0.73% 0.87% -0.14% 0.66% 1.02% 0.87% 0.15%
Medicaid 7.09% 9.44% -2.35% 9.67% 7.71% 9.38% -1.67%
Medicare 25.97% 24.51% 1.46% 24.84% 24.79% 25.03% -0.24%
Other 2.07% 2.42% -0.35% 1.38% 2.15% 2.40% -0.25%
Managed Care 37.93% 34.27% 3.66% 38.56% 38.19% 34.05% 4.14%
Self Pay 15.63% 19.34% -3.71% 14.51% 14.95% 19.19% -4.24%
Potential Medicaid 10.58% 9.15% 1.43% 10.38% 11.19% 9.08% 2.11%
Total 100.00% 100.00% 0.00% 100.00% 100.00% 100.00% 0.00%
Jackson North
Combined percentages:
Commercial 0.32% 1.23% -0.91% 0.57% 0.42% 1.24% -0.82%
Medicaid 11.81% 14.97% -3.16% 14.25% 13.73% 14.98% -1.25%
Medicare 27.50% 30.31% -2.81% 24.83% 26.38% 30.25% -3.87%
Other 1.18% 0.51% 0.67% 1.96% 1.30% 0.50% 0.80%
Managed Care 32.59% 28.36% 4.23% 29.91% 32.31% 28.39% 3.92%
Self Pay 10.08% 14.05% -3.97% 10.51% 11.18% 14.06% -2.88%
Potential Medicaid 16.52% 10.57% 5.95% 17.97% 14.68% 10.58% 4.10%
Total 100.00% 100.00% 0.00% 100.00% 100.00% 100.00% 0.00%
Jackson Health System HospitalsPayor Mix Patient Days as % of Total
Fiscal Year 2012 - 2013
FS-11

4. Cost Accounting Update

Accounts Receivable All Hospitals
April 2013 (FY13)

Revenue Cycle KPI’s
Cash Collections Goal Actual
April 2013 (FY13) $85.3M $ 90.3M
KPI Best Practice /Benchmark Goal Actual Prior Month
POS 2% of net collections $ 1.8M $2.7M $1.9M
Potential Medicaid Conversion
% of approvals compared to referrals for the prior 90 days. 90% 89% 86%
AR Greater than 90 Days
Less than 25% of discharged AR 25% 31% 30%
Denial Reduce Net denial write-offs FYTD (less Benefit exhausted amounts) (FY12=10.4%)
5.5% 9.6% 9.6%
Revenue Integrity Reduce late charge (# of charges) greater than 5 days (FY12=2.4%) 1.5% 2.6% 2.1%
Benchmarks obtained by: HARA & Advisory Board ** Internal Target. No industry benchmark available

JHS CBO Cash Collections Month FY-12 Cash FY-13 Cash October $ 90,249,736 $ 93,035,086 November 83,841,693 $ 90,228,516 December 88,954,472 $ 76,727,419 January 76,200,810 $ 93,346,075 February 79,062,126 $ 81,386,890 March 96,923,009 $ 77,187,713 April 85,893,916 $ 90,399,591 May 95,658,525 June 85,636,129 July 88,697,935 August 85,818,756 September 79,204,218 Total $ 1,036,141,325 $ 602,611,290
Source: JHS Treasury Management & Revenue Control Dept.

Thank you,
6. Review and Recommend Approval of the Following Resolutions for Contracts and Agreements:
Agenda Item 6 (a) Fiscal Committee May 23, 2013
RESOLUTION NO. PHT 05/13 –
RESOLUTION APPROVING SETTLEMENT OF COMPLAINT FOR DAMAGES IN SOUTH BROWARD HOSPITAL DISTRICT D.B.A MEMORIAL HOSPITAL PEMBROKE V. JMH HEALTH PLAN, FILED UNDER CASE NO. COWE 13-003349 IN THE COUNTY COURT IN AND FOR BROWARD COUNTY, FLORIDA IN THE AMOUNT OF $9,523.00 (Paul Marineau, Executive Director, JMH Health Plan)
WHEREAS, the Financial Recovery Board desires to accomplish the purposes outlined in the
accompanying memorandum, a copy of which is incorporated herein by reference.
NOW, THEREFORE, BE IT RESOLVED BY THE FINANCIAL RECOVERY BOARD OF
THE PUBLIC HEALTH TRUST OF MIAMI-DADE COUNTY, FLORIDA, that this Board hereby
approves settlement of Complaint for Damages in South Broward Hospital District D.B.A. Memorial
Hospital Pembroke vs. JMH Health Plan filed under Case No. COWE 13-003349 in the County Court in
and for Broward County, Florida in the amount of $9,523.00.

TO: Financial Recovery Board of the Public Health Trust FROM: Paul Marineau Executive Director, JMH Health Plan DATE: May 17, 2013 SUBJECT: Resolution Approving Settlement of Complaint for Damages in South
Broward Hospital District d/b/a Memorial Hospital Pembroke v. JMH Health Plan, filed under Case No. COWE 13-003349 in the County Court in and for Broward County, Florida in the amount of $9,523.00
_____________________________________________________________________________ RECOMMENDATION Staff recommends that the Financial Recovery Board approve the settlement of claims filed by the South Broward Hospital District in Case No. COWE 13-003349 in the County Court in and for Broward County, Florida in the amount of $9,523.00. BACKGROUND On April 15, 2013, the South Broward Hospital District d/b/a Memorial Hospital Pembroke filed causes of action against the Jackson Health Plan in the amount of $9,523.00 for the Health Plan’s failure to pay charges on behalf of a plan member who received services at the District’s Memorial Hospital Pembroke. Upon review of the matter and the complaint staff has determined that the claim is payable and would have been paid if Memorial Hospital Pembroke had ever submitted the claim. As no claim has ever been received from Memorial Hospital Pembroke for the dates of service for the patient identified, Jackson Health Plan had no knowledge of any liability existing until Memorial Hospital Pembroke filed this cause of action.

Agenda Item 6 (b) Fiscal Committee May 23, 2013
RESOLUTION NO. PHT 05/13 –
RESOLUTION APPROVING SETTLEMENT OF SMALL CLAIMS COMPLAINT FOR DAMAGES IN SOUTH BROWARD HOSPITAL DISTRICT D.B.A MEMORIAL REGIONAL HOSPITAL V. CHRISTINE RHAU, PUBLIC HEALTH TRUST OF DADE COUNTY D.B.A.
JACKSON HEALTH PLAN, FILED UNDER CASE NO. COWE 13-2972 IN THE COUNTY COURT IN AND FOR BROWARD COUNTY,
FLORIDA IN THE AMOUNT OF $3,086.00. (Paul Marineau, Executive Director, Jackson Health Plan)
WHEREAS, the Financial Recovery Board desires to accomplish the purposes outlined in the
accompanying memorandum, a copy of which is incorporated herein by reference.
NOW, THEREFORE, BE IT RESOLVED BY THE FINANCIAL RECOVERY BOARD OF
THE PUBLIC HEALTH TRUST OF MIAMI-DADE COUNTY, FLORIDA, that this Board hereby
approves settlement of small claims Complaint for Damages in South Broward Hospital District D.B.A.
Memorial Regional Hospital v. Christine Rhau, Public Health Trust of Dade County, D.B.A. Jackson
Health Plan, filed under Case No. COWE 13-2972 in the County Court in and for Broward County,
Florida in the amount of $3,086.00.
TO: Financial Recovery Board of the Public Health Trust FROM: Paul Marineau Executive Director, JMH Health Plan DATE: May 17, 2013 SUBJECT: Resolution Approving Settlement of Small Claims Complaint
for Damages in South Broward Hospital District d.b.a. Memorial Regional Hospital v. Christine Rhau, Public Health Trust of Dade County d/b/a Jackson Health Plan filed under Case No. COWE 13-2972 in the County Court in and for Broward County, Florida in the amount of $3,086.00.
_____________________________________________________________________________ RECOMMENDATION Staff recommends that the Financial Recovery Board approve the settlement of small claims filed by the South Broward Hospital District in Case No. COWE 13-2972 in the County Court in and for Broward County, Florida in the amount of $3,086.00. BACKGROUND
On April 15, 2013, the South Broward Hospital District d.b.a. Memorial Regional Hospital filed small claims against the Jackson Health Plan in the amount of $3,086.00 for the Health Plan’s failure to pay charges on behalf of a plan member who received services at Memorial Regional Hospital. Upon review of the matter and the complaint staff has determined that the claim is payable and should have been paid but was not due to incorrect processing.


7. Purchasing and Facilities Subcommittee Report

May 2013 PHT Financial Recovery Board 1
PUBLIC HEALTH TRUST FINANCIAL RECOVERY BOARD PURCHASING REPORT
May 31, 2013
TO: PUBLIC HEALTH TRUST FINANCIAL RECOVERY BOARD FROM: PROCUREMENT MANAGEMENT DEPARTMENT The following recommendations are made in accordance with the Trust’s “Procurement Policy” and it’s implementing “Procurement Regulation.” This report includes competitively solicited contract awards over $3,000,000, waivers of formal competition over $250,000 and other categories for Board approval as prescribed by the Procurement Regulation. The entire report has been screened and assembled by the Procurement Management Department with the direct participation of the Administrator and staff, all subject to review by the Vice President, Strategic Sourcing Division, consultation with the President as needed, and review for legal sufficiency by the County Attorney’s Office. SECTION I. AWARDS UNDER INVITATIONS TO BID (ITB’s) This section consists of awards under competitively solicited Invitations to Bid (ITB’s) over $3,000,000. No items to report SECTION II. AWARDS UNDER REQUESTS FOR PROPOSALS (RFP’s) This section consists of awards under competitively solicited Requests for Proposals (RFP’s) over $3,000,000. No items to report SECTION III. AWARDS UNDER THE COMPETITIVELY SOLICITED CONTRACTS OF OTHER PUBLIC PROCUREMENT ENTITIES This section consists of awards over $3,000,000 under competitively solicited (“ITB,” “RFP” or equivalent) contracts of other public and nonprofit entities. No items to report

May 2013 PHT Financial Recovery Board 2
SECTION IV. AWARDS UNDER GROUP PURCHASING ORGANIZATION (“GPO”) CONTRACTS This section consists of awards over $3,000,000 under Group Purchasing Organization (“GPO”) contracts. GPOs are organizations that aggregate the purchasing volume of their members consisting of hospitals and other health care providers to leverage discounts with manufacturers, distributors and other vendors to realize administrative savings and efficiencies. The Trust’s GPO is MedAssets. No items to report SECTION V. AWARDS UNDER A WAIVER OF FORMAL COMPETITION
This section consists of awards over $250,000 without the formal solicitation of competitive bids or proposals. All award recommendations in this section have the approval of the President, are based on a finding that the waiver of competitive bidding is in the best interests of the Public Health Trust, and require a two-thirds affirmative vote of the Trustees present for approval. A. Sole Source 1. (541114-TW) The Adult Respiratory Therapy Department requests approval of a one year contract to INO Therapeutics, LLC for Nitric Oxide inhalation gas therapy.
INO Therapeutics, LLC $930,380 dba Ikaria: (for one year) Total approved funding: $930,380
The Adult Respiratory Therapy department, in collaboration with the Procurement Management Department, conducted market research to determine the availability of competition. The team confirmed that the INO Therapeutics product remains the only turnkey solution available on the market today, making this a sole source procurement. Nitric Oxide inhalation therapy gas is used for treatment of cardio thoracic and transplant patients post surgery. The therapy gas is used for heart and lung patients requiring pulmonary vasodilatation, post pump, transplant and pulmonary hypertension therapies and has the least side effects. The cost of using Nitric Oxide is significantly lower than costs associated with a patient’s response to a 3-5 day alternative therapy. The proposed amount of $930,380 down from a spend of $1,141,860 for the expiring contract reflects a recent reduction in the hourly usage from approximately 15,300 hours to approximately 11,000 hours, thus, reducing the current spend by approximately $211,480.The vendor had initially proposed a new hourly rate of $88.39. Through negotiation, this rate was reduced to $84.58 an hour.

May 2013 PHT Financial Recovery Board 3
SECTION V. (cont’d.) INO Therapeutics is the only FDA approved vendor for this particular drug and its delivery system. The proposed contract can be terminated for convenience with a thirty (30) day notice and includes UAP and OIG provisions. The contract has been reviewed and approved by the County Attorney’s Office for legal sufficiency. A Sole Source Justification has been provided and Conflict of Interest Declarations have been signed by John Kimble, Adult Respiratory Manager and Lori Donahue, Contracts Administrator for INO therapeutics with no reported disclosures. ECRI stated that the rate being offered to the Trust is the lowest they have seen offered. MD Buyline reported that because each agreement in their database is unique, they were unable to identify any particular savings being offered with this contract. However, they do recommend a one year contract because “there are products under development that will bring competition to this niche market.” (Alex Contreras). B. Physician’s Preference Staff requests a waiver of formal competition for the contract items listed in this category because a physician or clinician has requested the particular item or service without which the physician or clinician cannot successfully and safely render patient care. 2. (534290-TW) Pathology Services Department requests funding to exercise the first of three one-year renewal options for the continuation of specialty diagnostic laboratory services.
ViraCor-IBT Laboratory, Inc.: $1,500,000
(For one year)
Total approved funding: $1,500,000
Background In April 2012, the Board approved a bid waiver (Physician Preference) contract award to ViraCor-IBT in the amount of $1,300,000 for a one-year period with three renewal options of one year each to be exercised at the discretion of the Trust. ViraCor-IBT provides quantitative real time bacterial and viral testing that is focused on molecular testing. The need for these services has increased considerably, as there has been an increase in test utilization by the Infectious Diseases, Transplant and Pediatrics departments. Although the Board approved $1,300,000 last year, the contract was modified for an additional $250,000
May 2013 PHT Financial Recovery Board 4
SECTION V. (cont’d.) to cover the last two months of the contract term due to increased usage. Based on current trends and patient care needs, it has been projected that this increased utilization will persist rather than decline. The estimated dollars requested will provide adequate funding for the new contract term assuming the current utilization trend. JHS pediatric and transplant physicians developed protocols that call for these tests on a regular basis for all patients. The physicians are pleased with the accuracy, reliability and turnaround time of the tests results, and Viracor remains their preference. The Pathology Department has confirmed that ViraCor-IBT is the only reference laboratory with the ability to deliver results of the labor-intensive quantitative Polymerase Chain Reaction (PCR) testing for viral markers within a 24 hour turn-around time of specimen receipt as required by JHS. ViraCor-IBT is the most qualified provider for this level of service. Recommendation Approval for this one year contract award for diagnostic testing services is requested to avoid disruption of the real-time bacterial and viral testing services which is highly utilized by Pediatrics and Transplant Departments. Physicians would not be able to diagnose, treat and discharge patients quickly and effectively without the continuation of this service. Although the vendor is not on the MedAssets contract, a market analysis was conducted as part of a MedAssets and Procurement Management (PDM) initiative for savings, and this determined the current competitive “benchmark” pricing. Negotiations with Viracor resulted in projected savings of approximately $150,000 for the expiring contract period. The vendor has agreed to forego its customary CPI increase and hold existing contract pricing for the proposed renewal as well as the two remaining one-year renewals, if the Trust opts to exercise them. In preparing this renewal, competitive pricing for the same test menu was secured from Quest Diagnostics (the current prime reference laboratory vendor on the MedAsset GPO). The price comparison showed savings to the Trust of $659,194 for one year if ViraCor is utilized for the tests. In addition, ViraCor will bear the cost of an interface currently being instituted with the Trust’s Lab (Pathology), providing cost avoidance to the Trust of $34,000. The Trust will realize cost avoidance of approximately $738,194 by renewing with ViraCor for the new contract term. This value to the Trust for the proposed one-year term is based on price comparison with Quest, the vendor foregoing its customary CPI increase ($45,000 for 2013) and also bearing the cost of the new interface. The contract can be cancelled for convenience with a thirty (30) day notice and includes the OIG and UAP provisions. The contract was approved by Risk Management as to insurance and liability and by the County Attorney’s Office for legal sufficiency.

May 2013 PHT Financial Recovery Board 5
SECTION V. (cont’d.) A Bid Waiver Justification has been provided and Conflict of Interest Declarations have been signed by Raul Cortes, JHS Senior Clinical Manager, Dr. Martin Andreansky, Pediatric BMT Director and Matthew Urbanek, CFO, ViraCor-IBT, Inc., with no reported disclosures. MD Buyline reported that the Viracor testing service is not currently covered and ECRI had no prior data with which to benchmark this service. (A. Contreras). C. Standardization Items in this category have been established as the Trust standard. No items to report D. Non-Competitive Cooperative Purchasing This subsection consists of awards under the contracts of other public entities that were not competitively solicited. No items to report E. Miscellaneous Bid Waiver This subsection consists of awards not falling in the other categories of waiver of formal competition but where waiver is deemed to be in the best interests of the Trust. No items to report SECTION VI. OPTIONS-TO-RENEW AND CONTRACT MODIFICATIONS FOR CONTRACTS THAT WERE COMPETITIVELY SOLICITED This section refers to existing contracts that were competitively bid (“ITB” or “RFP”) at their origin and consists of either (a) the exercise of established options-to renew or (b) the execution of contract modifications for which the Procurement Policy requires prior Board approval. No items to report SECTION VII. OPTIONS-TO-RENEW AND CONTRACT MODIFICATIONS FOR CONTRACTS THAT WERE AWARDED UNDER A WAIVER OF FORMAL COMPETITION

May 2013 PHT Financial Recovery Board 6
SECTION VII. (cont’d.) This section refers to existing contracts that were not competitively bid at their origin and consists of either (a) the exercise of established options-to renew or (b) the execution of contract modifications for which the Procurement Policy requires prior Board approval. All contracts in this section are renewals not previously authorized by the Board have the written approval of the President, are based on a finding that the waiver of full and competitive bidding is in the best interest of the Public Health Trust, and require a two-thirds affirmative vote of the Trustees present for approval. No items to report
SECTION VIII. MISCELLANEOUS
This section consists of procurement actions that require Board approval not included under any other section of the Purchasing Report. No items to report

JOINT CONFERENCE AND EFFICIENCIES COMMITTEE

PUBLIC HEALTH TRUST FINANCIAL RECOVERY BOARD
Joint Conference and Efficiencies Committee Stephen S. Nuell, Chairperson Joe Arriola, Vice Chairperson Michael Bileca Mojdeh L. Khaghan Marcos Jose Lapciuc Irene Lipof Darryl K. Sharpton
Date, Time and Location May 23, 2013 – To follow the Closed Session of the Joint Conference and Efficiencies Committee Meeting Ira C. Clark Diagnostic Treatment Center Conference Room 259
AGENDA
1. Approval of the Previous Meeting Minutes
(Stephen S. Nuell, Chairperson, Joint Conference and Efficiencies Committee)
(a) *Meeting Minutes as of April 18, 2013
2. Chief Medical Officer Report (Michael Butler, MD, Executive Vice President and Chief Medical Officer, Jackson Health System)
3. President of the Executive Medical Committee of the Medical Staff Report (Joshua Lenchus, DO, RPh, FACP, SFHM, President, Executive Medical Committee of the Medical Staff, Jackson Health System)
4. Review of the Credentials Committee Decisions
(Joshua Lenchus, DO, RPh, FACP, SFHM, President, Executive Medical Committee of the Medical Staff, Jackson Health System)
(a) Review and Recommend Approval of the Credentials Activity Report – May 2013
(Support document will be distributed at the meeting.)
(b) Resolution Recommended To Be Approved
(1) *Resolution approving and adopting a Jackson Health System Radiation Physicist Delineation of Privileges of the Medical Staff— May 2013
(Kevin Andrews, Vice President, Quality and Patient Safety Division, Jackson Health System)
5. Standing Reports
(a) Health Education Network (HEN) Quality & Safety What Does The Future Look Like (Kevin Andrews, Vice President, Quality and Patient Safety Division, Jackson Health Systems)
(b) Scorecard and Bridges to Quality Report (Kevin Andrews, Vice President, Quality and Patient Safety Division, Jackson Health Systems)
Agenda items noted with an asterisk (*) indicates that the supporting documents are attached.

1. Approval of the Previous Meeting Minutes

PUBLIC HEALTH TRUST FINANCIAL RECOVERY BOARD
Joint Conference and Efficiencies Committee Stephen S. Nuell, Chairperson Joe Arriola, Vice Chairperson Michael Bileca
Mojdeh L. Khaghan Marcos Jose Lapciuc
Darryl K. Sharpton
Date, Time and Location April 18, 2013 – Followed the Fiscal Committee meeting Ira C. Clark Diagnostic Treatment Center Conference Room 259
ATTENDANCE
Joint Conference and Efficiencies Committee Stephen S. Nuell Joe Arriola Mojdeh L. Khaghan Marcos Jose Lapciuc Darryl K. Sharpton
Excused Michael Bileca Jackson Health System Kevin Andrews Carlos A. Migoya Michael Butler, MD Joshua Lenchus, DO Don S. Steigman Matthew Pinzur Miami Dade College Irene Lipof Miami-Dade County Attorneys Christopher Kokoruda Laura Llorente

Joint Conference and Efficiencies Committee Meeting April 18, 2013 Page 2 of 3 MEETING CALL TO ORDER With a quorum being present, the Joint Conference and Efficiencies Committee meeting was called to order by Stephen S. Nuell, Chairperson, Joint Conference and Efficiencies Committee at 12:43 p.m. 1. APPROVAL OF THE PREVIOUS MEETING MINUTES
(a) Meeting Minutes as of March 14, 2013
The meeting minutes of March 14, 2013 was approved as presented.
2. CHIEF MEDICAL OFFICER REPORT, JACKSON HEALTH SYSTEM
Michael Butler, MD, Chief Medical Officer, Jackson Health System reported the following:
• Graduate Medical Education – Preparation for New Accreditation System • Credentialing Process Progression • Medical Staff Disruptive Behavior Discussion • Review of the Ethics Committee Recommendations • LIP Grant report submitted on Monday, April 15, 2013 • JMH Coordinating with University of Miami regarding the ICD-10 Implementation Process • Physician/Employee Engagement Report to be provided at the May 2013 meeting
3. CHAIRMAN OF THE MEDICAL STAFF REPORT
Joshua Lenchus, DO, Chairman, Medical Executive Committee, reported the following:
• Briefed on collaborative care of UM and JMH improving service, quality and best practices • Renovation to physicians dining room • Legislative Bill updates related to practice of medicine for which JMH may be affected
4. REVIEW OF THE CREDENTIALS COMMITTEE DECISIONS
(a) The Committee reviewed for approval the Credentials Committee Activity Report as of
April 2013. (See attached summary.)
Mr. Nuell requested a motion for the Credentials Committee Activity Report as of April 2013.
Mr. Sharpton moved approval; seconded by Mr. Arriola and
carried without dissent. A copy of the Credentials Activity Report as of April 2013 was distributed at the meeting.

Joint Conference and Efficiencies Committee Meeting April 18, 2013 Page 3 of 3
(b) The Committee reviewed for approval the following substitute agenda items and supporting documents:
• 4 (b) (1) Resolution for Policy 400.015 Withholding, Withdrawing and
Foregoing Life Sustaining Treatment (Adults) • 4 (b) (2) Resolution for Policy 400.130 Perioperative Do-Not-
Resuscitate (DNR) Orders (Adults) • 4 (b) (3) Resolution for Policy 400.131 Physician Orders for Life
Sustaining Treatments (POLST) (Adults) • 4 (b) (4) Resolution for POLST Order Form C-290ZL Physician Orders
for Life Sustaining Treatment (POLST) for Adult Patients Mr. Nuell requested a motion for substitute agenda items 4 (b) (1) through 4 (b) (4) and
supporting documents.
Mr. Arriola moved approval; seconded by Mr. Sharpton and carried without dissent. A copy of the substitute agenda items and supporting documents were distributed at the
meeting.
5. STANDING REPORTS
(a) Health Education Network (HEN) Quality & Safety: What Does the Future Look Like
The item was deferred.
(b) Scorecard and Bridges to Quality Report
The item was deferred.
MEETING CALL TO ADJOURN
The Joint Conference and Efficiencies Committee meeting adjourned at 1:32 p.m.
Transcribed by Kimberly A. Calhoun, Executive Assistant Quality and Patient Safety Division Jackson Health System

CREDENTIALS COMMITTEE MONTHLY ACTIVITY REPORT
APRIL 2013
Medical Staff Allied Health Professionals
Initial Applicant(s) ( 23 ) – Community Physician(s) ( 6 ) – Academic Physician(s) 29 4 Annual Evaluations/ FPPE 17 3 Reappointments(s) 51 13 Reappointments(s) Reinstatements 0 0 Termination 0 0 Notification of Site(s) of Practice a. Correction of Clinical Privileges 0 0 b. Request for Additional Privileges 0 0 c. Change of Membership Category 0 0 d. Additional/Change Sponsor 0 1 e. Additional Service/Facility 0 0
f. Request for Change of Service/Clinical Privileges 0 0
g. Delete Sponsor/Privileges 0 0 h. Denial of Clinical Privileges – Modified 0 0 i. Relinquish Clinical Privileges/Facility 0 0 j. Request for reduction of clinical privileges 0 0 k. Deceased 1 0 l. Request for Leave of Absence 0 0 Resignation(s) 6 1 Voluntary Withdrawal and Voluntary Relinquishment of Membership and Privileges: a. Incomplete Reappointment(s) 0 0 b. Reappointment Application Not Returned 1 0 c. Lack of Utilization 0 0

2. Chief Medical Officer Report

3. President of the Executive Medical Committee of the Medical Staff Report

4. Review of the Credentials Committee Decisions

4 (a) Review and Recommend Approval of the Credentials Activity Report – May 2013

4 (b) Resolution Recommended To Be Approved


5. Standing Reports

5 (a) Health Education Network (HEN) Quality and Safety-What Does The Future Look Like

5 (b) Scorecard and Bridges to Quality Report

STRATEGY & GROWTH COMMITTEE

PUBLIC HEALTH TRUST FINANCIAL RECOVERY BOARD Strategy and Growth Committee Marcos Jose Lapciuc, Chairperson Mojdeh L. Khaghan, Vice Chairperson Joe Arriola Michael Bileca Irene Lipof Stephen S. Nuell Darryl K. Sharpton
Date, Time and Location April 18, 2013 – To follow the Joint Conference and Efficiencies Committee meeting Ira C. Clark Diagnostic Treatment Center Conference Room 259
AGENDA 1. Approval of the Previous Meeting Minutes 2 Minutes (Marcos Jose Lapciuc, Chairperson, Strategy and Growth Committee) (a) *Meeting Minutes as of April 18, 2013 2. Legislative Update 10 Minutes
(Nathan Ray, Corporate Director, Governmental Relations, Jackson Health System)
3. UM AOA Update 5 Minutes (Don S. Steigman, Executive Vice President and Chief Operating Officer, Jackson Health System) 4. IT Update 10 Minutes (Mojdeh L. Khaghan, PHT FRB, Michael Garcia, Chief Information Officer, Jackson Health System and Wayne Wilbright, M.D., Chief Medical Information Officer, Jackson Health System)
The agenda item noted with an asterisk (*) indicate that the supporting document is attached.

1. Approval of the Previous Meeting Minutes

PUBLIC HEALTH TRUST FINANCIAL RECOVERY BOARD Strategy and Growth Committee
Marcos Jose Lapciuc, Chairperson Mojdeh L. Khaghan, Vice Chairperson Joe Arriola Michael Bileca Stephen S. Nuell Darryl K. Sharpton
Date, Time and Location April 18, 2013 – Followed the Joint Conference & Efficiencies Committee meeting Ira C. Clark Diagnostic Treatment Center Conference Room 259
ATTENDANCE
Strategy & Growth Committee Mojdeh L. Khaghan Stephen S. Nuell Darryl K. Sharpton Marcos Jose Lapciuc Joe Arriola Excused
Michael Bileca
Jackson Health System Carlos A. Migoya Don S. Steigman Wayne Wilbright, M.D. Mark T. Knight Melissa Masters Michael Garcia Miami Dade College Irene Lipof Miami-Dade County Attorneys
Laura Llorente Christopher Kokoruda

Strategy and Growth Committee March 14, 2013 Page 2 Meeting Call to Order With a quorum being present, the Strategy & Growth Committee meeting was called to order at 1:38 p.m. by Marcos Jose Lapciuc, Chairperson, Strategy and Growth Committee. Chairperson’s Remarks With regards to the Evaluation of the President and CEO, Mr. Lapciuc reported that the overall performance score for Mr. Migoya was 4.67. Mr. Lapciuc stated that it is the intent of the PHT Financial Recovery Board (PHT FRB) to publicly review the Evaluation of the President and CEO at the next televised PHT FRB meeting. Mr. Lapciuc encouraged members of the PHT FRB to contact the appropriate member(s) of Jackson Health System staff with questions related to the Evaluation of the President and CEO. 2. PSN ITN and HB 711 Updates
PSN ITN Melissa Masters, Director, Program Planning, Strategic Planning Department, Jackson Health System reported that that the process to complete the PSN ITN has been timely completed and submitted. It is anticipated that the outcome of the PSN ITN will be made public July 1, 2013.
HB 711
Mr. Lapciuc reminded everyone that at the next televised PHT FRB meeting a special meeting and Public Hearing will be conducted regarding HB 711.
1. Approval of the Previous Meeting Minutes
(a) Meeting Minutes as of March 14, 2013 Mr. Lapciuc requested a motion approving the meeting minutes as of March 14, 2013. The meeting minutes of March 14, 2013
was unanimously approved as presented. 3. Trauma Update
Mr. Migoya reported that a state law was passed to deregulate trauma which would make it more competitive as Jackson Health System JHS) moves forward into the future. There has been conversation with the owner of the Bill that was passed. The Committee will be kept informed regarding the next steps. Mr. Sharpton acknowledged the JHS staff for all the work they have been doing in Tallahassee.
Strategy and Growth Committee March 14, 2013 Page 3 4. UM AOA Update
Ms. Masters reported that representative from JHS and University of Miami Health System (UMHS) are working together regarding the UM AOA. It is anticipated that a full report regarding the UM AOA will be presented at the next scheduled meeting. Don S. Steigman, Executive Vice President and Chief Operating Officer, Jackson Health System stated that he has been working with Steven Falcone, M.D., Chief Executive, University of Miami at Jackson Memorial Hospital; Associate Vice President for medical Affairs; Professor of Radiology, Neurological Surgery and Ophthalmology, UMHS to review ways that both entities can work collaboratively regarding the UM AOA.
5. IT Update For purposes of information, Michael Garcia, Chief Information Officer, Jackson Health System and Wayne Wilbright, M.D., Chief Medical Information Officer, Jackson Health System presented the IT update. As part of the update was a status report regarding the Cerner Agreement as well as the Letter of Intent which provides for JHS to move forward with critical path items while finalizing the negotiation process and approval of the Cerner Agreement. Further updates highlighted the following: Central IT strategies, outline of the 7 strategic high value targets to be completed within the next 18 months, 32 existing Cerner Agreements within the Single Master Agreement, Master Agreement phases (phase 1 consists the next 3-year road map which itemizes the 7 strategic high value targets and present the Master Agreement to the PHT Financial Recovery Board for approval in June of this year, and phase 2 identified the future high-value targets and what will be done beyond year 2016), key time sensitive elements that are attributing to the work necessary to begin working immediately with Cerner, scope of the Letter of Intent and timelines, and Master Agreement and schedule 1 timeline. A copy of the IT Update information was distributed at the meeting. Due to IT matters that need to be completed over the next several years and commitment from Cerner to continue a partnership with Jackson Health System, Mr. Migoya requested to meet with Phil Patterson, Chairman and CEO, Cerner to discuss the issues and future surrounding JHS relationship with Cerner, makeup of the Cerner relationship team and assurance of Cerner senior member contact, JHS being the forefront of Cerner, and assurance of a long term commitment by Cerner. Mr. Migoya stated that he explained to Mr. Patterson that JHS is undergoing a major transformation and as JHS proceeds with the transformation process it could represent Cerner from a worldwide perspective. Mr. Patterson made it clear that he understands the importance of technology and IT as it relates to what needs to happen at JHS and the role Cerner will have. He assured Mr. Migoya that Cerner is 100% committed to service JHS. Mr. Migoya stated that he is in favor of the Letter of Intent with Cerner which prepares for the next steps over the next 90 days and a possible long term commitment from Cerner. Mr. Sharpton stated that with the assistance of staff he is pleased to know that JHS has come so far so soon in terms of prioritizing the IT investment. From a process standpoint, Mr. Sharpton questioned how a Letter of Intent was reached with Cerner versus the vendor competition process.

Strategy and Growth Committee March 14, 2013 Page 4
Mr. Garcia explained that the Letter of Intent was reached with Cerner for purposes of the work that needs to be performed (over an 18-month period of time) for the current system which include upgrades for Meaningful Use and requirements necessary to be compliant with IC-10. He further explained that JHS has a contract with Cerner for the next 3 plus years and need to begin the negotiations process to develop a Master Agreement and the correct pricing structure. Cerner is JHS current legacy system and JHS need to determine whether or not they can perform the job. If Cerner proves not to be the right candidate JHS will have the necessary amount of time to be able to move forward with other vendor choices. The Letter of Intent with Cerner can be cancelled within a 30-day period of time. Mr. Migoya stated that he will be available to discuss in detail with Mr. Sharpton the status of IT as it relates to the Letter of Intent with Cerner and related costs. Mr. Lapciuc requested that a color coded schedule and timely comprehensive IT strategy be developed for each of the IT objectives that will be compliant with ICD-10. With regards to a third party involvement, Mr. Garcia stated that JHS contracted with Cumberland Consultants Group (Cumberland), to serve as a third party to review the effectiveness of integration of technology and review the cost of ownership which will be presented to the Committee in June of this year prior to approving the Master Agreement Schedule 1. Cumberland is using evidence-based resources to assure that working with Cerner JHS is aligned with best-practices based on successful implementation within the industry. After discussion, Mr. Lapciuc requested a motion recommending that JHS enter into a Letter of Intent with Cerner. Mr. Sharpton moved approval; seconded by Mr. Arriola, and carried without dissent. Ms. Khaghan reminded everyone that the Committee will receive on a monthly basis IT update reports.
Other Discussion
• JHS Strategic Retreat Mr. Lapciuc requested to have for review and discussion at the June 2013 JHS Strategic Retreat the following:
The future of Jackson Health System Detailed Market Share Analysis Detailed Payor Mix Future of Cost Accounting What facility items should be prioritized What IT items should be prioritized Services Lines Targeted for the Future Balanced Score Card update based on the 3-year Strategic Plan

Strategy and Growth Committee March 14, 2013 Page 5 Meeting Call to Adjourn The Strategy & Growth Committee meeting adjourned at 2:24 p.m. Transcribed by Ivenette Cobb Executive Assistant Public Health Trust Financial Recovery Board

2. Legislative Update

3. UM AOA Update

4. IT Update