public expenditure policy and … 2: cost of capital and rate of capital formation in india 5 table...
TRANSCRIPT

20C5
PUBLIC EXPENDITURE POLICY AND MANAGEMENT IN INDIA : A
CONSIDERATION OF THE ISSUES
Parthasarathi Shome Tapas K. Sen
S. Gopalakrishnan
No. 8 June 1996
ot Public f / .
LIBRARY
Acc. No
tV&V/ D E V -"'

Public Expenditure Policy and Management in India
A Consideration of the Issues+
Parthasarathi Shome* Tapas K. Sen
S. Gopalakrishnan
Authors are Director. Fellow and Economist, respectively. National Institute of Public Finance and Policy, New Delhi. They would like to thank H. K. Amarnath for research assistance and R. Parmeswaran for secretarial assistance.
An earlier version of this paper was presented at a seminar on "Expenditure Management", Department of Expenditure. Ministry of Finance. Government of India, in Vigyan Bhavan, New Delhi on March 18. 1996.
Contents
Page
I. Introduction 1
II. Public Expenditure Issues in India 2Macro-economic issues 3Role of Government 7Priorities 10Form of Expenditure 15Control Mechanism 17
III. Debt and Expenditure Management: Principles and Cross-Country Experiences 20Debt management: markets, co-operation, and rules-based approaches 21Expenditure management: role and functioning of a national treasury 23
IV. Concluding Remarks 24
References 26
Table 1: Aggregate Budgetary Trends in India 4Table 2: Cost of Capital and Rate of Capital Formation in India 5Table 3: Debt Servicing Burden of the Government in India 6Table 4: Expenditure-Revenue Gap in India: Centre and States 9Table 5: Share of Rural Development in Total Plan Expenditure 11Table 6: Functional Classification of Government Expenditure 13
i i
Diagram I: Aggregate Government Expenditure(Centre, States and Union Territories)
18
Publi. Expenditure Policy and Management in India :
A Consideration of the Issues
Parthasarathi Shome, Tapas K. Sen, and
S. Gopalakrishnan
I. Introduction
For about forty years of planned economic development in India (upto 1991-92),
public expenditure was considered a superior good; it prevailed that more of it was better and
that a rising proportion of the additional output of the economy should be spent according
to the collective wisdom of the government. The near-crisis situation of 1991 was an eye-
opener in this context; it focused attention on budgetary trends of the government as the
proximate cause and it also brought up larger issues of the role of the government and the
economic reforms. All these served to emphasise the need for an assessment of govenment
expenditure afresh. But in 1991, there was the danger of swinging to the other extreme, i.e.,
cutting expenditures across the board, mainly due to the preoccupation with fiscal deficit.
Most would agree that that danger is also past. In 1996, we can perhaps examine the issues
relating to public expenditure more dispassionately than ever before. That is one objective
of this paper. A second related objective is to survey selected cross-country experiences with
control of general government1 expenditure/debt and to point towards the optimum role of a
national treasury.
Following this line, Section II attempts a critical analysis of the prevailing expenditure
policy and control issues in India, without traversing the ground regarding the achievements
of the 1990s liberalisation process, which are well known, and confining the discussion to the
The phrase "general government" usually includes various levels — central, state and local -- government. In this paper, central and state government levels are included.

main theme under consideration. Given the extent of the public debt burden. Section III
presents a broad discussion of cross-country practices in general government expenditure and
debt management, with a view towards future policy guidance. Section IV concludes.
II. Public Expenditure Issues in India
It is convenient to group the public expenditure issues into one of the five categories
that relate to five important aspects of the topic at hand:
First, the macroeconomic questions relating to public expenditures and their
sustainability; the issues here are often empirical and even the questions (certainly the
answers) can vary from time to time.
The second set of issues has to do with the normative questions that often cross the
boundaries of economics; these have to do with the appropriate size of the public
expenditures, or, by implication, the role of the government.
The third set of issues relates to the priorities in public expenditure on different
services or different groups of people. This obviously connects with the distributional issues.
The fourth set of issues involves the form of public expenditure. Given the priorities
in terms of target groups or services, the production/provision of the relevant service can
normally be made in different ways with different combinations of inputs; how, why, and
which combinations are chosen would obviously be an important set of questions.
The fifth and final set of considerations relates to the mechanics of public expenditure
control and the political economy questions. Institutional setup is an important ingredient in
the determination of public expenditure; how exactly it works in a particular context forms
the subject matter of a number of erudite enquiries across the world.

It hardly needs to be mentioned that even this quick cataloguing of issues clearly
shows the futility of trying to cover all important issues relating to public expenditures, even
in a superficial fashion, in a small survey paper like the present one. Instead, we outline
below a sample of issues that have been raised in India. Not all of them have arisen in the
context of public expenditures per se; research in the area of public expenditure in India has
not been all encompassing.
Macro-economic issues
The major trends with respect to public expenditures are well known. The long term
growth in public expenditures has been well above the growth of non-debt receipts both at the
Centre and States in general. Between 1974-75 and 1990-91, per capita government
expenditures in constant prices grew at about 6 per cent per annum, whereas per capita
revenue receipts in constant prices grew at only 4.6 per cent per annum (Rao, Sen and Ghosh,
1995). Thus, the fiscal deficit of the country as a whole has the tendency of growing and
there is a constant struggle to keep it within limits. An obvious outcome of these basic trends
is the recourse to rising net borrowing - both domestic and foreign (and/or deficit financing).
Table 1 provides the relevant figures.2
The rising domestic borrowing has had two effects on the growth prospects.3 First,
it has pushed up the rate of interest, making the cost of capital higher (Table 2). This, in
turn, has meant that fewer investment projects at the margin are profitable, which reduces the
demand for investment. On the supply side, the government demand for the investible surplus
has tended to crowd out private demand; the rate of capital formation being lower in the
government (Table 2), the level of investment in the economy should have suffered as a
result. The growth implications of this scenario are obvious.
Note, however, that Central government expenditure as a percentage of GDP has declined on average in the 1990s compared to the 1980s, while figures relating to the States have increased. At least at the level of the Central government, contrary to popular discussion, it seems to be the tax revenue to GDP ratio that needs redoubled attention, reflecting a decline by approximately 1 per cent of GDP during the 1990s.
See Economic Survey. 1996, for a discussion of the components of total — internal and external -- government liabilities, which have now reached 67 per cent of GDP.
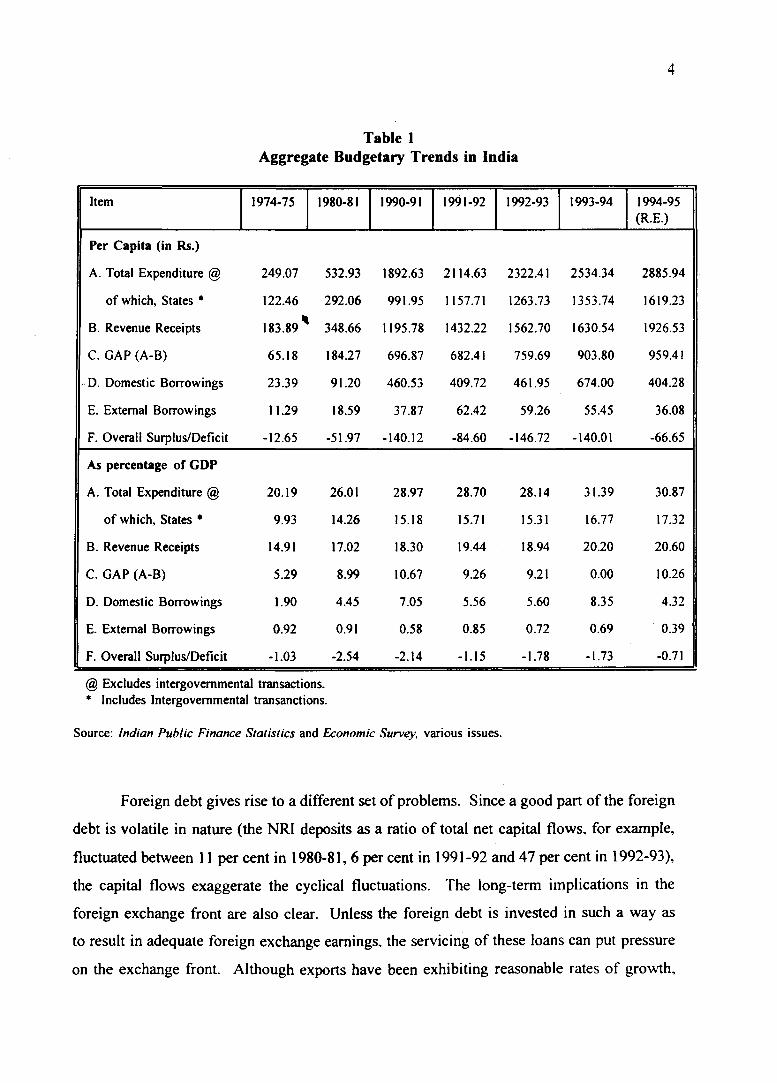
4
Table 1Aggregate Budgetary Trends in India
Item 1974-75 1980-81 1990-91 1991-92 1992-93 1993-94 1994-95(RE.)
Per Capita (in Rs.)
A. Total Expenditure @ 249.07 532.93 1892.63 2114.63 2322.41 2534.34 2885.94
of which, States * 122.46 292.06 991.95 1157.71 1263.73 1353.74 1619.23
B. Revenue Receipts 183.89* 348.66 1195.78 1432.22 1562.70 1630.54 1926.53
C. GAP (A-B) 65.18 184.27 696.87 682.41 759.69 903.80 959.41
D. Domestic Borrowings 23.39 91.20 460.53 409.72 461.95 674.00 404.28
E. External Borrowings 11.29 18.59 37.87 62.42 59.26 55.45 36.08
F. Overall Surplus/Deficit -12.65 -51.97 -140.12 -84.60 -146.72 -140.01 -66.65
As percentage of GDP
A. Total Expenditure @ 20.19 26.01 28.97 28.70 28.14 31.39 30.87
of which, States * 9.93 14.26 15.18 15.71 15.31 16.77 17.32
B. Revenue Receipts 14.91 17.02 18.30 19.44 18.94 20.20 20.60
C. GAP (A-B) 5.29 8.99 10.67 9.26 9.21 0.00 10.26
D. Domestic Borrowings 1.90 4.45 7.05 5.56 5.60 8.35 4.32
E. External Borrowings 0.92 0.91 0.58 0.85 0.72 0.69 0.39
F. Overall Surplus/Deficit -1.03 -2.54 -2.14 -1.15 -1.78 -1.73 -0.71
@ Excludes intergovernmental transactions.* Includes Intergovernmental transanctions.
Source: Indian Public Finance Statistics and Economic Survey, various issues.
Foreign debt gives rise to a different set of problems. Since a good part of the foreign
debt is volatile in nature (the NRI deposits as a ratio of total net capital flows, for example,
fluctuated between 11 per cent in 1980-81, 6 per cent in 1991-92 and 47 per cent in 1992-93),
the capital flows exaggerate the cyclical fluctuations. The long-term implications in the
foreign exchange front are also clear. Unless the foreign debt is invested in such a way as
to result in adequate foreign exchange earnings, the servicing of these loans can put pressure
on the exchange front. Although exports have been exhibiting reasonable rates of growth,

they have so far been insufficient to cover imports, let alone foreign debt servicing
obligations. The best performance in recent years was in 1993-94, when the exports covered
almost 95 per cent of the imports.
5
Table 2Cost of Capital and Rate of Capital Formation in India
Year Prime Lending Rate of IFCI
Rate of Gross Capital Formation (Aggregate)
Rate of Gross Capital Formation (Public Sector)
1970-71 9 17.10 6.51
1975-76 12 20.83 9.63
1980-81 14 20.92 8.65
1985-86 14 24.19 11.22
1990-91 14-15 25.66 9.74
1991-92 18-20 22.87 9.17
1992-93 17-19 23.30 8.87
1993-94 17-19 21.35 8.58
Source: Report on Currency and Finance (various issues), Reserve Bank of India and National Income Statistics, Central Statistical Organisation.
The rising debt-service burden has resulted in preoccupations regarding financial costs;
the rising proportion of interest liability in total government expenditure (from 8.06 per cent
in 1975-76 to 21.3 per cent in 1995-96) has prompted fears of the entire revenue receipts
being used up to pay interest on debt alone (see Table 3). The possibility of a ‘debt trap’ is
a real one for some. Whether the situation is indeed so alarming or not is a moot point; what
is certainly true is that the substantial interest burden without the utilisation of the debt in a
way to raise sufficient returns for its servicing results either in raising the deficits further or
cutting into the other categories of (possibly productive) public expenditure, or both (Shome.
1996).
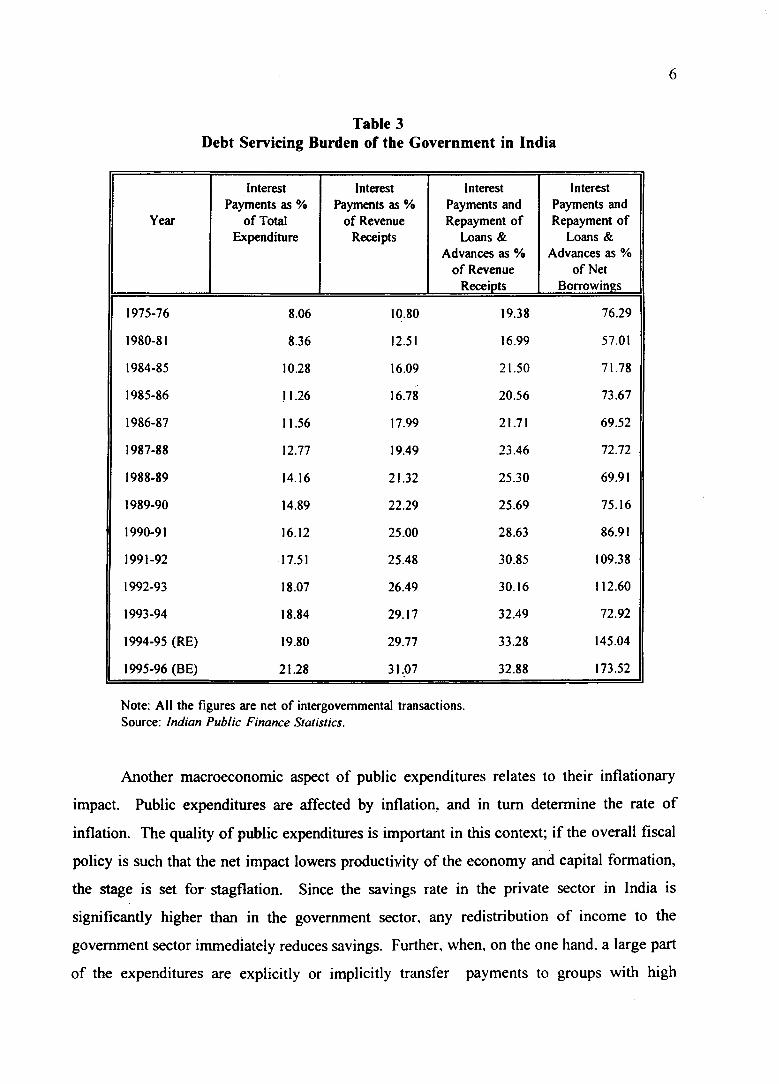
6
Table 3Debt Servicing Burden of the Government in India
Year
Interest Payments as %
o f Total Expenditure
interest Payments as %
of Revenue Receipts
Interest Payments and Repayment of
Loans & Advances as %
o f Revenue Receipts
Interest Payments and Repayment of
Loans & Advances as %
of Net Borrowings
1975-76 8.06 10.80 19.38 76.29
1980-81 8.36 12.51 16.99 57.01
1984-85 10.28 16.09 21.50 71.78
1985-86 11.26 16.78 20.56 73.67
1986-87 11.56 17.99 21.71 69.52
1987-88 12.77 19.49 23.46 72.72
1988-89 14.16 21.32 25.30 69.91
1989-90 14.89 22.29 25.69 75.16
1990-91 16.12 25.00 28.63 86.91
1991-92 17.51 25.48 30.85 109.38
1992-93 18.07 26.49 30.16 112.60
1993-94 18.84 29.17 32.49 72.92
1994-95 (RE) 19.80 29.77 33.28 145.04
1995-96 (BE) 21.28 31,07 32.88 173.52
Note: All the figures are net of intergovernmental transactions. Source: Indian Public Finance Statistics.
Another macroeconomic aspect of public expenditures relates to their inflationary
impact. Public expenditures are affected by inflation, and in turn determine the rate of
inflation. The quality of public expenditures is important in this context; if the overall fiscal
policy is such that the net impact lowers productivity of the economy and capital formation,
the stage is set for stagflation. Since the savings rate in the private sector in India is
significantly higher than in the government sector, any redistribution of income to the
government sector immediately reduces savings. Further, when, on the one hand, a large part
of the expenditures are explicitly or implicitly transfer payments to groups with high
7
marginal propensities to consume and, on the other, infrastructural bottlenecks resulting from
relative neglect by the government exist on the production side, low growth and inflation
might be expected. If prices are attempted to be controlled either directly, or indirectly
through administered prices, the inflationary tendencies crop up in the uncontrolled markets
(e.g., rents, professional consultation fees etc.) or in the black economy (real estate prices,
professional incomes, etc.), causing tax evasion and a concomitant vicious circle of
unfavourable effects (Tanzi and Shome, 1993).
Role of Government
In India, until recently, the role of government was considered central for most
growth-generating economic activities. This role took a particular form. Controls, subsidies,
production, procurement, distribution, provision — various facets of governmental intervention
pervaded different spheres of economic activity. This was a result of the basic philosophy of
Central planning and public sector led development of the economy. Market failure in key
areas of production, distribution and regulation, and a government continuously striving to
enhance the welfare of the citizens were the major assumptions of this paradigm. The
widespread government interventions gave rise to a huge public sector as well as a
bureaucracy with increasing appetites for resources. More as a result of the emergence of a
gigantic governmental apparatus than as a matter of rational policy, government expenditures
kept rising as a proportion of the GDP until it reached 30 per cent in the second half of the
1980s and has hovered around that figure since then [the figure for 1994-95 (R.E.) is 30.1 per
cent; see Table 1].
Since 1990-91, the expenditures of the Central government have fallen as a percentage
of the GDP; but this fall has been countered to some extent by the rise in the States. One
view is that the Centre has simply shifted the burden of some expenditures (like food
subsidies) on to the States, which accounts for these recent trends. It has certainly cut down
the plan loans (Sen, Rao and Ghosh, 1994); the grants recommended by the Tenth Finance
Commission will also help the Centre to cut its own expenditures.

As a part of the economic reforms, the role of government has now been (and is
being) reassessed. The possibility of "government failure", akin to the "market failure"
argument, is now taken seriously. It is recognised that the government itself may have
become too bulky and unwieldy. The public sector, for reasons that are well known, is
generally considered to have become inefficient — with only pockets of efficiency — and a
challenge to public resources. The establishment cost of government activity has risen and
to provide the same or even a lower level of actual service, rising amounts of real resources
seem to be needed to be spent. Yet, the large government expenditures have been faulted for
being generally inefficient in providing the required service. This is now recognised both at
the Central and the State levels. As a result, there is some attempt to withdraw from areas
where the government does not enjoy a comparative advantage.
However, a clear picture of the role of government in coming years is yet to emerge,
as there is still strong resistance to limiting the role of government to those areas where it
works best and strangely, to increasing its role in areas like regulation and enforcement of
property rights. The "distributive coalitions" that have wielded disproportionately large
influence over expenditure decisions, and for their own benefit, now have an interest in the
present level and distribution of public expenditures. It, therefore, might be expected that
redefining the role of government, with the attendant implications for expenditure policy could
now be viewed with some suspicion (Rao and Sen, 1993).
The consensus is, nevertheless, veering around to the view that in principle, the
government should confine itself to the areas of public goods and possibly some merit goods.
Technological changes have altered the status of natural monopolies and even pure public
goods such as wireless broadcasting. On the other hand, the relatively recent focus on human
development and environmental concerns do define a clear area of operation for the
government. Regulation instead of production/provision of goods and services, provision of
adequate and costed infrastructural facilities to private investors, and playing a promotional
role with respect to socially desirable goals are other areas of legitimate government concern.
Finally, the lessons learnt from the East Asian economies show that it is the quality of
government intervention rather than the quantity that is important for economic growth (Tanzi
and Shome, 1992). The ‘how’s and ‘what’s determine the success of the policy much more
8
9
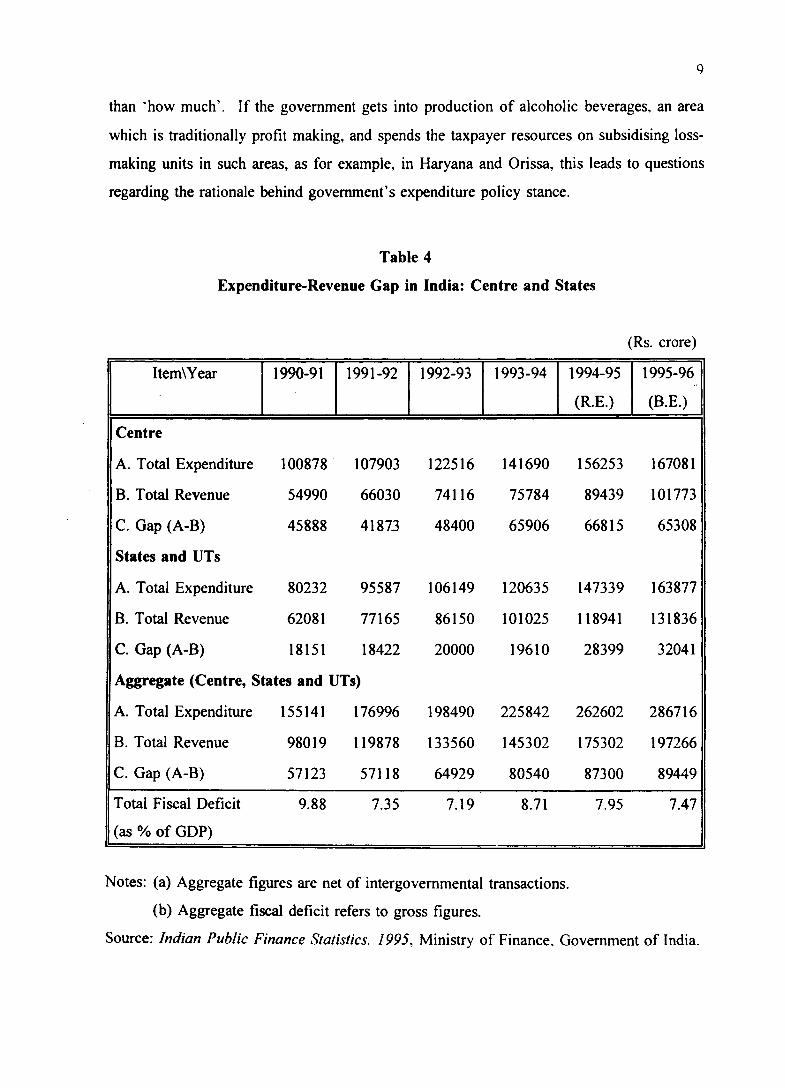
than ‘how much’. If the government gets into production of alcoholic beverages, an area
which is traditionally profit making, and spends the taxpayer resources on subsidising loss-
making units in such areas, as for example, in Haryana and Orissa, this leads to questions
regarding the rationale behind government’s expenditure policy stance.
Table 4
Expenditure-Revenue Gap in India: Centre and States
(Rs. crore)
Item\Year 1990-91 1991-92 1992-93 1993-94 1994-95
(RE.)
1995-96
(B.E.)
Centre
A. Total Expenditure 100878 107903 122516 141690 156253 167081
B. Total Revenue 54990 66030 74116 75784 89439 101773
C. Gap (A-B) 45888 41873 48400 65906 66815 65308
States and UTs
A. Total Expenditure 80232 95587 106149 120635 147339 163877
B. Total Revenue 62081 77165 86150 101025 118941 131836
C. Gap (A-B) 18151 18422 20000 19610 28399 32041
Aggregate (Centre, States and UTs)
A. Total Expenditure 155141 176996 198490 225842 262602 286716
B. Total Revenue 98019 119878 133560 145302 175302 197266
C. Gap (A-B) 57123 57118 64929 80540 87300 89449
Total Fiscal Deficit 9.88 7.35 7.19 8.71 7.95 7.47
(as % of GDP)
Notes: (a) Aggregate figures are net of intergovernmental transactions.
(b) Aggregate fiscal deficit refers to gross figures.
Source: Indian Public Finance Statistics. 1995, Ministry of Finance. Government of India.

10
Priorities
In the comprehensive Central planning framework, the emphasis was on bringing
major aspects of the economy under government control and the resources spent to do it were
not considered a binding constraint. This was almost equally true for the Central and the
State governments. Even when the revenue receipts (capital receipts were essentially loans)
were not sufficient to meet the revenue and capital expenditures on various functions and
services, there was no serious attempt at prioritising expenditures and thereby economise
(Table 4). Fiscal deficit of the aggregate government sector, therefore, stays above 7 per cent
of the GDP. Borrowings and deficit financing continue to be taken as the balancing variables.
The budget constraint should have been more effective at the State level, but it was not, partly
reflecting a traditional role of the Centre as a lender of last resort and partly due to the
ingenuity of the States in finding new sources of borrowing (see Bagchi and Sen, 1992 and
Gopalakrishnan and Rangamannar, 1996).4
Despite the tendency for running deficits, however, there is no gainsaying the fact that
certain services or functional categories did not get as much attention as they deserved while
certain others received more than their due. An assertion like this always carries some
amount of value judgement with it, but such expenditures seem not to have conformed even
to the intentions of the policymakers. For example, in the case of expenditure on poverty
eradication, while the tax structure is cluttered with distributional objectives and a
preoccupation with progressivity (even though recently reduced), the much-publicised, targeted
anti-poverty programmes [such as Integrated Rural Development Programme (IRDP) and
National Rural Employment Programme (NREP) (later Jawahar Rozgar Yojana)] that*
comprise most of rural development programmes have tended to lack funds (Table 5), spread
too thinly over too many beneficiaries and from many accounts, poorly administered.
Expenditures targeted to specified weaker sections like Scheduled Castes and Scheduled Tribes
were probably too little in comparison to the size of the target groups. Expenditures on
farmers’ subsidies on procurement of their surplus produce and on some farm inputs were,
on the other hand, large and continuously rising even at the cost of significantly distorting
This has also happened typically in middle-income, fiscally federal economies such as Argentina and Brazil. See Shome (1995).
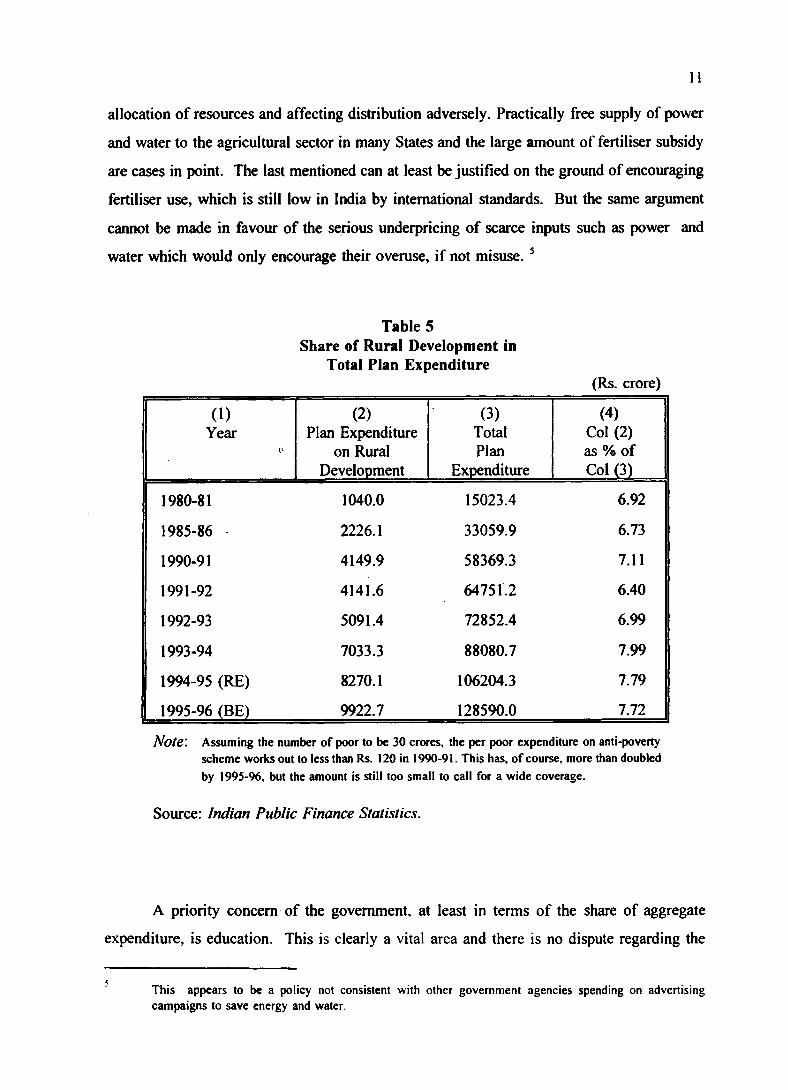
allocation of resources and affecting distribution adversely. Practically free supply of power
and water to the agricultural sector in many States and the large amount of fertiliser subsidy
are cases in point. The last mentioned can at least be justified on the ground of encouraging
fertiliser use, which is still low in India by international standards. But the same argument
cannot be made in favour of the serious underpricing of scarce inputs such as power and
water which would only encourage their overuse, if not misuse. 5
Table 5
11
Share of Rural Development in Total Plan Expenditure
(Rs. crore)
(1)Year
(2)Plan Expenditure
on Rural Development
(3)TotalPlan
Expenditure
(4) Col (2) as % of Col (3)
1980-81 1040.0 15023.4 6.92
1985-86 2226.1 33059.9 6.73
1990-91 4149.9 58369.3 7.11
1991-92 4141.6 64751.2 6.40
1992-93 5091.4 72852.4 6.99
1993-94 7033.3 88080.7 7.99
1994-95 (RE) 8270.1 106204.3 7.79
1995-96 (BE) 9922.7 128590.0 7.72
Note'. Assuming the number of poor to be 30 crores, the per poor expenditure on anti-poverty scheme works out to less than Rs. 120 in 1990-91. This has, of course, more than doubled by 1995-96, but the amount is still too small to call for a wide coverage.
Source: Indian Public Finance Statistics.
A priority concern of the government, at least in terms of the share of aggregate
expenditure, is education. This is clearly a vital area and there is no dispute regarding the
This appears to be a policy not consistent with other government agencies spending on advertising campaigns to save energy and water.

need to spend on education in general. But disaggregation beyond this point raises a number
of controversies. An important question that is raised is: does the increased expenditure
benefit the students in terms of greater availability of schools or better quality of education,
or does it simply raise the quasi-rent that the government-employed teachers may be enjoying?
Other issues within education relate to the share of primary and other levels of education.
Finally, there are issues of leakage. For example, in particular States, college education is
probably in excess supply going by the number of eligible school children completing
secondary schooling. The same has been observed in the case of secondary schools. The
only possible explanation of this anomaly is provided by the institutional arrangements; salary
of teachers is paid by the government to the colleges run mostly by private organisations,
teachers are usually selected by the management, and the market wage for teachers usually
employed would be lower than the government scales prescribed. A combination of these
factors allows the managements to choose their own candidates as teachers who actually
receive only the market wage; the additional salary forms the profit in this business. Such
leakages have been observed in Gujarat, Kerala, Orissa and West Bengal (see Ravishankar,
1989, for example).
Another important area stressed in recent years is health. In India, athough private
expenditure probably outweighs public expenditure on health, the latter is extremely important
in certain crucial sub-sectors like primary health care and public health. Due to the rising
population, family welfare (or more precisely, family planning) has become the overriding
concern and the primary health care institutions run by the government have almost become
family planning centres. However, this is a self-defeating policy since it has been shown that
infant mortality rate has a strong influence on the adoption of family planning methods. Good
pre-natal care of women, proper medical attention at birth and cutting down on infant
mortality would better help the cause of family planning. Primary health care system must
work well as such to promote family planning; if that happens only information about family
planning methods and necessary assistance for their use will be needed. The relatively large
expenditure on persuasion and incentives should not then be necessary. In fact, this sector
provides a good example of why coordination between various policies (not observed often
in practice) is important. The connections between female education, child health, nutrition,
water supply and sanitation, and family planning are already documented. There is clearly

a need for an orchestrated public expenditure policy in these areas which, however, continue
to be dealt with largely independently (Sen, 1993).
Table 6Functional Classification of Government Expenditure
(Rs. crore)
Year GeneralAdministration
Defence SocialServices
EconomicServices
LoansandAdvances
TotalExpenditure
1974-75 1256.19 2130.64 3557.07 5491.32 2354.37 14789.59
1980-81 2718.36 3893.53 8474.26 15336.84 4956.42 35379.41
1985-86 5960.07 8560.10 20018.61 34594.78 7281.79 76415.35
1990-91 15647.53 15491.54 40434.51 71622.05 11945.84 155141.47
1991-92 18314.22 16450.86 44636.71 85621.96 11972.19 176995.94
1992-93 21744.30 17660.86 48923.61 98766.02 11394.80 198489.59
1993-94 24034.04 2193928 58407.97 108174.98 13285.89 225842.16
1994-95 (RE) 28737.46 23596.72 72948.44 123128.15 14191.33 262602.10
1995-96 (BE) 34119.15 25634.00 79458.76 133580.75 13922.89 286715.55
Note: General Administration includes all interest payments. Source: Indian Public Finance Statistics.
The broad functional distribution of government expenditure does not reveal any
startling changes over the years except a spurt in expenditure on general administration --
mainly due to rising interest payments as noted above — and a slowdown in defence
expenditure (Table 6). These figures , however, do not reveal the low priority that economic
services as a group have received in the revenue budgets of all levels of government, except
for the major subsidies. The economic classification of the government budgets indicates that
the assets already created under this category are not adequately maintained or kept in good
repair (Rao and Tulasidhar, 1993). Since these are generally in the nature of infrastructural
services, this has the result of reducing the general level of efficiency of the economy and
raising the costs of production. The stagnant capital expenditures of the government have also
hit this sector hard. Inadequate provision for this sector affects long-term growth prospects,
as has been observed in the case of Kerala. The ‘Kerala Model’ emphasised human

development which has resulted in the best human development index in India comparable
to the advanced countries; but in the process, economic services were neglected and the effect
is evident in the form of low growth of the State economy despite a large inflow of
remittances. Privatisation could justify a deceleration, or even a cutback, in the public
expenditure on economic services but, in reality, large scale privatisation is yet to take place,
particularly at the State level where important infrastructural services such as irrigation, power
and road transport are provided. Thus, inadequate provision for these services in the
government budgets continues to imply, by and large, lower availability. Further, the fact
that per capita expenditures in the States on this as well as other functions are directly related
to the level of per capita SDP, does not augur well for the relatively less developed States
(Gopalakrishnan and Rangamannar, 1996).
A worrying trend is the large share of total government expenditure claimed by wages
and salaries. More than a quarter of the rising public expenditures has been claimed by
compensation to employees, and their constant share from 1974-75 to date indicates a lack
of scale economy. This is both due to rising employment and rising emoluments. The latter
has been rising faster than the per capita income as well as the consumer price index. Thus,
it appears that whatever economies of scale were actually available, were neutralised through
a rise in emoluments. This has been much commented upon, so much so that now there
seems to be a critical mass of consensus for reducing the number of employees, particularly
at the lower levels, but paying the remaining employees well (a guide to what is ‘paying well’
is provided by looking at organised private sector emoluments for persons of equivalent rank).
Comparisons of emoluments between the private sector and the public sector would raise a
lot of dust and involve too many variables, but to make a dent on the problem of number of
employees, the attrition policy must apply to all levels; the disguised unemployment is by no
means confined to the lower echelons of the bureaucracy.
Two of the basic functions of government, national defence and maintenance of law
and order, have not grown faster than the overall growth of government expenditures, despite
pressures on the latter. However, an anomaly that may be pointed out is that within the
category of maintenance of law and order, courts of justice have received a falling share of
expenditure despite the complementarity with the other area of law and order, the police (Rao
14
and Sen, 1993). Overall, the general administration has maintained its share in government
expenditure over a long period, again reflecting the lack of scale economy. This is
particularly surprising, because the tax administration costs have exhibited substantial
economies of scale. Tax collection costs as a ratio of tax revenue shows a clear tendency of
falling as tax revenue increases; this is supported by time series as well as cross-section
evidence for the States (Rao and Sen, 1993).
Form of Expenditure
There are three important broad sets of issues in this category: tax expenditures as a
substitute of other expenditures, capital versus revenue expenditures and plan versus non-plan
expenditures.
The tax expenditure question, put in a nutshell, relates to the wisdom of granting tax
concessions in preference to overt expenditures for the target group. This is resorted to
extensively by the Centre as well as the States. It reduces the transparency of the system, apart
from making the targeting less effective. The costs to the government are often unknown and
escape the scrutiny of the control mechanism prescribed.
The relative neglect of capital expenditures has been well-documented and discussed
by many. The expenditure trends clearly show a stagnant capital expenditure alongside fast
rising revenue expenditure in India, despite the lack of adequate infrastructural facilities within
the country. This problem is compounded by the fact that available resources are spread too
thinly over too many projects, resulting in large backlogs and significant cost overruns. The
burgeoning revenue expenditures have not only gobbled up all the revenue receipts, but also
have cut into capital receipts as well and have thereby reduced the resource availability for
capital expenditure. This creates an inherently unstable situation as the loan-servicing
requirements make for self-propelling revenue expenditures with no compensating increase
in the receipt flows. Given the trends in revenue receipts, keeping the revenue expenditures
within the limits set by the revenue receipts is vital to generate resources for capital
expenditure. This prudent policy seems to have turned turtle, and is clearly not sustainable.
The issue of an efficient input combination (capital assets, consumables and other material,
15

and personnel) for providing a service has been ignored in the process (Rao. Sen and Ghosh,
1995).
The primacy given to plan sizes and plan expenditures could be said to have been
partly responsible for the present fiscal scenario. Essentially, plan sizes ought to depend on
available resources for plan purposes (and the Central transfers available in the case of States).
But due to very limited and even negative resources available for plan purposes from the
revenue budget, and an unwillingness to compromise on plan size, plans have been financed
with substantial amount of borrowings. The plans have changed their nature over the years
to contain expenditures of current and capital nature in almost equal proportions from the
original 30:70 ratio. As a result, the debts incurred for plan purposes have rarely been self-
liquidating. It thus appears that to put a lid on the growth of expenditures, a rethinking about
the whole planning procedure relating to its formulation and financing has become due.
This also relates to the issue that once approved by the Planning Commission, the
expenditures incurred assume some kind of sanctity despite being unsustainable in the long
run. The illusory difference between the plan and non-plan expenditures (expenditure on plan
schemes started during a particular plan period become non-plan once that particular five-year
plan is over) thus is partly responsible for continuously adding to schemes on which resources
have to be spent. There is no inherent qualitative difference between a plan scheme and a
non-plan scheme; there are several examples of large developmental projects (e.g., power
projects in Karnataka) outside the plan. The time may be ripe to undertake a thorough
review of the planning process - particularly its financing - and of the traditional distinction
between plan and non-plan expenditures, which has generally prevented a holistic view of
government finances. It may be opportune for the Resources Group for the Ninth Five Year
Plan, which has already initiated its functions through the operation of Working Groups
focussing on resources, savings, taxes and expenditures to look also into such matters.
The formal distinction between current and capital expenditures, however, appears to
be on a more stable foundation, despite the fact that the basic distinction of generating a
future flow of returns from capital expenditure is. by and large, not in reality observed in
India. But that does not rule out the presumption that certain expenditures are analogous to
16
17
consumption in the sense that they are not expected to yield any returns and these current
expenditures are different qualitatively from capital expenditures from which returns are
expected. If the distinction was not maintained, there would be no way of judging the
performance of the investments made by the government, as there would be no way of
knowing what part of the expenditure was in the nature of investments.
Control Mechanism
There is a constitutionally ordained mechanism in place to maintain control over public
expenditure. This consists of the office of the Comptroller and Auditor General and its
subordinate offices, the legislature and the legislative committees, and the judiciary. The
executive branch has its own control mechanism which includes bodies for scrutinising and
approving proposed projects and for monitoring progress. Performance budget was introduced
in 1975 and its scope was gradually expanded to monitor the effectiveness of government
expenditures. Thus, there is an elaborate system of policy formulation, process control and
efficiency control of public expenditure. Despite this system, the expenditures have grown
much faster than revenue receipts, causing the fiscal deficit to grow. Obviously, this
elaborate system tends to control expenditure in a mechanical or legal way; checks are made
for the necessary approvals and completed forms: the contents of various expenditure
proposals and their worth rarely gets a scrutiny once past the.formulation stage. The system
is not very successful in controlling leakages either; it has been stated that a non-negligible
part of public expenditure ends up in the underground economy.
There are several indicators and symptoms of the system failure. Apart from the
significant growth of public expenditures, the nature of the growth is instructive. A plot of
the total public expenditure per capita at current prices exhibits such a smooth curve (Diagram
I) that the hypothesis of budgeting through "creeping incrementalism" (in nominal terms)
receives strong support a priori. Even in real terms, Diagram I shows that per capita
government expenditure has increased steadily during the twenty years under consideration,
more than doubling from Rs. 364 in 1974-75 to Rs. 845 in 1993-94. Since this is known to
be the typical bureaucratic manner of budgeting, it also provides some evidence of the need
for improvement in expenditure control. Possible areas include the fashion of preparation of
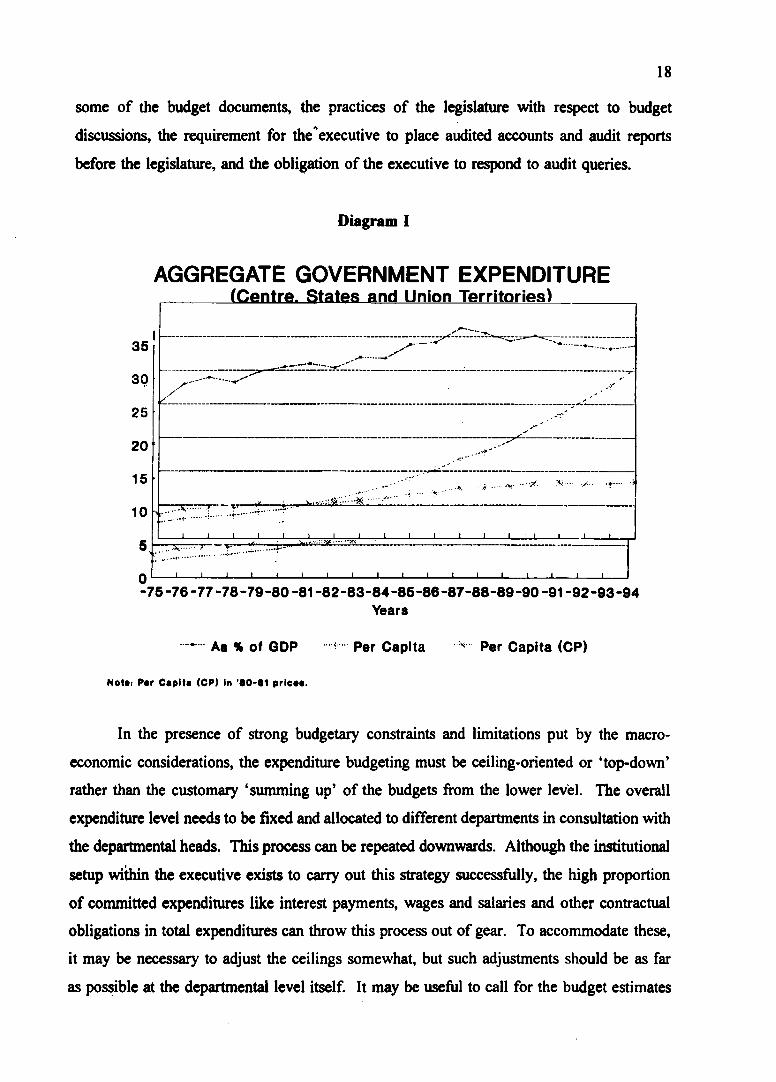
some of the budget documents, the practices of the legislature with respect to budget
discussions, the requirement for the'executive to place audited accounts and audit reports
before the legislature, and the obligation of the executive to respond to audit queries.
Diagram I
AGGREGATE GOVERNMENT EXPENDITURE (Centre, States and Union Territories)
percentage/Rs. *0035
30
25
20
15
10
5
0-75 -76 -77 -78 -79 -80 -81 -82 -83 -84 -85 -86 -87 -88 -89 -90 -91 -92 -93 -94
Years
......... As ^ of qqp Per capita * Per Capita (CP)
Not*: Par Capita (CP) In '60-81 pricaa.
In the presence of strong budgetary constraints and limitations put by the macro-
economic considerations, the expenditure budgeting must be ceiling-oriented or ‘top-down’
rather than the customary ‘summing up’ of the budgets from the lower level. The overall
expenditure level needs to be fixed and allocated to different departments in consultation with
the departmental heads. This process can be repeated downwards. Although the institutional
setup within the executive exists to carry out this strategy successfully, the high proportion
of committed expenditures like interest payments, wages and salaries and other contractual
obligations in total expenditures can throw this process out of gear. To accommodate these,
it may be necessary to adjust the ceilings somewhat, but such adjustments should be as far
as possible at the departmental level itself. It may be useful to call for the budget estimates
19
broken up by the committed and discretionary elements separately, given the ceiling. As a
general rule of thumb, discretionary expenditures beyond the ceiling should not be allowed.
Also, adequate guidance should be given regarding what constitutes committed expenditures.
The strategy outlined above can be successful only if the budgeted expenditures thus
arrived at are not exceeded. The ongoing review process on the basis of monthly summaries
prepared by the Chief Controllers of Accounts should be useful to ensure this. Further,
supplementary grants need to be used very sparingly or the abovementioned budgeting process
can be circumvented. A similar caution applies to the appropriations from the Contingency
Fund.
In a framework of uneven and incomplete information flows, pressures of varying
strength being applied on the executive to placate various "distributive coalitions", uncertain
political awareness of the electorate and a short time horizon employed by politicians for
various reasons, it is the policy level and the implementation level where control tends to
become weak. A mechanical interpretation of the rules, deliberate or otherwise, often results
in mere observation of the formalities without maintaining focus on the intent There would
need to be more follow up action to ensure that the resources spent for a particular purpose
do translate into increased or improved delivery of the service concerned. Even performance
budgets have not ensured this (Rao and Rajagopalan, 1993). The system is more target-
oriented than goal-oriented; targets tend to be defined in a way that divorces them from the
intended goal. Also, the expenditure itself is often the target; success or failure is measured
in terms o f resources spent, irrespective o f the achievements in terms of the ultimate objective.
One of the reasons for the fiscal imbalance could actually be the absence of any
prescribed link between receipts and expenditures. The budgetary system has little inbuilt
checks on deficits. One way of introducing effective budgetary control would be to directly
link expenditures to receipts where appropriate. An example is provided by earmarked taxes,
e.g., profession tax revenue being used for Employment Guarantee Scheme in Maharashtra.
Even though this is not a solution for all situations (for example, in Latin American countries
such as Brazil and Costa Rica, too much earmarking seems to have led to much reduced
flexibility), in India it might be considered given the exigency of the moment. Other possible

20
examples could be financially self-sufficient hospitals, schools or universities. Non-
departmental public enterprises should have provided examples of functioning self-sufficient
units within the public sector, but by and large they have not been self-sufficient financially.
Admittedly, this could be used only in a very limited way initially and could probably never
be expanded very much. But it could provide useful lessons and give the proper signals.
Another possible step would be to form legislative sub-committees to examine selected
advance demands for grants each in detail, with the help of the representatives of the
concerned departments. The final demands for grants could vary from the advance by a given
margin. This would make up for the lack of scrutiny at the policy level that the "guillotine"
rule causes. Such advance demands could be drawn up by the end of December every year.
A major dent on the rising government expenditures could be made, however, through
a consistent policy of only necessary intervention by the government and firm control on
government employment as well as wages. If left to the judgements of any prevailing set of
decision-makers alone, however, political economy pressures would not expectably allow
expenditure growth to be reined in. Perhaps we need a statutory limit on expenditure growth
linked to receipts or to GDP, as have been introduced elsewhere. It would, however, be an
extreme step to take, with the sacrifice of some fiscal flexibility.
III. Debt and Expenditure Management: Principles and
Cross-Country Experiences 6
India being a federal state, it would be pertinent to review fiscal federal arrangements
in selected federal economies. This is so because, often in comparable federal countries,
central governments have acted as spenders or lenders of last resort (Shome, 1995), which has
important ramifications for government expenditure management policies.
6 See Premchand (1993) for a discussion on cross-country expenditure management at the national level.
Debt management: markets, co-operation, and rules-based approaches
Many countries are now redistributing tax and expenditure responsibilities to
subnational governments. The 73rd and 74th Amendments to the Indian Constitution have
embarked on a similar direction. Where public debt is concentrated in the central government,
some control would be essential to see that decentralisation does not worsen fiscal
performance of general government. Also, there should be no bail-out by upper level
governments when lower level governments face a borrowing crunch. Of course, borrowers
should have institutional structures, based on free and open market instruments, available to
them. At the same time, there should be no obstacles on financial intermediation that places
government in an advantageous position relative to the private sector (Ter-Minassian, 1995).
Many countries use control by the central government to check possible default by
state governments. Thus, sole reliance on market discipline is rare among countries. Even
in Canada, where municipalities have no constitutional limit to borrow, and borrow through
subventions or municipal financial companies, market discipline is not fully effective. Indeed,
provincial bonds comprise a poor market index. Nevertheless, provincial debt is increasing:
perhaps there is a "recognition lag" in the market. In France, central controls were tightened
recently to reduce regional level deficits, and a requirement for prior central approval was
introduced. In India, approval of the Central government is needed by those States which
have debt with the Central government.7 However, to the extent that the Central government
gives grants and loans at lower-than market rates of interest, Central control cannot be said
to have imposed discipline at the State level.
Scandinavia uses a cooperative approach to the control of subnational debt. Limits are
placed not by law or by the centre, but are arrived at through negotiations. Recently, in
Australia, subnational governments have been participating in macro-fiscal objectives through
targeting the deficit of general government. In Denmark, such negotiations are bilateral, while
in Australia, they are multilateral, through a Loan Council in which all states and the centre
are represented. Until 1993-94, the Loan Council determined the limit on the borrowing by
7 This restriction applies only to market borrowing and therefore notare often resorted to in order to avoid restrictions.
21
a binding constraint. Negotiated loans
all states, including through any innovative off-budget techniques. To curb this, the Loan
Council undertook ex-post monitoring to minimise them. The Loan Council also increased
efforts to improve market discipline in borrowing through obtaining timely information on
state finances.
Some methods comprise an attempt to use a rules-based approach using clear
guidelines, transparency and even-handedness that should keep in check any bargaining
between the centre and states, limits off-budget financing, and requires submission of timely
data on revenue and on all phases of expenditure disbursement.
Rules are usually applied to limit such debt. Some countries prohibit or restrict
borrowing of a particular kind that could lead to macro-economic problems, for example,
central bank borrowing. Industrialised countries — Germany, Switzerland, and some Spanish
and U.S. states — allow borrowing by subnational governments but stipulate repayment on an
annual basis. In other countries, the centre sets more frequent limits on debts, reviews the
operations, or attempts to centralise borrowing through, for example, on-lending to subnational
borrowing for specific purposes such as investment. These methods are found in more unitary
states such as the U.K., Japan and Korea.
Regarding the possibility of subnational governments borrowing externally, it should
be recognised, first, that external debt policy is intrinsically linked to other macro-economic
policies — including monetary and exchange rate policy which comprise direct central
government responsibility. Thus a co-ordinated approach to external debt is essential.
Second, different market ratings for different states may exacerbate differentials in regional
growth rates. Third, foreigners may, in any event, require the centre to guarantee loans to
states at least implicitly. These matters are pertinent in India today especially as various
committees and working groups discuss decentralisation of financing powers in the context
of recent Constitutional amendments.
22

23
Expenditure management: role and functioning of a national treasury
The scope of treasury responsibilities should include the management of: (1) the cash
flow of the central government, to guarantee a balance between revenue and expenditure and
to be compliant to the release of resources for which the central government is responsible;
(2) financial receivables (from state and local government and state-owned companies) and
real estate property of government; (3) obligations and duties assumed by the central and state
governments as well as state-owned companies involving external/internal credit; (4) the
budgeting of central government subsidised credit for the financing of agriculture, exports,
etc.; and (5) a coordinated system of public accounts. Selected other functions could be added
(Portugal, 1995).
Ideally, the budgetary system should not be just an accounting system for revenues and
expenditures. It should perform allocative, distributive and stabilization functions. It should
allocate appropriately while excluding non-contributors. It should distribute according to
factor earnings while redressing inequalities in income distribution. It should utilise fiscal
policies to attain a position of balance in macro-economic indices such as employment,
economic activity, etc.
Often, however, the only available instrument is the constraining of expenditures. The
root of such difficulty is usually the unrealistic volume of the budget, related to the size of
the state. The complications appear from various levels of government. There could be
excessive rigidity in linking incomes to revenue, leading to overestimates of expenditures so
that revenues are ensured for carrying out such expenditures, say on payroll. 8 Or between
revenue and expenditure. Both, if not optimally managed, could lead to a reversal of
priorities, resulting in the appearance of the question: what should be the role and the size of
the state?
For example, in Brazil, the 1988 Constitution increased expenditures on education as a ratio of total expenditures from 13 percent to 18 percent. Similarly, social assistance, social security and health care are also frozen in terms of overall expenditures. The execution of the central budget is undertaken within various such constraints.

If the accepted wisdom is followed, then the allocative function should be left to
subnational government, the distributive function should be handled by the central
government, while local government should undertake specific local functions. In India, many
responsibilities, that should be, are not passed down. This might be changed if the recent
Constitutional amendments are put into practice.
In general, actual expenditure management operations even in developing countries
could be or may need to be fully mechanised. In the case o f Brazil, which is a good example
for India, links from various states to Brasilia (the capital) are computerised, through an "on
line. real-time control" mechanism. Banks collect revenues and transfer to a consolidated
"single account" at the national treasury. On that basis, every month, the Secretary of the
Treasury prepares a daily national forecast of revenue collection (for the next month).
After thus obtaining the amount of available resources, estimates of staff payroll (as
determined by Presidential Decree), social security benefits, and servicing of external/internal
debt are the first to be scheduled for financial payments. The next step is the allocation of
revenues based on submission of demands from various bodies.
The execution of the budget also occurs through the "single account" system.
Transactions among federal and subordinate institutions must be through accounts they
maintain within the "single account". Only when payments are made to third parties is this
account affected, which then affects the monetary base. Thus, the central bank also needs to
know the details of the "single account" in order to manage its own cash flow. 4
IV. Concluding Remarks
This paper attempted a tour deforce of the major expenditure policy concerns as well
as expenditure and debt management issues in India today. It also summarised selected
gThe national treasury’s focus is. however, mainly on the volume of transactions and not on their detailedcomposition. The only categories used are: payroll, internal service payments, external service payments.social expenditures and other. Within the last category, there are no restrictions on how a particular ministryshould use these funds. There is no mention of specific expenditures, projects or payments.
24
25
principles and arrangements of expenditure management at different levels of governments,
using illustrative cross-country examples. It pointed towards the major areas needing
improvement in the case of India in light of the continuing high fiscal deficit to GDP ratio
and its long run ramifications for public debt.

26
References
Bagchi, A. and Sen, T.K. (1992), "Budgetary Trends and Plan Financing in the States", in A. Bagchi, J.L. Bajaj and W.A. Byrd (ed.) State Finances in India. Vikas. Delhi.
Gopalakrishnan, S. and Rangamannar, T.S. (1996), "Shortfalls in States’ Plan Outlays: An Analysis", Working Paper No. 6. NIPFP, New Delhi.
Government of India (1996), Economic Survey. Ministry of Finance. New Delhi.
Portugal Filho. M. (1995), "Brazil: A Proposal for a Treasury Code", paper presented at a Conference organised by International Monetary Fund and Ministry of Finance of Brazil, in Salvador, Brazil, December 1995 (unpublished).
Premchand, A. (1993), Public Expenditure Management. International Monetary Fund, Washington, D.C.
Rao, M.G. and Rajagopalan, D. (1990), Public Expenditure Control in India. Mimeo, NIPFP, New Delhi.
_______ and Sen, T.K. (1993), Government Expenditure in India: Level. Growth andComposition. Mimeo, NIPFP. New Delhi.
________ , Sen, T.K. and Ghosh, M. (1995), "Uneven Growth of Government Expenditure inIndia: An Analysis of the Trends Between 1974-75 and 1990-91". Journal of Indian School of Political Economy. Vol. 7, pp. 256-276.
_______ , and Tulasidhar, V.B. (1993), "Public Expenditure in India: Emerging Trends", inStability and Development: Essays in Honour of Dr. D.T. Lakdawala (edited by Y.K. Alagh, R.J. Mody and R.D. Desai), pp. 115-141, Har-Anand. Delhi.
Ravishankar, V.J. (1989), India: Government Expenditure in Social Services 1976/77 - 1986/87. Mimeo., The World Bank. New Delhi.
Sen, T.K. (1993), "Public Expenditure on Human Development in India : Trends and Issues", in Kirit S. Parikh and R. Sudarshan (ed.). Human Development and Structural Adjustment. Macmillan. Madras.
________ , Rao, M.G. and Ghosh. M. (1994), "Implications of 1994-95 Budget for Growthand Stability". Economic and Political Weekly. April 16-23. pp. 969-977.
Shome, P. (1995). "Fiscal Federal Relations and Macro Economic Management: Selected Latin American Experiences". M.H. Gopal Memorial Lecture. Indian Economic

Association, Annual 1994 Conference. Reprinted in Indian Economic Journal. Vol. 42. No. 3.
_____, (1996), "Economic Liberalisation. Fiscal Performance and Tax Reform: IndianExperience and Cross-Country Comparisons", in S. Mundle (ed.) Fiscal Policy in India. Oxford University Press, New Delhi (forthcoming).
Tanzi, V. and Shome. P. (1992), "The Role of Taxation in the Development of East Asian Economies", Chapter 2 in The Political Economy of Tax Reform, edited by Takatoshi Ito and Anne O. Krueger, University of Chicago Press, Chicago.
______and Shome, P. (1993), "A Primer on Tax Evasion". IMF Staff Papers. InternationalMonetary Fund, Washington. D.C.. December.
Ter-Minassian, T. (1995), "Borrowing by Subnational Governments: Issues and Selected International Experiences", paper presented at a Conference organised by International Monetary Fund and Ministry of Finance of Brazil, in Salvador. Brazil. December (unpublished).
publicex. 14\6092\16.5.96