public distribution system of essential commodities as a...
TRANSCRIPT

Public Distribution System of Essential Commodities as a Social Safety Net
A Study of the District of Allahabad, Uttar Pradesh
Final Report
Submitted by
Bhaskar Majumder
To Planning Commission Government of India
New Delhi
Govind Ballabh Pant Social Science Institute Jhusi, Allahabad
Phone: 667214, Fax: 667207 E-mail: [email protected]

i
Contents Chapter Contents ii-iii Research Team iv Preface v Location Map vi List of Boxes vii List of Tables viii-x List of Figures xi Executive Summary xii-xvii Chapter One: Public Distribution System in India: The Strengths and the
Weaknesses 1-6
Chapter Two: Public Distribution System in India: The Evolution 7-17 Chapter Three: Public Distribution System in the District of Allahabad:
Background, Coverage, and Methodology 18-38
Chapter Four: Public Distribution System in the District of Allahabad: The
Facts 39-112
Chapter Five: Public Distribution System in the District of Allahabad:
Major Observations and Suggestions 113-122
Chapter Six: Recommendations 123-129 References 130-131 Appendix: Questionnaires 132-149

ii
Chapter Contents Chapter One 1-6
1.1 Introduction 1
1.2.1 Public Distribution System: The Rationale 1
1.2.2 Prices, Poverty, and Public Distribution System 4
1.3 Arguments against Government Intervention in the Foodgrains Market 5
Chapter Two 7-17
2.1 Introduction 7
2.2 The History behind the Introduction of PDS in India 7
2.3 Revamped Public Distribution System: Some Features 9
2.4 Food Stocks, Allocation, and Off-Take: Purpose and Position 10
2.5 Release of Surplus Stocks through Non-FPS Measures 13
2.6 Quality of Items in PDS 13
2.7 Targeted Public Distribution System: Features and Rationale 14
2.8.1 Subsidy on Essential Commodities Distributed through the PDS 15
2.8.2 Subsidy on Sugar 16
Chapter Three 18-38
3.1 Background 18
3.2 Objectives of the Study 21
3.3 Coverage and Methodology 21
3.4 Sample District Profile 29
3.5 Public Distribution System: Profile of the District of Allahabad 33
3.6 Allotment and Lifting of Items in PDS, District Allahabad 1998-2001 38
Chapter Four 39-112
4.1 Profile of Sample Households 39
4.2 Profile of Households in the Sample 43
4.3 Profile of Population in the Sample 49
4.4 Distribution of Sample Households in Terms of Location of FPSs, Number of FPSs at Village Level, and Holding Pattern of Ration Cards and Distribution of Units
53
4.5 Gap Between Requirement and Distribution of Items Per Period, and Gap Between Market Price and FPS Price of Items at District Level
57
4.5.1 Item-wise Gap by Quantity Distributed to Households at Block Level 62
4.5.2 Item-wise Price Differential between Open Market and FPSs at Block Level
65

iii
4.6 Required Expenditure by Households on Essential Commodities (At both Market Price and FPS Price)
68
4.7 Regularity in Purchasing Items from FPSs 71
4.7.1 Reasons for Non-Regular Purchase of Rice, Wheat and Sugar from FPSs
72
4.7.2 Regularity in Consumption of Sugar by Households and its Fulfillment by Purchase from FPSs
74
4.8 Required Quantity of Kerosene Per Period: Sufficiency in Supplying through the FPSs and Supporting Non-FPS Sources
76
4.9.1 Distribution of Rice and Wheat by Quantity: The Extent of Satisfaction of the Households
78
4.9.2 Distribution of Sugar and Kerosene: The Extent of Satisfaction of the Households
80
4.10 Awareness of the Households 83
4.11.1 Response of the Households Regarding Withdrawal of Sugar from the PDS
87
4.11.2 Response of the Households Regarding Withdrawal of Kerosene from the PDS
89
4.12 Response of the Households to the Question of Confinement of PDS to Rice and Wheat Only
90
4.13 Response of the Households to the Question of Requirement of Kerosene from PDS in Case of Availability of Electricity
93
4.14.1 Perception of the Households about FPS Dealers 96
4.14.2 Perception of the Households about FPSs in Terms of Scheduled Time Followed in Operating the Shops
97
4.15 Verification of Ration Cards of Households by Government Department 99
4.16 Role of Panchayats in PDS 102
4.17 Perception of the Households about How to Improve the Functioning of PDS
105
4.18 Reactions of FPS Dealers 106
4.19 Problems of FPS Dealers 108
4.20 Awareness of FPS Dealers about the Commission on Different Items 111
Chapter Five 113-122
5.1 Major Observations 113
5.2 Major Suggestions 120
Chapter Six 123-129
6.1 Introduction 123
6.2.1 Recommendations based on the Study 123
6.2.2 Recommendations at a Glance 127

iv
Research Team
Project Director Dr. Bhaskar Majumder Research Assistants Sri Gyan Nath Jha Sri Madan Gopal Gupta Sri Ashok Kumar Dwivedi Sri Sandip Kumar Jaiswal

v
Preface The Final Report on the 'Public Distribution System of Essential Commodities as a Social Safety Net: A Study of the District of Allahabad, Uttar Pradesh' that we are going to submit to the Planning Commission, Government of India, has been funded and supported by the latter. This support covers both time allowed for the study and money allotted to conduct the study at the micro level. We hope that the findings, the suggestions, and the recommendations of this study will bear macro implications for the national economy. The collection of data, which are the statistical abstractions of concrete socio-economic reality in the life of the people at the grass root level, would not have been possible without the untiring efforts of the project staff meant for this purpose. The members in the project staff are the persons who took all the pains to tabulate and present data collected from the field in accordance with the objectives of the study. The errors in interpretation of data, and policy recommendations that followed, rest with me. We are thankful to Sri P.N. Nigam, Deputy Adviser (SER) in Planning Commission, Government of India, for his kind interest in this study. At the level of Government of Uttar Pradesh, we are particularly grateful to Sri N.C. Bajpai, ex-Secretary, Food and Civil Supplies Department, who took keen interest in this study. In fact, one of my colleagues, Dr. Sunit Singh, had to present the major study questions and objectives of this study in the State Secretariat, Lucknow, on October 3, 2000, in presence of Sri. Bajpai and all the responsible officers in his Department. We earnestly acknowledge the efforts of Dr. Singh and the Officers in the Department. We are especially thankful to the Director of our institute, Prof. Janak Pandey, who worked silently as a facilitator in these whole processes of interactions. We are thankful to Sri R.K. Singh, Regional Food Controller, Allahabad for his valuable support, both in terms of the time spared for our meeting with him in his office on October 3, 2000, and as a facilitator while we were in the field. We are also thankful to Sri. S.P. Srivastava, District Supply Officer, for ensuring a smooth environment in the field. We acknowledge the services of the Supply Inspectors who had been with us in the field throughout the days of Field Visit. The members in the Panchayats and Ward Sabhasads of Municipalities rendered valuable support for us in collecting information and in meeting the target people in the field. We are especially thankful to the target people as respondents to our questionnaire. We have treated these people as subjects, and not objects, of this study. We wholeheartedly acquired ideas from these people, the households and the Fair Price Shop dealers, in addition to their specific responses to the specific questions that we posed. The recommendations that we have offered in this Report relied heavily on the facts and ideas brought to light by these target people. We are thankful to all the members in the Faculty of the Institute for their valuable suggestions on the Draft Proposal presented in a seminar organized by the institute. For collection of secondary data, we banked on the library of the institute, in addition to the library of the Indian Statistical Institute, Calcutta. The Institute provided all the infrastructural and manpower facilities for getting the Report in the shape as it is now. We are extremely grateful to Ravi Srivastava, Professor, CSRD, JNU, New Delhi, for his valuable suggestions and comments on the Draft Report submitted earlier. May we be excused if we forget to mention the valuable services of persons in conducting this study. On behalf of the Research Team, I submit the Final Report of the study to the Planning Commission, Government of India, for acceptance. Date: 15.11.2001 G.B. Pant Social Science Institute, Allahabad
– Bhaskar Majumder

vi

vii
List of Boxes Box 1 Sampling Procedure 22 Box 2 Profile of Sample Villages/Wards within their respective Blocks/Towns and
Tehsils 23
Box 3 Study Tools and Major Objectives at Village Level 24 Box 4 Administrative Set up of Supply Department, Government of U.P. 36
viii
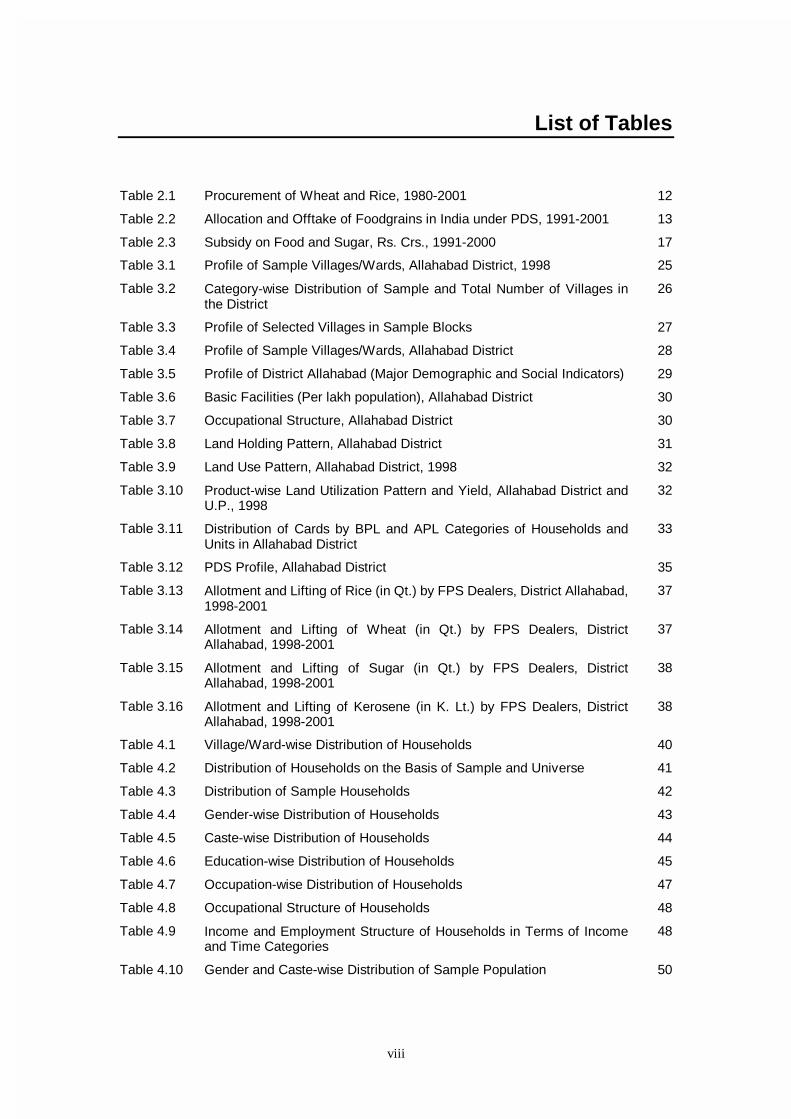
List of Tables Table 2.1 Procurement of Wheat and Rice, 1980-2001 12
Table 2.2 Allocation and Offtake of Foodgrains in India under PDS, 1991-2001 13
Table 2.3 Subsidy on Food and Sugar, Rs. Crs., 1991-2000 17
Table 3.1 Profile of Sample Villages/Wards, Allahabad District, 1998 25
Table 3.2 Category-wise Distribution of Sample and Total Number of Villages in the District
26
Table 3.3 Profile of Selected Villages in Sample Blocks 27
Table 3.4 Profile of Sample Villages/Wards, Allahabad District 28
Table 3.5 Profile of District Allahabad (Major Demographic and Social Indicators) 29
Table 3.6 Basic Facilities (Per lakh population), Allahabad District 30
Table 3.7 Occupational Structure, Allahabad District 30
Table 3.8 Land Holding Pattern, Allahabad District 31
Table 3.9 Land Use Pattern, Allahabad District, 1998 32
Table 3.10 Product-wise Land Utilization Pattern and Yield, Allahabad District and U.P., 1998
32
Table 3.11 Distribution of Cards by BPL and APL Categories of Households and Units in Allahabad District
33
Table 3.12 PDS Profile, Allahabad District 35
Table 3.13 Allotment and Lifting of Rice (in Qt.) by FPS Dealers, District Allahabad, 1998-2001
37
Table 3.14 Allotment and Lifting of Wheat (in Qt.) by FPS Dealers, District Allahabad, 1998-2001
37
Table 3.15 Allotment and Lifting of Sugar (in Qt.) by FPS Dealers, District Allahabad, 1998-2001
38
Table 3.16 Allotment and Lifting of Kerosene (in K. Lt.) by FPS Dealers, District Allahabad, 1998-2001
38
Table 4.1 Village/Ward-wise Distribution of Households 40
Table 4.2 Distribution of Households on the Basis of Sample and Universe 41
Table 4.3 Distribution of Sample Households 42
Table 4.4 Gender-wise Distribution of Households 43
Table 4.5 Caste-wise Distribution of Households 44
Table 4.6 Education-wise Distribution of Households 45
Table 4.7 Occupation-wise Distribution of Households 47
Table 4.8 Occupational Structure of Households 48
Table 4.9 Income and Employment Structure of Households in Terms of Income and Time Categories
48
Table 4.10 Gender and Caste-wise Distribution of Sample Population 50

ix
Table 4.11 Income-wise Distribution of Sample Households and Population at District Level
51
Table 4.12 Income-wise Distribution of Sample Population at Block Level 51
Table 4.13 Income-wise Distribution of Households at Block Level 52
Table 4.14 Distance by Location of FPS from the Residences of Households 54
Table 4.15 Distribution of Households on the Basis of Number of FPS at Village 55
Table 4.16 Holding Pattern of Ration Cards of Households 56
Table 4.17 Distribution of Units in existing Ration Cards 57
Table 4.18 Gap Between Requirement and Distribution of Items Per Month and Gap between Market Price and FPS Price of Items
59
Table 4.19 Requirement and Distribution of Items Per month and Gap between Requirement and Distribution Per month
66
Table 4.20 Price Gap between Fair Price Shop and Open Market, Item-wise 69
Table 4.21 Required Expenditure (Annual Average) by Households on Essential Commodities (At both Market Price and FPS Price)
70
Table 4.22 Regularity in Purchasing Items from FPSs by Households 72
Table 4.23 Reasons for Non-Regular Purchase of Foodgrains from FPSs 73
Table 4.24 Reasons for Non-Regular Purchase of Sugar from FPSs 74
Table 4.25 Regular Consumption of Sugar by Households 75
Table 4.26 Consumption of Required Sugar Purchased Though FPS and Open Market
76
Table 4.27 Response of the Households about Distributed Quantity of Kerosene in FPSs
77
Table 4.28 Required Quantity of Kerosene met by Non-FPS Sources for Not-Fully-Satisfied Households
79
Table 4.29 The Extent of Satisfaction of the Households about Quantity of Rice and Wheat Distributed through the FPSs
81
Table 4.30 The Extent of Satisfaction of the Households about Quantity of Sugar and Kerosene Distributed through the FPSs
82
Table 4.31 Awareness of the Households about Price Chart at FPS and Price Information
84
Table 4.32 Awareness of the Households about Correct Price of Information in Fair Price Shops
86
Table 4.33 Awareness of the Households about the Names of FPS Dealers 87
Table 4.34 Response of the Households about Withdrawing Sugar from the PDS 89
Table 4.35 Response of the Households about Withdrawing Kerosene from the PDS
90
Table 4.36 Response of the Households if their Requirement for Rice and Wheat are Supplied through the FPSs
91
Table 4.37 Reasons Offered by Unsatisfied Households (Confinement of PDS to Rice and Wheat Only)
92
Table 4.38 Reasons Offered by Satisfied Households (Confinement of PDS to Rice and Wheat Only)
93

x
Table 4.39 Response of the Households about the Need for Availability of Kerosene from the FPS (If the Houses have Electricity)
94
Table 4.40 Reasons Offered by the Households for Continuation of Supply of Kerosene from the FPS (In Presence of Electricity in the Residences of the Households)
95
Table 4.41 Perception of the Households about Fair Price Shop Dealers 96
Table 4.42 Reasons Offered by Unsatisfied Households about FPS Dealers 97
Table 4.43 Perception of the Households about Following the Scheduled Time in FPSs
98
Table 4.44 Reasons Offered by Households Regarding Non-maintenance of Scheduled Time by FPS Dealers
99
Table 4.45 Verification of Ration Cards of Households by Supply Department 99
Table 4.46 Perception of the Households about the Role of Panchayats in PDS 103
Table 4.46a Perception of Households about the Positive Role of Panchayats in PDS
103
Table 4.46b Perception of Households about the Negative Role of Panchayats in PDS
104
Table 4.47 Perception of the FPS Dealers about the Role of Panchayats in PDS 104
Table 4.48 Perception of the Panchayat Members Regarding the Role of the Panchayats in PDS
105
Table 4.49 Suggestions Offered by the Households for Improving the Functioning of the PDS
106
Table 4.50 Reactions of FPS Dealers about Supply Department 107
Table 4.51 Reactions of FPS Dealers about the Cardholders 108
Table 4.52 Reactions of FPS Dealers about Influential People Affecting the PDS 108
Table 4.53 Problems of FPS Dealers about Quantity of Items Allotted by Supply Department
109
Table 4.54 Problems of FPS Dealers Regarding Withdrawal of the Quota and Transportation
110
Table 4.55 Methods of Adjustment Adopted by the FPS Dealers Regarding Undistributed Items
111
Table 4.56 Awareness of the FPS Dealers about the Commission on Items 112

xi
List of Figures
Fig. 3.1 Allotment and Lifting of Rice by FPS Dealers for BPL Households 38
Fig. 3.2 Allotment and Lifting of Rice by FPS Dealers for APL Households 38
Fig. 3.3 Allotment and Lifting of Wheat by FPS Dealers for BPL Households 38
Fig. 3.4 Allotment and Lifting of Wheat by FPS Dealers for APL Households 38
Fig. 3.5 Allotment and Lifting of Sugar by FPS Dealers 38
Fig. 3.6 Allotment and Lifting of Kerosene by FPS Dealers 38
Fig. 4.1 Distribution of Sample Households 42
Fig. 4.2 Income-wise Distribution of Sample Households 52
Fig. 4.3a Average Consumption of Rice and Wheat of Sample Households 60
Fig. 4.3b Average Consumption of Sugar and Kerosene of Sample Households 61
Fig. 4.3c Average Rate of Rice 62
Fig. 4.3d Average Rate of Wheat 62
Fig. 4.3e Average Rate of Sugar 62
Fig. 4.3f Average Rate of Kerosene 62
Fig. 4.4 Required Expenditure (Annual Average) of Households on Essential Commodities at Both Market and FPS Prices
70
Fig. 4.5 Response of the Households about Withdrawing Sugar form PDS 88
Fig. 4.6 Response of the Households if their Requirement for Rice and Wheat are Supplied through PDS
92
Fig. 4.7 Verification of Ration Cards of Households by Supply Department 100
Fig. 4.8 Perception of the Households about the Role of Panchayats in PDS 102
Fig. 4.9 Problems of FPS Dealers about Quality of Items Allotted by Supply Department
109
Fig. 4.10 Problems of FPS Dealers Regarding Withdrawal of the Quota and Transportation
110

xii
Executive Summary The public distribution system as a social safety net can be understood by the fact
that aggregate availability of foodgrains per se is not enough to ensure the ability to acquire
foodgrains. Production does not automatically guarantee consumption. The mere presence of
food in the economy, or in the market, does not entitle a person to consume it. Even the
ability to buy may not guarantee food security, unless there is an efficient distribution system.
The public distribution system has remained a major instrument to execute the Government of
India's economic policy to protect the income-poor. The objectives of the Government of
India's Food Security Policy are (i) ensuring adequacy or sufficiency in supply of foodgrains,
and (ii) distributing foodgrains at an affordable price. In a broad sense, the purpose of social
security is to abolish want by guaranteeing every citizen an adequate income at all times to
meet his needs. The aim of social security is to guarantee for each person a minimum level of
living through a number of means. Our study concentrates on public distribution system seen
as a social safety net.
I Targeted Public Distribution System: Introduction
Following the recommendations of the Chief Ministers' Conference held in July 1996,
the Targeted Public Distribution System (TPDS) was launched in June 1997. The latent
problem was that a sizeable number of marginalised people, in the absence of cash income
that can be transformed into purchasing power are excluded from the planning process
because they do not constitute effective demand. Thus, the TPDS came to replace the
erstwhile PDS from June 1997. This system divides the potential beneficiaries into families
Below Poverty Line (BPL) and those Above Poverty Line (APL). The state governments were
assigned the task to streamline the PDS by issuing special cards to BPL families and selling
essential items under TPDS to them at specially subsidized prices, with better monitoring of
the delivery system.
II Objectives of the Study
We are going to study the extent to which PDS has succeeded or failed in providing
essential commodities to the population living below the poverty line (BPL) during the survey
period. The survey period will be one month before the date of inquiry. The specific objectives
of the study will be to examine
(i) If the PDS has failed or succeeded, and to what extent, to ensure the interests of the
poor in terms of their steady access to essential commodities from the FPS,
(ii) The likely impact of restricting the coverage of PDS to only the population below the
poverty line,
(iii) The likely impact of restricting the coverage of PDS to only rice and wheat,
(iv) The impact of withdrawing sugar from the purview of PDS,
(v) If the existing distributive set up is efficient to run the PDS.

xiii
III Methodology
To study the public distribution system (PDS) in Uttar Pradesh (U.P.) we have chosen
the Allahabad district purposively, it being one of the developed districts in Eastern U. P.
Eastern U. P. is generally seen as the relatively underdeveloped region in U. P.
The district of Allahabad has twenty development blocks, out of which we have
selected for our study a total of four, that is, 20.0 per cent of the blocks. These four blocks
have been selected from four administrative regions of the district, thereby taking care of the
dispersal of the distribution facilities being administered by the state supply office (Map 1, p.
vi). The blocks have been selected by stratified purposive sampling method, the chosen
blocks thus covering industrial developed, hilly developed and underdeveloped areas of the
district.
The district of Allahabad has a total of 2978 Revenue Villages, of which we have
selected only 24, that is, 0.9 per cent of the total. The district has 11 towns, of which we have
selected two, for proper representation of urban areas in the study. Though the percentage of
towns selected is 18.2, by selection of two Wards from each of the towns, the urban area
being covered has been reduced. We have selected more of the median villages. This has
been done by arrangement of villages by size of population.
In each village, we have selected 50 households by simple random sampling method,
where in each village more than 50.0 per cent of the BPL (Below Poverty Line by card
holding) families have been selected. In 24 villages thus we have covered 1200 households.
Out of the two towns selected, we selected two Wards, and a total of 50 households taken for
study in each Ward. Thus, 200 households as beneficiaries in the PDS have been selected
from the urban area of the district. We have thus covered 1400 households as beneficiaries
covering both rural and urban areas in Allahabad district, of which around 60.0 percent of the
households come from the BPL category.
In addition, we have studied in each village and town one FPS. In our original
proposal, we offered to study 20 FPSs. While in field we felt compelled to study one FPS in
each of the villages and Wards in towns. Thus, we covered 28 FPSs for required information
on the PDS in the district (Box 1, p. 22, Table 3.2, p. 26, Table 4.1, p. 38, Table 4.2, p. 39).
IV Sample Design
In Allahabad district, there are 6 tehsils, all of which have been covered in the study.
Out of 20 Blocks, the study has covered 4, that is, 20 per cent. The study has covered 24
inhabited revenue villages, which is 0.9 per cent of total revenue villages in the district, and
also 2 towns that is 18.2 per cent of all the towns in the district. All the 24 villages have gram
panchayats, the 24 gram panchayats thus covered constitute 1.7 per cent of all gram
panchayats in the district. The 4 wards selected and studied constitute 15.4 per cent of all the
26 wards in two towns in the district (Table 3.1, p. 25).
As we told earlier, the villages have been selected by size of population, taken in
three categories I, II and III, category I representing population size between 500 and 999,
category II representing population size between 1000 and 1999, and category III

xiv
representing population size between 2000 to 4999. The sample (selected villages in number)
represent 0.9 per cent of total villages in the district. But the same sample villages represent
4.1 per cent in number when considered with respect to the total number of villages in the
respective population categories. The sample villages in categories I, II and III represent
21.10 per cent of all villages in the district in the said categories. Thus, selection of Blocks out
of total number of villages in categories I, II and III bear a correspondence in terms of
representation by number of Blocks and Villages selected.
We have purposively selected 12 villages from category II, 6 villages each from
category I and category III. In the whole district, such selection would mean 1.8 per cent of
the villages in category II out of total villages in category II understood as 100.0 per cent,
while 0.7 per cent for category I out of total villages in category I understood as cent per cent,
and 1.9 per cent for category III out of total villages in category III understood as cent per
cent. The sample proportions for categories I, II and III represent exactly the similar picture. If
number of villages in category II in the sample is taken as cent per cent, then the 12 villages
selected in this category represent 9.3 per cent. If number of villages in category I is taken as
cent per cent, then the 6 villages selected in this category represent 3.2 per cent, while in
category III, this percentage is 9.4 (Table 3.2, p. 26). The selection of median villages by size
of population as sample villages thus confirms the representative character of the villages in
the district of Allahabad.
V Major Observations
The major observations that we have recorded here are based on the facts that we
collected in the field for the study on public distribution system in the District of Allahabad.
Distribution of Items
(i) In almost all the villages, rice and wheat were not made available to the families
owning ration cards. Even when these items arrived, a single day was fixed for
distribution so that the income-poor (BPL) families were deprived. The simple reason
is, apart from lack of timely information, the BPL families lack the power and time to
collect money to buy the items on the day abruptly announced for sale through the
FPS (Table 4.41, p. 94, Table 4.42, p. 95).
(ii) We found false/wrong entries in the cards for most of the BPL families, entries
implying that all these families got all the items at scheduled rates (quantity and
price).
(iii) No cash memo was ever issued by any of the FPS owners.
(iv) Even when the items were made available and the supply position was announced by
the FPS Dealer, the prices per unit of items were not displayed (Table 4.31, p. 82).
(v) One consequence of (iv) was that the benefits of price-differential (sale price --
scheduled PDS price) went in favour of the FPS Dealer (Table 4.31, p. 82).
(vi) Sugar was usually irregular in supply (Table 4.26, p. 74).
(vii) Kerosene per head was distributed much less than what was allotted and that too at
prices higher than the scheduled PDS rate (Table 4.27, p. 75).

xv
(viii) The section in higher socio-economic category derived almost all the benefits from
irregular supply of items from the FPSs.
(ix) We found some villages where socially upper caste people continue to (mis)use the
PDS by availing items much more than what is fixed per card (Table 4.52, p. 106).
Gap between Allotment and Lifting of Items
While allotment and lifting of rice and wheat are specific to economic categories, BPL
and APL, by cardholding, those of sugar and kerosene are general, that is, across categories.
Lifting and Allotment of rice and wheat for BPL households revealed consistency at the level
of the district, while those are totally inconsistent in case of APL households. This is explained
by abruptly higher allocation of rice and wheat for APL households. We found consistency in
lifting and allotment of sugar and kerosene for households across categories, that is, both
BPL and APL (Table 3.13, p. 36a, Table 3.14, p. 36a, Table 3.15, p. 36b, Table 3.16, p.
36b).
Gap between Requirement and Distribution of Items The gap between requirement of households for items and distribution of items per
period by FPSs showed that the PDS at the level of the District of Allahabad failed
miserably in supplying essential commodities to the population across board, both BPL and
APL, excepting kerosene (Table 4.19, p. 64). The implicit assumption is that the PDS in
existence has the aim to fulfil most of the requirements of the target groups for essential
commodities distributed through the FPSs.
Price Gap in Items between FPSs and Open Market
We found no unidirectional positive price-differential between FPS price and open
market price for items distributed through the PDS in the blocks of the District of Allahabad
(Table 4.20 p. 67).
Confinement of PDS to Rice and Wheat only
We found the focus in the responses of the households in general against
confinement of PDS to rice and wheat only (Table 4.36, p. 89).
Withdrawal of Sugar from the PDS
We found no uniform response in adverse effect with respect to withdrawal of sugar
from the PDS. Nor did we find any major variation in distribution of households by BPL and
APL categories in terms of revealing adverse effect consequent upon the withdrawal of sugar
from the PDS (Table 4.34, p. 87).
Distribution of Ration Cards
What we observed regarding distribution of cards are the following:
(i) Many income-poor (BPL) families have remained cardless.
(ii) Many BPL families have yellow cards, which are meant for non-poor.
(iii) Many non-poor families have white cards, which are meant for the poor. The above
may imply non-distribution of cards and wrong distribution of cards.
xvi
Verification of Ration Cards
The verification of ration cards has been done half-heartedly by the concerned State
Department. This is in the sense that only the identity of the cardholder has been checked
once for all with no action taken as a follow-up measure like cancellation of false/misplaced
cards, issuing new cards to the card-less, and steps taken regarding expansion in units
(Table 4.45, p. 97).
VI Recommendations based on the Study
Based on the facts that we collected for the District of Allahabad regarding the
functioning of the Public Distribution System, and based on the observations that we gathered
in our conversations with the beneficiaries, we offer our recommendations for improving the
PDS in India. We recommend the continuation of the Targeted Public Distribution System
(TPDS) for the District of Allahabad, in keeping with the major policy perspective announced
in 1997 by the Government of India when it was launched.
Recommendations at a Glance
♦ Ensure regular distribution of rice, wheat, and kerosene by exact quantity allotted at
right price. Ensure withdrawal of rice and wheat by the FPS Dealers for distribution
among the households without any time lag.
♦ Ensure enhanced allotment of rice, wheat, and kerosene per household per period so
as to converge to the consumption requirements of the households per period for
these items.
♦ Delete price-differential for rice and wheat over BPL and APL categories and ensure
quantity-differential by allotting more of these items per household per period in
favour of the BPL category.
♦ Ensure reduced price of kerosene per liter for all households, BPL and APL, even if it
costs more to the public exchequer.
♦ Ensure provision of purchase of rice, wheat, and kerosene by installments for that
section of BPL households who can not have disposable money as and when
required to buy these items. Adopt a strategy of 'Due Slip' to be issued by the FPS
Dealers to the targeted sections as such within the BPL category of households.
♦ Ensure allotment and distribution of sugar for BPL households at the prevailing price.
Withdraw allotment of sugar for APL households. Announce 'special' distribution of
sugar during Festivals for both BPL and APL households.
♦ Raise the rate of commission on distribution of each of rice, wheat, sugar, and
kerosene per unit for the FPS Dealers with immediate effect.
♦ Ensure release of quota to be withdrawn by the FPS Dealer in a particular period
(month) after subtracting 'undistributed items' of the preceding period (month). Set up
a fact-finding Committee, as and when necessary, to find out the reasons behind
repetition of undistributed items accumulated over periods.

xvii
♦ Initiate time-bound inquiry for repetitive non-withdrawal of items by an FPS Dealer
instead of automatic cancellation of licence/quota of the Dealer.
♦ Ensure compulsory maintenance of records for each of sale, stocks, and Ration Card
Master Register by the FPS Dealers.
♦ Ensure allotment of new FPS Dealership to local educated unemployed youth
preferably from the socio-economically-disadvantaged sections in the locality.
♦ Stop criminal/illegal interference in the PDS network at the local level.
♦ Ensure verification of Ration Cards at the local level, including issuing new cards,
canceling false cards etc.
♦ Ensure budget provision at Nigam/Regional Supply Office for allotment of quota to
the FPS Dealers, rather than asking the Dealers to pay money in advance.
♦ Ensure public display of quantity of items distributed by the FPS Dealers per period,
and quantity of items remaining undistributed. The State Supply Department is being
requested to provide necessary calendar to the FPS Dealers for the said purpose.
♦ Ensure reduced number of FPSs for vigilance by a single supply Inspector. The State
Supply Department is expected to collect information from the 'Vigilance Committee'
voluntarily formed by the consumers (households) at the village level regarding the
functioning of the PDS at the local level.
♦ In addition to strong vigilance by the Panchayats and Supply Inspectors over visibility
of Correct Price Chart in the FPS, ensure 'secret and sudden' vigilance by RFO to
check items in FPSs by quantity and quality and undistributed stocks. The vigilance
by the RFO has to cover households also, both BPL and APL, at random in the
concerned village.
♦ Ensure active and positive role of Panchayats in an interactive manner with the State
Supply Department/BDO etc regarding preparation of correct schedule of
cardholders, by BPL and APL, and hence make it transparent. Ensure training for
Panchayat members for convergence to perfect functioning of the system. Ensure
active and positive role of Panchayats for development of awareness of households
regarding the 'right to food at fair price'. This requires an interactive frame among
Panchayats, NGOs, Supply Department, and Media.
♦ Form an autonomous State Vigilance Committee to work as a complementary unit
with the existing administrative network meant for the PDS.

Chapter - One
Public Distribution System in India: The Strengths and the Weaknesses
'There is no true food security, no matter how much is produced, if the food producing resources are controlled by a small minority and used only to profit them. In such a system the greater profit will always be found in catering to those who can pay the most -- not the hungry'. (Frances Moore Lappe and Joseph Collins, 1977, 'Food First, The Myth of Scarcity', Souvenir Press (E&A) Ltd., London, p. 119). 1.1 Introduction
Post-independence Indian agriculture followed the Bengal Famine of 1943 and food
scarcity during the Second World War (1939-45). By 1944, an official government report
conservatively estimated that one and a half million lives had been lost by the 1943 famine.
The consequence had a deep root. 'In 1943, Churchill ordered the Indians and the thousands
of British military in India to live off their own stocks when Japanese conquest of Burma had
cut off a main outside source of rice for Bengal and all of India. But, despite all this, the
colonial government allowed rice to flow out of Bengal' (Lappe and Collins, 1977, p. 69).
Public intervention in Indian agriculture was in fact connected with food scarcity. By 1947,
about 54 million people in urban India were covered by statutory rationing and an additional
19 million by other forms of public distribution (Dantwala, 1993, p. 182). During post-
independence period, agriculture came to depend first on extension of net sown area and
irrigation coverage at least up to the emergence of Green Revolution. Technology came to
determine the fate of Indian agriculture after mid-1960s and up to the 1980s. Concentrated in
a 'few high potential region' the high-technology-led new agricultural strategy paid off
(Dantwala, 1993, p. 173). Before the mid-1960s, the food security system in India was in an
embryonic stage. Government policies and measures then aimed at solving localized scarcity
in the face of crop failure, famine, drought etc. 'Until the mid-sixties access to concessional
imports of foodgrains (mainly wheat) was available under US Public Law 480. Further, the
domestic price of wheat was considerably higher than the landed cost of imports. It is not
surprising that the government as the sole legal importer of foodgrains, used imports as a
major source of supply for the public distribution system. Indeed, until the late sixties, imports
constituted over 60.0 per cent of the grains distributed during thirteen of the seventeen years,
1951 to 1967 (Narayana, Parikh, and Srinivasan, 1991, p. 151). The situation changed
radically with the phenomenal growth in wheat output associated with Green Revolution.
1.2.1 Public Distribution System: The Rationale
The public distribution system as a social safety net can be appreciated by the fact
that aggregate availability of foodgrains per se is not enough to ensure the ability to acquire

2
foodgrains. Production does not automatically guarantee consumption. The mere presence of
food in the economy, or in the market, does not entitle a person to consume it (Dreze and
Sen, 1989, p. 9). Even the ability to buy may not guarantee food security, unless there is an
efficient distribution system (Suryanarayana, 2000, p. 80). Colonial history of India also
confirms that 'the major famines and scarcities occurred during a period when India was a
food surplus country and was in fact exporting large quantities of foodgrains'. At the national
level at least, famines in British India 'were not precipitated by absolute shortages of food
caused by uncontrollable vagaries of nature' (Ghose, 1999, p. 359). Historically, we find no
one-to-one correspondence between per capita supply of food and deprivation of a section of
population in terms of food consumption.
At the all-India level, between 1972-73 and 1993-94, according to National Sample
Survey data, per capita consumption of cereals declined from 15.3 to 13.4 Kg. per month over
the two decades. During these two decades ending 1993-94, there occurred a steady decline
in the food share from about 73.0 per cent to 55.0 per cent at the all-India level. This
decrease occurred in all regions. As informed by the NSSO, food shares declined for all
income groups, including the first (poorest) quartile (Meenakshi, 2000, p. 34-35). This is in
spite of the fact that the poor continue to spend most of their budget on food and much higher
than the percentage spent by the non-poor on food. This seems to confirm Engel's Law,
which says that economic development is accompanied by declining food shares. We think,
the converse is not necessarily true, namely that declined and declining food share implies
economic development. Even if it implies economic development then the social base of that
development is weak so that it becomes unsustainable. The flexibility in the consumption
habit of the vulnerable sections of the society may conceal the real reasons of reductions in
food consumption, sometimes occasionally. For example, 'the reduction of food consumption
may be an early response to the threat of entitlement failure, apparently motivated, at least
partly, by the preservation of productive assets' (Dreze and Sen, 1989, p. 77). The decline in
per capita consumption of food per period may, however, be attributable to changed inner
composition of food. Bennett's Law argues that consumers gradually switch to a more
expensive diet, substituting quality for quantity. This is confirmed in the Indian context as
revealed by the NSSO data. During the period, 1972-73 to 1993-94, the decline in per capita
consumption of cereals is wholly attributable to a decline in coarse cereal consumption, down
from 4.8 to 2 Kg. per capita per month. An increase in wheat consumption from 3.9 Kg. to 4.4
Kg. per capita per month was not enough to compensate for the decline in total cereal
consumption. The consumption of rice remained virtually unchanged during this period
(Meenakshi, 2000, p. 35). Following NSSO data, the substitution away from coarse cereals
into rice was prominent in the lower income groups, and the non-poor sections experienced
almost no change in the consumption of rice and wheat. The reason is likely to be that the
non-poor section already has enough quantities of high quality cereals to the extent of their
satiety. The fact remains that before the income-poor population shift from cereals to non-

3
cereals, they shift from less expensive cereals to more expensive cereals. In the Indian
context, this implies a switch away from the coarse cereals to either wheat or rice, or both.
The Public Distribution System (PDS) has remained a major instrument to execute
the Government of India's economic policy to protect the poor. Public intervention in the
foodgrains market 'aim at procurement of foodgrains for public distribution and maintenance
of buffer stocks to give not only short-term but also long-term stability of prices of essential
commodities and safeguard the interest of the consumers. Procurement of foodgrains also
ensures remunerative returns to the farmers and provide them with incentives to invest more
on agriculture to raise its productivity and to ensure that in the event of any glut or due to any
other reason, the market prices do not fall below the support prices' (GOI, 1991-92, p. 55).
The purpose of the GOI since the early 1970s when it started following the policy of
Minimum Support Prices (MSP) was 'to ensure that farmers get remunerative prices for their
produce and there is no distress sale particularly during the harvesting season' (GOI, 1998-
99, p.73). As declared by the government, 'procurement prices are based on support prices
announced by the government... The procurement operations of wheat, paddy and coarse
grains are totally voluntary. The producers have the option to sell their produce to FCI/State
agencies at support prices or in the open market whichever is advantageous to them' (GOI,
1998-99, p. 70). The PDS aims at ensuring stability in the foodgrains market when open
market prices of foodgrains fluctuate less because of steady availability in the hands of the
government. This removes scarcity psychosis and checks speculative tendencies. The
disadvantaged and vulnerable sections of the society are the targets of this PDS. The
government also pledges to pay attention to distress areas like drought prone areas, desert
areas, tribal areas, urban slum areas and selected hilly areas. From June 1992 a special
scheme to strengthen the PDS was introduced by inclusion of additional items like tea, soap,
iodized salt and pulses to serve the tribal and hilly population in the backward and remote
areas (GOI, 1994-95, p. 78). The reasons of this special scheme seem to be both poor
infrastructure and income-poverty. The Integrated Tribal Development Project (ITDP) is an
example of the concern of the GOI to provide foodgrains (wheat and rice) at special
subsidized rates (below PDS rates) for tribal people (GOI, 1991-92, p. 54). On June 1, 1997,
the GOI introduced a revised scheme of distribution known as Targeted Public Distribution
System (TPDS). This shows a deviation from the earlier ones in the sense that from now on
the distribution of foodgrains would be operated under two-tier system of delivery to
households, those Below Poverty Line (BPL) and those Above Poverty Line (APL). The BPL
families are planned to receive foodgrains at heavily subsidized prices (GOI, 1998-99, p. 69).
To execute PDS and TPDS the government has to procure or purchase foodgrains at the
prices declared by the government. The government believes that procurement of foodgrains
'serves the objective of providing price security to the farmers, which induces them to sustain
production levels. This is in addition to PDS working as 'an instrument to protect the
vulnerable sections against price volatility' (GOI, 1998-99, p. 70).

4
1.2.2 Prices, Poverty, and Public Distribution System
The level of food prices is one of the crucial variables mediating the relationship
between aggregate food availability and individual entitlements. Generally, the successful
containment of increases in food prices help in protecting the entitlements of vulnerable
groups (Dreze and Sen, 1989, p. 88). In India, generally the population in the affected areas
feels the impact of natural disasters almost entirely. If there occurs an increase in price
following deficits in output and supply of essential commodities, it is the landless labourers,
the marginal farmers, the unemployed and the underemployed, the urban slum dwellers who
will bear the brunt of it. At the extreme, 'famines are always a divisive phenomena. The
victims typically come from the bottom layers of society... there does not seem to have been a
famine in which victims came from all classes of the society (Dreze and Sen, 1989, p. 48).
The social objective of sharing the regional deficit in food output on a national basis remains
absent. The PDS aims at protecting the vulnerable sections of the society by encompassing
them in the distribution network. One of the objectives of PDS, namely to ensure price
stabilization of foodgrains is executed through buffer stock operations as an instrument. It is a
fact that in an underdeveloped agricultural production system agricultural production varies
not only between one year and another but also within a year. This may lead to income
destabilization if prices are rigidly fixed. For example, in case of a fall in agricultural output, a
fall in income is not compensated if the prices of agricultural products are not allowed to rise.
Price changes thus are expected to provide a compensatory effect to changes in output
(Khusro, 1973, p. 13). This output variation is not only inter-temporal but also spatial. In terms
of production, seasonal and annual, some of the states in India may show surplus, while
some other states may show deficit. This surplus or deficit is to be understood in terms of
consumption requirements per period vis-a-vis production. Surplus states will have a
tendency to exhibit lower prices relative to the deficit states. If surplus foodgrains is
transferred from the surplus states to the deficit states, prices will have a tendency to
equalize. Public intervention in the foodgrains market thus attempts to ensure dynamic
equilibrium in the foodgrains market (Khusro, 1973, p.9). A direct link between food prices
and income-poverty becomes an important issue sometimes. It is argued that high foodgrains
prices may accentuate poverty. A situation of high foodgrain prices may have contrasting
implications on different groups of population. In the Indian context, however, the problem is
less acute because of continuous monitoring in prices of foodgrains by government. In
addition, the positive aspect of the scenario in the Indian context is that ' producer and
consumer price interventions by government are determined somewhat independently'. This
relieves the dilemma of foodgrain prices affecting different sections of population differently.
These dual interventions, however, occur at a high cost to the public exchequer. That is the
question of subsidy, dealt later in this study.

5
1.3 Arguments against Government Intervention in the Foodgrains Market
The arguments against government intervention in agriculture seem to be
synonymous with liberalization of agriculture. The disapproval of government intervention in
agricultural markets 'is part of a larger critique of development strategies that promoted
domestic industrialization behind trade barriers, which were financed through the taxation of
agriculture via pricing policies that depressed food and agricultural commodity prices so that
wages could be kept low... Not surprisingly, the major policy implication is that, to foster
sustained growth of agricultural productivity, output and exports, the terms of trade should
improve for farmers through a reduction in the discrimination against agriculture. The major
way of getting the prices right for agriculture is by means of a thorough liberalization of the
foreign trade regime, reducing the tariff and quota protection of industry, eliminating the real
exchange rate misalignment and removing the anti-export bias in agriculture' (Storm, 1997, p.
68). We concentrate on the arguments restricted to government intervention in Indian
agriculture through procurement and distribution. It is a fact that the government does not
directly control agricultural production, other than creating storage facilities to take care of
bumper production and hence holding stocks, or offering support price in the post-harvest
period when price has a tendency to fall below unit cost level. The addition to stocks by the
government in case of bumper production is also a measure against abrupt fall in price.
These exceptions show that the government is the ultimate protector of home producers,
quantitatively through checking downward flexibility in foodgrains prices. The questions come
when the government intervention restricts the freedom of the producers-cum-sellers through
imposition of restrictions on movement of goods and marketing. Such restrictions keep the
benefits of the products localized, and price of the final product faces a downward flexibility.
Such 'restrictions are usually defended on the ground that they are not aimed at producers
but at unscrupulous traders' (Ahluwalia, 1996, p. 421). One example is the Essential
Commodities Act of 1955 that restricts stocks held by traders, the other is the Maharashtra
Cotton Monopoly Procurement Scheme that ensures institutional arrangement for government
procurement of cotton.
The Government of India (GOI) adopted in 1991 the New Economic Policy (NEP), a
major component of which is liberalization of initiatives and enterprises in production-
investment-trade. It pledges for reducing role of the government in the context of opening the
economy in favour of a competitive regime. The NEP aims at 'domestic price reforms that free
agriculture from internal controls and raise prices of agricultural output (that) are expected to
have positive impact on agricultural growth' (Bhalla, 1995, p.8). It is known that since 1990s
'there are no quotas of procurement in surplus states for delivery to the central pool. The
strictly centrally imposed zonal restrictions on inter-state movement of commodities no longer
exist' (Dantwala, 1993, p. 176). One argument against the public intervention in the
foodgrains market is that the groups whose interests are served include mainly the non-poor.
This includes richer farmers from 'green revolution' areas, government and public

6
bureaucracy, urban consumers and foodgrain traders and millers (Rao, 1996, p.138). At the
all-India level, the dependence of the people identified as poor on the public distribution
system in rural areas on the commodities rice, wheat, edible oils, coal, common clothes is
less than 16.0 per cent (Dantwala, 1993, p.183). Hence, subsidized sale of foodgrains
through Fair Price Shops (FPSs) or public distribution system benefits mainly the already
benefited socio-economic categories.
It is argued that the supplies through PDS 'have contained the vigour of inflation but
part of their impact has been offset by monetization of budgetary deficit to meet food
subsidies. Maintaining supplies to PDS involves continuation of food procurement, grant of
subsidies and reintroduction and perpetuation of some controls. But several weaknesses
have emerged in the distribution system, which have diluted the essence of the system to
benefit the vulnerable sections. The financial liabilities of the state governments in maintaining
this system have increased. Leakage and black marketing in PDS items have also reduced
the full impact of PDS in containing inflation' (GOI, 1992-93, p. 92). The policy of the
government to keep both input and output prices low leads to subsidized provision of inputs
like water, electricity, and fertilizer, and subsidy to consumers. It is argued that most of this
subsidy is realized by the final consumers of foodgrains. The distribution of procured
foodgrains through the PDS involves a consumer subsidy to make good the losses incurred
by the Food Corporation of India (FCI) (Rao, 1996, p. 138). The PDS thus is argued to be too
expensive. The budgeted estimate of food subsidy for 1995-96 was Rs. 5250 crore, which
was more than the total estimated budget deficit of the Centre in the same year. The fixed
cost component, in particular the operational cost of the FCI, is considered too high (Mooij,
1999, p. 241). The huge subsidy explains a part of the fiscal deficit of the government or
surrendering the scope to save income earned elsewhere. It is also argued that were the
farmers be given international prices for their inputs, farm income would go up (Parikh, 1999,
p. 5). It is being argued now that meeting demand for food in a national economy should be
seen as being realized by food production and supply on a world scale.
There is now a realization that the PDS as it has now evolved may actually be serving
only a limited proportion of the poor and that there are large variations in the coverage
between the states. Thus, the target setting and subsidy question should receive attention for
solution. In view of the GOI, two major aspects of PDS that need a national consensus are (i)
the norms of excluding the non-poor and (ii) limiting the open-ended subsidy because of FCI
operations (GOI, 1993-94, p. 66). The study on the Public Distribution System pursued by us
at the level of Allahabad district of Uttar Pradesh aims at unfolding these questions, among
others, in a frame of analysis that we built.

Chapter - Two
Public Distribution System in India: The Evolution 'Agricultural exports from a country where many go hungry is largely a reflection of the problem, not the problem itself. Even if all agricultural exports stopped, there still would be hungry people -- those who continue to be excluded from genuine control over their country's food-producing resources'. (Frances Moore Lappe and Joseph Collins, 1977, Food First, the Myth of Scarcity, Souvenir Press (E&A) Ltd., London). 2.1 Introduction
The objective of the Government of India's Food Security Policy is to ensure
availability of foodgrains to the public at an affordable price. The objectives are thus (i)
ensuring adequacy or sufficiency in supply of foodgrains, and (ii) distributing foodgrains at an
affordable price. The Public Distribution System, which has existed in the country since the
Second World War, attempts to meet these twin objectives (GOI, 1995-96, p. 88). In view of
the GOI, 'the PDS aims at insulating the consumer from the impact of rising prices of these
commodities and maintaining the minimum nutritional status of our population. The PDS
supplies have a stabilizing effect on open market prices by increasing availability, removing
scarcity psychosis and deterring speculative tendencies' (GOI, 1991-92, Part II, p. 53).
2.2 The History behind the Introduction of PDS in India
The history behind introduction of the PDS in India is rooted in famines and food
scarcities during the entire period of British colonial rule in India. The first one was the Bengal
famine of 1770. An estimated ten million people died in this famine that was essentially the
consequence of plunder by the colonists of the East India Company. Between 1860 and
1910, there occurred twenty major famines and scarcities. The last famine in British India was
the Bengal famine of 1943 (Ghose, 1999, p. 355). Post-independence Indian agriculture
followed the Bengal Famine of 1943 and food scarcity during the Second World War. Public
intervention in Indian agriculture was in fact connected with food scarcity. By 1947, about 54
million people in urban areas were covered by statutory rationing and another 19 million by
other forms of public distribution (Dantwala, 1993, p. 182). The measures that the GOI adopts
for intervention in the foodgrains market are through procurement, buffer stocks, public
distribution, imports, restrictions on internal movements of foodgrains, controls on exports etc
(Sharma, 1992, p. 343). All these measures are not necessarily applied simultaneously.
The first Foodgrains Policy Committee, 1943, recommended only informal rationing in
rural areas. By implication, free or open market in foodgrains was permitted in the rural areas,
that is, the producing areas (Dandekar, 1994, p. 209). Since 1947, the government was
expected to do away with controls on production, distribution, and prices of foodgrains. The

8
Foodgrains Policy Committee, 1947, suggested progressive decontrol in the foodgrains sector
following which a policy of gradual decontrol was announced by the government in November
1947 (GOI, 1976, Part I, p.145). 'However, the expectation that decontrol would lead to
dishoarding of stocks, increase in procurement and stability in prices did not materialize and
prices began rising fast... A reversion to controls was, therefore, decided upon in September,
1948... With the returns of controls, procurement of adequate stocks for public distribution
assumed crucial importance' (GOI, 1976, Part I, p. 145). By August 1949 the GOI started
receiving complaints on quality of foodgrains distributed and appointed the Foodgrains
Investigation Committee that submitted its report on 30 April 1950 confirming the complaints
(Dandekar, 1994, p. 212). In view of the persisting gap between the commitments of public
distribution and the procurement, a Foodgrains Procurement Committee was appointed on 8
February 1950, in pursuance of the recommendations of the All India Food Ministers'
Conference held in Aug. 1949. The Foodgrains Procurement Committee of 1950
recommended 'monopoly procurement of foodgrains, abolition of the free market, imposition
of complete statutory rationing in towns with a population of 50,000 and above and informal
rationing elsewhere' (GOI, 1976, Part I, p. 145). Since it was admitted by the GOI that any
scheme of decontrol would involve risks, hence on 8 July 1952, the Government issued the
Foodgrains (Licensing and Procurement) Order, 1952. This Order prohibited any individual
from engaging in any business which involved purchase, sale or storage for sale of any
foodgrains except under and in accordance with a licence issued by the state governments
(Dandekar, 1994, p. 216). The Essential Commodities Act of 1955 entrusted the government
with taking steps for regulation of 'production, supply, distribution and trade in essential
commodities for securing equitable distribution' (GOI, 1976, Part I, p. 167). Following the
recommendations of the Foodgrains Prices Committee set up in 1964 there came an
Agricultural Price Commission in January 1965. The important point is that the floor or support
prices for major foodgrains recommended by the Committee for 1964-65 were 'generally
higher than the average post-harvest prices during the preceding three seasons' (GOI, 1976,
Part I, p. 167). It is thus not an automatic fact that the public distribution will depress the price
against the producers-sellers. The National Commission on Agriculture in fact recognized that
'the minimum support price should be fair to the farmer and should cover his cost of
production and leave him a reasonable margin of profit (GOI, 1976, Part II, p. 83).
The Essential Commodities (EC) Act that came into force in 1955 is meant to
facilitate government regulation of trade and commerce. The EC, 1955 empowers the public
officials in enforcing the public distribution system. The 1955 Act however was not the first
one for imposition of controls on trade and distribution. Of course, it was the first one in
Independent India. The British Colonial Government under the Defense of India Rules had
implemented some control measures. Since 1946 there came legislation in the form of the
Essential Supplies (Temporary Powers) Act, which was in fact replaced by the EC Act of 1955
(Mooij, 1999, p. 193). The number of commodities declared essential under the Act has
rapidly increased from 10 items in 1955 to 60 in 1992. In August 1992, it was decided to

9
extend the EC (Special Provisions) Act by another five years. Of late, the Ninth Planning
Commission of India is thinking to remove rice and wheat, the two most essential items from
the purview of the EC, 1955, Act (The Hindu, Oct. 1, 2000, p. 8).
In India, availability of foodgrains is ensured through a network of Fair Price Shops
(FPSs) licensed by the State/UT administrations where each such shop is envisaged to serve
a population of 2000. From over 4 lakhs in March 1992, the number of FPSs rose to over 4.33
lakhs as on 31 March, 1995. Most of these FPSs are in rural areas. In 1995, the rural areas
had the number of FPSs three times that in the urban areas.
The procurement of foodgrains for distribution through PDS is maintained through
domestic procurement rather than through imports. Under this system, the price at which
government procures foodgrains determines the price at which consumers receive foodgrains
through the PDS. From the beginning, the GOI has made it clear that remunerative prices are
to be a central feature of its policy towards agriculture. The concept of state trading was
revived in January 1965 when, by an Act of Parliament, the GOI set up the Food Corporation
of India. For procurement and price setting respectively there came the Food Corporation of
India (FCI) and the Agricultural Prices Commission (now Commission for Agricultural Costs
and Prices) in 1965. The post-1965 period thus brought about institutionalized arrangements
and procedure for procurement, stocks, pricing, and distribution of foodgrains. Let us take a
brief perusal of the on-going and changing mode of operation in the domain of public
distribution system.
2.3 Revamped Public Distribution System: Some Features
The Government initiated, in consultation with the State governments and the Union
Territory (UT) administrations, steps to revamp the PDS to improve its reach based on an
area approach (GOI, 1991-92, Part II, p. 53). Preference was planned to be given in this
revamped system to the population living in the most difficult areas of the country. This
included areas such as the drought prone areas, desert areas, tribal areas, certain designated
hilly areas and the urban slum areas (GOI, 1991-92, Part II, p. 53). A Revamped Public
Distribution System (RPDS) was thus launched in June 1992 in 1700 blocks. For the tribal, hill
and arid area populations remotely located and having poor infrastructure, additional items
like tea, soap, pulses and iodized salt were made available under the RPDS. It was decided
by the GOI during mid-1990s that the geographical coverage of RPDS would be extended to
the entire 2446 Employment Assurance Scheme (EAS) Blocks (GOI, 1995-96, p. 84). Under
the scheme of RPDS, foodgrains (rice and wheat) are allocated to states and union territories
for revamped Public Distribution System blocks at lower prices; Rs. 50 per quintal lower than
Central issue prices (CIPs) for normal PDS blocks. The State Governments are required to
ensure that the retail prices of these commodities in these blocks are not higher than CIPs by
more than 25 paise per Kg. Sugar is also distributed at lower prices (GOI, 1992-93, p. 90).
The Central Issue Prices (ex-FCI godowns) are fixed by the Central Government for PDS as
well as RPDS. The retail end prices for PDS and RPDS are fixed by the State Governments,
taking into account the transportation cost and the dealer's commission (GOI, 1995-96, p.87).

10
The difference between the PDS and the RPDS in terms of retail end prices is that for RPDS,
a maximum ceiling of Rs. 25 per quintal has been fixed by Central Government on account of
transportation cost etc, which can be built up by State Government in fixing retail prices for
RPDS (GOI, 1995-96, p. 87).
The Programme Evaluation Organization of the Planning Commission identified four
major weaknesses of the RPDS. These are (i) proliferation of bogus cards, (ii) inadequate
storage arrangements, (iii) ineffective functioning of vigilance committee, and (iv) failure to
issue ration cards to all eligible households (Dev and Ranade, 1997, p. 67).
2.4 Food Stocks, Allocation, and Off-Take: Purpose and Position
One of the basic features of agriculture is that while production occurs at discrete
points of time, consumption is continuous throughout the year. The gap between production
as a stock in agriculture and consumption as a flow in agricultural commodities in agriculture
is bridged by storage or carrying forward the output (Balakrishnan and Ramaswami, 2000,
p.118). The main plank of Central Government's food security operations lies in building up
public stocks of foodgrains and its release each month for distribution to the State
Governments for supply through the PDS (GOI, 1994-95, p. 78). Conceptually, foodgrains
stocks can be regarded as divisible into three -- pipeline stocks, buffer stocks, and reserve
stocks. Pipeline stock is interpreted to be the stocks from current production destined for
current consumption. These are also thought to be operational stocks. Buffer stocks are seen
to be counter-speculative. Reserve stocks are held to bridge the gap between normal
consumption and low production of a bad contingency year (Khusro, 1973, p. 4). With the
lesser frequency of bad contingency years after technological transformation in agriculture of
post-1965 period, we find no reason why reserve stocks should be seen as an additional
category in public stocks of foodgrains. With respect to the same transformation, if the inter-
regional price equilibrium is maintained or readily restored by price intervention in the
foodgrains market, there will be lesser need for operational or pipeline stocks. We thus
concentrate on buffer stocks.
Food security takes public procurement of foodgrains as the first precondition. It at
first provides the producers the price security and scope for sale on a voluntary basis by the
producers. There is thus no fixed procurement over years. Procurement prices of foodgrains
are based on support prices announced by the Department of Agriculture and Co-operation.
The chances of distress sale are thus reduced. Minimum support prices are the prices at
which the government is willing to buy any amount offered to ensure that the open market
price does not fall to unremunerative levels in years of surplus. Procurement prices are the
prices at which the government secures a limited quantity for the distribution system. Both
procurement and support prices are policy-determined. 'The Government's procurement
operations as an instrument of agricultural price policy is intended to provide a benchmark
remunerative return to the farmer, and prevent a sharp fall in prices at harvest time. In other
words, procurement prices serve as a protective shield against price uncertainty, which, in
turn, provides a sustained incentive for the farmer to improve productivity and rationally

11
reallocate resources between various crops. Minimum Support Prices (MSPs) thus ensure
stability of market supply (GOI, 1994-95, p. 80-81). Food stocks are maintained by the Central
Government (i) to meet the prescribed Minimum Buffer Stock norms for food security, (ii) for
monthly releases of foodgrains for supply through the PDS and (iii) for market intervention to
augment supply so as to help moderate the open market prices (GOI, 1996-97, p.78; GOI,
1997-98, p.73; GOI, 1999-2000, p.81). Stocks are released each month for distribution to the
State Governments for supply through the PDS. Each state is allocated a prescribed quantity
based on past demand, off-take trends, relative need and other related factors. Stocks are
also released for open sale to augment supplies and help moderate the open market prices
(GOI, 1995-96, p.85).
'Under PDS the Central Government bears the responsibility for the procurement and
supply of five commodities, viz., rice, wheat, sugar, imported edible oils, and kerosene to the
States and Union Territories. Some States add a few more commodities for distribution under
PDS' (GOI, 1998-99, p. 69). In the early 1990s, the Government was supplying six essential
commodities through the PDS, namely, wheat, rice, sugar, edible oils, kerosene, and soft-
coke (GOI, 1991-92, Part II, p. 53). These commodities were supplied at reasonable (below
market) rates to consumers, the access to the system being universal. Given the occasional
variation in commodity coverage, rice and wheat constitute the bedrock of India's food
security through the PDS. At any given point of time, a minimum stock of rice and wheat is
maintained as a central buffer stock for meeting food security needs. In case there is a
shortfall, the stock is replenished through imports. If there is an excess of stocks, they are
released for open sale to improve supplies and moderate prices in the open market (GOI,
1994-95, p. 78). Wheat and rice are the two major foodgrains used by the Central
Government for market price stabilization and for ensuring food security through the PDS.
Rice is mainly procured for the Central Pool from a levy imposed on the rice millers/traders
under the Essential Commodities Act, 1955 and the levy orders issued by the State
Governments. The foodgrains stock maintained in the Central Pool by the Government is
utilized for distribution to states for the PDS. In the years, when public stocks fall below the
minimum buffer stock norms or when production shortfalls are anticipated, the Government
take recourse to imports for augmenting the buffer stocks. However, depending on the
behaviour of the open market prices and the stock position in the Central Pool, the public
stock of foodgrains is also utilized for market intervention as an instrument of supply
management policy (GOI, 1996-97, p. 81).
The steady availability of foodgrains to the targeted population constitutes food
security for them. Among the steps initiated by the Government of India, the setting up of the
Food Corporation of India in 1965 was a 'big step forward in the direction of food distribution
and maintenance of quality' (GOI, 1976, Part II, p. 154). The FCI is assigned the
responsibilities of sale, purchase and distribution of foodgrains, maintain adequate buffer
stock and quality of stored materials, installation and modernization of rice and flourmills,
manufacture and distribution of processed foods. We are concerned only with public sector

12
stocks and storage only, which are held by FCI, the Central and State Governments and the
State Warehousing Corporations both on an ownership basis and on a rental basis (Khusro,
1973, p. 3).
The average procurement for rice was 5.48 million tonnes during 1981-85. This
increased to 6.64 tonnes on average during 1986-90 and further to 10.88 during 1991-95 and
13.11 during 1995-2000. For wheat, the corresponding figures were 8.38, 9.25, 8.30, and
11.31. For rice and wheat together, the average procurement per year increased from 13.86
during 1981-85 to 15.89 during 1986-90 and further to 16.36 during 1991-95 (Table 2.1). For
all-India, the allocation of wheat oscillated around 10 million tonnes during 1991-2000, while
during the same period the allocation of rice varied between 10 and 15 million tonnes. Off-
take of wheat as a percentage of allocation came to be below 50.0 per cent during 1994-95
and 1995-96 and again in 1999-2000. For the remaining years of the 1990s, this ratio per
year was around three-fourth. For rice also off-take as a ratio of allocation declined during
1994-95 and 1995-96 to around three-fifth and for 1999-2000 to around half. For the rest of
the 1990s the ratio was more than three-fourth (Table 2.2).
Table 2.1 Procurement of Wheat and Rice, 1980 - 2001
(Central Pool Stocks, Total in Million Tonnes) Year Rice Wheat Total (Rice+Wheat)
1980 8.58 8.15 16.73 1981 6.21 4.91 11.12 1982 5.34 5.01 10.35 1983 4.77 6.99 11.76 1984 4.34 10.45 14.79 1985 6.74 14.54 21.28 Average of 1981-1985 5.48 8.38 13.86 1986 9.06 14.93 23.99 1987 8.50 13.93 22.43 1988 5.91 7.35 13.26 1989 4.09 4.44 8.53 1990 5.65 5.61 11.26 Average of 1986-1990 6.64 9.25 15.89 1991 8.66 9.24 17.90 1992 8.63 5.28 13.91 1993 8.52 3.28 11.80 1994 11.17 10.82 21.99 1995 17.42 12.88 30.12 Average of 1991-1995 10.88 8.30 16.36 1995-96 9.95 12.33 NC 1996-97 12.22 8.16 NC 1997-98 14.33 9.30 NC 1998-99 11.79 12.65 NC 1999-2000 17.27 14.14 NC Average of 1995-2000 13.11 11.31 NC 2000-2001 11.43* 16.35 NC Note: NC = Not Calculated (because of different accounting period of wheat and rice). Data for rice
stock being Oct. - Sept. and those for wheat stocks, April - March, for 1995-2000. * As on 11.1.2001. Source: GOI, Ministry of Agriculture, Bulletin of Food Statistics (Several Years). GOI, 1999-2000, Economic Survey, P. 82. GOI, 2000-2001, Economic Survey, p. 93.

13
Table 2.2 Allocation and Offtake of Foodgrains in India Under PDS, 1991 - 2001
(Total in Million Tonnes)
Wheat Rice Year Allocation Offtake Offtake as
% of Allocation
Allocation Offtake Offtake as % of
Allocation 1991-92 10.36 8.83 85.23 11.36 10.17 89.52 1992-93 9.25 7.85 84.86 11.48 9.69 84.40 1993-94 9.56 5.91 61.82 12.41 8.87 71.47 1994-95 10.80 4.83 44.72 13.32 8.03 60.28 1995-96 11.31 5.29 46.77 14.62 9.46 64.70 1996-97 10.72 8.52 79.47 15.16 11.14 73.48 1997-98 10.11 7.08 70.02 12.81 9.90 77.16 1998-99 10.11 7.95 78.63 12.93 10.74 83.06 1999-00 10.37 5.00 48.21 13.84 10.95 79.12 2000-01 7.51 2.72* 36.21 10.96 5.75* 52.46
Note: * April - Dec. 2000. Source: GOI, 1996-1997, Economic Survey, P. 79. GOI, 1999-2000, Economic Survey, p. 81. GOI, 2000-2001, Economic Survey, p. 92. 2.5 Release of Surplus Stocks through Non-FPS Measures
During 1992-93 to 1994-95, the actual off-take of wheat and rice by the States was
poor, leading to accumulation of stocks. Consequently, the GOI in August 1994 announced
new schemes for utilization of surplus public stocks of foodgrains. This included Supply of
Subsidized Foodgrains to SC/ST/OBC Hostels, Mid-Day Meals Schemes, Release of
Subsidized Wheat to Modern Food Industries India Ltd. (MFIL), release of surplus foodgrains
(wheat and rice) for Employment Generation Scheme, Open Market Sale of Foodgrains by
FCI (GOI, 1995-96, p.85-86). The Employment Generation Scheme was meant for
manufacture of food products by families falling below poverty line. The Mid-Day Meals
Scheme was initially meant for the benefit of the students enrolled in primary schools in 2368
RPDS/EAS Blocks. During 1996-97, this scheme was proposed to be extended to 2006 Low
Female Literacy (LFL) blocks. During 1997-98, the scheme was planned to all primary
schools in the country (828 blocks and 3,000 Nagar Palikas). 'FCI was authorised to sell
wheat and rice in the open market to serve the twin objectives of disposing of some of its
surplus stock and to check the rise in their market prices as a part of its market intervention
function to moderate supply side effects on inflation' (GOI, 1995-96, p. 86).
2.6 Quality of Items in PDS
Any consumer, independent of his income, has the right to expect food safety in
terms of wholesomeness and quality in all the foods he uses. The FCI as the major buyer of
foods in bulk has set up its own standards for wholesomeness. FCI has its own laboratories
manned by trained personnel to test for quality and maintenance of standard (GOI, 1976, Part
II, p 155).

14
2.7 Targeted Public Distribution System: Features and Rationale
Following the recommendations of the Chief Ministers' Conference held in July 1996,
an effort was made to streamline the PDS. Thus, the Targeted Public Distribution System
(TPDS) was launched in June 1997. This also coincided with the celebration of completion of
fifty years of India's independence. The PDS, as it was being implemented earlier, had been
criticized for its urban bias and its failure to serve effectively the poorer sections of the
population. The latent problem was that a sizeable number of marginalised people, in the
absence of cash income that can be transformed into purchasing power are excluded from
the planning process because they do not constitute effective demand. This is true
irrespective of the technological (Green) revolution after the mid-sixties in India. Thus, the
TPDS came to replace the erstwhile PDS from June 1997. This system divides the potential
beneficiaries into families Below Poverty Line (BPL) and those Above Poverty Line (APL).
'Under TPDS the Government is committed to issuing 10 kgs of foodgrains per month per
BPL family at a price equal to half of the economic cost of FCI. ... Quantity of foodgrains
earmarked to meet BPL requirements is 72 lakh tonnes per annum benefiting an estimated 6
crores population' (GOI, 1999-2000, p.79-80). The state governments were assigned the task
to streamline the PDS by issuing special cards to BPL families and selling essential items
under TPDS to them at specially subsidized prices, with better monitoring of the delivery
system. 'The bifurcation of BPL and APL quotas of foodgrains into rice and wheat has been
left to the States. In case of those States, which have not indicated the bifurcation, the
average lifting of rice and wheat over the last 10 years, has been adopted on provisional
basis'. Following the TPDS guidelines, any requirement from states over and above TPDS
quotas, can be met subject to availability of foodgrains in the Central Pool and at the rates
equal to FCI's average economic cost (GOI, 1997-98, p.72).
The essential features of the TPDS are the following
¾ States to identify families Below Poverty Line (BPL) who would be issued 10 kgs
of foodgrains per month per family at prices less than the Central Issue Price
(CIP)
¾ Population above the poverty line (non-poor) now under PDS to continue to
receive normal entitlement at the full CIP
¾ The Centre should guarantee supply of foodgrains for the BPL at 10 kgs per
month per family to States. Additional quantities required by states would depend
on the availability of stocks in the Central Pool
¾ States will be free to add to the quantum, coverage and the subsidy from their
own resources
¾ Subsidized foodgrains will also be issued to all beneficiaries under the
EAS/Jawahar Rojgar Yojana as per guidelines at the rate of 1 kg. per manday for
which food coupons would be issued to beneficiaries for exchanging at FPS
(GOI, 1996-97, p. 77).

15
Rationale of Targeted PDS
No one denies that 'the safest and most obvious way of guaranteeing the universal
protection of entitlements is to provide direct and unconditional support to everyone without
distinction.... it does have the advantage of altogether bypassing the various difficulties which
any form of selectivity in the provision of relief is bound to entail. ...Universal support can be a
simple expression of ...right to food (Dreze and Sen, 1989, p. 104). The fact is that the
strategy of universal support has several disadvantages. It involves an administrative and
logistic burden. In addition, 'universal support may require a commitment of resources that
can be hard to obtain' (Dreze and Sen, 1989, p. 104). The PDS as it was planned to be
carried on in post-independence India can not today go to encompass all and offer benefits to
all in terms of all essential commodities. 'The need for reducing government expenditure
under the stabilization programme calls for a discriminatory approach in providing PDS
benefits and hence should be targeted only to the vulnerable groups, since malnutrition is
caused by an unequal distribution of food and misplaced consumer choices rather than
inadequate supply' (Suryanarayana, 2000, p. 80). So comes the targeted system. The
targeted system has the advantage that it can ensure the greatest economy of resources by
withholding public support from less vulnerable groups. In addition, the targeted system can
promote the redistribution of resources by concentrating public support exclusively on the
most deprived groups. In India, targeting should take care of not only exclusion of the non-
poor but also covering all the needy poor excluded at present from the PDS network.
2.8.1 Subsidy on Essential Commodities Distributed through the PDS
In view of the FAO of the UN, food subsidy schemes are oriented towards urban
people partly because urban people can use political system to subsidize food prices. In its
view, the use of food subsidies for the benefit of rural poor is a feasible policy option only
when there are large numbers of rural landless who must buy their food, as in South Asia
(FAO, 1987, p. 79). While food subsidies in general can have beneficial effects, their costs
can become extremely high to the income-poor countries. For example, food subsidies as a
percentage of government expenditure were 4.0 in 1978 as opposed to 1.6 for Indonesia, 0.2
for Brazil, 2.2 for Mexico. For the countries in South Asia, like Pakistan and Bangladesh, this
percentage was high at around 5.0 during 1978-80. For China also, this percentage was very
high during the mid-1970s (FAO, 1987, p. 81). All the countries we have quoted, following
FAO study, are the large economies by size of population and all are in the income-poor Third
World.
In India, around 10.0 per cent of total output of selected essential commodities are
supplied through the PDS per year. As PDS supplies are made at concessional rates, the
Central Government had to spend over Rs. 2,000 crores on subsidizing distribution of wheat
and rice alone in the early 1990s (GOI, 1991-92, Part II, p. 53). 'The gap between the
economic cost incurred by the FCI towards procurement, storage, distribution and wastage of
foodgrains and its average realization based on the issue prices under PDS has been
widening over the years. This gap is filled by the Central Government through consumer

16
subsidy' (GOI, 1999-2000, p. 82). Although the minimum support prices of wheat and paddy
have been raised each year and the procurement prices of levy rice have also been revised
upward consequent to the revision of the minimum support price, there has been no
corresponding revision in the CIP of rice and wheat since February 1994. Before that, during
the 1980s, the issue price of wheat was revised upward from Rs. 160 per quintal in August
1982 to Rs. 234 in May 1990, that is an increase of 46.25 per cent over eight years. For rice,
the issue price was revised upward from Rs. 188 in Oct. 1982 to Rs. 289 in June 1990, that is
an increase of 53.72 per cent. This upward revision was monotonic over years (GOI, 1996-97,
p.79). In spite of this upward revision in issue prices, there occurred higher food subsidy
burden on the Government. The reason does not lie perhaps in changing issue prices but in
the level of these prices set. The Central Issue Prices of foodgrains for PDS/RPDS are fixed
deliberately much below the economic cost of foodgrains with a view to making foodgrains
available to PDS consumers at reasonable prices (GOI, 1995-96, p. 87). Price setting on
foodgrains for distribution through PDS is administered price. It is to be known that while 'the
Central Government issues foodgrains to states for PDS at a uniform CIP, the consumer-end
retail price fixed by State Governments for the PDS varies considerable between states' (GOI,
1994-95, p. 80). When the consumer-end PDS prices of foodgrains are lower than CIP, State
Governments bear the burden of additional subsidy. 'Depressing administered prices
artificially by subsidization from the exchequer only alters the source of price rise; it does not
remedy the malady of price rise. Subsidies reduce the incentives to producers to compete
and reduce costs. In fact, when accompanied by retention pricing, subsidies reward the least
efficient producers at the expense of the efficient ones' (GOI, 1992-93, p. 85).
2.8.2 Subsidy on Sugar
Under the system of dual pricing of sugar in operation for some years, the
Government at pre-determined prices as levy sugar acquires 45 per cent of the sugar
production. The remaining 55 per cent of the produce are released for sale in the open
market. This ratio of levy to free sale sugar has been maintained at 45:55 since 1988-89
(GOI, 1991-92, Part II, p. 56). The retail issue price of levy sugar distributed through the PDS
at Rs. 5.25 per kg. with effect from 1st January, 1989 was raised to Rs. 6.10 per kg. from 24th
July, 1991 and further to Rs. 6.90 per kg. from 21st January, 1992 to reduce the burden of
subsidy on sugar distribution through the PDS (GOI, 1991-92, Part II, p. 57). 'Levy sugar price
supplied to PDS consumers at Rs. 9.05 per kg. had remained unchanged for three years
since February, 1994 despite periodic revisions in the statutory minimum price of cane paid to
sugarcane growers. Consequently, PDS supply of sugar was heavily subsidized and in order
to reduce part of the subsidy, the Government raised the issue price of sugar for PDS to Rs.
10.50 per kg. in February, 1997. Even then, the PDS retail price was still cheaper compared
to the market price ranging between Rs. 15 to Rs. 16.50 per kg' (GOI, 1996-97, p. 77).
Sugar subsidy as a percentage of food subsidy declined during the end of the 1990s.
Subsidy on sugar was more than one-tenth of total food subsidy in 1994-95 and declined to
5.0 percent in 1997-98 and below it during the following two years of the 1990s (Table 2.3).

17
Sugar subsidy thus can not explain the burden on account of subsidy as a whole on food
account. Still then, questions may arise whether to confine subsidy on a commodity if that is
not significantly consumed by the income-poor.
In formulating agricultural policy, debates center around short-term welfare gains for
the income-poor via food subsidies at a public budget cost vis-a-vis more public investment.
This is primarily because the latter shows the possibilities of higher growth and employment
opportunities while the former shows cost or burden on the public exchequer. Also, while
providing subsidies, 'eligibility is not determined on the basis of a means test but applies to all
households in the neighbourhoods where stores are located; nor is there self-targeting by
choice of commodities with high income elasticities for the poor and low to the rich (Janvry
and Subbarao, 1986, p. 78). The need to restrain the burden of subsidy on the central budget
calls for a judicious PDS including coverage of items to be distributed, the cross-section of
population to be served, and the pricing of the items to be distributed. Regarding
selection/exclusion of target groups, a number of measures have been considered. These
include exclusion of income tax payers, salaried employees in Government, public and private
sector, registered shop-owners, sales tax assesses, telephone owning families, residents of
posh housing colonies etc. (GOI, 1993-94, p. 66). Subsidies arise from the difference
between the issue price and the economic cost of FCI. In addition, unwillingness or delay in
making necessary correction in the Central Issue Price (CIP) consequent to a rise in the
Minimum Support Price (MSP) or procurement price may cause the food subsidy budget to
rise significantly. Given the extent of poverty, the necessity of procurement of food stocks for
distribution during calamities etc., withdrawal of food subsidy may be neither desirable nor
feasible, at least in the short and medium term. The task then is to impose an upper limit on
subsidy.
Table 2.3 Subsidy on Food and Sugar, Rs. Crs., 1991-2000
Year Food Subsidy Sugar Subsidy Sugar Subsidy as %
of Food Subsidy 1991-92 2850 - - 1992-93 2800* - - 1993-94 5537 - - 1994-95 5100* 566 11.09 1995-96 5377* 422 7.84 1996-97 6066* 900 14.83 1997-98 7900* 400 5.06 1998-99 9100 400 4.39
1999-2000 9560* 360 3.76 Note: * Includes Sugar Subsidy. Sugar Subsidy refers to Sugar year, Oct. - Sept., -: Means data not available. Source: GOI, 1999-2000, Economic Survey, P. 82, 84. GOI, 2000-2001, Economic Survey, P. 96.

Chapter - Three Public Distribution System in the District of Allahabad: Background, Objectives, Coverage, and Methodology
'The structural reasons for global interdependence lie in the growth of food trade, the industrialization and specialization of world agriculture, and the sensitivity of the world economy to shifts in food prices'. (Hopkins, Raymond F., 1982 'Food Policymaking', in Hadwiger Don., F., and Talbot Ross B., Food Policy and Farm Programs, Academy of PoliticalScience, NewYork).
3.1 Background (a) Public Intervention in the Foodgrains Market
Agricultural production is essentially land-centered. We use the term 'land' in the
loose sense to include 'physical soil area' covered by agricultural crops. The physical soil
input is privately owned, in addition to some other complementary inputs like fertilizers,
pumpsets, tractors etc. Water as the most important ingredient to keep 'physical soil input'
cultivable is provided as an input by the government through medium and major irrigation
system. This is supported by private initiatives through minor irrigation system. The point we
would like to make clear here is that agricultural production by its nature remains primarily in
private hands. The resultant, i.e., physical volume of output per period thus remains in private
hands. How does the government then intervene in the domain of agriculture?
One answer is since the government allows the individuals to own and use physical
soil which is a free gift of nature, in turn, allows the individuals to derive benefits from
universal nature by its transformation, hence the government can claim a share out of it.
Privatization by sanction by the government allows the government to have a share out of it.
The second answer is activity-specific. Since the government helps the production system
through irrigation etc., water being universal gift of nature, the government can intervene to
get a return on it. Hence, the government intervenes. The third answer is distribution of
benefits-specific. Some individuals are producers of crops who are at the same time owners
of physical soil. Hence some individuals who are not owners of soil, and hence do not have
the scope to transform it into crops after appropriate use of other inputs including labour, have
to get a share of that crop. This establishes not only production by social cooperation but also
consumption of crops by individuals who do not produce crops, but produce some other
commodities. Production of crops by sale of labour power, or by owning and using marginal
land-holdings, may fetch little earnings for the agricultural labourers and marginal farmers.
This earning is likely to be insufficient for them to buy food grains required for physical
survival in the free market. The question of price-protection for the income-poor thus comes in
when it centers on meeting the food needs. It is thus not only a question of protecting the non-

19
owners of land but also the owners of land and income-poor who constitute the ground for
public intervention in the market for foodgrains. The poor, the vulnerable, the left-out sections
of the society provide the base for the public distribution system. We thus examine the scope
of the public distribution system as a social safety net.
(b) Public Distribution System as a Social Safety Net
As a concept, social safety or security is as old as the existence of human beings as
a social or collective unit. In a broad sense, the purpose of social security is to abolish want
by guaranteeing every citizen an adequate income at all times to meet his needs. The aim of
social safety is to guarantee for each person a minimum level of living through a number of
means (Savy, 1972, p.2-3). These means include both supply-side and demand-side
instruments that cover economic and social interventions of the government. The concern of
social safety sometimes denotes concern for a cross-section of the society in a national
economy. This aspect may be important as far as the short-term goals of the government are
concerned. In its totality, however, social safety includes all the population all over the world
for which not only the sovereign government of a national economy but also the international
institutions are responsible.
The ultimate objective of our study is to examine how social welfare is promoted in a
national economy. This is examined through government intervention in the market for
foodgrains. National or personal income is a poor indicator for ensuring social welfare.
Agricultural output and the price at which it is bought measure the power of the purse of the
non-agricultural population, particularly when food is the first biological need in the hierarchy
of needs. Given money income of an individual, the price per unit of foodgrains determines
his entitlement to foodgrains, and hence disposable income to be spent on non-agricultural
commodities. The price of foodgrains thus plays a significant role in indicating the welfare in
an economy particularly characterized by high poverty. Poverty of people is understood as the
situation where a sizeable section of the population is left with levels of money income below
the poverty line. Poverty line is understood as the access of the individuals to minimum
calorie intake specified by some norm.
The factors that influence rural poverty are primarily local manpower absorption in
agriculture, growth of agricultural output, food prices and anti-poverty programmes initiated
and implemented by the Government. Agricultural growth not only raises output but also
income-generation for labourers by wage payment. The level and changes in food prices,
absolute inter-temporal and also relative to non-food industrial goods, affect the real
purchasing power of the people as food takes away the largest portion of the family budget of
the poor. Food prices may have greater impact on the urban poor relative to the rural
counterpart. While the latter may have access to the foodgrains grown in their own home
farms, the former may not have any such access and have to depend entirely on the market
price of foodgrains. This is because of non-availability of cultivable land in the urban areas
(Dev and Ranade, 1997, p.63). We will thus take into account both rural and urban scenario.

20
While food prices are well taken into account in the literature for alleviation of poverty, the
public support system is rarely emphasized much.
In case of crop failure and consequential price rise, a high percentage of population
will remain without minimum levels of food consumption and hence will be counted as
population below poverty line. The incidence of crop failure and hence the incidence of food
shortage initially gets distributed among the families approximately in the same direction as
the productive assets are distributed (Ghose, 1999, p. 351). On the assumption that the
distribution of productive assets can not be changed overnight, we think about the public
support system that ensures access to food. It is not only aggregate supply of food but also its
distribution that determines the incidence of hunger and deprivation in any society. The public
support system for foodgrains comes as an effective instrument for alleviation of income-
poverty of people. This does not imply that PDS can be seen in isolation from some other
instruments to make a dent on poverty. We take here a limited perspective of poverty
alleviation that works through PDS. The perspective is limited in the sense that given limited
income of the individual, the price of foodgrains distributed through PDS can determine the
consumption possibilities of the individuals by determining their real income. The PDS shows
at best the maximum of the essential commodities the targeted individuals can get subject to
the family budget constraint. The PDS in no way aims at enhancing the money or real income
of the individual. In fact, it does not have any income-generating device. The PDS is a purely
supply-side instrument that aims at covering the vulnerable section of the population through
guaranteeing the entitlement to essential commodities at a price known to the potential
consumers. The potential consumers do not determine the price. If at all there comes reduced
price of essential commodities distributed through PDS, it can not lift the ceiling of the
individual entitlement. The reduced price then leads to extended coverage of the population
by increasing the number of card holding families. The section of people without income-
earning employment, landless agricultural labourers without jobs for a reasonable period of a
year, the section of people without residential address etc are not covered by the PDS. The
PDS as a social safety net has to be understood in the sense of this limited perspective. The
perspective as announced by the GOI is that essential commodities such as rice, wheat,
imported edible oils, sugar and kerosene are distributed at prices below the market prices
through a network of fair price shops. The Government accepts this as an essential element
of Government's safety net for the poor (GOI, 1992-93, p. 89).
Public Distribution System as a safety net for the poor in the context of the Indian
economy has to be understood by the consumption standard of the poor. About 40-50 per
cent of the poor in India, even if they spend three-fourth of their outlay on food, can not afford
the average Indian dietary energy measured in kilocalories standard. This proportion showed
no clear trend, up or down, between the mid-1950s and the mid-1970s. The World Bank style
of identifying the poor lies in who are really undernourished by clinical evidence and the
section that are above the poorest section. The poorest deciles spend their increase in
income on the cheapest available food, without going for the finer qualities of the same food,

21
or diverting a portion of their income on other non-food commodities (Clay, 1981, p. 89). We
do not delve into the question of who are the destitute-like poor and who can afford to buy
some essential commodities. We know that food insecurity imposes severe hardship directly
on the segment of population who is poor. Thus, we concentrate on population who are below
the poverty line, study its insecurity in terms of availability of food and study the relevance of
the PDS in that context.
3.2 Objectives of the Study
We are going to study the extent to which PDS has succeeded or failed in providing
essential commodities to the population living below the poverty line (BPL) during the survey
period. The survey period will be one month before the date of inquiry. The specific objectives
of the study will be to examine
(vi) If the PDS has failed or succeeded, and to what extent, to ensure the interests of
the poor in terms of their steady access to essential commodities from the FPS,
(vii) The likely impact of restricting the coverage of PDS to only the population below
the poverty line,
(viii) The likely impact of restricting the coverage of PDS to only rice and wheat,
(ix) The impact of withdrawing sugar from the purview of PDS,
(x) If the existing distributive set up is efficient to run the PDS.
3.3 Coverage and Methodology
(a) Methodology
To study the public distribution system (PDS) in Uttar Pradesh (U.P.) we have chosen
the Allahabad district purposively, it being one of the developed districts in Eastern U. P.
Eastern U. P. is generally seen as the relatively underdeveloped region in U. P.
The district of Allahabad has twenty development blocks, out of which we have
selected for our study a total of four, that is, 20.0 per cent of the blocks. These four blocks
have been selected from four administrative regions of the district, thereby taking care of the
dispersal of the distribution facilities being administered by the state supply office (Map 1).
The blocks have been selected by stratified purposive sampling method, the chosen blocks
thus covering industrial developed, hilly developed and underdeveloped areas of the district.
The district of Allahabad has a total of 2978 Revenue Villages, of which we have
selected only 24, that is, 0.8 per cent of the total. The district has 11 towns, of which we have
selected two, for proper representation of urban areas in the study. Though the percentage of
towns selected is 18.2, by selection of two Wards from each of the towns, the urban area
being covered has been reduced. We have selected more of the median villages. This has
been done by arrangement of villages by size of population.
In each village, we have selected 50 households by simple random sampling method,
where in each village more than 50.0 per cent of the BPL (Below Poverty Line by card
holding) families have been selected. In 24 villages thus we have covered 1200 households.
Out of the two towns selected, we selected two Wards, and a total of 50 households taken for
study in each Ward. Thus, 200 households as beneficiaries in the PDS have been selected

22
from the urban area of the district. We have thus covered 1400 households as beneficiaries
covering both rural and urban areas in Allahabad district, of which around 60.0 percent of the
households come from the BPL category.
In addition, we have studied in each village and town one FPS. In our original
proposal, we offered to study 20 FPSs. While in field we felt compelled to study one FPS in
each of the villages and Wards in towns. Thus, we covered 28 FPSs for required information
on the PDS in the district (Box 1).
Box 1 Sampling Procedure
State Uttar Pradesh
District Allahabad It is one of the developed districts of eastern Uttar Pradesh. The district is divided into 6 tehsils, 20 community development blocks, 11 towns, 1378 gram panchayats and 2715 inhabited revenue villages.
Blocks/Towns Four blocks have been selected by stratified purposive sampling method, which covers industrial, hilly developed and underdeveloped areas of district. We have also selected two towns, of which one is an industrial area and other is located on the border of another district, Mirzapur.
24 Revenue Villages and 4 Wards All villages of the district are stratified into three groups by size of population - (i) Between 500 and 999 (ii) Between 1000 and 1999 (iii) Between 2000 and 4999 Based on population criteria, these 24 villages have been selected. Also 4 Wards have been covered from two selected towns.
1400 Households Selection of households within the villages has been done by simple random sampling method. Each sample unit has covered 50 households. More than fifty per cent of the families covered in sample villages/towns have been drawn from BPL families.
28 Fair Price Shops* Minimum one fair price shop has been covered in each sample village/ward.
Note: * We had to cover more FPSs than what we proposed (twenty) in the
original proposal, the reason being that we covered 24 villages and 4 wards of two towns in Allahabad district.

23
The names of Tehsils, Blocks, Villages and Wards, Gram and Nagar Panchayats in
the district are enlisted in Box 2.
The names of respondents, study tools and major objectives of the study are
elaborated in Box 3.
Box 2
Profile of Sample Villages/Wards within their Respective Blocks/Towns and Tehsils
Tehsils Blocks/Towns Villages/Wards Gram/Nagar Panchayats
Janwan Janwan Golhaiya Golhaiya Garha Garha Sheorajpur Sheorajpur Benipur Benipur
Bara
Shankargarh
Lohgara Lohgara Rithainya Niria Semarha Uperhar Semarha Uperhar Pach Dewra Pach Dewra Dewri Kala Dewari Kala Karchhana Karchhana
Karchhana
Karchhana
Bhatauli Piparaon Baragaon Jalalpur Mahuwa Kothi Chandopara Motiha Barethi Jogapur Mohua Dih Dusaoti Mahua Dih
Handia
Saidabad
Oasepur Binda Muzaffarpur Urf. Bichhia Muzaffarpur Urf. Bichhia Fatehpur Kayasthan Fatehpur Kayasthan Atrampur/Nawabganj Atrampur Fatoopur Uperher Fatoopur Uperher Kanjia Kanjia
Soraon
Kaurihar
Malak herher Uperher Malak herher Uperher Ward No. 3 Phulpur Phulpur Phulpur Ward No. 12 Phulpur Ward No. 1 Bharatganj Meja Bharatganj Ward No. 12 Bharatganj
Source: NIC, Allahabad Based on 1991 Census.

24
Box 3
Study Tools and Major Objectives at Village Level
Village Level Activities
Village Level
Survey
Study Tools
Major Objectives of Study
Gram Panchayats
Respondents - Gram Pradhan or Dy. Pradhan or member of Panchayat
Questionnaire for Village
- Basic Amenities of Village - Role of panchayats in PDS. - Role and problems of gram panchayats
at village level. - Resources and problems of farmers.
Fair Price Shops
Respondents - Dealers of Fair Price Shops
Questionnaire for Fair Price Shop
Dealers
- Duration of holding the dealership of FPS.
- Availability and distribution of allotted quota of items and their quality.
- Pressure of number of households on FPS dealers and their commissions.
- Coordination among Panchayats, supply department and block staffs.
- Inspection and supervision of FPS dealers.
- Problems of FPS dealers in operating the shop.
- Perception of dealers regarding the gram Panchayats.
Sample Households
Respondents - Head or Responsible member of households
Questionnaire for Beneficiaries
- Socio-economic and educational status of households.
- Availability and distance of FPS. - Per month requirements of households
of the items distributed. - Satisfaction of beneficiaries in terms of
quantity, quality and price of PDS items and FPS dealers.
- Rate of items distributed through the FPSs and open market.
- Impact of restricting the coverage of PDS to only rice and wheat.
- Perception of the beneficiaries regarding the improvement of PDS.
- Perception of beneficiaries about the role of Gram Panchayats in PDS.

25
(b) Sample Design
In Allahabad district, there are 6 tehsils, all of which have been covered in the study.
Out of 20 Blocks, the study has covered 4, that is, 20 per cent. The study has covered 24
inhabited revenue villages, which is 0.9 per cent of total revenue villages in the district, and
also 2 towns that is 18.2 per cent of all the towns in the district. All the 24 villages have gram
panchayats, the 24 gram panchayats thus covered constitute 1.7 per cent of all gram
panchayats in the district. The 4 wards selected and studied constitute 15.4 per cent of all the
26 wards in two towns in the district (Table 3.1).
Table 3.1 Profile of Sample Villages/Wards, Allahabad District, 1998
Particulars Selected Total
Tehsils 6 (100.0)
6 (100.0)
Blocks 4 (20.0)
20 (100.0)
Gram Panchayats 24 (1.7)
1378 (100.0)
Inhabited Revenue Villages 24 (0.9)
2715 (100.0)
Towns 2 (18.2)
11 (100.0)
Wards 4 (15.4)
26 (100.0)
(a) Phulpur 2 (14.3)
14 (100.0)
(b) Bharatganj 2 (16.7)
12 (100.0)
Source: District Statistical Handbook of Allahabad, 1998 and NIC, Allahabad.
As we told earlier, the villages have been selected by size of population, taken in
three categories I, II and III, category I representing population size between 500 and 999,
category II representing population size between 1000 and 1999, and category III
representing population size between 2000 to 4999. The sample (selected villages in number)
represent 0.9 per cent of total villages in the district. But the same sample villages represent
4.1 per cent in number when considered with respect to the total number of villages in the
respective population categories. The sample villages in categories I, II and III represent
21.10 per cent of all villages in the district in the said categories. Thus, selection of Blocks out
of total number of villages in categories I, II and III bear a correspondence in terms of
representation by number of Blocks and Villages selected.
We have purposively selected 12 villages from category II, 6 villages each from
category I and category III. In the whole district, such selection would mean 1.8 per cent of
the villages in category II out of total villages in category II understood as 100.0 per cent,
while 0.7 per cent for category I out of total villages in category I understood as cent per cent,
and 1.9 per cent for category III out of total villages in category III understood as cent per
cent. The sample proportions for categories I, II and III represent exactly the similar picture. If
number of villages in category II in the sample is taken as cent per cent, then the 12 villages

26
selected in this category represent 9.3 per cent. If number of villages in category I is taken as
cent percent, then the 6 villages selected in this category represent 3.2 per cent, while in
category III, this percentage is 9.4 (Table 3.2). The selection of median villages by size of
population as sample villages thus confirms the representative character of the villages in the
district of Allahabad.
Table 3.2
Category-wise Distribution of Sample and Total Number of Villages in the District
Total Sample Total District Categories of Villages Sample Total Sample Total
I 6 (3.2)
186 (100.0)
6 (0.7)
804 (100.0)
II 12 (9.3)
129 (100.0)
12 (1.8)
673 (100.0)
III 6 (9.4)
64 (100.0)
6 (1.9)
319 (100.0)
Others - 204 - 919 Total 24
(4.1) 583
(100.0) 24
(0.9) 2715
(100.0) Source: District Statistical Handbook of Allahabad, 1998 and NIC, Allahabad.
All the 4 Blocks selected are represented by selection of 6 villages for each Block
chosen for the study of PDS in the district of Allahabad. These 4 Blocks are Sankargarh,
Karchhana, Saidabad and Kaurihar. The 6 villages selected in Sankargarh represent 3.2 per
cent of all villages in Sankargarh; the 6 villages in Karchhana represent 5.0 per cent of all
villages in Karchhana, the 6 villages in Saidabad represent 3.8 per cent of all villages in
Saidabad, while in Kaurihar the 6 villages represent 4.9 per cent of all villages in Kaurihar.
Depending on a number of factors in the respective categories, I, II, and III, like
existence of Gram Panchayats, functioning FPSs etc. we have selected and surveyed the
villages in the respective categories. Thus, equal number of villages, that is, two in number
does not represent each category in a particular block, but there is inter-category variation in
selection of villages. For example, for category III which is large by size of population, in
Sankargarh Block there are only 4 villages, out of which we selected only one, while in the
same category III in Saidabad, there are 26 villages so that we selected two. Similarly, in
Kaurihar we selected two villages out of a total of 20 villages in category III, while in
Karchhana, we selected one out of a total of 14 villages in this category. Since category II is
constituted by the most representative villages by size of population (2000 – 4999), hence we
selected 3 villages out of 6 in each Block from this category, that is half of all villages selected
from any Block, and by summation, villages from category II represent half of all (24) villages
selected for the study. The variation in number of villages, inter-Block, thus rested on
whether or not to take more villages from category I or category III, it is a variation between 1
closing village or 2 villages from each of the categories, I and III (Table 3.3).

27
Table 3.3 Profile of Selected Villages in Sample Blocks
Categories of Villages
I II III Total Villages Blocks
Selected Total Selected Total Selected Total
Other Villages
Selected Total Shankargarh 2
(2.9) 68
(100.0) 3
(15.0) 20
(100.0) 1
(25.0) 4
(100.0) 93 6
(3.2) 185
(100.0) Karchhana 2
(7.1) 28
(100.0) 3
(10.0) 43
(100.0) 1
(7.1) 14
(100.0) 34 6
(5.0) 119
(100.0) Saidabad 1
(1.9) 52
(100.0) 3
(8.8) 34
(100.0) 2
(7.7) 26
(100.0) 44 6
(3.8) 156
(100.0) Kaurihar 1
(2.6) 38
(100.0) 3
(9.4) 32
(100.0) 2
(10.0) 20
(100.0) 33 6
(4.9) 123
(100.0) Total Sample 6
(3.2) 186
(100.0) 12
(9.3) 129
(100.0) 6
(9.3) 64
(100.0) 204 24
(4.1) 583
(100.0) Total District 6
(0.7) 804
(100.0) 12
(1.8) 673
(100.0) 6
(1.9) 319
(100.0) 919 24
(0.9) 2715
(100.0) Note: 1. Village categories based on total population of the villages (I=500 to 999, II=1000 to 1999 and III= 2000 to 4999, by population). 2. Due to not availability of census town data of 1991, categorization of Wards has not been done but weightage has been given to those Wards
where mostly BPL families reside. 3. Four Wards have been selected from two towns, namely Phulpur and Bharatganj, first one is an industrial area and the second one is located
at a distance of 70 km. from district headquarter and is located on the border of the district. Source: District Statistical Handbook of Allahabad, 1998 and NIC of Allahabad.

28
By distribution of Households in the 4 Blocks selected for the study, we find that the
villages selected in Sankargarh has 21.7 per cent of all households in the sample, while for
Karchhana it has 18.3 per cent, for Saidabad it has 26.6 per cent and for Kaurihar it has 33.4
per cent. By distribution of population, these selected villages in 4 Blocks represent
respectively 21.1, 21.7, 24.1 and 33.1 per cent of total population in all the sample blocks
taken together. On the one hand, we thus have a one-to-one correspondence between the
distribution of number of households and the distribution of population, by selection of six
villages from each of the four blocks. The two distributions by number of households and by
population also show balanced representation block wise. These distributions also show a
correspondence with villages selected by size of population categories, represented by I, II
and III. If we consider in addition the social categories like SC and ST in population, then the
sample population in SC category shows 27.9 per cent of total population in the sample, while
the ST category represents only 0.2 per cent. There are, however, wide inter-block variations
in distribution of population by SC category (Table 3.4).
Table 3.4 Profile of Sample Villages/Wards, Allahabad District
Total Population SC Population Name of Village/
Ward & Block Area (In
Hect.)
Total No. of HHs.
Male Female Total Male Female Total % SC Pop.
Janwan 642.66 127 399 279 678 189 139 328 48.3 Golhaiya 394.18 157 454 412 866 278 264 542 62.6 Garha 507.90 255 663 593 1256 534 457 991 78.9 Sheorajpur 728.86 269 725 609 1334 305 264 569 42.7 Sidhtikar 579.77 232 730 626 1356 202 175 377 27.8 Lohgara 1008.51 331 1250 1117 2367 315 280 595 25.1 Total Shankargarh 3861.88 1371
(21.7) 4221 (21.9)
3636 (20.9)
7857 (21.1)
1823 (32.8)
1579 (32.7)
3402 (32.8)
43.3
Rithainya 126.00 113 405 359 764 - - - - Semraha Uperhar 64.00 145 581 486 1067 52 36 88 8.2 Pach Dewra 159.00 232 623 492 1115 63 42 105 9.4 Dewri Kala 191.00 223 1008 796 1804 191 172 363 20.1 Karchhana 231.00 380 1531 1263 2794 420 352 772 27.6 Bhatauli 27.00 66 303 250 553 75 60 135 24.4 Total Karchhana 798.00 1159
(18.3) 4451 (23.1)
3646 (21.0)
8097 (21.7)
801 (14.4)
662 (13.7)
1463 (14.1)
18.1
Baragaon 115.82 116 405 353 758 212 190 402 53.0 Mahuwa Kothi 95.29 273 668 620 1288 152 137 289 22.4 Motiha 193.34 368 874 782 1656 240 210 450 21.1 Jogapur 132.95 131 550 492 1042 99 93 192 18.4 Osepur 122.40 421 1048 1005 2053 292 254 546 26.6 Dusaoti 110.64 371 1152 1015 2167 532 444 976 45.0 Total Saidabad 770.44 1680
(26.6) 4697 (24.4)
4267 (24.6)
8964 (24.1)
1527 (27.5)
1328 (27.5)
2855 (27.5)
31.8
Muzffarpur Urf.Bichhia 81.75 90 292 267 559 49 49 98 17.5 Fatehpur Kayasthan 90.00 245 658 532 1190 303 248 551 46.3 Atrampur/ Nawabganj 321.33 377 1000 927 1927 251 246 497 25.8 Fatoopur Uperhar 97.00 217 665 564 1229 190 161 391 28.5 Kanjia 286.53 475 1491 1346 2837 240 205 445 15.7 Malak Herher Uperhar 312.00 705 2410 2178 4588 376 346 722 16.8 Total Kaurihar 1188.61 2109
(33.4) 6516 (33.8)
5814 (33.5)
12330 (33.1)
1409 (25.3)
1255 (26.0)
2664 (25.7)
21.6
Grand Total (Sample)
6618.93 6319 (100.0)
19285 (100.0)
17363 (100.0)
37248 (100.0)
5560 (100.0)
4824 (100.0)
10384 (100.0)
27.9
Note: Due to non-availability of urban data, the urban figures are not mentioned. Source: District Statistical Handbook of Allahabad District, 1998 and NIC Allahabad.

29
3.4 Sample District Profile
(a) Physical and Social Infrastructure in the District
The two factors, mutually supporting however, that affect the entitlement and access
to commodities and services and hence empowerment of population, are physical and social
infrastructure. The demographic and geographic dimensions of the district are included in
physical infrastructure for simplicity of analysis.
The regional distribution of population in the district shows 75:25 by rural:urban
division. The rate of growth of population of the district during 1981-91 was around 3.0 per
cent per annum, much higher than the national average. By division by social categories,
scheduled castes (SC) population in the district constituted one-fifth of the total, while
scheduled tribe (ST) population only 0.06 per cent. The sex ratio is extremely in favour of
male population, 874 female per thousand males. The literacy rate in the district in 1991 was
46.2 per cent, which was higher than the average for UP as a whole. The number of villages
connected by electricity is 90.0 per cent of all the villages in the district (Table 3.5). The
district is also developed in terms of physical infrastructure and social institutions like Pakka
roads, educational institutions, hospitals and health centres, communications, administration,
fair price shops etc. (Table 3.6).
Table 3.5 Profile of District Allahabad
(Major Demographic and Social Indicators) Sl.No. Indicators Number/Level/Unit
1. Total Geographical Area (sq. km.) 5248.2 2. Total Population 3750283 3. SC Population (Percentage) 21.36 4. ST Population (Percentage) 0.06 5. Urban Population (Percentage) 25.09 6. Population Growth Rate (1981-91) 29.6 7. Population Density (per sq. km.) 714.58 8. Sex Ratio (per thousand males) 874.5 9. Literacy Rate (Percentage, 1991) 46.2 10. Number of Households 586677 11. Average Size of Family 6.4 12. Tehsils (Number) 6 13. Development Blocks (Number) 20 14. Nyaya Panchayats (Number) 208 15. Gram Panchayats (Number) 1378 16. Revenue Villages (Number) 2978 17. Towns (Number) 11
Number of Municipal Corporation 1 Number of Police Station 35
18. Post Offices (Number) 386 19. Fair Price Shops (Number) 2011
(a) Rural 1623 (b) Urban 388
20. Electrified Inhabited Villages (Percentage) 90.35 Source: District Statistical Handbook of Allahabad 1998.

30
Table 3.6 Basic Facilities (Per lakh population), Allahabad District
Facilities Number
Pakka Road (in km.) 80.4 Junior Basic Schools 49.2 Senior Basic Schools 15.1 Higher Secondary Schools 6.0 Degree Colleges 0.4 Industrial Training Institutes 0.1 Allopathic Hospitals 1.6 Aayurvedic Hospitals 0.8 Homeopathic Hospitals 0.8 Yunani Hospitals 0.1 Primary Health Centres 2.1 Female Maternity Welfare Centres 2.4 Female Maternity Welfare Sub-centres 9.8 Cattle Hospitals 1.2 Fair Price Shops 53.6 Police Stations 1.0 Post Offices 10.3 Source: District Statistical Handbook of Allahabad, 1998.
(b) Economic Profile of the District
Let us look at the occupational pattern in the district. Around 30.0 per cent of total
population in the working age constitute the main workers in the district, which is the same as
that of the state. The non-workers constitute around 68.0 per cent, which is also the same as
that of the state. The marginal workers form the rest. In the main workers category, cultivators
constitute 41.0 per cent, agricultural labourers 22.0 per cent, these two categories thus
constituting nearly two-third of the main workers in the district. The rest of the population in
the working age characterised as main workers come mainly from household industry, trade
and commerce, and services (Table 3.7).
Table 3.7 Occupational Structure, Allahabad District
Allahabad Uttar Pradesh Occupations
Number Percent Number Percent Main Workers 11,41,024 30.42 4,13,60,734 29.73 (a) Cultivators 4,71,414 41.31 2,20,31,181 53.27 (b) Agricultural Labourers 2,51,866 22.07 78,33,258 18.94 (c) Livestock and Allied Activities 7,042 0.62 2,95,684 0.71 (d) Mining and Quarrying 4,591 0.40 34,598 0.08 (e) Household Industry* 49,243 4.32 9,97,165 2.41 (f) Other than Household Industry** 66,538 5.83 22,08,368 5.34 (g) Constructions 12,932 1.13 5,10,520 1.23 (h) Trade and Commerce 90,380 7.92 25,50,857 6.17 (i) Transport and Communication 28,991 2.54 7,71,224 1.86 (j) Other Services 1,58,027 13.85 41,27,879 9.98 Marginal Workers 66,898 1.78 34,38,546 2.47 Non-Workers 25,42,361 67.79 9,43,13,007 67.80 Note: * Manufacturing, Processing, Servicing and Repairs in Household Industry. ** Manufacturing, Processing, Servicing and Repairs in Other than Household Industry. Source: District Statistical Handbook of Allahabad, 1998 and Census of India, 1991.

31
Following the observation that most of the working population constitutes the
cultivation category, let us see land holding by ownership and use in the district. The size of
land holdings below 0.5 hectare per cultivator cover 60.0 per cent of total number of land
holders who occupy a total landholding area of less than 20.0 per cent, that is, one-third of
what equal distribution of landholding requires. The size of landholdings above 10 hectares
per cultivator cover 0.3 per cent of total number of landholdings who occupy a total
landholdings area of 5.6 per cent, that is more than 16 times what equal distribution of
landholdings requires. Between 0.5 and 10 hectares of landholding per cultivator, the land
ownership pattern shows increasing skewness as the size holding is arranged in ascending
order. The ownership of landholding thus becomes more skewed, the higher the size holding
per cultivator. The rural region of the district shows the same land ownership pattern what we
calculated from the sample villages representing sample rural region of the district, shows
exactly the same skewed ownership of landholding (Table 3.8). In land use pattern in the
district, we find around two-third of total reported area as net sown area. Area sown more
than once constitutes less than one-third of net sown area. Net area irrigated is around two-
fifth of net sown area. Land use in the district thus shows poor indicators understood by
multiple cropping and irrigation. Another significant observation here is that, rather than the
remaining portion of total reported land area in the district (Remaining Portion = Total Area —
Net Sown Area) covered by forestry, it is covered by wasteland and current fallow, land not
available for cultivators and land put to non-agricultural use. The land use pattern in rural
region in the district resembles the picture for the whole district (Table 3.9).
Table 3.8 Land Holding Pattern, Allahabad District
Sample Rural Total Rural Total District Size of Land Holding
(in hectare) Number Area Number Area Number Area Below 0.5 67279
(61.1) 15943 (19.4)
305651 (60.4)
72902 (19.6)
313593 (60.4)
73724 (19.5)
0.5 to 1.0 22554 (20.5)
14627 (17.8)
102491 (20.3)
66891 (18.0)
105153 (20.3)
67644 (17.9)
1.0 to 2.0 13157 (11.9)
17434 (21.2)
59519 (11.8)
80843 (21.8)
61454 (11.8)
82890 (21.9)
2.0 to 4.0 5833 (5.3)
16773 (20.4)
26812 (5.3)
73264 (19.7)
27477 (5.3)
74535 (19.7)
4.0 to 10.0 2132 (1.9)
12600 (15.3)
9923 (1.9)
56879 (15.3)
10148 (1.9)
57933 (15.3)
Above 10.0 276 (0.3)
4880 (5.9)
1284 (0.3)
20514 (5.5)
1330 (0.3)
20938 (5.6)
Total 110231 (100.0)
82257 (100.0)
505680 (100.0)
371293 (100.0)
519155 (100.0)
377664 (100.0)
Note: Figures in parentheses denote column percentages. Source: District Statistical Handbook of Allahabad, 1998.
Also, following the observation that most of the population in the working age come
from the two categories, cultivators and agricultural labourers, let us look at the major crops in
the district and their yield, yield measured by quintals per hectare in a particular year. The
major crops being produced are wheat and paddy where most of the cultivated area is

32
devoted. The two major crops cover more than three-fourth of gross cropped area in the
district as well as the state of U. P. The other crops are bajra, gram, jawar, maize and pulses.
The productivity per unit of land, measured by yield per hectare, for wheat and paddy in the
district, is around 20 quintals per hectare that is what the yield at the state level shows (Table
3.10).
Table 3.9 Land Use Pattern, Allahabad District, 1998
Land Use (in hectare) Types of Land
Rural Urban Total Forestry 19463
(3.8) - 19463
(3.75) Cultivable wasteland 15326
(3.0) 200
(3.23) 15526 (3.0)
Current fallow 32691 (6.38)
817 (13.2)
33508 (6.46)
Other wasteland and fallow 26039 (5.08)
292 (4.72)
26331 (5.08)
Land not available for cultivation 20207 (3.94)
220 (3.55)
20427 (3.94)
Land put to non-agricultural uses 54992 (10.73)
1533 (24.77)
56525 (10.9)
Postures 1724 (0.34)
- 1724 (0.33)
Others 8800 (1.72)
73 (1.18)
8873 (1.71)
Net sown area 333242 (65.02)
3054 (49.34)
336296 (64.84)
Total reported area 512484 (100.0)
6189 (100.0)
518673 (100.0)
Area sown more than once 146118 (28.51)
1170 (18.9)
147288 (28.4)
Total cropped area (gross) 479360 (93.53)
4224 (68.25)
483584 (93.23)
Net area irrigated 212142 (41.39)
2370 (38.29)
214512 (41.36)
Note: Figures in parentheses denote column percentages. Source: District Statistical Handbook of Allahabad, 1998.
Table 3.10 Product-wise Land Utilization Pattern and Yield, Allahabad District and U.P., 1998
Allahabad Uttar Pradesh
Crops Area in Hectare
% of Area Yield in Qt./Hect.
Area in Hectare
% of Area Yield in Qt./Hect.
Paddy/Rice 138040 41.05 19.76 5616728 22.47 18.17 Jawar 12333 3.67 9.16 526536 3.04 9.36 Bajra 33342 9.91 9.30 785105 4.54 11.15 Maize 273 0.08 20.03 1095488 6.33 13.19 Wheat 191533 56.95 21.07 8567674 49.53 21.71 Gram 30777 9.15 8.60 1275254 7.37 8.79 All Pulses 60121 17.88 11.97 1764732 10.20 9.35 Oil Seeds 10885 3.24 5.39 151876 0.88 7.42 Source: District Statistical Handbook of Allahabad, 1998, and Statistical Abstract of Uttar
Pradesh, 1992.

33
3.5 Public Distribution System: Profile of the District of Allahabad
(a) Distribution of Ration Cards
The distribution of ration cards by BPL and APL categories of households and units
shows that the BPL families received only one-sixth of cards while the APL families received
more than five-sixth for the district of Allahabad. For the state of U. P., these relative shares
were one-fourth and three-fourth. The distribution of units by BPL and APL categories of
households shows that the BPL families hold 15.3 per cent of total units for the district of
Allahabad. At the state level, this figure is 23.7 per cent higher than the per cent of the
district. The average unit per household is 4.9 for BPL and 4.5 for APL in Allahabad district.
For U. P. as a whole, the average size per unit is more or less the same, for BPL it is 4.7 and
for APL it is 4.6.
The distribution of cards for the sample rural area shows that BPL households got
more than one-fourth while APL households got a little less than three-fourth. The distribution
of cards by categories of BPL and APL thus is in favour of APL for the sample, while for the
district the distribution of cards is more in favour of APL relative to what it is for the sample
(Table 3.11).
Table 3.11 Distribution of Cards by BPL and APL Categories of Households and Units in
Allahabad District
Area Categories Number of Cards
Number of Units
Average Unit Per Household
BPL 9537823 (24.0)
43935376 (23.7)
4.6
APL 30162593 (76.0)
141496038 (76.3)
4.7
Uttar Pradesh
Total 39700416 (100.0)
185431414 (100.0)
4.7
BPL 199391 (16.4)
907216 (15.3)
4.5
APL 1018334 (83.6)
5026552 (84.7)
4.9
Allahabad
Total 1217725 (100.0)
5933768 (100.0)
4.9
Sample Area BPL 48969
(27.6) 210101 (27.3)
4.3
APL 128291 (72.4)
559419 (72.7)
4.4
Rural
(Shankargarh, Karchhana, Saidabad,
and Kaurihar) Total 177260 (100.0)
769520 (100.0)
4.3
BPL 1275 (14.9)
6324 (13.0)
5.0
APL 7265 (85.1)
42267 (87.0)
5.8
Urban
(Phulpur, and Bharatganj) Total 8540
(100.0) 48591 (100.0)
5.7
BPL 50244 (27.0)
216425 (26.5)
4.3
APL 135556 (73.0)
601686 (73.5)
4.4
Total
(Rural + Urban)
Total 185800 (100.0)
818111 (100.0)
4.4
Source: Data provided by District and State Level Officials, November 2000.

34
(b) Items to be Distributed
(i) Allotment
In the PDS in Allahabad district, the importance of wheat as a major consumable item
is most. So far as allotment for the district is concerned for 1998, the allotment of wheat is 22
times the allotment of rice in quintals. The allotment of sugar is nearly twice the quantity
allotted for rice.
Wheat allotted per card is 14 kg. per household, while it is 6 kg. for rice and 550 gram
per unit for sugar. Kerosene per card is 3.76 lt. in rural areas and 4 lt. for urban areas in the
district.
(ii) Price
For BPL families, the price of distributable wheat is Rs. 4.65 per kg., while for APL
families, it is nearly twice, Rs. 8.80. For rice, the price for BPL families is Rs. 6.15 while for
APL families, it is Rs. 11.80, nearly double the price what the BPL families are supposed to
pay. This price-differential does not correspond to product-differential, it is for same variety,
for each of wheat and rice.
For sugar and kerosene, it is a different phenomenon. Sugar has a common rate for
both BPL and APL families, fixed at Rs. 13.00 per kg., while for kerosene it is Rs. 9.05.
(iii) Fair Price Shops
The FPSs, located in rural areas of the district constitute 87.49 per cent of total FPSs
in the district, the rest being in urban areas. The dealers/owners of the FPSs are entitled to a
commission, these commissions being fixed administratively. For example, for wheat and rice
per kg. it is 6 paise, for sugar 7 paise, for kerosene per liter 14 paise (Table 3.12).
Table 3.12 PDS Profile, Allahabad District, 2000
Particulars Units Programme Implementing Department Supply Department
(a) Tehsils 6 (b) Blocks 20 (c) Gram Panchayats 1378 (d) Revenue Villages 2715 (e) Towns 11
Total Ration Cards 1217725 (a) BPL 199391 (b) APL 1018334
Total Ration Cards (Rural) 907504 (a) BPL 188279 (b) APL 719225
Total Ration Cards (Urban) 310221 (a) BPL 11112 (b) APL 299109
Total Units 5933769 (a) BPL 907216.5 (b) APL 5026552.5
Contd...

35
Particulars Units Total Units (Rural) 4095262
(a) BPL 849640.5 (b) APL 3245621.5
Total Units (Urban) 1838507 (a) BPL 57576 (b) APL 1780931
Allotted quota of Items (a) Wheat (in quintals) (b) Rice (in quintals) (c) Sugar (in quintals) (d) Kerosene (in liters)
279038 12500 21560
4308000 Allotted quota for households
(a) Wheat per card (in kg.) (b) Rice per card (in kg.) (c) Sugar per unit (in gram) (d) Kerosene per card (in liters) (i) Rural
(ii) Urban
14 6
550 3.46
4 Price of PDS Commodities (in Rs.)
(a) Wheat in kg. (i) BPL (ii) APL
(b) Rice in kg. (I) BPL (ii) APL
(c) Sugar in kg. (BPL & APL) (d) Kerosene in lt. (BPL & APL)
4.65 8.80 6.15
11.80 13.00 9.05
Note: * These data have been taken from District Statistical Handbook of Allahabad, 1998. Source: District Supply Office, Allahabad, November 2000.
(iv) Supply Office
The district administrative set up for the PDS works at three levels in descending
order, Tehsil, Block, Village. At the district level, the major responsibility regarding PDS is to
ensure area-wise (Tehsil) allotment and distribution of items at various levels in order to
control the PDS all over the district. This is ensured jointly by Additional District Magistrate
and (ADM, Civil Supply) and District Supply Officer (DSO).
At the Tehsil level, the Sub-Divisional Magistrate (SDM) is responsible for allotment of
the license for the FPSs and quota of items for each FPS. The SDM is supposed to control
and ensure the distribution system upto the gram panchayat level. The Regional Food Officer
(RFO), hierarchically just below DSO, works parallely with the SDM to ensure FPS-wise
allotment of items. The RFO issues the certificate for carrying and distribution of food grains
and also verifying its control over the distribution system.
At the Block level, the Block Development Officer (BDO) is assigned to ensure the
proper functioning of the distribution network as guided by the SDM at the Tehsil level. The
supply Inspector is the bottommost administrative unit/category who works at the village level
to ensure the distribution of all items at Gram Panchayat level. The Inspector is supposed to
check the FPS's stock of items, allotment of items, quality and price list of items, distribution
of items per card etc. The FPS owner/dealer has a compulsion to draw the allotted items
every month and distribute the drawn items to the cardholders attached to his FPS in
prescribed quantity per head, unadulterated quality and at the price fixed for the said purpose.

36
To have supervision and vigilance on the system at the village level, there is the (elected)
panchayat. The Panchayat can do the appointment and cancellation of licence of any FPS
dealer. The Panchayat is also expected to form a vigilance committee for over all control over
the distribution system. The village level workers are expected to play a constructive role in
the open Panchayat meetings for PDS (Box 4).
Box 4 Administrative Set Up of Supply Department, Government of U.P.(Major
Responsibilities of Officials)
District Allahabad
District Level Major Responsibilities District Level Additional District Magistrate
(Civil Supplies)
To ensure the area-wise (Tehsil) allotment and distribution of items at various levels in order to control the PDS all over the district.
District Supply Officer
Tehsil Level City Area Tehsil Level (Sub-Divisional
Magistrate/Tehsildar) To allot the licenses for the FPS and quota of items for each FPS. To control and ensure the distribution system at gram panchayat level.
(Regional Food Officer) To ensure FPS-wise allotment of items. To Issue the certificate for carrying and distribution of foodgrains and verifying its control over the distribution system.
(Supply Inspector) To ensure the distribution of all items at Gram Panchayat level. To check the FPS's stock, prescribed price and allotted quantity per card and unit actually distributed.
Block Level Village Level (Block Development Officer) (Fair Price Shopkeeper)
To ensure the proper functioning of the distribution system as guided by the Sub-Divisional Magistrate at the Tehsil level.
To draw the items every month and distribute those to all cardholders attached to the particular FPS in prescribed quality and price.
Village Level Role of Panchayat (Village Level Worker)
To check and verify the stocks of FPS and ensure the distribution system at village level with the help of Panchayats; To Issue the certificate of distributed items, and also to issue new ration cards.
Appointment and cancellation of FPS dealer with the help of open Panchayat meeting. To form a vigilance committee for overall control over the distribution system at the village level. This includes checking the stock of items, prescribed price and allotted quality of items and to control the black marketing of items.

37
3.6 Allotment and Lifting of Items in PDS, District Allahabad, 1998 – 2001
At the level of the district of Allahabad, U.P., we took notice of lifting of items, rice,
wheat, sugar, and kerosene, by the FPS dealers vis-à-vis allotment of these items for 1998-
2001. While allotment and lifting of rice and wheat are specific to economic categories, BPL
and APL, by cardholding, those of sugar and kerosene are general, that is, across categories.
In case of rice for BPL households in the district, lifting as percentage of allotment
was cent per cent for 1998-99 and 1999-00, while it fell abruptly in 2000-01. For APL
households, lifting of rice by the FPS dealers as percentage of allotment remained below 10.0
per cent for each of the years 1998-99 and 1999-00, while it increased abruptly in 2000-01
(Table 3.13, Fig. 3.1 & Fig. 3.2). For wheat the picture is similar for BPL households, cent per
cent lifting by FPS dealers for BPL households in 1998-99 and 1999-00 and declining a little
the next year. Lifting of wheat for APL households as percentage of allotment remained
moderate in 1998-99 as well as in 2000-01, while it came down to a surprisingly low level at
2.5 per cent in 1999-00. While in general, absolute lifting of wheat by FPS dealers for APL
households remains low as a trend, we find hardly any reason why allotment of wheat was
raised for APL households at the district level. It was, thus, not reduced lifting by FPS dealers
but increased allotment by supply authority that explains the very poor lifting as percentage of
allotment of wheat for APL households (Table 3.14, Fig. 3.3 & Fig. 3.4).
Lifting of sugar by FPS dealers for households, BPL and APL, as percentage of
allotment remained high and steady, ranging between 95.0 and 100.0 per cent during 1998-
99 to 2000-01 (Table 3.15 & Fig. 3.5). For kerosene, lifting as percentage of allotment at the
district level for households across categories came to be almost cent per cent (Table 3.16 &
Fig. 3.6).
Table 3.13
Allotment and Lifting of Rice (in Qt.) by FPS Dealers, District Allahabad, 1998-2001
APL Households BPL Households Year Allotment Lifting Lifting as %age
of Allotment Allotment Lifting Lifting as %age
of Allotment 1998-99 23560.0 2328.0 9.8 21180.0 21180.0 100.0 1999-00 77520.0 7883.8 10.2 75850.0 75850.0 100.0 2000-01 480.0 360.0 75.0 147160.0 80390.0 54.6 Source: District Supply Office.
Table 3.14 Allotment and Lifting of Wheat (in Qt.) by FPS Dealers, District Allahabad, 1998-2001
APL Households BPL Households Year
Allotment Lifting Lifting as %age of
Allotment
Allotment Lifting Lifting as %age of
Allotment 1998-99 51440.0 29040.0 56.4 39425.7 39425.7 100.0 1999-00 139480.0 3477.3 2.5 166613.3 166613.3 100.0 2000-01 3000.0 2100.0 70.0 332136.0 278982.2 84.0 Source: District Supply Office.

38
Table 3.15 Allotment and Lifting of Sugar (in Qt.) by FPS Dealers, District Allahabad, 1998-2001
Year Allotment Lifting Lifting as %age of Allotment
1998-1999 2,31,708.0 2,22,416.0 96.0 1999-2000 2,18,640.0 2,18,640.0 100.0 2000-2001 2,59,290.0 2,45,500.0 94.7
Source: District Supply Office. Table 3.16
Allotm ent and Lifting of Kerosene (in K. Lt.) by FPS Dealers, District Allahabad, 1998-2001
Year Allotment Lifting Lifting as %age of Allotment
1998-99 47,278.0 47,067.0 99.5 1999-00 47,296.0 46,752.0 98.8 2000-01 51,296.0 49,638.0 96.8
Source: District Supply Office.
Allotment and Lifting of Rice by FPS Dealers for BPL Households
2118
0 7585
0
2118
0 7585
0
8039
0
1471
60
1998-99 1999-00 2000-01
Year
In Q
uin
tal
Allotment
Lifting
Fig. 3.1 Fig. 3.2
Allotment and Lifting of Wheat by FPS Dealers for BPL Households
3942
5.7 16
6613
.3
3942
5.7 16
6613
.3
2789
82.2
3321
36
1998-99 1999-00 2000-01
Year
In Q
uin
tal
Allotment
Lifting
Fig. 3.3 Fig. 3.4
Allotment and Lifting of Wheat by FPS Dealers for APL Households
5144
0
300029
040
3477
.3
2100
1394
80
1998-99 1999-00 2000-01
Year
In Q
uin
tal
Allotment
Lifting
Allotment and Lifting of Sugar by FPS Dealers
2317
08
2186
40
2224
16
2186
40 2455
00
2592
90
1998-99 1999-00 2000-01
Year
In Q
uin
tal
Allotment
Lifting
Fig. 3.5 Fig. 3.6
Allotment and Lifting of Kerosene by FPS Dealers
472
78
472
96
270
67 4
675
2
496
38
512
96
1998-99 1999-00 2000-01Year
In K
. Lt. Allotment
Lifting
Allotment and Lifting of Rice by FPS Dealers for APL Households
2356
0
7752
0
480
2328 7883
.8
360
1998-99 1999-00 2000-01
Year
In q
uin
tal
Allotment
Lifting

Chapter - Four
Public Distribution System in the District of Allahabad: The Facts
'When millions of people die in a famine, it is hard to avoid the thought that something terribly criminal is going on' (Dreze, J. and Sen, A., 1989, Hunger and Public Action, Clarendon Press, Oxford, p. 20).
PART - I
4.1 Profile of Sample Households
Variations in the number of total households at village level follow variations in size of
population by which three categories of villages were selected. As a corollary, selection of
identical number of sample households (50) for each village shows variation as a percentage
of total households.
Of the total households in the selected villages, some villages like Rithainya,
Semraha Uperhar, Pach Dewra, Dewrikala, Karchhana, Muzffarpur Urf. Bicchia, Fatehpur
Kayasthan, Atrampur/Nawabganj, Fatoopur Uperhar, Kanja, and Malak Herher Uperhar are
characterized by very low number of BPL households, varying from 5.99 per cent to 15.82 per
cent of all households (BPL+APL), while there are villages with very high percentage of BPL
households, like Garha with 89.53 percent.
Independent of the inter-village variations in the number of BPL households, we have
selected sample BPL households in villages generally more than the number of selected APL
households. The villages where more than 50.0 per cent of the 50 households selected
belong to the APL category are one-fourth of all villages in number, namely, Rithainya
Baragaon, Muzffarpur Urf. Bicchia, Fatehpur Kayasthan, Kanja, and Malak Herher Uperhar.
The villages with more of same APL households are also some of the villages where APL
households stay more in number.
For the selected Wards in Towns, it is a case of high variation in number of BPL
households as percentage of all households, ranging between 4.18 and 9.74. We have
selected more of BPL households from each Ward out of a total of 50, with a major exception.
It is Ward Number 12 of Bharatganj town (Table 4.1).
The selection of more of BPL households follows the objectives of the study.
Therefore, it is purposively done.
The households studied in the rural region of 4 blocks taken together constitute 7.5
per cent of all households in those rural Blocks. The households studied in the urban region
of 2 Towns taken together constitute 16.9 per cent of all households in those urban areas. As
a whole, for rural and urban regions, by selection of households, it becomes 8.2 per cent of all
households in the total Sample region (rural + urban).

40
Table 4.1 Village/Ward-wise Distribution of Households
Sample Households Total Households Name of Village/Ward
BPL APL Total BPL APL Total Janwan 40 10 50 344 (53.7) 296 640 Golhaiya 32 18 50 155 (52.5) 140 295 Garha 41 9 50 496 (89.5) 58 554 Sheorajpur 32 18 50 302 (76.6) 92 394 Sidhtikar 37 13 50 366 (60.6) 238 604 Lohgara 38 12 50 325 (29.2) 787 1112 Rithainya 16 34 50 60 (11.0) 485 545 Semraha Uperhar 30 20 50 50 (15.8) 266 316 Pach Dewra 27 23 50 52 (14.5) 307 359 Dewri Kala 34 16 50 110 (14.3) 659 769 Karchhana 26 24 50 95 (9.6) 895 990 Bhatauli 25 25 50 155 (9.6) 660 815 Baragaon 13 37 50 140 (30.4) 320 460 Mahuwa Kothi 35 15 50 211 (40.3) 312 523 Motiha 34 16 50 194 (40.9) 280 474 Jogapur 40 10 50 191 (41.4) 270 461 Osepur 30 20 50 339 (40.8) 492 831 Dusaoti 44 6 50 350 (53.8) 300 650 Muzffarpur Urf. Bichhia 5 45 50 77 (9.3) 750 827 Fatehpur Kayasthan 21 29 50 60 (11.4) 465 525 Atrampur/ Nawabganj 33 17 50 90 (6.0) 1412 1502 Fatoopur Uperhar 25 25 50 52 (17.5) 245 297 Kanjia 24 26 50 122 (12.5) 850 972 Malak Herher Uperhar 23 27 50 88 (8.6) 939 1027 Ward No. 3 (Phulpur) 35 15 50 99 (27.6) 259 358 Ward No. 12 (Phulpur)* 24 26 50 17 (4.2) 389 406 Ward No. 1 (Bharatganj) 44 6 50 189 (91.7) 17 206 Ward No. 12 (Bharatganj) 15 35 50 25 (11.9) 185 210 Note: *Sample figure is higher than total number of BPL, because some influential people
got BPL cards and the record was not maintained by the Supply Office. Figures in parentheses show BPL households as percentage of total households. Source: District Supply Office of Allahabad, September 2000.
The sample rural households constitute 0.1 per cent of all rural households in the
District (Universe) and the sample urban households constitute 0.06 per cent of all urban
households in the District. As a whole, for rural and urban regions taken together it becomes
0.1 per cent.
In the sample households studied, BPL households selected constitutes 15.9 per cent
of all rural BPL households in existence, and APL households selected constitutes 4.3 per
cent of all APL households in existence in rural region. BPL households selected in rural
region as a percentage of all households (BPL+APL) constitute 58.75 per cent. For urban
areas, BPL households selected constitute 35.8 per cent of all urban BPL households in
existence, and APL households selected constitute 9.6 per cent of all APL households in the
urban areas of the District. The percentages for selected BPL and APL households for the
whole selected sample (Rrual+Urban) are 17.3 and 4.7 respectively.

41
Table 4.2 Distribution of Households on the Basis of Sample and Universe
Sample Households Universe Households
Selected Total Sample Total Block/Town
BPL APL Total BPL APL Total BPL APL Total BPL APL Total Shankargarh 220
(11.1) 80
(5.0) 300 (8.3)
1988 (100.0)
1611 (100.0)
3599 (100.0)
220 (1.4)
80 (0.5)
300 (0.9)
15184 (100.0)
16798 (100.0)
31982 (100.0)
Karchhana 158 (30.5)
142 (4.3)
300 (7.9)
522 (100.0)
3272 (100.0)
3794 (100.0)
158 (2.3)
142 (0.3)
300 (0.6)
6678 (100.0)
41968 (100.0)
48646 (100.0)
Saidabad 196 (13.8)
104 (5.5)
300 (8.8)
1425 (100.0)
1874 (100.0)
3399 (100.0)
196 (0.9)
104 (0.3)
300 (0.6)
21417 (100.0)
30127 (100.0)
51544 (100.0)
Kaurihar 131 (26.8)
169 (3.6)
300 (5.8)
489 (100.0)
4661 (100.0)
5150 (100.0)
131 (2.3)
169 (0.4)
300 (0.7)
5690 (100.0)
39398 (100.0)
45088 (100.0)
Total Rural 705 (15.9)
495 (4.3)
1200 (7.5)
4424 (100.0)
11418 (100.0)
15942 (100.0)
705 (0.4)
495 (0.1)
1200 (0.1)
188279 (100.0)
719225 (100.0)
907504 (100.0)
Phulpur 59 (50.9)
41 (6.3)
100 (13.1)
116 (100.0))
648 (100.0))
764 (100.0)
59 (10.0)
41 (1.0)
100 (2.2)
590 (100.0)
4012 (100.0)
4602 (100.0)
Bharatganj 59 (27.6)
41 (20.3)
100 (24.0)
214 (100.0)
202 (100.0)
416 (100.0)
59 (8.6)
41 (1.3)
100.0 (2.5)
685 (100.0)
3253 (100.0)
3938 (100.0)
Total Urban 118 (35.8)
82 (9.6)
200 (16.9)
330 (100.0)
850 (100.0)
1180 (100.0)
118 (1.1)
82 (0.02)
200 (0.06)
11112 (100.0)
299109 (100.0)
310221 (100.0)
Grand Total 823 (17.3)
577 (4.7)
1400 (8.2)
4754 (100.0)
12268 (100.0)
17122 (100.0)
823 (0.4)
577 (0.1)
1400 (0.1)
199391 (100.0)
1018334 (100.0)
1217725 (100.0)
Source: District Supply Office of Allahabad, November 2000.

42
Distribution of Sample Households
57.8
59 58
41.2
41 41.2
1 0 0.8
0
10
20
30
40
50
60
70
Rural Urban Total
Fig. 4.1
Per
cen
tag
e
BPL
APL
Card-less
There are inter-Block variations in selection of BPL households drawn from all BPL
households in the respective Blocks, the variations ranging from 11.1 per cent to 30.5 per
cent. The same is true for BPL households in urban areas selected from total urban BPL
households. The total BPL and APL households taken in the denominator for calculation of
percentage figure correspond to that from sample Blocks and Towns mentioned (Table 4.2).
Of the total cardholders in rural areas, BPL households cover 57.8 per cent and APL
households cover 41.2 per cent, the rest being covered by card-less households. The
cardless households constitute only 1.0 per cent of the sample households drawn in rural
region of the district.
We got names of households in the list maintained by the State Supply Office, all
supposedly with cards, but while in Field we found card-less cases. We did not hesitate to
interview these card-less households. As we understand, there may be a number of
reasons for non-availability of cards, like the possibility that cards were actually
prepared but not allotted. The other possibility may be that cards were prepared, and
allotted to wrong households, say, a few cards meant for BPL households actually
allotted to the APL
households.
For the urban areas,
BPL households constitute 59.0
per cent of the sample total,
while APL households cover the
rest. We did not find any case of
cardless households in the
urban areas chosen for study.
In totality, for both rural
and urban areas studied, BPL
families constitute 58.0 per cent
while APL households constitute 41.2 per cent, card-less case as percentage of total
(Rural+Urban) standing at 0.8 (Table 4.3 & Fig. 4.1).
Table 4.3 Distribution of Sample Households
Category Rural Urban Total
BPL 694 (57.8)
118 (59.0)
812 (58.0)
APL 495 (41.2))
82 (41.0)
577 (41.2)
Card-less 11 (1.0)
- 11 (0.8)
Total 1200 (100.0)
200 (100.0)
1400 (100.0)
Source: Field survey.

43
4.2 Profile of Households in the Sample
(a) Gender-wise Classification
Of the total respondents in BPL (812) out of the total households (1400), 89.2 per
cent is constituted by male and 10.8 by female population. Of the total respondents in APL
(577), 91.7 per cent comes from male, 8.3 per cent from female. The gap is explained by
card-less categories of male and female respondents constituting a total of 11 out of 1400. In
its totality (BPL+APL+Card-less) thus male respondents constituted 90.1 per cent and female
9.9 per cent. There are inter-block and inter-town variations in the percentages of
respondents by gender category. These variations are also explained on the economic
horizon of BPL and APL classifications of respondents (Table 4.4).
Table 4.4 Gender-wise Distribution of Households
Households Block/Town Categories
Male Female Total BPL 196 17 213 APL 77 3 80 Card-less 6 1 7
Shankargarh
Total 279 (93.0)
21 (7.0)
300 (100.0)
BPL 137 17 154 APL 133 9 142 Card-less 3 1 4
Karchhana
Total 273 (91.0)
27 (9.0)
300 (100.0)
BPL 172 24 196 APL 95 9 104
Saidabad
Total 267 (89.0)
33 (11.0)
300 (100.0)
BPL 118 13 131 APL 150 19 169
Kaurihar
Total 268 (89.3)
32 (10.7)
300 (100.0)
BPL 43 16 59 APL 37 4 41
Phulpur
Total 80 (80.0)
20 (20.0)
100 (100.0)
BPL 58 1 59 APL 37 4 41
Bharatganj
Total 95 (95.0)
5 (5.0)
100 (100.0)
BPL 724 (89.2)
88 (10.8)
812 (100.0)
APL 529 (91.7)
48 (8.3)
577 (100.0)
Card-less 9 (81.8)
2 (18.2)
11 (100.0)
Total
Total 1262 (90.1)
138 (9.9)
1400 (100.0)
Source: Field survey.

44
(b) Caste-wise Classification
Of the total respondents in BPL (812) out of the total households (1400), SC
constituted 75.7 per cent and general category constituted only 2.7 per cent. Of the total
respondents in APL (577), SC constituted 37.3 per cent. Of the SC total respondents (841),
BPL category covers 73.12 per cent. Excepting SC category, that too in rural areas, there is
no report of card-less cases. Such card-less cases are only 11 out of a total of 1400
households studied in the rural Blocks and towns. There are inter-block and inter-town
variations in percentage of SC category in BPL and APL. Similarly, there are inter-Block and
inter-town variations in BPL and APL categories covered by SC population, and other caste
groups (Table 4.5).
Table 4.5 Caste-wise Distribution of Households
Block/Town Categories SC OBC General Minority Total BPL 194 16 3 - 213 APL 21 23 36 - 80 Card-less 7 - - - 7
Shankargarh
Total 222 (74.0)
39 (13.0)
39 (13.0)
- 300 (100.0)
BPL 85 50 14 5 154 APL 37 53 35 17 142 Card-less 4 - - - 4
Karchhana
Total 126 (42.0)
103 (34.3)
49 (16.3)
22 (73.0)
300 (100.0)
BPL 122 54 - 20 196 APL 30 53 1 20 104
Saidabad
Total 152 (50.7)
107 (35.7)
1 (0.3)
40 (13.3)
300 (100.0)
BPL 114 15 1 1 131 APL 101 58 1 9 169
Kaurihar
Total 215 (71.7)
73 (24.3)
2 (0.7)
10 (3.3)
300 (100.0)
BPL 47 - 1 11 59 APL 19 - - 22 41
Phulpur
Total 66 (66.0)
- 1 (1.0)
33 (33.0)
100 (100.0)
BPL 53 3 3 - 59 APL 7 10 24 - 41
Bharatganj
Total 60 (60.0)
13 (13.0)
27 (27.0)
- 100 (100.0)
BPL 515 135 18 26 694 APL 189 187 73 46 495 Card-less 11 - - - 11
Rural (Total)
Total 715 (59.6)
322 (26.8)
91 (7.6)
72 (6.0)
1200 (100.0)
BPL 100 3 4 11 118 APL 26 10 24 22 82
Urban (Total )
Total 126 (63.0)
13 (6.5)
28 (14.0)
33 (16.5)
200 (100.0)
BPL 615 (75.7)
138 (17.0)
22 (2.7)
37 (4.6)
812 (100.0)
APL 215 (37.3)
197 (34.1)
97 (16.8)
68 (11.8)
577 (100.0)
Card-less 11 (100.0)
- - - 11 (100.0)
Total (Rural + Urban)
Total 841 (60.1)
335 (23.9)
119 (8.5)
105 (7.5)
1400 (100.0)
Source: Field survey.

45
(c) Education-wise Classification
Of the total respondents in BPL (812), 62.3 per cent are illiterate and 7.9 per cent are
nominally literate (below Primary level) so that 70.2 per cent of BPL households can not be
expected to be aware of many of the visible dimensions of the PDS. This includes reading, for
example, the price list of items etc. Of the total respondents in APL (577), as high as 40.9 per
cent are illiterate and 8.3 percent are nominally literate (below Primary level), so that nearly
half of total APL households (as respondents) can not be expected to participate in a
functionally useful way in the PDS network. This is in spite of the fact that the APL
households are supposed to be economically well off (in terms of income). Of the total (11)
card-less cases in the rural Blocks, a total of 8 (72.7 per cent) comes from the illiterate
category; there is no card-less case reported for respondents with educational status of high
school and above (Table 4.6).
Table 4.6
Education-wise Distribution of Households Block/Town Categories 1 2 3 4 5 6 7 Total
BPL 167 16 10 8 8 4 - 213 APL 27 8 9 11 9 11 5 80 Card-less 5 - 1 1 - - - 7
Shankargarh
Total 199 (66.3)
24 (8.0)
20 (6.7)
20 (6.7)
17 (5.7)
15 (5.0)
5 (1.7)
300 (100.0)
BPL 75 10 21 16 18 10 4 154 APL 48 12 21 17 21 16 7 142 Card-less 3 1 - - - - - 4
Karchhana
Total 126 (42.0)
23 (7.7)
42 (14.0)
33 (11.0)
39 (13.0)
26 (8.7)
11 (3.7)
300 (100.0)
BPL 117 14 18 15 21 7 4 196 APL 32 11 10 15 17 10 9 104
Saidabad
Total 149 (49.7)
25 (8.3)
28 (9.3)
30 (10.0)
38 (12.7)
17 (5.7)
13 (4.0)
300 (100.0)
BPL 92 12 11 9 4 3 - 131 APL 105 10 13 16 15 4 6 169
Kaurihar
Total 197 (65.7)
22 (7.3)
24 (8.0)
25 (8.3)
19 (6.3)
7 (2.3)
6 (2.0)
300 (100.0)
BPL 40 6 3 4 2 3 1 59 APL 15 6 5 4 6 1 4 41
Phulpur
Total 55 (55.0)
12 (12.0)
8 (8.0)
8 (8.0)
8 (8.0)
4 (4.0)
5 (5.0)
100 (100.0)
BPL 15 6 6 11 10 6 5 59 APL 9 1 3 7 11 4 6 41
Bharatganj
Total 24 (24.0)
7 (7.0)
9 (9.0)
18 (18.0)
21 (21.0)
10 (10.0)
11 (10.0)
100 (100.0)
BPL 506 (62.3)
64 (7.9)
69 (8.5)
63 (7.7)
63 (7.7)
33 (4.1)
14 (1.6)
812 (100.0)
APL 236 (40.9)
48 (8.3)
61 (10.6)
70 (12.1)
79 (13.7)
46 (8.0)
37 (6.2)
577 (100.0)
Card-less 8 (72.7)
1 (9.1)
1 (9.1)
1 (9.1)
- - - 11 (100.0)
Total
Total 750 (53.6)
113 (8.1)
131 (9.4)
134 (9.6)
142 (10.1)
79 (5.6)
51 (3.5)
1400 (100.0)
Note: 1=Illiterate, 2=Literate, 3=Primary, 4=Middle, 5=High School, 6=Intermediate, and 7=Higher Education.
Source: Field survey.

46
(d) Occupation-wise Classification
Of the 812 BPL respondents, 51.5 per cent work as non-agricultural labour while 17.1
per cent are engaged as agricultural labour. Thus, most of the BPL households are labourers,
engaged in agriculture and non-agricultural activities. Of the 577 APL respondents, as high as
30.7 per cent are engaged in agriculture as cultivators while 23.2 per cent work as non-
agricultural labourers. BPL and APL households taken together, 39.9 per cent of all are as
non-agricultural labourers. For both BPL and APL categories, the three occupations, namely
as agricultural cultivators, agricultural labourers, and non-agricultural labourers, constitute
71.60 per cent of all occupations recorded for 1400 households studied. There are, however,
inter-block and inter-town and between Blocks and Towns, variations in percentage of
households engaged in agricultural (as cultivators and labourers) and non-agricultural
activities (like non-agricultural labour, government service etc.) (Table 4.7).
(e) Occupation-cum-Employment Structure of Households in the Sample
The occupational structure of the households (1400) shows as high as 8.6 per cent
involved in more than one occupation. Thus, we get really 1520 households in the occupation
category. The households engaged as agricultural cultivators constitute 65.4 per cent of the
total employment of households (387) in a single sector (Agriculture). The households
identified as individuals engaged as agricultural cultivator also work in industry/services/other
sectors. The second category that absorbs more of the occupations by engagement is
agricultural labourers. The households engaged as agricultural labourers in a single sector,
agriculture, constitute 28.9 per cent of the total employment in agriculture. Since the
economic activities in the sample households essentially belong to agriculture and allied
activities, so the extent of unemployment is as low as 0.6 per cent of all households involved
in a single sector (Table 4.8). In terms of time spent, agriculture constitutes 61.7 per cent of
the total time spent (employment) on all occupations recorded for the sample households, the
second ranked being that of non-agricultural labourers at 17.5 per cent. However, if the
occupation is identified by income, then the service sector (private service as well as
government service) accounts for the most. The households engaged in services earn more
than 40.0 per cent in each of private service and government service. The households while
employed in agriculture earn around 20.0 per cent of their income while these same
individuals earn around the same while they are in each of private service and government
service (Table 4.9). It is thus a mixture of occupations by time-spent and income earned
for the rural households. Though by time-spent, agriculture (cultivators and
agricultural labourers) is the dominant activity for the sample households, in terms of
income-earned there are sharp differences across activities.

47
Table 4.7 Occupation-wise Distribution of Households
Block/Town Categories 1 2 3 4 5 6 7 8 9 10 11 Total
BPL 15 1 171 3 - 4 2 1 15 - 1 213 APL 39 - 16 3 5 7 2 3 4 - 1 80 Card-less - 2 4 - - - - - - - 1 7
Shankargarh
Total 54 (18.0)
3 (1.0)
191 (63.7)
6 (2.0)
5 (1.7)
11 (3.7)
4 (1.3)
4 (1.3)
19 (6.5)
- 3 (1.0)
300 (100.0)
BPL 18 61 44 1 1 7 6 3 12 1 - 154 APL 46 16 25 13 9 12 6 2 10 3 - 142 Card-less - 1 3 - - - - - - - - 4
Karchhana
Total 64 (21.3)
78 (26.0)
72 (24.0)
14 (4.8)
10 (3.3)
19 (6.3)
12 (4.0)
5 (1.7)
22 (7.3)
4 (1.3)
- 300 (100.0)
BPL 37 39 55 5 2 10 30 2 12 - 4 196 APL 49 6 13 8 8 1 11 2 5 1 - 104
Saidabad
Total 86 (28.7)
45 (15.0)
68 (22.7)
13 (4.3)
10 (3.3)
11 (3.7)
41 (13.7)
4 (1.3)
17 (5.7)
1 (0.3)
4 (1.3)
300 (100.0)
BPL 6 31 86 - - - - - 7 - 1 131 APL 40 24 70 2 3 8 5 6 9 1 1 169
Kaurihar
Total 46 (15.3)
55 (18.3)
156 (52.0)
2 (0.7)
3 (1.0)
8 (2.7)
5 (1.7)
6 (2.0)
16 (5.3)
1 (0.3)
2 (0.7)
300 (100.0)
BPL - 4 28 1 - 5 13 3 5 - - 59 APL 3 1 7 3 4 8 10 1 4 - - 41
Phulpur
Total 3 (3.0)
5 (5.0)
35 (35.0)
4 (4.0)
4 (4.0)
13 (13.0)
23 (23.0)
4 (4.0)
9 (9.0)
- - 100 (100.0)
BPL 2 3 34 4 1 4 1 - 10 - - 59 APL - - 3 2 2 28 - 1 5 - - 41
Bharatganj
Total 2 (2.0)
3 (3.0)
37 (37.0)
6 (6.0)
3 (3.0)
32 (32.0)
1 (1.0)
1 (1.0)
15 (15.0)
- - 100 (100.0)
BPL 78 (9.6)
139 (17.1)
418 (51.5)
14 (1.7)
4 (0.5)
30 (3.7)
52 (6.4)
9 (1.1)
61 (7.5)
1 (0.1)
6 (0.6)
812 (100.0)
APL 177 (30.7)
47 (8.1)
134 (23.2)
31 (5.4)
31 (5.4)
64 (11.1)
34 (5.9)
15 (2.6)
37 (6.4)
5 (0.9)
2 (0.3)
577 (100.0)
Card-less - 3 (27.3)
7 (63.6)
- - - - - - - 1 (9.1)
11 (100.0)
Total
Total 255 (18.2)
189 (18.5)
559 (39.9)
45 (3.2)
35 (2.5)
94 (6.7)
86 (6.1)
24 (1.7)
98 (7.0)
6 (0.4)
9 (0.6)
1400 (100.0)
Note: 1=Agriculture, 2=Agricultural labour, 3=Non-agricultural labour, 4=Private service, 5=Govt. service, 6=Small business, 7=Artisians, 8=Housewives, 9=Students, 10=Unemployed, and 11=Others (Pujari (Prist), Sapera (Snake Charmers), Washerman and etc.)
Source: Field survey.

48
Table 4.8
Occupational Structure of Households
Occupations Agriculture Industry Services Other Sectors Total Agricultural Cultivators 253
(65.4) 5
(13.5) 20
(21.5) 18
(2.0) 296
(21.1) Agricultural Labour 112
(28.9) 3
(8.1) 3
(3.2) 89
(10.1) 207
(14.8) Non-Agricultural Labour 22
(5.7) 18
(48.6) 1
(1.1) 531
(60.1) 572
(40.9) Private Service 1
(0.3) 2
(5.4) 42
(45.2) 6
(0.7) 51
(3.6) Government Service 9
(2.3) 1
(2.7) 34
(36.6) 1
(0.1) 45
(3.2) Small Business 4
(1.0) 2
(5.4) 4
(4.3) 94
(10.6) 104 (7.4)
Artisan 6 (1.6)
15 (40.5)
3 (3.2)
70 (7.9)
94 (6.7)
Housewives 9 (2.3)
- 4 (4.3)
13 (1.5)
26 (1.9)
Students 3 (0.8)
- 1 (1.1)
3 (0.3)
7 (0.5)
Unemployed 1 (0.3)
- 2 (2.2)
5 (0.6)
8 (0.6)
Others 17 (4.4)
1 (2.7)
10 (10.6)
82 (9.3)
110 (7.9)
Total 437 (112.9)
47 (127.0)
124 (133.3)
912 (103.3)
1520 (108.6)
Involved in more than one sector*
50 (12.9)
10 (27.0)
31 (33.3)
29 (3.3)
120 (8.6)
households involved in a single sector
387 (100.0)
37 (100.0)
93 (100.0)
883 (100.0)
1400 (100.0)
Note: * These households are involved in more than one occupation and they are earning from more than one sector.
Source: Field survey.
Table 4.9 Income and Employment Structure of Households in Terms of Income and Time Categories
Sector/
Occupation 1 2 3 4 5 6 7 Total
In Terms of Income Cultivators 10
(20.0) 5
(10.0) 3
(6.0) 10
(20.0) 11
(22.0) 4
(8.0) 7
(14.0) 50
(100.0) Industry 2
(20.0) - 2
(20.0) - - 1
(10.0) 5
(50.0) 10
(100.0) Services 4
(12.9) - - 13
(41.9) 14
(45.2) - - 31
(100.0) Others* 7
(24.1) 5
(17.2) 1
(3.4) 4
(13.8) 3
(10.3) 6
(20.7) 3
(10.3) 29
(100.0) Total 23
(19.2) 10
(8.3) 6
(5.0) 27
(22.5) 28
(23.3) 11
(9.2) 15
(12.5) 120
(100.0) In Terms of Time Spent
Cultivators 37 (72.0)
2 (4.0)
5 (10.0)
2 (4.0)
1 (2.0)
1 (2.0)
2 (4.0)
50 (100.0)
Industry 4 (40.0)
2 (20.0)
3 (30.0)
- - - 1 (10.0)
10 (100.0)
Services 21 (67.7)
1 (3.2)
3 (9.7)
2 (6.4)
1 (3.2)
1 (3.2)
2 (6.4)
31 (100.0)
Others* 12 (41.4)
1 (3.4)
10 (34.5)
1 (3.4)
- 2 (6.9)
3 (10.3)
29 (100.0)
Total 74 (61.7)
6 (5.0)
21 (17.5)
5 (4.2)
2 (1.7)
4 (3.4)
8 (6.7)
120 (100.0)
Note: 1=Cultivators, 2=Agricultural labour, 3=Non-Agricultural Labour, 4=Private Service, 5=Government Service, 6=Small Business & 7=Artisan.
* (Non-agricultural labour, Artisan, Small Shops, Doctor (Unregistered), Weaver, Washerman, Driver, Madari (Snake charmer), Purohit (Priest), Band Master etc.
Source: Field survey.

49
4.3 Profile of Population in the Sample
(a) Distribution of Sample Population by Social (Caste and Gender) Categories
Of the population (7073) covered in the Sample for study of PDS in the Allahabad
district, 57.3 per cent is constituted by SC, 25.2 per cent OBC, 8.6 per cent minority. The
general caste category is constituted by only 8.9 per cent. There are inter-block variations in
percentage chosen from among caste categories, the variations ranging from the lowest in
Karchhana Block at 38.8 per cent to 74.1 per cent in Sankargarh for SC category. For
Kaurihar, the SC percentage in the sample population is 71.0 while in Saidabad Block it is
47.4 per cent. For town areas, Phulpur and Bharatganj, the SC percentages lay in between
the maximum and minimum for the rural blocks; for Phulpur, the percentage is 59.5 while for
Bharatganj it is 56.0 per cent. Distributed over gender categories, the total sample population
is 52:48 for male and female. The SC population carved out from this sample is distributed
exactly in the same ratio, 52:48, as the total sample population. Of total male number in the
sample male population, SC constitutes 57.0 per cent, the same percentage holds good for
the total female number in the SC category out of total female sample population, which is
57.6 per cent. There are, however, inter-Block variations in distribution of population, caste-
wise and gender-wise, and gender-wise within a particular caste (Table 4.10).
(b) Distribution of Sample Population by Economic (Income and Occupation) Categories
For distribution of cards by economic categories, BPL and APL, an income of Rs.
11,000 per annum per household has been accepted (as per the approval of the Eighth Plan,
1992-1997, by the Planning Commission, Govt. of India) as the cut off line. Below this income
per annum, households would be entitled to BPL cards, and above this income, APL cards.
Of the total number of households (1400) surveyed in 24 villages and two towns, we
got 52.8 per cent households with income less than Rs. 11,000 and 33.0 per cent households
with income less than Rs. 9,000 (The latter has been taken by the Supply Dept., Govt. of U.P.
as the upper limit income for identification of BPL families, as per GO of U.P. No. 437/29-
Khadya-Desc-I-I(9/97). Of the total households with income less than Rs 11,000, BPL
cardholders constituted 79.56 per cent, while APL cardholders constituted 19.07 per cent, the
rest 1.37 per cent explained by card-less cases. Of the total population in the sample (7073),
the percentage of population below income category of Rs. 11,000 covered 47.85 per cent. Of
the total households (1400), BPL households by cardholding constituted 58.0 per cent and
APL households constituted 41.21 per cent, the rest 0.78 per cent explained by card-less
cases. Of the total sample population (7073), BPL constituted 56.78 per cent and APL
constituted 42.69 per cent, the rest 0.52 per cent explained by card-less cases. The
households with income more than Rs. 11,000 per Household per month enjoy BPL cards
also. Of the total households with income above Rs. 11,000, BPL cardholding households
constituted 33.88 per cent. Of the total households with BPL Cards (812), households with

50
income less than Rs. 11,000 is 72.41 per cent, implying that 27.59 per cent of households
with income more than Rs. 11,000 held BPL cards. In other words, one fourth of APL
households by income (economic) category got entitlement to BPL cards (by error or by
wrong decision or other administrative failure). What is more serious is that the income-poor
(income less than Rs. 11,000 per year per household) households had to have APL cards. Of
the total APL cards (577), such BPL families got 24.43 per cent. The APL households who got
APL cards thus constituted three-fourth of what they should have received (Table 4.11 & Fig.
4.2). There are inter-block and inter-town variations in distribution of cards, BPL and APL,
among respective income-categories of population and households (Tables 4.12, 4.13).
Table 4.10 Gender and Caste-wise Distribution of Sample Population
Block/Town Gender SC OBC General Minority Total
Male 566 99 98 - 763 Female 491 85 88 - 664 Children (<5 yrs.) 199 35 24 - 258
Shankargarh
Total 1057 (74.1)
184 (12.9)
186 (13.0)
- 1427 (100.0)
Male 318 275 158 64 815 Female 278 273 121 48 720 Children (<5 yrs.) 120 98 37 14 269
Karchhana
Total 596 (38.8)
548 (35.7)
285 (18.6)
112 (7.9)
1535 (100.0)
Male 391 305 3 137 836 Female 384 297 3 116 800 Children (<5 yrs.) 148 108 1 39 296
Saidabad
Total 775 (47.4)
602 (36.8)
6 (0.3)
253 (15.5)
1636 (100.0)
Male 526 206 3 20 755 Female 514 172 2 21 709 Children (<5 yrs.) 170 61 - 4 235
Kaurihar
Total 1040 (71.0)
378 (25.8)
5 (0.4)
41 (2.8)
1464 (100.0)
Male 158 - 1 111 270 Female 146 - 3 92 241 Children (<5 yrs.) 37 - - 31 68
Phulpur
Total 304 (59.5)
- 4 (0.8)
203 (39.7)
511 (100.0)
Male 155 36 81 - 272 Female 125 32 71 - 228 Children (<5 yrs.) 67 8 25 - 100
Bharatganj
Total 280 (56.0)
68 (13.6)
152 (30.4)
- 500 (100.0)
Male 2114 (57.0)
921 (24.8)
344 (9.3)
332 (8.9)
3711 (100.0)
Female 1938 (57.6)
859 (25.6)
288 (8.2)
277 (8.2)
3362 (100.0)
Children (<5 yrs.) 741 (50.4)
310 (25.3)
87 (7.2)
88 (7.2)
1226 (100.0)
Total
Total 4052 (57.3)
1780 (25.2)
632 (8.9)
609 (8.6)
7073 (100.0)
Note: Children have been included in gender (male and female) figures. Source: Field survey.

51
Table 4.11
Income-wise Distribution of Sample Households and Population at District Level
Sample Households Population Income in Rs. (Yearly) BPL APL Card-
less Total BPL APL Card-
less Total
Below 5,000 87 (10.7)
17 (2.9)
2 (18.2)
106 (7.6)
275 (6.8)
46 (1.6)
2 (5.4)
323 (4.5)
5,000 - 9,000 296 (36.5)
50 (8.6)
8 (72.7)
354 (25.4)
1318 (32.8)
183 (6.0)
31 (83.8)
1532 (21.7)
9,001 - 11,000 205 (25.2)
74 (12.8)
- 279 (19.8)
1172 (29.2)
358 (11.8)
- 1530 (21.7)
11,001 - 15,000 172 (21.2)
160 (27.8)
1 (9.1)
333 (23.8)
944 (23.6)
829 (27.5)
4 (10.8)
1777 (25.2)
15,001 - 20,000 30 (3.7)
113 (19.6)
- 143 (10.3)
187 (4.6)
560 (18.5)
- 747 (10.5)
Above 20,000 22 (2.7)
163 (28.3)
- 185 (13.1)
120 (3.0)
1044 (34.6)
- 1164 (16.4)
Total 812 (100.0)
577 (100.0)
11 (100.0)
1400 (100.0)
4016 (100.0)
3020 (100.0)
37 (100.0)
7073 (100.0)
Source: Field survey.
Table 4.12 Income-wise Distribution of Sample Population at Block Level
Block/Town Categories 1 2 3 4 5 6 Total
BPL 21 348 266 303 54 22 1014 APL - 7 2 122 106 148 385 Card-less - 24 - 4 - - 28
Shankargarh
Total 21 (1.5)
379 (26.5)
268 (18.8)
429 (30.0)
160 (11.2)
170 (4.9)
1427 (100.0)
BPL 26 333 155 215 24 37 790 APL - 37 43 238 153 265 736 Card-less 2 7 - - - - 9
Karchhana
Total 28 (1.8)
377 (24.6)
198 (12.9)
453 (29.5)
177 (11.5)
302 (19.7)
1535 (100.0)
BPL 119 314 275 179 82 42 1011 APL 3 25 53 131 123 290 625
Saidabad
Total 122 (7.5)
339 (20.7)
328 (20.0)
310 (18.9)
205 (12.5)
332 (20.4)
1636 (100.0)
BPL 74 188 305 65 - 8 640 APL 35 77 209 273 112 118 824
Kaurihar
Total 109 (7.4)
265 (18.1)
514 (35.1)
338 (23.1)
112 (7.7)
126 (8.6)
1464 (100.0)
BPL 35 123 91 46 - - 295 APL 8 26 44 45 35 58 216
Phulpur
Total 43 (8.4)
149 (29.2)
135 (26.4)
91 (17.8)
35 (6.8)
58 (11.4)
511 (100.0)
BPL - 12 80 136 27 11 266 APL - 11 7 20 31 165 234
Bharatganj
Total - 23 (4.6)
87 (17.4)
156 (31.2)
58 (11.6)
176 (35.2)
500 (100.0)
BPL 275 (6.8)
1318 (32.8)
1172 (29.2)
944 (23.5)
187 (4.7)
120 (3.9)
4016 (100.0)
APL 46 (1.5)
183 (6.1)
358 (11.8)
829 (27.5)
560 (18.5)
1044 (34.6)
3020 (100.0)
Card-less 2 (5.4)
31 (83.8)
- 4 (10.8)
- - 37 (100.0)
Total
Total 323 (4.6)
1532 (21.7)
1530 (21.6)
1777 (25.1)
747 (10.6)
1164 (16.5)
7073 (100.0)
Note: Income in Rs. (Yearly) 1=Below 5000, 2=5000-9000, 3=9001-11000, 4=11001-15000, 5=15001-20000, and 6=Above 20000.
Source: Field survey.

52
Income-wise Distribution of Sample Households
10.7
36.5
25.2
21.2
3.7
2.7
2.9 8.
6 12.8
27.8
19.6 28
.3
18.2
72.7
0
9.1
0 0
0
10
20
30
40
50
60
70
80
Below5000
5000-9000
9001-11000
11001-15000
15001-20000
Above20000
Income
Per
cen
tag
e
BPL
APL
Card-less
Fig. 4.2
Table 4.13 Income-wise Distribution of Households at Block Level
BPL* APL Total Block/Town Categories
1 2 3 4 5 6 BPL APL Total
BPL 7 85 50 58 10 3 142 71 213 APL - 2 1 29 22 26 3 77 80 Card-less - 6 - 1 - - 6 1 7
Shankargarh
Total 7 (2.3)
93 (31.0)
51 (17.0)
88 (29.3)
32 (10.7)
29 (9.7)
151 (50.3)
149 (49.7)
300 (100.0)
BPL 11 68 27 37 4 7 106 48 154 APL - 13 10 42 33 44 23 119 142 Card-less 2 2 - - - - 4 - 4
Karchhana
Total 13 (4.3)
83 (27.7)
37 (12.3)
79 (26.3)
37 (12.3)
51 (17)
133 (44.3)
167 (55.7)
300 (100.0)
BPL 38 64 47 30 10 7 149 47 196 APL 1 7 11 25 20 40 19 85 104
Saidabad
Total 39 (13.0)
71 (23.7)
58 (19.3)
55 (18.3)
30 (10.0)
47 (15.7)
168 (56.0)
144 (48.0)
300 (100.0)
BPL 22 46 50 11 - 2 118 13 131 APL 14 20 45 52 23 15 79 90 169
Kaurihar
Total 36 (12.0)
66 (22.0)
95 (31.6)
63 (21.0)
23 (7.7)
17 (5.7)
197 (65.7)
103 (34.3)
300 (100.0)
BPL 9 28 15 7 - - 52 7 59 APL 2 6 6 9 7 11 14 27 41
Phulpur
Total 11 (11.0)
34 (34.0)
21 (21.0)
16 (16.0)
7 (7.0)
11 (11.0)
66 (66.0)
34 (34.0)
100 (100.0)
BPL - 5 16 29 6 3 21 38 59 APL - 2 1 3 8 27 3 38 41
Bharatganj
Total - 7 (7.0)
17 (17.0)
32 (32.0)
14 (14.0)
30 (30.0)
24 (24.0)
76 (76.0)
100 (100.0)
BPL 87 (10.7)
296 (36.5)
205 (25.2)
172 (21.2)
30 (36.9)
22 (2.7)
588 (72.4)
224 (27.6)
812 (100.0)
APL 17 (2.9)
50 (8.7)
74 (12.8)
160 (27.7)
113 (19.6)
163 (28.2)
141 (24.4)
436 (75.6)
577 (100.0)
Card-less 2 (18.2)
8 (72.7)
-
1 (9.1)
- - 10 (90.9)
1 (9.0)
11 (100.0)
Total
Total 106 (7.6)
354 (25.3)
279 (19.9)
333 (23.8)
143 (10.2)
185 (13.2)
739 (52.8)
661 (47.2)
1400 (100.0)
Note: Income in Rs. (Yearly) 1=Below 5000, 2=5000-9000, 3=9001-11000, 4=11001-15000, 5=15001-20000 & 6=Above 20000.
* Classification of BPL households have been done on the basis of an income of Rs. 11,000 per household per year because this is the category approved for Eight Plan Period (1992-1997) by the Planning Commission, India.
Source: Field survey.

53
4.4 Distribution of Sample Households in Terms of Location of FPSs,
Number of FPSs at Village Level and Holding Pattern of Ration Cards and Distribution of Units
(a) Location of FPSs
Of the total households (1400) surveyed in 24 villages (in 4 Blocks) and 4 wards (in 2
Towns), 67.2 per cent get the FPS located within the village or within 1 km. from the location
(House) of the household. For 26.9 per cent of the households, the FPS is located at a
distance of more than 1 km. but less than 2 km. Only for 5.9 per cent of the
households, the FPS is located as a distance of more than 2 km. from the location
(House) of the household.
Of the 1400 households, 812 belong to the BPL category. Of these BPL households
67.6 per cent get the FPS within the distance of the first category, 25.5 per cent get the FPS
located by second category, and 6.9 percent in the third. For the APL households (577) the
distribution of FPSs by location is similar, as it is for the BPL families. There are inter-block
and inter-town variations in location of FPSs from the location (House) of the sample
households. For example, for the 300 households surveyed in Sankargarh Block, as high as
53.0 per cent reported that the FPSs were located at a distance of more than 1 km. but less
than 2 km. The extreme case (in terms of possible better services provided by FPS by
location) is shown by the Bharatganj town where all the households (100) surveyed reported
to have the FPS located within 1 km. from the residence. The second town selected, namely
Phulpur, also showed better access for households to FPS when 97.0 per cent of 100
households surveyed reported location of the FPS they are attached to within 1 km. of their
residence. Within Blocks, Saidabad Block represented easy access of households to FPS by
distance. For Saidabad Block, 94.7 per cent of the households reported to have the FPS
within the village or within one km. from the settled residence.
We covered 1200 households in 4 Blocks, distributed equally among Blocks, thus
each Block encompassing 300 households surveyed. We covered 200 households in 4 wards
of 2 Towns, distributed equally between towns. As we found, only for Sankargarh Block,
distance by location of the FPS is a major problem. In Sankargarh, one-fourth of the
households revealed that it was located at a distance more than 2 km. from the location of
residence (House). If we consider households by BPL and APL categories, we find the equi-
proportionate relation for both the categories vis-a-vis the distance by location of the FPS in
general (BPL+APL) (Table 4.14).

54
Table 4.14 Distance by Location of FPS from the Residences of Households
Distance of FPS from Households Block/Town Categories
In Village or within 1 km.
Between 1 and 2 km.
Above 2 km. Total
BPL 47 114 52 213 APL 18 39 23 80 Card-less 1 6 - 7
Shankargarh
Total 66 (22.0) 159 (53.0) 75 (25.0) 300 (100.0) BPL 108 42 4 154 APL 94 45 3 142 Card-less 4 - - 4
Karchhana
Total 206 (68.7) 87 (29.0) 7 (2.3) 300 (100.0) BPL 187 9 - 196 APL 97 7 - 104
Saidabad
Total 284 (94.7) 16 (5.3) - 300 (100.0) BPL 91 40 - 131 APL 97 71 1 169
Kaurihar
Total 188 (62.7) 111 (37.0) 1 (0.3) 300 (100.0) BPL 57 2 - 59 APL 40 1 - 41
Phulpur
Total 97 (97.0) 3 (3.0) - 100 (100.0) BPL 59 - - 59 APL 41 - - 41
Bharatganj
Total 100 (100.0) - - 100 (100.0) BPL 549 (67.6) 207 (25.5) 56 (6.9) 812 (100.0) APL 387 (67.1) 163 (28.2) 27 (4.7) 577 (100.0) Card-less 5 (45.6) 6 (54.5) - 11 (100.0)
Total Total 941 (67.2) 376 (26.9) 82 (5.9) 1400 (100.0) Note: Figures in parentheses denote row percentages. Source: Field survey. (b) Number of Fair Price Shops
Of the total households (1400) surveyed, 13.7 per cent reported to have no FPS in
their village while 78.8 per cent reported to have one FPS in the village. The distribution
network of FPSs thus centers around one FPS per revenue village as we studied.
Absence of FPS in a particular village does not imply that the households in that
particular village do not have access to items distributable through the FPSs. The fact may be
that these households are entitled to the essential items distributed through the FPSs in the
adjoining village outside the geographic boundary of the village where they are settled. Only
7.0 per cent of the households reported to have two FPSs in a single village where they are
settled. As low as 0.5 per cent of the households reported that they have as high as three
FPSs in their localities. No Block, constituting the rural region of the district, reported
existence of three FPSs in any village. These high numbers of three FPSs are located thus in
urban areas, the towns, namely Phulpur and Bharatganj. In addition, of the households (98)
reporting to have two FPSs in the locality, the percentage for urban areas is 69.38. Generally,
more than one FPS in a particular village implies probably that for Kerosene there is another
shop (owned by another license holder).
The overall location of FPSs in terms of distance (Km.) holds well when we examine
the households by categories like BPL and APL. For example, of the 812 BPL households,
76.6 per cent reported to have one FPS in the locality while 81.6 per cent of APL out of a total

55
of 577 reported to have one FPS in the village/town. There are inter-Block variations in
number of FPSs serving BPL and APL households and together (BPL+APL). For example, for
Karchhana Block, we find one shop in a village serving 99.0 per cent of the households (300)
while in Sankargarh the case of one shop in a village is serving 50.7 per cent of the
households (300). In between these lie the Blocks, Saidabad and Kaurihar, when the question
of one shop serving households between maximum and minimum is concerned. The case of
there being no FPS in the village is maximum in Sankargarh Block (19.0 per cent out of a total
of 300), followed by Kaurihar at 14.0 percent (out of a total of 300). The Blocks that are
relatively advanced in this respect are Saidabad and Karchhana, respectively showing 0.3
and 0.7 per cent of households without the facility of having a single shop in a village (Table
4.15). What we have talked here is about the distribution of households, and not distribution
of villages/towns, by number of FPSs located and hence offering services for households to
access.
Table 4.15 Distribution of Households on the Basis of Number of FPS at Village
Block/Town Categories Number of Households
No Shop One Shop Two Shops
Three Shops
Total
BPL 107 106 - - 213 APL 40 40 - - 80 Card-less - 6 1 - 7
Shankargarh
Total 147 (49.0)
152 (50.7)
1 (0.3)
- 300 (100.0)
BPL - 154 - - 154 APL 2 139 1 - 142 Card-less - 4 - - 4
Karchhana
Total 2 (0.7)
297 (99.0)
1 (0.3)
- 300 (100.0)
BPL - 181 15 - 196 APL 1 90 13 - 104
Saidabad
Total 1 (0.3)
271 (90.3)
28 (9.4)
- 300 (100.0)
BPL 16 115 - - 131 APL 26 143 - - 169
Kaurihar
Total 42 (14.0)
258 (86.0)
- - 300 (100.0)
BPL - 24 30 5 59 APL - 19 20 2 41
Phulpur
Total - 43 (43.0)
50 (50.0)
7 (7.0)
100 (100.0)
BPL - 42 17 - 59 APL - 40 1 - 41
Bharatganj
Total - 82 (82.0)
18 (18.0)
- 100 (100.0)
BPL 123 (15.1)
622 (76.6)
62 (7.6)
5 (0.6)
812 (100.0)
APL 69 (12.0)
471 (81.6)
35 (6.1)
2 (0.3)
577 (100.0)
Card-less - 10 (90.9)
1 (9.1)
- 11 (100.0)
Total
Total 192 (13.7)
1103 (78.8)
98 (7.0)
7 (0.5)
1400 (100.0)
Source: Field survey.

56
(c) Holding Pattern of Ration Cards among Households
Apart from 11 card-less cases, all the rest households from the total 1400 households
surveyed own at least one Ration Card. We found households, inside both BPL and APL, who
own more than one ration card. The BPL households who own two ration cards constitute 4.2
per cent of all BPL households (812) while APL households owing two ration cards constitute
6.1 per cent of the APL households (577). In totality (BPL+APL), 4.9 per cent of households
out of 1400 households have two ration cards. We also found households, inside both BPL
and APL, who own three or more ration cards. In totality such households (BPL+APL)
constitute 0.8 per cent of 1400 households; for BPL households (812), it is 0.7 per cent while
the APL households having three and above ration cards constitute 0.9 per cent of total APL
households (577). The BPL households owning two or more ration cards constitute 4.9 per
cent of all BPL households (812) while the APL households owning two or more ration cards
constitute 6.9 per cent of all APL households. There are inter-Block and inter-town variations
in holding pattern of ration cards (Table 4.16).
Table 4.16 Holding Pattern of Ration Cards of Households
Number of Ration Cards Two Three & Above Total
Block/Town Categories
BPL APL BPL APL BPL APL
Total*
BPL 10 1 - 1 10 2 213 APL 3 1 1 1 4 2 80 Card-less - - - - - - 7
Shankargarh
Total 13 (4.3)
2 (0.7)
1 (0.3)
2 (0.7)
14 (4.7)
4 (1.3)
300 (100.0)
BPL 8 12 3 2 11 14 154 APL 10 1 1 1 11 2 142 Card-less - - - - - - 4
Karchhana
Total 18 (6.0)
13 (4.3)
4 (1.3)
3 (1.0)
22 (7.3)
16 (5.3)
300 (100.0)
BPL 5 4 1 1 6 5 196 APL 7 2 - 1 7 3 104
Saidabad
Total 12 (4.0)
6 (2.0)
1 (0.3)
2 (0.7)
13 (4.3)
8 (2.7)
300 (100.0)
BPL 6 3 2 1 8 4 131 APL 15 18 3 1 18 19 169
Kaurihar
Total 21 (7.0)
21 (7.0)
5 (1.7)
2 (0.7)
26 (8.7)
23 (7.7)
300 (100.0)
BPL 2 2 - - 2 2 59 APL - - - - - - 41
Phulpur
Total 2 (2.0)
2 (2.0)
- - 2 (2.0)
2 (2.0)
100 (100.0)
BPL 3 1 - - 3 1 59 APL - 1 - 1 - 2 41
Bharatganj
Total 3 (3.0)
2 (2.0)
- 1 (1.0)
3 (3.0)
3 (3.0)
100 (100.0)
BPL 34 (4.2)
23 (2.8)
6 (0.7)
5 (0.6)
40 (4.9)
28 (3.4)
812 (100.0)
APL 35 (6.1)
23 (4.0)
5 (0.9)
5 (0.9)
40 (6.9)
28 (4.9)
577 (100.0)
Card-less - - - - - - 11 (100.0)
Total
Total 69 (4.9)
46 (3.3)
11 (0.8)
10 (0.7)
80 (5.7)
56 (4.0)
1400 (100.0)
Note: * These households already hold single ration card. Source: Field survey.

57
(d) Distribution of Units (in Existing Ration Cards)
The distribution of households (1400) in terms of cardholding shows equal number of
households surveyed (300) for each Block and equal number of households surveyed (100)
for each Town. The distribution of households in terms of units (in existing ration cards)
shows asymmetry, inter-Block and inter-town.
Of the total households (1400), the units came to be a total of 6302 that is a multiple
of 4.5. Of these total units (6302), BPL households for all Blocks and towns taken together
have 54.8 per cent and APL households, the rest 45.2 per cent. There are inter-Block and
inter-town variations in unit holding. Also, there are variations in distribution of units between
BPL and APL households within any particular Block. The most prominent of this variation is
shown by Sankargarh Block where 70.8 per cent of the units distributed (held) within the
Block go to the BPL households as opposed to 29.2 per cent for APL households. For
Karchhana, it is more or less equally distributed among BPL and APL households. For each
town also, access of BPL and APL households to units distributed is more or less equal.
(Table 4.17).
Table 4.17 Distribution of Units in Existing Ration Cards
Block/Town BPL APL Total
Shankargarh 894.5 (70.8)
368.5 (29.2)
1263 (100.0)
Karchhana 675.5 (50.3)
668.0 (49.7)
1343.5 (100.0)
Saidabad 845.0 (59.2)
582.0 (40.8)
1427.0 (100.0)
Kaurihar 545.0 (41.4)
770 (58.6)
1315.0 (100.0)
Phulpur 246.5 (50.2)
244.5 (49.8)
491.0 (100.0)
Bharatganj 247.0 (53.4)
215.5 (46.6)
462.5 (100.0)
Total 3453.5 (54.8)
2848.5 (45.2)
6302.0* (100.0)
Note: * Some units of false ration cards have also been included in these figures. Source: Field survey.
4.5 Gap Between Requirement and Distribution of Items Per Period, and Gap Between Market Price and FPS Price of Items at District Level
Let us consider the consumption requirements of the households of the essential
commodities distributed through the FPS and what is actually distributed, so that we may
derive the gap, if any, between these two. Let us see the gap item-wise and by economic
categories, BPL and APL.
For rice, for BPL households, the percentage gap between requirement and that
supplied by the FPS per family per month is 92.2. This means that only 7.8 per cent of the
requirement of rice by BPL households are covered by distribution by FPS. For wheat for BPL

58
families, only 8.7 per cent of requirement per period per family are covered by distribution by
FPS, the gap thus being 91.3 between quantity required and quantity distributed through FPS.
For sugar, for BPL families, the gap is 88.2, that is, 11.8 per cent of sugar required is supplied
through FPS. For kerosene, it is a different story, where for BPL families 77.3 per cent is
covered by FPS. By absolute quantity supplied only 2.7 kg. of rice per family per month is
supplied through FPS for BPL households, while the required quantity is 34.5 kg. For wheat
for BPL households, only 3.8 kg. is supplied through FPS while the required quantity is 43.5
kg. For sugar, the supplied quantity is 0.2 kg. when the requirement is only 1.7 kg. per family
per month for BPL households.
The similar scenario holds good for APL households in terms of the gap between
required quantity and received quantity, though the APL households are not entitled to rice
and wheat at same prices as paid by BPL households. For card-less cases, the households
somehow manage to get a little amount from the FPS, though generally they meet 95.0 per
cent of demand for rice and wheat through the open market and 100.0 per cent for sugar.
Surprisingly, the card-less households get 62.3 per cent of kerosene from FPSs.
The high gap between quantity of essential items required and that distributed
through FPS shows the insignificant contribution of FPS in meeting the consumption
requirements of households. It also signals at the necessity for increased quantity to be
supplied (for households) by the FPSs. What we observe is high requirement of rice and
wheat, on average 35.1 kg. and 44.6 kg. respectively across BPL and APL households, as
opposed to very low quantity of sugar required. On average, requirement of sugar per family
per month is 2.6 kg. for BPL and APL households taken together which is only 1.7 kg. for BPL
families. The major items in the consumption basket thus are rice and wheat, and more so for
BPL households.
Let us also look at what price per unit of items the households pay in the open market
and for distribution through FPS. This open market price is the price on average as reported
by the households and FPS price is the price actually charged on items by the FPS dealer (as
reported by households, FPS price charged often alleged to be higher than fixed FPS price).
The gap between these two prices, open market and FPS, is always positive, but not very
significant. For rice for BPL households, the gap between the two is 10.2 per cent, absolute
prices per kg. being Rs. 7.12 and Rs. 6.46 on average. For wheat for BPL households, the
gap between the two is only 1.4 per cent, while for sugar it is 28.0 per cent. The gap in price
is very significant for kerosene, it is 39.5 per cent for BPL households, the absolute gap being
Rs. 4 per liter.
For APL households similarly there is insignificant gap between market price and
FPS price for rice and wheat. The gap is significant for sugar. It is 3.92 per cent for sugar for
APL households. The prices paid by the APL households in the open market is always
marginally higher than the prices paid for the same items by the BPL households. The quality
of items bought by the respective households may explain this difference (Table 4.18 & Fig.
4.3a, b, c, d, e, f).

59
Table 4.18
Gap Between Requirement and Distribution of Items Per Month and Gap between Market Price and FPS Price of Items
Average Consumption of Items Average Rate of Items Items Category Require-ment per family per
month
Distribut-ed by
FPS per family per
month
Gap between require-
ment and sup. by FPS
FPS price (in Rs.)
Market price
(in Rs.)
Gap between market
price and FPS price
(in Rs.) BPL 34.5
(100.0) 2.7
(7.8) 31.8
(92.2) 6.46
(100.0) 7.12
(110.2) 0.66
(10.2) APL 36.3
(100.0) 0.4
(1.1) 35.9
(98.9) 6.77
(100.0) 7.29
(107.7) 0.52 (7.7)
Card-less 26.8 (100.0)
1.3 (4.9)
25.5 (95.1)
6.25 (100.0)
7.63 (122.1)
1.38 (22.1)
Rice (In kg.)
Total 35.1 (100.0)
1.7 (4.8)
33.4 (95.2)
6.22 (100.0)
7.19 (115.6)
0.97 (15.6)
BPL 43.5 (100.0)
3.8 (8.7)
39.7 (91.3)
5.03 (100.0)
5.10 (101.4)
0.07 (1.4)
APL 46.2 (100.0)
0.5 (1.1)
45.7 (98.4)
5.15 (100.0)
5.13 (99.6)
-0.02 (-0.4)
Card-less 40.9 (100.0)
1.8 (4.4)
39.1 (95.6)
5.16 (100.0)
5.18 (100.4)
0.02 (0.4)
Wheat (In kg.)
Total 44.6 (100.0)
2.4 (5.4)
42.2 (94.6)
5.05 (100.0)
5.11 (101.2)
0.06 (1.2)
BPL 1.7 (100.0)
0.2 (11.8)
1.5 (88.2)
13.59 (100.0)
17.40 (128.0)
3.81 (28.0)
APL 3.8 (100.0)
0.3 (7.9)
3.5 (92.1)
13.58 (100.0)
17.50 (128.9)
3.92 (28.9)
Card-less 0.3 (100.0)
- 0.3 (100.0)
13.75 (100.0)
17.33 (126.0)
3.58 (26.0)
Sugar (In kg.)
Total 2.6 (100.0)
0.2 (7.7)
2.4 (92.3)
13.59 (100.0)
17.43 (128.3)
3.84 (28.3)
BPL 4.4 (100.0)
3.4 (77.3)
1.0 (22.7)
10.10 (100.0)
14.09 (139.5)
3.99 (39.5)
APL 5.5 (100.0)
3.9 (70.9)
1.6 (29.1)
10.07 (100.0)
14.20 (141.0)
4.13 (41.0)
Card-less 5.3 (100.0)
3.3 (62.3)
2.0 (37.7)
10.05 (100.0)
14.54 (144.7)
4.49 (44.7)
Kerosene (In liters)
Total 4.8 (100.0)
3.6 (75.0)
1.2 (25.0)
10.09 (100.0)
13.50 (133.8)
3.41 (33.8)
Source: Field survey.

60
Average Consumption of Rice & Wheat in Sample Households
Rice for BPL 8%
92%
Rice for APL1%
99%
Rice for Card-less 5%
95%
Rice for All (Total) 5%
95%
Wheat for BPL9%
91%
Wheat for APL 1%
99%
Wheat for Card-less 4%
96%
Wheat for All (Total)5%
95%
Through FPS
Through Others Sources (Market Etc.)
Through FPS
Through Others Sources (Market Etc.)

61
Average Consumption of Sugar & Kerosene in Sample Households
Suga r for BP L
12%
88%
Suga r for AP L
8%
92%
Suga r for Ca rd-les s
100% 0%
Suga r for All (Tota l)8%
92%
Ke ros ene for BPL
77%
23%
Ke ros ene for APL
71%
29%
Ke ros ene for Card-le ss
62%
38%
Ke ros ene for All (Tota l)
75%
25%
Fig . 4.3b
Through FPS
Through Others S ources (M arket E tc .)
Through FPS
Through Others S ources (M arket E tc .)

62
4.5.1 Item-wise Gap by Quantity Distribution to Households at Block
Level Now we can elaborate on the gap between requirement and allotment of items, for
BPL and APL households, in its totality and also Block-wise and Town-wise.
For rice, the gap between required quantity by all households (BPL+APL+Cardless)
and received quantity (from FPS) is 33.4 kg. per month which shows a gap of 95.2 per cent.
For wheat the gap is 94.6 per cent, for sugar it is 92.3 per cent, and for kerosene it is 25.0 per
cent. The simple interpretation is that PDS has failed miserably in supplying essential
items to the population across board, both BPL and APL, excepting kerosene, if PDS
has any aim to fulfil most of the requirements of the target groups for essential
commodities through FPS.
Ave ra ge Ra te of Rice
0
1
2
3
4
5
6
7
8
9
B P L A P L Card- les s T otal
Fig . 4.3c
In R
s.
Ave ra ge Ra te of W h e a t
0
1
2
3
4
5
6
B P L A P L Card- les s T otal
Fig . 4.3d
In R
s.
Ave ra ge Ra te of S ug a r
0
2
4
6
8
1 0
1 2
1 4
1 6
1 8
2 0
B P L A P L Card- les s T otal
Fig . 4.3e
In R
s.
Ave ra te R a te of Ke ro se ne
0
2
4
6
8
1 0
1 2
1 4
1 6
B P L A P L Card- les s T otal
Fig . 4.3f
In R
s.
FP S P rice
M arket P ric e
FP S P rice
M arket P ric e
FP S P rice
M arket P ric e
FP S P rice
M arket P ric e

63
For BPL households, required average consumption of rice is 34.5 kg. per month per
household while the distributed quantity is only 2.7 kg, that is, 7.8 per cent of the required
quantity. For wheat, average consumption requirement per household per month is 43.5 kg.
while the distributed quantity is 3.3 kg, that is, 8.7 per cent of the required quantity. For sugar,
the required quantity per household per month is very meagre at 1.7 kg. of which 11.8 per
cent is distributed through the FPS. 77.3 per cent of consumption requirements for kerosene
for BPL households is met through the FPS.
APL households have a little higher requirement, per household per month, for all the
items, rice, wheat, sugar and kerosene, relative to the corresponding requirements of BPL
households. For rice, wheat, and kerosene they are marginally higher, while for sugar the
requirement of APL households is double that of BPL households per household per period.
Most of the requirements of APL households are met though open market, excepting
kerosene. The APL households receive only 1.1 per cent of each of rice and wheat required
from the FPSs, while they receive 7.9 per cent of sugar required for consumption per period,
and 70.9 per cent of the kerosene from the FPSs.
The card-less households do not receive sugar from the FPSs, but manage to get
rice, wheat and kerosene from these shops. The quantities of rice, wheat and kerosene that
these card-less households receive from FPSs fall well below those received by the BPL
cardholders. In any case, one simple interpretation is that the card-less cases need to
be taken care of by the administrative set up meant for the PDS network in the district.
We have consistent information on consumption requirements of essential items, by
regional division of the District of Allahabad, and by selection of Blocks and Towns. For
example, considering inter-Block variations in consumption requirement of rice per household
per month, we get the minimum at 34.5 kg. for each of Karchhana and Kaurihar Blocks and
maximum at 36.7 kg. for Sankargarh Block. The range of variation in consumption
requirement of rice for all (BPL+APL+Cardless) thus is 2.2 kg. per household per month, inter
Block-wise. For wheat, the range of variation in requirement for all households blockwise is
6.2 kg. per household per month, the maximum requirement being 47.9 kg. for Saidabad
Block and the minimum being 41.7 kg. for Kaurihar Block. For sugar, the requirement for all
households Block-wise lies between 2.1 kg. at minimum for each of Sankargarh and Kaurihar
Blocks and 2.9 kg. at maximum for Karchhana Block. The range of variation in consumption
requirement of Sugar (Block-wise) per household per month thus is 0.8 kg. If we look at
consumption requirement of essential items in urban areas, we find that for rice it is a wide
variation between 20.6 kg. for Bharatganj town and 36.4 kg. for Phulpur town. For wheat also,
the requirement in Phulpur is 46.5 kg., far more than the requirement in Bharatganj which is
34.4 kg. per month per household.
In terms of consumption requirements for items by specific economic categories,
there is consistency across Blocks in the District. For example, for rice the requirements of
BPL households vary between the minimum at 34.5 kg. for Karchhana and 37.4 kg. for
Sankargarh, a gap in inter-village requirement of rice for BPL households estimated at 2.9 kg.

64
For wheat, for BPL households, the inter-Block variation in consumption requirement is
estimated at 5.6 kg., the maximum being 46.9 kg. for Sankargarh and the minimum being
41.3 kg. for Kaurihar. The simple interpretation is that there exists a minimum
requirement of BPL households for at least rice and wheat, which are very significant
by quantity in the consumption basket. The average requirement of rice and wheat per
BPL Household per period can also be calculated.
For BPL households, the estimated range of variation among Blocks in consumption
requirement of sugar per household per month is 0.8 kg., the maximum at 2.1 kg. for each of
Sankargarh and Saidabad while the minimum is at 1.4 kg. for Kaurihar. There thus exist
minimum and average (with hypothetical maximum at given prices) requirement for
sugar for BPL households for all the Blocks taken together.
We have calculated the average requirements of items for BPL and APL
households separately and together that may be taken as yardstick for consideration
by the administrative division in the PDS network for supply through the FPSs. These
average figures, that is, consumption requirements for each item, are approximations
that aim at covering the average consumption requirements of households.
So far, for each Block and Town surveyed the distribution of items on the
average accounts for very insignificant percentage of requirements. While for
Sankargarh this percentage (distribution as a percentage of requirements) is as high as 11.2
per cent for rice, for Saidabad it is 0.5 per cent. In between these extremes lie Kaurihar at 4.6
per cent and Karchhna at 6.4 per cent. For the towns, Phulpur and Bharatganj, the
percentages stand at 0.8 and 1.0 respectively. Saidabad thus draws tremendous attention
as far as allotment of rice is concerned. The same calculation for wheat allotment, as a
percentage of requirement per household per month, is as high as 9.4 for Sankargarh and as
low as 0.8 for Saidabad. For the towns, the distribution percentages for wheat are 1.3 and 1.2
respectively for Phulpur and Bharatganj. The Block that draws attention in terms of
necessity to distribute more of wheat is again Saidabad. As we saw, the gap between
requirement and distribution is highest for Saidabad for rice and wheat, respectively at 99.5
and 99.4 per cent. Saidabad does not represent a Block with much higher average
requirement. The fact is that very low distribution rather than high requirement explain
the large gap between requirement and distribution for Saidabad, so far as rice and
wheat are concerned. Saidabad draws more attention though the fact remains valid for
all the Blocks studied that distribution of essential items offers a very poor picture
relative to required consumption.
As far as sugar is concerned, distribution as percentage of requirement stood at as
high as 9.5 per cent for Sankargarh and Kaurihar, and as low as 6.9 per cent for Karchhana,
and 7.1 per cent for Saidabad. As a percentage, the gap between requirement and
distribution being met by open market for sugar stands at more than 90.0 per cent for all the
Blocks. However, the fact is that the absolute requirement of sugar per household per month
is very low for each of these Blocks, lying between 2.1 kg. and 2.9 kg. The requirement for

65
sugar is still lower for BPL households in the Blocks. The households in towns, Phulpur and
Bharatganj, satisfy more of the requirements for sugar through the FPSs, relative to the
villages in Blocks. The requirements for sugar for households in towns are also low, 2.6 kg.
on average.
Kerosene has a steady supply through the FPSs, the distribution as a percentage of
requirement being 75.0 for all the Blocks and towns. For Saidabad and Kaurihar, the
distribution as percentage of requirement is poorer (around 65.0 per cent) relative to those for
Sankargarh (at 82.7 per cent) and Karchhana (at 73.3 per cent). This happens when the
average consumption requirement of sugar is as low as 4.5 liter for Kaurihar and 4.6 liter for
Saidabad, relative to a little higher at 5.2 liter for Sankargarh and as equal as 4.5 liter for
Karchhana. Since requirement of Kerosene is satisfied more or less equally across
economic categories, BPL and APL, hence increased allotment of Kerosene in FPSs, is
meant to offer benefits to both types of households (Table 4.19).
4.5.2 Item-wise Price-Differential between Open Market and FPSs at Block Level
Earlier we talked about 'quantity gap' between required consumption and distribution
of items through FPS, Block-wise, Town-wise, for BPL and APL households, and for the
district as a whole. Now we try to point out the price-differential item-wise between open
market and FPS.
For rice, the gap in price per unit between open market and FPS for all households,
BPL and APL, in all Blocks and Towns, that is for the District on the average is Rs. 0.97 which
is 15.6 per cent of FPS price (Rs. 6.22 on average). For wheat, the absolute gap is Rs. 0.06,
that is, 1.2 per cent of FPS price (Rs. 5.05 on average). For sugar, the gap is Rs. 3.84, which
is 28.3 per cent of FPS price (Rs. 13.59 on average). For kerosene, the gap is Rs. 3.41,
which is 33.8 per cent of FPS price (Rs. 10.09 on average). This positive 'price gap' is
more or less equally applicable for BPL and APL households in the District as a whole
for rice, sugar and kerosene, but not for wheat. For wheat for BPL households, the gap is
1.4 per cent of FPS price reported for BPL households (Rs. 5.03) while the gap is negative at
-0.4 per cent for APL households for whom the FPS price is recorded at Rs. 5.15. Open
market rate for wheat differs insignificantly between BPL and APL households, for BPL
households it is Rs. 5.10 per kg. and for APL households it is Rs. 5.13 per kg. For calculating
the gap between open market price and FPS price, we have taken FPS price as base (with an
index of 100.0). The prices we record are the prices reported by the households, the
prices they pay while they buy the items (same quality) in the open market and from
the FPS. Each of sugar and kerosene has approximately equal price for BPL and APL
households as they receive these items from FPSs considered on average for the district as a
whole. For sugar, the FPS price is Rs. 13.59 for BPL households and Rs. 13.58 for APL
households. For kerosene, it is Rs. 10.10 for BPL households and Rs. 10.07 for APL
households.

66
Table 4.19 Requirement and Distribution of Items Per month and Gap between Requirement and Distribution Per month
Average Distribution of Items from FPS Gap between Requirement and Received Items Average Consumption of Required Items Block/Town Category
Rice (In kg.)
Wheat (In kg.)
Sugar (In kg.)
Kerosene (In liters)
Rice (In kg.)
Wheat (In kg.)
Sugar (In kg.)
Kerosene (In liters)
Rice (In kg.)
Wheat (In kg.)
Sugar (In kg.)
Kerosene (In liters)
BPL 4.8 4.9 0.1 3.9 32.6 42.0 1.2 0.8 37.4 46.9 1.3 4.7 APL 2.3 3.2 0.5 5.4 32.7 42.8 3.8 1.0 35.0 46.0 4.3 6.4 Card-less - - - 4.0 35.0 52.8 0.3 2.3 35.0 52.8 0.3 6.3
Shankargarh
Total 4.1 (11.2)
4.4 (9.4)
0.2 (9.5)
4.3 (82.7)
32.6 (88.8)
42.4 (90.6)
1.9 (90.5)
0.9 (17.3)
36.7 (100.0)
46.8 (100.0)
2.1 (100.0)
5.2 (100.0)
BPL 3.9 6.8 0.2 3.1 30.5 38.0 1.6 0.8 34.4 44.8 1.8 3.9 APL 0.2 0.3 0.2 3.5 35.1 44.8 3.9 1.7 35.3 45.1 4.1 5.2 Card-less 3.7 5.0 - 2.2 8.8 15.0 0.2 1.3 12.5 20.0 0.2 3.5
Karchhana
Total 2.2 (6.4)
3.7 (8.3)
0.2 (6.9)
3.3 (73.3)
32.3 (93.6)
40.9 (91.7)
2.7 (93.1)
1.2 (26.7)
34.5 (100.0)
44.6 (100.0)
2.9 (100.0)
4.5 (100.0)
BPL 0.2 0.5 0.1 2.6 35.2 43.9 2.0 1.5 35.4 44.4 2.1 4.1 APL - - 0.4 3.8 46.6 54.8 3.6 1.8 46.6 54.8 4.0 5.6
Saidabad
Total 0.2 (0.5)
0.3 (0.6)
0.2 (7.1)
3.0 (65.2)
39.1 (99.5)
47.6 (99.4)
2.6 (92.9)
1.6 (34.8)
39.3 (100.0)
47.9 (100.0)
2.8 (100.0)
4.6 (100.0)
BPL 3.6 5.6 0.1 2.8 32.0 35.7 1.3 1.4 35.6 41.3 1.4 4.2 APL - - 0.2 2.9 33.6 42.1 2.5 1.8 33.6 42.1 2.7 4.7
Kaurihar
Total 1.6 (4.6)
2.4 (5.7)
0.2 (9.5)
2.9 (64.4)
32.9 (95.4)
39.3 (94.2)
1.9 (90.5)
1.6 (35.6)
34.5 (100.0)
41.7 (100.0)
2.1 (100.0)
4.5 (100.0)
BPL 0.5 1.1 0.3 5.1 34.5 42.5 2.0 0.6 35.0 43.6 2.3 5.7 APL - - 0.4 5.3 38.5 50.6 3.5 1.2 38.5 50.6 3.9 6.5
Phulpur
Total 0.3 (0.8)
0.6 (1.3)
0.3 (10.3)
5.2 (86.7)
36.1 (99.2)
45.9 (98.7)
2.6 (89.7)
0.8 (13.3)
36.4 (100.0)
46.5 (100.0)
2.9 (100.0)
6.0 (100.0)
BPL 0.4 0.8 0.3 4.4 17.4 28.2 1.8 0.3 17.8 29.0 2.1 4.7 APL - - 0.7 5.4 24.7 42.2 4.4 0.9 24.7 42.2 5.1 6.3
Bharatganj
Total 0.2 (1.0)
0.4 (1.2)
0.5 (14.7)
4.8 (88.9)
20.4 (99.0)
34.0 (98.8)
2.9 (85.3)
0.6 (11.1)
20.6 (100.0)
34.4 (100.0)
3.4 (100.0)
5.4 (100.0)
BPL 2.7 (7.8)
3.8 (8.7)
0.2 (11.8)
3.4 (77.3)
31.8 (92.2)
39.7 (91.3)
1.5 (88.2)
1.0 (22.7)
34.5 (100.0)
43.5 (100.0)
1.7 (100.0)
4.4 (100.0)
APL 0.4 (1.1)
0.5 (1.1)
0.3 (7.9)
3.9 (70.9)
35.9 (98.9)
45.7 (98.9)
3.5 (92.1)
1.6 (29.1)
36.3 (100.0)
46.2 (100.0)
3.8 (100.0)
5.5 (100.0)
Card-less 1.3 (4.8)
1.8 (4.4)
- 3.3 (62.3)
25.5 (95.2)
39.1 (95.6)
0.3 (100.0)
2.0 (37.7)
26.8 (100.0)
40.9 (100.0)
0.3 (100.0)
5.3 (100.0)
Total
Total 1.7 (4.8)
2.4 (5.4)
0.2 (7.7)
3.6 (75.0)
33.4 (95.2)
42.2 (94.6)
2.4 (92.3)
1.2 (25.0)
35.1 (100.0)
44.6 (100.0)
2.6 (100.0)
4.8 (100.0)
Source: Field survey.

67
There are inter-regional (Block-wise) variations in 'price gap' item-wise. For rice, the
gap is maximum at 16.6 per cent for Kaurihar, followed by Saidabad at 14.4 per cent, and
minimum at 6.9 per cent for Sankargarh. For Karchhana, the gap is 14.0 per cent. All these
percentages are calculated with FPS as the base price with 100.0 as the index. The problem
is that there are inter-Block variations in the reported (by households) FPS price. Thus, we
need to look at absolute gap also in Rupee terms per unit of items bought by the households.
For Kaurihar the 'absolute price gap' for rice is Rs. 1.04 while for Karchhana it is Rs. 0.89, for
Sankargarh it is Rs. 0.47 and for Saidabad it is Rs. 0.34. The absolute magnitude of the
price gap for rice thus differs from the percentage magnitude of the price gap,
excepting Kaurihar Block, for rice. The variations in inter-Block FPS price for rice is
however marginal, between Rs. 6.25 for Kaurihar at minimum and Rs. 6.84 at maximum, the
prices being averages of 'price reports' by all BPL and APL households in the Blocks
surveyed.
For wheat the price gap varied between as high as 4.8 per cent for Karchhana and as
low as -2.7 percent for Sankargarh. This means that for Sankargarh the open market price
was lower than FPS price for wheat during the period of survey. The reasons for buying
wheat from FPS in Sankargarh thus may lie elsewhere, and not in 'price gap'. The reported
FPS price for wheat varied between maximum at Rs. 5.19 for Sankargarh and minimum at
Rs. 4.91 for Saidabad, these are average wheat prices for the Blocks, as reported by all the
respondents from BPL and APL households. Calculated on this very low range of
variation in 'reported FPS price', the 'absolute magnitude of price gap' for wheat stands
maximum at Rs. 0.24 for Karchhana and minimum at -0.14 for Sankargarh.
For sugar the percentage price gap is highest for Karchhana at 29.1 and lowest at
27.5 for Saidabad. Sankargarh shows a price gap of 27.6 per cent for sugar while for Kaurihar
it is 27.7 per cent. Thus, inter-Block variations in reported price gap by percentage are very
low. The reported FPS absolute price for sugar is confined to a very low range of variation for
Blocks, maximum being reported for Saidabad at Rs. 13.72, and minimum at Rs. 13.53 for
Kaurihar. The reported absolute price gap differs from percentage price gap for sugar
considered over blocks, the reasons being both differences in 'reported FPS prices'
and 'reported open market prices' for items.
For kerosene the 'percentage price gap' varies between the maximum at 41.8 for
Karchhana and the minimum at 38.5 for Sankargarh. The 'absolute price gap' shows the
maximum at Rs. 4.27 for Karchhana and the minimum at Rs. 3.85 for Sankargarh. The
'reported absolute price' for kerosene stood at Rs. 10 per liter for each of Kaurihar and
Sankargarh, the lowest, and maximum at Rs. 10.24 for Karchhana, followed by Rs. 10.16 for
Saidabad. For Kerosene, there is one-to-one correspondence between 'absolute price
gap' and 'percentage price gap' considered over blocks in the District.
As reported, both BPL and APL households avail from FPSs all the items, rice,
wheat, sugar, and kerosene at same or similar prices. For example, while the 'average FPS
price' for rice was Rs. 6.46 for BPL households (average over all Blocks and towns), for APL
68
households it was Rs. 6.77, higher by only Rs. 0.31. For wheat, the 'reported average FPS
price' was Rs. 5.03 for BPL households and Rs. 5.15 for APL households, higher for APL
households by Rs. 0.12 only. For sugar for BPL households, the 'reported average FPS price'
is Rs. 13.59, while for APL households, it is Rs. 13.58. For kerosene for BPL families it is Rs.
10.07 and for APL households, Rs. 10.05. The inter-regional (Block-wise and Town-wise)
variations in reported FPS price per item is also not significant, considering over BPL
and APL households. In other words, both BPL and APL households pay same or
similar prices for essential items in all the Blocks and Towns. There is also not much
variation in open market rates as bought by BPL and APL households of the items considered
as reported by the respondents from households (Table 4.20).
4.6 Required Expenditure by Households on Essential Commodities (at both Market Price and FPS Price)
To get market-based expenditure of households, we have multiplied actual quantity of
the commodity required by (average) market price. This market price per unit of the item is
based on the information provided by the households. To get FPS-based expenditure, we
have multiplied actual quantity of the commodity required by FPS price. What we find is that
for both BPL and APL households, FPS-based expenditure accounted for around 90.0 per
cent of market-based expenditure. The expenditure by households has been calculated in
Rupee terms over all the items distributed, namely, wheat, rice, sugar, and kerosene. We
have calculated the annual expenditure of households, on the assumption of required
quantity actually supplied (received by households), in the market and through FPS.
The implication is that at least 10.0 per cent of expenditure can be saved by
households, both BPL and APL, if the required quantity is supplied through FPS. The
price prevailing in the (open) market as responded by the households is by no means
an overestimation, as reflected by the willingness of a major section of the households
to buy from the open market.
The FPS price reported (as being paid by the households) is higher than the price
fixed for distribution purposes. If we multiply the actual quantity of commodities supplied by
the FPS by the (actually charged) price the households pay, we get (actual) expenditure on
FPS items (quantities) bought by the households. This actual expenditure on FPS items
constitutes 12.6 per cent of market-based expenditure for BPL households and 7.5 per cent
for APL households. For both BPL and APL households taken together, actual expenditure on
FPS items constitutes only 10.0 per cent of market-based expenditure. Thus, FPS
distributed items at FPS charged prices (prices higher than what is fixed) show not
only a huge gap (90.0 per cent) between required expenditure on essential items (by
consumption requirements of households) and expenditure incurred by households at
FPS level, but also the scope for increased distribution of items.
While market price (as reported by the households) is higher than the FPS price
actually charged on households (the latter being higher than the FPS price fixed), for APL
households market price is higher than the corresponding market price for BPL households.
The reason may lie in quality-differential of the same items bought in the open market.

69
Table 4.20 Price Gap between Fair Price Shop and Open Market, Item-wise
Block/Town Category Rice (Rs./kg.) Wheat (Rs./kg.) Sugar (Rs./ kg.) Kerosene (Rs./liters)
FPS Market Gap FPS Market Gap FPS Market Gap FPS Market Gap BPL 6.82 7.23 0.41 5.18 5.21 -0.03 13.55 17.34 3.79 10.01 13.90 3.89 APL 6.91 7.49 0.58 5.20 5.05 -0.15 13.64 17.31 3.67 10.00 13.66 3.66 Card-less - 7.64 7.64 5.50 5.04 -0.46 13.50 17.33 3.87 10.00 14.57 4.57
Shankargarh
Total 6.84 (100.0)
7.31 (106.9)
0.47 (6.9)
5.19 (100.0)
5.05 (97.3)
-0.14 -(2.7)
13.59 (100.0)
17.34 (127.6)
3.75 (27.6)
10.00 (100.0)
13.85 (138.5)
3.85 (38.5)
BPL 6.35 7.03 0.68 4.94 5.18 0.24 13.64 17.73 4.09 10.25 14.46 4.21 APL 6.50 7.25 0.75 5.00 5.21 0.21 13.73 17.58 3.85 10.22 14.59 4.37 Card-less 6.25 7.62 1.37 5.00 5.12 0.12 14.00 17.00 3.00 10.16 14.25 4.09
Karchhana
Total 6.35 (100.0)
7.24 (114.0)
0.89 (14.0)
4.95 (100.0)
5.19 (104.8)
0.24 (4.8)
13.67 (100.0)
17.65 (129.1)
3.98 (29.1)
10.24 (100.0)
14.52 (141.8)
4.27 (41.8)
BPL 6.33 6.65 1.32 4.91 4.98 0.07 13.74 17.39 3.65 10.18 14.29 4.11 APL - 6.71 6.71 - 4.98 4.98 13.68 17.52 3.84 10.11 14.31 4.20
Saidabad
Total 6.33 (100.0)
6.67 (114.4)
0.34 (14.4)
4.91 (100.0)
4.98 (101.4)
0.07 (1.4)
13.72 (100.0)
17.49 (127.5)
3.77 (27.5)
10.16 (100.0)
14.30 (140.7)
4.14 (40.7)
BPL 6.16 7.40 1.24 5.00 5.07 0.07 13.50 17.11 3.61 10.00 13.57 3.57 APL 6.26 7.41 1.15 5.00 5.06 0.06 13.53 17.41 3.88 10.00 14.21 4.21
Kaurihar
Total 6.25 (100.0)
7.29 (116.6)
1.04 (16.6)
5.00 (100.0)
5.07 (101.4)
0.07 (1.4)
13.53 (100.0)
17.28 (127.7)
3.75 (27.7)
10.00 (100.0)
13.93 (139.3)
3.93 (39.3)
BPL 6.38 6.95 0.57 4.91 5.12 0.21 13.39 17.44 4.05 10.00 14.18 4.18 APL - 7.07 7.07 - 5.09 5.09 13.41 17.54 4.13 10.00 14.34 4.34
Phulpur
Total 6.38 (100.0)
7.00 (109.7)
0.62 (9.7)
4.91 (100.0)
5.11 (104.1)
0.20 (4.1)
13.39 (100.0)
17.48 (130.5)
4.09 (30.5)
10.00 (100.0)
14.25 (142.5)
4.25 (42.5)
BPL 6.26 7.73 1.47 4.95 5.46 0.51 13.64 17.61 3.97 10.21 14.22 4.01 APL - 8.18 8.18 - 5.66 5.66 13.50 17.74 4.24 10.01 13.41 3.40
Bharatganj
Total 6.26 (100.0)
9.77 (156.1)
3.51 (56.1)
4.95 (100.0)
5.54 (111.9)
0.59 (11.9)
13.57 (100.0)
17.66 (130.1)
4.09 (30.1)
10.13 (100.0)
13.89 (137.1)
3.76 (37.1)
BPL 6.46 (100.0)
7.12 (110.2)
0.66 (10.2)
5.03 (100.0)
5.10 (101.4)
0.07 (1.4)
13.59 (100.0)
17.40 (128.0)
3.81 (28.0)
10.10 (100.0)
14.09 (139.5)
3.99 (39.5)
APL 6.77 (100.0)
7.29 (107.7)
0.52 (7.7)
5.15 (100.0)
5.13 (99.6)
-0.02 -(0.4)
13.58 (100.0)
17.50 (128.9)
3.92 (28.9)
10.07 (100.0)
14.20 (141.0)
4.13 (41.0)
Card-less 6.25 (100.0)
7.63 (122.1)
1.38 (22.1)
5.16 (100.0)
5.18 (100.4)
0.02 (0.4)
13.75 (100.0)
17.33 (126.0)
3.58 (26.0)
10.05 (100.0)
14.54 (144.7)
4.49 (44.7)
Total
Total 6.22 (100.0)
7.19 (115.6)
0.97 (15.6)
5.05 (100.0)
5.11 (101.2)
0.06 (1.2)
13.59 (100.0)
17.43 (128.3)
3.84 (28.3)
10.09 (100.0)
13.50 (133.8)
3.41 (33.8)
Source: Field survey.
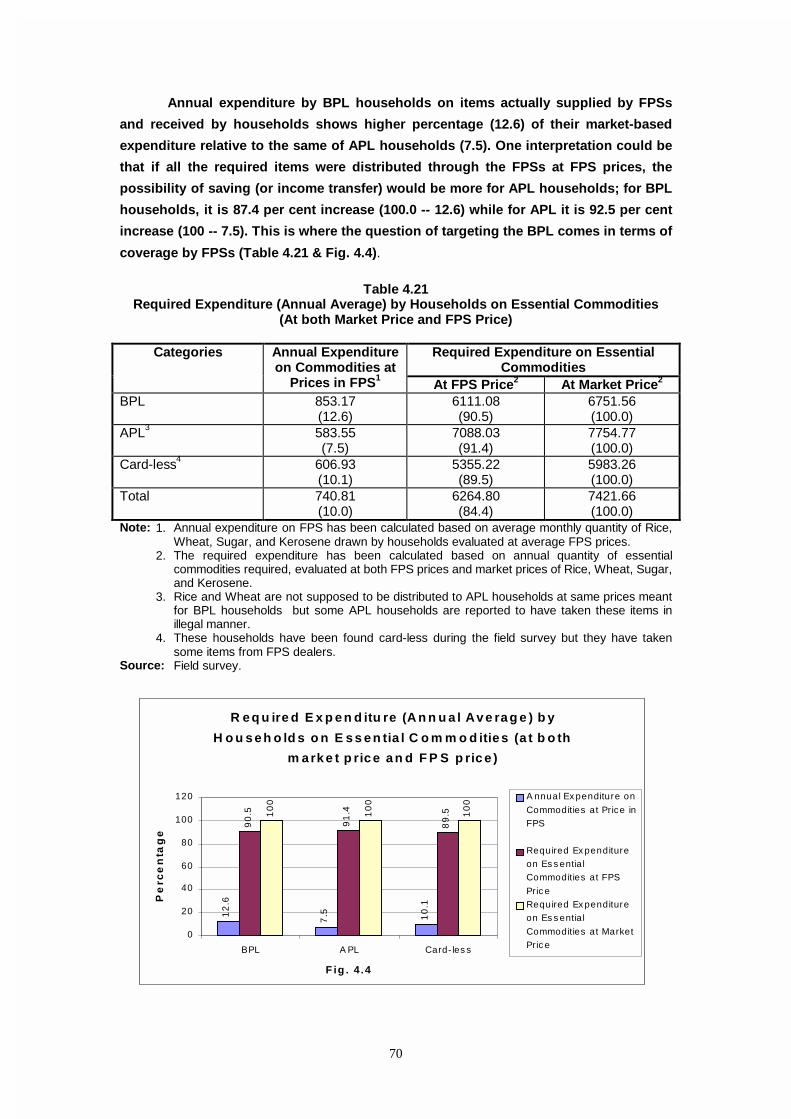
70
Annual expenditure by BPL households on items actually supplied by FPSs
and received by households shows higher percentage (12.6) of their market-based
expenditure relative to the same of APL households (7.5). One interpretation could be
that if all the required items were distributed through the FPSs at FPS prices, the
possibility of saving (or income transfer) would be more for APL households; for BPL
households, it is 87.4 per cent increase (100.0 -- 12.6) while for APL it is 92.5 per cent
increase (100 -- 7.5). This is where the question of targeting the BPL comes in terms of
coverage by FPSs (Table 4.21 & Fig. 4.4).
Table 4.21
Required Expenditure (Annual Average) by Households on Essential Commodities (At both Market Price and FPS Price)
Required Expenditure on Essential
Commodities Categories Annual Expenditure
on Commodities at Prices in FPS1
At FPS Price2 At Market Price2
BPL 853.17 (12.6)
6111.08 (90.5)
6751.56 (100.0)
APL3 583.55 (7.5)
7088.03 (91.4)
7754.77 (100.0)
Card-less4 606.93 (10.1)
5355.22 (89.5)
5983.26 (100.0)
Total 740.81 (10.0)
6264.80 (84.4)
7421.66 (100.0)
Note: 1. Annual expenditure on FPS has been calculated based on average monthly quantity of Rice, Wheat, Sugar, and Kerosene drawn by households evaluated at average FPS prices.
2. The required expenditure has been calculated based on annual quantity of essential commodities required, evaluated at both FPS prices and market prices of Rice, Wheat, Sugar, and Kerosene.
3. Rice and Wheat are not supposed to be distributed to APL households at same prices meant for BPL households but some APL households are reported to have taken these items in illegal manner.
4. These households have been found card-less during the field survey but they have taken some items from FPS dealers.
Source: Field survey.
R e q u ire d E x p e n d itu re (A n n u a l Av e ra g e ) b y
H o u s e h o ld s o n E s s e n tia l C o m m o d itie s (a t b o th
m a rk e t p ric e a n d F P S p ric e )
12
.6
7.5 10
.1
90
.5
91
.4
89
.510
0
10
0
10
0
0
20
40
60
80
100
120
BPL A PL Card- les s
F ig . 4 .4
Pe
rce
nta
ge
A nnual Ex penditure on
Commodities at Price in
FPS
Required Ex penditure
on Es s entia l
Commodities at FPS
Pric e
Required Ex penditure
on Es s entia l
Commodities at Market
Pric e

71
4.7 Regularity in Purchasing Items from FPSs
We inquired about whether or not the households purchase items regularly from the
FPSs. If yes, how much, and if not, why not. Let us examine the response we got.
In totality, over all the Blocks and Towns surveyed, covering both BPL and APL, we
find 84.9 per cent of households responded as not buying rice and wheat regularly from
FPSs. Non-regular purchase of foodgrains (rice and wheat) covers 76.7 per cent of all BPL
households, while for APL households it is 96.5 per cent. For sugar, the overall percentage of
households showing non-regular purchase is 60.6, it is 66.3 percent for BPL households while
it is 52.2 per cent for APL households. The case of 'regular purchase' for kerosene covers
98.5 per cent of households of which percentage for BPL households is 98.4 and APL
households, 98.0. The percentages of BPL and APL households as regular buyers of items
are calculated taking total number of households in the respective categories in the
denominator. Thus, only kerosene as an essential item satisfies the objective of regular
purchase by households, independent of the price per unit of kerosene.
There are high inter-regional (Blockwise and Townwise) variations in terms of
regularity of items bought by households, and BPL and APL separately in a particular Block.
For example, for Karchhana, the percentage of households reported to be buying rice and
wheat 'non-regularly' is the maximum at 84.0 while it is minimum at 50.3 for Saidabad. For the
urban areas this incidence of non-regular purchase of rice and wheat by households is very
high, for Bharatganj it covers 95.0 per cent of the households while for Phulpur it is 92.0 per
cent. The inter-Block variation in non-regular purchase of sugar ranges from the maximum at
74.3 per cent of the households for Sankargarh and the minimum at 49.7 per cent for
Saidabad. In between these lie Kaurihar and Karchhana. For kerosene, the inter-Block and
inter-Town variations in non-regular purchase do not carry much operational meaning since
nearly cent per cent of households in all the Blocks and Towns regularly purchase kerosene.
The households, total, Blockwise and Townwise, thus are unequally distributed so far as
regular or non-regular purchase of items are concerned. While for kerosene the response
to supply by FPSs is same or similar for all households, BPL and APL, over all Blocks
and Towns, for each of rice, wheat, and sugar the response is poor in terms of regular
purchases from FPSs. There are intra-block and intra-town differences between BPL and
APL households in terms of non-regular purchases of essential items (Table 4.22).

72
Table 4.22 Regularity in Purchasing Items from FPSs by Households
Block/Town Categories Foodgrains Sugar Kerosene Yes No Yes No Yes No
Total
BPL 56 157 35 178 211 2 213 APL 17 63 42 38 74 6 80 Card-less - 7 - 7 7 - 7
Shankargarh
Total 73 (24.3)
227 (75.7)
77 (25.7)
223 (74.3)
292 (97.3)
8 (2.7)
300 (100.0)
BPL 43 111 57 97 148 6 154 APL 3 139 34 108 141 1 142 Card-less 2 2 1 3 3 1 4
Karchhana
Total 48 (16.0)
252 (84.0)
92 (30.7)
208 (69.3)
292 (97.3)
8 (2.7)
300 (100.0)
BPL 12 184 80 116 193 3 196 APL - 104 71 33 104 - 104
Saidabad
Total 12 (4.0)
288 (96.0)
151 (50.3)
149 (49.7)
297 (99.0)
3 (1.0)
300 (100.0)
BPL 65 66 42 89 130 1 131 APL - 169 61 108 169 - 169
Kaurihar
Total 65 (21.7)
235 (78.3)
103 (34.3)
197 (65.7)
299 (99.7)
1 (0.3)
300 (100.0)
BPL 8 51 30 29 59 - 59 APL - 41 31 10 41 - 41
Phulpur
Total 8 (8.0)
92 (92.0)
61 (61.0)
39 (39.0)
100 (100.0)
- 100 (100.0)
BPL 5 54 30 29 58 1 59 APL - 41 37 4 41 - 41
Bharatganj
Total 5 (5.0)
95 (95.0)
67 (67.0)
33 (33.0)
99 (99.0)
1 (1.0)
100 (100.0)
BPL 189 (23.3)
623 (76.7)
274 (33.7)
538 (66.3)
799 (98.4)
13 (1.6)
812 (100.0)
APL 20 (3.5)
557 (96.5)
276 (47.8)
301 (52.2)
570 (98.8)
7 (1.2)
577 (100.0)
Card-less 2 (18.2)
9 (81.8)
1 (9.1)
10 (90.9)
10 (90.9)
1 (9.1)
11 (100.0)
Total
Total 211 (15.1)
1189 (84.9)
551 (39.4)
849 (60.6)
1379 (98.5)
21 (1.5)
1400 (100.0)
Note: Foodgrains imply rice and wheat. Source: Field survey. 4.7.1 Reasons for Non-Regular Purchase of Rice, Wheat, and Sugar from
FPSs Let us consider now the basic reasons (may not be exhaustive) behind 'non-regular
purchase' of essential items by households, BPL and APL, from FPSs. As far as rice and
wheat are concerned, 40.7 per cent of the households (1400) reported that these items are
not distributed or distributed very infrequently. The BPL households of the total (570), who
responded by citing 'non-distribution of these items', constituted higher percentage relative to
APL households. Next, come two major reasons for non-regular purchase of rice and wheat
from FPS, namely, 'non-allotment' for APL and 'unfelt need for items distributed through FPS'.
These three reasons cover more than 70.0 per cent of all the households citing various
reasons (often overlapping reasons) for non-regular purchase from FPSs. For example, the

73
'poor quality of items', the 'low market rate prevailing for items', 'irregular distribution through
FPSs', 'information not available' may explain partially the reason cited as 'No need for FPS
items'. Among other reasons cited comes' absence of disposable money at a point of time'.
As such, the reasons, though seem to be overlapping, show the dissection of reasons
rooted in less than perfect functioning of the PDS network so far as rice and wheat are
concerned. The relative weights on these reasons also differ between BPL and APL
households. For example, for BPL households 'absence of disposable money at a point of
time' is a major explanatory factor for non-regular purchase of rice and wheat, while for APL
households it is not. In addition to 'weight-differential', the reasons cited by the respective
categories of households, BPL and APL, sometimes seem confusing. For example, 'low
market rate' for the item (rice and wheat) is cited more by BPL households (89.6 per
cent constituted by BPL category in this reason) relative to APL households. It may be
that the BPL families respond more to lower rate prevailing in the open market relative to the
response to higher rate by APL households for slightly differentiated products of the same,
say, rice or wheat (Table 4.23).
Table 4.23 Reasons for Non-Regular Purchase of Foodgrains from FPSs
Reasons BPL APL Card-less Total
Non-distributed items 380 (46.8)
186 (32.2)
4 (36.4)
570 (40.7)
No need for FPS items 73 (9.0)
129 (22.4)
- 202 (14.4)
Poor quality of items 7 (0.9)
3 (0.5)
2 (18.2)
12 (0.9)
Low market price 112 (13.8)
13 (2.3)
- 125 (8.9)
Irregular distribution through FPSs
- 1 (0.2)
- 1 (0.1)
Lack of disposable money at a point of time
34 (4.2)
4 (0.7)
3 (27.3)
41 (2.9)
Information not available 10 (1.2)
2 (0.4)
- 12 (0.9)
Non-allotted for APL 7 (0.9)
219 (38.0)
- 226 (16.2)
Regular withdrawal 189 (23.3)
20 (3.5)
2 (18.2)
211 (15.1)
Total 812 (100.0)
577 (100.0)
11 (100.0)
1400 (100.0)
Source: Field survey.
The reasons cited by the households, separately BPL and APL households, for non-
regular purchase of sugar are similar to those cited in case of rice and wheat. In case of
sugar, the majority explanation goes in terms of 'Items not distributed', 'Lack of disposable
money at a point of time', and 'No need for sugar in the consumption basket'. 'Lack of
disposable money' explains the case more of BPL households relative to the APL
households. Within the BPL households (812), 'Items not distributed', 'No need for sugar in
the household consumption basket' and 'Lack of disposable money' explain 60.0 per cent of

74
the BPL households citing the reasons for non-regular purchase of sugar. The availability and
need for sugar during the 'Festivals' come as additional explanatory factors for non-regular
purchase of sugar (Table 4.24).
Table 4.24 Reasons for Non-Regular Purchase of Sugar from FPSs
Reasons BPL APL Card-less Total
Non-distribution of items 243 (29.9)
199 (34.5)
2 (18.2)
444 (31.7)
Poor quality 6 (0.7)
7 (1.2)
1 (9.1)
14 (1.0)
Lack of disposable money at a point of time
91 (11.2)
23 (4.0)
3 (27.3)
117 (8.4)
Problems to get it and by little quantity
4 (0.5)
4 (0.7)
- 8 (0.6)
Information not available 13 (1.6)
1 (0.2)
- 14 (1.0)
No need for sugar 158 (19.5)
44 (7.6)
3 (27.3)
205 (14.6)
Need only during festival 23 (2.8)
23 (4.0)
1 (9.1)
47 (3.4)
Regular withdrawal 274 (33.7)
276 (47.8)
1 (9.1)
551 (39.4)
Total 812 (100.0)
577 (100.0)
11 (100.0)
1400 (100.0)
Source: Field survey. 4.7.2 Regularity in Consumption of Sugar by Households and Its
Fulfillment by Purchase from FPSs Of the 1400 households surveyed, 71.6 per cent reported to consume sugar
regularly. Of the 812 households constituting the BPL category, 62.1 per cent reported to
consume sugar regularly while of the 57.7 per cent APL households, 86.3 per cent reported
regular consumption of sugar. This regular consumption does not necessarily imply regular
purchases from the FPSs; it only implies sugar as regular consumable item, whether or not
bought from the FPSs. There are inter-Block and inter-Town variations in terms of 'regular
consumption' of sugar, ranging from the maximum percentage of households reporting
regular consumption at 81.7 for Saidabad and minimum at 59.8 for Shankargarh. For inter-
Town variations, it is higher for Phulpur at 88.0 while for Bharatganj the percentage of
households reporting regular consumption of sugar is 74.0. There are also intra-Block
variations in percentage of households reporting regular consumption of sugar. While more of
BPL households (within each Block) in Sankargarh and Saidabad reported regular
consumption of sugar, less of BPL households reported regular consumption sugar for
Karchhana and Kaurihar, relative to the response of APL households. The response of
economic categories, BPL and APL, thus shows 'opposite relative response' intra-
block, relative to APL households (Table 4.25). The total number of households
responding as buyers of sugar, the item being in their regular consumption basket, constitute
71.6 per cent of all households (1400) surveyed. Of this truncated section of sugar

75
consumers, only 31.7 per cent households buy the total required amount from the FPSs,
while 42.4 percent households buy the total required amount from the open market, the rest
25.9 per cent of households meet their sugar requirements partially from the open market and
partially from the FPSs.
Table 4.25 Regular Consumption of Sugar by Households
Block/Town Categories Consumed Not Consumed Total
BPL 105 108 213 APL 73 7 80 Card-less - 7 7
Shankargarh
Total 178 (59.3)
122 (40.7)
300 (100.0)
BPL 93 61 154 APL 125 17 142 Card-less 1 3 4
Karchhana
Total 219 (73.0)
81 (27.0)
300 (100.0)
BPL 148 48 196 APL 97 7 104
Saidabad
Total 245 (81.7)
55 (18.3)
300 (100.0)
BPL 71 60 131 APL 128 41 169
Kaurihar
Total 199 (66.3)
101 (33.7)
300 (100.0)
BPL 52 7 59 APL 36 5 41
Phulpur
Total 88 (88.0)
12 (12.0)
100 (100.0)
BPL 35 24 59 APL 39 2 41
Bharatganj
Total 74 (74.0)
26 (26.0)
100 (100.0)
BPL 504 (62.1)
308 (37.9)
812 (100.0)
APL 498 (86.3)
79 (13.7)
577 (100.0)
Card-less 1 (9.1)
10 (90.9)
11 (100.0)
Total
Total 1003 (71.6)
397 (28.4)
1400 (100.0)
Source: Field survey. Of the BPL consumers of sugar, which is 62.06 per cent of all BPL households
(812), only 32.5 per cent responded as satisfying the whole quota of sugar from the
FPSs, 43.1 per cent buy wholly from the open market, and the rest of the households
buy partially from both open market and FPSs. For APL consumers of sugar that stands at
86.30 per cent of all APL households (577), 30.9 per cent meet their whole requirements of
sugar from FPSs, while 41.8 per cent satisfy requirements only from open market, the rest
satisfy their sugar requirements partially from both open market and FPSs (Table 4.26).

76
There are inter-regional variations (inter-Block and inter-Town) and also intra-regional
(among BPL and APL categories) variations in requirement of sugar met by FPS vis-a-vis
open market. In general, the households satisfying their requirements of sugar wholly
from FPSs at the level of Blocks and Towns center around the average at the level of
the district which is around 31.7 per cent of households.
Table 4.26 Consumption of Required Sugar Purchased Though FPS and Open Market
Open Market Block/Town Categories
Whole Partial FPSs Total
BPL 62 14 29 105 APL 27 19 27 73
Shankargarh
Total 89 (50.0)
33 (18.5)
56 (31.5)
178 (100.0)
BPL 41 14 38 93 APL 91 14 20 125 Card-less - 1 - 1
Karchhana
Total 132 (60.3)
29 (13.2)
58 (26.5)
219 (100.0)
BPL 65 47 36 148 APL 21 36 40 97
Saidabad
Total 86 (35.1)
83 (33.9)
76 (31.0)
245 (100.0)
BPL 28 18 25 71 APL 64 31 33 128
Kaurihar
Total 92 (46.2)
49 (24.6)
58 (29.2)
199 (100.0)
BPL 14 21 17 52 APL 4 20 12 36
Phulpur
Total 18 (20.5)
41 (46.6)
29 (32.9)
88 (100.0)
BPL 7 9 19 35 APL 1 16 22 39
Bharatganj
Total 8 (10.8)
25 (33.8)
41 (55.4)
74 (100.0)
BPL 217 (43.1)
123 (24.4)
164 (32.5)
504 (100.0)
APL 208 (41.8)
136 (27.3)
154 (30.9)
498 (100.0)
Card-less - 1 (100.0)
- 1 (100.0)
Total
Total 425 (42.4)
260 (25.9)
318 (31.7)
1003 (100.0)
Source: Field survey. 4.8 Required Quantity of Kerosene Per Period: Sufficiency in Supplying
through the FPSs and Supporting Non-FPS Sources About the allotted quantity of kerosene distributed through the FPSs, 53.4 per cent of
the households expressed that the supplied quantity per capita per period is sufficient to meet
their requirements. Of these satisfied households (747), the BPL households constitute 61.44
per cent. Among all BPL households (812), the satisfied BPL households constitute 56.5 per

77
cent. Among all APL households, 49.0 per cent are satisfied in the sense we understood from
the response of the households.
Of the 46.6 per cent of all households who expressed insufficiency in allotment and
distribution of kerosene, BPL households constitute 54.04 per cent. These unsatisfied BPL
households constitute 43.5 per cent of all BPL households (812).
The Block-wise variations in distribution of households, satisfied by 'Sufficiency in
distribution of kerosene through FPSs, range from 34.0 per cent for Kaurihar at minimum and
64.3 per cent for Sankargarh. For towns, the variations stand at 77.0 per cent of households
for Phulpur at the minimum and 83.0 per cent for Bharatganj at the maximum. Of the satisfied
households, BPL constitutes both more and less in percentage terms relative to APL
percentages, the intra-BPL and intra-APL percentages considered within each Block. For
example, for Karchhana, 'BPL households satisfied as percentage of all BPL households in
the Block' is more than 'APL households satisfied as percentage of all APL households in the
Block', while for Shankargarh the opposite is true. There is thus no unique indication of the
extent of satisfaction expressed by BPL and APL households by the indicator of
sufficiency in distribution of Kerosene (Table 4.27).
Table 4.27 Response of the Households about Distributed Quantity of Kerosene in FPSs
Block/Town Categories Sufficient Insufficient Total BPL 133 80 213 APL 58 22 80 Card-less 2 5 7
Shankargarh
Total 193 (64.3)
107 (35.7)
300 (100.0)
BPL 92 62 154 APL 62 80 142 Card-less 3 1 4
Karchhana
Total 157 (52.3)
143 (47.7)
300 (100.0)
BPL 87 109 196 APL 48 56 104
Saidabad
Total 135 (45.0)
165 (55.0)
300 (100.0)
BPL 46 85 131 APL 56 113 169
Kaurihar
Total 102 (34.0)
198 (66.0)
300 (100.0)
BPL 51 8 59 APL 26 15 41
Phulpur
Total 77 (77.0)
23 (23.0)
100 (100.0)
BPL 50 9 59 APL 33 8 41
Bharatganj
Total 83 (83.0)
17 (17.0)
100 (100.0)
BPL 459 (56.5)
353 (43.5)
812 (100.0)
APL 283 (49.0)
294 (51.0)
577 (100.0)
Card-less 5 (45.5)
6 (54.5)
11 (100.0)
Total
Total 747 (53.4)
653 (46.6)
1400 (100.0)
Source: Field survey.

78
Of the 'not-fully satisfied' households (653) so far as allotment and distribution of
kerosene is concerned, 88.4 per cent reported to satisfy the requirement through purchase
from the open market, while 1.2 per cent of these households buy the same item at higher
rates from the same FPS, and 10.4 per cent of households 'anyhow adjust' by 'flexibility in
consumption'. The distribution of households, who satisfy the extra requirement of
Kerosene (extra in the sense of consumption requirement of kerosene over what is
distributed per period) from open market, are evenly distributed over APL and BPL
households, when the percentages of these households are calculated as percentages
of their respective totals in the district. Of the 'not fully satisfied' households, there are
inter-Block and inter-town variations in percentages of households and also intra-
Block and intra-town variations by BPL and APL categories of households with no
uniqueness to show if a particular Block or economic category remains non-satisfied.
There are inter-regional (Block-wise and Town-wise) variations in responses of the
households buying Kerosene from open market, and also variations intra-region (Block and
Town) for BPL and APL categories expressed in terms of the percentages of their respective
totals in a particular Block or town. The intra-regional variations do not show any particular
(unique) category, by BPL and APL, responding more to open market purchase of kerosene.
For inter-block variations in percentages of households buying from open market,
Shankargarh reported the maximum at 69.2 per cent while Saidabad reported the maximum
at 98.2 per cent, the percentages calculated as Block summation of both the economic
categories, BPL and APL (Table 4.28).
4.9.1 Distribution of Rice and Wheat by Quantity: The Extent of Satisfaction of the Households
So far as the distribution of rice and wheat is concerned, only 9.6 per cent of
households reported to have been satisfied in case of rice and only 8.9 per cent of
households satisfied in case of wheat at the district level. The unsatisfied percentages of
households for the respective items are 14.3 and 14.7. Both these cases, 'satisfied' and
'unsatisfied' show the average calculated over all households, in all Blocks and towns over all
the economic categories, BPL and APL. The extent of the households being satisfied by the
distribution of rice and wheat per capita per period is explained most by two factors, 'non-
availability' and 'not-allotment'. Mostly the APL households cover the non-allotment factor
for each of rice and wheat. While 38.1 per cent of all households, by BPL and APL
categories, report 'non-allotment' as the factor behind the extent of satisfaction, in case of rice
the APL households constitute 97.0 per cent of the absolute total (BPL+APL) number of
households at 534 that represent the cases of non-allotment of rice. For wheat, non-allotment
is cited by 38.1 per cent of all households, the absolute number of such households being
534, of which 97.0 per cent is covered by APL households. As a percentage of all APL
households (577), the cases of non-allotment come to be 89.77 per cent of APL households
for each of rice and wheat.

79
Table 4.28 Required Quantity of Kerosene met by Non-FPS Sources for Not-Fully-Satisfied
Households
Block/Town Categories Black or Open
Market
Higher Rate in FPS
Adjustment Any how
Total
BPL 55 2 23 80 APL 16 1 5 22 Card-less 3 - 2 5
Shankargarh
Total 74 (69.2)
3 (2.8)
30 (28.0)
107 (100.0)
BPL 54 1 7 62 APL 65 3 12 80 Card-less 1 - - 1
Karchhana
Total 120 (83.9)
4 (2.8)
19 (13.3)
143 (100.0)
BPL 108 - 1 109 APL 54 - 2 56
Saidabad
Total 162 (98.2)
- 3 (1.8)
165 (100.0)
BPL 82 - 3 85 APL 104 1 8 113
Kaurihar
Total 186 (93.9)
1 (0.5)
11 (5.6)
198 (100.0)
BPL 8 - - 8 APL 13 - 2 15
Phulpur
Total 21 (91.3)
- 2 (8.7)
23 (100.0)
BPL 6 - 3 9 APL 8 - - 8
Bharatganj
Total 14 (82.4)
- 3 (17.6)
17 (100.0)
BPL 313 (88.7)
3 (0.8)
37 (10.5)
353 (100.0)
APL 260 (88.4)
5 (1.7)
29 (9.9)
294 (100.0)
Card-less 4 (66.7)
- 2 (33.2)
6 (100.0)
Total
Total 577 (88.4)
8 (1.2)
68 (10.4)
653 (100.0)
Source: Field survey.
There are, however, inter-Block variations in percentage of APL households reporting
non-allotment of rice (percentage calculated over Block-specific total APL households). The
variations range from 70.0 per cent of APL households in Sankargarh at the minimum and
95.85 per cent for Kaurihar at the maximum, in between come Karchhana (89.43 per cent)
and Saidabad (92.30 per cent). Non-distribution of rice to APL households thus is not
uniform for blocks. The same is true in case of non-distribution of rice for APL households
for towns. We can also look at inter-regional variations in percentage of APL households
reporting non-distribution of wheat. The variations show identical picture as we got in case of
rice. What it shows is that the same set of APL households cited non-distribution of
rice and wheat, Block-wise, town-wise and total for the district.

80
The factor that explains the seriousness of the problem in distribution of rice
and wheat is given by 'non-availability' as distinct from non-distribution. For each of rice
and wheat, 30.6 per cent of the households report non-availability at the district level. Of this
category of households characterized by 'non-availability of rice', BPL households constitute
91.37 per cent of the total households citing non-availability of rice as a factor (429), which is
the same as for non-availability of wheat. The BPL households thus deprived of availability at
the district level constitute 48.3 per cent of all BPL households (812) for each of rice and
wheat. The APL households reporting non-availability of each of rice and wheat constitute
only 4.85 per cent of their total number (577) surveyed at district level. As percentage of the
households citing non-availability of each of rice and wheat (429 for each), APL households
constitute 6.52 per cent. The rest of the households is covered by card-less households
(Table 4.29).
4.9.2 Distribution of Sugar and Kerosene by Quantity: The Extent of Satisfaction of the Households
Regarding distribution of sugar by quantity, 29.6 per cent of the households
expressed satisfaction while 19.6 per cent expressed dissatisfaction. The case of 'non-
availability on demand' is expressed by 32.4 per cent of the households while 'unfelt need' is
expressed by 18.4 per cent. There is no report of non-allotment of sugar, perhaps that is
covered by 'unfelt need factor' or 'need not revealed' at the FPS level. For kerosene, the
percentage of households satisfied by quantity distributed is as high as 54.0 per cent while
'unsatisfied' cases represent 44.8 per cent, the rest 1.2 per cent of households represent the
case of 'non-availability of demand'. There is no report of non-distribution and 'unfelt
need' for kerosene for Blocks, Towns and hence for the District, considering both BPL
and APL households.
The inter-regional (Block-wise) variations in percentage of households satisfied by
quantity of sugar distributed are marginal, excepting for Kaurihar. The 'unsatisfied' cases
however, vary very much among households Blockwise with minimum at 9.3 per cent for
karchhana and 24.3 per cent for Saidabad. The distribution of the 'satisfied households'
among BPL and APL Blockwise does not show any uniform trend for sugar. This is
based on calculation of 'BPL satisfied households' in a Block for sugar as percentage of total
BPL households in the Block and the same repeated for 'APL satisfied households' as
percentage of all APL households in the Block. Similarly, the 'BPL unsatisfied households'
as percentage of all BPL households for any Block does not show uniformly higher or
lower percentage when compared with 'APL unsatisfied households' as percentage of
all APL households for any particular Block, sugar being the item considered.
Of the total number of households at the district level (454) reporting 'non-availability
of sugar on demand', the percentage for BPL households is 53.52, while for APL it is 44.27,
the rest of the cases covered by card-less households. These BPL households cover 29.92
per cent of all BPL households (812) while the total APL households reporting non-availability
of sugar on demand constitute 34.83 per cent of all APL households (577) at the district level.

81
Table 4.29 The Extent of Satisfaction of the Households about Quantity of Rice and Wheat Distributed through the FPSs
Block/Town Categories Rice Wheat
Satisfied Un-satisfied
Not Allotted
Non-available on demand
Unfelt Need
Satisfied Un-satisfied
Not Allotted
Non-available on demand
Unfelt Need
Total
BPL 43 44 1 117 8 34 50 1 116 12 213 APL 8 1 56 9 6 9 1 56 9 5 80 Card-less - - - 7 - - - - 7 - 7
Shankargarh
Total 51 (17.0)
45 (15.0)
57 (19.0)
133 (44.3)
14 (4.7)
43 (14.3)
51 (17.0)
57 (19.0)
132 (44.0)
17 (5.7)
300 (100.0)
BPL 35 22 - 49 48 36 21 - 49 48 154 APL 3 - 127 6 6 3 - 127 6 6 142 Card-less - 2 - 2 - - 2 - 2 - 4
Karchhana
Total 38 (12.7)
24 (8.0)
127 (42.3)
57 (19.0)
54 (18.0)
39 (13.0)
23 (7.7)
127 (42.3)
57 (19.0)
54 (18.0)
300 (100.0)
BPL 7 36 8 130 15 6 36 8 131 15 196 APL - 1 96 5 2 - 1 96 5 2 104
Saidabad
Total 7 (2.3)
37 (12.3)
104 (34.7)
135 (45.0)
17 (5.7)
6 (2.0)
37 (12.3)
104 (34.7)
136 (45.3)
17 (5.7)
300 (100.0)
BPL 21 58 1 37 14 20 59 1 37 14 131 APL - 1 162 3 3 1 1 162 3 2 169
Kaurihar
Total 21 (7.0)
59 (19.7)
163 (54.3)
40 (13.3)
17 (5.7)
21 (7.0)
60 (20.0)
163 (54.3)
40 (13.3)
16 (5.3)
300 (100.0)
BPL 11 27 5 16 - 11 27 5 16 - 59 APL - - 40 1 - - - 40 1 - 41
Phulpur
Total 11 (11.0)
27 (27.0)
45 (45.0)
17 (17.0)
- 11 (11.0)
27 (27.0)
45 (45.0)
17 (17.0)
- 100 (100.0)
BPL 6 8 1 43 1 6 8 1 43 1 59 APL - - 37 4 - - - 37 4 - 41
Bharatganj
Total 6 (6.0)
8 (8.0)
38 (38.0)
47 (47.0)
1 (1.0)
6 (6.0)
8 (8.0)
38 (38.0)
49 (49.0)
1 (1.0)
100 (100.0)
BPL 123 (15.1)
195 (24.0)
16 (2.0)
392 (48.3)
86 (10.6)
113 (13.9)
201 (24.7)
16 (2.0)
392 (48.3)
90 (11.1)
812 (100.0)
APL 11 (2.0)
3 (0.5)
518 (89.8)
28 (4.8)
17 (2.9)
13 (2.3)
3 (0.5)
518 (89.8)
28 (4.8)
15 (2.6)
577 (100.0)
Card-less - 2 (18.2)
- 9 (81.8)
- - 2 (18.2)
- 9 (81.8)
- 11 (100.0)
Total
Total 134 (9.6)
200 (14.3)
534 (38.1)
429 (30.6)
103 (7.4)
125 (8.9)
206 (14.7)
534 (38.1)
429 (30.6)
105 (7.5)
1400 (100.0)
Source: Field survey.

82
Table 4.30 The Extent of Satisfaction of the Households about Quantity of Sugar and Kerosene Distributed through the FPSs
Block/Town Categories Sugar Kerosene
Satisfied Un-satisfied Not available on demand
Unfelt Need Satisfied Unsatisfied Not available on demand
Unfelt Need Total
BPL 46 35 66 66 134 74 5 - 213 APL 37 19 23 1 56 20 4 - 80 Card-less - - 7 - 4 3 - - 7
Shankargarh
Total 83 (27.7)
54 (18.0)
96 (32.0)
67 (22.3)
194 (64.7)
97 (32.3)
9 (3.0)
- 300 (100.0)
BPL 59 14 45 36 97 51 6 - 154 APL 27 13 87 15 62 80 - - 142 Card-less - 1 3 - - 3 1 - 4
Karchhana
Total 86 (28.7)
28 (9.3)
135 (45.0)
51 (17.0)
159 (53.0)
134 (44.7)
7 (2.3)
- 300 (100.0)
BPL 47 42 71 36 90 105 1 - 196 APL 44 31 22 7 49 55 - - 104
Saidabad
Total 91 (30.3)
73 (24.3)
93 (31.0)
43 (14.3)
139 (46.3)
160 (53.3)
1 (0.3)
- 300 (100.0)
BPL 21 33 27 50 48 83 - - 131 APL 37 33 64 35 58 111 - - 169
Kaurihar
Total 58 (19.3)
66 (22.0)
91 (30.3)
85 (28.3)
106 (35.3)
194 (64.7)
- - 300 (100.0)
BPL 26 12 14 7 51 8 - - 59 APL 18 17 3 3 25 16 - - 41
Phulpur
Total 44 (44.0)
29 (29.0)
17 (17.0)
10 (10.0)
76 (76.0)
24 (24.0)
- - 100 (100.0)
BPL 30 8 20 1 49 10 - - 59 APL 23 16 2 - 33 8 - - 41
Bharatganj
Total 53 (53.0)
24 (24.0)
22 (22.0)
1 (1.0)
82 (82.0)
18 (18.0)
- - 100 (100.0)
BPL 229 (28.2)
144 (17.7)
243 (29.9)
196 (24.1)
469 (57.8)
331 (40.8)
12 (14.7)
- 812 (100.0)
APL 186 (32.2)
129 (22.4)
201 (34.8)
61 (10.6)
283 (49.0)
290 (50.3)
4 (0.7)
- 577 (100.0)
Card-less - 1 (9.1)
10 (90.9)
- 4 (36.4)
6 (54.5)
1 (9.1)
- 11 (100.0)
Total
Total 415 (29.6)
274 (19.6)
454 (32.4)
257 (18.4)
756 (54.0)
627 (44.8)
17 (1.2)
- 1400 (100.0)
Source: Field survey.

83
As high as 24.1 per cent of all BPL households (812) expressed 'unfelt need' for
sugar at the district level while for APL households the percentage is 10.6 of all APL
households. As percentage of all households reporting 'unfelt need' for sugar, BPL
households constitute 76.26 per cent.
The BPL households satisfied with distribution of kerosene through FPSs constitute
57.8 percent of all BPL households (812) in the district. Of the satisfied total households for
Kerosene (756) at the district level the BPL households constitute 62.03 per cent while APL
households constitute 37.43 per cent. The rest of the households is explained by cardless
cases (0.52) who are 'surprisingly satisfied somehow' with distribution of kerosene. It may be
that the cardless households get kerosene at higher prices through the same FPSs. Of the
total unsatisfied households (627), BPL and APL taken together for kerosene, BPL
households constitute 52.79 per cent while APL households cover 46.25 per cent, the rest
(0.95 per cent) is covered by cardless households. The BPL unsatisfied households as
percentage of BPL total households (812) represent 40.8 per cent, while for APL unsatisfied
households, it is 50.3 per cent of all APL households (577). For kerosene the 'non-availability
on demand' factor is nearly absent, as reported by the households (Table 4.30).
4.10 Awareness of the Households
Let us examine the awareness of the households in terms of some indicators we think
relevant here. These indicators are visibility of price chart at FPSs, and hence price
information and also the names of FPS dealers as known to the households.
(a) Price Chart at Fair Price Shops
Of the total households surveyed in the district, as high as 61.4 per cent reported
non-availability of 'price chart' in the FPSs while 24.4 per cent reported availability of this
chart. The rest of the households (14.3 per cent) reported their ignorance about the existence
of Price Chart in the FPS.
The BPL households, as a percentage of all BPL households, who reported non-
availability of price chart, constituted 68.1 per cent while the APL households, as percentage
of all APL households, reporting non-availability of this chart, came to be 52.0 per cent. Of
the total households (859) reporting 'non-availability of price chart', BPL households constitute
64.37 per cent, while APL households 34.92 per cent, the rest (0.07 percent) covered by
cardless households. Of the total households (341) who observe price chart in FPSs, BPL
households constitute 43.69 per cent while APL households constitute 55.13 per cent, the
rest being covered by cardless cases. The BPL households reporting availability of price chart
is 18.34 per cent of all BPL households (812) in the district. Calculated similarly, the APL
households reporting availability of Price Chart is 32.58 per cent of all APL households in the
district. The non-availability of Price Chart at FPS thus is cited more by BPL
households, the latter seen as percentage of all BPL households reporting non-
availability and seen also as percentage of all households reporting non-availability of
Price Chart.

84
The ignorance of the households reported regarding existence of Price Chart at FPS
shows a higher percentage of APL relative to BPL, both calculated as percentages of their
respective totals at the district level. As a percentage of all ignorant households so far as
Price Chart is concerned, BPL households constitute 55.0 per cent while APL households
constitute 44.5 per cent, the rest covered by card-less households.
There are inter-regional (Block-wise and Town-wise) variations in percentage of
households, separately for BPL and APL, regarding availability and non-availability of Price
Chart, and regarding ignorance about the existence of Price Chart. Blockwise the ignorance is
maximum for Karchhana and minimum for Sankargarh. The 'ignorance' factor is much less
for urban areas relative to the rural ones (Table 4.31).
Table 4.31 Awareness of the Households about Price Chart at FPS and Price Information
Price Chart Available Correct Price Maintained Block/Town Categories
Yes No Do not know
Yes No Do not know
Total
BPL 10 179 24 2 8 - 213 APL 32 47 1 6 26 - 80 Card-less 2 5 - 1 1 - 7
Shankargarh
Total 44 (14.7)
231 (77.0)
25 (8.3)
9 (3.0)
35 (11.7)
- 300 (100.0)
BPL 57 56 41 18 32 7 154 APL 36 72 34 15 21 - 142 Card-less 2 1 1 - 1 1 4
Karchhana
Total 95 (31.7)
129 (43.0)
76 (25.3)
33 (11.0)
54 (18.0)
8 (2.7)
300 (100.0)
BPL 21 154 21 5 13 3 196 APL 26 69 9 11 14 1 104
Saidabad
Total 47 (15.7)
223 (74.3)
30 (10.0)
16 (5.3)
27 (9.0)
4 (1.3)
300 (100.0)
BPL 26 88 17 12 10 4 131 APL 37 88 44 14 21 2 169
Kaurihar
Total 63 (21.0)
176 (58.7)
61 (20.3)
26 (8.7)
31 (10.3)
6 (2.0)
300 (100.0)
BPL 21 31 7 5 12 4 59 APL 24 17 - 15 9 - 41
Phulpur
Total 45 (45.0)
48 (48.0)
7 (7.0)
20 (20.0)
21 (21.0)
4 (4.0)
100 (100.0)
BPL 14 45 - 4 8 2 59 APL 33 7 1 13 18 2 41
Bharatganj
Total 47 (47.0)
52 (52.0)
1 (1.0)
17 (17.0)
26 (26.0)
4 (4.0)
100 (100.0)
BPL 149 (18.3)
553 (68.1)
110 (13.5)
46 (5.7)
83 (10.2)
20 (2.5)
812 (100.0)
APL 188 (32.6)
300 (52.0)
89 (15.4)
74 (12.8)
109 (19.0)
5 (0.9)
577 (100.0)
Card-less 4 (36.4)
6 (54.5)
1 (9.1)
1 (9.1)
2 (18.2)
1 (9.1)
11 (100.0)
Total
Total 341 (24.4)
859 (61.4)
200 (14.3)
121 (8.6)
194 (13.9)
26 (1.9)
1400 (100.0)
Source: Field survey.
(b) Price Information by Price Chart
Of the total households reporting availability of Price Chart (341), as low as 35.48 per
cent confirmed availability of correct Price information in the FPS, which is only 8.6 per cent of

85
all households (1400). As high as 56.89 per cent of all households reporting availability of
Price chart' negated existence of correct Price Chart, or confirmed existence of incorrect Price
Chart. The households who negated existence of correct Price Chart constituted 13.9 per
cent of all households (1400). The households who affirmed availability of Price Chart but
expressed ignorance about the correctness of Price Information provided by the Chart is 7.62
per cent, which is 1.9 per cent of all households. The correctness of Price Information,
even when the Price Chart is available in FPSs, thus is questionable, as reported by the
households of all categories, BPL and APL.
There are, however, inter-regional variations regarding 'confirmation in availability of
correct information', 'non-confirmation of correct information in Price Chart' and 'ignorance in
correctness of prices mentioned in the Chart'. For urban (Town) areas, the percentage of
households in the category of confirmation in availability of correct information is
higher, relative to those for the rural (Block) areas. The similar urban-rural positive
differential also holds good for the remaining two categories studied on the question of
correctness of information in Price Chart. We found no unique weight-differential between
BPL and APL households, weightage calculated by percentage of households in the
respective categories as percentage of their respective total number in the Blocks and
towns (Table 4.31).
(c) Price Information by Items
Of the total households (1400) surveyed in the selected Blocks and Towns in the
district, only 0.6 per cent confirmed their correct knowledge about the FPS price of rice, 0.7
per cent of the households confirmed knowledge about the FPS price of sugar, 1.4 percent of
sugar, and 1.8 per cent of kerosene. Of the total (9) households having correct information of
price of rice per kg., 5 comes from BPL and 4 from APL households. For wheat, the
households having correct price information (10) is equally distributed between BPL and APL
households. BPL households reported their ignorance about the price of sugar per kg. For
kerosene, the APL households cover twice the number of BPL households of the total
households having correct information on price of kerosene per liter. The precise point is
that most of the households, both BPL and APL, do not know the correct price of items
being distributed for them through the FPSs. The reasons for this lack of awareness, so
far as correct price information of items distributed through FPSs is concerned, may be
different between rural and urban areas. The fact is that the households in urban areas
(Phulpur and Bharatganj) did not confirm as having correct price information of rice
and wheat. Only two APL households, in Bharatganj town, each for sugar and Kerosene,
confirmed as having correct price information for sugar and kerosene, while only one APL
household in Phulpur confirmed having correct price information for kerosene.
The inter-regional variations (Block-wise and Town-wise) in the number and
percentages of households (separately within BPL and APL and between BPL and
APL) does not make much sense in a state of wholesome ignorance (lack of
awareness) of most of the households about correct price information of items

86
distributed through the FPSs. The immediate task may be to launch campaign for the
promotion of awareness of households about their 'right to correct price information' (Table
4.32).
Table 4.32 Awareness of the Households about Correct Price Information in Fair Price Shops
Households Block/Town Categories
Rice Wheat Sugar Kerosene Total
BPL 2 2 2 3 213 APL 3 4 6 6 80 Card-less - - - - 7
Shankargarh
Total 5 (1.7)
6 (2.0)
8 (2.7)
9 (3.0)
300 (100.0)
BPL 1 1 1 1 154 APL - - 1 5 142 Card-less - - - - 4
Karchhana
Total 1 (0.3)
1 (0.3)
2 (0.7)
6 (2.0)
300 (100.0)
BPL 1 1 2 3 196 APL - - 1 3 104
Saidabad
Total 1 (0.3)
1 (0.3)
3 (1.0)
6 (2.0)
300 (100.0)
BPL 1 1 1 1 131 APL 1 1 1 1 169
Kaurihar
Total 2 (0.7)
2 (0.7)
2 (0.7)
2 (0.7)
300 (100.0)
BPL - - - - 59 APL - - - 1 41
Phulpur
Total - - - 1 (1.0)
100 (100.0)
BPL - - - - 59 APL - - 1 1 41
Bharatganj
Total - - 1 (1.0)
1 (1.0)
100 (100.0)
BPL 5 (0.6)
5 (0.6)
- 8 (1.0)
812 (100.0)
APL 4 (0.7)
5 (0.9)
6 (0.6)
17 (2.9)
577 (100.0)
Card-less - - 10 (1.7)
- 11 (100.0)
Total
Total 9 (0.6)
10 (0.7)
16 (1.4)
25 (1.8)
1400 (100.0)
Source: Field survey.
(d) Names of Fair Price Shop Dealers
Of the total households (1400) as high as 91.9 per cent know the names of the FPS
dealers. Of the total BPL households (812), as high as 91.3 per cent, and of the total APL
households (577), as high as 92.5 per cent know the names of FPS dealers. Thus, the
distribution of the households at the district level between BPL and APL households
who know the names of FPS dealers is equiproportionately related with the distribution
of all households selected between BPL and APL categories of households.

87
The inter-regional (Block-wise and Town-wise) variations in distribution of all
households, separately for intra-BPL and intra-APL, get manifested as high
percentages of their respective totals, both Block-cum-Townwise and economic
category wise. The block that draws attention, however, is Kaurihar where as high as 17.7
per cent of the households do not know the names of the FPS dealers serving them, and
these 'ignorant households' in Kaurihar are equally distributed between BPL and APL
households (Table 4.33).
Table 4.33 Awareness of the Households about the Names of FPS Dealers
Block/Town Categories Know Do not Know Total
BPL 182 31 213 APL 76 4 80 Card-less 7 - 7
Shankargarh
Total 265 (88.3)
35 (11.7)
300 (100.0)
BPL 146 8 154 APL 134 8 142 Card-less 4 - 4
Karchhana
Total 284 (94.7)
16 (5.3)
300 (100.0)
BPL 193 3 196 APL 102 2 104
Saidabad
Total 295 (98.3)
5 (1.7)
300 (100.0)
BPL 105 26 131 APL 142 27 169
Kaurihar
Total 247 (82.3)
53 (17.7)
300 (100.0)
BPL 58 1 59 APL 39 2 41
Phulpur
Total 97 (97.0)
3 (3.0)
100 (100.0)
BPL 57 2 59 APL 41 - 41
Bharatganj
Total 98 (98.0)
2 (2.0)
100 (100.0)
BPL 741 (91.3)
71 (8.7)
812 (100.0)
APL 534 (92.5)
43 (7.5)
577 (100.0)
Card-less 11 (100.0)
- 11 (100.0)
Total
Total 1286 (91.9)
114 (8.1)
1400 (100.0)
Source: Field survey.
4.11.1 Response of the Households Regarding Withdrawal of Sugar from the PDS
Of the total households selected at the district level (1400), for 47.6 per cent the
withdrawal of sugar from the PDS will make no difference, while for 52.4 percent it will make
adverse effect. As high as 55.0 per cent of BPL households out of the total BPL households

88
(812) would experience no adverse effect if sugar is withdrawn from the PDS, while as high
as 64.0 per cent of APL households out of the total APL households (577) would experience
adverse effect on withdrawal of sugar from the PDS. The question of withdrawal of sugar
from the PDS is hypothetical in the sense that, given the actual consumption
requirements of sugar of the respective economic categories and given prevailing
actual prices in the open market and FPS, the question aims at examining what would
happen if sugar is not at all distributed through the FPSs.
There are Blocks where withdrawal of sugar will make much difference, e.g.,
Karchhana where 65.3 percent of the households responded that they would have adverse
effect if sugar was withdrawn. The high overall percentage for this Block is explained more by
APL households which is 71.8 per cent of total APL households in the Block. The BPL
households as percentage of all BPL households in the Block who responded that they would
have adverse effect with respect to withdrawal of sugar is 61.03 per cent for Karchhana
Block.
The inter-Block variations in response of the households to the question of withdrawal
of sugar show the 'non-adverse case' maximum for Sankargarh (65.3 per cent) and minimum
for Karchhana (34.7 per cent). The BPL households as percentage of all BPL households in
Sankargarh revealing 'non-adverse case' is 69.0 per cent, while for APL households as a
percentage of all APL households in the Block it is 52.5 percent. As natural, there is 'no
uniform response in adverse effect' with respect to withdrawal of sugar from the PDS.
There are inter-Block and inter-town variations in this response, and also there are
inter-economic categories variations considered intra-Block and intra-town in terms of
adverse and non-adverse cases in response to the question of withdrawal of sugar
(Table 4.34 & Fig. 4.5).
Response of the Households about withdrawing sugar from the PDS
55
36
100
47.6
45
64
0
52.4
0
20
40
60
80
100
120
BPL APL Card-less Total
Fig. 4.5
Per
cen
tag
e
Make nodifferenceAdverseeffect

89
Table 4.34
Response of the Households about Withdrawing Sugar from the PDS
Block/Town Categories Make no Difference
Adverse Effect Total
BPL 147 66 213 APL 42 38 80 Card-less 7 - 7
Shankargarh
Total 196 (65.3)
104 (34.7)
300 (100.0)
BPL 60 94 154 APL 40 102 142 Card-less 4 - 4
Karchhana
Total 104 (34.7)
196 (65.3)
300 (100.0)
BPL 100 96 196 APL 24 80 104
Saidabad
Total 124 (41.3)
176 (58.7)
300 (100.0)
BPL 90 41 131 APL 91 78 169
Kaurihar
Total 181 (60.3)
119 (39.7)
300 (100.0)
BPL 33 26 59 APL 9 32 41
Phulpur
Total 42 (42.0)
58 (58.0)
100 (100.0)
BPL 17 42 59 APL 2 39 41
Bharatganj
Total 19 (19.0)
81 (81.0)
100 (100.0)
BPL 447 (55.0)
365 (45.0)
812 (100.0)
APL 208 (36.0)
369 (64.0)
577 (100.0)
Card-less 11 (100.0)
- 11 (100.0)
Total
Total 666 (47.6)
734 (52.4)
1400 (100.0)
Source: Field survey.
4.11.2 Response of the Households Regarding Withdrawal of Kerosene
from the PDS As high as 97.7 per cent of all the households selected in the district (1400)
responded that they would face difficulties if kerosene is withdrawn from the PDS. This
distribution of households is uniform by regions (Blocks and Towns) and by economic
categories (BPL and APL), thereby showing no major variation in inter-regional distribution of
households in terms of the necessity to have access to Kerosene distributed through the FPS.
Nor is there any major variation in distribution of households by BPL and APL
categories, intra-Block and intra-town, in terms of revealing adverse effect consequent
upon the withdrawal of Kerosene from the PDS (Table 4.35).

90
Table 4.35
Response of the Households about Withdrawing Kerosene from the PDS
Block/Town Categories Make no Difference
Adverse Affect Total
BPL 6 207 213 APL 8 72 80 Card-less - 7 7
Shankargarh
Total 14 (4.7)
286 (95.3)
300 (100.0)
BPL 4 150 154 APL 6 136 142 Card-less - 4 4
Karchhana
Total 10 (3.3)
290 (96.7)
300 (100.0)
BPL 1 195 196 APL - 104 104
Saidabad
Total 1 (0.3)
299 (99.7)
300 (100.0)
BPL 3 128 131 APL 3 166 169
Kaurihar
Total 6 (2.0)
294 (98.0)
300 (100.0)
BPL - 59 59 APL 1 40 41
Phulpur
Total 1 (1.0)
99 (99.0)
100 (100.0)
BPL - 59 59 APL - 41 41
Bharatganj
Total - 100 (100.0)
100 (100.0)
BPL 14 (1.7)
798 (98.3)
812 (100.0)
APL 18 (3.1)
559 (96.9)
577 (100.0)
Card-less - 11 (100.0)
11 (100.0)
Total
Total 32 (2.3)
1368 (97.7)
1400 (100.0)
Source: Field survey.
4.12 Response of the Households to the Question of Confinement of PDS to Rice and Wheat Only
If the PDS is confined to distribution of only rice and wheat, as high as 78.2 per cent
of the households will be unsatisfied. The 'unsatisfied BPL households' as a percentage of all
BPL households at the district level is 75.4 per cent while the 'unsatisfied APL households' as
a percentage of all APL households is 81.8 per cent. The 'unsatisfied BPL households' as a
percentage of 'all unsatisfied households' is 55.89 while the 'unsatisfied APL households' as a
percentage of all APL households is 43.10 per cent. These respective percentages show
approximately the ratio in which BPL and APL households have been selected and surveyed
at the district level. There is thus uniformity in general in distribution of 'unsatisfied

91
households' by economic categories in response to confinement of PDS to only rice
and wheat. Only one-fifth of the households expressed satisfaction in response to the
possibility of confinement of PDS to rice and wheat only.
There are inter-Block variations in distribution of 'unsatisfied households' like the
maximum one for Karchhana at 94.9 per cent and the minimum at 63.7 per cent for Kaurihar.
In urban areas, it is a peculiar distribution of 'unsatisfied households', like the cent per cent
case for Bharatganj town and as low as 62.0 per cent for Phulpur town. In terms of
distribution of 'unsatisfied households' over economic categories, there is no
uniformity by intra-Block and intra-Town calculations. The 'unsatisfied BPL households'
as per cent of all BPL households in Karchhana Block, for example, is as high as 95.45 while
the same for Saidabad Block is 70.91. Similar calculations may be made for intra-Block APL
households, intra-Town BPL and APL households. The focus in the responses of the
households in general is against confinement of PDS to rice and wheat only (Table 4.36
& Fig. 4.6).
Table 4.36 Response of the Households if their Requirement for Rice and Wheat are Supplied
through the FPSs
Block/Town Categories Satisfied Unsatisfied Total BPL 51 162 213 APL 7 73 80 Card-less - 7 7
Shankargarh
Total 58 (19.3)
242 (80.7)
300 (100.0)
BPL 7 147 154 APL 9 123 142 Card-less - 4 4
Karchhana
Total 16 (5.3)
284 (94.9)
300 (100.0)
BPL 57 139 196 APL 27 77 104
Saidabad
Total 84 (28.0)
216 (72.0)
300 (100.0)
BPL 62 69 131 APL 47 122 169
Kaurihar
Total 109 (36.3)
191 (63.7)
300 (100.0)
BPL 23 36 59 APL 15 26 41
Phulpur
Total 38 (38.0)
62 (62.0)
100 (100.0)
BPL - 59 59 APL - 41 41
Bharatganj
Total - 100 (100.0)
100 (100.0)
BPL 200 (24.6)
612 (75.4)
812 (100.0)
APL 105 (18.2)
472 (81.8)
577 (100.0)
Card-less - 11 (100.0)
11 (100.0)
Total
Total 305 (21.8)
1095 (78.2)
1400 (100.0)
Source: Field survey.

92
(a) Reasons Put Forward by Unsatisfied Households in Response to the Question of Confinement of PDS to Rice and Wheat Only
The reasons why most of the households are not satisfied, if the PDS is confined to
distribution of only rice and wheat, are many. Of all the households (1400), for 28.4 per cent
Kerosene is essential, while for 44.6 per cent both kerosene and sugar are essential. Of all
the BPL households, for 34.7 per cent kerosene is essential while for another 36.2 per cent
both kerosene and sugar are essential. This 'essentiality of items' is expressed by the
households as the 'necessity of items to be distributed through the FPS'. The other reasons
lie in 'unfelt need' for rice and wheat, 'poor quality' of rice and wheat, 'irregular distribution' of
rice and wheat, 'higher FPS price relative to open market price' for rice and wheat etc. Thus,
the response of the unsatisfied households range from the suggestion for 'obstruction
of kerosene and sugar' from being withdrawn from PDS to initiating positive steps for
distribution of quality items of rice and wheat regularly at really fair price (Table 4.37).
Table 4.37 Reasons Offered by Unsatisfied Households
(Confinement of PDS to Rice and Wheat Only)
Reasons BPL APL Card-less Total Unfelt need 14
(2.3) 14
(3.0) 2
(18.2) 30
(2.7) Kerosene is essential 282
(46.1) 111
(23.5) 5
(45.5) 398
(36.3) Both Kerosene and Sugar are essential 294
(48.0) 328
(69.5) 2
(18.2) 624
(57.0) FPS price is higher than market price 13
(2.1) 7
(1.5) 1
(9.1) 21
(2.0) Quality is poor - 3
(0.6) - 3
(0.3) Irregular distribution 3
(0.5) - - 3
(0.3) Distribution system should be improved 3
(0.5) 6
(1.3) - 9
(0.8) Satisfied 200
(32.7) 105
(22.2) - 305
(27.8) No response 3
(0.5) 3
(0.6) 1
(9.1) 7
(0.6) Total 612
(100.0) 472
(100.0) 11
(100.0) 1095
(100.0) Source: Field survey.
R e s p o n s e o f th e H o u s e h o ld s if th e ir R e q u ire m e n t fo r R ic e a n d W h e a t a re
S u p p lie d th ro u g h F P S s
24.6
18.2
0
21.8
75.4 81
.8
100
78.2
0
2 0
4 0
6 0
8 0
1 0 0
1 2 0
B PL A PL Ca r d - le s s To ta l
F ig . 4 .6
Per
cen
tag
e
S a t is f ie d
Un s a tis f ie d

93
(b) Reasons Put Forward by Satisfied Households in Response to the
Question of Confinement of PDS to Rice and Wheat Only The satisfaction of the households (305), in response to the hypothetical question of
confining PDS to only rice and wheat, is conditional upon a number of factors cited by the
households. As high as 71.14 per cent of the satisfied households put the condition that FPS
price should be lower than open market price, while 14.42 per cent of the households put the
condition that quantity should be allotted in terms of needs for rice and wheat, while another
6.88 per cent put the condition in terms of ensuring regularity in distribution of rice and wheat
throughout the month. Some households also pointed out the necessity to improve quality of
rice and wheat. These conditions put by the households rest on the supposition that the
households actually buy the whole requirement of rice and wheat from FPSs.
Of the 'satisfied BPL households' (200), 64.5 per cent put the condition on FPS price,
while 16.5 per cent put the condition on supply (allotment) of items in terms of need. Of the
'APL satisfied households' (105), as high as 83.80 per cent put the condition on FPS price
relative to open market price for rice and wheat, while 10.47 per cent put the condition on
quality of items distributed of rice and wheat in terms of requirements. Thus, for both BPL
and APL categories, what matter for their satisfaction lie in 'FPS Price vis-a-vis Open
Market Price' and 'quantity distributed vis-a-vis required' of items (Table 4.38).
Table 4.38
Reasons Offered by Satisfied Households (Confinement of PDS to Rice and Wheat Only)
Reasons BPL APL Total FPS price should be lower than market price 129
(15.9) 88
(15.3) 217
(15.5) Quantity allotted should be according to need 33
(4.1) 11
(1.9) 44
(3.1) Distribution should be regular for the whole month 18
(2.2) 3
(0.5) 21
(1.5) Quality should be improved 11
(1.4) 1
(0.2) 12
(0.8) Not satisfied 612
(75.4) 472
(81.8) 1084 (77.4)
No response 9 (1.1)
2 (0.3)
11 (0.8)
Total 812 (100.0)
577 (100.0)
1400 (100.0)
Source: Field survey. 4.13 Response of the Households on the Question of Requirement of
Kerosene from PDS in Case of Availability of Electricity The response of the households regarding their need for kerosene to be
distributed through the FPS is clearly in favour of regular supply even when the
residential houses are provided electricity. As high as 83.3 per cent of all households
confirmed in favour of the continuation of kerosene distributed through the FPSs. Of all the

94
BPL households (812), 80.0 per cent felt the necessity for access to kerosene in the FPS
while 88.0 per cent of the APL households felt this need.
There are high inter-Block variations in 'unfelt need' for kerosene in presence of
electricity in residential houses. For example, the unfelt need is expressed by as high as 30.7
per cent of the households for Kaurihar and as low as 9.7 per cent for Karchhana and at the
minimum 8.0 per cent for Saidabad. For towns, the 'felt need' for kerosene in presence of
electricity in houses is cent per cent for Bharatganj and 76.0 per cent for Phulpur. The inter-
economic category (BPL and APL) variations over Blocks and Towns for 'felt' and
'unfelt' need for kerosene in presence of electricity is not uniform (Table 4.39).
Table 4.39 Response of the Households about the Need for Availability of Kerosene from the FPS
(If the Houses have Electricity)
Block/Town Categories Yes No Total BPL 154 59 213 APL 75 5 80 Card-less 7 - 7
Shankargarh
Total 236 (78.7)
64 (21.3)
300 (100.0)
BPL 143 11 154 APL 126 16 142 Card-less 2 2 4
Karchhana
Total 271 (90.3)
29 (9.7)
300 (100.0)
BPL 175 21 196 APL 101 3 104
Saidabad
Total 276 (92.0)
24 (8.0)
300 (100.0)
BPL 76 55 131 APL 132 37 169
Kaurihar
Total 208 (69.3)
92 (30.7)
300 (100.0)
BPL 43 16 59 APL 33 8 41
Phulpur
Total 76 (76.0)
24 (24.0)
100 (100.0)
BPL 59 - 59 APL 41 - 41
Bharatganj
Total 100 (100.0)
- 100 (100.0)
BPL 650 (80.0)
162 (19.9)
812 (100.0)
APL 508 (88.0)
69 (12.0)
577 (100.0)
Card-less 9 (81.8)
2 (18.2)
11 (100.0)
Total
Total 1167 (83.3)
233 (16.7)
1400 (100.0)
Source: Field survey.
Of all the households (1167) who confirmed the need for continuing with the supply of
kerosene through FPSs, 83.7 per cent cited irregular supply of electricity as the cause. The
rest, 16.3 per cent, based their response on the need for kerosene as a fuel. Of the total BPL

95
households (650) who expressed need for continuing supply of kerosene, as high as 91.1 per
cent cited irregular supply of electricity as the cause while 74.2 per cent of APL households
(508) for such purposes offered irregular electricity supply as the cause. The requirement of
kerosene for fuel is expressed more by APL households relative to BPL, both calculated as
percentages of their respective totals, the totals here imply the section of BPL and APL
households who felt the need to continue kerosene as distributable item in the PDS.
The precise point is that the supply of electricity does not in general make any
difference so far as the requirement or demand for kerosene being satisfied through
FPS is concerned (Table 4.40).
Table 4.40 Reasons Offered by the Households for Continuation of Supply of Kerosene from the FPS
(In Presence of Electricity in the Residences of the Households)
Block/Town Categories Irregular Electricity Supply
For Fuel Total
BPL 137 17 154 APL 38 37 75 Card-less 6 1 7
Shankargarh
Total 181 (76.7)
55 (23.3)
236 (100.0)
BPL 140 3 143 APL 102 24 126 Card-less 2 - 2
Karchhana
Total 244 (90.0)
27 (10.0)
271 (100.0)
BPL 168 7 175 APL 79 22 101
Saidabad
Total 247 (89.5)
29 (10.5)
276 (100.0)
BPL 57 19 76 APL 100 32 132
Kaurihar
Total 157 (75.5)
51 (24.5)
208 (100.0)
BPL 33 10 43 APL 18 15 33
Phulpur
Total 51 (67.1)
25 (32.9)
76 (100.0)
BPL 57 2 59 APL 40 1 41
Bharatganj
Total 97 (97.0)
3 (3.0)
100 (100.0)
BPL 592 (91.1)
88 (8.9)
650 (100.0)
APL 377 (74.2)
131 (25.8)
508 (100.0)
Card-less 8 (88.9)
1 (11.1)
9 (100.0)
Total
Total 977 (83.7)
190 (16.3)
1167 (100.0)
Source: Field survey.

96
4.14.1 Perception of the Households about Fair Price Shop Dealers
Of all the households selected in the District, as high as 78.3 per cent expressed
satisfaction about the Fair Price Shop dealers. Households expressed the satisfaction in
absence (physical) of the FPS Dealer. There are inter-regional variations (Blockwise and
Townwise) in the distribution of households who expressed satisfaction. Also, there
are inter-economic category variations, intra-Block and intra-Town, with no uniformity
(Table 4.41).
Table 4.41 Perception of the Households about Fair Price Shop Dealers
Block/Town Categories Satisfied Unsatisfied Total
BPL 157 56 213 APL 54 26 80 Card-less 5 2 7
Shankargarh
Total 216 (72.0)
84 (28.0)
300 (100.0)
BPL 124 30 154 APL 93 49 142 Card-less 4 - 4
Karchhana
Total 221 (73.7)
79 (26.3)
300 (100.0)
BPL 155 41 196 APL 94 10 104
Saidabad
Total 249 (83.0)
51 (17.0)
300 (100.0)
BPL 109 22 131 APL 146 23 169
Kaurihar
Total 255 (85.0)
45 (15.0)
300 (100.0)
BPL 46 13 59 APL 39 2 41
Phulpur
Total 85 (85.0)
15 (15.0)
100 (100.0)
BPL 33 26 59 APL 37 4 41
Bharatganj
Total 70 (70.0)
30 (30.0)
100 (100.0)
BPL 624 (76.8)
188 (23.2)
812 (100.0)
APL 463 (80.2)
114 (19.8)
577 (100.0)
Card-less 9 (81.8)
2 (18.2)
11 (100.0)
Total
Total 1096 (78.3)
304 (21.7)
1400 (100.0)
Source: Field survey.
The reasons cited by the households (304) not satisfied with the FPS Dealer, are
many. As high as 24.7 per cent of these 'non-satisfied' households reported 'non-distribution
of sugar excepting on festivals', while another 10.5 per cent reported 'absence of information'
about the availability of items in the FPSs. Another 9.9 per cent of households reported non-
distribution of rice and wheat from FPSs. Thus, 50.0 per cent of reasons for non-satisfaction

97
lies in non-distribution of items. The response of the households covers all items together
and separately sugar for some households, rice and wheat for some other households. One
major reason cited by the households unsatisfied with the FPS Dealers is recorded as items
diverted/sold to open market. This reason covers 26.6 per cent of the unsatisfied households.
The other reasons for non-satisfaction include 'distribution of items at higher rate than fixed
for FPS', 'non-distribution of prescribed quantity, socially biased distribution' etc. (Table 4.42).
Table 4.42
Reasons Offered by Unsatisfied Households about FPS Dealers
Reasons BPL APL Card-less Total Absence of information 19
(10.1) 12
(10.5) 1
(50.0) 32
(10.5) Items not distributed 53
(28.2) 21
(18.4) 1
(50.0) 75
(24.7) Prescribed quantity of kerosene not distributed
8 (4.3)
4 (3.5)
- 12 (3.9)
Sugar not distributed/distributed only on festival
24 (12.8)
26 (22.8)
- 50 (16.4)
Rice and Wheat not distributed 24 (12.8)
6 (5.3)
- 30 (9.9)
Items distributed at higher prices 7 (3.7)
3 (2.6)
- 10 (3.3)
Items sold/diverted to open market 43 (22.9)
38 (33.3)
- 81 (26.6)
Prescribed quantity not distributed 8 (4.3)
3 (2.6)
- 11 (3.6)
Biased distribution 2 (1.1)
1 (0.9)
- 3 (1.0)
No response 15 (8.0)
4 (3.5)
- 19 (6.3)
Total 188 (100.0)
114 (100.0)
2 (100.0)
304 (100.0)
Source: Field survey.
4.14.2 Perception of the Households about FPSs in Terms of Scheduled Time Followed in Operating the Shops
Of the total households (1400) as high as 54.8 per cent conveyed that the FPS
Dealers follow scheduled time in operating the shops, while 37.0 per cent of households
negated it, the rest being in the ignorant category. The BPL households who conveyed
maintenance of scheduled time by the FPS dealers cover 54.2 per cent of all BPL households
while for APL, it is 39.9 per cent of the APL households at the district level. The category
characterizing ignorance of the households about time followed by FPS Dealers covers more
of BPL households relative to the APL as percentages of their respective totals.
There are major inter-Block differences in the perception of the households
regarding scheduled time followed by the FPS dealers. For Kaurihar it is 18.7 per cent
of all households in this particular Block, while for Saidabad it is 65.3 per cent of the
households in Saidabad who affirmed on the scheduled time followed by the FPS
dealers. For towns also there are wide differences in the perception among households

98
regarding the time of functioning of FPSs. There are also major inter-economic category
differences in perception regarding the time maintained by the FPS dealers in operating the
shops (Table 4.43).
Table 4.43 Perception of the Households about Following the Scheduled Time in FPSs
Households Block/Town Categories
Yes No Do not know Total BPL 127 76 10 213 APL 48 32 - 80 Card-less - 6 1 7
Shankargarh
Total 175 (58.3)
114 (38.0)
11 (3.7)
300 (100.0)
BPL 95 56 3 154 APL 85 51 6 142 Card-less 3 1 - 4
Karchhana
Total 183 (61.0)
108 (36.0)
9 (3.0)
300 (100.0)
BPL 117 68 11 196 APL 79 20 5 104
Saidabad
Total 196 (65.3)
88 (29.3)
16 (5.3)
300 (100.0)
BPL 13 80 38 131 APL 43 92 34 169
Kaurihar
Total 56 (18.7)
172 (57.3)
72 (24.0)
300 (100.0)
BPL 38 20 1 59 APL 29 12 - 41
Phulpur
Total 67 (67.0)
32 (32.0)
1 (1.0)
100 (100.0)
BPL 50 3 6 59 APL 40 1 - 41
Bharatganj
Total 90 (90.0)
4 (4.0)
6 (6.0)
100 (100.0)
BPL 440 (54.2)
303 (37.3)
69 (8.5)
812 (100.0)
APL 324 (39.9)
208 (25.6)
45 (5.5)
577 (100.0)
Card-less 3 (27.3)
7 (63.6)
1 (9.1)
11 (100.0)
Total
Total 767 (54.8)
518 (37.0)
115 (8.2)
1400 (100.0)
Source: Field survey.
The reasons offered by the households who negated the possibility of maintaining
scheduled time by the FPS dealers include (i) late arrival of items, (ii) diversion of items to
open market, (iii) engagement of FPS dealers in some other jobs etc. Most of the households
(57.1 per cent) among those who negated maintenance of scheduled time by FPS dealers as
a fact revealed their ignorance about the reasons for non-maintenance of time (Table 4.44).

99
Table 4.44 Reasons Offered by Households Regarding Non-maintenance of Scheduled Time by
FPS Dealers
Reasons BPL APL Card-less Total Late arrival of items 23
(7.6) 23
(11.1) - 46
(8.9) Engagement of FPS dealers in other jobs
22 (7.3)
7 (3.4)
- 29 (5.6)
Ignorance of households regarding reasons
185 (61.1)
107 (51.4)
4 (57.1)
296 (57.1)
No problem for non-maintenance of time
30 (9.9)
36 (17.3)
- 66 (12.7)
Diversion of items to open market
31 (10.2)
22 (10.6)
1 (14.3)
54 (10.4)
No response 12 (4.0)
13 (6.2)
2 (28.6)
27 (5.2)
Total 303 (100.0))
208 (100.0)
7 (100.0)
518 (100.0)
Source: Field survey. 4.15 Verification of Ration Cards of Households by Government
Department
Of the total households (1400), accepting the basis as one card possessed by one
household, as high as 77.8 per cent of the cards have been 'verified' by the Government of
Uttar Pradesh (Supply Dept., and Rural Development Dept./Nagar Nigam) while 22.2 per cent
have remained 'non-verified'. Of the total BPL households (812), 76.4 per cent and of the total
APL households, 81.3 per cent are reported to have been verified. There are inter-regional
(Block-wise and Town-wise) variations in distribution of ration cards that got 'verified' and
remained 'non-verified'. These variations also hold good over economic categories by BPL
and APL (Table 4.45 & Fig. 4.7).
Table 4.45 Verification of Ration Cards of Households by Supply Department
Block/Town Categories Verified Non-Verified Total
BPL 137 76 213 APL 46 34 80 Card-less - 7 7
Shankargarh
Total 183 (61.0)
117 (39.0)
300 (100.0)
BPL 105 49 154 APL 108 34 142 Card-less - 4 4
Karchhana
Total 213 (71.0)
87 (29.0)
300 (100.0)
BPL 156 40 196 APL 88 16 104
Saidabad
Total 244 (81.3)
56 (18.7)
300 (100.0)
Contd...

100
Block/Town Categories Verified Non-Verified Total
BPL 126 5 131 APL 168 1 169
Kaurihar
Total 294 (98.0)
6 (2.0)
300 (100.0)
BPL 54 5 59 APL 40 1 41
Phulpur
Total 94 (94.0)
6 (6.0)
100 (100.0)
BPL 42 17 59 APL 19 22 41
Bharatganj
Total 61 (61.0)
39 (39.0)
100 (100.0)
BPL 620 (76.4)
192 (23.6)
812 (100.0)
APL 469 (81.3)
108 (18.7)
577 (100.0)
Card-less - 11 (100.0)
11 (100.0)
Total
Total 1089 (77.8)
311 (22.2)
1400 (100.0)
Note: Ration cards have been checked on the basis of a single card possessed by a single household.
Source: Field survey.
Verification of Ration Cards of Households by Supply Department
76.4 81.3
0
77.8
23.6
18.7
100
22.2
0
20
40
60
80
100
120
BPL APL Card-less Total
Fig. 4.7
Per
cen
tag
e
Verif ied
Non-verif ied

101
PART - II
Introduction: Role of Panchayats in PDS
As defined by The Constitution (Seventy-third Amendment) Act, 1992 of the
Government of India, "Panchayat" means an institution (by whatever name called) of self-
government constituted under article 243G, for the rural areas (Institute of Social Sciences,
2000, p. 493). Article 243G of the Constitution says that 'subject to the provisions of this
Constitution, the Legislature of a State may, by law, endow the Panchayats with such powers
and authority as may be necessary to enable them to function as institutions of self-
government and such law may contain provisions for the devolution of powers and
responsibilities upon Panchayats at the appropriate level' (Institute of Social Sciences, 2000,
p. 493). The powers, authority and responsibilities of Panchayats thus cover (a) the
preparation of plans for economic development and social justice, (b) the implementation of
schemes for economic development and social justice as may be entrusted to them including
those in relation to the matters listed in the Eleventh Schedule (Institute of Social Sciences,
2000, p. 495). The Eleventh Schedule (Article 243G) includes 29 areas of jurisdiction of which
public distribution system is one (Institute of Social Sciences, 2000, p. 497-498).
We studied the functioning of Public Distribution System in the District of Allahabad,
Uttar Pradesh. In order to understand the existing modus operandi of Panchayati system vis-
a-vis PDS, we have gone through the relevant Acts. The U.P. Panchayat Vidhi Sansodhan
(UP Panchayat Raj Act 947, as amended up to 9 of 1994) came into force on April 22, 1994.
The rules and regulations regarding the constitution and functioning of Panchayats are also
modified and amended within the broad guidelines provided in the 73rd Amendment Act. After
1994, there came no further amendments to the legislation. However, with a view to
operationalizing the powers, duties, functions and administration of the three-tier Panchayats,
as envisaged in the 73rd Amendment, the Government of U.P. issued 55
government/departmental orders and three notifications between January 1996 and May
1999 (Rajiv Gandhi Foundation, 2000, p. 232). However, up to 1999, we found no direct
supervision of the PDS in operation in UP by the Panchayati system in keeping with the
Eleventh Schedule (Article 243G) of the Constitution of India (Rajiv Gandhi Foundation, 2000,
p. 237).
Following a recently circulated order from the Government of UP, the Gram Sabha
has been empowered to form six committees for each Village Panchayat under its jurisdiction.
Among these committees, the 'Administrative Committee' headed by the Gram Pradhan has
been authorized to supervise all the works related to the concerned Village Panchayat
(Panchayati Raj Anubhag-1, GO No. 4430/30-1-99 SPR/99 and 4077(1) 33-2-99-48 G/99
Dated 29 July 1999).
Following one more recently circulated order from the Government of UP, the
guidelines for operation of the FPSs within the network of the Panchayati Raj System will be
the following:

102
• Selection of FPS by location will be finally decided by the village panchayat.
Generally, there will be one FPS in each village panchayat. In case of more than
4000 units of cards in any village, the Panchayat may form another FPS in the
same village. If the single village has more than one FPS, the village panchayat
will distribute equal number of units in all FPS.
• The FPS dealer should draw at a time the quota (allotment) of the whole month.
For this the FPS dealer has to be economically strong. The dealer is also
expected to be educated and reputed in the locality.
• The 'Administrative Committee' is required to take all necessary steps regarding
complaints of cardholders against FPS dealers.
• A new FPS has to be established by the village panchayat within a month against
the suspended FPS. If the Gram Sabha suspends the FPS dealer by consensus,
then there will remain no scope of any appeal against this action before any court
of law.
• At present, the head of the Administrative Committee is Gram Pradhan who
guides the activities of FPSs (GO No. 3035/29-Kh-6-99-37 S/99 dated 10
August 1999).
4.16 Role of Panchayats in PDS as Perceived by the Households, FPS
Dealers, and Panchayat Members (a) Perception of Households about the Role of Panchayats in PDS
As high as 62.6 per cent of all the households (1400) revealed their ignorance about
the actual and possible role of Panchayats in PDS. Of all the BPL households (812), 61.4 per
cent and of all the APL households (577), 63.9 per cent are ignorant about the role of
Panchayats in PDS. The distribution of households who are aware of the role to be
played by Panchayats in PDS is evenly distributed over BPL and APL categories, as
percentages of their respective totals. There are, however, inter-regional (Blockwise
and Townwise) variations in 'prudent' and 'ignorant' households in terms of perception
about the role of Panchayats in PDS (Table 4.46 & Fig. 4.8).
Perception of the Households about the Role of Panchayats in PDS
22.8
23.2
0
22.8
15.8
12.8
27.2
14.6
61.4
63.9 72
.7
62.6
0
10
20
30
40
50
60
70
80
BPL APL Card-less Total
Fig. 4.8
Per
cen
tag
e
Positive Role
No Role
No Know ledge

103
Table 4.46
Perception of the Households about the Role of Panchayats in PDS
Households Block/Town Categories Positive Role No Role No Knowledge Total
BPL 64 51 98 213 APL 38 13 29 80 Card-less - 2 5 7
Shankargarh
Total 102 (34.0)
66 (22.0)
132 (44.0)
300 (100.0)
BPL 41 27 86 154 APL 14 25 103 142 Card-less - 1 3 4
Karchhana
Total 55 (18.3)
53 (17.7)
192 (64.0)
300 (100.0)
BPL 20 25 151 196 APL 16 7 81 104
Saidabad
Total 36 (12.0)
32 (10.7)
232 (77.3)
300 (100.0)
BPL 16 12 103 131 APL 41 18 110 169
Kaurihar
Total 57 (19.0)
30 (10.0)
213 (71.0)
300 (100.0)
BPL 42 3 14 59 APL 25 7 9 41
Phulpur
Total 67 (67.0)
10 (10.0)
23 (23.0)
100 (100.0)
BPL 2 10 47 59 APL - 4 37 41
Bharatganj
Total 2 (2.0)
14 (14.0)
84 (84.0)
100 (100.0)
BPL 185 (22.8)
128 (15.8)
499 (61.4)
812 (100.0)
APL 134 (23.2)
74 (12.8)
369 (63.9)
577 (100.0)
Card-less - 3 (27.2)
8 (72.7)
11 (100.0)
Total
Total 319 (22.8)
205 (14.6)
876 (62.6)
1400 (100.0)
Source: Field survey.
Table - 4.46a Perception of Households about the Positive Role of Panchayats in PDS
Particulars BPL APL Card-less Total
Ensuring distribution of items 69 (53.9)
38 (51.4)
1 (33.3)
106 (51.7)
Informing the Households - 4 (5.4)
- 4 (1.5)
Checking the stocks 4 (3.1)
6 (8.1)
1 (33.3)
11 (5.4)
Checking the quality of items 34 (26.6)
11 (14.9)
- 45 (22.0)
No responses 21 (16.4)
15 (20.3)
1 (33.3)
37 (18.0)
Total 128 (100.0)
74 (100.0)
3 (100.0)
205 (100.0)
Source: Field survey.

104
Table - 4.46b
Perception of Households about the Negative Role of Panchayats in PDS
Reasons for Negative Role Perceived
BPL APL Card-less Total
Panchayats take benefits 168 (90.8)
106 (79.1)
- 274 (85.9)
Pradhan lives outside the village 14 (7.6)
22 (16.4)
- 36 (11.3)
Lack of time of panchayat members - 3 (2.2)
- 3 (0.9)
Inactive panchayat members - 3 (2.2)
- 3 (0.9)
No responses 3 (1.6)
- - 3 (0.9)
Total 185 (100.0)
134 (100.0)
- 319 (100.0)
Source: Field survey. (b) Perception of FPS Dealers about the Role of Panchayats in PDS
The factors by which the FPS Dealers identify or perceive the role of Panchayats in
PDS include both positive and negative functions by Panchayats in helping or hindering the
functioning of the PDS. The positive factors include the role of Panchayats as 'helping
distribution' (response of 85.7 per cent of FPS Dealers) and 'checking the stock and rate'
(17.9 per cent). The negative factors include 'illegal demand for items' by Panchayat
members, 'inactive Panchayat members', 'Panchayat members actually getting more items'.
These negative factors, however, cover a thin minority of the FPS Dealers. The summation of
the percentages of FPS Dealers revealing single or multiple factors, positive and/or negative,
is naturally more than 100.00. FPS Dealers running shops for less than 5 years never
mention the negative factors (Table 4.47).
Table 4.47 Perception of the FPS Dealers about the Role of Panchayats in PDS
Age of FPS Licences/ Role of Panchayats
Below 2 Years
2 to 5 Years
5 to 10 Years
Above 10 Years
Total
Panchayat members get more quantity than allotted
- - 1 (7.7)
- 1 (3.6)
Illegal demand for items - - 2 (15.4)
- 2 (7.1)
Helping distribution 2 (100.0)
1 (50.0)
10 (76.9)
11 (100.0)
24 (85.7)
Check the stocks and prices 1 (50.0)
1 (50.0)
1 (7.7)
2 (18.2)
5 (17.9)
Panchayats not active - 1 (50.0)
1 (7.7)
- 2 (7.1)
Total 2 (100.0)
2 (100.0)
13 (100.0)
11 (100.0)
28 (100.0)
Source: Field survey.

105
(c) Perception of the Panchayat Members about the Role of Panchayats
in PDS We interviewed a total of 24 members in Gram Panchayats that include 'Pradhan',
'Deputy Pradhan', 'Panchayat Member' and 'Ex-Pradhan'. As high as 79.2 per cent of these
members accepted in principle the responsibility to ensure regular distribution of items
through PDS. The other responsibilities mentioned by the Panchayat members include
'making new ration cards', 'checking the stocks', 'solving local problems', 'checking the
quantity of items and their prices' etc. As high as 12.5 per cent of these members revealed
'ignorance' about their responsibilities while 8.3 per cent did not respond. These percentages
are calculated on the basis of overlapping inclusion in the categories characterizing
responsibilities, so that the summation of percentages will be more than 100.0 (Table 4.48).
Table 4.48
Perception of the Panchayat Members Regarding the Role of the Panchayats in PDS
Responsibilities Number of Panchayat Members
Percent
Making new ration cards 1 4.2 Ensuring regular distribution 19 79.2 Checking the stocks 3 12.5 Solving local problems 4 16.7 Check FPS price and quantity 4 16.7 Ignorance 3 12.5 No response 2 8.3 Total 24 100.0 Source: Field survey. 4.17 Perception of the Households about How to Improve the
Functioning of the PDS Of the total households supposed to offer suggestions for improving the functioning
the PDS, 21.2 per cent abstained from offering any suggestions. We, however, express the
major suggestions in terms of households as percentage of the total households (1400). The
summation of these percentages will obviously exceed 100.0 per cent, for their being multiple
suggestions by any specific household. What we really care for, thus, is the weight of any
particular suggestion.
As high as 33.0 per cent of the households suggested that items should be regularly
distributed through the FPSs. Still higher is the percentage of households who suggested that
the price of kerosene per unit (liter) should be reduced. There are overlapping inclusion of
households offering these suggestions. The other major suggestions include that (i) the prices
of items distributed through FPS should be lower than the market rates, (ii) quantity of each of
kerosene and sugar distributed should be increased, (iii) quantity of rice and wheat distributed
should be increased, (iv) there has to be provision to get the items in installments, (v) as a
corollary of (iv), the items should be distributed throughout the month, (vi) quality of items
should improve, (vii) FPS should be located inside the village etc. By economic categories,

106
BPL and APL, there are no major differences in suggestions offered for improving the
PDS (Table 4.49).
Table 4.49 Suggestions Offered by the Households for Improving the Functioning of the PDS
Suggestions BPL APL Card-less Total
Items should be regularly distributed 285 (35.1)
173 (30.0)
4 (36.4)
462 (33.0)
Information must reach the cardholders 26 (3.2)
15 (2.6)
- 41 (2.9)
Rate of Items of FPS should be lower than market rates
215 (26.5)
156 (27.0)
1 (9.1)
272 (26.6)
Quantity of rice and wheat should be increased
48 (5.9)
32 (5.5)
- 80 (5.7)
Quantity of kerosene should be increased
134 (16.5)
153 (26.5)
- 287 (20.5)
Quantity of sugar should be increased 91 (11.2)
97 (16.8)
- 188 (13.4)
Quality of items should be better 32 (3.9)
48 (8.3)
- 80 (5.7)
Edible oil and other items should also be distributed
25 (3.1)
22 (3.8)
- 47 (3.3)
Items should be distributed throughout the whole month
67 (8.3)
24 (4.2)
1 (9.1)
92 (6.6)
There has to be provision to get items in installments
47 (5.8)
14 (2.4)
1 (9.1)
62 (4.4)
Rice and Wheat should also be distributed to APL (at same rate)
15 (1.8)
49 (8.5)
- 64 (4.6)
Price of kerosene should be reduced 305 (37.6)
269 (46.6)
- 574 (41.0)
Assessment for identification of BPL and APL should be corrected
69 (8.5)
19 (3.3)
1 (9.1)
89 (6.3)
FPS should be in the village 21 (2.6)
2 (0.3)
1 (9.1)
24 (1.7)
Ration cards should be issued to card-less households
- 3 (0.5)
10 (90.9)
13 (0.9)
Regular inspection must be done at the village level
77 (9.5)
76 (13.2)
- 153 (10.9)
Present system is good 24 (3.0)
20 (3.5)
- 44 (3.1)
No response 197 (24.3)
99 (17.2)
1 (9.1)
297 (21.2)
Total 812 (100.0)
577 (100.0)
11 (100.0)
1400 (100.0)
Source: Field survey. 4.18 Reactions of Fair Price Shop Dealers
(a) About the State Supply Department
Of the 28 FPS Dealers interviewed in 24 villages and 4 wards of two towns, the age-
distribution of these shops from the date of registration/licence, is weighted in favour of the
shops operating for more than 5 years. These shops cover 85.7 per cent of the total FPSs. Of
this, the FPSs operating for a period below 10 years is marginally more than the number of
FPSs operating for a period above 10 years.

107
As high as 71.4 per cent of the FPS dealers revealed their satisfaction with the State
Supply Department, of which FPSs operating for a period less than 5 years revealed
satisfaction cent per cent. It seems, for new license holders/newly registered, it becomes a
compulsion to be satisfied cent per cent with the Supply Department. The FPSs between 5 to
10 years and above 10 years are more or less equally distributed by the criterion of 'being
satisfied with the supply Department'. As low as 3.6 per cent of FPSs, that too only within the
age-bracket of 5 to 10 years, expressed dissatisfaction by citing the reason of 'access of
powerful shopkeepers to better quality items'. The reasons like 'delay in delivery of items',
'poor quality of items issued', 'bribing and commission' are cited by the FPSs operating for a
period above 5 years. Since the 'wholly satisfied' FPSs operating above 5 years as a
percentage of all FPSs (28) cover 57.14 per cent and 80.0 per cent of the 'wholly satisfied'
FPSs group (20), hence the reasons cited as reactions for dissatisfaction expressed by the
FPSs is only marginal (Table 4.50).
Table 4.50 Reactions of FPS Dealers about Supply Department
Age of FPS Licences/
Reactions Below 2 Years
2 to 5 Years
5 to 10 Years
Above 10 Years
Total
Access of powerful shopkeepers to better quality items
- - 1 (7.7)
- 1 (3.6)
Poor quality of items issued - - 2 (15.4)
1 (9.1)
3 (10.7)
Bribing and commission at all layers
- - 1 (7.7)
1 (9.1)
2 (7.1)
Delay to deliver the items - - - 3 (27.3)
3 (10.7)
Satisfied with Supply Department
2 (100.0)
2 (100.0)
9 (69.2)
7 (63.6)
20 (71.4)
Total 2 (100.0)
2 (100.0)
13 (100.0)
11 (100.0)
28 (100.0)
Source: Field survey.
(b) About Ration Card Holders
Of the 28 FPSs, as high as 75.0 per cent expressed satisfaction with the cardholders.
In this category, the FPSs operating for a period less than 5 years expressed satisfaction cent
per cent (with no reason cited for dissatisfaction). It may be that these dealers are willing to
run the PDSs in a steady and stable manner. There are minor differences in the extent of
satisfaction considering FPSs operating between 5 and 10 years, and FPSs operating over 10
years. The reasons offered by the FPS Dealers operating for 5 years and more for their
dissatisfaction with the card holders include (i) presence of households in the FPS without
ration cards, or with others' ration cards, (ii) Absence of Cardholders in time of distribution, (iii)
demand for items by Cardless households (Table 4.51).

108
Table 4.51 Reactions of FPS Dealers about the Cardholders
Age of FPS Licences/
Reactions Below 2 Years
2 to 5 Years
5 to 10 Years
Above 10 Years
Total
Cardholders do not come with ration cards
- - 1 (7.7)
- 1 (3.6)
Cardholders do not take items in time
- - 1 (7.7)
2 (18.2)
3 (10.7)
Card-less households want to draw items
- - 1 (7.7)
1 (9.0)
2 (7.1)
Households come with others' cards and get items
- - 1 (7.7)
- 1 (3.6)
Satisfied with cardholders 2 (100.0)
2 (100.0)
9 (69.2)
8 (72.7)
21 (75.0)
Total 2 (100.0)
2 (100.0)
13 (100.0)
11 (100.0)
28 (100.0)
Source: Field survey. (c) About Influential People
As high as 60.7 per cent of the FPS Dealers revealed 'no influence' from the local
influential people on the PDS. In terms of the seriousness of the issue, however, the
remaining 39.3 per cent of the FPS Dealers who confirmed adverse influence on PDS
exercised by local influential people is significant. The factors that explain exercise of
influence include (i) willingness of the section to get items free of cost, (ii) willingness to get
more quantity than what is allotted, (iii) creating conflicts with FPS Dealers, (iv) Panchayat's
unwarranted pressure (Table 4.52).
Table 4.52 Reactions of FPS Dealers about Influential People Affecting the PDS
Factors Showing Influence Number of FPS
Dealers Percent
Want to get items free of cost 1 3.6 Want to get more quantity of items 4 14.3 Quarrelling with FPS dealers 6 21.4 Panchayat's pressure 2 7.1 No influence 17 60.7 Total 28 100.0 Source: Field survey.
4.19 Problems of FPS Dealers Regarding Quantity of Items Allotted by
Supply Department, Withdrawal of Quota and Transportation, and Adjustment of the FPS Dealers Regarding Undistributed Items
(a) Quantity of Items Allotted by Supply Department
Of the total (28) FPS Dealers, as high as 82.1 per cent expressed satisfaction by
'adequacy' of the quantity of items allotted. All the FPS Dealers running the shops for less
than 5 years are satisfied with the allotted quantity. This distribution is peculiar in the sense
that the FPS dealers running the shops for more than 5 years but less than 10 years cite the
'problems regarding allotted quantity' in the main. These 'problems of inadequacy' relate to

109
'inadequate quantity allotted', 'absence of Godown-in-charge', 'inadequate quantity of sugar
allotted', 'lack of budget in Godown' etc. More than 90.0 per cent of the FPS Dealers (11),
running shops for more than 10 years, expressed satisfaction with the Supply Department so
far as adequacy of allotted quantity' is concerned. This is cent per cent for all the FPS Dealers
running shops for less than 5 years (Table 4.53 & Fig. 4.9).
Table 4.53 Problems of FPS Dealers about Quantity of Items Allotted by Supply Department
Age of FPS Licences/
Problems Below 2 Years
2 to 5 Years
5 to 10 Years
Above 10 Years
Total
Allotted quantity inadequate - - 1 (7.7)
1 (9.1)
2 (7.1)
Godown in-charge often absent - - 1 (7.7)
- 1 (3.6)
Lack of budget in godown - - 1 (7.7)
- 1 (3.6)
Quantity allotted of sugar inadequate
- - 1 (7.7)
- 1 (3.6)
Allotted quantity of items adequate
2 (100.0)
2 (100.0)
9 (69.2)
10 (90.9)
23 (82.1)
Total 2 (100.0)
2 (100.0)
13 (100.0)
11 (100.0)
28 (100.0)
Source: Field survey. (b) Withdrawal of Quota and Transportation
We express the problems cited by the FPS Dealers in withdrawal of Quota and the
transportation of items withdrawn for distribution by weightage, weightage measured by
percentage of FPS Dealers citing a particular or multiple of problems in the said processes.
The summation of weightage thus will be more than 100.0. The problem that comes first in
weightage is 'high transportation cost', followed by 'low market price of rice and wheat', 'low
commission of FPS Dealers', 'late delivery of items'. The first one is cited by 57.1 per cent of
FPS Dealers, the next three are cited by 14.2 per cent of FPS Dealers for each with
overlapping FPS dealers in the problem categories. The other problems cited are 'late
P ro b le m s o f F P S D ea le rs a b o u t Q u a n tity o f Ite m s A llo tte d b y S u p p ly
D e p artm e n t
0 0
7.7
9.1
0 0
7.7
00 0
7.7
00 0
7.7
0
100
100
69.2
90.9
0
2 0
4 0
6 0
8 0
1 00
1 20
Be lo w 2y ea rs
2 to 5y ea rs
5 to 1 0y ea rs
A b ov e 10y ea rs
F ig . 4 .9
Per
cent
age
A llo tte dq ua ntityina de qu ate
Go do w n in-c ha rge o f te na bs en t
L ac k ofb ud ge t ing od ow n
Qu an titya llo tted o fs ug arina de qu ateA llo tte d

110
delivery of items', 'poor quality of items', 'insufficient allotted quantity', 'monsoon (rainy
season) related problems'. 17.9 per cent of FPS Dealers cited 'no problems' regarding
withdrawal of quota, transportation of items etc. Excepting 'inadequate allotted quantity', the
FPS dealers running shops for less than 5 years did not mention any problem regarding quota
and transportation of items (Table 4.54 & Fig. 4.10).
Table 4.54 Problems of FPS Dealers Regarding Withdrawal of the Quota and Transportation
Age of FPS Licences/
Problems Below 2 Years
2 to 5 Years
5 to 10 Years
Above 10 Years
Total
High transportation cost 1 (50.0)
2 (100.0)
5 (38.5)
8 (72.7)
16 (57.1)
Low commission on items for the dealers
- - 1 (7.7)
3 (27.3)
4 (14.2)
Monsoon-related problems 1 (50.0)
- - 1 (9.1)
2 (7.1)
Late delivery of items - - 3 (23.1)
1 (9.1)
4 (14.2)
Commission and bribing at all steps
- 1 (50.0)
4 (30.8)
2 (18.2)
7 (25.0)
Low market price of rice and wheat
- - 1 (7.7)
3 (27.3)
4 (14.2)
Insufficient allotted quantity - - 1 (7.7)
- 1 (3.6)
Pressure to give items to card-less households
- - - 1 (9.1)
1 (3.6)
Poor quality of items - - - 1 (9.1)
1 (3.6)
No problems 1 (50.0)
- 2 (15.4)
2 (18.2)
5 (17.9)
Total 2 (100.0)
2 (100.0)
13 (100.0)
11 (100.0)
28 (100.0)
Source: Field survey.
Problems of FPS Dealers Regarding Withdrawal of the Quota and Transportation
50
100
38.5
72.7
0 0
7.7
27.3
50
0 0
9.1
0 0
23.1
9.1
0
50
30.8
18.2
0 0
7.7
27.3
0 0
7.7
00 0 0
9.1
0 0 0
9.1
50
0
15.4
18.2
0
20
40
60
80
100
120
Below 2years
2 to 5 years 5 to 10 years Above 10years
Fig. 4.10
Per
cen
tag
e
High transportation cost
Low commission on itemsfor the dealersMonsoon-related problems
Late delivery of items
Commission and bribing atall stepsLow market price of riceand w heatInsuff icient allotted quantity
Pressure to give items tocard-less householdsPoor quality of items
No problems

111
(c) Undistributed Items
The methods by which the FPS Dealers adjust the undistributed items are many.
Most of the methods adopted, however, go either as 'items distributed in the next month' or
'non-existing undistributed stocks', the first one covering 53.6 per cent of the FPS dealers.
The other methods adopted include 'items sold in the open market', 'undistributed inferior
quality of items merged with better quality of the same items', 'rice and wheat sold to APL
households'. These other methods are cited by FPS Dealers operating shops for more than 5
years (Table 4.55).
Table 4.55
Methods of Adjustment Adopted by the FPS Dealers Regarding Undistributed Items
Age of FPS Licences/ Methods of Adjustment
Below 2 Years
2 to 5 Years
5 to 10 Years
Above 10 Years
Total
Items distributed in the next month
1 (50.0)
2 (100.0)
4 (30.8)
8 (72.7)
15 (53.6)
Merged with better quality for sale
- - - 1 (9.1)
1 (3.6)
Items sold in the open market - - 1 (7.7)
- 1 (3.6)
Rice and wheat sold to APL households
- - - 1 (9.1)
1 (3.6)
Stocks do not remain undistributed
1 (50.0)
- 8 (61.5)
1 (1.1)
10 (35.6)
Total 2 (100.0)
2 (100.0)
13 (100.0)
11 (100.0)
28 (100.0)
Source: Field survey.
4.20 Awareness of the FPS Dealers about the Commission on Different Items
The distribution of the number of FPS Dealers in terms of their knowledge about the
commission on items they are entitled to vary sharply between items. In case of each of rice
and wheat, as high as 82.1 per cent of FPS Dealers know the rate of commission per kg.,
while in case of sugar, the percentage is 64.3, and in case of kerosene it is as low as 28.6
percent. There are also inter-regional, rural and urban, variations in knowledge of FPS
Dealers about the rate of commission per unit on the items. In case of rice and wheat, for
example, there is no urban FPS Dealer who does not know the rate of commission on these
items. Only in case of kerosene, rural FPS Dealers are in more 'knowledge command' so far
as the rate of commission per liter on kerosene is concerned (Table 4.56).

112
Table 4.56 Awareness of the FPS Dealers about the Commission on Items
Rice Wheat Sugar Kerosene Area
Know Do not Know Know Do not Know Know Do not Know Know Do not Know Total
Rural 19
(79.2)
5
(20.8)
19
(79.2)
5
(20.8)
16
(66.7)
8
(33.3)
7
(29.2)
17
(70.8)
24
(100.0)
Urban 4
(100.0)
- 4
(100.0)
- 2
(50.0)
2
(50.0)
1
(25.0)
3
(75.0)
4
(100.0)
Total 23
(82.1)
5
(17.9)
23
(82.1)
5
(17.9)
18
(64.3)
10
(35.7)
8
(28.6)
20
(71.4)
28
(100.0)
Source: Field survey.

Chapter - Five
Public Distribution System in the District of Allahabad: Major Observations and Suggestions
'When there is a limited amount of food, with the market dividing it among the population according to their respective purchasing power and market pulls, a worsening of the relative position of some groups in the scale of money incomes can lead to an absolute decline in their ability to command food. In food battles, the Devil takes the hindmost' (Dreze, J., and Sen, A., 1989, Hunger and Public Action, Clarendon Press, Oxford, p. 48-49).
5.1 Major Observations
The major observations that we attempt to record here are based on the facts that we
collected in the field for the study on public distribution system in the District of Allahabad.
Distribution of Items
(x) In almost all the villages, rice and wheat were not made available to the families
owning ration cards. Even when these items arrived, a single day was fixed for
distribution so that the income-poor (BPL) families were deprived. The simple reason
is, apart from lack of timely information, the BPL families lack the power and time to
collect money to buy the items abruptly announced for sale through the FPS.
(xi) We found false/wrong entries in the cards for most of the BPL families, entries
implying that all these families got all the items at scheduled rates (quantity and
price).
(xii) No cash memo was ever issued by any of the FPS owners.
(xiii) Even when the items were made available and the supply position was announced by
the FPS Dealer, the prices per unit of items were not displayed.
(xiv) One consequence of (iv) was that the benefits of price-differential (sale price --
scheduled PDS price) went in favour of the FPS Dealer.
(xv) Sugar was usually irregular in supply.
(xvi) Kerosene per head was distributed much less than what was allotted and that too at
prices higher than the scheduled PDS rate.
(xvii) The section in higher socio-economic category derived almost all the benefits from
irregular supply of items from the FPSs.
(xviii) We found some villages where socially upper caste people continue to (mis)use the
PDS by availing items much more than what is fixed per card.
Gap between Requirement and Distribution of Items
The gap between requirement of households for items and distribution of items per
period by FPSs shows that the PDS at the level of the District of Allahabad has failed

114
miserably in supplying essential commodities to the population across board, both BPL and
APL, excepting kerosene. The implicit assumption is that the PDS in existence has the aim to
fulfil most of the requirements of the target groups for essential commodities distributed
through the FPSs.
APL households have a little higher requirement, per household per month, for all the
items, rice, wheat, sugar, and kerosene, relative to the corresponding requirements of BPL
households. The consumption requirements of APL households for sugar is double that of
BPL households per household per period.
Most of the requirements of APL households are met through open market, excepting
kerosene. For BPL households, most of the requirements of kerosene are met through PDS.
The cardless households somehow manage to draw rice, wheat and kerosene from the FPSs
but not sugar.
In terms of consumption requirements for items by specific economic categories, BPL
and APL, there is consistency across Blocks in the District. There exists a minimum
requirement of BPL households for at least rice and wheat, which are very significant by
quantity in the consumption basket.
So far, for each Block and Town surveyed, the average allotment accounts for very
insignificant percentage of requirements. Saidabad Block draws tremendous attention so far
as allotment of rice is concerned. The Block that draws attention in terms of necessity to allot
more of wheat is Saidabad. The fact is that very low distribution rather than high requirement
explain the large gap in items between requirement of households and distribution by the FPS
Dealers for Saidabad, so far as rice and wheat are concerned. Saidabad Block draws more
attention though the fact remains valid for all the Blocks studied that allotment of essential
items offers a very poor picture relative to the required consumption.
Since requirement of kerosene is satisfied more or less equally across economic
categories, BPL and APL, through supply by FPSs, hence we do not find any tangible gap in
requirement and distribution of kerosene.
Price Gap in Items between FPSs and Open Market
The prices of essential items that we recorded are the prices reported by the
households, that is, the prices the households pay while they buy the items, from FPSs as
well as from the open market (for the same quality of items).
The absolute magnitude of the price gap for rice differs from the percentage
magnitude of the price gap, excepting Kaurihar Block. Calculated on a very low range of
variation in ' reported FPS price', the 'absolute magnitude of price gap' for wheat Blockwise is
negligible.
It is observed during the period of survey that the market price of wheat is even lower
than FPS price for the same quality of the item in Sankargarh Block. The item wise price-
differential, thus, is not unidirectional, that is, not necessarily showing higher market price.

115
The reported absolute price gap differs from percentage price gap for sugar
considered over Blocks, the reasons being both differences in 'reported FPS prices' and
'reported open market prices' for items.
For kerosene, there is one-to-one correspondence between 'absolute price gap' and
'percentage price gap' considered over Blocks in the District of Allahabad.
The inter-regional, Blockwise and Townwise, variations in reported FPS price per
item is not significant, considering over BPL and APL households. In other words, both BPL
and APL households pay same or similar prices for essential items in all the Blocks and
Towns. There is also not much variation in open market rates as bought by BPL and APL
households of the items considered as reported by the households.
Household Consumption Expenditure on Essential Commodities and Implicit Income Transfer
We have calculated the annual expenditure of households on essential items
(received by households), by quantity of items consumed evaluated at the market price and at
FPS price. The implication is that at least 10.0 per cent of expenditure can be saved by
households, both BPL and APL, if the required consumption quantity is supplied through
FPSs. The price prevailing in the open market as reported by the households is by no means
an overestimation, as reflected by the willingness of a major section of the households to buy
from the open market.
The items distributed through FPSs at FPS prices (higher than what is fixed) show
not only a huge gap (90.0 per cent) between required expenditure on essential items (by
consumption requirements of households) and expenditure incurred by households at FPS
level, but also the scope for increased distribution of items.
Annual expenditure by BPL households on items actually supplied by FPSs and
received by the households shows higher percentage (12.6) of their market-based
expenditure relative to the same of APL households (7.5). One interpretation could be that if
all the required items were distributed through the FPSs at FPS prices, price taken to be the
same for both BPL and APL households, the possibility of saving (or income transfer) would
be more for APL households; for BPL households it is 87.4 per cent increase while for APL
households it is 92.5 per cent increase. This is where the question of targeting the BPL
comes in terms of coverage by FPSs.
Time-Response of the Households in Purchasing Commodities from the FPSs
Only kerosene as an essential item satisfies the objective of regular purchase by
households, independent of the price per unit of kerosene. While for kerosene the response
to supply by the FPSs is same or similar for all households, BPL and APL, over all blocks and
towns for rice, wheat, and sugar, the response is poor in terms of regular purchase from the
FPSs.

116
There are intra-Block and intra-Town differences between BPL and APL households
in terms of non-regular purchases of essential items.
The reasons offered by the households for non-regular purchase of rice and wheat
are (i) non-distribution and irregular distribution, (ii) non-allotment of these items to APL
households, (iii) unfelt need for items distributed through FPSs, (iv) poor quality of items, (v)
low market prices prevailing, (vi) non-availability of information, (vii) absence of disposable
money at a point of time. As such, the reasons, though seem to be overlapping, show the
dissection of reasons rooted in less than perfect functioning of the PDS network so far as rice
and what are concerned.
For only a cross section within BPL households, like stone breakers in Shankargarh
Block, 'absence of disposable money at a point of time' is a major explanatory factor for non-
regular purchase of all the essential items.
The reasons offered by the households, separately BPL and APL, for non-regular
purchase of sugar are similar to those cited in case of rice and wheat. Here 'lack of
disposable money at a point of time' explains the percentage coverage of households more
by BPL.
Consumption of Sugar by Economic Categories
The response of economic categories, BPL and APL, shows 'opposite relative
response' intra-Block, relative to APL households, it being a response to the question of
regularity in consumption of sugar by households and its fulfillment by purchase from the
FPSs.
Of the BPL consumers of sugar, which is 62.06 per cent of all BPL households
selected for the study, only 32.5 per cent responded as satisfying the whole quota of sugar
from the FPSs. As high as 43.1 per cent of BPL households buy sugar wholly from the open
market, and the rest of the households buy partially from both the open market and the FPSs.
In general, the households satisfying their requirements of sugar wholly from the FPSs on
average at the level of Blocks and Towns center around the average at the level of the District
which is around 31.7 per cent of households.
Consumption of Kerosene by Economic Categories
There is no unique indication of the satisfaction expressed by BPL and APL
households by the indicator of sufficiency in allotment and distribution of kerosene.
The distribution of households, who satisfy the extra requirement of kerosene (extra
in the sense of consumption requirement of kerosene over what is allotted per period) from
open market, are evenly distributed over APL and BPL households, when the percentage of
these households are calculated as percentages of their respective totals in the District. Of
the non-fully satisfied households, there are inter-Block and inter-Town variations in
percentages of households and also intra-Block and intra-Town variations by BPL and APL
categories of households with no uniqueness to show if a particular Block or economic
category remains non-satisfied.

117
Some Item-Specific Problems in Distribution of Items from the FPSs
Mostly the APL households cite non-allotment of rice and wheat, though non-
allotment of each of rice and wheat to APL households is not uniform for Blocks and Towns.
The factor that explains the seriousness of the problem in distribution of rice and wheat is
given by non-availability as distinct from non-allotment.
We found no report of 'non-allotment' and 'unfelt need' for kerosene for Blocks,
Towns and hence for the District, considering both BPL and APL households.
The Block wise distribution of the satisfied households among BPL and APL Block-
wise does not show any uniform trend for sugar. Similarly, the BPL unsatisfied households as
percentage of all BPL households for any Block does not show uniformly higher or lower
percentage when compared with APL unsatisfied households as percentage of all APL
households for any particular Block, sugar being the item considered.
Withdrawal of Sugar from the PDS
The question of withdrawal of sugar from the PDS is hypothetical in the sense that,
given the actual consumption requirements of sugar of the respective economic categories
and given prevailing actual prices in the open market and FPSs, the question aims at
examining what would happen if sugar is not at all distributed through the FPS. In collection of
information from the field, however, we could not question the knowledge or ignorance of the
respondents (households) in understanding the uncertainties in response to the question that
is speculative in nature.
There is no uniform response in adverse effect with respect to withdrawal of sugar
from the PDS. There are inter-Block and inter-Town variations in this response, and also
there are inter-economic categories variations considered intra-Block and intra-Town in terms
of adverse and non-adverse cases in response to the question of withdrawal of sugar. Nor is
there any major variation in distribution of households by BPL and APL categories, intra-Block
and intra-Town, in terms of revealing adverse effect consequent upon the withdrawal of sugar
from the PDS.
Confinement of PDS to Rice and Wheat only
There is uniformity in general in distribution of unsatisfied households by economic
categories with respect to confinement of PDS to rice and wheat only. In terms of distribution
of unsatisfied households over economic categories, there is no uniformity by intra-Block and
intra-Town calculations. The focus in the responses of the households in general is against
confinement of PDS to rice and wheat only.
The reasons put forward by the unsatisfied households in response to the question of
confining PDS to only rice and wheat include factors like 'irregular distribution of these items',
'poor quality of these items', 'higher FPS price relative to market price', 'essentiality of
kerosene in particular', 'essentiality of kerosene and sugar' etc. Thus, the response of the
unsatisfied households range from 'obstruction of kerosene and sugar' from being withdrawn
from PDS to initiating positive steps for distribution of quality-rich items of rice and wheat
regularly at really fair price.

118
The reasons put forward by satisfied households in response to the question of
confinement of PDS to only rice and wheat include conditions like 'regular distribution of these
items for the whole month', 'improved quality of items', 'lower FPS prices', 'increased
allotment' etc. For both BPL and APL categories, what matter for their satisfaction lie in 'FPS
price vis-a-vis open market price', and 'quantity allotment vis-a-vis quantity requirement' of
items.
Requirement of Kerosene
The response of the households regarding their need for kerosene distributed through
the FPS is clearly in favour of regular supply even when the residential houses have
electricity. The inter-economic category (BPL and APL) variations in response over Blocks
and Towns for 'felt' and 'unfelt' need for kerosene in hypothetical presence of electricity is not
uniform. The precise point is that the supply of electricity does not in general make any
difference so far as the requirement of kerosene being satisfied through FPSs is concerned.
Verification of Ration Cards
On the assumption of one card possessed by one household, it is confirmed that the
State Department has verified most of the cards. This verification has been done half-
heartedly in the sense that only the identity of the cardholder has been checked once for all
with no action taken as a follow-up measure like cancellation of false/misplaced cards, issuing
new cards to the card-less, and steps taken regarding expansion in units.
Distribution of Ration Cards
(i) Many income-poor (BPL) families have remained cardless,
(ii) Many BPL families have yellow cards, which are meant for non-poor,
(iii) Many non-poor families have white cards, which are meant for the poor.
The above imply non-distribution of cards and wrong distribution of cards.
Awareness of the Households regarding Price Chart, and Price Information
We examined awareness of the households in terms of the indicators like visibility of
Price Chart at FPSs and hence price information. The non-visibility of Price Chart at FPS is
cited more by BPL households, the latter seen as percentage of all BPL households reporting
non-visibility and seen also as percentage of all households reporting non-visibility of Price
Chart.
The ignorance of the households regarding visibility of Price Chart at FPSs is much
less for urban areas relative to the rural areas.
The correctness of Price Information, even when the Price Chart is available in FPSs,
is questionable, as reported by the households of all categories, BPL and APL. For urban
areas, the percentage of households in the category of confirmation in availability of correct
information is higher, relative to those for the rural areas. We found no unique weight-
differential between BPL and APL households, weightage calculated by percentage of

119
households in the respective categories as percentage of their respective total number in the
Blocks and the Towns, in their responses to correctness of Price Information.
The precise point is that most of the households, both BPL and APL, do not know the
correct price of items being distributed for them through the FPSs. The fact is that the
households in urban areas did not confirm as having correct price information of rice and
wheat. The inter-regional variations (Blockwise and Townwise) in the number and
percentages of households (separately within BPL and APL and between BPL and APL) does
not make much sense in a state of wholesome ignorance (lack of awareness) of most of the
households about correct price information of items distributed through the FPSs.
The distribution of the households at the District level between BPL and APL
households who know the names of the relevant FPS Dealers is equiproportionately related
with the distribution of all households selected between BPL and APL categories of
households.
Perception of the households about FPS Dealers
Most of the households in general expressed satisfaction about the FPS dealers.
There are inter-regional variations (Block wise and Town wise) in the distribution of
households who expressed satisfaction. Also, there are inter-economic category variations in
the extent of satisfaction, intra-Block and intra-Town, with no uniformity.
Most of the households conveyed that the FPS Dealers follow scheduled time in
operating the shops. There are, however, inter-Block and inter-Town differences in the
perception of the households regarding scheduled time followed by the FPS Dealers. The
category characterizing ignorance of the households about time followed by the FPS Dealers
covers more of BPL households relative to the APL households as percentages of their
respective totals.
Perception of the households about the Role of Panchayats in PDS
The distribution of households who are aware of the role to be played by the
Panchayats in PDS is evenly distributed over BPL and APL categories, as percentages of
their respective totals. There are, however, inter-regional variations in 'prudent' and 'ignorant'
households in terms of perception about the role of Panchayats in PDS.
Perception of the FPS Dealers about the Role of Panchayats in PDS
The factors by which the FPS Dealers perceive the role of Panchayats in PDS include
both positive and negative functions by Panchayats in helping or hindering the functioning of
the PDS. The negative factors that hinder the desired functioning of the PDS are not
mentioned by the FPS Dealers operating the shops for a period of less than 5 years.
Perception of the Panchayat Members about the Role of Panchayats in PDS
Almost all the existing and ex-members in Panchayats accepted in principle the
responsibility of ensuring regular distribution of items through PDS.

120
Reactions of FPS Dealers about the State Supply Department
Most of the FPS Dealers revealed their satisfaction with the State Supply
Department.
Reactions of the FPS Dealers about the Ration Cardholders
Most of the FPS Dealers expressed satisfaction with the cardholders. There are
minor differences in the extent of satisfaction considering FPSs operating between 5 and 10
years.
Reactions of the FPS Dealers about Local Influential People
Majority of the FPS Dealers reported 'no influence' from the local influential people on
the PDS. At a very informal level, however, it came to be revealed that the phenomena of
influence by local people, including public officials and persons from privileged socio-
economic-political categories, were not insignificant.
Problems of FPS Dealers about the quantity of items allotted by the Supply Department
Most of the FPS Dealers expressed satisfaction by 'adequacy' of the quantity of items
allotted. The problems cited in this respect cover mainly the FPS Dealers running the shops
between 5 and 10 years.
Problems of FPS Dealers Regarding Withdrawal of Quota and Transportation
Excepting 'inadequate allotted quantity', the FPS Dealers running shops for less than
five years did not mention any problem regarding quota and transportation of items. The FPS
Dealers operating shops for more than five years mentioned most of the problems regarding
withdrawal of quota and transportation of items.
Problems of FPS Dealers Regarding Undistributed Items
The reasons and methods of distributable items going to the open market and items
distributable for the BPL households going to the APL households have been reported by the
FPS Dealers, particularly those Dealers operating for more than five years.
Awareness of the FPS Dealers about the Commission on Different items
The distribution of the number of FPS Dealers in terms of their knowledge about the
commission on items they are entitled to vary sharply between items. There are also inter-
regional variations in knowledge of FPS Dealers about the rate of commission on the items.
5.2 Major Suggestions
The economic categories of the households, and the Fair Price Shop Dealers that we
covered in the sample, and also the responses of the Panchayat Members, have been taken
as the base for the suggestions offered here.
Households
For the minority of the households the PDS may be confined to distribution of rice and
wheat only, if (i) quantity allotted of each of these items is according to the need of the
households per period, (ii) the allotted items are distributed regularly throughout the

121
month/period, (iii) the quality of items are improved for same price per unit, (iv) the FPS price
per unit of items is less than open market price.
For the majority of the households, both kerosene and sugar are essential for
distribution through the FPSs; this response is more prominent regarding kerosene. The
supply of electricity in the residential houses of the households does not make any difference
so far as requirement for kerosene is concerned. The focus of the responses of the
households in general is against confinement of PDS to rice and wheat only.
The suggestions is general offered by the households for improved functioning of the
PDS are:
(i) Information must reach the cardholders well in advance per period (month) regarding
arrival and distribution of items through the FPSs,
(ii) There has to be regular distribution of items throughout the period (month),
(iii) There has to be provision for the poor (BPL) households to get the items from the
FPSs in installments,
(iv) Quantity of kerosene allotted per household per period should be increased,
(v) Quality of all items should be better,
(vi) Edible oil should also be distributed through the FPSs,
(vii) Quantity of sugar should be allotted more (mainly suggested by the APL households),
(viii) Rice and Wheat should be distributed to the APL households at the same price as it
is for the BPL households (mainly suggested by the APL households),
(ix) The price of items distributed through FPSs should be lower than open market price,
(x) The price of kerosene per liter should be reduced,
(xi) The FPS should be located inside the village,
(xii) There has to be regular inspection over the system operating at the village level,
(xiii) Ration Cards should be issued to card-less households,
(xiv) Assessment for identification of BPL and APL cardholding should be corrected,
(xv) Diversion of items to open market should be stopped,
(xvi) Quantity of rice and wheat per household per period should be increased.
By economic categories, BPL and APL, there are not major differences in suggestions offered
for improving the PDS.
Fair Price Shop Dealers
The suggestions in general offered by the FPS dealers for improved functioning of the
PDS are:
(i) Quantity allotted by the Supply Department should be adequate for each item,
(ii) The Godown-in-Charge has to be present during delivery/withdrawal of items,
(iii) Late delivery of items (by the Supply Department) should be stopped,
(vi) Commission (illegal payment) and Bribing should be stopped in the relation between
FPS Dealers and Supply Department,
(v) The FPS prices fixed for distributable items should be lower than open market prices
(for same quality of items),

122
(vi) Quality of items released from the Supply Department for distribution through FPSs
should be improved,
(vii) Measures are needed, to be initiated by the Supply Department, which reduce the
transportation cost of the FPS Dealers in carrying items for distribution,
(viii) There has to be non-discrimination in releasing quality items to the FPS Dealers
running shops for varying years,
(ix) There has to be allotment of items for card-less households,
(x) Awareness should be built so that cardholders come with verified cards and cardless
households do not come for drawing items from the FPSs,
(xi) Monsoon-related transportation problems for carrying items for distribution at the local
level should be taken care of by the Supply Department.
Panchayats
The suggestions, in general, offered by Panchayat members for improved functioning
of PDS are:
(i) Panchayats should ensure regular distribution of items at village level,
(ii) Panchayats should check the stocks in the FPSs at the beginning and at the end of
distribution of items per period,
(iii) Panchayats should check the quantity distributed per household per period, check the
visibility of Price Chart and also check price list of items,
(iv) Panchayats should take care of issuing new cards, particularly for card-less
households.
In addition to these, the suggestions that we received from the Supply Inspectors
(while in field) and the personnel in the State Supply Offices, including Regional Food Office,
have been taken care of in the following Chapter.

Chapter - Six
Recommendations
'Each household ...can store grains and other commodities only if authorized to do so; these can be requisitioned in times of calamities' (Kautilya, 'The Arthashastra', in L.N. Rangarajan (Ed), 1992, Penguin Books, p. 255).
6.1 Introduction
The objective of the Public Distribution System in India is to guarantee for the low-
income population a desirable per capita consumption of food. The supply-side nature of PDS
shows that even when there is stock and its release for distribution among the target group, a
sizeable section of the poor may not have access to it, the reason being income-poverty.
Reducing price of foodgrains has no lower limit, or it is zero at the lower limit, which implies
free distribution. This is not feasible. The subsidy-constrained determination of positive price
requires selection of target groups of population to be served, target commodities for
distribution for inclusion in the Public Distribution net and exclusion of the groups of
population that deserve to be excluded. The example that is quoted most in the context of
access of the poor to food and thus ensuring social safety is the Food Stamp Act of 1964 in
the USA (Claffey and Stucker, 1982, p. 42; Suryanarayana, 2000, p. 111). The benefits of this
programme go directly to those food-consumers who earn most of their income to be spent on
food. The public distribution system in India, particularly the targeted one launched since
1997, keeps in mind the similar logic.
6.2.1 Recommendations based on the Study
Based on the facts that we collected for the District of Allahabad regarding the
functioning of the Public Distribution System, and based on the observations that we gathered
in our conversations with the beneficiaries, we offer our recommendations for improving the
PDS in India. We recommend the continuation of the Targeted Public Distribution System
(TPDS) for the District of Allahabad, in keeping with the major policy perspective announced
in 1997 by the Government of India when it was launched.
For effective, efficient, and transparent functioning of TPDS, we recommend the
following measures:
(1) We recommend enhanced allotment of rice, wheat, and kerosene per household
per period, to be distributed through the FPSs. This enhanced allotment should
cover as much as practicable the consumption requirements of these items per
household per period. This distributive strategy is to be seen in a dynamic context
of changing asset (land)-income-consumption distributions and compositions.
(2) Based on the fact that most of the BPL households are regular buyers of rice,
wheat, and kerosene, provided they have prior information about arrival of these

124
items, we recommend the distribution of rice, wheat, and kerosene by the exact
quantity allotted at the right price. Also, based on the fact that there is irregular
distribution of these items, combined with the prevailing low (and often lower)
market price per unit of rice and wheat, we recommend the ensuring of regularity
in withdrawal of these items by the FPS Dealers for distribution among the
households without any time lag.
(3) We recommend provision of purchase of rice, wheat, and kerosene by
installments for a particular section of BPL households who do not have
disposable money as and when required (say, on a daily or weekly basis). One
example in our study is the case of 'stone-breakers' in the Sankargarh Block of
the District of Allahabad. The strategy of provision for 'Due Slip' for such sections
of cardholders to show their entitlements for the period (month) is a step in the
right direction. The modus operandi for execution of this 'Due Slip' strategy may
be left to the Panchayats, with Supply Inspectors operating at the village level
working as mediators between Panchayats and State Supply Department. One of
the mechanisms, we suggest, is 'Pay as and when the portion of items bought'.
(4) It followed from our observation that most of the BPL households need sugar on
a regular basis in their consumption basket. However, the irregular distribution of
sugar by the FPSs is the major reason for non-purchase of sugar by the BPL
households from the FPSs. Often availability of only a negligible fraction of the
allotted quota of sugar per card leads to non-purchase of sugar by the BPL
households. This is in spite of the fact that the intra-BPL inter-commodity price-
differential for sugar is much higher relative to other commodities, like rice and
wheat, distributed through the FPSs. The subsidy claimed to be provided by the
Government of India on sugar is not tenable at least at the time of our study when
the price-differential between open market and FPS for sugar is almost non-
existent. We recommend thus allotment and distribution of right quantity of sugar
per card for BPL households. The quantity of sugar required on average for
consumption is only 1.7 Kg. per household per month for the BPL in the District of
Allahabad. Thus, we have reasons to reject the hypothesis of 'huge subsidy' on
sugar account for supply to BPL households. The flexibility in policy option lies in
withdrawal of sugar from being allotted for APL households, thereby reducing the
procurement, storage, and transportation cost on account of sugar by the State
Department. The assumption is that the APL households can afford to buy sugar
from the open market. We, however, recommend 'special' distribution of sugar
during festivals. This special amount may follow allotment of a 'lump-sum'
amount by the Supply Department and distributed by the FPS in a proportion
determined by the total quantity allotted divided by the number of cardholders
attached to the concerned FPS.

125
(5) Based on the information of undistributed items in stock with the FPS Dealer, we
recommend allotment of the balance of items for the following month by the
Supply Department, the balance calculated after subtracting the stocks of the
preceding month from regular allotment of the following month. The Supply
Inspector-in-Charge of the cluster of villages will be responsible for reporting on
undistributed stock item wise to the Supply Department. In case of repetition of
undistributed items and its probable accumulation over periods (months) with the
FPS Dealers, an inquiry by the State Supply Department has to be conducted by
a 'Fact Finding Committee', as and when necessary, regarding the non-
functioning of the distribution system.
(6) Generally the price-differential for each of rice and wheat between economic
categories, BPL and APL, did not work at the level of the villages in the District of
Allahabad. This is, as reported by the APL households, in the sense that 'rice and
wheat are not allotted to the APL households'. The fact as we observed is that
the APL households demanded rice and wheat at the same price as being paid
by the BPL households. Maintaining this price-differential for each of rice and
wheat at the village level de facto implies confinement of distribution of rice and
wheat to BPL households only. We reject the price-differential (from the same
window at the same point of time) as a policy strategy and recommend quantity-
differential for rice and wheat by BPL and APL categories, the allotment per
household for the latter obviously being less than the former.
(7) In keeping with the recommendations (1) and (6) thus, we recommend enhanced
allotment of each of rice and wheat per household per period for BPL category,
and reduced allotment of each of rice and wheat per household per card for APL
category. The final outcome on total quantity to be allotted for rice and wheat at a
single FPS level, and for summation of FPSs, will depend on percentage of
cardholders in the BPL and APL categories, and their withdrawal-cum-
consumption habits of these items.
(8) We recommend reduced price of kerosene per liter for all households, BPL and
APL, than what it is now even if it costs more to the public exchequer. This
reduced price of kerosene per liter is expected not to lead to significant increase
in demand for kerosene. Rather, the implicit saving (income transfer) on kerosene
account is expected to be spent by the households on enhanced rice and wheat
allotted.
(9) We oppose automatic cancellation of licence/quota of FPS Dealer even if the
Dealer repetitively fails to withdraw items from the Supply Office. We recommend
for the State Supply Department initiation of action only after time-bound inquiry
is made about the non-withdrawal of items.

126
(10) We recommend raising the rate of commission for the FPS Dealers on rice,
wheat, sugar, and kerosene per unit with immediate effect. These rates should be
informed to the FPS Dealers.
(11) We recommend strong vigilance by the Panchayats and Supply Inspectors over
visibility of 'Correct Price Chart' for the items in the FPS. We also recommend
'secret and sudden' vigilance by the Regional Food Officer or any competent
authority on his behalf to check the quantity and quality of items, undistributed
stock etc. in the FPSs. The 'secret and sudden' vigilance has to cover at random
the households from both the BPL and the APL categories selected from all the
'Hamlets' within a particular village.
(12) We recommend the active and positive role of Panchayats in preparing 'correct
schedule' of cardholders, cardless households, and BPL and APL categories by
income and occupation. This role of Panchayats has to be interactive with State
Supply Office/BDO etc. for cross check/double check to ensure transparent
functioning of the system. In this context, we recommend Training for Panchayat
Members, including Panchayat Presidents, arranged by the State Supply
Department. These training programmes should take into confidence the
consumers' bodies (NGOs), Research Institutes and Universities located in the
neighbourhood to play a constructive role.
(13) We recommend reduced number of FPSs for vigilance by a single Supply
Inspector. The State Supply Department will have to ensure residence for stay
for the Supply Inspector in the locality and impose compulsion on him to stay in
the locality (whether or not in the assured residence in the locality) where he is
supposed to function. We also recommend a 'Vigilance Committee' at the village
level formed by the households from both the BPL and the APL categories. The
State Supply Department will be expected to collect information on the
functioning of the PDS at the village level from the Village Vigilance Committee.
(14) We strongly recommend a 'State Vigilance Committee' for the efficient and
transparent functioning of PDS. This committee has to be autonomous in the
sense of being independent of the State Supply Department and District and
Block Offices working towards the some purpose. However, the functions of the
autonomous 'State Vigilance Committee' are to seen as complementary to the
existing administrative network.
(15) We recommend public display of quantity of items distributed by the FPS Dealers
per period, and quantity of items remaining undistributed, one month-wise
calendar used for each of these 'displays'. The State Supply Department will have
to provide these calendars through the Supply Inspectors for use by the FPS
Dealers.
(16) We recommend the ensuring of compulsory maintenance of records for each of
sale, stock, and Ration Card Master Register by the FPS Dealers.

127
(17) We recommend the ensuring of verification of ration cards at the level of
households each year, issue new cards (for example, for new-born babies), issue
cards to cardless households/individuals, cancel false cards, reorient
misallocated (for example, by BPL and APL categories) cards etc.
(18) We recommend the revision of the 'Charter' (for PDS) which offers the
economically well off individual the eligibility for selection as an FPS Dealer. We
specifically recommend allotment of new FPS Dealership to local unemployed
educated youth, preferably from the socially disadvantaged and economically
vulnerable section of the locality.
(19) With the withdrawal point of items shifting to Regional (Tehsil Godown) level for
the FPS Dealers from the previously fixed FCI Godown, the process of
withdrawal has become a lengthy process, with the additional problem of keeping
budget (disposable money) in the hands of the distributing authority (Nigam at the
Regional Level). The Nigam/ Government Department will have to make
provision for this budget, rather than depending on money receipt in advance
from the FPS Dealers, the latter seeking to withdraw items. The State Supply
Department will have to check proper disposal of items at the Regional (Tehsil)
level.
(20) The State Supply Department will have to take appropriate steps to stop
criminal/illegal interference in the PDS network at the local level. The Department
is being requested to seek the support of the local people/village level
workers/social activists in this regard.
(21) We recommend the ensuring of positive role of Panchayats/NGOs/Supply
Department/Media for propaganda at the village level for development of
awareness of the households regarding 'right to food at fair price'.
6.2.2 Recommendations at a Glance
♦ Ensure regular distribution of rice, wheat, and kerosene by exact quantity allotted at
right price. Ensure withdrawal of rice and wheat by the FPS Dealers for distribution
among the households without any time lag.
♦ Ensure enhanced allotment of rice, wheat, and kerosene per household per period so
as to converge to the consumption requirements of the households per period for
these items.
♦ Delete price-differential for rice and wheat over BPL and APL categories and ensure
quantity-differential by allotting more of these items per household per period in
favour of the BPL category.
♦ Ensure reduced price of kerosene per liter for all households, BPL and APL, even if it
costs more to the public exchequer.
♦ Ensure provision of purchase of rice, wheat, and kerosene by installments for that

128
section of BPL households who can not have disposable money as and when
required to buy these items. Adopt a strategy of 'Due Slip' to be issued by the FPS
Dealers to the targeted sections as such within the BPL category of households.
♦ Ensure allotment and distribution of sugar for BPL households at the prevailing price.
Withdraw allotment of sugar for APL households. Announce 'special' distribution of
sugar during Festivals for both BPL and APL households.
♦ Raise the rate of commission on distribution of each of rice, wheat, sugar, and
kerosene per unit for the FPS Dealers with immediate effect.
♦ Ensure release of quota to be withdrawn by the FPS Dealer in a particular period
(month) after subtracting 'undistributed items' of the preceding period (month). Set up
a fact-finding Committee, as and when necessary, to find out the reasons behind
repetition of undistributed items accumulated over periods.
♦ Initiate time-bound inquiry for repetitive non-withdrawal of items by an FPS Dealer
instead of automatic cancellation of licence/quota of the Dealer.
♦ Ensure compulsory maintenance of records for each of sale, stocks, and Ration Card
Master Register by the FPS Dealers.
♦ Ensure allotment of new FPS Dealership to local educated unemployed youth
preferably from the socio-economically-disadvantaged sections in the locality.
♦ Stop criminal/illegal interference in the PDS network at the local level.
♦ Ensure verification of Ration Cards at the local level, including issuing new cards,
canceling false cards etc.
♦ Ensure budget provision at Nigam/Regional Supply Office for allotment of quota to
the FPS Dealers, rather than asking the Dealers to pay money in advance.
♦ Ensure public display of quantity of items distributed by the FPS Dealers per period,
and quantity of items remaining undistributed. The State Supply Department is being
requested to provide necessary calendar to the FPS Dealers for the said purpose.
♦ Ensure reduced number of FPSs for vigilance by a single supply Inspector. The State
Supply Department is expected to collect information from the 'Vigilance Committee'
voluntarily formed by the consumers (households) at the village level regarding the
functioning of the PDS at the local level.
♦ In addition to strong vigilance by the Panchayats and Supply Inspectors over visibility
of Correct Price Chart in the FPS, ensure 'secret and sudden' vigilance by RFO to
check items in FPSs by quantity and quality and undistributed stocks. The vigilance
by the RFO has to cover households also, both BPL and APL, at random in the
concerned village.
♦ Ensure active and positive role of Panchayats in an interactive manner with the State
Supply Department/BDO etc regarding preparation of correct schedule of
cardholders, by BPL and APL, and hence make it transparent. Ensure training for
Panchayat members for convergence to perfect functioning of the system. Ensure

129
active and positive role of Panchayats for development of awareness of households
regarding the 'right to food at fair price'. This requires an interactive frame among
Panchayats, NGOs, Supply Department, and Media.
♦ Form an autonomous State Vigilance Committee to work as a complementary unit
with the existing administrative network meant for the PDS.
We suggest introduction of supplementary measures like:
(i) guarantee of social security through schemes like Employment Guarantee
Scheme as in Maharastra, Unemployment Allowance/ Insurance etc. (ILO,
2000, p. 165, 167),
(ii) Food for Work Scheme, that can supplement PDS,
(iii) Food Coupon or Food Stamp system for the income-poor.
Cash support or cash aid, with or without food aid, as a strategy can not be
sustained. In fact, it may lead to 'food battles' (Dreze and Sen, 1989, p. 96). There has to
come thus a strategy like cash for work, for example, the one adopted by the government of
Maharashtra during 1972-73 drought (Dreze and Sen, 1989, p. 101). Maharashtra has been
duly recognized for its public intervention through the Employment Guarantee Scheme (EGS)
in terms of its effectiveness in reducing poverty and food insecurity (Suryanarayana, 1999, p.
78). Even if this injection of cash leads to inflation by increasing food prices, it will be
progressive by having its origin in higher purchasing power of the poor. The prescription
works better if additional employment is generated in the food sector. The food sector based
generation of employment may fail to uplift the income-poor above the poverty line for the
simple reason that the wage rate for these labourers may be too low to uplift them above the
poverty line (Dev, 2000, p. 198). The purpose of our study is however not to prescribe how
poverty can be eliminated. One of the objectives of our study is to examine the question of
access of the income-poor to the essential commodities and thus examine the feasibility of
the PDS to protect the poor. Since these measures ensure direct and indirect income,
including income transfer, to the socially and economically disadvantaged sections of the
population, hence PDS, even if it is a supply-side measure, can protect the poor when
supported by the measures that we suggested.

130
References
Ahluwalia, M.S., 1996, New Economic Policy and Agriculture: Some Reflections, Indian Journal of Agricultural Economics, Vol. 51, No. 3, July-Sept.
Balakrishnan, P., 1999, 'Agricultural Growth and Economic Welfare since 1991.' presented in the Foundation Day Seminar on 'Rural Prosperity and Agriculture: Strategies and Policies for the Next Millenium, Nov. 4-5, National Institute of Rural Development, Hyderabad, India.
Balakrishnan, P. and Ramaswami, B., 2000, Analysing Public Intervention in the Foodgrains Markets, Krishnaji, N. and Krishnan, T.N.(Ed), Public Support for Food Security, The Public Distribution System in India, Sage Publications, New Delhi.
Chatterjee, P.K., 1995, Emerging Perspectives of Agricultural Development in India, Indian Journal of Agricultural Economics, Vol. 50, No. 3, July-Sept.
Claffey, Barbara A., and Stucker, Thomas A., 1982, The Food Stamp Program, in Hadwiger Don., F., and Talbot Ross B, 'Food Policy and Farm Programs,' New York.
Clay, Edward, 1981, Food Policy Issues in Low-Income Countries, World Bank Staff Working Paper No. 473, Washington D.C.
Dandekar, V.M., 1994, 'The Indian Economy, 1947-92', Vol. I, (Agriculture), Sage Pub., New Delhi.
Dantwala, M.L., 1993, Agricultural Policy: Prices and Public Distribution System, Indian Journal of Agricultural Economics, Vol 48, No. 2, April-June.
Dev, S. Mahendra and Ranade, Ajit, 1997, 'Poverty and Public Policy, A Mixed Record', Parikh, Kirit S. (Ed), India Development Report, 1997, Oxford Univ. Press, Delhi.
Dev, S. Mahendra, 2000, Food Security with Emphasis on PDS vs EGS: A Tale of Two States, in Krishnaji, N., and Krishnan, T.N.(Ed), Public Support for Food Security, The Public Distribution System in India, Sage Pub., New Delhi.
Dreze, J. and Sen, A., 1989, Hunger and Public Action, Clarendon Press, Oxford.
Food and Agriculture Organization of the United Nations, 1987, 'Agricultural Price Policies: Issues and Proposals', Rome.
Ghose, Ajit Kumar, 1999, 'Food Supply and Starvation : A Study of Famines with Reference to the Indian Sub-Continent', in Dreze, Jean (Ed), The Economics of Famine, Edward Elgar Pub. Ltd., UK.
Government of India, 1991-92, Economic Survey.
Government of India, 1992-93, Economic Survey.
Government of India, 1993-94, Economic Survey.
Government of India, 1994-95, Economic Survey.
Government of India, 1995-96, Economic Survey.
Government of India, 1996-97, Economic Survey.
Government of India, 1997-98, Economic Survey.
Government of India, 1998-99, Economic Survey.
Government of India, 1999-2000, Economic Survey.
Government of India, Ministry of Agricultural and Irrigation, 1976, Report of the National Commission on Agriculture, Part I and Part II, New Delhi.

131
Hopkins, Raymond F., 1982 'Food Policymaking', in Hadwiger Don., F., and Talbot Ross B., Food Policy and Farm Programs, New York.
Institute of Social Sciences, 2000, Status of Panchayati Raj in the States and Union Territories of India, Concept Pub. Co., New Delhi.
International Labor Office (ILO), 2000, World Labor Report, Geneva.
Janvry, Alain De and Subbarao, K., 1986, Agricultural Price Policy and Income Distribution in India, Oxford University Press, Delhi.
Johl, S.S., 1995, Agriculture Sector and NEP, Indian Journal of Agricultural Economics, Vol. 50, No. 3, July-Sept.
Kautilya, 'The Arthashastra', in Rangarajan, L.N., (Ed), 1992, Penguin Books.
Khusro, A.M., 1973, Buffer Stocks and Storage of Foodgrains in India, Tata McGraw-Hill Pub. Co., Bombay-New Delhi.
Lappe F.M., and Collins J., 1977, Food First, The Myth of Scarcity, Souvenir Press (E&A) Ltd., London.
Majumder, Bhaskar, 1999, 'Liberalization of Indian Agriculture: The Relevance of Public Intervention in the Market for Foodgrains', IASSI Quarterly, V.17, N. 4 April-June.
Majumder, Bhaskar, 1999, 'Liberalization of Indian Agriculture: Implications for the Home Market for Foodgrains', in Roychoudhury, K.C., and Singh, R.P.,(Ed), National Institute of Rural Development, Hyderabad, India.
Meenakshi, J.V., 2000 'Food Consumption Trends in India: A Regional Analysis', in Krishnaji, N., and Krishnan, T.N.(Ed), Public Support for Food Security, The Public Distribution System in India, Sage Pub., New Delhi.
Mellor, John W. and Desai, Gunvant M., 1986, 'Agricultural Change and Rural Poverty: A Synthesis', in Mellor, John W. and Desai, Gunvant M. (Ed), Agricultural Change and Rural Poverty, Variations on a Theme by Dharm Narain, OUP, Delhi.
Mooij, Jos, 1999, Food Policy and the Indian State, The Public Distribution System in South India, Oxford Univ. Press, Delhi.
Narayana, N.S.S., Parikh, Kirit S., Srinivasan, T.N., 1991, Agriculture, Growth and Redistribution of Income, North-Holland in association with Allied Publishers Ltd, New Delhi.
Pearse, Andrew, 1980, 'Seeds of Plenty', Seeds of Want, Social and Economic Implications of the Green Revolution, Clarendon Press, Oxford.
Rajiv Gandhi Foundation, 2000, Panchayati Raj in India, Status Report 1999, March, New Delhi.
Rao, V.M., 1996, 'Policy Research for Liberalized Agriculture: Some Illustrated Research Areas, Indian Journal of Agricultural Economics, Vol. 51, Nos. 1&2, Jan-June.
Savy, Robert, 1972, Social Security in Agriculture and Rural Areas, International Labour Office, Geneva.
Storm, Servass, 1997, Trade Liberalization, the Terms of Trade and Agricultural Growth: The example of India, in Bhaduri, A. and Skartein, R. (Ed), Economic Development and Agricultural Productivity, Edward Elgar, UK.
Suryanarayana, M.H., 1999, 'Poverty, Food Insecurity and Levels of Living: Maharashtra', Journal of Indian School of Political Economy, Vol. XI, No. 1, Jan-March.
Suryanarayana, M.H., 2000, Food Security and Calorie Adequacy Across States: Implications for Reform, in Krishnaji, N., and Krishnan, T.N.(Ed), Public Support for Food Security, The Public Distribution System in India, Sage Pub., New Delhi.
The Hindu, 2000, Oct. 1, Sunday.

132
Appendix
Questionnaires
1. Questionnaire for Households 133-138
2. Questionnaire for Fair Price Shop Dealers 139-142
3. Questionnaire for Villages 143-149

133
;NNVIR8Q F<\+N LDU ONHNIWG IR.NX OD/)NNX@ E\NJNFNQ;NNVIR8Q F<\+N LDU ONHNIWG IR.NX OD/)NNX@ E\NJNFNQQuestionnaire for Households in Villages to be Surveyed in the District of
Allahabad for the Project “Public Distribution System” etc.
IRGNO >N�0� []NH LDSN�U� ������������� [NDR� ��������������
�� P5UMQNUN GN XNH� ��������������������������������������������������������������������������������
�� ILUN GN XNH� ��������������������� WNIU� (SC/ST-1, OBC-2, Gen.-3, Min.-4, Other.-5)
�� YN�T� �� I\D[� �LT��@ H���
�� IN^NN� �������������������������������� �� 2�RON�� ���������������������
�� LIMRNM GV OQ/��
GT\ LT��N HIJ\N F3SV
�� LNIMRNIMG IRRM�N�
«�OD�«�OD� XNHXNH O(FD�NO(FD�N I\D[I\D[ YN�TYN�T IN^NNIN^NN HT>� 2�RON�HT>� 2�RON�
�
�
�
�
�
�
�
�
�
��
��
��
��
��
ODGVU�ODGVU� O(FD�NO(FD�N �HNUNILUN�@LIULI5X�@+NNE=FJX�@ LT LT K�@ LNVUNLNVUK�@ FJZ� XN6GM�@ Y8���
N6I^NG /UMN6I^NG /UM �IXM^NM�@ ON^NM�@ ¹N)NIHG�@ P3S¹N)NIHG�@ HN��IHG�@ P3SUM HN��IHG�@
P3S�@ UGXKGK�@ Y8���
2�RON�2�RON� �¤I�N�@ ¤I�N HWQZM�@ [6M ¤I�N HWQZM�@ ¹NERV9 XN6GMK�@ OMGNMK XN6GMK�@ \"NT
2�RON��@ GTN\ GNMK[M�@ [CJ�NK�@ 1N ��@ FVMNVW[NM��@ Y8���

134
�� �IQ �G OV YI�NG 2�RON� HVD OD\;X J6 UNV HT>� 2�RON� '�N J6?
�Y� YNHQXK GV ODQ+N= HVD
�F� OH� >NLU GV ODQ+N= HVD
��� YNLGV LIMRNM HVD IGX ^NV� NVD OV YN� ¹N,U JNVUK J6?
�Y� ¤I�N � �O� XN6GMK �
�F� P_NV[ � �Q� Y8� �/L�9 P<\V>N GMVD� �
��� '�N YNLGNV R/UT GV �L HVD +NK YNHQXK JNVUK J6? �JND�@ XJKD��
�IQ JND@ UNV IGO �L HVD
��� YNLGV LIMRNM GN RNI�N=G YN� '�N J6? �� �������������������
��� '�N YNLGN LIMRNM [MKFK MV>NN GV XKSV WKRX FOM GM MJN J6?
�JND�@ XJKD��
��� IGO R�N= YNLGN LIMRNM FK�LK��\� LIMRNM GV I\�V ISI8JU JTYN?
��� FK�LK��\� LJSNX L YNLGNV IGOGV HN��H OV ¹N,U JTE=?
��� MNNX GK QTGNX YNLGV "NM OV IGUXK QZM J6?
�[NDR HVD�@ � IG�HK� OV � IG�HK� �@ � IG�HK� OV YI�NG ��
��� YNLGV [NDR HVD MNNX GK IGUXK QTGNXV J6?
��� '�N YNLGV LNO MNNX GN0= J6? �JND�@ XJKD��
��� �IQ JND@ UNV MNNX GN0= GN MD[ G6ON J6?
�O4VQ �BPL��@ LK\N �APL��@ JMN �ANP���
��� YNLGV LIMRNM HVD IGUXV MNNX GN0= J6D?
GN0= OD>�N �ZIX9 OD>�N BPL
APL ANP
Total

135
��� IWO QTGNX OV YNL MNNX ONH[]K ¹N,U GMUV J6D PO GNV9VQNM GN XNH '�N J6?
��� YNLGV LIMRNM HVD HT>� >NN_ ONH[]K GK >NLU IGUXK J6@ MNNX GK QTGNX OV
IGUXK ONH[]K ¹N,U JNVUK J6 YN6M POGK [T�NR5UN G6OK J6?
YNR�GUN MNNX OV ¹N,U [T�NR5UN
�Y� SNR\ IG[]N� ������������������� ���������������������� �����������
�F� [VJZD IG[]N� ������������������� ���������������������� �����������
�O� SKXK IG[]N� ������������������� ���������������������� �����������
�Q� IH9a9K UV\ \K9M ������������������� ���������������������� �����������
��� Y8� �/L�9 P<\V>N GMVD� ������������������� ���������������������� �����������[T�NR5UN ODGVU�[T�NR5UN ODGVU� �>NMNF�@ ONHN8��@ Y31N�@ FJTU Y31N�@ Y8���
��� YNL GF OV MNNX GK QTGNX OV MNNX ¹N,U GM MJV J6D? ������������������������������
��� YNLGV XNH GN MNNX GN0= IGUXV R�N= LZR= GN J6?
�� R�N= OV GH�@ � R�N= OV � R�N= UG�@ � R�N= OV YI�NG��
��� �Y� YNLGV MNNX GN0= GN +NN6IUG O5�NLX GF JTYN? ����������������������������������
��� '�N YNL >NN_ ONH[]K \VXV MNNX GK QTGNX LM IX�IHU �L OV WNUV J6D?
�JND�@ XJKD��
�IQ JND@ UNV IGUXV IQXNVD LM �¹IUHNJ�@ 6HNIOG�@ Y8���
�IQ XJKD@ UNV '�NV?
��� '�N YNL YLXV "NM LM SKXK GK >NLU IX�IHU GMUV J6D? �JND�@ XJKD��
�IQ JND@ UNV '�N YNL FNWNM OV YLXN LZMN GNV9N >NMKQUV J6D?
�LZMN GNV9N �@ YNDING GNV9N �@ Y8���
��� '�N YNL SKXK IX�IHU �L OV MNNX GK QTGNX OV >NMKQUV J6? �JND�@XJKD��
�IQ XJKD@ UNV '�NVD?
��� '�N YNL IH9a9K UV\ IX�IHU �L OV MNNX GK QTGNX OV >NMKQUV J6?
�JND�@ XJKD��
�IQ JND@ UNV ¹IU GN0= UV\ GK HN N IGUXK J6? ���������������������������
��� IWUXK HN N HVD IH9a9K UV\ YNLGNV MNNX GK QTGNX OV ¹N,U JNVUK J6@
'�N RJ L�N=,U J6? �JND�@ XJKD��
�IQ XJKD@ UNV YNL YLXK YIUIM'U YNR�'UN GJND OV LZMN GMUV J6D?

136
��� '�N YNLGK MNNX ONH[]K GN PL+NNV[ IGOK Y8� LIMRNM `NMN IG�N WNUN
J6? �JND�@ XJKD��
�IQ JND@ UNV '�N YNL FQ\V HVD POGV IGOK ONH[]K GN PL+NNV[ GMUV J6D?
�JND�@ XJKD��
��� '�N YNL MNNX GK QTGNX OV ¹N,U [VJDZ@ SNR\@ SKXK �RD IH9a9K UV\ GK HN N OV
O8UT�9 J6D? �JND�@ XJKD��
�Y� [VJDZ �F� SNR\ �O� SKXK �Q� IH9a9K UV\
�IQ JND@ UNV GNM�N /L�9 GMVD
�IQ XJKD@ UNV GNM�N /L�9 GMVD
��� '�N YNLGNV MNNX GK QTGNX OV GNVE= MNKQ ¹N,U JNVUK J6? �JND�@ XJKD��
�IQ XJKD@ UNV '�NV?
��� '�N YNLXV MNNX GK QTGNX LM IQRN\ �N IQ>NXV �NV;� /)NNX LM HZ<�
UNI\GN QV>NN J6? �JND�@ XJKD��
�IQ JND@ UNV '�N RJND ¹IU IG[]N�#¹IU \K9M HZ<� YDIGU MJUN J6?
�JND�@ XJKD��
��� '�N YNL R/UT >NMKQUV OH� HZ<� UNI\GN GV YXTONM HZ<� QVUV J6D?
�JND�@ XJKD��
�IQ XJKD@ UNV MNNX ONHI[]�NVD GN HZ<� '�N J6?
IX�NN=IMU HZ<� +NZ[UNX HZ<� FNWNM HZ<�
�Y� SNR\ ¹IU IG[]N� ������������������� ������������������ ��������������
�F� [VJZD ¹IU IG[]N� ������������������� ������������������ ��������������
�O� SKXK ¹IU IG[]N� ������������������� ������������������ ��������������
�Q� IH9a9K UV\ ¹IU \K9M ������������������� ������������������ ��������������
��� Y8� �/L�9 P<\V>N GMVD� ������������������� ������������������ ��������������
��� YNL YLXV LNIMRNIMG FW9 GN IGUXN �L�N ¹IUHNJ MNNX QTGNX OV ONH[]K \VXV
LM 2�� GMUV J6D? �� ��������������������
��� MNNX GK QTGNX OV GVR\ [VJZD �RD SNR\ >NNMKQXV HVD IGUXN �L�N 2�� JNVUN J6?
�� ����������������������

137
��� �IQ MNNX GK QTGNX OV SKXK GNV RNLO \V I\�N WN� UNV YNLGV �LM
G6ON ¹+NNR L0�V[N?
�GNVE= ¹+NNR XJKD�@ IRLMKU ¹+NNR�@ Y8� �/L�9 P<\V>N GMVD���
��� �IQ MNNX GK QTGNX OV IH9a9K GN UV\ GNV RNLO \V I\�N WN� UNV YNLGV
�LM G6ON ¹+NNR L0�V[N?
�GNVE= ¹+NNR XJKD�@ IRLMKU ¹+NNR�@ Y8� �/L�9 P<\V>N GMVD���
��� �IQ MNNX GK QTGNX OV YNLGNV GVR\ SNR\ �RD [VJZD ¹N,U JNV WNV IG
YNLGV YNR�GUNXTONM JNV UNV '�N YNL POOV ODUT�9 JNV[VD? �JND�@XJKD�@Y8���
�IQ JND@ UNV G6OV
�IQ XJKD UNV '�NVD?
��� �IQ YNLGN [NDR#^NV IR_TUK¤U JNV WN� UNV '�N YNLGNV MNNX GK QTGNX
OV IH9a9K GV UV\ GK YNR�'UN JNV[K? �JND�@ XJKD��
�IQ JND@ UNV '�NVD?
��� �Y� '�N YNLGN [NDR IR_TUK¤U J6? �JND�@ XJKD��
��� �F� �IQ JND@ UNV YNLGV [NDR HVD ¹IUIQX IR_TU YNLZIU= YN6OUX IGUXV "N89V JNVUK J6?
��� �O� �IQ MNI HVD IR_TU YNLZIU= OTIXISU GM QK WN� UNV YNLGNV IH9a9K UV\ GK
IGUXK YNR�GUN JNV[K? ����������������������
��� '�N YNL YLXV MNNX QTGNXQNM#GNV9VQNM OV ODUT�9 J6D? �JND�@ XJKD��
�Y��IQ YNL MNNX QTGNXQNM#GNV9VQNM OV ODUT�9 XJKD J6D@ UNV EOGN GNM�N J6
�QTGNX GN OH��@ "NI9�N >NN_ ONHN[]K�@ GH XNLUN6\�@ MNNX GN0= HVD
YIX�IHU E89}K�@ >NN_ ONHN[]K HVD IH\NR9�@ Y8���
��� '�N YNLXV G+NK EO O(F8�N HVD INGN�U QW= GMNE= J6? �JND�@ XJKD��
�IQ JND@ UNV GJND YN6M POGN '�N LIM�NNH IXG\N?
��� '�N YNLGV YXTONM IRUM�N ¹�NN\K GN G6OV FVJUM FXN�N WN OGUN J6? OT^NNR QVD

138
��� '�N YNLGV LIMRNM HVD Y8XLZ�NN= �NVWXN `NMN GNVE= \N+NNI8RU JTYN J6?
�JND�@ XJKD��
�IQ JND@ UNV �J \N+N YNL GF OV ¹N,U GM MJV J6D? HNJ ������������ R�N= ����������
�G�EO �NVWXN HVD YNLGV LIMRNM GN S�X IGOGV HN��H OV JTYN?
�[]NH LDSN�U#RK��\�0&\Z�#\V>NLN\#&\NG GH=SNMK#YNLZIU= IR+NN[#UJOK\QNM#Y8��
�>N� EO �NVWXN GV Y8U=[U IH\XV RN\K ONH[]K GN IRRM�N QVD
ONH[]K GN XNHONH[]K GN XNH HN NHN N HZ<�HZ<�
��� �G PL+NNV'UN GV �L HVD ONR=WIXG IRUM�N ¹�NN\K OV O(FI8�NU IX(XNIGDU IR�N�NVD
LM YLXK WNXGNMK GN IRRM�N QVD? �IQ JND UNV HN��H�IQ JND UNV HN��H
ONHN8� IX�HNR\K �JND�@ XJKD�� ����������������������������������
IXMK^N�N �RD WNDS �JND�@ XJKD�� ����������������������������������
OZSXN O(F8�NK YI�NGNM �JND�@ XJKD�� ����������������������������������
OU=GUN �RD WXOJ�NV[ �JND�@ XJKD�� ����������������������������������
XN[IMG QNI�5R �JND�@ XJKD�� ����������������������������������
��� '�N YNLGV [NDR GK [I%U LDSN�U ONR=WIXG IRUM�N ¹�NN\K GNV OTSN� FXNXV GV
QNI�5R GN IXR=JX GMUK J6? �JND�@ XJKD�@ HN\ZH XJKD��
�IQ JND@ UNV IGO ¹GNM
�IQ XJKD@ UNV YNLGK MN� HVD EOGV ¹HT>N GNM�N '�N J6D? �¹N)NIHGUN «H HVD FUN�VD�
��� O/UV [<\V GK QTGNX OV >NN_ ONHN[]K ¹N,U GMXV JVUT QTGNXQNM `NMN GNVE= IXISU
YRI�N IX�NN=IMU GK [�K J6? �JND�@ XJKD�@ HN\ZH XJKD��
�IQ JND@ UNV '�N IX�NN=IMU YRI�N GV QN6MNX YNLGNV >NN_ ONHN[]K ¹N,U JNVUK
J6? �JND�@ XJKD��
�IQ XJKD@ UNV EOGN GNM�N '�N J6?
Y8RV�NG GK I9,L�NK
Y8RV�NG GN XNH IQXNDG
139
;NNVIR8Q F<\+N LDU ONHNIWG IR.NX OD/)NNX@ E\NJNFNQQuestionnaire for Ration/Fair Price Shop Dealers
IRGNO >N�0� []NH LDSN�U� ������������� [NDR� ��������������
�� GNV9VQNM GN XNH� ������������������������������������������������������� �� YN�T�
�� WNIU� �Y�WN�#Y�W�WN��@ IL�WN��@ ONHN8��@ Y<LOD>�G�@ Y8���
�� N6I^NG /UM� �IXM^NM�@ ON^NM�@ ¹N)NIHG�@ P3S¹N)NIHG�@ HN��IHG�@
P3SUM HN��IHG�@ P3S�@ UGXKGK�@ Y8���
�� YNLGV O/UV [<\V GK QTGNX IGUXV IQXNVD �ON\NVD#HIJXV� OV S\ MJK J6? �������������
�� '�N YNLGV LNO FND9XV �NV;� MNNX L�N=,U HN N HVD PL\&�N MJUN J6?
�JND�@ XJKD��
�IQ XJKD@ UNV '�NVD?
�� '�N YNLGNV YNLZIU= IR+NN[ OV MNNX IX�IHU ¹N,U JNVUN J6? �JND�@ XJKD��
�IQ XJKD@ UNV '�NV?
�� YNLGV O/UV [<\V GK QTGNX OV IGUXV LIMRNMNVD GNV MNNX ¹QNX GK WNUK J6?BPL APL Total
�� YNLGV O/UV [<\V GK QTGNX OV IWUXV LIMRNMNVD GNV MNNX ¹QNX GK WNUK J6 PX
LIMRNMNVD GK OQ/� OD>�N IGUXK J6? BPL APL
�Y� GT\
�F� R�/G
�O� F3SV
��� '�N YNLGV O/UV [<\V GK QTGNX OV BPL LIMRNM IX�IHU SKXK >NMKQUV J6?
�JND�@ XJKD��
�IQ XJKD@ UNV '�NVD?

140
��� '�N YNLGV O/UV [<\V GK QTGNX OV BPL LIMRNM IX�IHU IH9a9K UV\ >NMKQUV J6D?
�JND�@ XJKD��
�IQ XJKD@ UNV '�NVD?
��� ¹IU �ZIX9 IGXUK ONH[]K MNNX GN0= �NNMGNV GNV QK WNUK J6?BPL APL
�Y� SNR\ ����������������� �����������������
�F� [VJDZ ����������������� �����������������
�O� SKXK ����������������� �����������������
�Q� IH9a9K UV\ ����������������� �����������������
��� Y8� �P<\V>N GMVD� ����������������� �����������������
��� IGUXV \NV[ YLXV �TIX9 OV YI�NG ONHNX >NMKQUV J6?
OD>�N HN N
�Y� SNR\ ����������������� �����������������
�F� [VJDZ ����������������� �����������������
�O� SKXK ����������������� �����������������
�Q� IH9a9K UV\ ����������������� �����������������
��� Y8� �P<\V>N GMVD� ����������������� �����������������
��� '�N YNLGV O/UV [<\V GK QTGNX OV APL LIMRNM IH9a9K UV\ >NMKQUV J6D?
�JND�@ XJKD��
�IQ JND@ UNV �IX�IHU�@ G+NKG+NK��
�IQ XJKD@ UNV '�NVD?
��� '�N YNLGV O/UV [<\V GK QTGNX OV APL LIMRNM SNR\ �RD [VJZD >NMKQUV J6D?
�JND�@ XJKD��
�IQ XJKD@ UNV '�NVD?
��� '�N YNL YLXV O/UV [<\V GK QTGNX LM GN0= �NNMGNVD GV I\� HZ<� UNI\GN
LM ONNHI[]�NVD GN HZ<� YDIGU GMUV J6D? �JND�@ XJKD��
�IQ XJKD@ UNV '�NVD?

141
��� WNV ONH[]K YNLGV O/UV [<\V GK QTGNX OV FVSK WNUK J6 POV ¹N,U GMXV HVD
IGOK ¹+NRNN\K 2�I'U GN QFNR MJUN J6? �JND�@ XJKD��
�IQ JND@ UNV IGO ¹GNM GN QFNR MJUN J6?
��� '�N GN0= �NNMG IX�IHU YLXN MNNX ONH[]K \V WNUV J6D? �JND�@ XJKD��
�IQ XJKD@ UNV '�NVD?
��� '�N YNL YLXV GN0= �NNMGNVD OV ODUT�9 J6D? �JND�@ XJKD��
�IQ XJKD@ UNV '�NV?
��� '�N YNL YNLZIU= IR+NN[ OV ODUT�9 J6D? �JND�@ XJKD��
�IQ XJKD@ UNV '�NVD?
��� '�N YNL YNLZIU= IR+NN[ GV IR�� GJKD GNVE= INGN�U QW= GMRN�K J6?
�JND�@ XJKD��
�IQ JND@ UNV GJND U)NN '�N POGN GNVE= LIM�NNH IXG\N?
��� '�N YNLGNV JN\ HVD YNLGV O/UV [<\V GK QTGNX GN IGOK YI�NGNMK `NMN
WNDS GN YXT+NR ¹N,U J6 �OMGNMK GN�N=\�#LDSN�U#WX¹IUIXI�N�$ �JND�@ XJKD��
��� O/UV [<\V GK QTGNX OV WNV +NK ONH[]K YNL FVSUV J6 POHVD YNLGN IX�NN=IMU ¹IU
IG[]N�#¹IU \K9M GHKNX '�N J6D?
�Y� SNR\ �� ��������������������
�F� [VJDZ �� ��������������������
�O� SKXK �� ��������������������
�Q� IH9a9K UV\ �� ��������������������
��� GN0= �NNMGNVD `NMN ONH[]K X \VXV LM \[+N[ IGUXK ONH[]K ¹IUHNJ YNLGV LNO
FSUK J6 YN6M '�NVD? HN N GNM�N
�Y� SNR\ ¹IU IG[]N� �������������� ��������������������������������������������
�F� [VJDZ ¹IU IG[]N� �������������� ��������������������������������������������
�O� SKXK ¹IU IG[]N� �������������� ��������������������������������������������
�Q� IH9a9K GN UV\ ¹IU \K9M �������������� ��������������������������������������������

142
��� �IQ YNLGV [NVQNH HVD MNNX ONH[]K GN0=�NNMGNVD GNV FND9XV GV FNQ NV�N FSUK J6 UNV
POV YNL '�N GMUV J6D?
��� WNV ONH[]K YNLGNV YNLZIU= IR+NN[ OV IX[=U GK WNUK J6 POGK [T�NR5UN GN /UM
'�N MJUN J6?
�Y� SNR\ �>NMNF�@ ONHN8��@ Y31N�@ FJTU Y31N�@ Y8���
�F� [VJDZ �>NMNF�@ ONHN8��@ Y31N�@ FJTU Y31N�@ Y8���
�O� SKXK �>NMNF�@ ONHN8��@ Y31N�@ FJTU Y31N�@ Y8���
�Q� IH9a9K GN UV\ �>NMNF�@ ONHN8��@ Y31N�@ FJTU Y31N�@ Y8���
��� MNNX ONHI[]�NVD GNV ¹N,U GMXV@ P8JVD \NXV �RD IRUIMU GMXV HVD YNLGNV IGO ¹GNM
GK OH/�NYNVD GN ONHNXN GMXN L0�UN J6?
Y8RV�NG GK I9,L�NK
Y8RV�NG GN XNH IQXNDG

143
[NVIR8Q F<\+N L8U ONHNIWG IR.NX OD/)NNX@ E\NJNFNQ[NVIR8Q F<\+N L8U ONHNIWG IR.NX OD/)NNX@ E\NJNFNQONR=WIXG IRUM�N ¹�NN\K GN�=«HONR=WIXG IRUM�N ¹�NN\K GN�=«H
[]NH YXTOZSK[]NH YXTOZSK
���� ONHN8� OZSXN�VD�ONHN8� OZSXN�VD�
��� [N:R GN XNH� P5UMQN5NN GN XNH�
��� []NH LDSN�U GN XNH� I\D[�
��� 8�N� LDSN�U GN XNH� WNIU�
��� IRGNO >N�0 GN XNH� 2�RON��
��� WXLQ GN XNH� LQ�
��� [DNR HVD 9NV\NVD GK OD>�N�
��� YN�NNM+NZU OTIR�NN�VD�
OTIR�NNYNVD GN XNHOTIR�NNYNVD GN XNH PL\&�NUN JN:� XJK�PL\&�NUN JN:� XJK� QZMK �IG�HK��QZMK �IG�HK��
FO /9NL
MV\RV /9VNX
9V\K4NVX
IR_TU
L]N)NIHG IR_N\�
P3SUM L]N)NIHG IR_N\�
HN��IHG IR_N\�
YND[XRN0�K GV8Q]
FN\RN0�K GV8Q]
/RN/)� PLGV8Q]
L]N)NIHG /RN/)� GV8Q]
ONHTQNI�G /RN/)� GV8Q]
YXN6LSNIMG IN^NN GV8Q]
MN�9}K�GCU F6DG
^NV K� []NHK�N F6DG
+NZIH IRGNO F6DG
OJGNMK OIHIU
[8XN «� GV8Q]
O/UV [<\V GK QTGNX
H�0K OIHIU#OJGNMK «� GV8Q]
GCI�N FKW +N�0NM
ON,UNIJG FNWNM
IXWK ISIG5OG#'\KIXDG
Y� LDWKGCU ISIG5OG
QRN GK QTGNX
LTI\O )NNXN#SN6GK
Y8�

144
��� [N:R HVD HN[= GK I/)NU� O(LG= HN[=#HT>� O0DG#G3SN HN[=#HN[= IRJKX
��� �IQ [N:R IGOK L]GNM GV HN[= OV WT0N J6@ UNV '�N LZMV R�N= P'U HN[= OV
YNRN[HX JNVUN J6? JN:#XJKD
���� �IQ XJKD@ UNV IGUXV HNJ YNRN[HX XJKD JNVUN?
���� �IQ [N:R IR_TUKGM�N GV -V�NK HVD J6D UNV�
�G� EO [N:R HVD IGUXV LIMRNMNVD GNV IFW\K PL\&�N J6?
�>N� ONHN8�U� [DNR HVD IR_TU YNLZIU= IGUXV "N89V JNVUK J6?
�[� [N:R HVD IGUXV LIMRNM IR_TU GN PL+NNV[ IX(X GN�NV= GV I\� GMUV J6D$
�Y� "NMV\Z �F� GCI�N
�O� Y8� �P<\V>N GMVD�
���� [N:R GV ODQ+N= HVD IRRM�N QVD�
LIMRNMNVD GK OD>�NLIMRNMNVD GK OD>�NIRRM�NIRRM�NSC ST OBC General Minorities Total
[MKFK MV>NN GV XKSV
[MKFK MV>NN GV �LM
GT\ MNNX GN0= �NNMG BPL
GT\ MNNX GN0= �NNMG APL
Y8XLZ�NN= �NVWXN
GT\ LIMRNM OD>�N
���� GCI�N O(FI8�NU OZSXN�VD�GCI�N O(FI8�NU OZSXN�VD�
��� [N:R GV GC�NG >NVUK HVD IGX HT>� FN�NNYNVD GN YXT+NR GMUV J6D? GCL�N UKX
FN�NNYNVD GNV ¹N)NIHGUN «H HVD FUN�D� �ODON�NXNVD GK GHK�@ +NZIH GN Y+NNR�@
FVSXV GV I\� GH FSUN J6�@ 2�RON�KGM�N XJKD JTYN�@ XE= UGXKG GN
Y+NNR�@ PISU HZ<� LM FVSXV GK 2�R/)NN XJKD�@ +N�0NM�N GN Y+NNR�@
Y<LGNI\G BC�N GK 2�R/)NN GN YN+NNR�@ Y8���
��� [N:R HVD IX(XI\I>NU LIMO(LI5U�NVD GK YXTHNIXU OD>�N '�N J6
G� 96}'9MNVD GK OD>�N
>N� )N]6NMNVD GK OD>�N
[� IXWK 9�ZFR6\ GK OD>�N
"N� ONR=WIXG 9�ZFR6\ GK OD>�N
��� [N:R HVD FXN31NIQU ^NV NVD GN PL�NV[ [N:R RN\V IGX IGX �LNVD HVD GMUV J6D?
�W\N� \G0K#EHNMUK \G0K#4\#SNMN[NJ#Y8�
��� [N:R GV GC�NGNVD GK HT>� OH/�N�VD '�N J6D?
��
��
��

145
���� LDSN�U �RD ONR=WIXG IRUM�N ¹�NN\K�LDSN�U �RD ONR=WIXG IRUM�N ¹�NN\K�
��� [N:R GV O/UV [<\V GK QTGNX OV IL1\V UKX HNJ HVD IRUIMU ONHI[]�NVD GN IRRM�N
ONHN[]K GN XNHONHN[]K GN XNH '�N IRUM�N JTYN'�N IRUM�N JTYN �IQ XJKD UNV GNM�N�IQ XJKD UNV GNM�N
SNR\
[VJZ:
IH99K UV\
SKXK
Y8�
��� ONR=WIXG IRUM�N ¹�NN\K 2�R/)NN GNV OTIXISU GMXV JVUT YNLGN HT>� QI�5R '�N
J6?
��
��
��
��� ONR=WIXG IRUM�N ¹�NN\K GN�=«H GV ODSN\X HVD GN6X� OK HT>� IQ'GUVD J6?
��
��
��
��� �VON '�N IG�N WN� IWOOV EO GN�=«H GN ODSN\X YN6M FVJUM JNV OGV?
��
��
��
��� '�N YNLGV [NDR HVD ONR=WIXG IRUM�N ¹�NN\K 2�R/)NN LM IX[MNXK M>NXV JVUT
LDSN�U `NMN IGOK OIHIU GN [%X IG�N [�N J6? JND#XJKD
��� �IQ JND@ UNV EO OIHIU GK HT>� OH/�N�VD '�N J6?
��
��
��
��� [N:R GV I\� [I%U LDSN�UNVD GK HT>� OH/�N '�N J6?
��
��
��
��� LDSN�UNVD GNV YI�NG L]+NNRNN\K FXNXV GV I\� YNL '�N OT!NR QV[VD?
��
��
��
��� [N:R GV ��� R�N= GV FN\GNVD �RD FNI\GNYNVD GV L]N)NIHG IN^NN GK OH/�N�
��
��
��

146
���� Y8��Y8��
��� '�N [N:R HVD YIUIM'U +NZIH GN IRUM�N +NZIHJKXNVD GNV JTYN J6? JN:#XJKD
��� �IQ JN:@ UNV IGO R�N=? IRRM�N QVD�
��� '�N YNL \NV[ HJOZO GMUV J6 IG IL1\V QO R�NNV= GV HTGNF\V YF [NDR GK
I/)NIU
I/)NIUI/)NIU √ GNM�NGNM�N
FVJUM J6
�)NN I/)NIU
IF[0� [�K
��� YNLGV [N:R GV IX�N=XNVD GV I\� ODSNI\U ONHNIWG IRGNO �NVWXNYNVD HVD YNL '�N
GIH�N: HJOZO GMUV J6?
��
��
��
��� EO [DNR GV \NV[NVD GK HT>� /RN/)� OH/�N�D '�N J6D?
��
��
��
��� '�N OMGNM `NMN ODSNI\U IRI+N8X /RN/)� OVRNYNVD OV []NHK�N LIMRNMNVD GNV \N+N
JTYN J6? �JDN#XJKD�
�G� �IQ XJKD@ UNV EOGN GNM�N '�N J6?
��
��
��
��� YNL YLXV [DNR GV O+NK \NV[NVD GNV FVJUM /RN/)� OVRN PL\&�N GMNXV JVUT '�N
OT!NR QVD[V?
��
��
��
��� PLMNV'U GIH�NVD GNV QZM GMXVGV I\� YNL '�N OT!NR QV[VD?
��
��
��
Y8RV�NG GK I9,L�NK�
Y8RV�NG GN J/UN^NM

147
IRGNO >N�0 GN XNH �
[]NH LDSN�U GN XNH �
MNW/R [NDR GN XNH �
\N+NNI8RU 2�I'U GK OD>�N\N+NNI8RU 2�I'U GK OD>�N�NVWXN GN XNH�NVWXN GN XNH R�N=R�N=
SC OBC Min. Other Total ����
����Y8XLZ�NN= �NVWXN
����
����
����YNE=�YNM�0K�LK�
����
����
����9}NEOVH
����
����
����0K�0&\Z�OK�YNM���
����
����
�����H�0&\Z��O�
����
����
����MN�9}K� RC�NR/)NN LVDNX
����
����
����MN�9}K� LIMRNM \N+N �NVWXN
����
����
����MN�9}K� HNUC5R \N+N �NVWXN
����
����
����MN�9}K� IR�NRN LVDNX GN�=«H
����
����
����MN�9}K� IRG\DN[ YXTQNX �NVWXN
����
����
����EI8QMN YNRNO �NVWXN
����
Contd...

148
\N+NNI8RU 2�I'U GK OD>�N\N+NNI8RU 2�I'U GK OD>�N�NVWXN GN XNH�NVWXN GN XNH R�N=R�N=
SC OBC Min. Other Total ����
����MN�9}K� P8XU SZ<JN GN�=«H
����
����
����[]NHK�N /R31UN GN�=«H
����
����
����WV�YNM�RNE=�#E����O�
����
����
����1N RCIU �RD H��N8J +NNVWX
����
����
����O(LZ�N= ON^NMUN YI+N�NX
����
����
����OHI8RU FN\ IRGNO LIM�NVWXN
����
����
����FNI\GN OHCI� �NVWXN
����
����
����Y8�
����

149
IRGNO >N�0 GN XNH �
[]NH LDSN�U GN XNH � MNW/R [NDR GN XNH �
«H OD>�N«H OD>�N IRRM�NIRRM�N OZSXN�DOZSXN�D
� FK�LK��\� LIMRNMNVD GK OD>�N
� ��LK��\� LIMRNMNVD GK OD>�N
� GT\ LIMRNMNVD GK OD>�N
� FK�LK��\� YXTOZISU WNIU LIMRNM GK OD>�N
� ��LK��\� YXTOZISU WNIU LIMRNM GK OD>�N
� [DNR GK WXOD>�N
�G� LT��N
�>N� HIJ\N
�[� FK�LK��\�
�"N� ��LK��\�
�0�� FK�LK��\� YXTOZISU WNIU
�S� ��LK��\� YXTOZISU WNIU
� ON^NM 2�I'U�NVD GK OD>�N
�G� LT��N
�>N� HIJ\N
� IR_TUGCU LIMRNMNVD GK OD>�N
� �NUN�NU ON�NX �HK9M HVD�
�G� L'GK O0�G GK \(FNE=
�>N� >N0�DWN GK \(FNE=
�[� G3SK O0�G GK \(FNE=
�"N� GDG0� GK L'GK O0�G GK \(FNE=
�� LV�W\ OTIR�NN �OD>�N HVD�
�G� EI�0�N HNGN= II
�>N� LV�W\ GZL
�[� LNE90 LV�W\
�� IODSNE= GV ON�NX �OD>�N�
�G� XJM
�>N� MNWGK� X\GZL
�[� IXWK X\GZL
�"N� UN\NF
�0�� GZL#MJ9
�S� LX S'GK
�1� I0;[K
�W� Y8�
XNV9�XNV9� PLMNV'U OZSXN�D ���� HVD JTE= FK�LK��\� ORV=^N�N GV YN�NNM LM QVD$