public distribution system in gujarat: a synoptic overviewgidr.ac.in/pdf/wp-138.pdf · 2 public...
TRANSCRIPT

Working Paper No. 138
Public Distribution System in Gujarat: A Synoptic Overview
Sudarshan Iyengar
Gujarat Institute of Development Research Gota, Ahmedabad 380 060 May 2003

1
Abstract Public Distribution System (PDS) programme in India has been introduced for achieving multiple objectives. Its primary objective is to provide subsidised foodgrains and other items of daily necessity such as oil, sugar and Kerosene etc. to weaker sections of the population The programme also aims to stabilise market prices of foodgrains in times of unusual inflationary tendencies, to provide food security to areas suffering from drought and similar natural calamities and manmade disasters, to provide support prices to farmers and to maintain buffer stock. The PDS programme is implemented in welfare state mode with universal beneficiary approach and hence it has been under criticism for being non-specific and wasteful. It has also been found to be an inadequate programme to fully address the food security problem of the poor and vulnerable. PDS is a centrally planned programme and each state in India implements the design set by the Central Government. This paper reviews the PDS programme in Gujarat since the formation of the State in 1960 and comments briefly upon its effectiveness in delivery and addresses the food security issue for the poor.
JEL Classification : H 53 Keyword : Public Distribution System (PDS); Targeting poor;
Supply; Purchase; Foodgrains
Acknowledgements This paper was prepared about a year back for presenting it in a State Level Consultation on food and nutritional security to be organised by the United Nation World Food Programme (UNWFP) in Gujarat. However, the consultation got delayed and it could be presented only in April 2003. In the meanwhile the paper was sent to Professors S.S. Acharya and Dinesh Marothia. Both of them provided very useful comments and suggestions. I benefited greatly from them as both of them have first hand experience in serving the Commission on Agricultural Costs and Prices. I thank both of them profusely. I also benefited from the presentations and discussions in the April 2003 UNWFP Consultation where a number of NGOs participated and shared their experiences and researchers presented their views. My colleague Dr. Uma Rani’s comments and suggestions have been very helpful. Girija Bal Krishnan has as usual helped in taking the paper to press. Dr. N. Lalitha has been patient but pursuant on the delay in my finalising this paper for the Institute’s Working Paper series. I also thank for her editorial suggestions. I alone am responsible for the shortcomings.

2
Public Distribution System in Gujarat: A Synoptic Overview
Sudarshan Iyengar
1. Introduction Putting morsels of food in the mouths of those who are poor and generally find it difficult to buy food from the market should be perhaps the major aim of any public distribution system in a country like India where substantial numbers of poor persons live. One is not certain whether this objective is being achieved effectively in most parts of the country or not. There is substantial literature on the subject that highlights the range of issues that deal with the efficiency of delivery systems and targeting the population whose welfare needs to be improved. It is assumed that government’s continued interest in running the public distribution system (PDS) is to protect the poor and vulnerable sections of population from possible inflation due to frequent and relatively wide fluctuations in the supplies (Kabra and Ittyerah 1992). Government also runs this programme as an anti poverty programme by selling food at subsidised price creating a positive income effect for the poor. PDS, as it has evolved over the years in India, aims to achieve more than one objective. The broader framework within which PDS operates contains minimum support price (MSP) programme to support farmers in getting remunerative prices from the market, procurement of food grain by a centralised agency namely the Food Corporation of India (FCI) to maintain buffer stock to meet unexpected shortfall in food grains supply, to release it in open market to regulate the market prices downwards, to supply food to poor and unemployed labour through food for work schemes, to support specific weaker sections of the society etc. The Principal Secretary, Food and Civil Supplies, Government of Gujarat states ten different contexts in which the PDS needs to be viewed (Dash, 2003). A review of PDS programme thus in effect becomes a review of the effectiveness with which the programme is able to achieve multiple objectives of reaching poor and deprived sections of the population with food and employment, regulate the foodgrains markets, improve regional transportation networks and support farmers etc.

3
This paper does not aim to undertake any comprehensive review, but an attempt is made to look at the functioning of the PDS infrastructure and changes therein over time in Gujarat and then comment upon the situation with respect to foodgrains distribution and the target groups. Thus a somewhat limited exercise of an overview of the Gujarat State’s Public Distribution System (PDS) is attempted. Even this exercise is limited by the extent of the relevant data that are available. The main source of compiling information has been the volumes of annual ‘Socio-economic Review, Gujarat State’, published by the Bureau of Economics and Statistics, Government of Gujarat. It was also possible to obtain some information from the Gujarat State Civil Supplies Corporation (GSCSC) with respect to latest situation. An attempt is made to understand the PDS in Gujarat with the help of schemes that are implemented under the programme, the supply infrastructure and its features. It should be recorded that like all other government programmes time series data on the subject are not available at desired level of disaggregation of area and population. Before attempting the overview of the PDS in Gujarat, it is important to bring out a special feature of the State with respect to foodgrains production. Gujarat has been a deficit state with respect to food grains. Traditionally, the state grew cash crops such as cotton and groundnut and hence area devoted to food grains is limited. The yields of food grains crops are also compared to many other states. Large part of the state is drought prone and hence rain fed cultivation is more prominent. In Section 2 a brief description about Gujarat and its agriculture with specific reference to foodgrains production is attempted. In Section 3 the PDS infrastructure is analysed and in section 4 analysis of the PDS functioning in the context who benefits and how and the issues in nutritional aspect and its relationship with PDS is attempted. Section 5, discusses the implications for effective programme for supporting food and nutrition supply to poor and vulnerable. 2. Food Grains Production in Gujarat The present day Gujarat came into existence on May 1, 1960. Gujarat is a rain shadow and hence receives low rainfall during a year. It is a drought prone state with 15 out of 25 districts (before 1997, 12 out of 19) being drought prone. The annual normal rainfall varies from 350 mm in Kachchh to 1850 mm in Dangs and 12 districts receive less than 750 mm of annual rainfall. The northeast and

4
southeast hilly and undulating terrain is inhabited by tribals. Agriculture is largely rain fed. Table 1 presents the cultivated area and area irrigated in Gujarat. It may be seen from Table 1 that only half of Gujarat’s land is under cultivation. It started with a poor irrigation record in 1960-61 with only 7 per cent area under irrigation and in 1990-96 it has almost quadrupled. This has had definite positive impact on both yields and production of various crops. Foodgrains production has also grown, but as stated earlier, traditionally, Gujarat is not a foodgrains producing state. Even in the early 1950s, the area under foodgrains crop was 62 per cent. Taking triennium averages for first three years of decades it has been shown that the share of area under foodgrains has come down from 62 per cent in 1950 to 44.4 in 1990. The triennium average for 1993-96 gives a figure of 43.5 per cent, (Patel, 2001). However, when we look at the decadal averages between 1970s and 1990s and compare it with 1960-61 figures, we find that area under foodgrains as percentage to gross cropped area declined only in the 1990s. Table 2 shows the percentage area under cereals and pulses over time to gross cropped area. It may be observed that with the rise in gross cropped area, the share of area under foodgrains increased marginally in 1970s and 1980s and only in the 1990s it declined somewhat significantly (Table 2). Comparing the figures in Table 2 with Patel’s analysis (Patel A.S.2001), it appears that the area under foodgrains in Gujarat declined very sharply first between 1950 and 1960 and then modestly in the 1990s. In the first three years of 1950s the area under foodgrains was 62 per cent and in 1960-61 it was 47 per cent. Thus even before expansion in irrigated area took place after 1960, foodgrains crops had lost priority to cash crops. With increase in irrigation facility and expansion in gross cropped area, foodgrains did not receive any special attention. On the contrary in the 1990s the share of foodgrains crops to total gross cropped area declined further. Increase in irrigation facility and related technologies including improved and high yielding seed varieties have helped in increasing the yields and therefore the production of foodgrains in the state. Table 3 contains data on foodgrains production in 1960-61, decadal averages for 1970s and 1980s and annual data for the 1990s up to 1996-97. It may be observed that production has increased over time. The per capita availability of foodgrains increased in 1970s over 1960s, but after that it has been declining. The annual data for the 1990s show year-to-year fluctuations. Given

5
the caloric requirement for the survival of a healthy person engaged in manual work and given the income distribution in the society, it may be said that the foodgrains production in Gujarat is not enough to feed its population. Vepa, (2003) has calculated the per capita per day net production of food items in Gujarat for triennium 1995-98 and compared the figures with the Indian Council of Medical Research (ICMR) norms and all India figures. Against the ICMR norm of 420 grams per day per capita of cereals net production (net of seed, feed and wastage) in Gujarat it was 223 grams, while the national average was 430 grams. In case of pulses the ICMR norm is 40 grams per capita per day, Gujarat produced 29 grams and all India average was 32 grams. Gujarat exceeds the ICMR norms and all India averages in case of Sugar (55, 30 and 41 grams respectively), edible oil (44, 22 and 18 grams), milk (265, 150 and 184 grams) and fish (40, 25 and 14 grams). ICMR list of food items that form a balance diet for normal healthy person numbers 10 and include cereals, tubers, pulses, sugar, edible oil, fruits, vegetables, milk, eggs and fish. The total food required under all categories amount to 982 grams per person per day. Net production of these food items taken together in Gujarat in 1995-96 was estimated to be 857 grams, which is 87 per cent of the ICMR norm. The all India figure was 1031 grams, 5 per cent more than the ICMR norm (Vepa, 2003, Table 1). In Table 2 we have examined the foodgrains statistics only and in those figures the production was gross, that is seed, feed and wastage is not deducted while calculating annual per capita production. When we compare with Vepa’s estimate, we find that the net production is around 91 kilograms per year per person in Gujarat, which is way below the gross production of about 122 kilograms (1995-98) for the comparable period. The net is about 75 per cent of the gross production. Gujarat indeed is not self sufficient in case of foodgrains. Since income distribution is skewed, the distribution of available food will also be skewed. Although poverty ratios have been falling sharply in Gujarat, still food distribution to the poor and vulnerable sections may have to be done through the PDS until market forces can cater to all sections of population. Further, as stated earlier, there are other programmes too, under which food supply has reached people engaged in employment programmes, mid-day meal programmes for children etc. In this context PDS becomes important.

6
3. PDS Supply and Infrastructure in Gujarat According to the Ministry of Consumer Affairs, Food and Public Distribution, Government of India, PDS has evolved over time as a major instrument of the Government’s economic policy for ensuring availability of foodgrains to the public at affordable prices as well as for enhancing the food security for the poor. It is an important constituent of the strategy for poverty eradication and is intended to serve as a safety net for the poor whose number is more than 330 million and is nutritionally at risk. PDS with a network of about 4.63 lakh Fair Price Shops (FPS) is perhaps the largest distribution network of its type in the world. PDS is operated under the joint responsibility of the Central and the State Governments. The Central Government has taken the responsibility for procurement, storage, transportation and bulk allocation of foodgrains, etc. The responsibility for distributing the same to the consumers through the network of FPSs rests with the State Governments. The operational responsibilities including allocation within the State, identification of families below poverty line, issue of ration cards, supervision and monitoring the functioning of FPSs rest with the State Governments. PDS means distribution of essential commodities to a large number of people through a network of FPS on a recurring basis. The commodities distributed are wheat, rice, sugar, edible oil, and kerosene. Department of Food and Civil Supplies was responsible for organising and operating the PDS in the state at the time of its formation in 1960. Even as part of the erstwhile Bombay State, Gujarat region was covered under the PDS system. The PDS as such was initiated as an ad hoc measure during the Second World War in the early 1940s. Over the years the system has stabilised as a permanent feature to contain rise in food grain prices and achieve food security for poor (for details see Jharwal M 1999 and Chakraborti M 2000). It continued to be respon-sible for organizing procurement and distribution of essential supplies including foodgrains up to 1980. In the 1960s, food production in the country as a whole was seriously short of the total requirement and hence various controls and rationing were in operation from time to time. In 1964, the Government of India introduced zone-based controls on rice, wheat and grams. In 1968, the export controls were relaxed in coarse grain surplus states of Punjab, Haryana MP, Bihar, UP and Rajasthan. But in 1969 due to famine conditions the controls were introduced in Rajasthan again and later withdrawn in October 1970. By 1970 control on wheat was also withdrawn and control over rice however remained.

7
The relaxation on controls had an impact on the local production in Gujarat and stocks improved in the open market. The pressure on fair price shops came down. There was a sudden drop in the allocation and lift of foodgrains in Gujarat in 1970-71. It appears as an exceptional year and there is hardly any satisfactory explanation in any document. 1972 was a drought year and once again reliance on PDS increased. It is difficult to trace the exact process and assess the quantum of dependence on the PDS for foodgrains because reliable and continuous data from all sources are not available. The State received supply from the Government of India and also procured its own supply of coarse grains and pulses from within the state. Procurement of edible oil also began in mid 1960s. Later, with the import of palmolien, soya bean and sunflower oils, the department began to handle its procurements and supplies. The Food and Civil Supplies department also handled sugar, kerosene, light and high-speed diesel oils quotas. In this paper I have restricted the scope to look at the foodgrains situation only. Allocation and lifting situation with respect to foodgrains in the 1960s is presented in Table 4. An important observation that emerges from Table 4 is that there has been immense fluctuation in the PDS supplies during the period considered. The 1964-65 to 1967-68 periods show high allocation and lift. The period coincides with the zone-based controls over the movement of foodgrains and pulses. Mid sixties are also years of severe droughts in many parts of the country including Gujarat. Relaxation in controls and improvement in the production environment may have led to decline in the allocation and lift of PDS supplies in the late 1960s. From 1972-73 onwards, another set of data is made available from the annual Socio-economic Review (SER) volumes of the Gujarat state, which is a time series data. Table 5 contains data on allocation and lift from the central pool between 1972-73 and 1997-98. The lift data are given as distribution. The lift and distribution data may have some discrepancy, as it will become evident when we look the central government data. The allocation and distribution data also does not give separate figures for rice and wheat. If one looks at the decadal pattern of allocation and lifting it may be observed that in the 1970s, 1973-74 and 1974-75 were bad years from the point of view of local production and more than 700 thousand tones of foodgrains had to be lifted from the central pool. In 1975, the domestic foodgrains output increased. The off take from the PDS declined substantially. The trend continued until 1987-88 the year in which Gujarat experienced one of the most serious droughts in the State after its formation. The

8
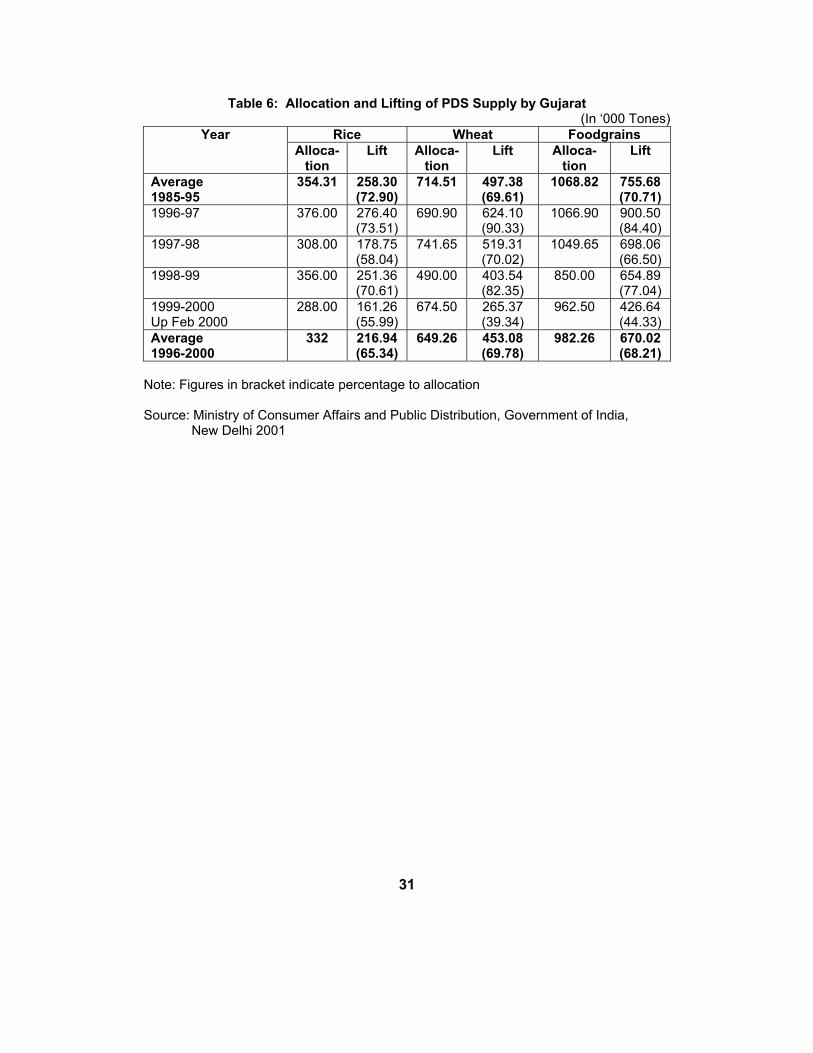
situation continued next year also and only in 1989-90 did the situation seem to have improved. In 1990s, the central pool quota has been generally higher and from 1997-98 the quantities have declined. Another important observation is that against the allocation of foodgrains the distribution of it has generally been lower and between 1975-85 and 1985-95, average distribution against the allocation has declined. The Government of India’s Ministry of Consumer Affairs and Public Distribution gives information for rice and wheat separately by states (Table 6). The first thing that strikes is that there is discrepancy in the figures quoted by the Government of India source and the state government source. Assuming that the data are generated centrally by the Ministry that is responsible for procuring and dispatching the supplies to states, the data may be taken to be more reliable. Secondly, the state level data are from the SER volumes and not directly from the state Civil Supply Corporation. Hence, one is not sure whether the SER is able to get comprehensive data. The Government of India figures suggest that the central pool allocation during 1985-95 was higher than the figures given in the SER volumes. Secondly, the lifting was lower than the state figures. On lifting of course, the figures are likely to differ because whereas the state figures are for distribution and the central figures are for lifting by the state government and which always has a lag. However, comparing the GoI data for 1985-95 and 1996-2000, it may be observed that both the allocation and lift have declined. If one looks at the annual figures in both, the GoI data or SER volumes, one can notice fluctuations in allocation as well as lift. During drought years the allocation and lift are higher. Government of India mainly handles the procurement and distribution of rice and wheat, but the state governments also procure and distribute coarse grains such as maize (Corn), Jowar (Sorghum) and Bajri (Pearl Millet). The SER volumes report about the procurement of these items for some years, but after 1991-92 one does not find any information on it. It can also be seen from Table 5 that the total quantity handled is very small. The PDS therefore, is largely distribution of wheat and rice. It has been argued by a number of scholars and organizations working with poor and socially backward sections of population that people do not find rice and wheat as useful as coarse grains because it does not constitute their staple diet. I shall come back to this point later when I discuss the relevance of the programme.

9
3.1 Fair Price Shops and Storage Capacity The final unit with which the user of PDS deals is the fair price shop. Historically, PDS in India has come up as a result of scarcity of food supplies that arose in the Second World War (Chakraborty, 2000) and the concept of ration shops came up first. The present day fair price shops are the old ration shops and they have grown in number. The PDS supply is lifted from the central government warehouses and godowns managed by the Food Corporation of India. The Government of Gujarat has to lift the stock and store it in its own warehouses. It handles the storage in two ways. The department of Food and Civil Supplies and now the GSCS Corporation has its own capacity created for storage and also hires in space from private owners. The SER volumes contain information on the storage facility and capacity with the GSCSC. Table 7 contains time series data on the fair price shops and the storage capacity. Between 1960 and 1997 the year up to which time series data are available, the number of fair price shops (FPS) have increased by more than three times. The compound average annual growth rate was 3.5 per cent, which is high. Since population has also increased pari pasu, it would be useful to look at the FPS per unit of population. Table 8 shows the population coverage by an FPS over time. By 2001, an FPS covered an average of 3548 persons in the state. The macro level figures clearly suggest that the number of FPS have been growing faster than the population because population covered per FPS has come down sharply between 1961 and 2001. It is obvious because the compound average annual growth rate of population has been lower than the growth rate of the fair price shops. However, it will be further useful to look at the rural-urban and district level distribution fair price shops to understand the dispersal in coverage. Table 9 contains the district level and rural urban distribution of FPS in Gujarat. Gujarat is traditionally divided into five regions, which also broadly conforms to the agro-climatic regions. Kachchh, with its desert like land known as Rann, is the largest district covering almost one fourth of the area of the state, but has the lowest population density. The population density was 35 persons per square Km in 2001. The rural and urban coverage of population per FPS respectively were

10
2463 and 4022 persons. Kachchh has the best coverage in Gujarat. However, this is consistent with the scatter of villages in Kachchh. Rural spread of the FPS is second best in the districts in Saurashtra. It also has large area and third lowest density of population after Dangs. It was 208 persons per sq. km. as per 2001 population. On an average one FPS covered 2779 persons in rural areas. In urban areas the coverage was 4478 persons, which was higher than North Gujarat region but lower than the remaining two regions Central and South Gujarat. Coverage in rural areas of remaining three regions North Gujarat, Central Gujarat and South Gujarat, is almost uniform. One FPS on an average covers 3100 to 3200 persons in rural areas. In urban areas, South Gujarat and central Gujarat, one FPS on an average covers between 5000 and 6000 persons. Closer examination of the data reveals that this is due to four large mega cities Ahmedabad, Surat, Vadodara, and Rajkot where the average population covered in higher than other urban areas. The district level distribution suggests that perhaps there hasn’t been any strategic planning for opening FPS. It is likely that pulls and pressures work rather than criteria. In rural areas for instance the average state level figure is 3020 persons per FPS. If we take figures that are 500 less or more than the state average, following districts get covered. In ‘500 below average’ category, Porbandar, Kachchh, Rajkot and Jamnagar get qualified in that order. In ‘500 above average’ category Dang and Dahod get qualified. Both Dangs and Dahod are tribal districts, and Dang has higher scatter. The village settlements in hilly and remote areas are generally small and even with one fair price shop for more than 3500 persons may mean travelling a distance of more than 15 to 20 Kms in some cases. The distance may act as a deterrent in availing the PDS facility by rural poor. While Kachchh and Saurashtra appear to be well covered at least two of the tribal districts are not adequately covered. It is relevant to note that in Gujarat poverty is high in the tribal regions compared with the Kachchh and Saurashtra regions. In 1987-88 NSS data for instance showed that 56 per cent of households in eastern tribal region (NSS region) in Gujarat were below poverty line where as the incidence was less than 41 per cent in Dry areas (Kachchh and North Gujarat) and 20 per cent in Saurashtra (Iyengar 2000). It should also be noted that 1987-88 was the worst drought year in Gujarat during which the cattle casualty was highest in dry areas and Saurashtra.

11
At the time of analysis the district level rural urban fair shops data for 1987-88 were not available and hence it is not possible to compare the FPS figures for the regions during that time. However, when even in 2001 the poorer regions show relatively lower coverage one may assume that the situation in 1987-88 could not have been better. There seems to clear case to strategise the setting up of FPS in poorer areas. The Government of Gujarat appears to have been sensitive over this issue particularly with respect to availability of grains to poor tribals in critical period. Hence a Grain Bank scheme was introduced under the Tribal Sub Plan in 1996-97. “Member families of the grain-bank will be entitled to take loan of food grains in four instalments of up to 25 kilos each during the rainy season or in any other period of scarcity.” (Rai, 2003: 4). The scheme until 2002-03 had benefited over one lakh families in Kachchh and other tribal dominated villages where the village population was more than 50 per cent of the total with about 225 grain banks. The scheme is of course more to grant food security than to strengthen the PDS network. 3.2 Ration Cards Related to the location and number of FPS are the ration cards. Without a ration card FPS supplies cannot be availed. Time series data from 1977 onwards are available for the number of ration cards and the annual growth in them (Table 10), which is uneven. It does not seem to have any straight relationship with the increase in population. The most known complaint is that there are ghost ration cards, which means that the household in reality does not exist but a ration card is issued under some phoney name. It may be also observed that after 1992, data on ration cards are not available from the SER volumes. This is because since July 1992, a new scheme was introduced for ration cards. The consumers were categorized into income tax payers, sales tax payers, persons earning more than Rs 28,000 per annum and farmers other than small and marginal ones. This category was identified as affordable category and hence a Red Card was issued to them, which gave entitlement for Sugar and kerosene only. Yellow cards were issued to all those who were small and marginal farmers or earned less than Rs 28,000 annually. Green cards were issued to all those who earned less than Rs 15000 annually,

12
benefited from Food for Work scheme, were infirm or were covered under old age pension scheme and were workers of closed textile mills. Surprisingly, the number of cardholders in each of these categories has not been specified. However for the year 2001 we have data on number of cards by district and by poverty category. Under the instruction form the GoI, all the states have conducted a survey, identifying households living below poverty line (BPL), popularly known as BPL survey. In Gujarat latest survey was conducted in 1997. The State Civil Supplies Corporation have classified the ration cards into BPL and APL (above poverty level) categories. Table 11 contains district level data on it. The problems in the population and poor population data as estimated by the Corporation are obvious. Even by 1993-94, 50th NSS round estimates poverty in Gujarat was not more than 25 per cent. Gujarat has experienced continuous decline in poverty over time (Appendix Table 1). In the data the population below poverty line (BPL) is shown to be 33 per cent. The interregional variations are also high and not believable because Kachchh shows very high population below poverty. In order to indicate more firmly the problem in ration card based population and poverty data for Gujarat, we have re-tabulated the ration card data with the 2001 population estimates for Gujarat by district in Table 12. The population estimates based on the ration cards as on September 1, 2001 are higher by at least 7 per cent at the state level compared with the 2001 Census figures including the estimates for Kachchh where Census could not be conducted due to earthquake devastations. This is clear when we look at the figures of total population given in Tables 11 and 12. It is still an underestimate because in reality not all families in rural and urban areas hold ration cards. If one assumes that the average size of the family per card was the same in reality and also assume that all families hold ration cards then using the Census 2001 district population it should be possible to work out the number of cards that should have been there, which is presented in Table 12. At the state level the ghost cards are at least 7 per cent. But the inter regional and inter district variations draw attention. Saurashtra region has perhaps the highest ghost cards (14.4 per cent) followed by Kachchh with 11.9 per cent and Central Gujarat with 8.2. North Gujarat has low excess of about 2 per cent and South Gujarat has a short fall of about 2 per cent. It is interesting to note that both North and South Gujarat have tribal population who are poorer than the most. In 1987-88 NSS

13
regional classification, the poverty estimates suggested more poverty among the tribals. Appendix Table 2 contains the data. Banaskantha, Sabarkantha, Surat, Valsad, Dangs are the districts that form part of the eastern tribal region and it is clear from the Table that poverty was relatively higher in this NSS region. The implication is that while generally there is a tendency to have more ration cards in the state than the population, the poor and needy areas are not adequately covered by the PDS network. Admitting the existence of the problem of ghost cards the Secretary, Food and Civil Supplies, Government of Gujarat says, “One of the major problems that affect the efficient distribution of goods to the low income consumers is the concept of ghost ration card. It happens because of the collusion of the tehsil staff and the unscrupulous traders, also because of the improper survey done by the tehsil staff. Because of this problem, sizeable amount of essential commodity reaches open market or wrong hands” (Dash, 2003: 13). There has been an argument about proper targeting of PDS towards the population that deserves. Both overestimation and underestimation distort the supplies. For instance overestimation of BPL families in Kachchh and Saurashtra districts would mean siphoning of supplies by relatively non-poor and underestimation of BPL families in tribal districts would mean insufficient coverage. Vepa (2003) has quoted a Table generated in a study by Tata Economic Consultancy Services in which diversions of food grains from PDS have been estimated. In case of Gujarat 23 per cent of wheat, 21 per cent of rice and 18 per cent of sugar were diverted from PDS to other outlets. The highest figure for wheat was 69 in Punjab, and lowest was 15 per cent in Andhra Pradesh. In case of rice the highest diversion was 54 per cent in Orissa and 18 per cent in Himachal and Karnataka. In case of Sugar diversion of 47 per cent in Bihar and lowest was 8 per cent in Himachal Pradesh. Awareness among people, strengthening of Panchayati Raj institutions such as Gram Sabha and efficient administration with vigilance may correct some of the distortions by way of ghost cards and diversion of essential supplies. 3.3 Gujarat State Civil Supplies Corporation (GSCSC) The State Government set up Gujarat State Civil Supplies Corporation in October 2, 1980. The objectives have been to procure essential commodities and to arrange its distribution especially to the vulnerable sections of the society. It is also intended to remove the bottlenecks in public distribution systems and see that adivasis and farmers get reasonable return to their produce at the same time

14
consumer’s interests are protected. The corporation is also acting as the Government nominee for purchase, storage and issue of imported edible oil to the fair price shops. Soya bean and Palmolein oils are imported under the GSCSC umbrella. With effect from November 1, 1980 distribution of foodgrains was transferred to the corporation along with the storage facilities. The Corporation also introduced mobile fair price shops in tribal areas. Time series data on the Corporation’s activities are available from 1986-87, which is presented in Table 13. In a way it is fascinating to see a total of thirty-two schemes including PDS being operated by the Corporation. It should be mentioned that almost all new schemes get started by the Centre. In 1986-87 the year from which time series data for corporation are available there were 9 schemes. These grew into thirty-two by 2000. It can be clearly seen that the total grains supplied under various schemes have not increased over time on a continuous basis. In fact, in the late 1980s and early 1990s the supplies touched maximum and then in the middle and late 1990s it declined and touched the mid 1980s level. It is also noteworthy that the schemes just do not go on adding over time. Some schemes are also discontinued. It is evident from the Table that in a given year the number of schemes in operation ranged between 9 and 17. Thus, it is difficult to look for any systematic logic in introducing new schemes under the PDS programme. Does increase in number of scheme imply better targeting? One is not certain. In some scheme particular population section is targeted and in some schemes it is the area. But without any firm and consistent increase in the new schemes the entire exercise appears to be completely ad hoc. The setting up of Corporation also does not seem to have helped in any significant way at least as far as the quantity of grains handled in PDS is concerned. The department of Food and Civil Supplies handled the PDS supply practically in the same way. In case of Gujarat the corporation has experimented with having its own retail outlet for provisional stores including grains supply and named it as “Kalpataru”. The performance is reportedly not very good uniformly at all the outlets. Corporatisation of PDS mechanism may have in a way led to more administrative and management expenses. This issue needs separate examination. The national concern and criticism of the PDS prompted some important changes in PDS networking and programming. According to the Economic Survey 2002-03, PDS, as it stood earlier, was widely criticised for its failure to

15
serve the population below the poverty line, its urban bias, negligible coverage in the states with the highest concentration of the rural poor and lack of transparent and accountable arrangements for delivery. Realising this, the Government streamlined PDS by issuing special cards to families Below Poverty Line (BPL) and selling foodgrains to them at specially subsidised prices, with effect from June, 1997. The programme was named the Targeted Public Distribution System (TPDS), the States were required to formulate and implement foolproof arrangements for identification of the poor, for delivery of foodgrains to FPSs and for its distribution in a transparent and accountable manner at the FPS level. We have discussed above Gujarat’s response with this respect while commenting upon the ration cards scenario. In fact, Gujarat took special initiative in 1992, much before the TPDS scheme was introduced. The scheme, when introduced, was intended to benefit about 6 crore poor families for whom a quantity of about 72 lakh tonnes of foodgrains was earmarked annually. The Government of India used the Lakdawala Committee estimates for targeting poor. The identification of poor under the scheme was to be done by the states under the same Lakdawala Committee methodology for estimating state level poverty numbers. The allocation of foodgrains to the States/UTs was made on the basis of average consumption in the past, i.e., average annual off-take of foodgrains under PDS during the past ten years. Keeping in view the consensus on increasing the allocation of foodgrains to BPL and to better target food subsidy, the Government of India increased the allocation to BPL families from 10 kg to 20 kg per family per month at 50 per cent of economic cost and allocation to APL at economic cost from April 2000. The allocations were further revised in July 2001 to 25 kg per family per month and again in April 2002 to 35 kg per family per month for BPL and Antyodaya families. The allocation for APL was initially retained at the same level as at the time of introduction of TPDS, but it was also changed to 35 kg per family per month from April 2002. The 50th Round of the National Sample Survey exercise had brought out that about 5% of the total population in the country sleeps without two square meals a day. The Government of India termed this group as struck by hunger. For TPDS to target still better towards this category of population, the Prime Minister launched the “Antyodaya Anna Yojana” (AAY) on 25th December 2000. Of the 6.52 crore persons under BPL at all India level, one crore were to be further identified under AAY. These identified families are currently being provided 35 kg

16
foodgrains per family per month at highly subsidized rates of Rs. 2 a kg for wheat and Rs.3 a kg for rice. This incidentally was a scheme that was already introduced by the Government of Gujarat before the Government of India introduced AAY. The national level concerns appear very reasonable and genuine. Attempt to target the poorest and vulnerable should undoubtedly be a cherished goal of the State. However, when one looks at the State level PDS programme one finds reallocation of the foodgrains from one scheme to the other. Even when there was earthquake in January 2001 and riots in February 2002, distribution through PDS has not registered any unusual rise in the total foodgrains distributed in State. During 2000-2001, earthquake related PDS distribution was about 64 thousand tonnes and in 2001-02, it was 34 thousand tonnes. During the riot period that is 2001-02 and 2002-03, the PDS distribution was 163 thousand tonnes, which was substantial. However, the total PDS distribution between April-October 2002 was around 382 thousand tonnes. It can be expected that for the next six months i.e. November 2002 and March 2003, the total PDS distribution would not exceed 750 thousand tonnes. Table 13 does not provide data for 2002-03 because only April-October data have been published. One can argue that introducing specific schemes for PDS is an attempt to do better targeting, lack of which has given rise to major criticism. However, one fails to see any state government initiative in understanding the poverty profile, need assessment in different geographical areas with Gujarat and tailoring the schemes according to them. Most of the 30 odd schemes that have been attempted by the government of Gujarat have been initiated at the instance of the Government of India. And there is fair amount of ad hocism in starting and closing schemes or increasing and decreasing allocation and distribution under different schemes. Table 13 (A) gives percentage distribution of total PDS foodgrains supply in Gujarat under different programmes every year beginning 1986-87. Let us look at the first decade and a year that is between 1986-87 and 1996-97 since during these ten years of the existence of the state civil supplies corporation, targeting was not on agenda of the central government. No less than 25 schemes were implemented to channelise the PDS supplies in Gujarat. Integrated Tribal Development Programme (ITDP) was the first major claimant of the PDS supply. Food for All (FFA) was another programme that received

17
importance. In 1987-88 scarcity was a major claimant and rightly so because it was one of the worst droughts experienced by Gujarat in about 90 years after the 1900 famine. Similarly, in 1991-92 Mid Day Meal (MDM) schemes got importance. For the next four years Drought Prone Areas Programmes (DPAP) got importance. 1997-98 onwards allocation under ITDP got discontinued. In the last five years it is largely TPDS-BPL and APL. Programmes such as DPAP, ITDP, Scarcity, etc. are area programmes. MDM, FFA etc. are population specific programmes. What was the government trying to target, poor areas or poor people or poor people in poor areas? And if a priority was once fixed, for what reasons was it altered? There are hardly any answers to these questions. Should one believe that under TPDS-BPL, tribal received priority? Do the drought and scarcity hit areas and people get priority? If so how? The ration card game that we have shown earlier, suggests that areas with low poverty have larger share of ghost cards. Does targeting help? If Gujarat has specific problem related to tribal area and people, the ITDP channel should have continued and the targeting in it should have been more focussed. The basic problem is that the state government does not make its own assessment and is guided by the centre’s instruction and schemes. The centralised top-down mindset is also witnessed in the welfare schemes. Grassroots and local assessment of the situation and plan formulation according to the local situation is hardly attempted. Thus, if there be a problem in targeting, there would be a problem in addressing the nutrition issue as well. Mid Day Meal is a programme that directly addresses the children’s nutrition. It receives about 5 to 6 per cent of PDS supplies. If the state government had continued to support it under MDM scheme, why it had to reduce the allocation once the Central Mid Day Meal (CMDM) started? The total allocation to MDM did not change with central special assistance. If the earlier allocation was enough, the state government should have said no to central assistance under the CMDM and demanded allocation under some other programme? If it was not sufficient, then there was no point in reducing the allocation under MDM. In any case, in all these allocation shuffle game total PDS quantities have been widely fluctuating. The average handling of foodgrains in first 11 years of Corporation beginning 1986-87 was 909 thousand tonnes with 601 thousand tonnes lowest value and 1343 thousand tonnes highest value. In the next five years, i.e. after the TPDS-BPL, APL scheme started the average handling was 670 thousand tonnes with lowest of 520 thousand tonnes and highest of 797 thousand tonnes. Interestingly, once the national policy to target the specific groups was formulated and implemented, the foodgrains handling by Gujarat government fell by about 27 per cent on an average. Was Government of

18
Gujarat wasting foodgrains by subsidising non-poor? One does not have an answer. It should now be relevant to know how poor utilise the PDS. NSS Rounds have some information on this aspect. The next section contains a brief review. 4. Who Utilises and Benefits and How Much from PDS in
Gujarat? There is no state specific comprehensive analysis of the performance of PDS in the context of basic issues that have been raised in the national level analysis. At the national level the PDS reviews examine among other things issues relating to food subsidy, regional distribution, income distribution, PDS as an anti-poverty measure, implications of PDS supply on the caloric intake of the general and poor population, PDS and economic reforms, universal application versus targeting and international experiences. However, some studies have done All India analysis covering major states and one gets some insights into the working of PDS in the states. Subbarao in his 1988 work (as referred by Jharwal 1999) showed that barring Kerala and Gujarat, people living below the poverty line in rural areas did not benefit much from the procurement, stocking and public distribution. Kerala and Gujarat could do better because of better coverage under PDS network. Tyagi in his 1990 work (as referred by Jharwal 1999), found that large part of PDS benefits accrued to Maharashtra, Gujarat, Kerala and West Bengal and states such as Madhya Pradesh, Bihar, Orissa that have extensive poverty had PDS only at modest scale. Earlier, in 1986, the Indian Institute of Public Administration conducted a major study across the states (Jharwal 1999). The study found that in MP, Gujarat, Haryana, Punjab and Karnataka, the wheat requirement met by the PDS was negligible whereas it was between 50 to 80 per cent in West Bengal, Tamil Nadu, Delhi and Kerala. Similarly, in case of rice, good proportion of contribution came from PDS in West Bengal, J&K, UP, Delhi and Arunachal Pradesh. The study also brought out a clear bias in favour of urban areas. Incidentally, most scholars have brought out the urban bias in PDS. Jharwal (1999) has undertaken a comprehensive study of PDS in India covering most important issues raised in the literature. The study also provides at many places state level analysis. It should be stated at the outset that Jharwal’s analysis of the state level performance is mainly based on the 42nd Round of the

19
NSS conducted in 1986-87. Vepa (2003) has analysed PDS scene in Gujarat using the 55th Round of NSS. Both these studies together provide useful insights. It should also be recognised at the outset that the PDS story in India is essentially a story of rice, wheat, oil and sugar. The last two items are on quota basis. Sugar is maximum 400 grams per capita per month. Oil quota fluctuates but does not exceed 500 ml per capita per month. The large part of the PDS story is thus reduced to rice and wheat. This point needs to be highlighted in the context of the food security debate in which it is argued that not only the quantity of the food consumed is important in food security, but also the nutritive value of the food eaten. The ICMR norms for balanced diet, as stated earlier, contains ten items such as cereals, tubers, pulses, sugar, edible oil, fruits, vegetables, milk, eggs and fish. A daily consumption of 982 grams is prescribed. Cereals alone have a weight of 43 per cent and if one adds sugar and edible oil, the weight increases to 48 per cent. Thus, PDS with its multiple objectives can help the poor and vulnerable only in gaining access to a maximum of about 50 per cent of the nutritive diet that an average person is supposed to take. Further analysis below shows that with problems in targeting the poor precisely, the chances of providing 50 per cent of food security to poor through PDS is further reduced. At the country level, India is still dominated by rural people and most persons depend upon homegrown supplies. Table 14 below shows the percentage of people who purchase selected items from any source. The figures show that in case of rice a higher percentage of population buy both in rural and urban areas. This is because Gujarat is not a major rice growing state and the consumption of rice is also less. In case of wheat, percentage of people buying in rural Gujarat is higher than the all India rural population. Wheat is one of the staple foods and it is also first substitute to the staple food that is either bajri or jowar. Thus, in Gujarat larger proportion of rural population was reportedly buying wheat from any source in 1986-87. About similar situation is likely to obtain even today. It has been shown in the first section already that Gujarat is food deficit state and hence generally the proportion of population buying food is higher. Subbarao’s finding that Gujarat is a better utiliser of PDS is borne out by the share of PDS in total purchase of rice and wheat as reflected in Tables 15 and 16. Gujarat is not a major rice eater and hence in the total rice purchased in the country, Gujarat’s share is small with 2.84 per cent. But the share of PDS in total purchase is way above the national average. Nearly 50 per cent of all rice

20
purchased in rural Gujarat in 1986-87 came from PDS and 26 per cent of all rice purchased in urban areas came from PDS. The national averages are below 20 per cent both in rural and urban areas. After we know that relatively higher proportion of people buy rice and wheat from PDS in Gujarat, let us look at the position of the poor in it. Table 17 contains data on percentage of poor among all buyers of rice and wheat from any source. Here, Gujarat seems to take a back seat. Consistently both in rural and in urban areas proportion of poor among all buyers is lower than the national average. The situation with respect to rice is almost comparable to that of All India, but in case of wheat participation of poor is poor. I have made a point earlier that wheat is not the staple food in Gujarat. Obviously, poor do not eat much wheat. If they have to buy they would buy bajri or jowar and since they are not covered in the PDS, they buy them from open market. It is further interesting to observe that although 37 per cent of all wheat consumed was purchased in rural Gujarat, poor purchasers constituted a very small portion and less in proportion than their urban counterparts. Thus, open purchase of rice and wheat by poor in Gujarat in 1986-87 was highly restricted. The next obvious inquiry would be to look for the proportion of poor buying from PDS from among all poor who buy. It is interesting to find that relatively less proportion among poor buy rice and wheat in Gujarat but among those who do, a very large majority buy from PDS (Table 18). It is possible to hypothesise that in Gujarat the better of among the poor buy and they do it largely through PDS. However, they do not end up buying very large quantities from PDS. In Table 19 data about the share of purchase by poor PDS purchasers to total PDS purchase is given. Gujarat’s position is much below the All India average. Thus poor in Gujarat buy rice and wheat largely from PDS but their share in total PDS purchase of rice and wheat by all population is low. PDS in Gujarat is well utilised but more so by the non-poor. Although poor buy less from PDS compared with all PDS buyers, still the weight it has in the total purchase by poor by any source needs to be ascertained (Table 20). Since rice is not staple food, poor hardly buy it from the open market in rural Gujarat. 84 per cent of the total rice bought came from PDS. In urban areas the situation is different. In case of wheat too as much as 55 per cent of all purchase in rural Gujarat came from PDS. All India figures are fairly low both in rural and urban areas and in case of wheat and rice. In large number of states therefore,

21
poor have to rely on market and other sources for buying rice and wheat and PDS contributes only between 11 and 22 per cent. It has been brought out by other scholars as well that poor are left out in many states and hence better targeting has been advocated (Parikh 1994). The central question in PDS while it is aimed at providing food security to the poor is: what is the contribution of PDS in the total food that is consumed by the poor? If poor show that most of the supplies come from the PDS, then it may be said that PDS is effective. Jharwal has analysed and tabulated the contribution of PDS and market in the total consumption. However, the exercise is not carried out for poor. Nevertheless, even for the total population the data are interesting. The share of PDS and market in the total per capita rice, wheat and total cereal consumption per annum is presented in Table 21. A further limitation of the data is that it is not computed separately for rural and urban areas. In case of all India, purchased cereals in 1986-87 constituted only about 16 per cent of the total annual per capita consumption. Rice and wheat’s shares were higher between 23 and 26 per cent. PDS share of rice and wheat was between 13 and 16 percent. In case of Gujarat 45 per cent of all cereals were purchased and share in wheat was very high (63 per cent). Interestingly, in case of rice and wheat share of PDS was high. But the most interesting point in Gujarat’s case is that the cereal composition in consumption is significantly different. At all India level rice and wheat constituted about 85 per cent of all cereals, whereas, in case of Gujarat they constituted 59 per cent only. The average consumer in Gujarat eats less rice and wheat and eats more of Jowar and Bajri and other coarse cereals. Therefore even during drought, PDS comes to help but it is the open market, which helps more. Table 22 contains data on the drought year and normal year share of PDS and market in the consumption of cereals. In case of Gujarat it is clear that both in normal and drought year the share of market purchase is higher. At all India level, PDS appears more effective during drought year although the share of market purchase goes up. This is because in Gujarat rice and wheat are consumed less. For an effective PDS therefore, cereal basket needs to examined and focussed upon. Vepa’s analysis for the NSS 55th Round also does not give any drastically different picture. The average monthly per capita consumption of foodgrains (rice and wheat) was 0.93 kg against the all India average of 1.02 kg. The lowest four Monthly Per Capita Expenditure (MPCE) classes together in Rural Gujarat

22
constituted 16 per cent of the total sample and their average monthly consumption of foodgrains from PDS was 1.15 kg, which was 24 per cent higher than all expenditure classes and the share of wheat in it was 63 per cent (Based on Vepa 2003, Table 6). In urban areas of Gujarat share of PDS was fairly higher for the lowest four MPCE classes. The average monthly consumption was 0.91 kg, which was lower than the rural figure, but compared with the average figure of 0.49 kg for urban MPCE classes taken together, it was higher by 86 per cent. Cereal consumption of the lowest ten percent of NSS sample in Gujarat was 8.73 kg per month per capita. The average for the total sample was 11.37 kg, which was slightly lower than the national average of 12.72 kg per month per capita. The poorest ten percent consumed about 24 per cent less than all. In case of all India the poorest 10 per cent consumed 18 per cent less than all. In terms of caloric intake the poorest 10 per cent consumed 1400 calories per day compared with 1986 calories for the state sample as a whole (Vepa 2003, Table 9). This means that the poorest ten percent people got 30 per cent less calories than average for all. Thus, the poor ate less of cereals and other food items. The PDS in Gujarat is thus effective to some extent in as much as it helps poor buying more of wheat and rice out of total purchase they make, but still it is not sufficient for them to get the total caloric requirement from the grains they buy in general and what they buy from PDS in particular. If the NSS inquiry on per capita consumption expenditure imputes value for the meal consumed by children in school under mid day meal programme then the deficit in average caloric content is more serious. However, if the Mid Day meal is not considered in the NSS inquiry, children of poor families who attend school and are covered under Mid Day Meal programme would have relatively better nutrition than those who do not attend school. The under six population among the poor are more likely to be undernourished because 0-6 age group children among the poorest are also not likely to attend Anganwadis, the pre school institution. We have already seen in Table 13 (A) that the share of MDM and CMDMS (state and central mid day meal schemes) in the total PDS allocation has not been more than 6 to 7 per cent. With full attendance in pre school Anganwadis and regular schools, the share is not likely to go beyond 9 per cent. As the all India analysis reflects that Gujarat is one of the better users of PDS and poor in Gujarat use PDS more than non-poor for wheat purchase, the TPDS

23
or allocation under special programmes is not likely to improve targeting further. There appears to be a need for fresh assessment of the situation and planning. 5. Suggestions for Improving Effectiveness of PDS in Gujarat The state level review of PDS should mainly be in the context of food and nutrition security to poor and vulnerable population sections. At the national level PDS may have multiple objectives, but at the state level, it is largely effective targeting, distribution and providing nutritional security to poor regularly, during drought and other natural disasters and to vulnerable sections. The relevance and usefulness of the PDS in the larger context of regulating market behaviour to provide support prices and maintain buffer stocks etc. are being questioned seriously. The Economic Survey 2002-03 has found that the economic cost of procuring and transporting rice and wheat was very high. Even with substantially revised central issue prices, food subsidy is mounting. Between 1996-97 and 2002-03, food subsidy increased from Rs 6,066 crore to Rs 21,200 crore (Budget estimate, Table 5.15, Economic Survey 2002-03). If the issue prices are raised further, the target population may find it economical to buy from the open market. In yet another significant observation, the Economic Survey comments that the minimum support prices in case of most crop items were virtually ceiling prices. Thus, in Indian case food subsidy at present has a component of subsidy to producers and subsidy to consumers both. Rising issue prices may have adverse impact on the performance of the state level PDS programmes as well. Since, the food subsidy issue is to be settled at the national level, we continue to focus only on improving the effectiveness of the state level PDS programmes assuming the given central policy. Irrespective of the data sets used, poverty in Gujarat has declined over time. Hence, for an effective PDS programme, the sub regional level assessment of the potential PDS beneficiaries should be attempted first. The BPL surveys were supposed to provide this regional and village level picture of poor. Unfortunately, the BPL survey leaves a lot to be desired in terms of reliability of data generated. We have shown that using the BPL data, the ration card manipulation can be of substantial magnitude. For better targeting it is not enough to have only poverty estimates at the state and lower levels. The nature of vulnerability and poverty should also be

24
understood. The exercise is also necessary to address the nutrition issue. Although it must be stated again that the major items that the PDS handles are rice, wheat, edible oil, sugar and kerosene. The poorest tend to use rice and wheat and only occasionally draw on the sugar, oil and kerosene quota. Thus, of the total nutritional requirement PDS at best can take care of 48 per cent if consumed in a balanced fashion. Since poor do not normally have access to other items such as milk, eggs, vegetables and fruits etc in desired quantities that contribute to the total nutritional requirements, they may be consuming more of foodgrains subject to their income constraint. In this context, nature of poverty has to be understood first. Writing on economic reforms and poverty alleviation, Lal (1998) distinguishes between different types of poverty. Lal states that there are three types of poverty, mass structural poverty, destitution and conjunctural poverty that may have some usefulness in the present analysis. Lal goes on to argue and prove that there was historical evidence as well as strong theoretical base to conclude that mass structural poverty can be reduced substantially and sustainably only though liberalised market governed economies. Mass poverty meant that the headcount ratio of poor in large in an economy. Growth is the only major powerful engine that can make a dent on the mass poverty. The shift of organic agrarian economies to industrialised economies is an example that has potential to be carried forward. Destitution poverty is one where an individual is lacking in labour power for physical and social reasons. Society has always tackled this with charity both public and private. Conjunctural poverty arises due to seasonal and unpredictable fluctuations affecting normal production environment. The extreme form of such poverty manifests at the time of famines. Income transfer by State has been the dominant strategy. There has been considerable debate whether such income transfer should be under the welfare state mode or safety net mode. The latter seem to be the preferred one in the liberal economic approach. Lal too favours the targeted safety net approach. PDS as it is conceived and implemented is part of the welfare state approach to income transfer. The present PDS programme besides addressing the destitution and conjunctural poverty also aims to make dent on structural poverty and many scholars may not approve of it. This approach of universalising the income transfer has all potentials of getting vitiated. The actual beneficiaries are different than the intended beneficiaries. As noted, studies have shown that there are serious lags and leaks in the delivery system. Safety net approach implies better
25
and accurate targeting as stated earlier. I have shown elsewhere that in Gujarat more than the number, the groups and geographical locations where poor are located are more relevant in exploring ways and means to alleviate poverty in the State (Iyengar 2000). Thus, poverty can be traced in Gujarat among few groups. It is among tribal people in eastern belt of the state, schedule castes (some sections) in North and Central Gujarat and parts of Saurashtra, saltpan workers in Kachchh, North Gujarat and Saurashtra, livestock herders and similar occupation specific groups in North Gujarat, Saurashtra and Kachchh. Put together, they would constitute around 20 per cent of the total State population. The staple diet of most of these groups does not have large proportions of rice and wheat, which is the mainstay of PDS in India and therefore also in Gujarat. Only in years of acute drought, when the local crops fail totally, do they resort to consuming wheat as main diet. Even in such cases the market purchase of grains other than rice and wheat are substantial as reflected in the data presented by Jharwal (1999). While one cannot immediately shift the procurement and distribution in favour of other foodgrains it may be useful to carry out an analysis using latest NSS data first and tracing and describing the poor in each state, their food grains basket needs to be examined. This exercise will help the states in targeting the PDS better. Proper identification of the potential beneficiaries is the second most important step. The ghost ration cards have to be eliminated completely. The Gujarat Government has initiated an experiment of involving cooperatives as fair price distribution shops. These efforts need to be strengthened further. The Gram Sabha that has been reactivated now again under the Panchayati Raj administration and implementation of development schemes, should be involved thoroughly. The list of BPL families, list of different colour card holders (signifying their economic status) and the ration quota of all the items must be displayed in public and the records should be made available to any village resident upon request. The transparency and public knowledge of the entitlement of different families in a village would act as a check on the people, officer and traders who indulge in manipulation. The central government has recognised two categories BPL and APL. The state government should also reduce all the categories into two and target the allocation and distribution. More the number of categories, higher would be the chance of manipulation. In any given year the PDS is channeled through 10 or more schemes. Although intended for better targeting, it fails to do so. Further, the total supply is not

26
related to the number of schemes. It is not necessary for instance, that higher the number of schemes, higher was the PDS quantities distributed and vice versa. There is an urgent need to rationalise the schemes. Allocation and distribution aimed at BPL, APL should be enough. If employment programmes are to be run, it means increase in quota for the BPL families during particular months. Such quota allocation should be made public. The Panchayat office must display the monthly quota by category and scheme, if any on a notice board at a prominent public place. Similarly, the fair price shops should also declare in public the quota received and display the changing stock on daily basis. Non-government organisations have in some cases come forward by assisting in planning better distribution of the PDS supply and in general keep vigil on the malpractices. Some of them have also found that the programmes for children such as Integrated Child Development Scheme (ICDS) and Anganwadi are very useful in utilizing PDS supplies to improve the nutritional levels of children. The off take of the PDS supplies in ICDS via mid day meal scheme as reflected in Table 13, is not very high and is fluctuating. Unfortunately, NGOs are not present in more than 10000 out of 18000 villages, to run the nutrition programme well. The leakages in mid day meal scheme is also known. There is also the issue of children not attending school in 0-4 and 5-14 age groups. In many tribal areas the irregularities is so high that people have stated their clear preference for increased allocation for families with school going children instead of the mid day meal programme (ARCH-Vahini, 1991). For effective implementation of supplementary nutrition programmes, mobilization of communities, sensitization of parents and checks and balances on the implementing machinery are sufficient conditions. In view of the facts that (a) safety net approach is still not being adopted as a strategy for helping poor, and (b) income transfer is not affected only by way of providing cash wage employment and other income generating activity in drought and scarcity areas, it is necessary that people in the communities are involved to make the entitlement (BPL, APL), allocation and distribution of PDS supplies, as public and transparent. Gujarat government is partly successful in putting morsels in the mouth of poor but it should also avoid the spillage of the larger quantities outside the deserving mouths by making the system open, participatory and transparent.

27
Table 1: Area Sown and Irrigated in Gujarat, 1960-96
Year Net Area Sown in 000
Hectares
Area Irrigated in
000 Hectares
Percentage Area
Irrigated
Percentage area Cultivated to
Total Area Reported Under
Land Use 1960-61 9401 683 7.26 52.45 1970-79# 9490 1519 16.01 50.43 1980-89# 9265 2147 22.62 50.40 1990-96# 9483 2704 28.51 50.39
Note: # Average for 1970-79, 1980-89 and 1990-96 respectively. Source:
1. Agricultural Statistics Gujarat, Directorate of Economics and Statistics, Government of Gujarat, Gandhinagar
2. Socio-economic Review 1998-99 and 2000-2001, Directorate of Economics
and Statistics, Government of Gujarat, Gandhinagar
Table 2: Percentage Area under Cereals and Pulses in Gujarat, 1960-96
Year Net Area Sown in 000
Hectares
Gross Cropped
Area in 000 Hectare
Percentage Area Under Cereals and
Pulses
Percentage Area Under all Other
Crops
1960-61 9401 9972 47.43 5246 1970-79# 9490 10337 47.84 52.16 1980-89# 9265 10476 48.04 51.96 1990-96# 9483 10897 42.96 57.04
Note: # Average for 1970-71 to 1979-80, 1980-89 and 1990-96 Source:
1. Agricultural Statistics Gujarat, Directorate of Economics and Statistics, Government of Gujarat, Gandhinagar
2. Socio-economic Review 1998-99 and 2000-2001, Directorate of Economics and
Statistics, Government of Gujarat, Gandhinagar

28
Table 3: Per Capita Foodgrains Production in Gujarat, 1960-1996
Year Production of Foodgrains (‘000 Tones)
Population in Million
Per Capita Food Grains Production
in kgs. 1960-61@ 1888 20.6 92 1970-79# 3847 30.4 127 1980-89# 4518 37.7 120 1990-98# 5112 45.9 111 1990-91* 5083 41.3 123 1991-92 3839 41.6 92 1992-93 5941 42.2 147 1993-94 4151 42.7 97 1994-95 5760 43.3 133 1995-96 4774 43.8 109 1996-97 6089 45.7 133 1997-98 5710 46.4 123 1998-99 5567 47.0 118
Note: @ Production is for 1960-61 and population is 1961 Census Population
# Production is average for 1970-71 to 1979-80 and population is average of 1971 and 1981 Census Populations. Similar averages have been given for 1980s and 1990s.
* From here onwards production figures are annual production and population for 1990-91 is from 1991 Census Population and rest of the population figures are estimates.
Source: 1. Agricultural Statistics Gujarat, Directorate of Economics and Statistics, Government of
Gujarat, Gandhinagar 2. Socio-economic Review 1998-99 and 2000-2001, Directorate of Economics and
Statistics, Government of Gujarat, Gandhinagar

29
Table 4: Allocation and Lifting of PDS Supply by Gujarat, 1963-64 - 1970-71 (In ‘000 Tones)
Rice Wheat Pulses/Coarse Grains from
1968-69
Total Foodgrains
Year
Alloca-tion
Lift Alloca-tion
Lift Alloca-tion
Lift Alloca-tion
Lift
1963-64 71 78 198 152 - - 269 230 1964-65 188 182 696 652 62 5 1059 930 1965-66 99 82 518 495 17 37 829 795 1966-67 45 48 378 369 7 4 699 688 1967-68 35 32 301 302 16 16 616 593 1968-69 57 45 148 134 139 136 344 315 1969-70 104 65 48 40 30 40 182 145 1970-71 11 5 10 5 - - 21 10
Source: Annual Volumes of Socio-economic Review, Gujarat State, Directorate of
Economics and Statistics, Government of Gujarat, Gandhinagar

30
Table 5: Allocation and Distribution of PDS Supply by Gujarat, 1972-73 - 1997-98 (in ‘000 tones)
Foodgrains Year Allocation Distribution
Coarse Grains
Distributed Distribution as % of Allocation
1972-73 389.9 228.80 N.R. 58.68 1973-74 828.56 747.13 N.R 90.17 1974-75 721.00 769.84 N.R. 106.77 1975-76 N.A. N.A. N.A. - 1976-77 171.21 172.08 N.R. 100.51 1977-78 176.73 176.71 N.R. 99.99 1978-79 N.A. N.A. N.A. - 1979-80 162.29 130.14 N.R. 80.19 1980-81 185.12 125.86 N.R. 67.99 1981-82 202.43 204.16 N.R. 100.85 1982-83 185.00 224.73 25.73 121.48 1983-84 175.00 130.44 40.7 74.54 1984-85 175.00 81.59 30.03 46.62 Average 1972-84
306.52 272.22 - 88.81
1985-86 160.17 162.53 14.86 101.47 1986-87 414.15 432.19 33.71 104.36 1987-88* 950.00 885.4 14.55 93.20 1988-89 725.00 507.1 23.47 69.94 1989-90 1083.00 833.33 N.R. 76.95 1990-91 702.00 400.00 N.R. 56.98 1991-92 647.00 648.00 12.80 100.15 1992-93 651.00 568.45 NR 87.32 1993-94 528.00 255.86** N.R. 48.46 1994-95 1056.00 633.09 N.R. 59.95 1995-96 1244.50 711.45 N.R. 57.17 Average 1985-95
763.27 578.15 - 75.74
1996-97 1066.90 969.00 N.R. 90.82 1997-98 541.65** 449.91** N.R. 83.06
Note: * 1987-88 was a severe drought year and hence a special allotment was made for
300000 tones under scarcity and 256500 tones were distributed besides the normal allotment and distribution.
** April-September figures only NA – Not Available; NR – Nor Reported
Source: Annual Volumes of Socio-economic Review, Gujarat State, Directorate of Economics and Statistics, Government of Gujarat, Gandhinagar
31
Table 6: Allocation and Lifting of PDS Supply by Gujarat (In ‘000 Tones)
Rice Wheat Foodgrains Year Alloca-
tion Lift Alloca-
tion Lift Alloca-
tion Lift
Average 1985-95
354.31 258.30 (72.90)
714.51 497.38 (69.61)
1068.82 755.68 (70.71)
1996-97 376.00 276.40 (73.51)
690.90 624.10 (90.33)
1066.90 900.50 (84.40)
1997-98 308.00 178.75 (58.04)
741.65 519.31 (70.02)
1049.65 698.06 (66.50)
1998-99 356.00 251.36 (70.61)
490.00 403.54 (82.35)
850.00 654.89 (77.04)
1999-2000 Up Feb 2000
288.00 161.26 (55.99)
674.50 265.37 (39.34)
962.50 426.64 (44.33)
Average 1996-2000
332 216.94 (65.34)
649.26 453.08 (69.78)
982.26 670.02 (68.21)
Note: Figures in bracket indicate percentage to allocation Source: Ministry of Consumer Affairs and Public Distribution, Government of India,
New Delhi 2001

32
Table 7: Fair Price Shops in Gujarat, 1960-1997
Year No of Fair Price Shops in the State
Percentage Change Over Previous Year
Department’s Storage
Capacity (000 Tones)
Percentage Change Over Previous Year
1960 3969 - - - 1969 6620 - - 1970 6285 -5.06 144.00 - 1971 N.R. - 159.00 10.42 1972 7462 - 153.03 -3.75 1973 8337 11.73 186.03 21.56 1974 8504 2.00 202.95 9.10 1975 N.R. - 245.02 20.73 1976 9351 - 239.95 -2.88 1977 9273 -0.83 196.92 -17.93 1978 8956 -3.42 191.25 -2.88 1979 8700 -2.86 191.95 0.37 1980 9544 9.70 235.22 22.54 1981 9928 4.02 193.12 -17.90 1982 10103 1.76 224.15 16.07 1983 10525 4.18 256.43 14.40 1984 10456 -0.66 233.61 -8.90 1985 10602 1.40 243.32 4.16 1986 10843 2.27 226.86 -6.76 1987 11468 5.76 237.94 4.88 1988 11980 4.46 250.30 5.19 1989 12133 1.28 235.70 -5.83 1990 12099 -0.28 247.83 5.15 1991 12462 3.00 250.00 0.88 1992 12934 3.79 250.00 0.00 1993 13253 2.47 234.00 -6.40 1994 13230 -0.17 221.00 -5.56 1995 13296 0.50 221.00 0.00 1996 13348 0.39 221.00 0.00 1997 13936 4.41 221.00 0.00
Source: Annual Volumes of Socio-economic Review, Gujarat State, Directorate of
Economics and Statistics, Government of Gujarat, Gandhinagar
Table 8: Population per Fair Price Shop in Gujarat
Year Population in Million FPS Population per FPS 1961 20.6 3969 5190 1971 26.7 6285 4248 1981 34.1 9928 3435 1991 41.3 12462 3314 2001 49.97 14263 3503
Source: Different Volumes of Socio-economic Review, Gujarat State, Directorate of
Economics and Statistics, Government of Gujarat, Gandhinagar

33
Table 9: Distribution of Population and Fair Price Shops by District in Gujarat, 2001
Region/ District Rural Pop
Fair Price Shops
FPS/ ‘000 R Pop
Urban Pop
Fair Price Shops
FPS/ ‘000 U Pop
Total Pop
Total Fair Price Shops*
FPS/ ‘000 T Pop
Kachchh 1108.20 450 2463 474.56 118 4022 1582.76 568 2786 Amreli 1080.42 403 2681 312.87 23 13603 1393.29 426 3271 Bhavnagar 1534.59 496 3094 934.68 221 4229 2469.27 717 3444 Jamnagar 978.32 405 2416 837.71 131 6395 1816.03 536 3388 Junagadh 1737.10 525 3309 711.33 207 3436 2448.43 732 3345 Porbandar 275.45 137 2011 261.41 67 3902 536.86 204 2632 Rajkot 1165.32 520 2241 1406.61 313 4494 2571.93 833 3088 Surendranagar 1112.47 351 3169 402.68 125 3221 1515.15 476 3183 Saurashtra 7883.67 2837 2779 4867.29 1087 4478 12750.96 3924 3249 Banaskantha 2227.42 650 3427 275.42 87 3166 2502.84 737 3396 Gandhinagar 867.57 270 3213 467.16 88 5309 1334.73 358 3728 Patan 944.13 338 2793 237.81 76 3129 1181.94 414 2855 Mahesana 1426.07 456 3127 411.63 114 3611 1837.7 570 3224 Sabarkantha 1856.55 644 2883 226.87 68 3336 2083.42 712 2926 North Gujarat 7321.74 2358 3105 1618.89 433 3739 8940.63 2791 3203 Ahmedabad 1156.34 447 2587 4652.04 819 5678 5808.38 1256 4625 Anand 1349.12 441 3059 507.59 121 4195 1856.71 562 3304 Dahod 1478.99 384 3852 156.38 55 2843 1635.37 439 3725 Kheda 1617.23 519 3116 406.12 86 4722 2023.35 605 3344 Panchmahals 1771.53 546 3245 253.35 93 2724 2024.88 639 3169 Vadodara 1992.46 603 3304 1647.32 348 4734 3639.78 951 3827 Central Gujarat 9365.67 2940 3186 7622.80 1522 5008 16988.47 4462 3807 Bharuch 1017.39 327 3111 352.72 90 3919 1370.11 417 3286 Dangs 186.712 53 3523 - 6 0 186.71 59 3165 Narmada 461.98 145 3186 52.11 17 3065 514.09 162 3173 Navsari 893.03 272 3283 336.22 95 3539 1229.25 367 3349 Surat 2000.74 636 3146 2995.65 504 5944 4996.39 1140 4383 Valsad 1029.294 334 3082 381.39 49 7783 1410.68 383 3683 South Gujarat 5589.15 1767 3163 4118.09 761 5411 9707.023 2528 3840 Gujarat 31268.43 10352 3020 18701.63 3911 4782 49970.06 14263 3503
Source: Gujarat State Civil Supplies Corporation, Gandhinagar and Census 2001

34
Table 10: Number of Ration Cards in Gujarat
Year Number of Ration Cards
% Increase Over Previous Year
1977 5541342 - 1978 5578793 0.68 1979 5658709 1.43 1980 5686065 0.48 1981 6046207 6.33 1982 6313392 4.42 1983 6312601 -0.01 1984 6419876 1.70 1985 6495700 1.18 1986 6734828 3.68 1987 7122427 5.76 1988 7487271 5.12 1989 7856381 4.93 1990 6362716 -19.01 1991 6219000 -2.26 1992 4975200 -20.00
Source: Annual Volumes of Socio-economic Review, Directorate of
Economics and Statistics, Government of Gujarat, Gandhinagar

35
Table 11: Number of Ration Cards and Population Covered by Poverty Criterion by District in Gujarat as on September 1, 2001
Ration Cards Region/
District BPL Cards
BPL Pop. APL Cards
APL Pop. Total Cards
Total Pop BPL Pop as % of
Total PopKachchh 169347 823121 234867 949087 404304 1772208 46.45 Amreli 113431 582427 218464 1072500 331895 1654927 35.19 Bhavnagar 167524 856574 407927 1895659 575181 2752233 31.12 Jamnagar 88739 428765 336920 1500998 425659 1929763 22.22 Junagadh 162767 825115 354519 1629239 517286 2454354 33.62 Porbandar 35659 172074 90218 409180 125877 581254 29.60 Rajkot 160257 784901 670068 2928339 830325 3713240 21.14 Surendranagar 124134 576989 213697 936018 337831 1513007 38.14 Saurashtra 852511 4226845 2291813 10371933 3144054 14598778 28.95 Banaskantha 176782 950885 271279 1414586 448061 2365471 40.20 Gandhinagar 75163 375695 183029 918249 258192 1293944 29.03 Patan 89163 451322 166911 880101 256704 1331423 33.90 Mahesana 76569 401640 327760 1690803 404329 2092445 19.19 Sabarkantha 172681 936178 212944 1087351 385625 2023529 46.26 North Gujarat 590358 3115720 1161923 5991090 1752911 9106812 34.21 Ahmedabad 231683 1202028 1144971 5646543 1376654 6848571 17.55 Anand 160984 814532 212450 1142815 373434 1957347 41.61 Dahod 79107 569821 105568 781126 184675 1350947 42.18 Kheda 184700 985695 208847 1086622 393547 2072317 47.56 Panchmahals 153020 973162 171593 1064116 324613 2037278 47.77 Vadodara 206770 1103007 576827 3016645 783597 4119652 26.77 Central Gujarat
1016264 5648245 2420256 12737867 3436520 18386112 30.72
Bharuch 130615 643686 157985 756646 288600 1400332 45.97 Dangs 18887 95869 11083 59903 29970 155772 61.54 Narmada 64551 351666 30120 157566 94671 509232 69.06 Navsari 143127 706072 113873 564008 257000 1270080 55.59 Surat 303791 1544588 686175 3423617 989966 4968205 31.09 Valsad 103194 523757 159368 755770 262562 1279527 40.93 South Gujarat 764165 3865638 1158604 5717510 1922769 9583148 40.34 Gujarat 3392450 17679571 7267447 35767487 10659897 53447058 33.08
Note: BPL = Below Poverty Line defined as the family that earns less than Rs 11,000 per annum APL = Above Poverty Line defined as family that earns more than Rs 11,000 per annum. Source: Gujarat State Civil Supplies Corporation

36
Table 12: Discrepancy in 2001 Population based Cards and Ration Cards as per Records by District
Region/ District
2001 Pop
Total Cardsas per
Records
Members per Card
as per Total Card
Pop.
Cards as per 2001
Pop 2/4
Difference between
Record Cards and Cards as per 2001 Pop.
BPL Card Pop as % of Total Card
Pop
1 2 3 4 5 6 7 Kachchh 1582.76 404304 4.38 361361 42943
(11.88%) 46.45
Amreli 1393.29 331895 4.99 279216 52679 35.19 Bhavnagar 2469.27 575181 4.78 516584 58597 31.12 Jamnagar 1816.03 425659 4.53 400890 24769 22.22 Junagadh 2448.43 517286 4.74 516546 740 33.62 Porbandar 536.86 125877 4.62 116203 9674 29.60 Rajkot 2571.93 830325 4.47 575376 254949 21.14 Surendranagar 1515.15 337831 4.48 338203 -372 38.14 Saurashtra 12750.96 3144054 4.64 2748052 396002
(14.41%) 28.95
Banaskantha 2502.84 448061 5.28 474023 -25962 40.2 Gandhinagar 1334.73 258192 5.01 266413 -8221 29.03 Patan 1181.94 256704 5.19 227734 28970 33.90 Mahesana 1837.7 404329 5.18 354768 49561 19.19 Sabarkantha 2083.42 385625 5.25 396842 -11217 46.26 North Gujarat 8940.63 1752911 5.20 1719352 33559
(1.95%) 34.21
Ahmedabad 5808.38 1376654 4.97 1168688 207966 17.55 Anand 1856.71 373434 5.24 354334 19100 41.61 Dahod 1635.37 184675 7.32 223411 -38736 42.18 Kheda 2023.35 393547 5.27 383937 9610 47.56 Panchmahals 2024.88 324613 6.28 322433 2180 47.77 Vadodara 3639.78 783597 5.26 691973 91624 26.77 Central Gujarat 16988.47 3436520 5.35 3175415 261105
(8.22%) 30.72
Bharuch 1370.11 288600 4.85 282497 6103 45.97 Dangs 186.71 29970 5.20 35906 -5936 61.54 Narmada 514.09 94671 5.38 95556 -885 69.06 Navsari 1229.25 257000 4.94 248836 8164 55.59 Surat 4996.39 989966 5.02 995297 -5331 31.09 Valsad 1410.68 262562 4.87 289667 -27105 40.93 South Gujarat 9707.02 1922769 4.98 1949201 -26432
(-1.36%) 40.34
Gujarat 49970.06 10659897 5.01 9974064 685833 (6.88%)
33.08
Source: Complied from 2001 Census Population and GSCSC records on Ration cards.

37
Table 13: Handling of Foodgrains by the GSCSC under Various Programmes and Schemes (Quantity in ‘000 tones)
Scheme 1986-87 1987-88 1988-89 1989-90 1990-91 1991-92 1992-93 1993-94 1994-95 1995-96 1996-97 1997-98 1998-99 1999-00 2000-01 2001-02PDS 366.10 219.80 636.15 361.56 367.03 538.58 401.63 56.06 126.81 36.36 153.20 36.26 - - - RLEGP 72.40 28.10 21.82 7.47 1.29 - - - - - - - - - - NREP 15.30 64.58 47.68 9.36 12.00 - - - - - - - - - - FFA 37.30 176.03 212.31 192.54 199.02 224.65 183.03 139.55 110.19 - - - - - - ITDP 107.50 300.67 352.53 199.08 227.70 250.13 168.07 132.06 238.18 162.23 193.61 30.47 - - - CME 0.39 0.08 0.13 0.16 0.62 0.32 0.45 0.56 0.32 0.56 0.75 0.14 - - - INPEN 0.14 - - - - - - - - - - - - - - Flour Mill 1.07 - - - 11.89 4.51 8.60 9.49 - - - - - - - Sukhdi 0.91 - 4.45 - - - - - - - - - - - - Sattu - - 0.11 1.04 1.15 106 0.47 0.25 - - - - - - - MDMS - 22.64 20.46 20.71 - 174.59 32.43 30.01 39.17 18.99 14.24 7.86 1.83 1.02 2.68 4.04 ICDS - 0.33 1.12 1.03 0.74 0.08 0.15 0.63 0.96 8.80 7.70 18.36 13.60 3.46 3.61 16.35 Scarcity - 304.11 45.86 - - - - - - - - - - - 70.25 64.45 DNP - - 0.42 3.55 5.57 - - - - - - - - - - FFE - - - - 173.32 - - - - - - - - - - FLR - - - - 0.01 - - - - - - - - - - DDP - - - - - - 38.13 35.20 23.28 12.63 26.45 4.81 - - - DPAP - - - - - - 81.08 141.70 143.27 92.53 138.08 24.02 - - - WFP - - - - - 3.28 4.97 5.84 0.33 1.93 7.37 5.79 2.01 4.42 3.54 1.69 JRY - - - - - - 0.06 28.22 14.97 19.54 10.04 6.07 0.05 - - FFP/FFW - - - - - - - - - 337.68 386.92 58.27 - - 21.35 125.62EAS - - - - - - - - - 0.88 10.75 0.44 0.01 - - CMDMS - - - - - - - - - 12.16 18.04 25.60 - 34.61 33.42 27.16 RPDSMV - - - - - - - - - 3.99 4.68 - - - - SSIE - - - - - - - - - 1.61 2.55 0.13 0.60 0.15 - TPDS APL - - - - - - - - - - - 285.15 295.65 89.61 2.31 15.89 TPDS BPL - - - - - - - - - - - 196.81 224.40 243.19 391.58 372.61APL to BPL - - - - - - - - - - 96.72 141.59 130.05 - (Maleria) - - - - - - - - - - - 1.99 2.66 - 0.12 Earthquake - - - - - - - - - - - - - - 64.56 33.85 Adijati Kanya - - - - - - - - - - 18.13 1.56 (AAY) - - - - - - - - - - - - - - 0.28 44.20 Riot Relief - - - - - - - - - - - - - - - 1.22 Total 601.11 1131.15 1343.04 810.69 989.72 1203.63 955.10 579.62 697.96 712.88 974.28 796.97 709.90 520.16 617.57 708.68Note: PDS = Public Distribution System, RLEGP=Rural Labour Employment Programme, NREP=National Rural Employment Programme, FFA= Food for All,
ITDP=Integrated Tribal Development Project, CME=Closed Mill Employees, INPEN=, MDMS= Mid Day Meal Scheme, ICDS= Intensive Child Development Programme, FFE= Food for Education, DNP=Drought Nutrition Programme, FLR= Flood Relief, DDP, Desert Development Programme, DPAP, Drought Prone Areas Programme, WFP=World Food Programme, JRY=Jawahar Rojgar Yojna, FFP=Food for Poor, EAS=Employment Assurance Scheme, CMDMS=Central Mid Day Meal Scheme, RPDSMV=Revamped PDS through Mobile Vans, SSIE=Special Scheme for Issue to Establishments, TPDS=Targeted PDS, APL=Above Poverty Level, BPL=Below Poverty Level, AAA= Antyodaya Anna Yojna
Source: Compiled from various Socio Economic Review Volumes

38
Table 13A: Handling of Foodgrains by the GSCSC under Various Programmes and Schemes (Percentage to total)
Scheme 1986-87
1987-88
1988-89
1989-90
1990-91
1991-92
1992-93
1993-94
1994-95
1995-96
1996-97
1997-98
1998-99
1999-00
2000-01
2001-02
PDS 60.90 19.43 47.37 44.60 37.08 44.75 42.05 9.67 18.17 5.10 15.72 4.55 - - - - RLEGP 12.04 2.48 1.62 0.92 0.13 - - - - - - - - - - - NREP 2.55 5.71 3.55 1.15 1.21 - - - - - - - - - - - FFA 6.21 15.56 15.81 23.75 20.11 18.66 19.16 24.08 15.79 - - - - - - - ITDP 17.88 26.58 26.25 24.56 23.01 20.78 17.60 22.78 34.13 22.76 19.87 3.82 - - - - CME 0.06 0.01 0.01 0.02 0.06 0.03 0.05 0.10 0.05 0.08 0.08 0.02 - - - - INPEN 0.02 - - - - - - - - - - - - - - - Flour Mill 0.18 - - - 1.20 0.37 0.90 1.64 - - - - - - - - Sukhdi 0.15 - 0.33 - - - - - - - - - - - - - Sattu - - 0.01 0.13 0.12 8.81 0.05 0.04 - - - - - - - - MDMS - 2.00 1.52 2.55 - 14.51 3.40 5.18 5.61 2.66 1.46 0.99 0.26 0.20 0.43 0.57 ICDS - 0.03 0.08 0.13 0.07 0.01 0.02 0.11 0.14 1.23 0.79 2.30 1.92 0.67 0.58 2.31 Scarcity - 26.89 3.41 - - - - - - - - - - - 11.38 9.09 DNP - - 0.03 0.44 0.56 - - - - - - - - - - - FFE - - - - 17.51 - - - - - - - - - - - FLR - - - - - - - - - - - - - - - - DDP - - - - - - 3.99 6.07 3.34 1.77 2.71 0.60 - - - - DPAP - - - - - - 8.49 24.45 20.53 12.98 14.17 3.01 - - - - WFP - - - - - 0.27 0.52 1.01 0.05 0.27 0.76 0.73 0.28 0.85 0.57 0.24 JRY - - - - - - 0.01 4.87 2.14 2.74 1.03 0.76 0.01 - - - FFP/FFW - - - - - - - - - 47.37 39.71 7.31 - - 3.46 17.73 EAS - - - - - - - - - 0.12 1.10 0.06 0.00 - - - CMDMS - - - - - - - - - 1.71 1.85 3.21 - 6.65 5.41 3.83 RPDSMV - - - - - - - - - 0.56 0.48 - - - - - SSIE - - - - - - - - - 0.23 0.26 0.02 0.08 0.03 - - TPDS APL - - - - - - - - - - - 35.78 41.65 17.23 0.37 2.24 TPDS BPL - - - - - - - - - - - 24.69 31.61 46.75 63.41 52.58 APL to BPL - - - - - - - - - - - 12.14 19.95 25.00 - - (Maleria) - - - - - - - - - - - 0.25 0.37 - 0.02 - Earthquake - - - - - - - - - - - - - - 10.45 4.78 Adijati Kanya - - - - - - - - - - - - - - 2.94 0.22 (AAY) - - - - - - - - - - - - - - 0.05 6.24 Riot Relief - - - - - - - - - - - - - - - 0.17 Total 100.00 100.00 100.00 100.00 100.00 100.00 100.00 100.00 100.00 100.00 100.00 100.00 100.00 100.00 100.00 100.00
Source: Computed from Table 13

39
Table 14: Percentage of Persons Purchasing Selected Items from any Source
Item Region All India Gujarat
Rice Rural 57.19 66.48 Urban 82.35 64.20 Wheat Rural 30.20 36.84 Urban 57.73 49.24 Edible Oil Rural 87.19 93.02 Urban 93.72 86.83 Sugar Rural 77.74 95.56 Urban 93.70 97.43
Source: Compiled from Table 6.1 of S.M. Jharwal’s Public Distribution System in India Reassessed, Manak Publications Pvt. Ltd. Delhi 1999.
Table 15: Quantity of Rice Purchased from PDS by All Classes
State/Country Region Purchase in 000 tonnes
% Share to total
purchase
Share of PDS in all purchase
Rural 4360 100.0 16.76 Urban 1850 100.0 19.02
All India
Total 6210 100.0 17.43 Rural 141 3.23 46.53 Urban 36 1.95 26.21
Gujarat
Total 177 2.84 42.39 Source: Compiled from Table 6.4 of S.M. Jharwal’s Public Distribution System in India Reassessed, Manak Publications Pvt. Ltd. Delhi 1999.
Table 16 Quantity of Wheat Purchased from PDS by All Classes
State/Country Region Purchase in 000 tonnes
% Share to total
purchase
Share of PDS in all purchase
Rural 1580 100.0 12.64 Urban 1230 100.0 19.33
All India
Total 2810 100.0 15.57 Rural 172 10.86 37.02 Urban 74 5.98 19.63
Gujarat
Total 246 8.72 31.80 Source: Compiled from Table 6.5 of S.M. Jharwal’s Public Distribution System in India Reassessed, Manak Publications Pvt. Ltd. Delhi 1999.

40
Table 17: Proportion of Poor Purchasers to Total Purchasers of Selected Items from any Source (%)
Country/State Region Rice Wheat Rural 35.33 34.76 Urban 19.49 16.60
All India
Total 30.61 28.21 Rural 34.76 7.28 Urban 16.60 12.15
Gujarat
Total 28.21 9.04 Source: Compiled from Table 6.13 of S.M. Jharwal’s Public Distribution System
in India Reassessed, Manak Publications Pvt. Ltd. Delhi 1999.
Table 18: Proportion of Poor PDS Purchasers to the Poor Purchasing the Selected Items from any Source
Country/State Region Rice Wheat
Rural 40.16 28.79 Urban 46.27 35.00
All India
Total 41.32 30.11 Rural 82.26 76.64 Urban 70.65 45.53
Gujarat
Total 78.58 61.49 Source: Compiled from Table 6.14 of S.M. Jharwal’s Public Distribution System
in India Reassessed, Manak Publications Pvt. Ltd. Delhi 1999.
Table 19: Proportion of PDS Purchase by Poor to Total PDS Purchase of Selected Items
Country/State Region Rice Wheat
Rural 35.71 31.80 Urban 23.19 15.83
All India
Total 32.03 25.47 Rural 15.29 11.16 Urban 19.31 18.22
Gujarat
Total 16.25 12.97 Source: Compiled from Table 6.15 of S.M. Jharwal’s Public Distribution System in India Reassessed, Manak Publications Pvt. Ltd. Delhi 1999.

41
Table 20: Proportion of Quantity Purchased from PDS by Poor to Quantity Purchased from any Source
Country/State Region Rice Wheat
Rural 16.60 11.07 Urban 22.21 14.07
All India
Total 17.46 11.71 Rural 84.30 54.78 Urban 28.76 22.93
Gujarat
Total 63.38 36.52
Source: Compiled from Tables 6.16 and 6.17 of S.M. Jharwal’s Public Distribution System in India Reassessed, Manak Publications Pvt. Ltd. Delhi 1999
Table 21: Share of PDS and Market in the Per Capita Consumption per Annum
(Average 1986-87 to 1989-90)
Country/State Quantity and Share Rice Wheat Total Cereals
Quantity in Kgs.(%) 80.3 58.6 164.1 (84.6)
PDS Share 12.81 16.62 12.20 Market Share 10.62 9.17 3.57
All India
Total Purchase 23.43 25.79 15.77 Quantity in Kgs.(%) 24.0 55.8 135.0
(59.11) PDS Share 32.27 31.73 18.86 Market Share 12.69 31.60 26.43
Gujarat
Total Purchase 44.96 63.33 45.29
Source: Compiled from Table 7.1. of S.M. Jharwal’s Public Distribution System in India Reassessed, Manak Publications Pvt. Ltd. Delhi 1999.
Table 22: Share of PDS and Open Market Purchase in Cereals Consumption
in 1987-88@ and 1989-90@@
Rice Wheat Total Cereals Country/ State
Share in % 1987-88 1989-90 1987-88 1989-90 1987-88 1989-90
PDS 13.90 12.03 17.66 13.87 13.14 10.93 Market 17.47 6.23 9.64 15.84 9.32 0.00*
India
PDS+Market 31.37 18.26 27.30 29.71 22.46 --- PDS 41.47 27.55 36.31 23.17 23.59 14.98 Market 32.15 3.11 50.34 35.58 55.68 17.64
Gujarat
PDS+Market 73.32 30.66 86.65 58.75 79.27 32.62 Note: * This figure is incorrect but this is the figure quoted by Jharwal @ Drought Year; @@ Normal Year Source: Compiled from Table 7.2 of S.M. Jharwal’s Public Distribution System in India
Reassessed, Manak Publications Pvt. Ltd. Delhi 1999

42
References ARCH- Vahini. 1991, “An assessment of Mid Day Meal Programme in Bharuch and
Vadodara Districts.” Mimeo ARCH Mangrol, Rajpipla. Chakraborty M.2000, “Public Distribution System”, in Anveshak, 30(1), January-June
2000, 79-95. Dash H. K. 2003, “The Role and Rhyme of Public Distribution in India,” background paper
for State Level Consultation on Food and Nutritional Security and the Role of Food Assistance Schemes Including Community Food Banks. Held during April 10-11, 2003 at Ahmedabad. M.S. Swaminathan Research Foundation, SEWA, Emergency Food Security Network and United Nations World Food Programme.
Government of India, 2003, Economic Survey 2002-03. Economic Division, Ministry of
Finance and Company Affairs, GoI, New Delhi. Iyengar S. 2000, “Locating and Describing Poverty in Gujarat: An Exploration” Mimeo,
Gujarat Institute of Development Research, Ahmedabad, August 2000. Jharwal S.M. 1999, Public Distribution System in India Reassessed, Manek Publications
Pvt. Ltd. New Delhi. Kabra K.N. and Ittyerah Anil Chandy, 1992, The Public Distribution System in India,
Eastern Books, New Delhi. Lal Deepak, 1998, “Economic Reforms and Poverty Alleviation,” in Isher Judge Ahluwalia
and I.M.D. Little (eds) India’s Economic Reforms and Development: Essays for Manmohan Singh. Oxford University Press, New Delhi, 231-252.
Patel Arun S. 2001, “Agricultural Development in Gujarat-Performance and Future
Strategy”, in Gujarat-2010: Challenges and Opportunities, Seminar Volume, Sardar Patel Institute of Economics and Social Research, Ahmedabad. March.
Parikh Kirit S. 1994, “Who Gets How Much From PDS- How Effectively Does It Reach the
Poor?” in Sarvekshan 17(3) January-March, 1-15. Ramji Rai, 2003, “Grain banks in Tribal Areas of Gujarat”, paper presented in State Level
Consultation on Food and Nutritional Security and the Role of Food Assistance Schemes Including Community Food Banks. Held during April 10-11, 2003 at Ahmedabad. M.S. Swaminathan Research Foundation, SEWA, Emergency Food Security Network and United Nations World Food Programme.
Vepa Swarna, 2003, “Food Security in Gujarat,” paper presented in State Level
Consultation on Food and Nutritional Security and the Role of Food Assistance Schemes Including Community Food Banks. Held during April 10-11, 2003 at Ahmedabad. M.S. Swaminathan Research Foundation, SEWA, Emergency Food Security Network and United Nations World Food Programme.

43
Appendix Table 1
Poverty Indices - Gujarat Number and Percentage of Population Below Poverty Line Gujarat State (Officially Released Estimates)
INDIA GUJARAT Remarks Year
Population
(In lakh) % Population
(in lakh) %
1 2 3 4 5 6 Rural 2442.2 54.1 86.9 43.9 Urban 473.3 41.2 26.6 34
1972-73 Combine 2915.5 51.5 113.5 41.1
Related to the Population As on
1st Oct 72 Rural 2531 51.2 94.6 43.1 Urban 537 38.2 27.5 29.8
1977-78 Combine 3068 48.3 122.1 38.9
Related to the Population As on
1st Mar 78 Rural 2215 40.4 67.7 27.6 Urban 495 28.1 19.9 17.3
1983-84 Combine 2710 37.4 87.6 24.3
Related to the Population As on
1st Mar 84 Rural 1959.7 33.4 56.2 21.2 Urban 417 20.1 17.1 12.9
1987-88 Combine 2376.7 29.9 73.3 18.4
Related to the Population As on
1st Mar 88 Rural 2440.31 37.27 62.18 22.18Urban 763.37 32.36 43.02 27.89
1993-94 Combine 3203.68 35.97 105.20 24.21
Related to the Population As on
1st Mar 94 Source: Department of Rural Development, Government of Gujarat available at www.ruraldev-gujarat.com

44
Appendix Table 2
Percentage of Poor (Households and Population) in Gujarat by Region, Caste/Tribe and by Household Type
Rural Urban
1983 1987-88 1983 1987-88 Characteristics of tHousehold
HHs Pop HHs Pop HHs Pop HHs Pop 1. Region Eastern (Tribal) Northern Plains Eastern Plains Dry Areas Saurashtra Total
56.0 30.2 31.7 41.1 19.7 34.8
61.4 35.7 36.6 46.8 23.5 39.0
41.5 33.2 27.5 54.3 27.4 36.0
49.9 38.2 32.6 59.8 31.6 41.4
28.3 24.9 37.6 40.2 38.5 32.5
39.3 31.3 41.7 51.1 41.5 39.0
38.3 28.5 25.9 48.1 45.2 33.7
39.0 33.2 32.5 53.1 54.8 40.7
2. Caste/Tribe Scheduled Tribes Scheduled Caste Others Total
59.8 41.5 25.8 34.8
65.4 48.8 29.8 39.0
50.6 42.3 30.0 36.0
60.3 50.2 34.4 41.4
62.4 56.3 29.6 33.0
64.2 63.3 37.0 40.3
53.5 51.7 26.0 29.3
60.0 60.4 33.0 36.5
3. Household Type Self employed in Agricultural Self employed in non-Agri. Agricultural LabourOther Labour Other HHs Total
29.6 23.0 49.1 52.3 14.7 34.8
32.7 275 55.1 60.8 17.4 39.0
23.7 21.6 51.9 47.4 14.1 36.0
27.2 27.0 60.3 55.4 17.4 41.4
- 36.7 - - 30.8 32.5
- 41.0 - - 37.8 39.0
- 34.9 24.8 61.1 25.6 33.7
- 39.7 31.0 71.0 32.8 40.2
Note: HHs and Pop denote households and population respectively. Source: Visaria, Pravin. (1995), "Levels of Living in India: Correlates and Determinants", (Mimeo), Ahmedabad: Gujarat Institute of Development Research.