public disclosure authorized a perceived … perceived divideed divide how indonesians perceive...
TRANSCRIPT
A P E R C E I V E D D I V I D EA P E R C E I V E D D I V I D E
H O W I N D O N E S I A N S P E R C E I V E
I N E Q U A L I T Y A N D
W H A T T H E Y W A N T D O N E A B O U T I T
Nove m b e r 2 0 1 5 , Wo rl d B a n k
101664
Pub
lic D
iscl
osur
e A
utho
rized
Pub
lic D
iscl
osur
e A
utho
rized
Pub
lic D
iscl
osur
e A
utho
rized
Pub
lic D
iscl
osur
e A
utho
rized

2 NOVEMBER 2015
A PERCEIVED DIVIDE
The World Bank Office JakartaIndonesia Stock Exchange
Building Tower II/12th Floor
Jl. Jend. Sudirman Kav.
52-53
Jakarta 12910
P (6221) 5299-3000
F (6221) 5299-3111
W www.worldbank.org/id
The World Bank1818 H Street NW
Washington, DC 20433,
USA
T (202) 458-1876
F (202) 522-1557/1560
W www.worldbank.org
A Perceived Divide is a product of the staff of the World Bank. The findings, interpretations, and conclusions expressed herein do not necessarily reflect the views of the Board of Executive Directors of the World Bank or the Government they represent.
The World Bank does not guarantee the accuracy of the data included in this work. The boundaries, colors, denominations, and other information shown on any map in this work do not imply any judgment on the part of the World Bank concerning the legal status of any territory
or the endorsement or acceptance of such boundaries.
For any questions regarding this report, please contact Vivi Alatas ([email protected]) and Matthew Wai-Poi ([email protected]).
PrinTed in
november 2015
2

3 NOVEMBER 2015
A PERCEIVED DIVIDE
A Perceived Divide was prepared by the World Bank’s Poverty Global Practice team in the Jakarta o�ce. The team, led by Vivi Alatas (Lead Economist, GPVDR), provides technical and policy advice based on sound empirical research and analysis to the Government of Indonesia in support of its e�orts to reduce poverty, vulnerability and inequality.
Financial support for this background paper was provided by the Australian Department of Foreign A�airs and Trade (DFAT) through the trust fund for the Partnership for Knowledge-based Poverty Reduction. The trust fund is under the strategic oversight of Bambang Widianto, Executive Secretary of the National Team for the Acceleration of Poverty Reduction (Tim Nasional Percepatan Penanggulangan Kemiskinan, or TNP2K) and Rahma Iryanti of the National Development Planning Agency (Badan Perencanaan Pembangunan Nasional, or Bappenas).
This paper was prepared by Taufik Indrakesuma (Consultant, GPVDR) under the guidance of Edgar Janz (Senior Knowledge Management Specialist, GPVDR) and Matthew Wai-Poi (Senior Economist, GPVDR). This background paper was produced under the overall guidance of Ana Revenga (Senior Director, GPVDR), Carlos Silva-Jaurequi (Lead Economist, GPVDR) and Salman Zaidi (Practice Manager, GPVDR). Strategic guidance was
provided by Rodrigo Chaves (Country Director, EACIF), Ndiame Diop (Lead Economist, GMFDR) and Cristobal Ridao-Cano (Program Leader, EACIF).
The team is grateful for the outstanding work of the Lembaga Survei Indonesia (Indonesian Survey Institute, or LSI) in conducting the inequality perceptions survey. LSI generously provided the data without which this research project would not have been possible. We thank LSI for its permission to use the data and include the full survey instrument as a report annex.
Excellent comments were provided by many individuals, with special thanks to David Gottlieb (Department of Foreign A�airs and Trade, Australian Embassy) and Neil McCulloch (Director, Economic Policy Program, Oxford Policy Management).
The paper was edited by Peter Milne. Layout for this paper was done by Bentuk Team (Andreas Pranoto, Muhammad kamal, Phoebe Wathoel, Randy Kurnia).
Acknowledgements
4 NOVEMBER 2015
A PERCEIVED DIVIDE
0 3 AC K N O W L E D G E M E N T S
0 4 TA B L E O F C O N T E N T S
0 5 L I S T O F AC R O N Y M S , A B B R E V I AT I O N S , A N D I N D O N E S I A N T E R M S
0 6 E X E C U T I V E S U M M A R Y
0 8 I . W H Y D O P U B L I C P E R C E P T I O N S O F I N E Q UA L I T Y M AT T E R ?
1 0 I I . D O E S T H E P U B L I C T H I N K T H AT I N D O N E S I A I S U N E Q UA L?
1 2 I I I . W H AT D O P E O P L E T H I N K I S D R I V I N G R I S I N G I N E Q UA L I T Y ?
1 4 I V. H O W M U C H I N E Q UA L I T Y A R E P E O P L E W I L L I N G TO TO L E R AT E ?
1 6 V. W H I C H I N E Q UA L I T Y- R E D U C I N G P O L I C I E S A R E M O S T S U P P O R T E D?
2 0 V I . W H AT D O E S T H I S M E A N F O R I N D O N E S I A?
2 1 R E F E R E N C E S
2 2 A N N E X A . F U L L S U R V E Y I N S T R U M E N T
4 6 A N N E X B . S U R V E Y S A M P L E D E M O G R A P H I C S
4 9 A N N E X C . D E M O G R A P H I C C R O S S -TA B U L AT I O N S
ContentsTable of

5 NOVEMBER 2015
A PERCEIVED DIVIDE
List Of Acronyms, Abbreviations, And Indonesian Terms
TERM DEFINITION
AFC Asian financial crisis
BBC British Broadcasting Corporation
BLT Bantuan langsung tunai (direct cash assistance)
BSM Bantuan siswa miskin (assistance for poor students)
CC Consumer Class
ECC Emerging Consumer Class
Jamkesmas Jaminan kesehatan masyarakat (social health insurance)
LSI Lembaga Survei Indonesia (Indonesia Survey Institute)
PNPM Program Nasional Pemberdayaan Masyarakat (National Community Empowerment Program)
Raskin Beras untuk rumah tangga miskin (Rice for poor households)
RPJMN Rencana Pembangunan Jangka Menengah Nasional (National Medium Term Development Plan)
SD Sekolah Dasar (primary school)
SMA Sekolah Menengah Atas (senior secondary school)
SME small- and medium-sized enterprises
SMP Sekolah Menengah Pertama ( junior secondary school)
Susenas Survei Sosial Ekonomi Nasional (National Socio-Economic Survey)
UU Desa Village law of 2014

A PERCEIVED DIVIDE
6
I n e qua l I t y I n I n d on e s I a I s r I s I n g a n d a r e c e n t s u r v e y s ug ge s t s t h at I n d on e s I a n s a r e gr ow I n g I n c r e a s I n gly c on c e r n e d. The Gini coefficient in Indonesia has increased sharply over the past 15 years, increasing from 30 in 2000 to 41 in 2013. In a 2014 survey on public perceptions of inequality, most Indonesians consider income distribution in Indonesia to be “very unequal” or “not equal at all.” In addition, half of all respondents feel that Indonesia has become “more unequal” or “much more unequal” over the past five years.
t h e t ru e e x t e n t of h Igh I n e qua l I t y, how e v e r , I s wor s e t h a n mo s t pe opl e r e a l I z e . Respondents believe that the ideal income distribution is one where the top 20 percent of the population earn as much as the bottom 40 percent. Not with standing this ideal, respondents estimate that the actual income distribution has the top 20 percent earning as much as the bottom 60 percent. However, the 2014 National Socio-economic Survey (Susenas 2014) suggests that the richest 20 percent actually earn as much as the rest of the population combined. Furthermore, because household surveys typically do not capture the incomes of the richest Indonesians, the real level of inequality in Indonesia is probably even higher.
A PerCeived divide Executive Summary
executiveSummary
NOVEMBER 2015

A PERCEIVED DIVIDE
pe opl e c or r e c t ly pe r c e I v e I n e qua l I t y I n I n d on e s I a a s a pr obl e m of t h e r Ic h ge t t I n g r Ic h e r , w h I l e t h e p o or a r e be I n g l e f t be h I n d. Over 80 percent of respondents believe that the incomes of the richest quintile have grown “higher” or “much higher.” In contrast, only 25 percent of respondents believe that the incomes of the poorest have grown, while the rest think that poor people have either stagnated or become poorer in the past five years. This is consistent with the actual distribution of consumption growth in Indonesia, where between 2003 and 2010, the richest income deciles experienced seven times the growth of the poorest deciles.
pe opl e ov e rw h e l m I n gly be l I e v e t h at u r ge n t ac t Ion I s n e e de d t o a ddr e s s I n e qua l I t y. Nearly 88 percent of respondents believe that it is “urgent” or “very urgent” for the Government to address the current level of inequality. In addition, 61 percent of respondents are willing to accept lower economic growth in exchange for lower inequality. This suggests that Indonesians would support the Government’s expressed intention of reducing inequality, whereby the current Medium Term Development Plan target aims to reduce the Gini coefficient from 41 to 36 by 2019.
t h e r e I s s t r on g p u bl Ic s u pp ort f or s o c I a l pr o t e c t Ion p ol Ic I e s t h at pr ov I de dI r e c t a s s I s ta n c e t o t h e p o or a n d n e a r-p o or . When asked about the main causes of poverty, 57 percent of respondents cite external reasons that are beyond an individual’s control, such as coming from a poor family (22 percent) or having bad luck (16 percent). So, when the perceptions survey asked respondents to identify top priorities to address inequality, nearly half of all respondents support social protection programs as a key policy measure.
I n d on e s I a n s a l s o s t r on gly s u pp ort p ol Ic I e s t h at r e duc e I n e qua l I t y b y c r e at I n g be t t e r wor k opp ort u n I t I e s f or pe opl e t o I m pr ov e t h e I r I n c om e s . While 57 percent of respondents believe that external factors play a significant part in poverty, 52 percent of respondents believe that it is easy for people to pull themselves out of poverty if they work hard enough, with another 41 percent saying that while this is difficult it is still doable. Thus, 48 percent of respondents consider job creation policies a top priority, while complementary policies such as credits for small -sized and medium-sized enterprises and improving the qual i t y of educat ion are also suppor ted.
e r a dIc at I n g c or ru p t Ion I s a l s o c I t e d a s a t op pr Ior I t y f or I n e qua l I t y r e duc t Ion . Respondents feel strongly that there is a need to achieve a more meritocratic state where competition for wealth is fair and income is gained only through hard work. Thus, eradicating corruption is prioritized by 37 percent of respondents.
p op u l a r p ol Ic y r e s p on s e s t o I n e qua l I t y r e s on at e c l o s e ly w I t h f I n dI n g s f r om r e c e n t r e s e a r c h f I n dI n g s . A World Bank flagship report on inequality in Indonesia identifies four main policy response areas.1 First, public service delivery improvements are needed to provide an equal start in health and education for all children. Second, the poor need access to more and better jobs in order to address inequality in the labor market. Third, unequal accumulation of wealth through financial assets can be addressed through tax reforms and eradicating corruption. Finally, measures should be put in place to help all people, but especially the poor and vulnerable, mitigate and cope with shocks.
t h I s s u r v e y de mon s t r at e s t h at t h e r e I s a c l e a r opp ort u n I t y t o p u r s u e p ol Ic I e s t h at a r e b o t h t e c h n Ic a l ly s ou n d a n d br oa dly s u pp ort e d. The sur vey shows that there is a mandate for ac t ion f rom a major i t y of Indonesians who fee l that inequal i t y i s too h igh and is an urgent prob lem. There is a lso broad publ ic suppor t for many po l ic y ac t ions that are l ike ly to have the larges t pos i t i ve impac t s on inequal i t y reduc t ion .
1 See Indonesia’s Rising Divide: Why inequality is rising, why it matters and what can be done (World Bank, 2015a).
7
A PerCeived divide Executive Summary
NOVEMBER 2015

8 NOVEMBER 2015
A PERCEIVED DIVIDE
CHAPTER 1
MATTER?
WHY DO PUBLIC PERCEPTIONSOF INEQUALITY
I N E QUA L I T Y I N I N D ON E S I A H A S R I S E N S H A R PLY I N R E C E N T Y E A R S . Inequality during the Suharto era remained stable even through periods of high economic growth, only increasing slightly in the mid-1990s. During the 1997/98 Asian fi nancial crisis, inequality fell because the better o� were a� ected more heavily by the economic shocks of the crisis and were also the slowest segment of the population to recover. After recovering from the crisis, however, Indonesia’s inequality has risen steadily from a Gini coe� cient of 30 in 2000 up to 41 in 2013 (Figure 1).2
T H I S GR OW I N G G A P BE T W E E N R IC H A N D P O OR I S BE I N G DR I V E N B Y F OU R FAC T OR S .First, there
Although inequality has risen in Indonesia over the past decade, public concern towards the issue of inequality has been low historically. But with the current government setting targets to reduce inequality, and the media and politicians paying more attention to the issue, public perceptions may be shifting. This study examines public perceptions towards inequality using recent data to help us understand how the public perceives the issue and if there is general support for a public policy response.
is an inequality of opportunity, which means that not everyone develops the skills they need to fi nd well-paying jobs. Second, with an increasing emphasis on skills in the modern economy, the rewards for those who do fi nd good quality jobs are increasing, which is driving up wage inequality. At the same time, those without higher skills are getting trapped in poorly paid informal and low productivity jobs. Third, there are inequalities in the access to income from fi nancial assets that also drive inequality up. Fourth, shocks can a� ect inequality at any stage of the framework by eroding a household’s ability to earn an income, save, and invest in health and education.3
2 The Gini coe� cient is a measure of inequality, where 0 is complete equality (i.e., all people have the same income or consumption) and 100 is complete inequality (all the income or consumption is controlled by one person).3 An in-depth analysis of the causes and consequences of rising inequality in Indonesia can be found in the World Bank (2015a) report Indonesia’s Rising Divide: Why inequality is rising, why it matters and what can be done.
1.
45
40
35
30
25
20
1980 1981 1984 1987 1990 1992 1993 1994 1995 1996 1997 1998 1999 2000 2001 2002 2003 2004 2005 2006 2007 2008 2009 2010 2011 2012
ASIAN FINANCIALCRISIS
POST-CRISISRECOVERY
Inequality has steadily risen since Indonesia recovered from the Asian fi nancial crisis (percent) (fi g.1)
SOURCE Susenas, World Bank sta� calculations

9 NOVEMBER 2015
A PERCEIVED DIVIDE
T H E P U BL IC S HOW E D L I T T L E C ON C E R N A B OU T R I S I N G I N E QUA L I T Y DU R I N G T H E DE C A DE F OL L OW I NG T H E A S I A N F I N A N C I A L C R I S I S . Public pressure to reduce inequality has been low historically. When Indonesians were asked about income inequality in the past, a majority reported feeling that current inequality was either about right, or they were in favor of even higher inequality as an incentive for people to work harder (Figure 2). In the past, few people believed that there should be e� orts to make income levels in Indonesia more equal.
I N T H E M E A N T I M E , C ON C E R N S A B OU T I N E QUA L I T Y, B O T H N AT ION A L LY A N D GL OB A L LY, H AV E I N C R E A S E D. Inequality was a key issue in the run-up to the July 2014 Indonesian presidential elections, with major national and international media outlets reporting on rising inequality and both presidential candidates making public statements about their explicit strategies to reduce inequality during televised presidential debates. For example, an article on Indonesia’s elections (BBC, June 15, 2014) reported that President Joko Widodo’s campaign promise of a “maritime highway” was justifi ed as a way of reducing Indonesia’s east-west inequality.5 This recent rise to national prominence of inequality as an issue also coincides with increasing global attention towards income inequality, with books such as Thomas Piketty’s “Capital in the Twenty-First Century” shaping the international discourse.
W H I L E T H E G OV E R N M E N T I S BE GI N N I N G T O TA K E AC T ION T O A DDR E S S I N E QUA L I T Y, T H E S UC C E S S OF I T S S T R AT E G Y W I L L DE PE N D PA RT LY ON P U BL IC S U PP ORT. The new administration has, for the fi rst time, included inequality reduction as one of its national targets in the National Medium-Term Development Plan (Rencana Pembangunan Jangka Menengah Nasional, or RPJMN), with a target Gini coe� cient of 36 by 2019. Designing the right strategy to achieve this depends on correctly diagnosing the
root causes of the problem and identifying appropriate policy responses. Successful implementation of this strategy, however, also depends on how much support the Government can garner from other stakeholders, including parliament, political parties, and the general public. Therefore, it matters whether the public thinks that tackling inequality is a national priority and, if so, what policies they would support to reduce inequality.
T H I S PA PE R E X A M I N E S C U R R E N T PE R C E P T ION S OF T H E I N D ON E S I A N P U BL IC T OWA R D S I N E QUA L I T Y. Have public perceptions on this topic changed, particularly given the recent rise in inequality? The aim of this paper is to answer this question using the most recent data available. In 2014, Lembaga Survei Indonesia (Indonesian Survey Institute, or LSI, an independent and non-partisan public opinion research institute) conducted a survey to gauge perceptions towards inequality and inequality-reducing policies. LSI surveyed 3,080 individuals across 33 provinces in Indonesia, using a questionnaire that included over 70 questions.6 The survey sample was designed to be nationally representative, with a demographic composition—gender, provinces, urban-rural, religions, and ethnicity—to refl ect the adult Indonesian population (over 17 years of age) based on the 2010 Census.7
T H E R IC H N E S S OF T H E PE R C E P T ION S S U R V E Y PR OV I DE S U S W I T H A C L E A R E R U N DE R S TA N DI N G OF HOW PE OPL E C U R R E N T LY T H I N K A B OU T I N E QUA L I T Y. The paper is structured around four main questions about the perceptions of Indonesians concerning inequality. Section 2 looks at whether the public thinks that Indonesia is unequal. Section 3 examines what people think are the drivers of rising inequality. Section 4 asks how much tolerance people have towards inequality. Section 5 considers what types of inequality-reducing policies have the most public support, while Section 6 concludes.
4 The World Values Survey studies “changing values and their impact on social and political life,” conducted since 1981 in almost 100 countries. Indonesia was included in the survey for Waves 4 (in 2001) and 5 (in 2006).5 This statement was made during the June 15, 2014 presidential debate on economic development and social welfare.6 The full survey instrument is included in Annex A.7 A full demographic breakdown of the survey sample is provided in Annex B.
1999 - 2004 2005 - 2009
INCOMES SHOULD BE MADE MORE EQUAL
WE NEED LARGER INCOME DIFFERENCES AS INCENTIVES
2 3 4 5 6 7 8 9
Previous opinion surveys found that few Indonesians believed incomes should be more equal (fi g.2)
SOURCE World Values Survey4 (2001); World Values Survey (2006)Beliefs on income inequality in Indonesia (percent)
30
25
20
15
10
5
0
CHAPTER 1

10 NOVEMBER 2015
A PERCEIVED DIVIDE
DOES THE PUBLIC THINK THAT
A L A R GE M A JOR I T Y BE L I E V E S T H AT I N D ON E S I A’ S I N C OM E DI S T R I BU T ION I S U N E QUA L . The survey asked respondents to choose whether income distribution in Indonesia is “very equal,” “quite equal,” “quite unequal” or “not equal at all”. About 92 percent of respondents feel
Indonesians agree that inequality in Indonesia is both high and increasing, although actual levels of inequality appear to be even higher than those generally perceived. Most agree that the richest half of the population has become richer, while the poorest half of the population has fallen behind.
8 A full list of demographic cross-tabulations for all responses can be found in Annex C.
CHAPTER 2
INDONESIA IS UNEQUAL?
SOURCE LSI Perceptions Survey, 2014
VERY EQUAL
QUITE EQUAL
QUITE UNEQUAL
NOT EQUAL AT ALL
A vast majority agrees that income distribution is unequal (fig.3)
How equally is income distributed in Indonesia ?
0% 10% 20% 30% 40% 50% 60% 70% 80% 90% 100%
that Indonesia is either “quite unequal” or “not equal at all” (Figure 3). Responses are consistent across all groups of people, regardless of gender, income, education, age, or location (e.g., urban or rural domicile).8
1 6 51 40.6
2.

11 NOVEMBER 2015
A PERCEIVED DIVIDE
T H E AC T UA L L E V E L OF I N E QUA L I T Y, HOW E V E R , I S FA R H IGH E R T H A N MO S T R E S P ON DE N T S BE L I E V E .Survey respondents were asked to estimate Indonesia’s income distribution.9 Their average estimate had the richest quintile (i.e., the wealthiest 20 percent of people) earning 38 percent of all income, roughly equal to what respondents believe the bottom 60 percent earns (Figure 4). Although this distribution is perceived as being highly unequal, it is equivalent to a Gini coe� cient of 30, which is a relatively low Gini compared with other countries in the region. It is also equal to the lowest Gini coe� cient Indonesia has had since the Asian fi nancial crisis in 1997-1998. But despite these perceptions, the reality is that Indonesia’s inequality is far higher. As of 2014, Indonesia had a Gini coe� cient of 41—as measured by the national socio-economic survey (Survei Sosial Ekonomi Nasional, or Susenas)—with the richest 20 percent accounting for half of Indonesia’s consumption.10
H A L F OF T H E R E S P ON DE N T S A L S O F E E L T H AT I N E QUA L I T Y H A S BE E N GE T T I NG WOR S E R E C E N T LY. Between 2009 and 2014, the Gini coe� cient in Indonesia increased from 37 to 41. A slim majority of respondents (51 percent) agrees that income distribution in Indonesia has become “more unequal” or “much more unequal” over the past fi ve years (Figure 5). Another 31 percent of respondents believe that there has been no change in the level of inequality and 18 percent believe that income distribution in Indonesia has actually become more equal.
SOURCE World Values Survey (2001); World Values Survey (2006))
CHAPTER 2
50
40
30
20
10
0
MUCH MORE EQUAL MUCH MORE UNEQUALMUCH EQUAL NO CHANGE MORE EQUAL
Previous opinion surveys found that few Indonesians believed incomes should be more equal (fi g.5)
How has the income distribution in Indonesia changed in the last fi ve years ?
SOURCE LSI Perceptions Survey, 2014; Susenas 2014
Income inequality in Indonesia is higher than people think (fi g.4)
Share of national income
POOREST QUINTILE
RICHEST QUINTILE
2 3 4
PERCEIVED DISTRIBUTION SUSENAS DISTRIBUTION
38
49
25
20
1814
1012
9 The survey asked respondents to create an income distribution by dividing 50 coins among fi ve income quintiles. See Annex A, Questions V_10 and V_11 for the full survey question.10 Susenas only asks about household consumption, not income. In fact, income inequality is always higher than consumption inequality because richer households do not spend all of their income, but save some instead. Previous estimates put Indonesia’s income Gini 6.4 points higher than its consumption Gini (World Bank, 2015). So, a consumption Gini of 41 implies an income Gini of around 47. Moreover, it is believed that many richer households are not measured by Susenas, suggesting that actual inequality may be even higher. Current World Bank research is using credit data to estimate a more accurate number of wealthier Indonesians (World Bank; forthcoming).
1.82
16.1
31.36
40.07
10.63
12 NOVEMBER 2015
A PERCEIVED DIVIDE
People agree that the rich groups have become richer, but are divided over how the poor are doing (fig.6)
WHAT DOPEOPLE THINK IS
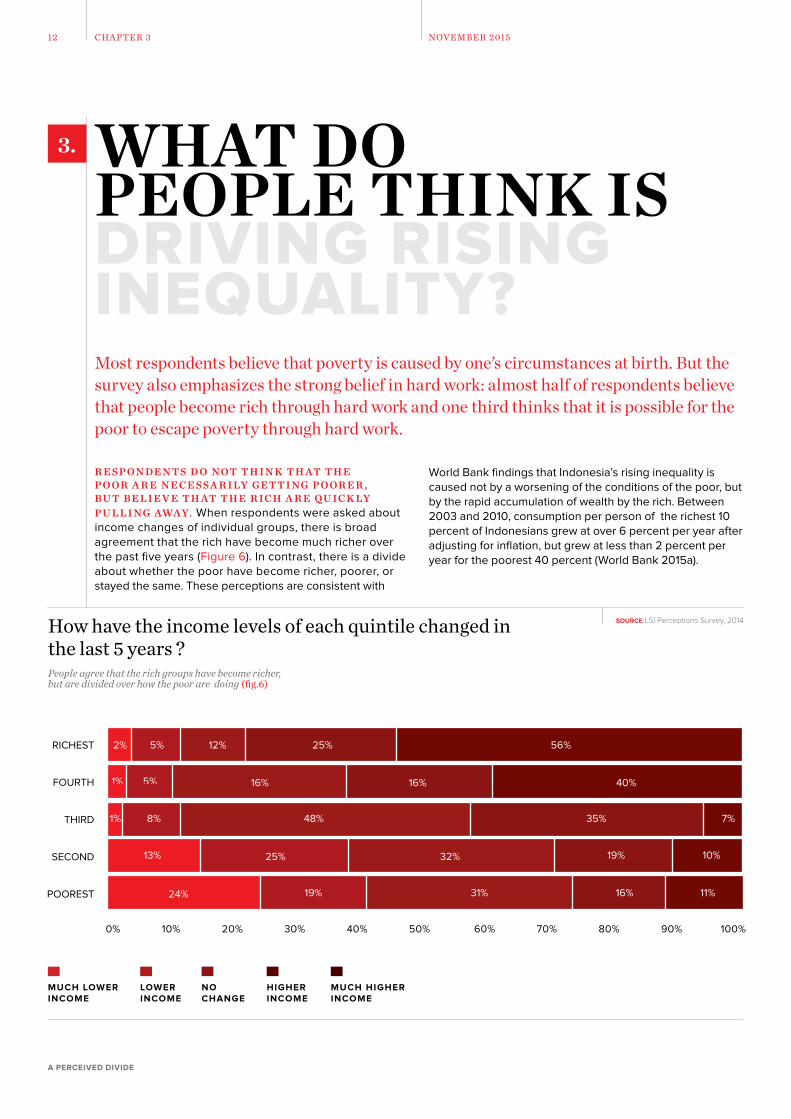
R E S P ON DE N T S D O N O T T H I N K T H AT T H E P O OR A R E N E C E S S A R I LY GE T T I N G P O OR E R , BU T BE L I E V E T H AT T H E R IC H A R E QU IC K LY P U L L I N G AWAY. When respondents were asked about income changes of individual groups, there is broad agreement that the rich have become much richer over the past five years (Figure 6). In contrast, there is a divide about whether the poor have become richer, poorer, or stayed the same. These perceptions are consistent with
Most respondents believe that poverty is caused by one’s circumstances at birth. But the survey also emphasizes the strong belief in hard work: almost half of respondents believe that people become rich through hard work and one third thinks that it is possible for the poor to escape poverty through hard work.
SOURCE LSI Perceptions Survey, 2014How have the income levels of each quintile changed in the last 5 years ?
3.
RICHEST
FOURTH
THIRD
SECOND
POOREST
MUCH LOWERINCOME
MUCH HIGHERINCOME
LOWERINCOME
NOCHANGE
HIGHERINCOME
CHAPTER 3
DRIVING RISINGINEQUALITY?
World Bank findings that Indonesia’s rising inequality is caused not by a worsening of the conditions of the poor, but by the rapid accumulation of wealth by the rich. Between 2003 and 2010, consumption per person of the richest 10 percent of Indonesians grew at over 6 percent per year after adjusting for inflation, but grew at less than 2 percent per year for the poorest 40 percent (World Bank 2015a).
0% 10% 20% 30% 40% 50% 60% 70% 80% 90% 100%
2% 5% 12% 25% 56%
1% 5% 16% 16% 40%
7%35%48%8%1%
13% 25% 32% 19% 10%
24% 19% 31% 16% 11%

13 NOVEMBER 2015
A PERCEIVED DIVIDE
I N D ON E S I A N S A R E DI V I DE D ON W H E T H E R W E A LT H I S G A I N E D T H R OUGH H A R D WOR K OR T H R OUGH C I R C U M S TA NC E S AT BI RT H A N D I N H E R I T E D OPP ORT U N I T I E S . Respondents were asked to choose the most influential determinant of wealth from a number of internal factors such as talent and hard work, and external factors such as family upbringing or good fortune. Respondents are nearly equally divided on the role of internal and external factors: 45 percent believe that external factors, such as family background, connections and luck, play the most important role (Figure 7), while 46 percent perceive hard work to be the dominant factor. Only 9 percent believe that wealth acquisition by today’s rich has been primarily through corruption.
MO S T, HOW E V E R , BE L I E V E T H AT P OV E RT Y I S DE T E R M I N E D B Y C I R C U M S TA NC E S BE YON D A N I N DI V I DUA L’ S C ON T R OL . Respondents were also asked to choose the most influential determinant of poverty out of a number of internal and external factors
11 For a discussion on inequality of opportunities, see Indonesia’s Rising Divide (World Bank, 2015a) and An Unfair Start: How unequal opportunities affect Indonesia’s Children (World Bank, 2015b)
Most people believe that poverty is determined by circumstances beyond an individual’s control (fig.8)
What is the most important factor that led the current poor to become poor ?
CHAPTER 3
60
50
40
30
20
10
0
INTERNAL EXTERNAL
Hard work is the primary determinant of wealth, but external factors also play a role (fig.7)
What is the most important factor that led the current rich to become rich ?
SOURCE LSI Perceptions Survey, 2014 SOURCE LSI Perceptions Survey, 2014
INTERNAL EXTERNAL CORRUPTION
50
40
30
20
10
0
(Figure 8). Hard work is once again cited as the single most important factor that influences wealth and poverty, but external factors when considered altogether are seen as more influential in causing poverty. These perceptions are consistent with World Bank research findings that inequality of opportunity from birth can explain a substantial amount of income inequality in later life. One third of all consumption inequality in Indonesia is due to a small number of factors that are outside an individual’s control, a level that is persistently high.11
N ON E T H E L E S S , I T I S PE R C E I V E D T H AT PE OPL E C A N OV E R C OM E T H E I R N E G AT I V E C I R C U M S TA NC E S T H R OUGH H A R D WOR K A N D P U L L T H E M S E LV E S OU T OF P OV E RT Y. A slim majority (52 percent of respondents) believes that it is easy for people to improve their economic status through hard work. Although a small fraction (7 percent) thinks that it is nearly impossible for people to improve their situation through hard work, the remaining respondents (41 percent) think that while this is di�cult it is still doable.
9
11
6
2
1
16
NO USEFULL TALENTS
BAD LUCK
UNEDUCATED FAMILY
UNSUPPORTIVE ENVIRONMENT
PHYSICAL DISABILITY
ILLNESS
41
5
23
11
5
5
2
9CORRUPTION
TALENT
HARD WORK
GOOD LUCK
RICH FAMILY
CONECTIONS
EDUCATED FAMILY
SUPPORTIVE ENVIRONMENT
3422NO HARD WORK
FROM POOR FAMILY

14 NOVEMBER 2015
A PERCEIVED DIVIDE
HOW MUCH INEQUALITY ARE PEOPLE WILLING TO
Most Indonesians believe that inequality is sometimes acceptable. However, all respondents agree that inequality in Indonesia should be lower than it currently is. Richer and better-educated respondents tend to tolerate more inequality, while women, youth, and rural respondents tend to tolerate less.
MO S T I N D ON E S I A N S A R E W I L L I N G T O AC C E P T S OM E DE GR E E OF I N E QUA L I T Y I F PE OPL E BE C OM E R IC H T H R OUGH H A R D WOR K A N D FA I R M E A N S , A N D I F T H E P O OR C ON T I N U E T O BE P U L L E D OU T OF P OV E RT Y. When asked whether inequality is ever acceptable, only 26 percent answer “inequality is never acceptable,” while 74 percent
RESPONSE OPTION %
Prices of basic needs are a�ordable for all 25
The poverty rate drops 19
The nation as a whole experiences progress 18
If people get rich from hard work or poor from laziness 20
Competition for wealth is fair 17
OTHER RESPONSES 1
4.
CHAPTER 4
T A B L E 1
What is the number one factor that would make inequality acceptable?Inequality is acceptable if the poor are protected and if wealth acquisition is fair
TOLERATE?
respond that “inequality is sometimes acceptable.” There are two major conditions cited for finding some inequality acceptable: that wealth acquisition is fair and meritocratic, and that those at the bottom of the pyramid are benefiting through a�ordable food prices and low poverty rates (Table 1).
SOURCE LSI Perceptions Survey, 2014. Note: Similar responses are grouped by color. Blue represents “protection of the poor” and red represents “fairness in wealth acquisition.”
15 NOVEMBER 2015
A PERCEIVED DIVIDE
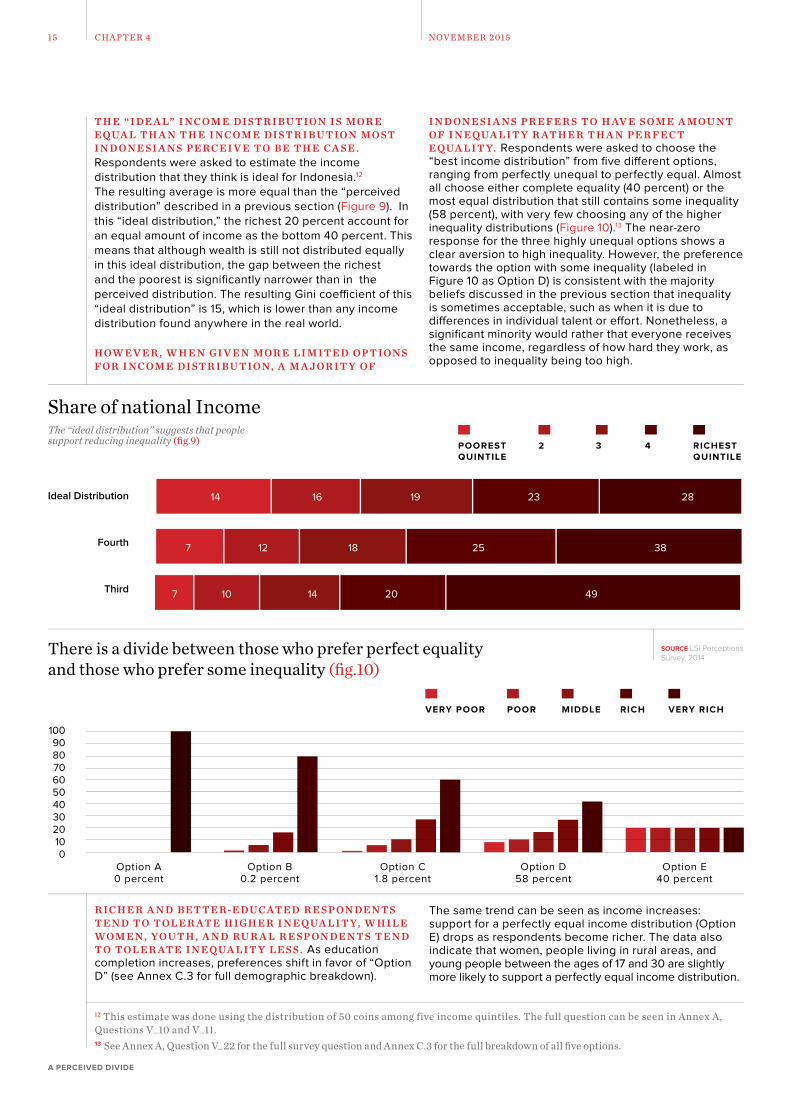
T H E “ I DE A L” I N C OM E DI S T R I BU T ION I S MOR E E QUA L T H A N T H E I N C OM E DI S T R I BU T ION MO S T I N D ON E S I A N S PE R C E I V E T O BE T H E C A S E .Respondents were asked to estimate the income distribution that they think is ideal for Indonesia.12 The resulting average is more equal than the “perceived distribution” described in a previous section (Figure 9). In this “ideal distribution,” the richest 20 percent account for an equal amount of income as the bottom 40 percent. This means that although wealth is still not distributed equally in this ideal distribution, the gap between the richest and the poorest is signifi cantly narrower than in the perceived distribution. The resulting Gini coe� cient of this “ideal distribution” is 15, which is lower than any income distribution found anywhere in the real world.
HOW E V E R , W H E N GI V E N MOR E L I M I T E D OP T ION S F OR I N C OM E DI S T R I BU T ION , A M A JOR I T Y OF
SOURCE LSI Perceptions Survey, 2014
There is a divide between those who prefer perfect equality and those who prefer some inequality (fi g.10)
1009080706050403020100
Option A 0 percent
Option B 0.2 percent
Option C 1.8 percent
Option D 58 percent
Option E 40 percent
VERY POOR VERY RICHPOOR MIDDLE RICH
R IC H E R A N D BE T T E R-E DUC AT E D R E S P ON DE N T S T E N D T O T OL E R AT E H IGH E R I N E QUA L I T Y, W H I L E WOM E N , YOU T H , A N D RU R A L R E S P ON DE N T S T E N D T O T OL E R AT E I N E QUA L I T Y L E S S . As education completion increases, preferences shift in favor of “Option D” (see Annex C.3 for full demographic breakdown).
The same trend can be seen as income increases: support for a perfectly equal income distribution (Option E) drops as respondents become richer. The data also indicate that women, people living in rural areas, and young people between the ages of 17 and 30 are slightly more likely to support a perfectly equal income distribution.
CHAPTER 4
I N D ON E S I A N S PR E F E R S T O H AV E S OM E A MOU N T OF I N E QUA L I T Y R AT H E R T H A N PE R F E C T E QUA L I T Y. Respondents were asked to choose the “best income distribution” from fi ve di� erent options, ranging from perfectly unequal to perfectly equal. Almost all choose either complete equality (40 percent) or the most equal distribution that still contains some inequality (58 percent), with very few choosing any of the higher inequality distributions (Figure 10).13 The near-zero response for the three highly unequal options shows a clear aversion to high inequality. However, the preference towards the option with some inequality (labeled in Figure 10 as Option D) is consistent with the majority beliefs discussed in the previous section that inequality is sometimes acceptable, such as when it is due to di� erences in individual talent or e� ort. Nonetheless, a signifi cant minority would rather that everyone receives the same income, regardless of how hard they work, as opposed to inequality being too high.
12 This estimate was done using the distribution of 50 coins among five income quintiles. The full question can be seen in Annex A, Questions V_10 and V_11. 13 See Annex A, Question V_22 for the full survey question and Annex C.3 for the full breakdown of all fi ve options.
The “ideal distribution” suggests that people support reducing inequality (fi g.9)
Share of national Income
POOREST QUINTILE
RICHEST QUINTILE
2 3 4
Ideal Distribution
Fourth
Third
16
12
10
19
18
14
23
25
20
28
38
49
14
7
7

16 NOVEMBER 2015
A PERCEIVED DIVIDE
WHICH INEQUALITY-REDUCING POLICIES ARE MOST SUPPORTED?Overall, Indonesians believe that inequality reduction is an urgent priority. Consistent with beliefs on the drivers of inequality, policy support is strongest for: programs that provide assistance to households that are poor or vulnerable to poverty and protect them from shocks; policies and programs that provide better work opportunities; and e�orts to eradicate corruption.
5.
MO S T I N D ON E S I A N S A R E C ON C E R N E D W I T H R E DUC I N G I N E QUA L I T Y A N D BE L I E V E I T S HOU L D BE A N U R GE N T PR IOR I T Y OF T H E G OV E R N M E N T. When asked about whether it is urgent for the Government to reduce inequality, 88 percent of respondents consider it either “urgent” or “very urgent” (Figure 11). This attitude towards inequality suggests that inequality reduction is one of the key lenses through which the public assesses government policy.
I N A DDI T ION , A M A JOR I T Y OF I N D ON E S I A N S I S A L S O W I L L I N G T O AC C E P T T H E T R A DE - OF F OF S L OW E R GR OW T H OF I N C OM E S I N E XC H A NGE
F OR R E DUC E D I N E QUA L I T Y. People often perceive that there is a trade-o� between policies that promote growth and those that promote equity. However, recent research by Dabla-Norris, et al. (2015) suggests that redistributing income to the poorest groups can actually accelerate economic growth. When confronted with this hypothetical trade-o� and asked to choose between “incomes of poor people grow quickly, but inequality is high” and “incomes of poor people grow slowly, but inequality is low,” 61 percent of respondents choose the latter scenario. Thus, although a significant number of people choose to prioritize rapid income growth, the majority opts for equity.
How urgent is it for the goverment to reduce inequality?The vast majority of Indonesians thinks that inequality reduction is an urgent priority (fig.11)
SOURCE LSI Perceptions Survey, 2014
NOT URGENTAT ALL
NOT VERY URGENT
QUITEURGENT
VERY URGENT
0% 10% 20% 30% 40% 50% 60% 70% 80% 90% 100%
CHAPTER 5
3 10 41 47

17 NOVEMBER 2015
A PERCEIVED DIVIDE
T H E MO S T P OP U L A R P OL IC I E S T O R E DUC E I N E QUA L I T Y FA L L I N T O T H R E E M A I N GR OU P S : PR OV I DI N G S O C I A L PR O T E C T ION F R OM S HO C K S A N D C I R C U M S TA NC E ; PR OV I DI N G BE T T E R WOR K OPP ORT U N I T I E S ; A N D E R A DIC AT I N G C OR RU P T ION . The most-supported policies were social protection programs, job creation, eradicating corruption, free education, credit for small- and medium-sized enterprises (SMEs), and free health care (Table 2). Social protection programs and free health are ways to protect people from shocks and negative circumstances. Job creation, credit for SMEs, and free education are all ways to provide opportunities for people to work hard and earn a higher income. Finally, the high prioritization of eradicating corruption is consistent with the demand for fair wealth acquisition.
POLICY Top 3 priorities?
Social protection programs14 49%
Creating more jobs 48%
Eradicating corruption 37%
Free education for all 30%
SME credit 27%
Free healthcare for all 17%
Increasing the minimum wage 17%
Infrastructure improvements (roads, power, etc.) 14%
More subsidies (e.g., for agriculture, fuel, etc.) 14%
Improving schools 10%
Grants to village level, e.g. National Program for Community Empowerment (Program Nasional Pemberdayaan Masyarakat, PNPM)15
7%
Loans for the poor (not business loans) 7%
Increasing the tax on the rich 2%
Unemployment insurance 2%
Equitable asset ownership (e.g., for land, forests, mines, etc.) 2%
T A B L E 2
What are the three most important policies for reducing inequality?
SOURCE LSI Perceptions Survey, 2014
Providing opportunities for hard work, protecting people from shocks, and eradicating corruption are seen as top priorities for reducing inequality
14 The survey gave examples of subsidized rice (Beras untuk Rumah Tangga Miskin, Raskin), unconditional cash transfers (bantuan langsung tunai, BLT), financial aid for poor students (bantuan siswa miskin, BSM), health insurance ( jaminan kesehatan masyarakat, Jamkesmas).15 The Rural PNPM program was phased out in 2015 as part of the implementation of the 2014 Village Law (UU Desa).16 The World Bank publication Protecting Poor and Vulnerable Households in Indonesia (2012) provides more details on Indonesia’s social assistance programs.17 Methodology for income groups (poor, vulnerable, emerging consumer class, consumer class) is explained in Annex B.
F I R S T A N D F OR E MO S T, PE OPL E S U PP ORT S O C I A L PR O T E C T ION PR O GR A M S A S A WAY OF DI R E C T LY H E L PI N G T H E P O OR A N D V U L N E R A BL E . “Social protection programs”—including both social assistance programs16 such as subsidized rice distribution, financial assistance for poor students, and cash transfer programs, as well as social insurance programs—rank as the top response for most demographic groups. These programs fulfill a dual function of protecting households from shocks that can throw them into poverty, and assisting the poor and vulnerable to improve their circumstances. As respondents become richer and better educated, so their support for social protection declines slightly in favor of eradicating corruption and creating more jobs (Figure 12).17 However, social protection is still supported by at least one third of respondents from every category. Although the rich and better educated are less likely to need or benefit from social protection programs, they still provide significant support for such programs.
CHAPTER 5

18 NOVEMBER 2015
A PERCEIVED DIVIDE
NOTE Poor = below poverty line; Vulnerable = between 1 and 1.5 * poverty line; Emerging Consumer Class = between 1.5 and 3.5 * poverty line; Consumer class = 3.5 * poverty line and above. Further explanation can be found in Annex B.SOURCE LSI Perceptions Survey, 2014
As income and education increase, support shifts from social protection programs to eradicating corruption and creating more jobs (fi g.12)
POOR TERTIARYNO EDUCATION
VULNERABLE JUNIOR HIGH SCHOOL
EMERGING CONSUMER CLASS
PRIMARY SCHOOL
CONSUMER CLASS
SENIOR HIGH SCHOOL
C ON S I S T E N T W I T H T H E BE L I E F T H AT H A R D WOR K C A N P U L L PE OPL E OU T OF P OV E RT Y A N D DR I V E T H E I R S UC C E S S , I N D ON E S I A N S S U PP ORT P OL IC I E S T O C R E AT E MOR E A N D BE T T E R JOB S . Nearly half of all respondents consider job creation as one of the most important ways of reducing inequality. Support for job creation consistently ranks in the top two policy priorities across all demographics, with stronger support among the wealthier and better educated. However, it is important to note that it is not enough only to create more jobs; in order to reduce inequality the jobs created have to be good quality, formal jobs with decent wages and benefi ts.18 On top of this, these jobs need to be accessible to the poor and vulnerable. To this end, it is notable that public support for the policies that enable the poor to access better jobs, namely free education, credit for SMEs, and infrastructure investments, is also high.
S U PP ORT F OR E R A DIC AT I N G C OR RU P T ION F I T S W I T H T H E S T R ON G R E J E C T ION OF I N E QUA L I T Y T H R OUGH I L L - G O T T E N G A I N S . About 9 percent of respondents believe that corruption is currently the primary determinant of wealth. Responses about the circumstances that make inequality acceptable, however, show the importance of achieving fair competition for wealth (Table 1). Thus, the overall support for eradicating corruption is high, ranking third overall with 37 percent of respondents. Eradicating corruption also features more prominently among respondents in the upper income and better educated levels, which may indicate that the wealthy and better educated are either more likely to see or hear about large-scale corruption, or more likely to be impeded personally by collusive and corrupt economic practices.
18 See World Bank (2015a) Section 2.3 for further discussion on labor market inequality and Section 3.2 for appropriate policy measures.
60%
50%
40%
30%
20%
10%
0
60%
50%
40%
30%
20%
10%
0
Social protection programs (raskin, BLT, BSM, health Insurance, etc.)
Social protection programs
Eradicating corruption
Eradicating corruption
More Jobs More Jobs
CHAPTER 5
19 NOVEMBER 2015
A PERCEIVED DIVIDE
S OM E G OV E R N M E N T I N I T I AT I V E S M AY R E C E I V E MOR E S U PP ORT I F T H E Y A R E S E E N A S C ON T R I BU T I N G T O T H E R E DUC T ION OF I N E QUA L I T Y. There are a number of policies that the current administration is trying to push forward, but that are not prioritized by the responses of this survey. Key examples include the new Village Law, infrastructure development, and increasing tax revenue. The implication of these fi ndings is that such policies may receive greater public support if they are linked to social protection programs or funding, and create opportunities for hard work. For example, if the Village Law is designed and socialized as a policy to improve the performance of spending on health, education, and social protection programs, or as a way to create more and better jobs, this may resonate more with the general public. In addition, support for the Village Law will dwindle if it is perceived as an additional opportunity for local leaders to engage in corruption. Communication strategies about infrastructure projects should focus less on the benefi ts for growth, and more on how the projects can improve the quality and quantity of jobs and reduce the prices of food and other goods, particularly in less developed regions of Indonesia. Finally, although increasing taxes on the rich receive very little support from all demographic groups, linking additional government revenue to increases in spending on health, education, and social protection may improve support for the policy.
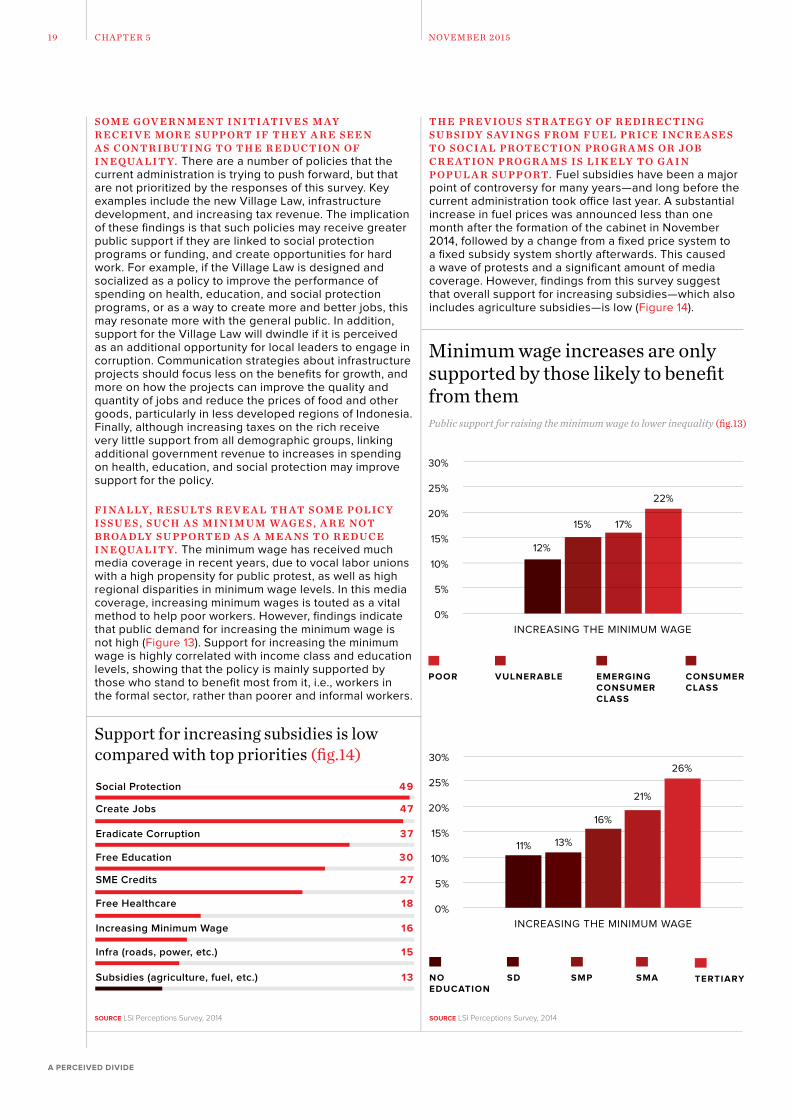
F I N A L LY, R E S U LT S R E V E A L T H AT S OM E P OL IC Y I S S U E S , S UC H A S M I N I M U M WAGE S , A R E N O T BR OA DLY S U PP ORT E D A S A M E A N S T O R E DUC E I N E QUA L I T Y. The minimum wage has received much media coverage in recent years, due to vocal labor unions with a high propensity for public protest, as well as high regional disparities in minimum wage levels. In this media coverage, increasing minimum wages is touted as a vital method to help poor workers. However, fi ndings indicate that public demand for increasing the minimum wage is not high (Figure 13). Support for increasing the minimum wage is highly correlated with income class and education levels, showing that the policy is mainly supported by those who stand to benefi t most from it, i.e., workers in the formal sector, rather than poorer and informal workers.
T H E PR E V IOU S S T R AT E G Y OF R E DI R E C T I N G S U B S I DY S AV I N G S F R OM F U E L PR IC E I N C R E A S E S T O S O C I A L PR O T E C T ION PR O GR A M S OR JOB C R E AT ION PR O GR A M S I S L I K E LY T O G A I N P OP U L A R S U PP ORT. Fuel subsidies have been a major point of controversy for many years—and long before the current administration took o� ce last year. A substantial increase in fuel prices was announced less than one month after the formation of the cabinet in November 2014, followed by a change from a fi xed price system to a fi xed subsidy system shortly afterwards. This caused a wave of protests and a signifi cant amount of media coverage. However, fi ndings from this survey suggest that overall support for increasing subsidies—which also includes agriculture subsidies—is low (Figure 14).
SOURCE LSI Perceptions Survey, 2014
Minimum wage increases are only supported by those likely to benefi t from them
30%
25%
20%
15%
10%
5%
0%
30%
25%
20%
15%
10%
5%
0%
POOR VULNERABLE EMERGING CONSUMER CLASS
CONSUMER CLASS
CHAPTER 5
TERTIARYNO EDUCATION
SD SMP SMA
INCREASING THE MINIMUM WAGE
INCREASING THE MINIMUM WAGE
Public support for raising the minimum wage to lower inequality (fi g.13)
Support for increasing subsidies is low compared with top priorities (fi g.14)
SOURCE LSI Perceptions Survey, 2014
Social Protection
Create Jobs
Eradicate Corruption
Free Education
SME Credits
Free Healthcare
Increasing Minimum Wage
Infra (roads, power, etc.)
Subsidies (agriculture, fuel, etc.)
49
47
37
30
27
18
16
15
13
12%
15% 17%
22%
11% 13%
16%
21%
26%

20 NOVEMBER 2015
A PERCEIVED DIVIDE
WHAT DOES THIS MEAN FOR P U BL IC PE R C E P T ION S T OWA R D S I N E QUA L I T Y I N I N D ON E S I A H AV E GR OW N F R OM R E L AT I V E DI S I N T E R E S T T O A L E V E L AT W H IC H T H E I S S U E I S N OW OF N AT ION A L I M P ORTA N C E . Perceptions towards inequality have changed markedly over time in Indonesia. While historically the issue of inequality did not register very highly in the minds of most Indonesians, a majority of Indonesians now believes that inequality is too high and should be urgently addressed.
T H I S C H A N GE I N AWA R E N E S S M E A N S T H AT T H E G OV E R N M E N T C A N N OW C OU N T ON W I DE S PR E A D P U BL IC S U PP ORT T O TAC K L E I N E QUA L I T Y. As a consequence of this change in public perceptions, there is now far broader public support for the Government’s new focus on reducing inequality. The growing importance of the issue of inequality should bolster the Government’s resolve in tackling inequality head on, and make it more confident in emphasizing and setting an agenda that focuses on ways of increasing equity.
T H E R E I S A L S O W I DE S PR E A D P U BL IC S U PP ORT F OR E F F E C T I V E P OL IC I E S T O R E DUC E I N E QUA L I T Y—E V E N AT T H E C O S T OF S L OW E R I N C R E A S E S I N I N C OM E S . The diagnostics and policy recommendations from the World Bank’s Indonesia’s
Rising Divide report identify four main policy responses: (i) improving local service delivery to provide a fair start in life for all; (ii) improving the skills of the workforce and creating more and better jobs; (iii) protecting households from shocks; and (iv) aligning taxes and spending to better address inequality. These responses largely coincide (although not completely) with the policies that have broad public support: the survey shows strong support for social protection policies to protect the poor and vulnerable from shocks, the creation of more and better jobs, the provision of accessible public services in the form of free health care and education, and the eradication of corruption. The survey also highlights that a majority of Indonesians favors policies aimed at reducing inequality over the prioritization of increasing incomes, in particular the minimum wage.
T H E G OV E R N M E N T H A S A N OPP ORT U N I T Y T O U S E P U BL IC S U PP ORT T O P U T F ORWA R D E F F E C T I V E P OL IC I E S T O TAC K L E T H E I S S U E OF I N E QUA L I T Y. This overlapping of policy responses with clear public support based on the perceptions survey findings provides the Government with an opportunity to pursue policies that are both technically sound and likely to be e�ective, and are also publicly supported.
CHAPTER 6
INDONESIA?
6.

21 NOVEMBER 2015
A PERCEIVED DIVIDE
References
Dabla-Norris, Era, Kalpana Kochhar, Nujin Suphaphiphat, Frantisek Ricka, and Evridiki Tsounta. 2015. Causes Sand Consequences of
of Income Inequality: a global perspective. IMF Sta� Discussion Note SDN/15/13. Washington, DC: International Monetary Fund.
Lembaga Survei Indonesia (LSI). 2014. Inequality Perceptions Survey. Jakarta: Lembaga Survei Indonesia.
World Bank. 2012. Protecting the Poor and Vulnerable in Indonesia. Jakarta: World Bank.
World Bank. 2015a. Indonesia’s Rising Divide: Why inequality is rising, why it matters and what can be done. Jakarta, Indonesia: World Bank.
World Bank. 2015b. An Unfair Start: How unequal opportunities aect Indonesia’s Children. Jakarta, Indonesia: World Bank.
World Bank. Forthcoming. Indonesia’s New Climbers: Who are the middle class and what does it mean for the country? Jakarta: World Bank.

C O M M U N I T Y S O C I A L I S S U E S
M ay 2 014 , Wo r l d B a n k
Annex A. Full Survey Instrument
N AT I O N A L S U RV E Y I N ST R U M E N T
Jln. Lembang Terusan No. D.57
Menteng, Jakarta Pusat, 10310, Indonesia
Telp. (021) 391 95 82, Faks. (021) 391 95 28
LEMBAGA SURVEI INDONESIA (LSI )

23 NOVEMBER 2015
NATIONAL SURVEY INSTRUMENT COMMUNITY SOCIAL ISSUES
1. Understand each question well before asking.
2. If the original respondent cannot be interviewed, please fill in the original respondent’s identity first at the back of the questionnaire, then follow rules for substitution of respondents.
3. Circle (o) answer clearly and focus.
4. Write clearly and legibly for open questions.
5. Do not give options to the respondent to answer ”don’t know” (code ”8” or ”88”) or ”unwilling to answer” (code ”9” or ”99”). This option is only for the interviewer. To be filled in privately if the respondent truly ”do not know” or truly ”will not answer”.
6. Do not need to read out the text in parantheses, unless the respondent does not understand or asks for an example.
7. There should be no no empty column nor answer, except for skipped questions.
8. There should be no o�cials of village (desa)/urban village (kelurahan)/neighbourhood association (rt)/commu-nity association (rw)/head of village (kepala kampung)/others sit in or listen to and more over intervene when the interview is conducted. If such situation exists then the interview should be postponed and rescheduled later.
9. Make neccesary e¨orts that no other persons, including household members, around when the interview is conducted.
10. If there is other household member presents during the interview, please ask him/her kindly not to be there.
Interviewer Guidelines
SMS Instructions11. Surveyor must send the sms interview result (for questions marked) to 9699.
12. Short number 9699 can only receive sms from telkomsel numbers. Surveyor therefore should use telkomsel number to send sms.
13. The surveyor’s telkomsel number must be registered first to area coordinator.
14. Each surveyor shall have “token”.
15. Token is the last 4 (four) digits of the surveyor’s telkomsel number which have been registered.
ANNEX A
24 NOVEMBER 2015
NATIONAL SURVEY INSTRUMENT COMMUNITY SOCIAL ISSUES
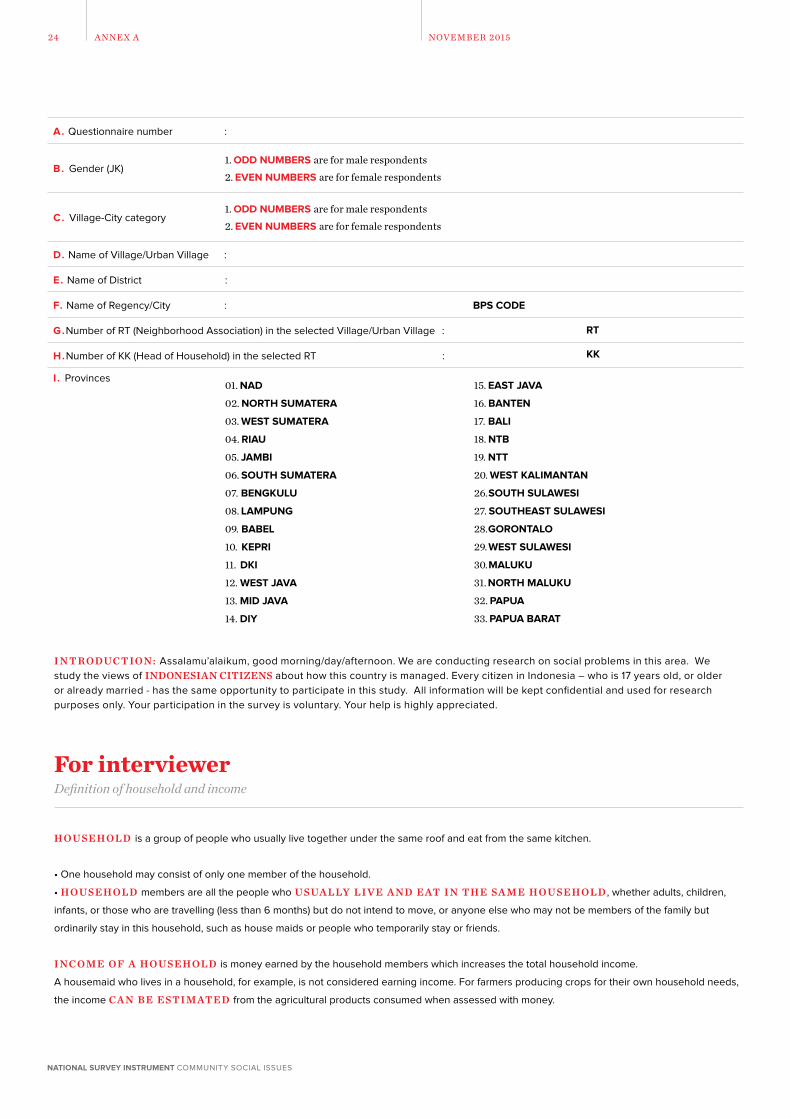
I N T R ODUC T ION: Assalamu’alaikum, good morning/day/afternoon. We are conducting research on social problems in this area. We study the views of INDONESIAN CITIZENS about how this country is managed. Every citizen in Indonesia – who is 17 years old, or older or already married - has the same opportunity to participate in this study. All information will be kept confidential and used for research purposes only. Your participation in the survey is voluntary. Your help is highly appreciated.
A. Questionnaire number :
B. Gender (JK)1. ODD NUMBERS are for male respondents 2. EVEN NUMBERS are for female respondents
C. Village-City category 1. ODD NUMBERS are for male respondents 2. EVEN NUMBERS are for female respondents
D. Name of Village/Urban Village :
E. Name of District :
F. Name of Regency/City : BPS CODE
G.Number of RT (Neighborhood Association) in the selected Village/Urban Village :
H.Number of KK (Head of Household) in the selected RT :
I . Provinces
RT
KK
01. NAD
02. NORTH SUMATERA
03. WEST SUMATERA
04. RIAU
05. JAMBI
06. SOUTH SUMATERA
07. BENGKULU
08. LAMPUNG
09. BABEL
10. KEPRI
11. DKI
12. WEST JAVA
13. MID JAVA
14. DIY
15. EAST JAVA
16. BANTEN
17. BALI
18. NTB
19. NTT
20. WEST KALIMANTAN
26. SOUTH SULAWESI
27. SOUTHEAST SULAWESI
28. GORONTALO
29. WEST SULAWESI
30. MALUKU
31. NORTH MALUKU
32. PAPUA
33. PAPUA BARAT
H O U S E H O L D is a group of people who usually live together under the same roof and eat from the same kitchen.
• One household may consist of only one member of the household.
• H O U S E H O L D members are all the people who U S UA L LY L I V E A N D E AT I N T H E S A M E H O U S E H O L D , whether adults, children,
infants, or those who are travelling (less than 6 months) but do not intend to move, or anyone else who may not be members of the family but
ordinarily stay in this household, such as house maids or people who temporarily stay or friends.
I N C O M E O F A H O U S E H O L D is money earned by the household members which increases the total household income.
A housemaid who lives in a household, for example, is not considered earning income. For farmers producing crops for their own household needs,
the income CA N B E E ST I M AT E D from the agricultural products consumed when assessed with money.
For interviewer Definition of household and income
ANNEX A
25 NOVEMBER 2015
NATIONAL SURVEY INSTRUMENT COMMUNITY SOCIAL ISSUES
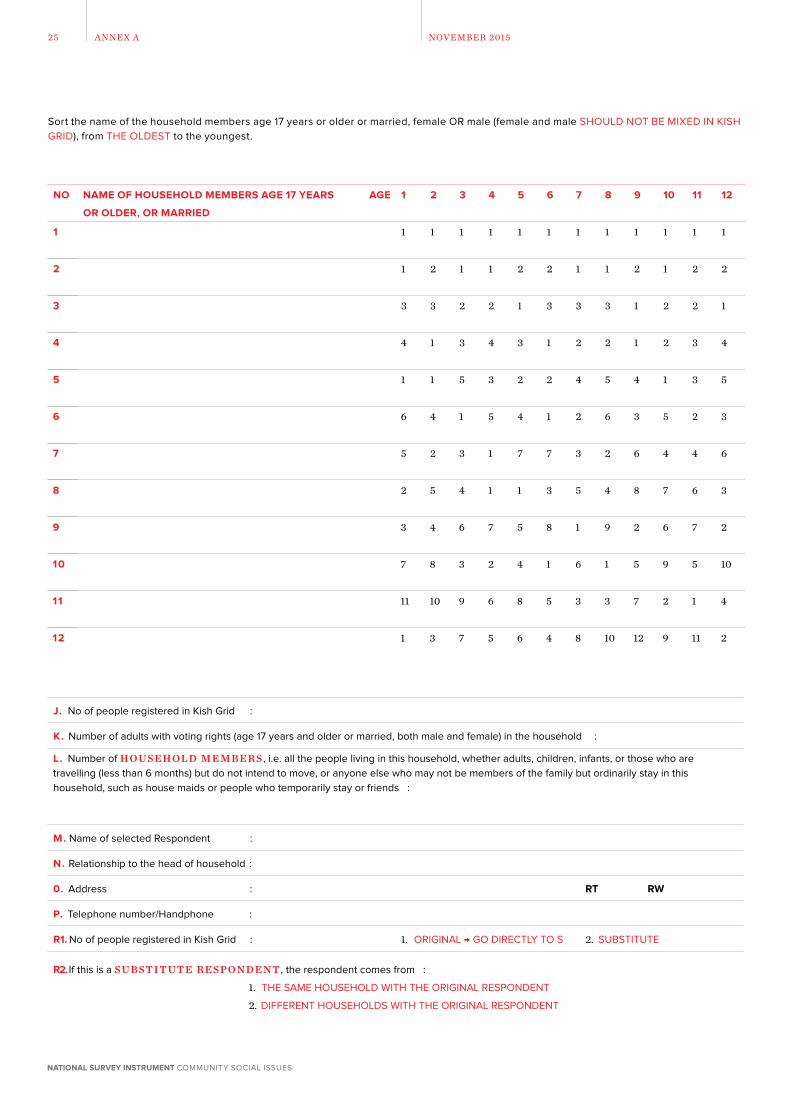
Sort the name of the household members age 17 years or older or married, female OR male (female and male SHOULD NOT BE MIXED IN KISH GRID), from THE OLDEST to the youngest.
NO NAME OF HOUSEHOLD MEMBERS AGE 17 YEARS
OR OLDER, OR MARRIED
AGE 1 2 3 4 5 6 7 8 9 10 11 12
1 1 1 1 1 1 1 1 1 1 1 1 1
2 1 2 1 1 2 2 1 1 2 1 2 2
3 3 3 2 2 1 3 3 3 1 2 2 1
4 4 1 3 4 3 1 2 2 1 2 3 4
5 1 1 5 3 2 2 4 5 4 1 3 5
6 6 4 1 5 4 1 2 6 3 5 2 3
7 5 2 3 1 7 7 3 2 6 4 4 6
8 2 5 4 1 1 3 5 4 8 7 6 3
9 3 4 6 7 5 8 1 9 2 6 7 2
10 7 8 3 2 4 1 6 1 5 9 5 10
11 11 10 9 6 8 5 3 3 7 2 1 4
12 1 3 7 5 6 4 8 10 12 9 11 2
J. No of people registered in Kish Grid :
K. Number of adults with voting rights (age 17 years and older or married, both male and female) in the household :
L. Number of H O U S E H O L D M E M B E R S , i.e. all the people living in this household, whether adults, children, infants, or those who are travelling (less than 6 months) but do not intend to move, or anyone else who may not be members of the family but ordinarily stay in this household, such as house maids or people who temporarily stay or friends :
M. Name of selected Respondent :
N. Relationship to the head of household :
0. Address : RT RW
P. Telephone number/Handphone :
R1. No of people registered in Kish Grid : 1. ORIGINAL → GO DIRECTLY TO S 2. SUBSTITUTE
R2. If this is a S U B ST I T U T E R E S P O N D E N T , the respondent comes from :
1. THE SAME HOUSEHOLD WITH THE ORIGINAL RESPONDENT
2. DIFFERENT HOUSEHOLDS WITH THE ORIGINAL RESPONDENT
ANNEX A

26 NOVEMBER 2015
NATIONAL SURVEY INSTRUMENT COMMUNITY SOCIAL ISSUES
1. (SMS-A) How O L D are you now ? Write ............................................................................................................................................................................................years
2. Are you m a r r i e d ? 1. Married 3. Single - GO DIRECTLY TO NO. 4
2. Separated/divorced 3. How m a ny c h i l d r e n do you have ? ................................................................................................................................................... i f n o c h i l d r e n , w r i t e 04. (SMS-B) S H OW D R O P CA R D A . Aside from being a citizen of Indonesia, which ethnic group do you belong to? For example Javanese,
Sundanese, Malay, Madurese, Bugis, Minang, Batak, etc ?
5. (SMS-C) What is your r e l i g i o n ?
6. (SMS-D) S H OW D R O P CA R D B. What is your latest e d u c a t i o n ?
7. S H OW D R O P CA R D C. Do you wo r k ?
8. What is your current m a i n o c c u p a t i o n ? (Please write the type of job in detail) ........................................................................................................................ ....................................................................................................................................................................................................................................................................................... .......................................................................................................................................................................................................................................................................................
QUESTIONNAIRE CONTROL NAME DATE INITIAL REMARK
S. Interviewer
T. Area Coordinator
U. Data Entry
V. (TO BE FILLED OUT DIRECTLY BY INTERVIEWER) Interview starts, time : ........................................................................................................................................
1. Javanese
2. Sundanese
3. Malay
4. Madurese
5. Bugis
6. Betawi
1. Never went to schooL
2. Not completed elementary school/
equivalent
3. Elementary school/equivalent
4. Not completed junior high school/
equivalent
5. Junior high school/equivalent
1. Islam
2.Protestantism
3. Catholicism
4. Hinduism
7. Batak
8. Minang
9. Banten
10. Balinese
11. Cirebon
12. Chinese
6. Not completed high school equivalent
7. High school/equivalent
8. Not completed college or university/
still a student
9. College
10. University or higher
5. Buddhism
6. Confucianism
7. Others : .............................................................
1. Yes
2. No, still a student
3. No, at home as a housewife
4. No, not yet
ANNEX A

27 NOVEMBER 2015
NATIONAL SURVEY INSTRUMENT COMMUNITY SOCIAL ISSUES
9. (TO BE FILLED OUT DIRECTLY BY INTERVIEWER IN ACCORDANCE WITH ANSWER NO. 8) Is the main occupation of the person included in one of the groups below ?
10. SHOW STAIRCASE IMAGE DROP CARD.
1. Farmer/breeder/fisherman
2. Laborer/helper
3. Workshop/service
4. Driver/motorcycle taxi driver
5. Security guard/civil defense
6. No permanent job
7. Stall merchant/street vendor
8. Large trader/wholesaler
9. Businessman
10. Village/urban village o�cial
11. Employee/private sector employee
12. Civil servant (PNS)
13. Teacher/lecturer
14. Pro�esional (lawyer/doctor/etc.)
15. Retired
88. None of the above
• Understand each question well before asking• Make sure respondents understand questions properly.
• Ask if respondent has understood the explanation of the staircase image. If not, please explain once again from the beginning.
• If respondent has understood, then please show 50 pieces of coins in 500 (five hundred) rupiah denomina-tions. No need to mention the number of coins shown, unless respondent asks.
Interviewer Guidelines
Interviewer Guidelines
Now I will ask about the people of Indonesia. Suppose the Indonesian population is divided into fi ve c o m m u n i ty g r o u p s. Each group has
t h e sa m e n u m b e r o f p o p u l a t i o n , i . e . , e a c h h a s e q u a l l y o n e - fi f t h o f t h e t ot a l p o p u l a t i o n . I f t h e I n d o n e s i a n p o p u l a t i o n is
now 250 million people, then each group equally consists of 50 million people. However, the group has five di�erent incomes.
The five community groups are depicted with staircases like this (SHOW STAIRCASE IMAGE):
1. The top of the stairs is one fifth of the population whose income is the highest, or t h e r i c h e st group
2. The second step from the top is one fifth of the population whose income is much, or t h e r i c h group
3. The third stair from the top is one fifth of the population whose income is moderate, or the m i d d l e group
4. The fourth stair from the top is one fifth of the population whose income is less, or t h e p o o r group
5.The bottom of the stairs is one fifth of the population whose income is very little, or t h e p o o r e st group.
To answer this question, try to divide the coins into the five steps.
You do not need to worry that you have a wrong answer. It is your e st i m a t i o n only. Please just be reminded, that the number of coins for the lower
step should not be more than the higher step, because the higher step is the richer group.
For example only, if you consider the whole income N OW I N FA CT belongs to the highest income or the richest group only, put all coins on the
top step. If you assume that N OW I N FA CT all groups have the same income, put all the coins equally on each of the steps.
In your opinion, how much income of each community group in Indonesia IN FACT today?
Here are some coins. Suppose the whole coins are the entire income of Indonesia.
ANNEX A

28 NOVEMBER 2015
NATIONAL SURVEY INSTRUMENT COMMUNITY SOCIAL ISSUES
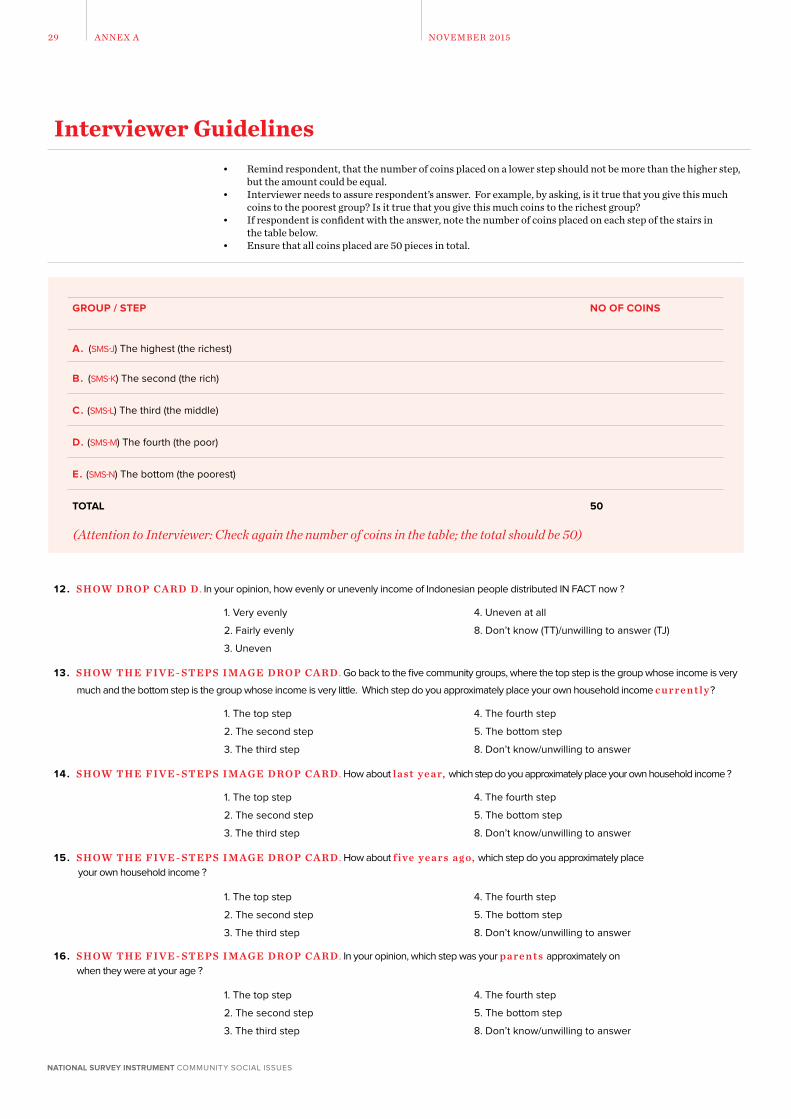
• Remind respondent, that the number of coins placed on a lower step should not be more than the higher step, but the amount could be equal.
• Interviewer needs to assure respondent’s answer. For example, by asking, is it true that you give this much coins to the poorest group? Is it true that you give this much coins to the richest group?
• If respondent is confident with the answer, note the number of coins placed on each step of the stairs in the table below.
• Ensure that all coins placed are 50 pieces in total.
Interviewer Guidelines
GROUP / STEP NO OF COINS
A. (SMS-E) The highest (the richest)
B. (SMS-F) The second (the rich)
C. (SMS-G) The third (the middle)
D. (SMS-H) The fourth (the poor)
E. (SMS-I) The bottom (the poorest)
TOTAL 50
(Attention to Interviewer: Check again the number of coins in the table; the total should be 50)
11. SHOW ONCE AGAIN THE STAIRCASE IMAGE DROP CARD, AND COINS.
• Interviewer should remove all coins from the staircase image drop card before start asking questions. • Read out questions clearly and do not speak too fast.• Make sure respondent understands questions properly.
Interviewer Guidelines
To answer this question, try to divide back the coins in to the five steps.
You do not need to worry that you have a wrong answer. It is according to your c o n s i d e r a t i o n only. Please just be reminded, that the number of
coins for the lower step should not be more than the higher step, because the higher step is the richer group.
For example only, if in your opinion the whole income S H O U L D belong to the highest income group or the richest group only, then put all the coins
on the top step. Or if you consider that all groups S H O U L D have the same income, put all the coins equally on each of the steps.
In your opinion, what SHOULD BE the income of each community group in Indonesia?
Now let’s look back the Staircase Image. And suppose that the whole of the coins is the entire income of Indonesia.
ANNEX A
29 NOVEMBER 2015
NATIONAL SURVEY INSTRUMENT COMMUNITY SOCIAL ISSUES
12. S H OW D R O P CA R D D . In your opinion, how evenly or unevenly income of Indonesian people distributed IN FACT now ?
13. S H OW T H E F I V E - ST E P S I M A G E D R O P CA R D . Go back to the five community groups, where the top step is the group whose income is very
much and the bottom step is the group whose income is very little. Which step do you approximately place your own household income c u r r e n t l y?
14. S H OW T H E F I V E - ST E P S I M A G E D R O P CA R D . How about l a st y e a r, which step do you approximately place your own household income ?
15. S H OW T H E F I V E - ST E P S I M A G E D R O P CA R D . How about fi ve y e a r s a g o, which step do you approximately place your own household income ?
16. S H OW T H E F I V E - ST E P S I M A G E D R O P CA R D . In your opinion, which step was your p a r e n t s approximately on when they were at your age ?
• Remind respondent, that the number of coins placed on a lower step should not be more than the higher step, but the amount could be equal.
• Interviewer needs to assure respondent’s answer. For example, by asking, is it true that you give this much coins to the poorest group? Is it true that you give this much coins to the richest group?
• If respondent is confident with the answer, note the number of coins placed on each step of the stairs in the table below.
• Ensure that all coins placed are 50 pieces in total.
Interviewer Guidelines
1. Very evenly
2. Fairly evenly
3. Uneven
1. The top step
2. The second step
3. The third step
1. The top step
2. The second step
3. The third step
1. The top step
2. The second step
3. The third step
1. The top step
2. The second step
3. The third step
4. Uneven at all
8. Don’t know (TT)/unwilling to answer (TJ)
4. The fourth step
5. The bottom step
8. Don’t know/unwilling to answer
4. The fourth step
5. The bottom step
8. Don’t know/unwilling to answer
4. The fourth step
5. The bottom step
8. Don’t know/unwilling to answer
4. The fourth step
5. The bottom step
8. Don’t know/unwilling to answer
GROUP / STEP NO OF COINS
A. (SMS-J) The highest (the richest)
B. (SMS-K) The second (the rich)
C. (SMS-L) The third (the middle)
D. (SMS-M) The fourth (the poor)
E. (SMS-N) The bottom (the poorest)
TOTAL 50
(Attention to Interviewer: Check again the number of coins in the table; the total should be 50)
ANNEX A

30 NOVEMBER 2015
NATIONAL SURVEY INSTRUMENT COMMUNITY SOCIAL ISSUES
17. S H OW T H E F I V E - ST E P S I M A G E D R O P CA R D . How about next year, on which step will your own household income approximately be ?
18. S H OW T H E F I V E - ST E P S I M A G E D R O P CA R D . How about n ext fi ve y e a r s, on which step will your own household income be ?
19. S H OW T H E F I V E - ST E P S I M A G E D R O P CA R D . In your opinion, on which step will your c h i l d r e n approximately be when they are at your age ?
20. S H OW T H E F I V E - ST E P S I M A G E D R O P CA R D . In your opinion, on which step will your g r a n d c h i l d r e n approximately be when they are at your age ?
1. The top step
2. The second step
3. The third step
1. The top step
2. The second step
3. The third step
1. The top step
2. The second step
3. The third step
1. The top step
2. The second step
3. The third step
4. The fourth step
5. The bottom step
8. Don’t know/unwilling to answer
4. The fourth step
5. The bottom step
8. Don’t know/unwilling to answer
4. The fourth step
5. The bottom step
8. Don’t know/unwilling to answer
4. The fourth step
5. The bottom step
8. Don’t know/unwilling to answer
Show the five drop cards showing images or income portion graphics. Sort the cards from left to right, start from the image a card on the most left, until the image e card on the most right.
E X P L A I N T O R E S P O N D E N T: Q U E ST I O N S N O 1 7- 2 0 inquire estimates or predictions of respondent, not hope or desire of respondent.
Interviewer Guidelines
21. (SMS-O) Here are five images. Each image shows di�erent incomes between the five groups as described previously (the richest, the rich, the middle, the poor, and the poorest groups).
I m a g e A means the entire income in Indonesia is only owned by the richest group, and
I m a g e E means income in Indonesia is divided evenly among all community groups. Meanwhile I m a g e s B , C , D show other income di�erences.
In your opinion, which image is a closer picture of income di�erences between groups in Indonesia I N FA CT today ? Whether such image A, B, C, D, or E
22. (SMS-P) Now if you have power and are asked to divide the incomes into the above five groups in Indonesia. In your opinion, how is THE BEST division like ? Whether such image A, B, C, D, or E ?
1. Image A
2. Image B
3. Image C
1. Image A
2. Image B
3. Image C
4. Image D
5. Image E
8. Don’t know/unwilling to answer
4. Image D
5. Image E
8. Don’t know/unwilling to answer
ANNEX A
Interviewer Guidelines

31 NOVEMBER 2015
NATIONAL SURVEY INSTRUMENT COMMUNITY SOCIAL ISSUES
23. (SMS-Q) S H OW D R O P CA R D E . Here are two images. Each image shows the di�erence between income of the five community groups in a country. If you are asked to choose, whether you prefer to live in a country with such income disparity shown in image A or B ?
24. (SMS-R) S H OW D R O P CA R D F . How about this pair of images? If you are asked to choose, whether you prefer to live in a country with such income disparity shown in image A or B ?
25. (SMS-S) S H OW D R O P CA R D G . How about this pair of images? If you are asked to choose, whether you prefer to live in a country with such income disparity shown in image A or B ?
26. S H OW D R O P CA R D H . In your opinion, how changes in income of each group IN FACT over the last five years ? Is the income of each group much reduced, slightly reduced, the same, slightly increased, or much increased ?
27. S H OW D R O P CA R D H . If you have the power to determine changes in income of the five groups five years to come, how changes in income that
SHOULD happen? Is the income of each group should be much reduced, slightly reduced, the same, slightly increased or much increased ?
1. Image A
2. Image B
1. Image A
2. Image B
1. Image A
2. Image B
8. Don’t know/unwilling to answer
8. Don’t know/unwilling to answer
8. Don’t know/unwilling to answer
GROUP INCOME OVER THE LAST 5 YEARS
MUCH REDUCED
SLIGHTLY REDUCED
THE SAME SLIGHTLY INCREASED
MUCH INCREASED
DON’T KNOW/UNWILLING TO ANSWER
A. The top one fifth (the richest) 1 2 3 4 5 8
B. The second one fifth (the rich) 1 2 3 4 5 8
C. The third one fifth (the middle) 1 2 3 4 5 8
D. The fourth one fifth (the poor) 1 2 3 4 5 8
E. The bottom one fifth (the poorest) 1 2 3 4 5 8
ANNEX A

32 NOVEMBER 2015
NATIONAL SURVEY INSTRUMENT COMMUNITY SOCIAL ISSUES
28. S H OW D R O P CA R D I . In your opinion, in general how was the income distribution among community groups in Indonesia over the past five years. Was the income much more evenly distributed, more even, no change, more uneven, or far more uneven ?
29. S H OW D R O P CA R D J . Let’s talk about the top group or whose income is the most. Of course there are many reasons why they can have very much
income. In your opinion, which of the following causes the most influential reason ? (ONLY ONE ANSWER) ?
30. S H OW D R O P CA R D J . Moreover, what else is the most significant cause ? (ONLY ONE ANSWER) ?
31. S H OW D R O P CA R D K . Now let’s talk about the bottom group or whose income is the least. Of course there is also a variety of reasons why they could
have just very little income. In your opinion, which of the following causes the most influential reason ? (ONLY ONE ANSWER) ?
32. S H OW D R O P CA R D K . Moreover, what else is the most significant cause ? (ONLY ONE ANSWER) ?
33. S H OW D R O P CA R D L . IIn your opinion, which of the following three statements best describes the current reality in Indonesia ?
1. Much more even
2. More even
3. No change
1. Talent
2. Hard work
3. Lucky/fortunate
4. Come from a wealthy family
5. Come from an educated family
6. Have a lot of connections (friend, colleagues, relatives, etc.)
1. Talent
2. Hard work
3. Lucky/fortunate
4. Come from a wealthy family
5. Come from an educated family
6. Have a lot of connections (friend, colleagues, relatives, etc.)
1. Talent
2. Hard work
3. Lucky/fortunate
4. Come from a wealthy family
5. Come from an educated family
6. Have a lot of connections (friend, colleagues, relatives, etc.)
1. Talent
2. Hard work
3. Lucky/fortunate
4. Come from a wealthy family
5. Come from an educated family
6. Have a lot of connections (friend, colleagues, relatives, etc.)
4. More uneven
5. far more uneven
8. Don’t know/unwilling to answer
7. Supportive environment
8. Corruption
9. Others, please specify ..................................................................................................................................
88. Don’t know/unwilling to answer
7. Supportive environment
8. Corruption
9. Others, please specify ..................................................................................................................................
88. Don’t know/unwilling to answer
7. Supportive environment
8. Unsupportive environment
9. Others, please specify ..................................................................................................................................
88. Don’t know/unwilling to answer
7. Supportive environment
8. Unsupportive environment
9. Others, please specify ..................................................................................................................................
88. Don’t know/unwilling to answer
1. People easily improve their economic condition if they are willing to work hard
2. It is di�cult to improve people’seconomic condition despite working hard
3. It is almost impossible to improve people’s economic condition despite working hard
8. Don’t know/unwilling to answer
ANNEX A

33 NOVEMBER 2015
NATIONAL SURVEY INSTRUMENT COMMUNITY SOCIAL ISSUES
34. S H OW D R O P CA R D M . In your opinion, which of the following two statements you agree more ?
35. S H OW D R O P CA R D N . If answered “1”, under which circumstances that inequality in income can be accepted most ? (ONLY ONE ANSWER)
36. S H OW D R O P CA R D O . If you are asked to choose, which of the following two circumstances that you favor more ?
37. S H OW D R O P CA R D P . In your opinion, how urgent or not urgent the income inequality in Indonesia to be resolved by the Indonesian government ?
38. In your knowledge, what government policy or government program that has been done to reduce the income
disparity between the rich and the poor in Indonesia ? (CAN BE MORE THAN ONE ANSWER)
39. (TO BE FILLED OUT DIRECTLY BY INTERVIEWER IN ACCORDANCE WITH ANSWER NO. 38)
40. In your opinion, what should be done by the new President of Indonesia to reduce income inequality in Indonesia ?
(CAN BE MORE THAN ONE ANSWER) WRITE CLEARLY :
1. In certain circumstances, the income inequality can be accepted
2. Whatever the reason, the inequality in income cannot be accepted → go directly to No. 36
1. Incomes of the poor rise rapidly, but the disparity in income between the rich and the poor is getting bigger
2. Incomes of the poor rise slowly, but the disparity in income between the rich and the poor is getting smaller
8. Don’t know/unwilling to answer → go directly to No. 36
8. Don’t know/unwilling to answer
1. Country/nation as a whole is progressing
2. Poverty rate is reduced
3. Fair competition to obtain wealth
4. People get rich because they work hard
or people become poor because they are lazy
5. Prices of basic necessities are a�ordable by everyone
6. Others, please specify ................................................................................................................................
8. Don’t know/unwilling to answer
1. Very urgent
2. Quite urgent
3. Less urgent
4. Not urgent at all
8. Don’t know/unwilling to answered
PLEASE WRITE CLEARLY, DO NOT JUST ABBREVIATIONS :
1. ..........................................................................................................................................................................................
2. .........................................................................................................................................................................................
3. .........................................................................................................................................................................................
1. Subsidized rice (Raskin)
2. Conditional Cash Transfer (PKH)
3. Educational Support Fund for poor students (BSM)
4. School Operational Support Fund (BOS)
5. National Program for Community Empowerment (PNPM)
6. Temporary Community Direct Assistance (BLSM)
7. Unconditional Cash Transfer (BLT)
8. Credit for the People (KUR)
9. Sub-District Development Program (PPK)
10. Urban Poverty Reduction Program (P2KP)
11. PNPM for Lagged and Specific Area (P2DTK)
12.Regional Infrastructure Social Economic Development Program (PISEW)
13. Social Health Insurance (JAMKESMAS) / Regional Health Insurance (JAMKESDA)
14. Fuel subsidy
15. Others, please specify ..............................................................................................................................
88. Don’t know/unwilling to answer
1. ..........................................................................................................................................................................................
2. .........................................................................................................................................................................................
3. .........................................................................................................................................................................................
ANNEX A

34 NOVEMBER 2015
NATIONAL SURVEY INSTRUMENT COMMUNITY SOCIAL ISSUES
41. (TO BE FILLED OUT DIRECTLY BY INTERVIEWER IN ACCORDANCE WITH ANSWER NO. 40)
42. S H OW D R O P CA R D Q . In your opinion, which of the following is the most important matter to be done by the new
President of Indonesia to reduce income inequality in Indonesia ? (ONLY ONE ANSWER)
43. S H OW D R O P CA R D Q . Besides, what else is the second most important matter to be done by the new President of Indonesia to
reduce income inequality in Indonesia ? (ONLY ONE ANSWER)
1. Provide social protection for the poor and vulnerable households (for example, subsidised rice, direct cash assistance, scholarship, social health insurance, employee social security, etc.)
2. Add grants/aids for Village/Urban Village (for example, National Program for Community Empowerment PNPM)
3. Provide free education for all people
4. Provide free medical care for all people
5. Build better infrastructures (roads, electricity, bridges, etc)
6. Raise taxes on the richer
7. Fight corruption
8. Raise the minimum wage
9. Fair ownership of assets (for example land, forests, mines, etc.) for public
10. Provide better schools
11. Provide more subsidies (for example, for agricultural needs, food, fuel)
12. Provide jobs
13. Social insurance for people who lose their jobs
14. Capital assistance for small businesses
15. Loans for poor people (not for business purposes)
16. Others, please specify ..............................................................................................................................
88. Don’t know/unwilling to answer
1. Subsidized rice (Raskin)
2. Conditional Cash Transfer (PKH)
3. Educational Support Fund for poor students (BSM)
4. School Operational Support Fund (BOS)
5. National Program for Community Empowerment (PNPM)
6. Temporary Community Direct Assistance (BLSM)
7. Unconditional Cash Transfer (BLT)
8. Credit for the People (KUR)
9. Sub-District Development Program (PPK)
10. Urban Poverty Reduction Program (P2KP)
11. PNPM for Lagged and Specific Area (P2DTK)
12.Regional Infrastructure Social Economic Development Program (PISEW)
13. Social Health Insurance (JAMKESMAS) / Regional Health Insurance (JAMKESDA)
14. Fuel subsidy
15. Others, please specify ..............................................................................................................................
88. Don’t know/unwilling to answer
ANNEX A

35 NOVEMBER 2015
NATIONAL SURVEY INSTRUMENT COMMUNITY SOCIAL ISSUES
44. S H OW D R O P CA R D Q . Besides, what else is the third most important matter to be done by the new President of Indonesia to reduce income
inequality in Indonesia ? (ONLY ONE ANSWER)
45. (SMS-T)The presidential election in 2014 will take place sometime later. But if the presidential election took place today, who would you choose as our president ? ............................................................................................................................................................................................................... ..................................................................................................................................................................................................................................................................
46. (SMS-U) SHOW DROP CARD R-1 . If the presidential election held today, who would you elect as the president among the following names ?
47. (SMS-V) SHOW DROP CARD R-1 . If the presidential election held today, who would you elect as the president and vice president among the following names ?
48. (SMS-W) When discussing the election with others, we find many people who are unable to vote because they are far from home, being ill, do not have the time or other reasons. How about yourself? Did you vote in the general election of members of House of Representatives / Legislative Council in 2014 that just took place sometime ago ?
49. (SMS-X) SHOW THE LIST OF 12 POLITICAL PARTIES . If “YES VOTING”, which political party did you vote in the election ?
1. Joko Widodo ( jokowi)
2. Prabowo Subianto
1. Joko Widodo ( jokowi) and M. Jusuf Kalla
2. Prabowo Subianto and Hatta Rajasa
8. Don’t know/unwilling to answer
8. Don’t know/unwilling to answer
1. Yes voting
2. Not voting → go directly to No. 51
8. Unable to vote → go directly to No. 51
8. Refused to answer → go directly to No. 50
1. National Democratic Party (Nasdem)
2. National Awakening Party (PKB)
3. Prosperous Justice Party (PKS)
4. Indonesian Democratic Party - Struggle (PDI-P)
5. Party of The Functional Groups (Golkar)
6. Great Indonesia Movement Party (Gerindra)
7. Democratic Party (PD)
8. National Mandate Party (PAN)
9. United Development Party (PPP)
10. People’s conscience Party (Hanura)
11. Crescent Star Party (PBB)
14. Indonesian Justice and Unity Party (PKPI) → Go directly to No 52
15. Indonesian Justice and Unity Party (PKPI)
88. Secret/unwilling to answer
1. Provide social protection for the poor and vulnerable households (for example, subsidised rice, direct cash assistance, scholarship, social health insurance, employee social security, etc.)
2. Add grants/aids for Village/Urban Village (for example, National Program for Community Empowerment PNPM)
3. Provide free education for all people
4. Provide free medical care for all people
5. Build better infrastructures (roads, electricity, bridges, etc)
6. Raise taxes on the richer
7. Fight corruption
8. Raise the minimum wage
9. Fair ownership of assets (for example land, forests, mines, etc.) for public
10. Provide better schools
11. Provide more subsidies (for example, for agricultural needs, food, fuel)
12. Provide jobs
13. Social insurance for people who lose their jobs
14. Capital assistance for small businesses
15. Loans for poor people (not for business purposes)
16. Others, please specify ..............................................................................................................................
88. Don’t know/unwilling to answer
ANNEX A
36 NOVEMBER 2015
NATIONAL SURVEY INSTRUMENT COMMUNITY SOCIAL ISSUES
50. (SMS-Y) SHOW THE LIST OF 12 POLITICAL PARTIES . If “YES VOTING”, but “Secret”, which political party do you think best represents your wishes ?
51. SHOW DROP CARD S. If “NOT VOTING” please explain why ?
SHOW DROP CARD T. In the past month, how often did you follow the news related to social issues or politics at the national or regional
level through the following mass media?
MASS MEDIA EVERY DAY OR ALMOST EVERY DAY
3-4 DAYS A WEEK
1-2 DAYS A WEEK
RARELY (NOT EVERY WEEK)
NEVER DON’T KNOW/UNWILLING TO ANSWER
52. Newspaper 1 2 3 4 5 8
53. News Magazine 1 2 3 4 5 8
54. TV 1 2 3 4 5 8
55. Radio 1 2 3 4 5 8
56. Internet 1 2 3 4 5 8
1. National Democratic Party (Nasdem)
2. National Awakening Party (PKB)
3. Prosperous Justice Party (PKS)
4. Indonesian Democratic Party - Struggle (PDI-P)
5. Party of The Functional Groups (Golkar)
6. Great Indonesia Movement Party (Gerindra)
7. Democratic Party (PD)
1. Election does not do any good
to improve condition
2. Elections only benefit others
3. Don’t know which party or member of
the House of Representatives to choose
4. No party or member of the House of
Representatives who could fulfill hopes
8. National Mandate Party (PAN)
9. United Development Party (PPP)
10. People’s conscience Party (Hanura)
14. Crescent Star Party (PBB)
15. Indonesian Justice and Unity Party (PKPI)
88. Secret/unwilling to answer
5. Not registered as a voter
6. Registered but cannot vote because did
not prepare A5 form
7. Others reason, please write .......................................................................................................................
8. Cannot vote
9. Refused to answer
ANNEX A

37 NOVEMBER 2015
NATIONAL SURVEY INSTRUMENT COMMUNITY SOCIAL ISSUES
57. Please state the names of your household members age 15 years and over, both male and female, including yourself.
58. (TO BE FILLED OUT DIRECTLY BY INTERVIEWER) Among the household members age 15 years and over stated above, which one is the respondent ?
(CIRCLE HOUSEHOLD MEMBER CODE ACCORDING TO THE TABLE IN QUESTION NO.57)
59. Among the above household members age 15 years and over, who earns the highest income ? (ONLY ONE ANSWER)
60. (INTERVIEWER: IF RESPONDENT IS THE HIGHEST INCOME EARNER, GO DIRECTLY TO NO.62. IF NOT, CONTINUE) What is the main occupation of this person whose income is the greatest ? PLEASE WRITE IN DETAILS .................................................................................................................................................... ..........................................................................................................................................................................................................................................................................
CODE NAMES OF HOUSEHOLD MEMBERS (HM) AGE 15 YEARS AND OVER, BOTH MALE AND FEMALE,
INCLUDING RESPONDENT
HM 1
HM 2
HM 3
HM 4
HM 5
HM 6
HM 7
HM 8
HM 9
HM 10
HM 11
HM 12
HM 13
HM 14
HM 15
1. HM 1
2. HM 2
3. HM 3
4. HM 4
5. HM 5
6. HM 6
7. HM 7
8. HM 8
1. HM 1
2. HM 2
3. HM 3
4. HM 4
5. HM 5
6. HM 6
7. HM 7
8. HM 8
9. HM 9
10. HM 10
11. HM 11
12. HM 12
13. HM 13
14. HM 14
15. HM 15
9. HM 9
10. HM 10
11. HM 11
12. HM 12
13. HM 13
14. HM 14
15. HM 15
ANNEX A

38 NOVEMBER 2015
NATIONAL SURVEY INSTRUMENT COMMUNITY SOCIAL ISSUES
61. (TO BE FILLED OUT DIRECTLY BY INTERVIEWER IN ACCORDANCE WITH ANSWER NO. 60) Does the highest income fall under one of the following groups ?
62. (SMS-Z) SHOW DROP CARD U. What is the approximate amount in rupiah, average in a month, of income earned by the highest income
generator above ? (IF RESPONDENT DOES NOT KNOW AT ALL, ASK OTHER HOUSEHOLD MEMBER WHO HAS THE KNOWLEDGE) ?
63. In addition to the person earning the highest income above, who else in the household works or earns a living?
(ONLY ONE ANSWER)
64. (SMS-Z) SHOW DROP CARD U . What is the approximate amount in rupiah, average in a month, of income earned by the person above ?
(IF RESPONDENT DOES NOT KNOW AT ALL, ASK OTHER HOUSEHOLD MEMBER WHO HAS THE KNOWLEDGE)
1. Farmer/breeder/fisherman
2. Laborer/helper
3. Workshop/service
4. Driver/motorcycle taxi driver
5. Security guard/civil defense (hansip)
6. Kerja tidak tetap
7. Stall merchant/street vendor
8. Large trader/wholesaler
1. Below 200 thousand
2. 200-399 thousand
3. 400-599 thousand
4. 600-799 thousand
5. 800-999 thousand
6. 1 million -1.199 million
9. Businessman
10. Village/urban village o�cial
11. Employee/private sector employee
12. Civil servant (PNS)
13. Teacher/lecturer
14. Pro�esional (lawyer/doctor/etc.)
15. Retired
88. None of the above
7. 1.2-1.399 million
8. 1.4-1.599 million
9. 1.6-1.799 million
10. 1.8-1.999 million
11. 2 million – 4 million
12. Above 4 million
1. HM 1
2. HM 2
3. HM 3
4. HM 4
5. HM 5
6. HM 6
7. HM 7
8. HM 8
9. HM 9
10. HM 10
11. HM 11
12. HM 12
13. HM 13
14. HM 14
15. HM
88. No one else → go directly to No. 71
1. Below 200 thousand
2. 200-399 thousand
3. 400-599 thousand
4. 600-799 thousand
5. 800-999 thousand
6. 1 million -1.199 million
7. 1.2-1.399 million
8. 1.4-1.599 million
9. 1.6-1.799 million
10. 1.8-1.999 million
11. 2 million – 4 million
12. Above 4 million
ANNEX A

39 NOVEMBER 2015
NATIONAL SURVEY INSTRUMENT COMMUNITY SOCIAL ISSUES
65. (TO BE FILLED OUT DIRECTLY BY INTERVIEWER IN ACCORDANCE WITH ANSWER NO. 60) Does the highest income fall under one of the following groups ?
66. SHOW DROP CARD U. What is the approximate amount in rupiah, average in a month, of income earned by the person above ?
(IF RESPONDENT DOES NOT KNOW AT ALL, ASK OTHER HOUSEHOLD MEMBER WHO HAS THE KNOWLEDGE)
67. Who else in the household works or earns a living ? (ONLY ONE ANSWER)
68. SHOW DROP CARD U. What is the approximate amount in rupiah, average in a month, of income earned by the person above ?
(IF RESPONDENT DOES NOT KNOW AT ALL, ASK OTHER HOUSEHOLD MEMBER WHO HAS THE KNOWLEDGE)
69. Who else in the household works or earns a living ? (ONLY ONE ANSWER) ?
1. HM 1
2. HM 2
3. HM 3
4. HM 4
5. HM 5
6. HM 6
7. HM 7
8. HM 8
9. HM 9
10. HM 10
11. HM 11
12. HM 12
13. HM 13
14. HM 14
15. HM
88. No one else → go directly to No. 71
1. Below 200 thousand
2. 200-399 thousand
3. 400-599 thousand
4. 600-799 thousand
5. 800-999 thousand
6. 1 million -1.199 million
7. 1.2-1.399 million
8. 1.4-1.599 million
9. 1.6-1.799 million
10. 1.8-1.999 million
11. 2 million – 4 million
12. Above 4 million
1. HM 1
2. HM 2
3. HM 3
4. HM 4
5. HM 5
6. HM 6
7. HM 7
8. HM 8
9. HM 9
1. HM 1
2. HM 2
3. HM 3
4. HM 4
5. HM 5
6. HM 6
7. HM 7
8. HM 8
9. HM 9
10. HM 10
11. HM 11
12. HM 12
13. HM 13
14. HM 14
15. HM 15
88. No one else → go directly to No. 71
10. HM 10
11. HM 11
12. HM 12
13. HM 13
14. HM 14
15. HM 15
88. No one else → go directly to No. 71
1. Below 200 thousand
2. 200-399 thousand
3. 400-599 thousand
4. 600-799 thousand
5. 800-999 thousand
6. 1 million -1.199 million
7. 1.2-1.399 million
8. 1.4-1.599 million
9. 1.6-1.799 million
10. 1.8-1.999 million
11. 2 million – 4 million
12. Above 4 million
ANNEX A

40 OCTOBER 2015
NATIONAL SURVEY INSTRUMENT COMMUNITY SOCIAL ISSUES
70. SHOW DROP CARD U. What is the approximate amount in rupiah, average in a month, of income earned by the person above ?
(IF THE RESPONDENT DOES NOT KNOW AT ALL, ASK THE OTHER HOUSEHOLD MEMBER WHO HAS THE KNOWLEDGE).
71. In the last three months, did your household get remittances from people living outside the household, for example, remittances from children or relatives who work in the city, overseas, etc. ?
72. SHOW DROP CARD U. If Yes, what was the approximate amount in rupiah of remittances received in a month?
(IF RESPONDENT DOES NOT KNOW AT ALL, ASK OTHER HOUSEHOLD MEMBER WHO HAS THE KNOWLEDGE).
73. In the last three months, did your household remit money to other parties outside this household ?
74. SHOW DROP CARD U. If Yes, what was the approximate amount in rupiah of the remittances sent in a month ?
(IF RESPONDENT DOES NOT KNOW AT ALL, ASK OTHER HOUSEHOLD MEMBER WHO HAS THE KNOWLEDGE).
1. Below 200 thousand
2. 200-399 thousand
3. 400-599 thousand
4. 600-799 thousand
5. 800-999 thousand
6. 1 million -1.199 million
1. Below 200 thousand
2. 200-399 thousand
3. 400-599 thousand
4. 600-799 thousand
5. 800-999 thousand
6. 1 million -1.199 million
1. Below 200 thousand
2. 200-399 thousand
3. 400-599 thousand
4. 600-799 thousand
5. 800-999 thousand
6. 1 million -1.199 million
7. 1.2-1.399 million
8. 1.4-1.599 million
9. 1.6-1.799 million
10. 1.8-1.999 million
11. 2 million – 4 million
12. Above 4 million
7. 1.2-1.399 million
8. 1.4-1.599 million
9. 1.6-1.799 million
10. 1.8-1.999 million
11. 2 million – 4 million
12. Above 4 million
7. 1.2-1.399 million
8. 1.4-1.599 million
9. 1.6-1.799 million
10. 1.8-1.999 million
11. 2 million – 4 million
12. Above 4 million
1. Yes
1. Yes
2. No → go directly to No. 73
2. No → go directly to No. 73
THANK YOU VERY MUCHFOR YOUR COOPERATION
ANNEX A

41 NOVEMBER 2015
NATIONAL SURVEY INSTRUMENT COMMUNITY SOCIAL ISSUES
Interviewer Evaluation
W1. Interviews completed at : ...........................................................................................................................................................................................................................
W2. Is respondent literate ?
X. Was respondent checked/monitored via telephone by Area Coordinator/assistant ?
Y. Is there any cellular phone signal around the area of respondent’s house ? (CHECK YOUR HANDPHONE, AND FIND OUT INFORMATION ON OTHER CELLULAR TELECOMMUNICATION PROVIDERS TO RESPONDENT OR PEOPLE AROUND THE AREA).
Y1. Was interview conducted in Bahasa Indonesia or other language ?
Y2. Was there anyone else present in the interview ?
Y3. Who was the other person ? (ANSWER CAN BE MORE THAN ONE)
Y4. Was the other person intervened the interview process ?
Y5. Was the respondent willing to cooperate in this interview ?
Y6. Was the respondent willing to cooperate in this interview ?
1. Yes
1. Yes
1. Yes
2. No
2. No → go directly to Y5
2. No
1. There is Telkomsel signal
2. There is Indosat signal
9. Others cellular phone signal,
please specify ..................................................
88. No signal at all
1. Bahasa Indonesia
2. Other language
1. No
2. Yes, but a little
1. Very less
2. Less willing
3. Mixed (Bahasa Indonesia & other language)
3. Yes, alot
3. Yes, quite
4. Yes, very much
1. Husband/wife/parents/other household
member in the same household
2. Neighbor
3. Village o�cials (Head of Village or
Urban Village Head/Secretary of the
village/Neighborhood Association/
Community Association)
4. Others, ............................................................................................................................................................
1. Yes, almost all questions
2. Yes, most of them
3. Yes, about half of them
4. Yes, about one quarter of them
5. Yes, about 10%
6. Yes, but less than 10%
7. Almost all of them can be understood well
ANNEX A

42 NOVEMBER 2015
NATIONAL SURVEY INSTRUMENT COMMUNITY SOCIAL ISSUES
Y7. What was the most difficult question understood by respondent ? .............................................................................................................................................
Y8. According to your assessment, how trustworthy respondent in answering the questions ?
Z1. House of the respondent :
Z2. Area of respondent’s house (BASED ON INTERVIEWER’S ESTIMATION) :
Z3. According to interviewer’s assessment, how was the condition of the respondent’s house ?
Z4. Does respondent own a car ?
Z6. Sources of information of original respondent who could not be interviewed :
Z7. House of the respondent : ............................................................................................................................................................................................................................
1. Very less
2. Less willing
3. Yes, quite
4. Yes, very much
1. Housing complex 2. Not housing complex
1. <= 10 m2
2. 11-20 m2
3. 21-30 m2
4. 31- 40 m2
5. 41-50 m2
6. 51-60 m2
7. 61-70 m2
8. 71-80 m2
9. 81-90 m2
10. 91-100 m2
11. 101-110 m2
12. 111-120 m2
13. 121-130 m2
14. 131-140 m2
15. 141-150 m2
16. 151-160 m2
17. 161-170 m2
18. 171-180 m2
19. 181-190 m2
20. 191-200 m2
21. 201-250 m2
22. 251-300 m2
23. 301-400 m2
24. 401-500 m2
25. 500-700 m2
1. Luxurious
2. Quite luxurious
3. Moderate
4. Quite simple
5. Simple
1. Yes 2. No
Identity of The Original Respondent Who Cannot Be Interviewed
1. Family member
2. There is Indosat signal
3. Neighbor
9. Others : ....................................................................
ANNEX A

43 NOVEMBER 2015
NATIONAL SURVEY INSTRUMENT COMMUNITY SOCIAL ISSUES
Z8. Telephone of information source : ..............................................................................................................................................................................................................
Z9. Name of the head of household (KK ) of original respondent : ..........................................................................................................................................................
Z10. Name of original respondent who should have been interviewed : ...............................................................................................................................................
Z11. Gender of original respondent :
Z12. Age of original respondent : ............................................................................................................................................................................................................Years
Z13. Ethnic group of original respondent :
Z14. Religion of original respondent :
Z15. Education of original respondent :
1. Male 2. Female
1. Javanese
2. Sundanese
3. Malay
4. Madurese
5. Bugis
6. Betawi
7. Batak
1. Islam
2. Protestantism
3. Catholicism
4. Hinduism
8. Minang
9. Banten
10. Balinese
11. Cirebon
12. Chinese
13. Others : .................................................................
5. Buddhism
6. Confucianism
7. Others : ....................................................................
1. Never went to school
2. Not completed elementary school/
equivalent
3. Elementary school/equivalent
4. Not completed junior high school/equivalent
5. Junior high school/equivalent
6. Not completed high school/equivalent
7. High school/equivalent
8. Not completed college or university/still a student
9. College
10. University or higher
ANNEX A

44 NOVEMBER 2015
NATIONAL SURVEY INSTRUMENT COMMUNITY SOCIAL ISSUES
Z16. Occupation of original respondent :
Z17. Reasons original respondent could not be interviewed :
Z18. House of respondent :
Z19. Area of respondent’s house (BASED ON INTERVIEWER’S ESTIMATION) :
Z20. According to interviewer’s assessment, how is the condition of respondent’s house ?
Z21. Does the respondent seem to have a car ?
1. Farmer
2. Breeder
3. Fisherman
4. Laborer/helper
5. Workshop/service
6. Driver/motorcycle taxi driver
7. Security guard/civil defense (hansip)
8. No permanent job
9. Stall merchant/street vendor
10. Large trader/wholesaler
11. Small entrepeneur
1. < 10 m2
2. 11-20 m2
3. 21-30 m2
4. 31- 40 m2
5. 41-50 m2
6. 51-60 m2
7. 61-70 m2
8. 71-80 m2
9. 81-90 m2
10. 91-100 m2
11. 101-110 m2
12. 111-120 m2
13. 121-130 m2
14. 131-140 m2
12. Business/large contractor
13. Village/urban village o�cial
14. Employee/private sector employee
15. Civil servant (PNS)
16. Teacher/lecturer
17. Pro�esional (lawyer/doctor/etc.)
18. Retired
19. Student/still in college
20. Housewife
21. Unable to find work
22. Others, please specify : ..................................
15. 141-150 m2
16. 151-160 m2
17. 161-170 m2
18. 171-180 m2
19. 181-190 m2
20. 191-200 m2
21. 201-250 m2
22. 251-300 m2
23. 301-400 m2
24. 401-500 m2
25. 500-700 m2
26. 701-1000 m2
27. > 1000 m2
1. Refused to be interviewed
2. Too old
3. Illness
4. Away for school outside survey area
1. Luxurious
2. Quite luxurious
3. Moderate
5. Away for work outside survey area
6. Others : ...................................................................
4. Quite simple
5. Simple
1. Housing complex 2. Not housing complex
1. Yes 2. No
ANNEX A

45 NOVEMBER 2015
NATIONAL SURVEY INSTRUMENT COMMUNITY SOCIAL ISSUES
AA1. Gender of original respondent :
AA2. Age of original respondent :
AA3. Ethnic group of original respondent :
AA4. Religion of original respondent :
AA5. Education of original respondent :
AA6. Occupation of original respondent :
AA7. House of original respondent :
AA8. Area of original respondent’s house :
Profile of Original Repondent Who Could Not Be Interviewed As a Reference For Respondent Substitution
SURVEYOR GUIDELINES : Copy the answers of questions Z11-Z19 to the multiple choice questions AA1-AA8 below
1. Male
1. Islam
1. Housing complex
2. Female
2. Others
2. Not housing complex
1. Below 25 years
2. 25-40 years
1. Elementary school or below (for answer
codes 1-3 on question Z15)
2. Junior high school or High school
(for answer codes 4-7 on question Z15)
1. Elementary school or below (for answer
codes 1-3 on question Z15)
2. Junior high school or High school (for
answer codes 4-7 on question Z15)
1. < 50 m2
(for answer codes 1-5 on question Z19)
1. Javanese
2. Sundanese
3. 41-55 years
4. Above 55 years
3. College (for answer codes 8-10 on question Z15)
3. College (for answer codes 8-10 on question Z15)
2. > 50 m2
(for answer codes 6-27 on question Z19)
3. Others
ANNEX A

46 NOVEMBER 2015ANNEX B
Annex B. Survey Sample Demographics
CATEGORIES % IN SAMPLE % NAT’L ADULT
POPULATION
GENDER Male 50.0 50.1
Female 50.0 49.9
DOMICILE Rural 51.0 50.2
Urban 49.0 49.8
RELIGION Islam 89.9 87.3
Catholic/Protestant 8.1 9.8
Other 2.0 3.0
PROVINCE NAD 1.9 1.9
North Sumatra 5.2 5.5
West Sumatra 1.9 2.0
Riau 2.3 2.3
Jambi 1.3 1.3
South Sumatra 2.9 3.1
Bengkulu 0.6 0.7
Lampung 3.2 3.2
Bangka Belitung 0.6 0.5
Riau Islands 0.6 0.7
DKI Jakarta 3.9 4.0
West Java 17.5 18.1
Central Java 14.6 13.6
Yogyakarta 1.3 1.5
East Java 15.9 15.8
Banten 4.3 4.5
Bali 1.6 1.6
NTB 1.9 1.9
NTT 1.9 2.0
West Kalimantan 1.9 1.8
Central Kalimantan 1.0 0.9
South Kalimantan 1.6 1.5
East Kalimantan 1.6 1.5
North Sulawesi 1.0 1.0
Central Sulawesi 1.0 1.1
South Sulawesi 3.6 3.4
Southeast Sulawesi 1.0 0.9
Gorontalo 0.3 0.4
West Sulawesi 0.3 0.5
Maluku 0.6 0.6
North Maluku 0.3 0.4
Papua 1.6 1.2
West Papua 0.3 0.3
NATIONAL SURVEY INSTRUMENT COMMUNITY SOCIAL ISSUES

47 NOVEMBER 2015
Age Distribution
Age Grouping In Analysis
Age groups
“What is your current age ?”
150
100
50
0
20% 40% 60% 80% 100%
The age groups below were chosen for two reasons:
1. No a priori assumptions about particular age thresholds that a� ect perceptions about inequality;
2. Maintaining roughly equal group sizes.
1000
900
800
700
600
500
400
300
200
100
0
17 - 30 31 - 40 41 - 50 51+
ANNEX B
NATIONAL SURVEY INSTRUMENT COMMUNITY SOCIAL ISSUES
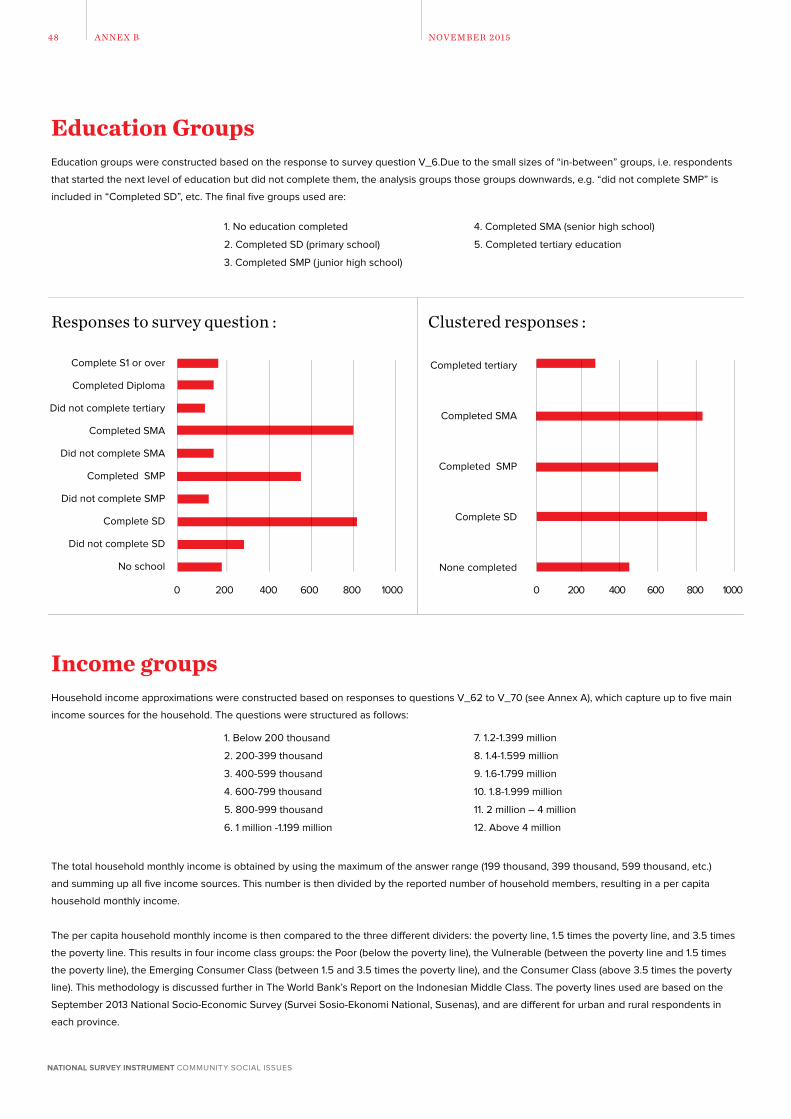
48 NOVEMBER 2015
Education Groups
Income groups
Education groups were constructed based on the response to survey question V_6.Due to the small sizes of “in-between” groups, i.e. respondents
that started the next level of education but did not complete them, the analysis groups those groups downwards, e.g. “did not complete SMP” is
included in “Completed SD”, etc. The fi nal fi ve groups used are:
Household income approximations were constructed based on responses to questions V_62 to V_70 (see Annex A), which capture up to fi ve main
income sources for the household. The questions were structured as follows:
1. No education completed
2. Completed SD (primary school)
3. Completed SMP ( junior high school)
4. Completed SMA (senior high school)
5. Completed tertiary education
Responses to survey question : Clustered responses :
Complete S1 or over
Completed Diploma
Did not complete tertiary
Completed SMA
Did not complete SMA
Completed SMP
Did not complete SMP
Complete SD
Did not complete SD
No school
Completed tertiary
Completed SMA
Completed SMP
Complete SD
None completed
0 200 400 600 800 1000 0 200 400 600 800 1000
1. Below 200 thousand
2. 200-399 thousand
3. 400-599 thousand
4. 600-799 thousand
5. 800-999 thousand
6. 1 million -1.199 million
7. 1.2-1.399 million
8. 1.4-1.599 million
9. 1.6-1.799 million
10. 1.8-1.999 million
11. 2 million – 4 million
12. Above 4 million
The total household monthly income is obtained by using the maximum of the answer range (199 thousand, 399 thousand, 599 thousand, etc.)
and summing up all fi ve income sources. This number is then divided by the reported number of household members, resulting in a per capita
household monthly income.
The per capita household monthly income is then compared to the three di� erent dividers: the poverty line, 1.5 times the poverty line, and 3.5 times
the poverty line. This results in four income class groups: the Poor (below the poverty line), the Vulnerable (between the poverty line and 1.5 times
the poverty line), the Emerging Consumer Class (between 1.5 and 3.5 times the poverty line), and the Consumer Class (above 3.5 times the poverty
line). This methodology is discussed further in The World Bank’s Report on the Indonesian Middle Class. The poverty lines used are based on the
September 2013 National Socio-Economic Survey (Survei Sosio-Ekonomi National, Susenas), and are di� erent for urban and rural respondents in
each province.
ANNEX B
NATIONAL SURVEY INSTRUMENT COMMUNITY SOCIAL ISSUES
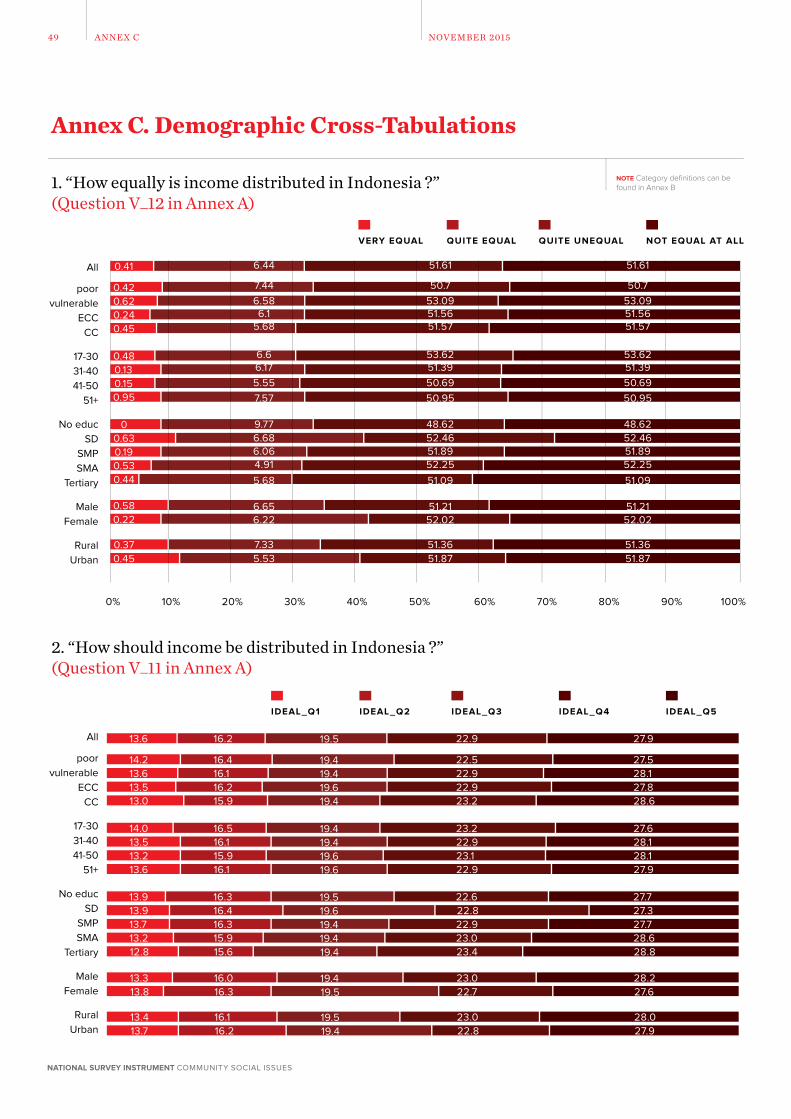
0.41
0.420.620.240.45
0.48
0
0.13
0.63
0.15
0.19
0.95
0.53
0.58
0.37
0.44
0.22
0.45
49 NOVEMBER 2015ANNEX C
Annex C. Demographic Cross-Tabulations
NOTE Category defi nitions can be found in Annex B1. “How equally is income distributed in Indonesia ?”
(Question V_12 in Annex A)
2. “How should income be distributed in Indonesia ?” (Question V_11 in Annex A)
VERY EQUAL
IDEAL_Q1
QUITE EQUAL
IDEAL_Q2
QUITE UNEQUAL
IDEAL_Q3
NOT EQUAL AT ALL
IDEAL_Q4 IDEAL_Q5
All
poorvulnerable
ECCCC
17-3031-4041-50
51+
No educSD
SMPSMA
Tertiary
MaleFemale
RuralUrban
All
poorvulnerable
ECCCC
17-3031-4041-50
51+
No educSD
SMPSMA
Tertiary
MaleFemale
RuralUrban
16.213.6
16.414.216.113.616.213.515.913.0
16.514.0
16.313.9
16.113.5
16.413.9
15.913.2
16.313.7
16.113.6
15.913.2
16.013.3
16.113.4
15.612.8
16.313.8
16.213.7
19.5
19.419.419.619.4
19.4
19.5
19.4
19.6
19.6
19.4
19.6
19.4
19.4
19.5
19.4
19.5
19.4
22.9
22.522.922.923.2
23.2
22.6
22.9
22.8
23.1
22.9
22.9
23.0
23.0
23.0
23.4
22.7
22.8
27.9
27.528.127.828.6
27.6
27.7
28.1
27.3
28.1
27.7
27.9
28.6
28.2
28.0
28.8
27.6
27.9
6.44
7.446.586.1
5.68
6.66.175.557.57
9.776.686.064.91
5.68
6.656.22
7.335.53
51.61
50.753.0951.5651.57
53.6251.3950.6950.95
48.6252.4651.8952.25
51.09
51.2152.02
51.3651.87
51.61
50.753.0951.5651.57
53.6251.3950.6950.95
48.6252.4651.8952.25
51.09
51.2152.02
51.3651.87
NATIONAL SURVEY INSTRUMENT COMMUNITY SOCIAL ISSUES
0% 10% 20% 30% 40% 50% 60% 70% 80% 90% 100%

50 NOVEMBER 2015ANNEX C
3. If you had the ability to divide national income among five groups, which of the images below is the best one ? (Question V_12 in Annex A)
Share of income
Share of income
Share of income
Share of income
Share of income
Gro
upG
roup
Gro
upG
roup
Gro
up
0 10 20 30 40 50 60 70 80 90 100
0 10 20 30 40 50 60 70 80 90 100
0 10 20 30 40 50 60 70 80 90 100
0 10 20 30 40 50 60 70 80 90 100
0 10 20 30 40 50 60 70 80 90 100
Richest
4
3
2
Poorest
Richest
4
3
2
Poorest
Richest
4
3
2
Poorest
Richest
4
3
2
Poorest
Richest
4
3
2
Poorest
A
B
C
D
E
NATIONAL SURVEY INSTRUMENT COMMUNITY SOCIAL ISSUES

57.7
50.1
55.7
61.4
62.4
53.9
58.6
59.3
58.5
53.5
52.3
57.2
63.3
64.6
60.1
55.1
54.5
60.9
40.4
47.2
42.6
37.3
35.6
43.6
39.4
39.4
39.4
44.3
45.8
41.0
35.1
32.3
37.9
43.1
43.3
37.5
1.8
2.5
1.7
1.4
1.8
2.5
1.8
1.3
1.9
2.2
1.9
1.7
1.5
2.7
1.9
1.8
2.2
1.5
2
1
0
0
1
0
1
0
1
0
0
0
1
1
2
0
0
2
51 NOVEMBER 2015
B C D E
All
poor
vulnerable
ECC
CC
17-30
31-40
41-50
51+
No educ
SD
SMP
SMA
Tertiary
Male
Female
Rural
Urban
4. “How urgent is it for government to reduce inequality ?” (Question V_37 in Annex A)
VERY URGENT QUITE URGENT NOT VERY URGENT NOT URGENT AT ALL
100%
90%
80%
70%
60%
50%
40%
30%
20%
10%
0
All
Po
or
vuln
era
b
EC
C
CC
17-3
0
31-4
0
41-5
0
51+
No
ed
uc SD
SM
P
SM
A
Tert
iary
Mal
e
Fem
ale
Rur
al
Urb
an
ANNEX C
NATIONAL SURVEY INSTRUMENT COMMUNITY SOCIAL ISSUES
0% 10% 20% 30% 40% 50% 60% 70% 80% 90% 100%

All
Po
or
vuln
era
b
EC
C
CC
17-3
0
31-4
0
41-5
0
51+
No
ed
uc SD
SM
P
SM
A
Tert
iary
Mal
e
Fem
ale
Rur
al
Urb
an
All
Po
or
vuln
era
b
EC
C
CC
17-3
0
31-4
0
41-5
0
51+
No
ed
uc SD
SM
P
SM
A
Tert
iary
Mal
e
Fem
ale
Rur
al
Urb
an
52 NOVEMBER 2015
5. “Which of these scenarios do you favor more ?” (Question V_36 in Annex A)
ANNEX C
HIGH GROWTH, HIGH INEQUALITY
LOW GROWTH, LOW INEQUALITY
All
poorvulnerab
ECCCC
17-3031-4041-50
51+
No educSD
SMPSMA
Tertiary
MaleFemale
RuralUrban
0% 10% 20% 30% 40% 50% 60% 70% 80% 90% 100%
6. Is “this policy” one of the three most important for reducing inequality ? (V_42, V_43, V_44)
Soc
ial p
rote
ctio
n pr
ogra
mV
illag
e gr
ants
60
50
40
30
20
10
0
12
10
8
6
4
2
0
NATIONAL SURVEY INSTRUMENT COMMUNITY SOCIAL ISSUES

53 NOVEMBER 2015
All
Po
or
vuln
era
b
EC
C
CC
17-3
0
31-4
0
41-5
0
51+
No
ed
uc SD
SM
P
SM
A
Tert
iary
Mal
e
Fem
ale
Rur
al
Urb
an
All
Po
or
vuln
era
b
EC
C
CC
17-3
0
31-4
0
41-5
0
51+
No
ed
uc SD
SM
P
SM
A
Tert
iary
Mal
e
Fem
ale
Rur
al
Urb
an
Free
ed
ucat
iona
l fo
r al
l
Free
he
alth
care
for
all
Rai
se te
xt o
n th
e re
ach
40
35
30
25
20
15
10
5
0
25
20
15
10
5
0
All
Po
or
vuln
era
b
EC
C
CC
17-3
0
31-4
0
41-5
0
51+
No
ed
uc SD
SM
P
SM
A
Tert
iary
Mal
e
Fem
ale
Rur
al
Urb
an
All
Po
or
vuln
era
b
EC
C
CC
17-3
0
31-4
0
41-5
0
51+
No
ed
uc SD
SM
P
SM
A
Tert
iary
Mal
e
Fem
ale
Rur
al
Urb
an
Bet
erIn
fras
truc
ture
18
16
14
12
10
8
6
4
2
0
ANNEX C
6
5
4
3
2
1
0
NATIONAL SURVEY INSTRUMENT COMMUNITY SOCIAL ISSUES

54 NOVEMBER 2015
All
Po
or
vuln
era
b
EC
C
CC
17-3
0
31-4
0
41-5
0
51+
No
ed
uc SD
SM
P
SM
A
Tert
iary
Mal
e
Fem
ale
Rur
al
Urb
an
All
Po
or
vuln
era
b
EC
C
CC
17-3
0
31-4
0
41-5
0
51+
No
ed
uc SD
SM
P
SM
A
Tert
iary
Mal
e
Fem
ale
Rur
al
Urb
an
All
Po
or
vuln
era
b
EC
C
CC
17-3
0
31-4
0
41-5
0
51+
No
ed
uc SD
SM
P
SM
A
Tert
iary
Mal
e
Fem
ale
Rur
al
Urb
an
Erad
icat
eco
rrup
tion
Rai
se
the
min
imum
w
age
Fair
owne
rshi
p of
pu
blic
ass
ets
60
50
40
30
20
10
0
30
25
20
15
10
5
0
4321
0
ANNEX C
All
Po
or
vuln
era
b
EC
C
CC
17-3
0
31-4
0
41-5
0
51+
No
ed
uc SD
SM
P
SM
A
Tert
iary
Mal
e
Fem
ale
Rur
al
Urb
an
Impr
ove
qua
lity
of s
choo
ls
12
10
8
6
4
2
0
All
Po
or
vuln
era
b
EC
C
CC
17-3
0
31-4
0
41-5
0
51+
No
ed
uc SD
SM
P
SM
A
Tert
iary
Mal
e
Fem
ale
Rur
al
Urb
an
Incr
ease
sub
sidi
es
18
16
14
12
10
8
6
4
2
0
NATIONAL SURVEY INSTRUMENT COMMUNITY SOCIAL ISSUES

55 NOVEMBER 2015
All
Po
or
vuln
era
b
EC
C
CC
17-3
0
31-4
0
41-5
0
51+
No
ed
uc SD
SM
P
SM
A
Tert
iary
Mal
e
Fem
ale
Rur
al
Urb
an
Cre
ate
mor
e jo
bs
60
50
40
30
20
10
0
All
Po
or
vuln
era
b
EC
C
CC
17-3
0
31-4
0
41-5
0
51+
No
ed
uc SD
SM
P
SM
A
Tert
iary
Mal
e
Fem
ale
Rur
al
Urb
an
Une
mpl
oym
ent
insu
ranc
e
5
4
3
2
1
0
All
Po
or
vuln
era
b
EC
C
CC
17-3
0
31-4
0
41-5
0
51+
No
ed
uc SD
SM
P
SM
A
Tert
iary
Mal
e
Fem
ale
Rur
al
Urb
an
Cre
dit f
or s
mal
l bu
sine
sses
35
30
25
20
15
10
5
0
ANNEX C
NATIONAL SURVEY INSTRUMENT COMMUNITY SOCIAL ISSUES
All
Po
or
vuln
era
b
EC
C
CC
17-3
0
31-4
0
41-5
0
51+
No
ed
uc SD
SM
P
SM
A
Tert
iary
Mal
e
Fem
ale
Rur
al
Urb
an
Non
bus
ines
s lo
ans
for
the
poor
12
10
8
6
4
2
0