public design and fast models of the two 15mw floater
TRANSCRIPT

corewind.eu
Public design and FAST
models of the two 15MW
floater-turbine concepts
USTUTT/UPC/COBRA/ESTYCO/DTU
April 2020
corewind Public design and FAST models of the two 15MW floater-turbine concepts 2
Document information
Deliverable number D1.3
Deliverable name Public design and FAST models of the two 15MW floater-turbine concepts
Reviewed by V. Arramounet (Innosea), Friedemann Borisade (RAMBOLL)
Date 04.2020
Work Package and Task
1.3
Lead Beneficiary for this Deliverable
USTUTT
Authors
Name Organisation E-mail
Mohammad Youssef Mahfouz USTUTT [email protected]
Mohammad Salari USTUTT [email protected]
Sergio Hernández ESTEYCO [email protected]
Fernando Vigara ESTEYCO [email protected]
Climent Molins UPC [email protected]
Pau Trubat UPC [email protected]
Henrik Bredmose DTU [email protected]
Antonio Pegalajar-Jurado DTU [email protected]
Version control
Version Date Author Description of Changes
Version 2 [2020-04-29] Mohammad Youssef Mahfouz Refinements and quality check
Version 1 [2020-04-08] Mohammad Youssef Mahfouz
corewind Public design and FAST models of the two 15MW floater-turbine concepts 3
Table of contents
Executive Summary ................................................................................................................................................ 6
1 Introduction and objective ............................................................................................................................ 7
1.1 Introduction .......................................................................................................................................... 7
1.2 Objective ............................................................................................................................................... 7
2 Reference wind turbine ................................................................................................................................. 7
2.1 Wind turbine ......................................................................................................................................... 7
2.2 Controller .............................................................................................................................................. 8
2.3 Model accessibility ................................................................................................................................ 9
3 Modelling approach ....................................................................................................................................... 9
3.1 Approach for hydrodynamic modelling ................................................................................................ 9
3.1.1 First-order hydrodynamic loads ........................................................................................................ 9
3.1.2 Viscous effects .................................................................................................................................. 9
3.1.3 Second-order hydrodynamic loads ................................................................................................. 10
3.2 Approach for mooring lines modelling................................................................................................ 10
4 Load cases selection..................................................................................................................................... 10
4.1 Excursion and acceleration limits ........................................................................................................ 10
4.2 Models preliminary verification .......................................................................................................... 11
4.3 Load cases for mooring design ............................................................................................................ 12
5 WindCrete spar floater FAST model ............................................................................................................ 13
5.1 Platform design ................................................................................................................................... 13
5.2 FAST model ......................................................................................................................................... 15
5.2.1 Tower .............................................................................................................................................. 16
5.2.2 Substructure ................................................................................................................................... 17
5.3 Hydrodynamic model .......................................................................................................................... 17
5.3.1 First order hydrodynamics .............................................................................................................. 17
5.3.2 Radiation solution ........................................................................................................................... 18
5.3.3 Viscous forces ................................................................................................................................. 20
5.3.4 Second order forces ........................................................................................................................ 20
5.4 Mooring line model ............................................................................................................................. 21
5.5 Controller adaptation .......................................................................................................................... 23
5.6 Simulation results ................................................................................................................................ 24
5.6.1 Static Equilibrium ............................................................................................................................ 24
5.6.2 Free Decays ..................................................................................................................................... 25

corewind Public design and FAST models of the two 15MW floater-turbine concepts 4
5.6.3 Step Wind ....................................................................................................................................... 26
5.6.4 Regular waves ................................................................................................................................. 27
5.6.5 Extreme turbulence wind and stochastic waves (DLC 1.3) ............................................................. 29
5.6.6 Normal turbulence wind and extreme stochastic waves (DLC 1.6) ................................................ 32
5.6.7 Power production with grid loss (DLC 2.1) ..................................................................................... 35
5.6.8 Parked turbine in 50-years extreme wind and waves (DLC 6.1) ..................................................... 37
6 ActiveFloat floater ....................................................................................................................................... 40
6.1 Platform design ................................................................................................................................... 40
6.1.1 Ballast system ................................................................................................................................. 43
6.1.2 Active ballast system ...................................................................................................................... 45
6.2 Tower model ....................................................................................................................................... 45
6.3 Hydrodynamic model .......................................................................................................................... 46
6.3.1 First order hydrodynamics .............................................................................................................. 46
6.3.2 Radiation hydrodynamics ............................................................................................................... 46
6.3.3 Viscous forces ................................................................................................................................. 48
6.3.4 Second order forces ........................................................................................................................ 52
6.4 Mooring line model ............................................................................................................................. 53
6.5 Controller adaptation .......................................................................................................................... 53
6.6 System Identification .......................................................................................................................... 53
6.6.1 Static Equilibrium ............................................................................................................................ 53
6.6.2 Free Decays ..................................................................................................................................... 54
6.6.3 Step Wind ....................................................................................................................................... 55
6.6.4 Regular waves ................................................................................................................................. 56
6.6.5 Extreme turbulence wind and stochastic waves (DLC 1.3) ............................................................. 57
6.6.6 Normal turbulence wind and extreme stochastic waves (DLC 1.6) ................................................ 62
6.6.7 Power production with grid loss (DLC 2.1) ..................................................................................... 64
6.6.8 Parked turbine in 50-years extreme wind and waves (DLC 6.1) ..................................................... 66
7 Models accessibility ..................................................................................................................................... 68
8 Conclusion .................................................................................................................................................... 68
9 References ................................................................................................................................................... 70
10 Appendix ...................................................................................................................................................... 72
10.1 WindCrete ........................................................................................................................................... 72
10.1.1 Extreme turbulence wind and stochastic waves (DLC 1.3) ......................................................... 72
10.1.2 Normal turbulence wind and extreme stochastic waves (DLC 1.6) ............................................ 78
10.2 ActiveFloat .......................................................................................................................................... 84

corewind Public design and FAST models of the two 15MW floater-turbine concepts 5
10.2.1 Extreme turbulence wind and stochastic waves (DLC 1.3) ......................................................... 84
10.2.2 Normal turbulence wind and extreme stochastic waves (DLC 1.6) ............................................ 92
corewind Public design and FAST models of the two 15MW floater-turbine concepts 6
Executive Summary We present two floating OpenFAST models for the WindCrete spar and the ActiveFloat semi-submersible. The
floaters are designed for the IEA Wind 15MW reference wind turbine. Moreover, Ultimate Limit State (ULS) load
cases are selected for the mooring and dynamic cable design in COREWIND.
Both floaters and the changes needed in the numerical models to couple the floaters and the turbine are
introduced. This includes the mooring system and the modified wind turbine control settings. The detailed
structure of both models is explained, including hydrodynamics, mooring system, tower and modifications to
the controller properties.
A preliminary verification of the models is done and the results are shown. The simulated responses are as
expected and generally within the design limitations. The load cases include static offsets checks, natural
frequencies, a step wind test and a subset of the IEC design load cases (1.3, 1.6, 2.1 and 6.1). The load cases are
used to check the controller performance, as well as to check the dynamic response of the models in normal
and severe environmental conditions. The OpenFAST models of both floaters will be available for free public
download.

corewind Public design and FAST models of the two 15MW floater-turbine concepts 7
1 Introduction and objective
1.1 Introduction This report introduces two new floating wind turbine configurations, both based on the new IEA Wind 15 MW
reference wind turbine. The two floaters are a spar and a semi-submersible. The report is structured in the
following way: First the new 15 MW turbine is introduced. Then the load cases are defined. Afterwards, the
structural design and hydrodynamic properties of the spar platform, WindCrete, is introduced. Then the model
demonstration of the design is done using OpenFAST model. Afterwards, the structural design and the
hydrodynamic properties of the semi-submersible floater, Activefloat, is introduced. Finally, model
demonstration of the Activefloat is done using OpenFAST similar as for WindCrete.
1.2 Objective
The goal of this report is to create and demonstrate two OpenFAST models for 15MW floating wind turbine on
a spar and a semi-submersible floaters, and to have a preliminary verification of the models’ performance. These
models will be used afterwards through COREWIND, for optimization of mooring lines and cable to achieve the
main project’s goal of decreasing the LCOE of floating wind turbines.
2 Reference wind turbine
2.1 Wind turbine The two floater concepts developed in COREWIND have been designed to support the IEA Wind 15 MW
reference wind turbine [1, 2] shown in Figure 2-1. The key parameters of the turbine are given in Table 2-1. As
it is clear in Figure 2-1 the reference turbine is an offshore turbine on a monopile structure. This means that the
tower of the turbine will be adapted for each floater design. The tower height, tower thickness and tower mass
is different for each model. The tower properties for the floaters are defines in sections 5.2.1 and 6.2 for
WindCrete and Activefloat respectively.

corewind Public design and FAST models of the two 15MW floater-turbine concepts 8
Figure 2-1: The IEA Wind 15MW reference wind turbine (Figure adapted from [1])
Table 2-1: Key properties of the IEA Wind 15MW reference wind turbine [1]
Rated power (MW) 15 Turbine class IEC Class 1B
Cut-in wind speed (m/s) 3 Cut-out wind speed (m/s) 25
Rated wind speed (m/s) 10.59 Rated thrust (MN) 2.4
Rotor diameter (m) 240 Hub height above sea level (m) 150
Minimum rotor speed (rpm) 5.0 Maximum rotor speed (rpm) 7.56
Blade mass (t) 65 Rotor-nacelle assembly mass (t) 1017
2.2 Controller It is well known that the wind turbine controller affects the dynamics of floating offshore wind turbines.
Therefore the controller properties (such as gains) need to be designed for each floating concept to avoid the
so-called “platform pitch instability” (see, for example, [3]).
In the power production mode of the IEA Wind 15 MW wind turbine, the controller provides a combination of
variable speed generator torque control and collective blade pitch control. For below rated the variable speed
generator torque controller ensures an optimal operation to achieve the maximum power. On the other hand,
when the turbine operates at rated power or alternatively at rated torque, the collective pitch controller

corewind Public design and FAST models of the two 15MW floater-turbine concepts 9
regulates the rotor speed. In this report’s simulations, the collective pitch controller aims to make the turbine
work at constant power above rated wind speed.
The controller used here is a slightly modified version of the provided NREL Reference OpenSource Controller
(ROSCO), which can be found in [4] . The ROSCO controller uses a Bladed-style controller DISCON interface. After
compiling the controller, which is developed in Fortran, it can be configured/tuned using a single control setting
parameter file [4]. For both the variable speed (VS) torque controller and the blade pitch controller, there are
different parameters which can be set and tuned. The adopted baseline controller in [4] is originally developed
for the NREL 5 MW and the DTU 10 MW reference wind turbines for which a tuning was needed to make it
usable for the floating wind turbine. For the case of IEA Wind 15 MW, installed on WindCrete and ActiveFloat
platforms, a tuning of the Proportional Integral (PI) gains for the collective pitch controller (CPC) was enough to
achieve stability for the above rated region. Note that the PI controller for collective pitch uses a gain-scheduling
method, with collective blade pitch as the scheduling parameter, to deal with different sensitivities of
aerodynamic torque to pitch angle at different wind speeds [5].
More details on the controller adaptation for the floating wind turbine with WindCrete and ActiveFloat
platforms can be found in sections 5.5 and 6.5, respectively.
2.3 Model accessibility Further details of the IEA Wind 15 MW reference wind turbine on the monopile structure, including the
OpenFAST and HAWC2 models, are available at the IEA Wind Task 37 GitHub
https://github.com/IEAWindTask37/IEA-15-240-RWT. Details on the accessibility to the two OpenFAST models
described in this report are given in Section 7.
3 Modelling approach
The numerical models described in this report were implemented in the open-source aero-hydro-servo-elastic
tool OpenFAST v2.1 [6] For the present work, the OpenFAST bottom-fixed IEA 15 MW wind turbine has been
adapted to the two floating concepts. This means that new input files for tower, controller, hydrodynamics and
mooring system have been prepared. The reference frame used in both models uses the FAST convention
reference frames.
3.1 Approach for hydrodynamic modelling Hydrodynamic loads on the two floaters have been included as described below.
3.1.1 First-order hydrodynamic loads
When modelling a floating wind turbine in an aero-hydro-servo-elastic tool, it is common practice to compute
the hydrodynamic properties (such as radiation added mass and damping, hydrostatics and wave excitation
forces) in a radiation-diffraction solver (e.g. WAMIT [7] or ANSYS AQWA [8]). These frequency-dependent
hydrodynamic properties are typically included in the time-domain equations of motion through the Cummins
equation [9]. Further details on the radiation-diffraction theory and its coupling to OpenFAST can be found in
[10] and [11], respectively.
3.1.2 Viscous effects Viscous effects, which are not captured by potential-flow radiation-diffraction solvers, are usually included in
the numerical model by means of the drag term in the Morison equation [12]. This term, which depends on the
relative velocity between the wave particles and the floating structure, introduces both forcing and damping.
An alternative approach to model viscous effects is to replace the Morison drag term by global linear and/or

corewind Public design and FAST models of the two 15MW floater-turbine concepts 10
quadratic damping matrices lumped at the flotation point. These matrices are often obtained experimentally or
with higher-fidelity models such as computational fluid dynamics (CFD). This approach, however, neglects the
forcing part of the Morison equation. In some cases, and especially when comparing to physical test results, a
combination of Morison drag and lumped damping matrices is chosen to represent viscous effects on the floater
(see, for example, [13]).
3.1.3 Second-order hydrodynamic loads
Second-order hydrodynamic loads occur at the sum and the difference frequencies of the linear wave spectrum.
Although they are in magnitude smaller than linear loads, they are likely to excite the floater natural frequencies
and cause fatigue for some components, e.g. the mooring system. Second-order hydrodynamic effects are often
calculated in a radiation-diffraction solver in the form of Quadratic Transfer Functions (QTFs), and are coupled
to the aero-hydro-servo-elastic model through a double sum over the range of frequencies [14].
3.2 Approach for mooring lines modelling For the present models, the mooring systems are modelled with MoorDyn [15], a lumped-mass dynamic
mooring model that captures dynamic effects such as line mass inertia, buoyancy, seabed contact and
hydrodynamic forces on the line in still water. MoorDyn also allows modelling of multi-segmented mooring lines,
including clump weights and buoyancy elements.
4 Load cases selection The floating platforms are designed to fulfill the design constraints indicated in the Design Basis in [16] for the
Canary Island site.
The main characteristics of the site are presented in the following table.
Table 4-1 - Canary Island Site. Key environmental parameters
Site Environmental key parameters
Depth (m) 200.00
Vref at 135 m (m/s) 40.68
Wind speed 10-min at 135 m (m/s) 12.26
Hs (Tr=50-y) (m) 5.11
Tp (Hs=5.11 m) (s) 9.0 - 11.0
Most probable Hs (m) 1.50
4.1 Excursion and acceleration limits The excursion and acceleration limits in Table 4-2 are the limits compared to the responses shown later in
sections 5.6 and 6.6.
Table 4-2: Excursion and acceleration limits
Limit for Windcrete Activefloat
OPERATION
Yaw (10 min. max) <15º
Yaw (10 min. std) <3º
Pitch (max.) [-5.5º, +5.5º] [-5.0º, +5.0º]
Pitch (10 min. average) [-4.0º, +4.0º] [-2.0º, +2.0º]

corewind Public design and FAST models of the two 15MW floater-turbine concepts 11
Roll (max.) [-3.5º, +3.5º] [-2.0º, +2.0º]
Pitch (10 min. std) <1º
Roll (10 min. std) <1º <0.4º
IDLING CONDITION
Pitch (10 min. average) [-5º, +5º]
Pitch (10 min. max) [-7º, +7º]
EMERGENCY STOP
Max. pitch [-15º, +15º]
EXCURSION RESTRICTIONS
Horizontal offset (alarm limit) (mean during operation)
15 m
Horizontal offset (WTG shutdown). Maximum during parked conditions
30 m
ACCELERATIONS LIMITS
Operation (acc. XY / acc. Z) 2.8 m/s2 (0.28g) 1.85 m/s2 (0.18 g)
Survival (acc. XY / acc. Z) 3.5 m/s2 (0.35g) 2.94 m/s2 (0.3 g)
4.2 Models preliminary verification Representative load cases were selected to check the time and frequency domain responses of both floating systems. First, decay tests were done to identify the natural frequencies of the floaters in surge, heave, pitch and yaw platform degree of freedom. Results are checked with provided design values from the substructure designers. They are followed by free decay simulations of the tower in both fore-aft and side to side degrees of freedom, during this decay test all other degrees of freedom were not blocked. The goal is to make sure that the tower’s natural frequency is higher than the 3P frequency. Moreover, the equilibrium state of the floaters is evaluated in the absence of wind and wave. Afterwards, simulations of regular waves in the absence of wind are done. The controller performance was checked through running a step wind simulation. The step wind simulation starts at 3m/s and increases 1m/s every 200s to reach 25m/s, then decreases again 1m/s every 200s till it gets back to 3m/s. Finally, representative cases of DLCs 1.3, 1.6, 2.1, and 6.1 [17] were carried on to check the performance of the floating wind turbine at different sea states, wind turbulence and sudden grid loss.
The values for extreme wind and waves as well as the wind-wave relationships were chosen based on values
from [16] for the Gran Canaria site. The turbulence class was chosen following the turbine’s class shown in [1].
Pierson-Moskowitz spectrum is used to model the irregular waves while including the effect of second order
waves and forces at irregular sea states.
Table 4-3: Load cases used for models verification
Name Duration [s] Waves Wind [m/s] Turbine
Surge decay 1500 - - Parked
Heave decay 1500 - - Parked
Pitch decay 1500 - - Parked

corewind Public design and FAST models of the two 15MW floater-turbine concepts 12
Yaw decay 1500 - - Parked
Tower decay 1500 - - Parked
Static equilibrium 1500 - - Parked
Regular Waves 1500 Regular
Hs = 2 m, Tp = 6 s
- Parked
Step wind 9200 - Steady wind;
3-25-3 m/s
Operational
Active control
DLC1.3 5400 Irregular;
Hs=2m, Tp=6s
Turbulent ETM;
8, 10.5, 16, 20, 25 m/s
Operational
Active control
DLC1.6 5400 Irregular;
Hs=5.11m, Tp=9s
Turbulent NTM;
8, 10.5, 16, 20, 25 m/s
Operational
Active control
DLC2.1 600 Irregular;
Hs=2m, Tp=6s
Turbulent NTM;
20 m/s
Grid loss
Shutdown
control
DLC6.1 5400 Irregular;
Hs=5.11m, Tp=9s
Turbulent EWM50;
41.2 m/s
Idling
Active control
4.3 Load cases for mooring design ULS load cases are selected for the mooring and dynamic cable design within Task 2.2. DLC 6.1 and 6.2 are studied for this specific purpose as they generate large platform offsets and dynamic motions. Studied DLC characteristics are provided in Table 4-4 below.
Mooring and cable design will be done for the three sites Gran Canaria, West of Barra and Morro Bay.
Table 4-4 Load cases used for mooring & dynamic cable design
Name Wind Waves Wind & Wave
misalignment
Current Water
level
Turbine Duration
DLC 6.1 EWM turbulent
wind (TI 11%)
50 years return
period
ESS
Irregular waves
50 years return
period
6 wave seeds
-30°, 0° & 30° ECM
50 years return
period
EWLR Parked
-8°, 0 & 8° yaw
misalignment
3600s

corewind Public design and FAST models of the two 15MW floater-turbine concepts 13
DLC 6.2 EWM turbulent
wind (TI 11%)
50 years return
period
ESS
Irregular waves
50 years return
period
6 wave seeds
-30°, 0° & 30° ECM
50 years return
period
EWLR Parked
-150°, -120°, -
90°, -60°, 30°,
0°, 30°, 60°,
90°, 120°, 150°
& 180° yaw
misalignment
3600s
5 WindCrete spar floater FAST model
5.1 Platform design The design of the WindCrete platform is based on a first static predesign to assess the main platform
characteristics in order to verify the design basis. The predesign basis are to present a static pitch due to the
maximum thrust force of the turbine less than 4 deg., and the natural motions periods of the platform, in heave,
pitch and roll to have a value above 30s. Moreover, the relations of draft, diameter and thickness of the
substructure and tower ensures the structural response of the platform and the disposition of the reinforcement
steel and the posttensioning.
The hub height of the platform is adjusted to 135 m above sea level, which is lower than the IEA-15MW which
is set to 150m, according to the following constraints referred to Gran Canaria location based on IEC 61400-3-2
standard [18]: 1) Access platform to be out of the reach of the 50-years wave crest; 2) Minimum air gap of 20%
of Hs or 1.50 meters, whichever is larger; 3) Hub height to be 6 meters plus the semi-rotor diameter. The 6
meters allowance is for an operating crane located at the access platform. The tower height is 129.495 m in
order to have a hub height of 135 m.
The tower in the WindCrete design is a tapered cylinder made of concrete with a constant thickness of 0.4m.
The tower base, which is defined at the mean sea level (MSL), has a diameter of 13.2m, and the top tower
diameter of 6.5m is the same as the IEA design, to ensure the connection with the wind turbine.
The substructure consists of a tapered transition piece of 10m length, a cylindrical spar of 135.7m length and a
hemisphere of 9.3m radius at the bottom of the substructure. Then, the total draft of the platform is 155m. The
cylindrical spar has a diameter of 18.6m and the tapered transition piece has a top diameter of 13.2 and a bottom
diameter of 18.6m. The Figure 5-1 shows a sketch of the WindCrete with its main dimensions in meters. The
origin of the reference system used in the WindCrete description and its mooring system is set at the MSL, in
the intersection with the WindCrete axis of symmetry, that coincides with the tower base on its undisplaced
position.
The required hydrostatic stiffness in the pitch/roll degree of freedom is achieved by adding a solid aggregate
ballast at the platform keel with a bulk density of 2500 kg/m3. The internal height of the ballast is of 44.15m
from the keel. In Figure 5-1 the aggregate ballast is colored in brown.
The Table 5-1 shows the main characteristics of the WindCrete platform, including tower and substructure with
the ballast. The Table 5-2 shows the hydrostatic properties of the buoy and the expected natural periods using
approximated values of the added mass terms, the mass of a hemisphere at the bottom for the heave motion
and the inertia produced by the displaced volume for pitch/roll motion.

corewind Public design and FAST models of the two 15MW floater-turbine concepts 14
Regarding the static pitch for the rated wind, a static mean pitch of 3.2 deg is expected for a mean thrust of
2.376E+03 kN and accounting the favorable action of the center of mass of the wind turbine, which is located in
windward direction.
Table 5-1: WindCrete main properties
WindCrete Properties
Mass [kg] 3.9805e+07
Center of Mass (CM) Height [m] -98.41
Ixx [kg·m2] from CM 1.5536e+11
Iyy [kg·m2] from CM 1.5536e+11
Izz [kg·m2] from CM 1.9025e+09
Figure 5-1: WindCrete sketch (values in meters)

corewind Public design and FAST models of the two 15MW floater-turbine concepts 15
Table 5-2: WindCrete hydrostatic properties
WindCrete Hydrostatic Properties
Displacement [m3] 4.054e+04
Center of Buoyancy Height [m] -77.29
C33 [N/m] 1.3746e+06
C44 [N·m/rad] from [0;0;0] -3.1463e+10
C55 [N·m/rad] from [0;0;0] -3.1463e+10
A33 [kg] from CM 1.727e+06
A55 [kg·m2] from CM 8.964e+10
T3 [s] 35
T5 [s] 41
5.2 FAST model In order to model the WindCrete platform in FAST, the tower and the substructure have to be defined separately.
The tower base height set in the WindCrete FAST model preserves the tower base height of the monopile model
to support the IEA-15 MW reference wind turbine. However, the tower height is reduced to 129.495m as
explained in section 5.2.1. Then, in the WindCrete FAST model the lower part of the tower is included in the
substructure. The Figure 5-2 shows a sketch of the separation between the tower and substructure modeled in
FAST.
Figure 5-2: FAST Substructure and Tower (values in meters)

corewind Public design and FAST models of the two 15MW floater-turbine concepts 16
5.2.1 Tower The elastic tower model in FAST is discretized in 20 sections from the bottom to the top. The physical properties
of each node based on the tower height fraction are shown in Table 5-3. The overall stiffness of the tower
ensures a stiff-stiff behavior against the 1P and 3P rotor frequencies.
Table 5-3: Physical properties of WIndCrete Tower
Height
Fraction [u]
Tower Mass
Density [kg/m]
Tower FA
Bending
Stiffness [Nm2]
Tower SS
Bending
Stiffness [Nm2]
0 3.776194E+04 9.918269E+12 9.918269E+12
0.05 3.683203E+04 9.203955E+12 9.203955E+12
0.1 3.590212E+04 8.524801E+12 8.524801E+12
0.15 3.497221E+04 7.879919E+12 7.879919E+12
0.2 3.404230E+04 7.268423E+12 7.268423E+12
0.25 3.311239E+04 6.689423E+12 6.689423E+12
0.3 3.218248E+04 6.142033E+12 6.142033E+12
0.35 3.125256E+04 5.625365E+12 5.625365E+12
0.4 3.032265E+04 5.138531E+12 5.138531E+12
0.45 2.939274E+04 4.680643E+12 4.680643E+12
0.5 2.846283E+04 4.250814E+12 4.250814E+12
0.55 2.753292E+04 3.848156E+12 3.848156E+12
0.6 2.660301E+04 3.471781E+12 3.471781E+12
0.65 2.567310E+04 3.120801E+12 3.120801E+12
0.7 2.474318E+04 2.794330E+12 2.794330E+12
0.75 2.381327E+04 2.491478E+12 2.491478E+12
0.8 2.288336E+04 2.211359E+12 2.211359E+12
0.85 2.195345E+04 1.953085E+12 1.953085E+12
0.9 2.102354E+04 1.715768E+12 1.715768E+12
0.95 2.009363E+04 1.498520E+12 1.498520E+12
1 1.916372E+04 1.300453E+12 1.300453E+12
To compute the aerodynamics loads on the tower, its diameter is defined every 10 meters, which leads to 13
points tower discretization. Table 5-4 shows the relation with the tower elevation and the tower diameter at
each point.
Table 5-4: Aerodyn tower sections
Tower Elevation [m] Tower Diameter [m] Cd
15 12.42 1
25 11.90 1
35 11.39 1
45 10.89 1
55 10.35 1

corewind Public design and FAST models of the two 15MW floater-turbine concepts 17
65 9.83 1
75 9.32 1
85 8.80 1
95 8.28 1
105 7.77 1
115 7.25 1
125 6.73 1
129.495 6.5 1
5.2.2 Substructure
The substructure in FAST is modeled as a rigid body defined by its properties from the center of mass of the
floater. The Table 5-5 shows the properties of the FAST WindCrete substructure including the ballast.
Table 5-5: WindCrete Substructure FAST properties
WindCrete Substructure FAST properties
Total mass [kg] 3.655e+07
Concrete mass [kg] 1.148e+07
Ballast mass [kg] 2.507e+07
Center of Mass (CM) Height [m] -113.08
Ixx [kg·m2] from WindCrete Substructure CM 5.590e+10
Iyy [kg·m2] from WindCrete Substructure CM 5.590e+10
Izz [kg·m2] from WindCrete Substructure CM 1.828e+09
5.3 Hydrodynamic model
The hydrodynamics of the WindCrete spar model are inertia dominated and the potential flow (PF) theory is
applicable. Then, the PF model is applied for the wave inertia hydrodynamic forces, wave diffraction effect and
radiation. The WAMIT files, which are needed for the HydroDyn module, are derived by converting the ANSYS-
AQWA potential-flow solution outputs to WAMIT output files format. The linear potential flow problem is solved
with the platform in its equilibrium position, with a draft of 155m. The reference point is located at [0;0;0], which
is the intersection between the platform axis and the MSL.
Moreover, drag forces are applied through the Morison equation that is included to account for viscous forces.
5.3.1 First order hydrodynamics
The first order hydrodynamic waves forces are assessed through the PF solution from ANSYS-AQWA. Figure 5-3
shows the wave excitation force and moment per unit amplitude for the WindCrete. The results are presented
using the number of each degree of freedom: 1 for the x, 2 for y, 3 for z, 4 for the rotation in x, 5 for the rotation
in y and 6 for the rotation in z.

corewind Public design and FAST models of the two 15MW floater-turbine concepts 18
Figure 5-3: WindCrete first order wave excitation forces and moments computed with ANSYS-AQWA (Results for 0º wave heading direction
5.3.2 Radiation solution The radiation solution of the potential flow problem is shown in Figure 5-5 .Moreover, the added mass matrix
at infinite frequency is shown in Eq. (5.1) in kg for the ij = {11, 22 and 33} terms, in kg.m for the ij {15, 24, 51 and
42} terms and in kg.m2 for the ij = {44, 55, and 66} terms.
𝐴∞ =
[
3.7354𝑒 + 07000
−2.9637𝑒 + 090
03.7354𝑒 + 07
02.9637𝑒 + 09
00
00
1.2657𝑒 + 06000
02.9637𝑒 + 09
02.9156𝑒 + 11
00
−2.9637𝑒 + 09000
2.9156𝑒 + 110
00000
9.3145𝑒 + 01]
(5.1)

corewind Public design and FAST models of the two 15MW floater-turbine concepts 19
Figure 5-4: WindCrete hydrodynamic added mass from ANSYS-AQWA
Figure 5-5: WindCrete hydrodynamic potential damping from ANSYS-AQWA

corewind Public design and FAST models of the two 15MW floater-turbine concepts 20
5.3.3 Viscous forces The viscous forces are modelled using the drag term of the Morison equation in the FAST Hydrodyn model. The
viscous forces are applied at the transverse motion of the substructure and at the bottom of the cylinder in the
vertical motion.
The transverse drag coefficient is set to 0.7, constant in all the length of the submerged substructure. The value
of the drag coefficient is a commonly used value in the literature [19], and was obtained in the scale experiments
of the 5MW WindCrete platform [20].
The axial drag coefficient is set to 0.2 due to low resistance produced by the hemispheric bottom section. The
value is estimated from the lower bound of the drag coefficients of cylindrical bodies in axial flow with
streamlined head forms [21] as shown in Figure 5-6.
Figure 5-6: Drag coefficients for cylindrical bodies in axial flow [21]
5.3.4 Second order forces
The second order forces are related to the wave's nonlinear effects which can excite the low frequency motions
of the platform, mainly the surge and sway. These loads are proportional to the wave amplitude squared and
they are related to the effect of a pair of waves with different frequencies. An AQWA diffraction analysis can
calculate the two contributions to this type of loads, difference frequencies and sum frequencies terms.

corewind Public design and FAST models of the two 15MW floater-turbine concepts 21
Figure 5-7: Difference Quadratic Transfer unction (QTF) for wave direction = 0 deg
5.4 Mooring line model The mooring line model is a preliminary design set for the WindCrete placed in the Gran Canaria island location
in a 200m water depth. The aim of the predesign is to withstand the external forces, the wind and the waves,
and to provide enough stiffness to the system. However, the system is not verified against the ULS and FLS
because this is not the aim of this report. The mooring line system design will be optimized further through
COREWIND in Work Package 2. The mooring lines are modelled with MoorDyn FAST module.
The mooring system is designed as a three single catenary mooring shape line composed by one type of chain.
At the top of the mooring system, the lines are equipped with the crowfoot system (delta connection) to provide
enough yaw stiffness to the platform. Moreover, the mooring system is intended to avoid uplifting forces at the
anchor. The fairleads are located at a 90m depth and the radius to anchor is set to 600m. The length of the main
line is of 565m, and the length of the delta lines is of 50m. The physical properties of the chain and its
hydrodynamic coefficients are presented in Table 5-6. The position of the fairleads and the anchors for each
mooring line are shown in Table 5-7. The mooring system is designed in order to provide a stiffness to the surge

corewind Public design and FAST models of the two 15MW floater-turbine concepts 22
and yaw DOFs that ensures a surge and yaw natural periods about 80 and 10 seconds, respectively. The surge
stiffness is of 5.0523e+05 N/m and the yaw stiffness is of 5.1545e+08 N·m/rad. These stiffnesses lead to a surge
natural period of about 82 s and a yaw natural period of about 12s. The Figure 5-8 shows the surge, sway and
heave forces of the mooring system against a surge motion of the platform.
Table 5-6: Chain characteristics
Parameter Value
Nominal diameter
[mm]
160
Dry mass per meter
length [kg/m]
561.25
Stiffness EA [N] 2.3040e+09
Main line length [m] 565
Delta line length [m] 50
Table 5-7: Mooring system anchors and fairlead location
Line # Anchor coordinates [m] Fairlead coordinates[m]
X Y Z X Y Z
1 -600 0.0 -200 -4.65 8.05 -90.0
-4.65 -8.05 -90.0
2 300 -519.61 -200 -4.65 -8.05 -90.0
9.3 0.0 -90.0
3 300 519.61 -200 9.3 0.0 -90.0
-4.65 8.05 -90.0
Figure 5-8: Mooring system response against surge motion

corewind Public design and FAST models of the two 15MW floater-turbine concepts 23
5.5 Controller adaptation As it has been mentioned in the section 2.2, an adaptation of the baseline controller ROSCO [4], which is
originally developed for an onshore wind turbine, was needed for the turbine installed on a floating platform.
We started with the adaptation of the controller for the WindCrete platform to achieve stability and acceptable
performance in the entire power production regions.
We noticed that the original collective pitch PI controller failed to achieve stability for some constant wind
speeds above rated. As a first try we tuned the controller gains for the operating point corresponding to wind
speed 13 m/s. The tuning was based on the well-known Ziegler–Nichols tuning method. After tuning the gains
for this point an update of the vectors of 𝐾𝑝 and 𝐾𝐼 for other operating points is carried out. Based on the Ziegler-
Nichols method for PI controller tuning we first chose an integral gain 𝑘𝑖 equal zero, and then we increase the
proportional gain 𝑘𝑝 until we reach the ultimate gain at which the closed loop system is on its stability limit. This
can be checked by plotting the generator speed for a constant wind v0 = 13 m/s and see for which proportional
gain the generator speed oscillates stable and with constant amplitude. We then select the proportional and
integral gains for this operating point, i.e. 𝑘𝑝𝑛𝑒𝑤13 and 𝑘𝑖𝑛𝑒𝑤
13 as follows:
𝑘𝑝𝑛𝑒𝑤13 = 0.45 𝑘𝑢𝑙 = −0.2804
𝑘𝑖𝑛𝑒𝑤
13 = 0.54𝑘𝑢𝑙
𝑇= −0.0070
in which 𝑘𝑢𝑙 is the ultimate gain, and 𝑇 is the oscillation period of the generator speed at ultimate gain, see the
following plot.
Figure 5-9: Tuning the PI controller gain for the operating point corresponding to v0=13m/s using Zeigler-Nichols method

corewind Public design and FAST models of the two 15MW floater-turbine concepts 24
We then compare this obtained PI gains with the original ones at the same operating point and apply the same
scaling to all the PI gains of gain-scheduling controller for other operating points overrated:
𝑑𝑘𝑝=
𝑘𝑝𝑛𝑒𝑤13
𝑘𝑝𝑜𝑟𝑖𝑔𝑖𝑛𝑎𝑙13
𝑑𝑘𝑖=
𝑘𝑖𝑛𝑒𝑤
13
𝑘𝑖𝑜𝑟𝑖𝑔𝑖𝑛𝑎𝑙
13
𝐾𝑃𝑛𝑒𝑤= 𝑑𝑘𝑝
. 𝐾𝑝𝑜𝑟𝑖𝑔𝑖𝑛𝑎𝑙 , 𝐾𝑖𝑛𝑒𝑤
= 𝑑𝑘𝑖 . 𝐾𝑖𝑜𝑟𝑖𝑔𝑖𝑛𝑎𝑙
In the above equations, 𝑘𝑝𝑜𝑟𝑖𝑔𝑖𝑛𝑎𝑙13 and 𝑘𝑖𝑜𝑟𝑖𝑔𝑖𝑛𝑎𝑙
13 are the original proportional and integral gains corresponding to
wind speed 13 m/s and 𝑘𝑝𝑛𝑒𝑤13 and 𝑘𝑖𝑛𝑒𝑤
13 are the tuned ones as before. 𝑑𝑘𝑝 and 𝑑𝑘𝑖
are the calculated scales
which can be used to find the new vectors of PI gains 𝐾𝑃𝑛𝑒𝑤 and 𝐾𝑖𝑛𝑒𝑤
for all operating points for overrated from
the original proportional and integral vectors 𝐾𝑝𝑜𝑟𝑖𝑔𝑖𝑛𝑎𝑙 and 𝐾𝑖𝑜𝑟𝑖𝑔𝑖𝑛𝑎𝑙
. The following figures show the tuned
gains comparing to the original ones.
Figure 5-10: Tuned gains of the PI controller comparing to the original ones, scheduled over the blade pitch angle
A preliminary check for the controller performance can be seen in Figure 5-13 and Figure 6-14 for WindCrete
and ActiveFloat respectively. Here we should mention that an optimization of the controller for the entire of the
power production operating points is scheduled for the future.
5.6 Simulation results
Simulations shown in Table 4-3 are done to identify the system properties. We will show the outputs of these
simulations in the following sections for WindCrete floater.
5.6.1 Static Equilibrium
First, we ran a static equilibrium simulation to identify the offsets in heave pitch and surge in the absence of
wind and waves. The goal is to make sure that the system is balanced and the global mass and net buoyancy
match each other.
The offsets especially in pitch and surge are because the CG of the tower top mass has an offset from the tower
axis.

corewind Public design and FAST models of the two 15MW floater-turbine concepts 25
Table 5-8: Offsets of the platform in the 6 DOFs at sea water level
Surge [m] Sway [m] Heave [m] Roll [deg] Pitch [deg] Yaw [deg]
-1.01 0.0 - 0.16 0.0 -0.64 0.0
5.6.2 Free Decays We then ran decay tests for surge, heave, pitch and yaw DOFs. We managed to calculate the natural frequencies
of these DOFs and are listed in Table 5-9. For every DOF an initial displacement was introduced, and the system
was left to oscillate freely in the absence of wind and wave. The mooring lines were attached to the system
during all decay simulations.
The Figure 5-11 and Figure 5-12 show the free decay tests for the surge and heave response of the WindCrete.
In Figure 5-11 the surge motion does not follow a simple decay system because the surge motion is coupled with
the pitch motion since the platform reference node at [0,0,0] does not correspond to the center of rotations of
the platform.
Figure 5-11: Surge decay of WindCrete floater
Figure 5-12: Heave decay of WindCrete floater

corewind Public design and FAST models of the two 15MW floater-turbine concepts 26
Table 5-9: WindCrete’s natural frequencies in surge, heave, pitch and yaw
Surge Heave Pitch Yaw
Frequency [Hz] 0.01221 0.03052 0.02441 0.09155
Period [s] 81.9 32.77 40.97 10.92
Moreover, we also did tower decay test for in both side to side and fore-aft DOFs, for the floating moored
configuration. The decay test is performed by imposing an initial tower-top displacement in the ElastoDyn FAST
file of the floating WindCrete model. The goal is to check that the tower’s natural frequencies lie outside the 1P
and 3P frequencies, to avoid resonance between the tower and the blade. From [1], the 1P frequency range of
[0.0833 to 0.1260] Hz and a 3P range of [0.25 to 0.378] Hz is set as reference. The tower side to side and fore-
aft natural frequencies are shown in Table 5-10. The tower’s frequencies are outside the 1P and 3P frequencies
range.
Table 5-10: WindCrete’s tower natural frequencies (first modes)
Tower side to side [Hz] Tower fore-aft [Hz]
0.5127 0.4944
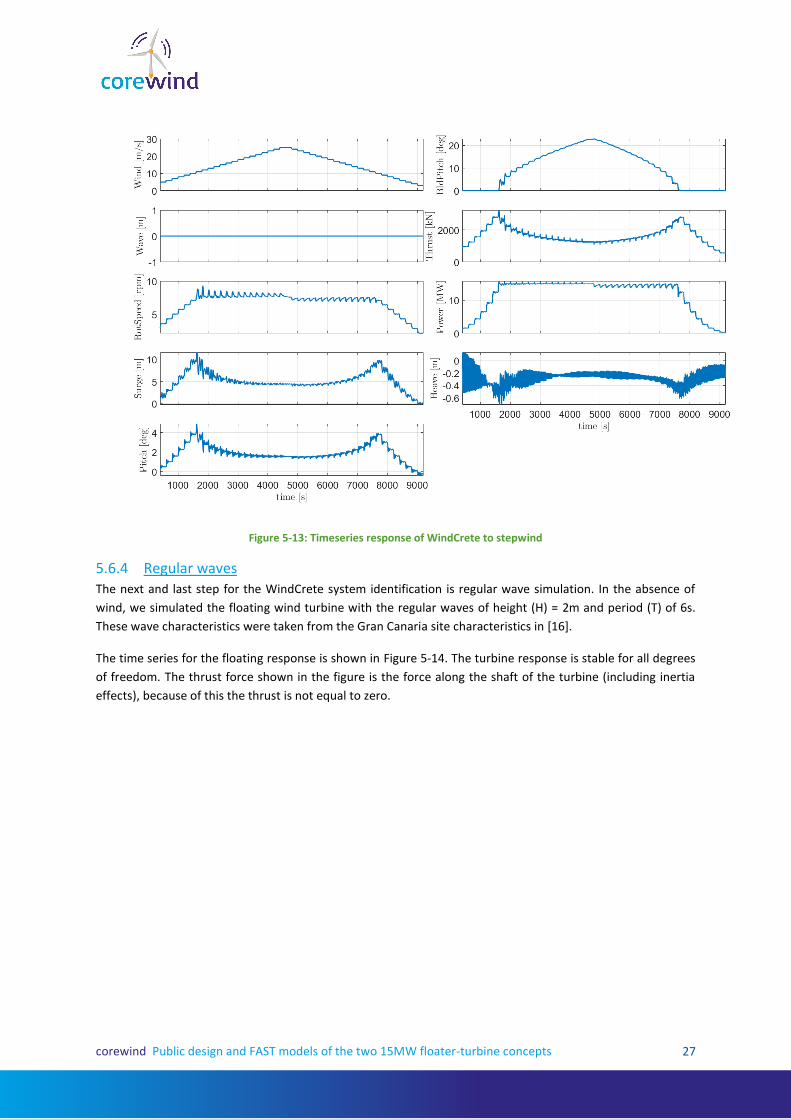
5.6.3 Step Wind We used step wind field of steady wind velocities, in the absence of waves to check the controller’s performance.
The wind field started at 3m/s and increased, with 1m/s step, till 25m/s then back to 3m/s also with 1m/s step.
The duration of the step is 200s for every wind speed.
Figure 5-13 shows that the controller is performing properly for all degrees of freedom except for heave. Every
time the wind speed increases all degrees of freedom starts oscillating with their natural frequency until they
reach the steady state. However, for heave there is a low decay ratio in the simulation. The reason for such
oscillation may be coming from the limited heave damping of the platform in the linear region for low heave
amplitudes when the movement is centimetric. Successive steps in the wind speed introduce pitch changes
which simultaneously induce variation of the vertical loads due to the thrust of the wind turbine. That excitation
is not completely damped in the 200 seconds between each wind step (that is less than 9 cycles for that
vibration).
corewind Public design and FAST models of the two 15MW floater-turbine concepts 27
Figure 5-13: Timeseries response of WindCrete to stepwind
5.6.4 Regular waves The next and last step for the WindCrete system identification is regular wave simulation. In the absence of
wind, we simulated the floating wind turbine with the regular waves of height (H) = 2m and period (T) of 6s.
These wave characteristics were taken from the Gran Canaria site characteristics in [16].
The time series for the floating response is shown in Figure 5-14. The turbine response is stable for all degrees
of freedom. The thrust force shown in the figure is the force along the shaft of the turbine (including inertia
effects), because of this the thrust is not equal to zero.

corewind Public design and FAST models of the two 15MW floater-turbine concepts 28
Figure 5-14: Timeseries response of WindCrete floater for regular waves
After checking the outputs of regular wave of H=2m and T=6s, it was surprising that the response at the wave
frequency was not very visible. Therefore, we ran simulations with Morison-based hydrodynamics and
compared them to the potential flow simulations. The goal was to check that the potential flow hydrodynamic
model was correctly included in the simulations. We ran a regular wave simulation with H=10m and T=10s, in
the absence of wind. Figure 5-15 shows the comparison, and as expected, the two models show similar
responses except for heave, where the potential flow model causes a larger response due to the low axial
hydrodynamic coefficient for the Morison-based model. We therefore concluded that the low response to
hydrodynamic loads was not related to a modelling issue, but instead to the large inertia of the physical system.

corewind Public design and FAST models of the two 15MW floater-turbine concepts 29
Figure 5-15: Comparison of the time series response of WindCrete with and without potential flow included
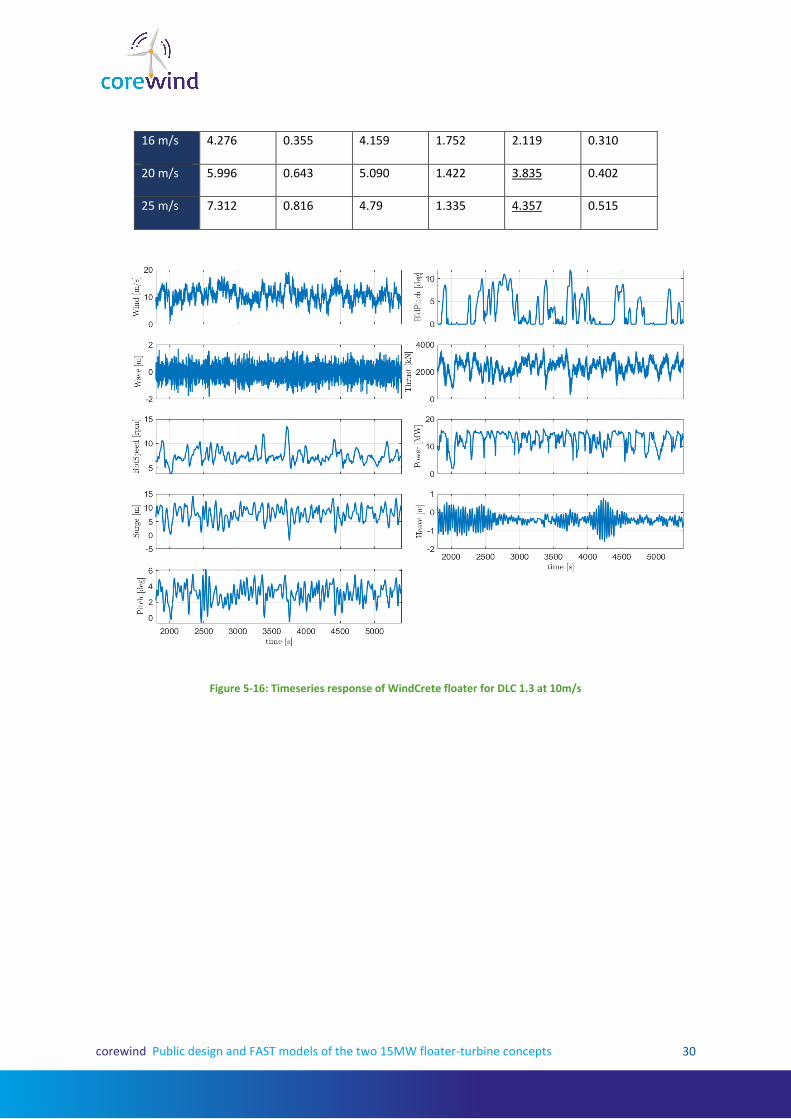
5.6.5 Extreme turbulence wind and stochastic waves (DLC 1.3) The next simulation carried out is DLC 1.3 [1], with an extreme turbulent wind field for wind speeds (8, 10.5, 16,
20, 25) m/s and stochastic wave of (Hs=2m, and Tp=6s). The first 1800s were excluded from the PSD analysis, to
make sure there are no transient conditions. The second order wave forces are taken into consideration, by
taking the difference QTF into account. We decided to use only the difference QTF as it is the most relevant for
our system due to the low natural frequencies of the floater and the mooring system. The Figures in this section
are only at windspeed 10.5m/s. The rest of the simulations can be seen in the Appendix.
In general, the turbine acts as expected. The motion ranges are compared to the operation ranges defined in
[16]. There are minor deviations for some motion ranges which are underlined in the following table. The main
motions of the platform are found in the low frequency range due to the large wind forces and the extreme
turbulence as shown in Figure 5-17. As previously discussed, the response to wave loads is small compared to
the wind-induced response, because of the relatively mild sea conditions at the location, the wind turbine size
and the large inertia of the system.
Table 5-11: WindCrete’s motion ranges (underlined values have higher values than the limits introduced in Table 4-2)
Yaw
maximum
[deg]
Yaw
average
[deg]
Pitch
maximum
[deg]
Pitch
average
[deg]
Roll
maximum
[deg]
Roll
average
[deg]
8 m/s 2.619 0.167 5.587 2.352 1.031 0.162
10.5 m/s 3.632 0.481 6.194 3.087 1.6401 0.258
corewind Public design and FAST models of the two 15MW floater-turbine concepts 30
16 m/s 4.276 0.355 4.159 1.752 2.119 0.310
20 m/s 5.996 0.643 5.090 1.422 3.835 0.402
25 m/s 7.312 0.816 4.79 1.335 4.357 0.515
Figure 5-16: Timeseries response of WindCrete floater for DLC 1.3 at 10m/s

corewind Public design and FAST models of the two 15MW floater-turbine concepts 31
Figure 5-17: Power spectrum density response of WindCrete floater for DLC 1.3 at 10m/s
The following table shows the nacelle accelerations in all degrees of freedom. The nacelle translational
accelerations are all within the ranges specified in [16].. The larger accelerations are found for the 20 m/s wind
speed. At this wind speed the sway motion is larger than expected and further work is needed to understand
the reason behind the sway response, and its higher nacelle acceleration.
Table 5-12: WindCrete’s maximum nacelle accelerations in translation and rotation
Nacc. acc in x-
axis [m/s2]
Nacc. acc in y-
axis [m/s2]
Nacc. acc in z-
axis [m/s2]
Nacc. rot. acc
around x-axis
[deg/s2]
Nacc. rot. acc
around y-axis
[deg/s2]
Nacc. rot. acc
around z-axis
[deg/s2]
8 m/s 1.099 0.261 0.246 0.381 1.941 0.517
10.5 m/s 1.812 0.289 0.429 0.709 3.253 0.568
16 m/s 1.933 0.390 0.421 0.649 3.223 0.627
20 m/s 2.122 0.871 0.587 1.031 4.376 0.720
25 m/s 1.558 0.635 0.409 0.945 3.359 0.926

corewind Public design and FAST models of the two 15MW floater-turbine concepts 32
Figure 5-18: Timeseries response of nacelle acceleration of WindCrete floater for DLC 1.3 at 10.5m/s
5.6.6 Normal turbulence wind and extreme stochastic waves (DLC 1.6) The next simulation carried out is DLC 1.6 [17], with a normal turbulence wind field for wind speeds (8, 10.5, 16,
20, 25) m/s and extreme stochastic wave of (Hs=5.11m, and Tp=9s). The first 1800s were excluded from the PSD
analysis, to make sure there are no transient conditions. The second order wave forces are taken into
consideration, by taking the difference QTF into account. The Figures shown here are only at windspeed
10.5m/s. The rest of the simulations can be seen in the Appendix.
In general, the turbine performs as expected. However, some motion ranges slightly violate the ranges in [16]
and further tuning for the controller is required to keep the motion ranges within the limitations. These motions
are shown underlined in the following table.
In this case also the pitch and surge motions are dominated by the wind loads and the wave loads are not very
significant, as shown in Figure 5-20.
Table 5-13: WindCrete’s motion ranges
Yaw
maximum
[deg]
Yaw
average
[deg]
Pitch
maximum
[deg]
Pitch
average
[deg]
Roll
maximum
[deg]
Roll
average
[deg]
8 m/s 1.514 0.209 4.272 2.279 0.666 0.163
10.5 m/s 2.656 0.489 5.548 3.468 1.320 0.267

corewind Public design and FAST models of the two 15MW floater-turbine concepts 33
16 m/s 3.000 0.366 3.708 1.813 1.491 0.317
20 m/s 4.652 0.586 3.731 1.475 2.673 0.396
25 m/s 5.462 0.714 3.970 1.384 3.026 0.5145
Figure 5-19: Timeseries response of WindCrete floater for DLC 1.6 at 10.5 m/s

corewind Public design and FAST models of the two 15MW floater-turbine concepts 34
Figure 5-20: Power spectrum density of WindCrete floater for DLC 1.6 at 10.5m/s
The following table shows the nacelle acceleration in all simulated wind speeds. The accelerations are with the
ranges defined in Table 4-2.
Table 5-14: WindCrete’s maximum nacelle accelerations in translation and rotation
Nacc. acc in x-
axis [m/s2]
Nacc. acc in y-
axis [m/s2]
Nacc. acc in z-
axis [m/s2]
Nacc. rot. acc
around x-axis
[deg/s2]
Nacc. rot. acc
around y-axis
[deg/s2]
Nacc. rot. acc
around z-axis
[deg/s2]
8 m/s 1.514 0.161 0.276 0.230 1.220 0.304
10.5 m/s 1.945 0.232 0.390 0.404 2.022 0.362
16 m/s 1.882 0.229 0.374 0.361 2.054 0.448
20 m/s 1.797 0.382 0.355 0.642 2.481 0.588
25 m/s 1.807 0.562 0.375 0.672 2.560 0.802

corewind Public design and FAST models of the two 15MW floater-turbine concepts 35
Figure 5-21: Timeseries response of nacelle acceleration of WindCrete floater for DLC 1.6 at 10.5 m/s
5.6.7 Power production with grid loss (DLC 2.1) The power production with grid loss was simulated following [17]. A normal turbulence wind field with wind
speed of 20m/s was used. A 600s simulation is used and the grid loss happens at 500s. A brake is applied to the
generator shaft linearly. The braking torques starts at zero and ramps linearly to reach the rated turbine torque
in 0.6s.
As the generator is turned off, due to grid loss, the rotation speed of the rotor increases. The rotor speed is
controlled by the applied braking torque which brings the turbine to stop. The maximum pitch is 3.2 degrees,
which is within the limits specified in [16] for emergency stop. Therefore, the turbine act as expected for this
DLC.

corewind Public design and FAST models of the two 15MW floater-turbine concepts 36
Figure 5-22: Timeseries response of WindCrete floater for DLC 2.1
Table 5-15: WindCrete’s maximum nacelle accelerations in translation and rotation
Nacc. acc in x-
axis [m/s2]
Nacc. acc in y-
axis [m/s2]
Nacc. acc in z-
axis [m/s2]
Nacc. rot. acc
around x-axis
[deg/s2]
Nacc. rot. acc
around y-axis
[deg/s2]
Nacc. rot. acc
around z-axis
[deg/s2]
1.024 0.598 0.268 2.467 2.315 0.425

corewind Public design and FAST models of the two 15MW floater-turbine concepts 37
Figure 5-23: Timeseries response of nacelle acceleration of WindCrete floater for DLC 2.1
5.6.8 Parked turbine in 50-years extreme wind and waves (DLC 6.1)
A parked turbine with the feathering blades is simulated for 50-years extreme wind and waves. The values for
extreme wind and waves used in the simulations were taken from [16] for the Gran Canaria site. The 50-years
extreme winds value is 41.2m/s. The value for 50 years extreme waves is Hs=5.1m and Tp=9s. The duration of
the simulation is 5400s, where the first 1800s were neglected to ensure we are out of the transient period.
The Table 5-16 shows the WindCrete’s motion range under the DLC 6.1. In this simulation all the values are
within the limits presented in Table 4-2 except for the pitch maximum rotation that exceeds the limit by 1.3 deg.
Table 5-16: WindCrete’s motion ranges (underlined values have higher values than the limits introduced in Table 4-2)
Yaw
maximum
[deg]
Yaw average
[deg]
Pitch
maximum
[deg]
Pitch
average
[deg]
Roll
maximum
[deg]
Roll average
[deg]
1.852 0.274 8.308 4.904 1.571 0.117

corewind Public design and FAST models of the two 15MW floater-turbine concepts 38
Figure 5-24: Timeseries response of WindCrete floater for DLC 6.1
Figure 5-25: Power spectrum density of WindCrete floater for DLC 6.1

corewind Public design and FAST models of the two 15MW floater-turbine concepts 39
In Figure 5-25 we noticed that the wave spectrum is not visible in the PSD of platform motions. The motions are mostly excited at their natural frequencies by wind and by the low-frequency second order waves, but not by the linear wave spectrum. We ran a simulation with the 50-years sea state (Hs=5.1m and Tp=9s) in the absence of wind, with a simulation duration of 14000s to make sure we don’t have any transient effects. In Figure 5-26 the wave spectrum appears in the PSD of surge and pitch motions. The main peak in surge, pitch, sway and roll happens exactly at the pitch natural frequency, which is 0.024 Hz. The main peak in both the heave and yaw motions happens exactly at the heave and yaw natural frequencies, respectively. Since there is no wind in the simulation, the resonance is caused by second-order hydrodynamic loads.
The resonant responses are very sensitive to the amount of damping, which is very uncertain at the moment due to the absence of physical tests to compare to. However, it is clear that the effect of the second order forcing on the platform is very relevant, especially compared to the response to linear wave loads. As previously observed, the response of the system to linear wave loads is relatively small, likely due to the large inertia of the system and the relatively larger aerodynamic and second-order hydrodynamic loads.
Figure 5-26: Power spectrum density of WindCrete floater for 50 years extreme waves in absence of wind
Table 5-17: WindCrete’s maximum nacelle accelerations in translation and rotation
Nacc. acc in x-
axis [m/s2]
Nacc. acc in y-
axis [m/s2]
Nacc. acc in z-
axis [m/s2]
Nacc. rot. acc
around x-axis
[deg/s2]
Nacc. rot. acc
around y-axis
[deg/s2]
Nacc. rot. acc
around z-axis
[deg/s2]
1.428 0.407 0.228 0.653 0.640 0.285

corewind Public design and FAST models of the two 15MW floater-turbine concepts 40
Figure 5-27: Timeseries response of nacelle acceleration of WindCrete floater for DLC 6.1
6 ActiveFloat floater
6.1 Platform design ActiveFloat floater has been developed by COBRA and is currently being designed by COBRA and ESTEYCO. The
platform is a semi-submersible concrete floater with three external vertical columns placed at 120 degrees. The
external columns are connected to a central shaft that holds the connection with the tower that ends in the
turbine. The three vertical columns are connected to the central shaft through three pontoons. The vertical
columns provide the buoyancy and stability to the system while the pontoons are structural members as the
central shaft from where the turbine loads are transferred and also add heave damping. The platform external
columns have the same height as the central cone where the access platform is located. The platform is made
of reinforced concrete, except for the tower that is made of structural steel.
The platform is transported un-ballasted in order to reduce draught requirements of navigation channels or
shipyards where the fabrication takes place. The platform is designed to have a transportation draft between
11 and 13 meters whereas the operational draft is 26.50 meters.
Circular heave plates are provided at the bottom of each external column, in order to increase damping.
The column diameter is kept equal towards to the pontoons beam. The pontoons have a rectangular cross-
section member with a central bulkhead that split the span of the pontoon decks.

corewind Public design and FAST models of the two 15MW floater-turbine concepts 41
Figure 6-1 - Activefloat Platform. Overview
The main dimensions are indicated in the following table.
Table 6-1 - Activefloat Platform. Main dimensions
Main dimensions
Hub height (m above sea level) 135.00
Columns Diameter (m) 17.00
Columns separation (center to tower center) (m) 34.00
Columns height (m) 35.50
Central cone base diameter (m) 19.60
Central cone top diameter (m) 11.00
Tower base diameter (m) 10.00
Tower top diameter (m) 6.50
Tower length (m) 120.50

corewind Public design and FAST models of the two 15MW floater-turbine concepts 42
Pontoons height (m) 11.50
Heave plate cantilever (m) 4.00
Overall beam (m) 83.90
Figure 6-2 - Activefloat Platform. Operation phase. Elevation (Units: meters)
Figure 6-3 - Activefloat Platform. Plan View (Units: meters)

corewind Public design and FAST models of the two 15MW floater-turbine concepts 43
The hub height of the floating system is adjusted to be at 135 m above sea level according to the following
constraints:
- Access platform to be out of the reach of the 50-years wave crest accounting with
- Minimum air gap of 20% of Hs or 1.50 meters, whichever is larger.
- Hub height to be 6 meters plus the semi-rotor diameter. The 6 meters allowance is for an operating
crane located at the access platform.
The naval key parameters are shown in the following table.
Table 6-2 - Activefloat Platform. Naval key parameters
Naval parameters
Displacement (m3) 36431.22
Active Ballast weight (t) 6360.00
Operation Draught (m) 26.50
KG (m) 15.41
KB (m) 10.67
GM (m) 6.41
GMc (m) 6.14
The floater inertias (concrete platform and ballast, without tower nor RNA) are indicated in the following table.
Table 6-3 - Activefloat Platform. Floater inertias
Platform inertias
Ixx (t.m2) 1.57E+07
Iyy (t.m2) 1.57E+07
Izz (t.m2) 2.58E+07
rxx (m) 21.14
ryy (m) 21.14
rzz (m) 27.1
6.1.1 Ballast system
The structure is designed so that the pontoons are fully ballasted during turbine operation. However, the central
shaft is left empty in order to store machinery in a dry environment, such as the active ballast system.
The pontoons fully ballasted are structurally efficient since differential pressure is very limited to the pre-service
phases. The lower slab of the central shaft in the other hand, requires a heavy structure since it has to resist
permanently a differential pressure (26.5 meters in the site B configuration).
The columns are ballasted partially. The platform design tries to ensure that columns have enough ballast in
order to be able to compensate the pitch produced by the mean thrust with the so called “Active ballast system”.

corewind Public design and FAST models of the two 15MW floater-turbine concepts 44
The coordinate system considered is indicated in the following figure:
Figure 6-4 - Activefloat Platform. Coordinate system
The origin is located at the sea level at the axis of the tower. The X coordinate is aligned with the mid plane of
the platform and pointing to the floater 2 and 3. The Y axis is aligned orthogonal to the mid plane of the platform
pointing according to the right-hand rule that makes the Z axis upwards.
The base weight control of the platform in operation condition in still water, is shown in the following table.
Note that the ballast water is divided in two, the ballast inside the pontoons (permanent ballast), that does not
change after the installation of the platform, and the ballast in tanks or external columns. The ballast in the
columns may be varied through the active ballast system in order to trim the platform as demanded by the
external conditions.
Table 6-4 - Activefloat Platform. Weight control
Weight Control
ITEM Weight (t) X (m) Y (m) Z (m)
RNA 1016.5 -7.023 0.000 133.840
TOWER 1088.5 0.000 0.000 56.919
Internals 100.0 0.000 0.000 56.919
FLOATER 34387.2 0.000 0.000 -17.529
TOTAL 36592.2 -0.195 0.000 -10.906
Note that the above has accounted for the mooring hang off. In order to keep the design draft of 26.5 meters,
750 tonnes of ballast water are removed from the tanks.

corewind Public design and FAST models of the two 15MW floater-turbine concepts 45
6.1.2 Active ballast system The active ballast system consists in a pump arrangement that allows to transfer water from column to column,
providing a corrective moment that reduces the mean pitch potentially to zero.
This section is aimed to define the ballast plan for the different wind speeds to be run in the coupled simulations,
i.e. 8, 10.5, 16, 20, 25 m/s.
The thrust assigned to each wind speed is, preliminary, the mean thrust of the steady state wind.
Table 6-5 - Activefloat Platform. Active Ballast system (X,Y,Z are the coordinates of the centre of gravity for the
Floater+Ballast)
DLC Wind speed
(m/s)
Floater + Ballast
M (t) X (m) Y (m) Z (m)
1.3
8 34387.2 -0.379 0 -17.59
10.5 34387.2 -0.522 0 -17.59
16 34387.2 -0.259 0 -17.59
20 34387.2 -0.196 0 -17.59
25 34387.2 -0.181 0 -17.59
1.6 / 2.1
8 34387.2 -0.365 0 -17.59
10.5 34387.2 -0.594 0 -17.59
16 34387.2 -0.272 0 -17.59
20 34387.2 -0.207 0 -17.59
25 34387.2 -0.188 0 -17.59
6.1 vref 34387.2 0 0 -17.59
6.2 Tower model The tower definition is as indicated in the following table. The tower starts at the top of the central concrete
cone of the platform, at 9.0 meters above sea level. The above tower top and bottom diameters are kept from
the turbine report in order to ensure the geometry compatibility.
Table 6-6 - Activefloat Platform. Tower definition
Height Fraction
Outer Diameter
[m]
Thickness [mm]
Area [m2] CoG [m] Mass [t]
0.00 10 59 1.843 - -
0.10 9.65 59 1.778 6.05 175
0.20 9.30 49 1.424 18.15 173.1
0.30 8.95 44.5 1.245 30.25 138.2
0.40 8.60 42 1.129 42.35 117.7
0.50 8.25 42 1.083 54.45 105.6
0.60 7.90 38 0.939 66.55 101.4
0.70 7.55 27.95 0.660 78.65 90.1
0.80 7.20 28.5 0.642 90.75 65.2
0.90 6.85 31 0.664 102.85 62.4

corewind Public design and FAST models of the two 15MW floater-turbine concepts 46
1.00 6.5 31 0.630 114.95 59.8
Total 47.9 1088.5
6.3 Hydrodynamic model The hydrodynamic model is initially produced in ANSYS AQWA. The model consisted in a boundary element
model with a mesh of 2 meters size. The model is calibrated against previous tank tests of similar platforms and
the linear additional damping, as well as the Morison drag coefficients, used in the model, are adjusted.
After the ANSYS AQWA output is created (LIS and QTF files) it is exported to the WAMIT output format, which is
the format of hydrodynamic files required by FAST and used for the coupled simulations.
6.3.1 First order hydrodynamics Next figures show the linear forces per unit wave amplitude for the Activefloat.
Figure 6-5 - Activefloat first order wave excitation forces and moments (0º wave heading direction)
6.3.2 Radiation hydrodynamics
Next graphs present the radiation characterization of the Activefloat. Firstly, the added mass matrix for infinite
frequency is presented. After the added mass evolution versus the frequency is shown. Note that units for the
matrix are consistent with the graphs below.
Table 6-7 - Activefloat Platform. Added mass matrix (infinite freq.)
X Y Z RX RY RZ

corewind Public design and FAST models of the two 15MW floater-turbine concepts 47
X 1.77E+07 4.57E+02 1.61E+03 1.01E+05 -9.54E+07 -6.74E+04
Y -1.16E+03 1.77E+07 2.39E+03 9.57E+07 -2.71E+04 2.74E+04
Z 1.90E+03 -2.07E+03 3.32E+07 -4.05E+05 5.46E+05 2.05E+05
RX -1.51E+05 1.03E+08 -3.06E+05 1.00E+10 6.99E+06 -3.57E+06
RY -1.03E+08 -5.26E+04 4.53E+05 4.51E+06 1.00E+10 -5.00E+05
RZ -4.80E+04 -5.51E+03 1.24E+04 4.64E+06 2.85E+06 1.57E+10
Figure 6-6 – Activefloat hydrodynamic added mass

corewind Public design and FAST models of the two 15MW floater-turbine concepts 48
Figure 6-7: Activefloat hydrodynamic potential damping
6.3.3 Viscous forces
The viscous effects were modeled in Hydrodyn through the Morison equation. The floater was defined by seven
members; four members represented the four vertical columns and three members for the horizontal pontoons
(see Figure 6-8). Activefloat is considered brand new hence no marine growth was taken into account in the
viscous model. However, the marine growth effects must be taken into account in the design process [22].
Figure 6-8: Activefloat geometry

corewind Public design and FAST models of the two 15MW floater-turbine concepts 49
The Morison drag coefficients used are defined differently for the central vertical column, the outer vertical
columns and the horizontal pontoon and heave plates. The methodology used here is similar to the methodology
used in [22] for the OO-Star Semi floater.
Central vertical column:
One member was used to model the central tapered vertical column. The member has a top diameter
of 11m, and a lower diameter of 19.62. The member ends at the top of the star shaped pontoons.
The transverse viscous drag for this vertical column was derived following [23], where the drag
coefficient is a function of the non-dimensional roughness (k/D). The non-dimensional roughness is
the ratio of the surface roughness (k) and the diameter (D). In this report the non-dimensional
roughness of concrete is taken as 3mm.
Following equation (X) in [23]. The top transverse drag coefficient is 0.737 and the lower transverse
drag coefficient is 0.687.
Outer vertical column:
Three members represent the three outer vertical columns each with a constant diameter of 17m.
The three members at the bottom of the star shaped pontoons.
Similar to the central vertical column, the transverse viscous drag for this vertical column was derived
following [23] , where the drag coefficient is a function of the non-dimensional roughness (k/D).
Following equation (X) in [23]. The value of the transverse drag coefficients over the three vertical
cylinders is 0.699.
Horizontal pontoons (star-shaped):
The remaining three members represent the three legs of the star-shaped base of Activefloat. The main
challenge, is that Hydrodyn is only able to model cylindrical shaped members using Morison elements. In order
to overcome this obstacle, the methodology used in [22] was followed, and explained through the coming
section. First, the drag coefficients of the real physical system are obtained from literature. Afterwards, the drag
coefficients for the modelled areas in Hydrodyn are calculated; such that the final drag forces acting on the
floater are equal for the real physical model and Hydrodyn implementation.
corewind Public design and FAST models of the two 15MW floater-turbine concepts 50
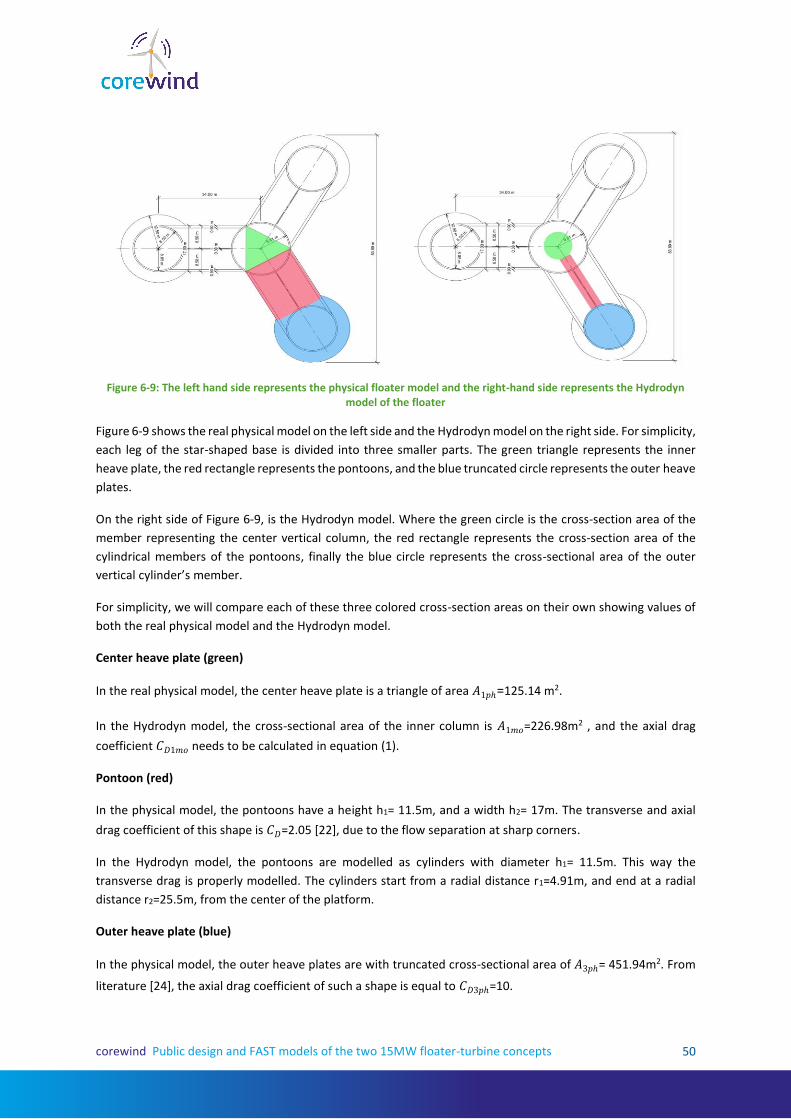
Figure 6-9: The left hand side represents the physical floater model and the right-hand side represents the Hydrodyn model of the floater
Figure 6-9 shows the real physical model on the left side and the Hydrodyn model on the right side. For simplicity,
each leg of the star-shaped base is divided into three smaller parts. The green triangle represents the inner
heave plate, the red rectangle represents the pontoons, and the blue truncated circle represents the outer heave
plates.
On the right side of Figure 6-9, is the Hydrodyn model. Where the green circle is the cross-section area of the
member representing the center vertical column, the red rectangle represents the cross-section area of the
cylindrical members of the pontoons, finally the blue circle represents the cross-sectional area of the outer
vertical cylinder’s member.
For simplicity, we will compare each of these three colored cross-section areas on their own showing values of
both the real physical model and the Hydrodyn model.
Center heave plate (green)
In the real physical model, the center heave plate is a triangle of area 𝐴1𝑝ℎ=125.14 m2.
In the Hydrodyn model, the cross-sectional area of the inner column is 𝐴1𝑚𝑜=226.98m2 , and the axial drag
coefficient 𝐶𝐷1𝑚𝑜 needs to be calculated in equation (1).
Pontoon (red)
In the physical model, the pontoons have a height h1= 11.5m, and a width h2= 17m. The transverse and axial
drag coefficient of this shape is 𝐶𝐷=2.05 [22], due to the flow separation at sharp corners.
In the Hydrodyn model, the pontoons are modelled as cylinders with diameter h1= 11.5m. This way the
transverse drag is properly modelled. The cylinders start from a radial distance r1=4.91m, and end at a radial
distance r2=25.5m, from the center of the platform.
Outer heave plate (blue)
In the physical model, the outer heave plates are with truncated cross-sectional area of 𝐴3𝑝ℎ= 451.94m2. From
literature [24], the axial drag coefficient of such a shape is equal to 𝐶𝐷3𝑝ℎ=10.

corewind Public design and FAST models of the two 15MW floater-turbine concepts 51
In the Hydrodyn model, the outer heave plate cross-section area is 𝐴3𝑚𝑜= 302.33m2, and the drag coefficient
𝐶𝐷3𝑚𝑜 is calculated in equations (1,2).
∫1
2𝜌𝐶𝐷ℎ2�̇�|𝑧|̇ 𝑑𝑟 +
1
2𝜌𝐶𝐷3𝑝ℎ𝐴3𝑝ℎ�̇�|𝑧|̇ +
1
2
1
3𝜌𝐶𝐷𝐴1𝑝ℎ�̇�|𝑧|̇
𝑟2
𝑟1
= ∫1
2𝜌𝐶𝐷ℎ1�̇�|𝑧|̇ 𝑑𝑟 +
1
4𝜌𝐶𝐷3𝑚𝑜𝐴3𝑚𝑜�̇�|𝑧|̇ +
1
4
1
3𝜌𝐶𝐷1𝑚𝑜𝐴1𝑚𝑜�̇�|𝑧|̇
𝑟2
𝑟1
∫1
2𝜌𝐶𝐷ℎ2�̇�|𝜃|̇ 𝑟
3𝑑𝑟 +1
2𝜌𝐶𝐷3𝑝ℎ𝐴3𝑝ℎ�̇�|𝜃|̇ 𝑅
3𝑟2
𝑟1
=∫1
2𝜌𝐶𝐷ℎ1�̇�|𝜃|̇ 𝑟
3𝑑𝑟 +1
4𝜌𝐶𝐷3𝑚𝑜𝐴3𝑚𝑜�̇�|𝜃|̇ 𝑅
3𝑟2
𝑟1
(2)
(1)
Following equations 9 and 10 from [22], equation 1 represents the drag forces in still water in the axial z
direction. The left-hand side of the equation represents the drag forces on the real physical model, where the
first term represents the drag on the pontoon, second term is the drag on the outer heave plate, and the third
term represents the drag on the center heave plate. The third term for the central heave plate is divided by
three as this area is included in all three star-shaped legs of the floater.
On the right-hand side, the first term represents the drag on the pontoon cylinders. The second term represents
the drag on the outer heave plate, and the third term represents the drag on the central heave plate. The second
and third terms are divided by two because Hydrodyn assumes two joints per heave plate. The third term for
the central heave plate is divided by three because, similar to the left-hand side, it is repeated in all three star-
shaped legs of the platform.
Equation 2 represents the drag moment around the y axis (pitch degree of freedom). The moment due to the
central heave plate is neglected for simplicity. This is a valid assumption due to the small arm of moment for the
central heave plate. The left-hand side of equation 2 represents the real physical moment. The first term in the
left-hand side represents the moment due to the pontoons. The second term represents the moment on the
outer heave plates with R=34m.
The right-hand side of equation 2 represents the pitch drag moment in the Hydrodyn model. The drag forces on
the pontoon cylinders. The second term represents the drag moment on the outer heave plate. The second term
is divided by two, similar to equation 1, because Hydrodyn assumes two joints per heave plate.
Equations 1 and 2 are solved simultaneously to calculate the axial coefficients 𝐶𝐷1𝑚𝑜 and 𝐶𝐷3𝑚𝑜 for the Hydrodyn
model.
The parameters of the physical model and the Hydrodyn model are summarized in the following table.
Table 6-8: Parameters of the physical model and the Hydrodyn model
Property Physical value Model value Colour in Figure 6-2
Pontoon leg height (h1) 11.5m 11.5m Red
Pontoon leg width (h2) 17m 11.5m Red

corewind Public design and FAST models of the two 15MW floater-turbine concepts 52
Transverse drag coefficient of for
pontoon (𝐶𝐷)
𝐶𝐷=2.05 𝐶𝐷=2.05 Red
Outer heave plate area 𝐴3𝑝ℎ=451.94m2 𝐴3𝑚𝑜= 302.33m2 Blue
Outer heave plate coefficient 𝐶𝐷3𝑝ℎ=10 𝐶𝐷3𝑚𝑜=40.09 Blue
Central heave plate area 𝐴1𝑝ℎ=125.14 m2 𝐴1𝑚𝑜=226.98m2 Green
Central heave plate coefficient 𝐶𝐷=2.05 𝐶𝐷1𝑚𝑜=5.7 Green
6.3.4 Second order forces The second order forces are related to the waves’ nonlinear effects and in some cases, it is important to take
them into account. These loads are quadratic with the wave amplitude and they are related to the effect of a
pair of waves with several frequencies. An AQWA diffraction analysis can calculate the two contributions to this
type of loads, diff – frequencies and sum – frequencies terms.
Figure 6-10: Difference Quadratic Transfer Function (QTF) for wave direction = 0

corewind Public design and FAST models of the two 15MW floater-turbine concepts 53
6.4 Mooring line model The mooring system attached to the Activefloat is a three catenary mooring line system. The design was done
such that at maximum rotor thrust, the maximum surge is below 15m, and no vertical forces are applied on the
anchor. Moordyn coupled to FAST was used to the calculation of the mooring lines dynamics. The lines are
modelled as chain lines, with diameter 0.16m, and axial stiffness of 2.3 GN. The mass per unit length of the line
is equal to 561.2 kg/m. The total unstretched lines length is 614m and divided into 80 calculation segments.
Figure 6-11: Mooring fairlead connection to Activefloat
Table 6-9: Mooring lines configuration
Line # Anchor coordinates [m] Fairlead coordinates[m]
X Y Z X Y Z
1 -600.0 0.0 -200 -42.5 0.0 -15.0
2 300 -519.6152 -200 21.25 -36.806 -15.0
3 300 519.6152 -200 21.25 36.806 -15.0
6.5 Controller adaptation The controller adaptation for the ActiveFloat platform follows essentially the same steps as in the case of
WindCrete platform. However, we used the same retuned controller WindCrete and achieved an acceptable
result. Therefore, at this step a sperate tuning of the controller for this platform is not carried out. The controller
parameters will be further optimized for Activefloat at a later stage of the project.
6.6 System Identification
Simulations shown in Table 4-3 are done to identify the system properties. We will show the outputs of these
simulations in the following sections for the Activefoat floater.
6.6.1 Static Equilibrium
First, we ran a static equilibrium simulation to identify the offsets in heave pitch and surge in the absence of
wind and waves. The goal is to make sure that the system is balanced and the global mass and net buoyancy
match each other.

corewind Public design and FAST models of the two 15MW floater-turbine concepts 54
The offsets especially in pitch and surge are because the CG of the tower top mass has an offset from the tower
axis.
Table 6-10: Offsets of the platform in the 6 DOFs
Surge [m] Sway [m] Heave [m] Roll [deg] Pitch [deg] Yaw [deg]
0.052 0.0 0.025 0.0 -1.799 0.0
6.6.2 Free Decays We then ran decay tests for surge, heave, pitch and yaw DOFs. The natural frequencies of these DOFs are
calculated and are listed in Table 6-11. For every DOF an initial displacement was introduced, and the system
was left to oscillate freely in the absence of wind and waves. The mooring lines were attached to the system
during all decay simulations.
Figure 6-12: Surge decay of Activefloat floater
Figure 6-13: Heave decay of Activefloat floater
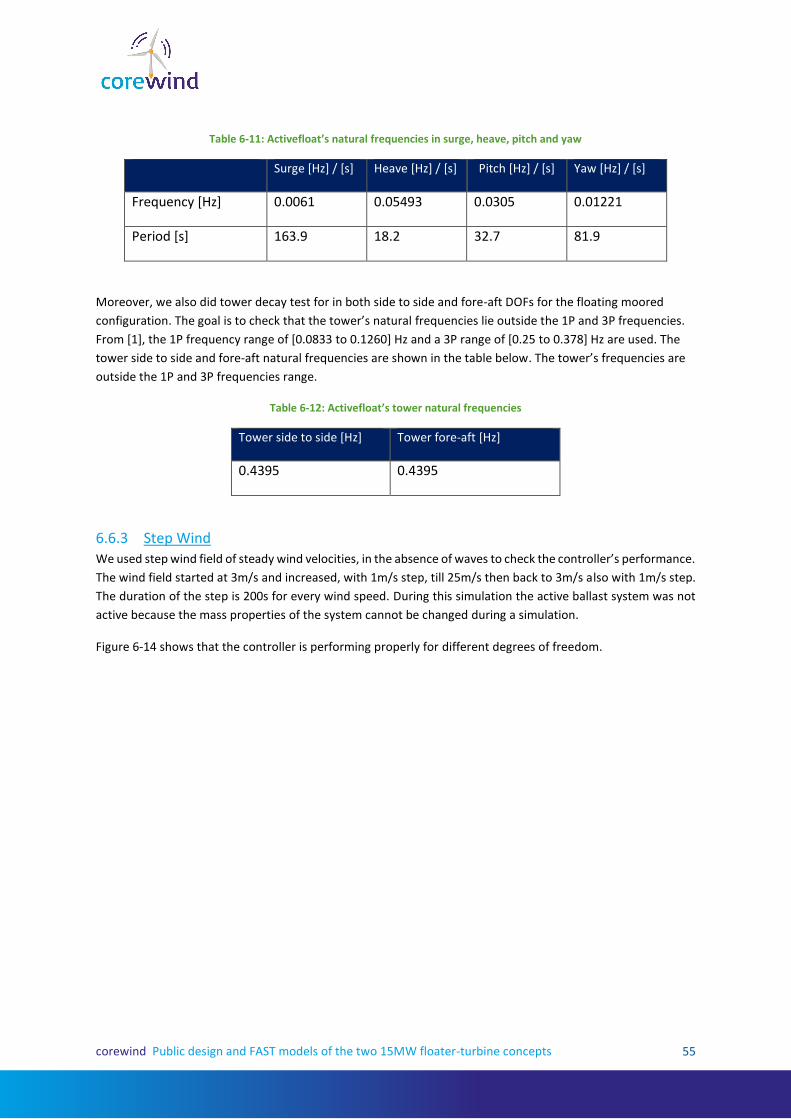
corewind Public design and FAST models of the two 15MW floater-turbine concepts 55
Table 6-11: Activefloat’s natural frequencies in surge, heave, pitch and yaw
Surge [Hz] / [s] Heave [Hz] / [s] Pitch [Hz] / [s] Yaw [Hz] / [s]
Frequency [Hz] 0.0061 0.05493 0.0305 0.01221
Period [s] 163.9 18.2 32.7 81.9
Moreover, we also did tower decay test for in both side to side and fore-aft DOFs for the floating moored
configuration. The goal is to check that the tower’s natural frequencies lie outside the 1P and 3P frequencies.
From [1], the 1P frequency range of [0.0833 to 0.1260] Hz and a 3P range of [0.25 to 0.378] Hz are used. The
tower side to side and fore-aft natural frequencies are shown in the table below. The tower’s frequencies are
outside the 1P and 3P frequencies range.
Table 6-12: Activefloat’s tower natural frequencies
Tower side to side [Hz] Tower fore-aft [Hz]
0.4395 0.4395
6.6.3 Step Wind We used step wind field of steady wind velocities, in the absence of waves to check the controller’s performance.
The wind field started at 3m/s and increased, with 1m/s step, till 25m/s then back to 3m/s also with 1m/s step.
The duration of the step is 200s for every wind speed. During this simulation the active ballast system was not
active because the mass properties of the system cannot be changed during a simulation.
Figure 6-14 shows that the controller is performing properly for different degrees of freedom.

corewind Public design and FAST models of the two 15MW floater-turbine concepts 56
Figure 6-14: Timeseries response of Activefloat floater
6.6.4 Regular waves The next and last step for the Activefloat system identification is regular wave simulation. In the absence of
wind, we simulated the floating wind turbine with the regular waves of significant height (Hs) = 2m and peak
period (Tp) of 6s. These wave characteristics were taken from the Gran Canaria site characteristics in [16].
The time series for the floating response is shown in Figure 6-15. The turbine response is stable for all degrees
of freedom. The thrust force shown in the figure is the force along the shaft of the turbine (including inertia
effects), because of this the thrust is not equal to zero. As observed for the WindCrete floater, the response to
regular waves is small, due to the large inertia of the system and the relatively small wave amplitude used.

corewind Public design and FAST models of the two 15MW floater-turbine concepts 57
Figure 6-15: Timeseries response of Activefloat floater for regular waves
6.6.5 Extreme turbulence wind and stochastic waves (DLC 1.3) The next simulation carried out is DLC 1.3 [IEC standard], were an extreme turbulent wind field for wind speeds
(8, 10.5, 16, 20, 25) m/s and stochastic wave of (Hs=2m, and Tp=6s). The first 1800s were excluded from the PSD
analysis, to make sure there are no transient conditions. The second order wave forces are taken into
consideration, by taking the difference QTF into account. We decided to use only the difference QTF as it is the
most relevant for our system due to the low natural frequencies of the floater. The Figures shown here are only
at windspeed 10.5m/s. The rest of the simulations can be seen in the Appendix.
The system is performing as expected with some results out of the validity ranges set in [17]. This is considered
acceptable given that the results in the following table are absolute maximums and even so, the deviations are
small. Also, it shall be noted that the current model is an early design than requires refinement.
Table 6-13: Activefloat’s motion ranges
Yaw
maximum
[deg]
Yaw
average
[deg]
Pitch
maximum
[deg]
Pitch
average
[deg]
Roll
maximum
[deg]
Roll
average
[deg]
8 m/s 5.358 0.403 5.160 0.049 0.942 0.374
10.5 m/s 8.273 1.059 -5.459 0.017 1.341 0.525
16 m/s 7.951 1.155 3.660 0.031 1.752 0.687
20 m/s 14.130 1.756 3.508 0.029 2.440 0.837

corewind Public design and FAST models of the two 15MW floater-turbine concepts 58
25 m/s 13.850 2.226 -2.867 0.022 3.228 1.042
Figure 6-16: Timeseries response of Activefloat floater for DLC 1.3 wind speed 10.5 m/s

corewind Public design and FAST models of the two 15MW floater-turbine concepts 59
Figure 6-17: Power spectrum density of Activefloat floater for DLC 1.3 at wind speed 10.5 m/s
Table 6-14: Activefloat’s maximum nacelle accelerations in translation and rotation
Nacc. acc in
x-axis [m/s2]
Nacc. acc in
y-axis [m/s2]
Nacc. acc in
z-axis [m/s2]
Nacc. rot. acc
around x-
axis [deg/s2]
Nacc. rot. acc
around y-
axis [deg/s2]
Nacc. rot. acc
around z-axis
[deg/s2]
8 m/s 0.918 0.338 0.264 0.892 2.879 0.121
10.5 m/s 1.826 0.486 0.593 1.429 6.223 0.171
16 m/s 1.717 0.838 0.565 1.341 4.815 0.148
20 m/s 1.786 0.892 0.722 1.473 6.429 0.162
25 m/s 1.385 0.793 0.602 1.650 6.166 0.176

corewind Public design and FAST models of the two 15MW floater-turbine concepts 60
Figure 6-18: Timeseries response of nacelle acceleration of Activefloat floater for DLC 1.3 wind speed 10.5 m/s
As observed for the WindCrete, the floater response is dominated by wind loads in all the degrees of freedom.
The wave spectrum is only visible in the PSD of heave. This is due to the relatively mild wave conditions at the
site (even for a 50-year sea state) and the much larger turbine size.
In the time series of nacelle acceleration we can see that there are high repeated oscillations. We had a closer
look at the PSD to understand the reasons behind these oscillations. We can see in Figure 6-19 that there are
three peaks in the frequency spectrum, the first corresponds to the natural frequencies of the floater, excited
by the wind and the low-frequency second order wave forces. The second is the wave peak frequency. Finally,
the highest peak at 0.47 Hz corresponds to the tower natural frequency. Therefore, the peaks in the nacelle
acceleration time series are due to tower vibrations.
We looked at the timeseries of the wind, blade pitch, thrust, and nacelle accelerations again to understand the
reason of the tower excitation in Figure 6-20. When there is a sudden increase in the blade pitch, the thrust
force decreases, and hence the horizontal force on the tower is suddenly reduced. This sudden drop of the
horizontal applied force on the tower leads to tower oscillations, which causes the peaks in the nacelle
accelerations. We believe that these impulsive forces can be decreased by tuning the blade pitch rate of the
controller (making pitching slower), then the change in thrust will be also slower.
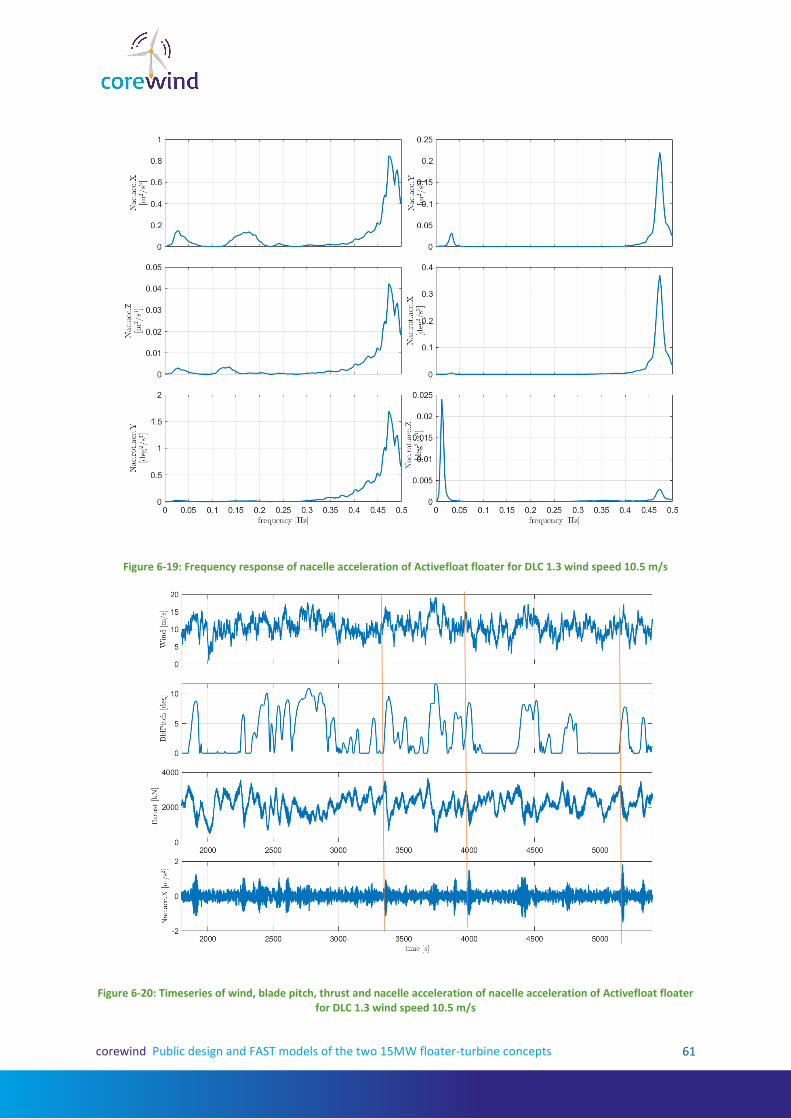
corewind Public design and FAST models of the two 15MW floater-turbine concepts 61
Figure 6-19: Frequency response of nacelle acceleration of Activefloat floater for DLC 1.3 wind speed 10.5 m/s
Figure 6-20: Timeseries of wind, blade pitch, thrust and nacelle acceleration of nacelle acceleration of Activefloat floater for DLC 1.3 wind speed 10.5 m/s

corewind Public design and FAST models of the two 15MW floater-turbine concepts 62
6.6.6 Normal turbulence wind and extreme stochastic waves (DLC 1.6)
The next simulation carried out is DLC 1.6 [IEC standard], with a normal turbulence wind field for wind speeds
(8, 10.5, 16, 20, 25) m/s and extreme stochastic wave of (Hs=5.11m, and Tp=9s). The first 1800s were excluded
from the PSD analysis, to make sure there are no transient conditions. The second order wave forces are taken
into consideration, by taking the difference QTF into account. The Figures shown here are only at windspeed
10.5m/s. The rest of the simulations can be seen in the Appendix.
The system is performing as expected with some results out of the validity ranges set in [17]. This is considered
acceptable given that the results in the following table are absolute maximums and even so, the deviations are
small. Also, it shall be noted that the current model is an early design than requires refinement.
Table 6-15: Activefloat’s motion ranges
Yaw
maximum
[deg]
Yaw
average
[deg]
Pitch
maximum
[deg]
Pitch
average
[deg]
Roll
maximum
[deg]
Roll
average
[deg]
8 m/s 3.324 0.485 -2.709 0.043 0.657 0.365
10.5 m/s 5.446 1.072 -4.111 0.027 1.063 0.547
16 m/s 5.698 1.166 -2.545 0.024 1.426 0.700
20 m/s 10.319 1.719 -2.599 0.022 2.106 0.840
25 m/s 11.272 2.254 -2.441 0.019 2.720 1.047

corewind Public design and FAST models of the two 15MW floater-turbine concepts 63
Figure 6-21: Timeseries response of Activefloat floater DLC 1.6 at wind speed 10.5 m/s
Figure 6-22: Power spectrum density of Activefloat floater for DLC 1.6 windspeed 10.5 m/s

corewind Public design and FAST models of the two 15MW floater-turbine concepts 64
Table 6-16: Activefloat’s maximum nacelle accelerations in translation and rotation
Nacc. acc in x-
axis [m/s2]
Nacc. acc in y-
axis [m/s2]
Nacc. acc in z-
axis [m/s2]
Nacc. rot. acc
around x-axis
[deg/s2]
Nacc. rot. acc
around y-axis
[deg/s2]
Nacc. rot. acc
around z-axis
[deg/s2]
8 m/s 0.843 0.084 0.368 0.341 1.809 0.047
10.5 m/s 1.347 0.343 0.576 0.822 3.133 0.075
16 m/s 1.337 0.372 0.615 0.944 3.564 0.102
20 m/s 1.563 0.697 0.565 1.175 4.282 0.120
25 m/s 1.168 0.619 0.557 1.235 4.034 0.121
Figure 6-23: Timeseries response of nacelle acceleration of Activefloat floater DLC 1.6
6.6.7 Power production with grid loss (DLC 2.1)
The power production with grid loss was simulated following [ IEC standard]. A normal turbulence wind field
with wind speed of 20m/s was used. A 600s simulation is used and the grid loss happens at 500s. A brake is
applied to the generator shaft linearly. The braking torques starts at zero and ramps linearly to reach the rated
turbine torque in 0.6s.

corewind Public design and FAST models of the two 15MW floater-turbine concepts 65
The maximum pitch is -6.29 degrees.
Figure 6-24: Timeseries response of Activefloat floater for DLC 2.1
Table 6-17: Activefloat’s maximum nacelle accelerations in translation and rotation
Nacc. acc in x-
axis [m/s2]
Nacc. acc in y-
axis [m/s2]
Nacc. acc in z-
axis [m/s2]
Nacc. rot. acc
around x-axis
[deg/s2]
Nacc. rot. acc
around y-axis
[deg/s2]
Nacc. rot. acc
around z-axis
[deg/s2]
1.107 0.660 0.419 10.060 3.450 1.025
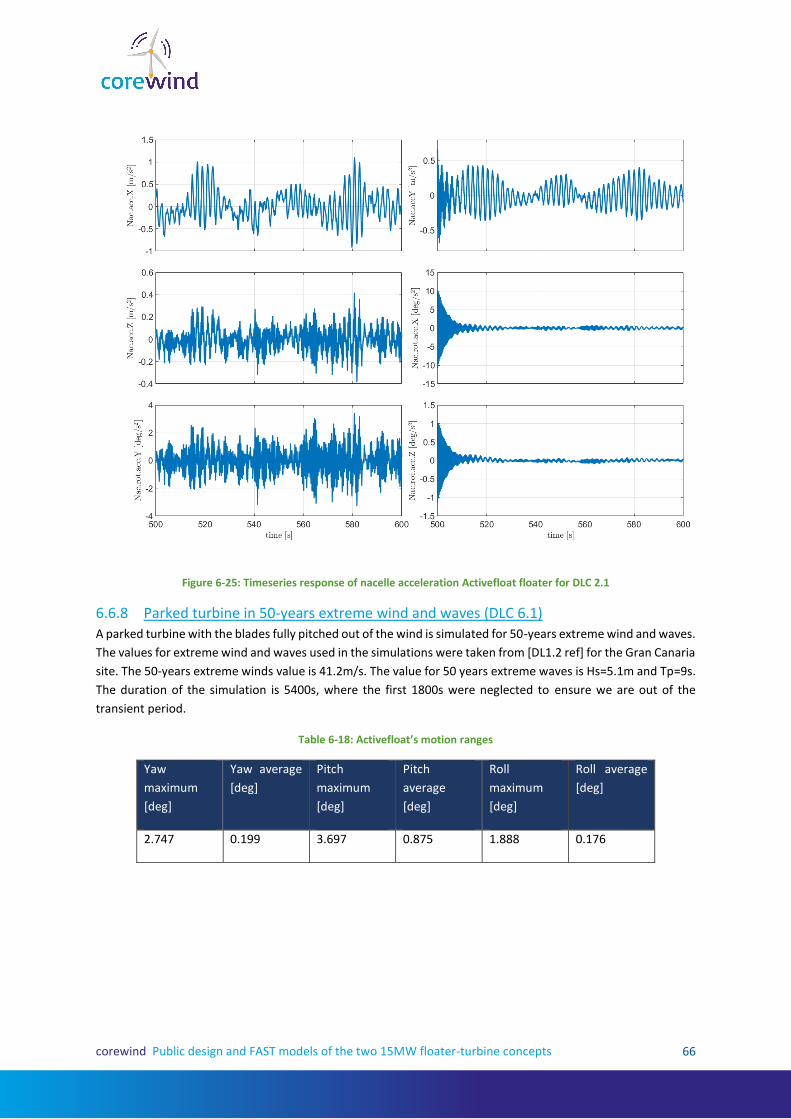
corewind Public design and FAST models of the two 15MW floater-turbine concepts 66
Figure 6-25: Timeseries response of nacelle acceleration Activefloat floater for DLC 2.1
6.6.8 Parked turbine in 50-years extreme wind and waves (DLC 6.1) A parked turbine with the blades fully pitched out of the wind is simulated for 50-years extreme wind and waves.
The values for extreme wind and waves used in the simulations were taken from [DL1.2 ref] for the Gran Canaria
site. The 50-years extreme winds value is 41.2m/s. The value for 50 years extreme waves is Hs=5.1m and Tp=9s.
The duration of the simulation is 5400s, where the first 1800s were neglected to ensure we are out of the
transient period.
Table 6-18: Activefloat’s motion ranges
Yaw
maximum
[deg]
Yaw average
[deg]
Pitch
maximum
[deg]
Pitch
average
[deg]
Roll
maximum
[deg]
Roll average
[deg]
2.747 0.199 3.697 0.875 1.888 0.176

corewind Public design and FAST models of the two 15MW floater-turbine concepts 67
Figure 6-26: Timeseries response of Activefloat floater for DLC 6.1
Figure 6-27: Power spectrum density of Activefloat floater for DLC 6.1

corewind Public design and FAST models of the two 15MW floater-turbine concepts 68
Table 6-19: Activefloat’s maximum nacelle accelerations in translation and rotation
Nacc. acc in x-
axis [m/s2]
Nacc. acc in y-
axis [m/s2]
Nacc. acc in z-
axis [m/s2]
Nacc. rot. acc
around x-axis
[deg/s2]
Nacc. rot. acc
around y-axis
[deg/s2]
Nacc. rot. acc
around z-axis
[deg/s2]
0.827 0.411 0.347 0.741 1.040 0.075
Looking at the PSD of the floater response, it is clear that the surge and pitch responses are resonant, dominated
by wind and second-order hydrodynamic loads. The linear wave loads are only visible in the PSD of heave.
Figure 6-28: Timeseries response of Activefloat floater for DLC 6.1
7 Models accessibility The OpenFAST models of both floaters are available for public use on the following link http://corewind.eu/. In
case of publication in work using these models, proper referencing of this report should be included.
8 Conclusion In this report we presented two floating OpenFAST models for a spar (WindCrete), and a semi-submersible
(Activefloat). The turbine used in this report is the IEA Wind 15MW reference wind turbine. The aerodynamics
of the turbine and the rotor nacelle assembly were not the main goal of the task, since the OpenFAST model
presented by IEA Task 37 was used as a base model for the rotor-nacelle assembly. Our main goal is to introduce

corewind Public design and FAST models of the two 15MW floater-turbine concepts 69
both floaters and the changes needed in the numerical models to couple the floaters and the turbine, including
the mooring system and the modified wind turbine control settings. The detailed structure of both models is
explained, including hydrodynamics, mooring system, tower and modifications to the controller properties.
A preliminary verification of the models is done and the results are shown through the report. The simulated
responses are as expected and generally within the design limitations introduced in Table 4-2. The load cases
are chosen to calculate the static offsets, natural frequencies, and check the controller performance, as well as
to check the dynamic response of the models in normal and severe environmental conditions.
The responses of both floaters are strongly dominated by wind forces. The linear wave loads generally don’t
have a significant impact on the response spectra. This is likely due to the larger size of the wind turbine, and to
the relatively mild sea conditions at the chosen site. The effect of second-order wave forces in the response is
significant, especially compared to linear wave loads. This emphasizes the importance of second order forces as
shown in Figure 5-26. However, we note the strong dependency of the resonant responses on the amount of
damping and the need to compare to physical test results in order to properly calibrate the damping in the
model. Wave tank tests will be carried out later within the COREWIND project.
The models will be used for the further work in COREWIND project on mooring design, dynamic cable design,
wind farm dynamics and planning. The models are currently available to the public as indicated in section 7.

corewind Public design and FAST models of the two 15MW floater-turbine concepts 70
9 References
[1] E. Gaertner, J. Rinker, L. Sethuraman, F. Zahle, B. Anderson, G. Barter, N. Abbas, F. Meng, P. Bortolotti, W.
Skrzypinski, G. Scott, R. Feil, H. Bredmose, K. Dykes, M. Shields, C. Allen and A. Viselli, "Definition of the
IEA Wind 15-Megawatt Offshore Reference Wind Turbine," 2020.
[2] H. Bredmose, J. Rinker, W. Skrzypinski, F. Zahle, F. Meng, K. Dykes, E. Gaertner, G. Barter, P. Bortolotti, L.
Sethuraman and M. Shields, "COREWIND D1.1: Definition of the 15 MW Reference Wind Turbine," 2020.
[3] T. Larsen and T. Hanson, "A method to avoid negative damped low frequent tower vibrations for a floating,
pitch controlled wind turbine," Journal of Physics: Conference Series, vol. 75, no. 1, 2007.
[4] NREL, ROSCO. Version 1.0.0, GitHub, 2020.
[5] T. Burton, D. Sharpe, N. Jenkins and E. Bossanyi, Wind energy: handbook, J. Wiley & Sons, 2001.
[6] J. Jonkman and M. Sprague, "NWTC Information Portal (OpenFAST)," [Online]. Available:
https://nwtc.nrel.gov/OpenFAST.
[7] C. Lee and J. Newman, "WAMIT," 2016. [Online]. Available: http://www.wamit.com/.
[8] Ansys®, AQWA, Release 19.0.
[9] W. Cummins, "The impulse response functions and ship motions," Schiffstechnik, vol. 9, pp. 101-109, 1962.
[10] C. Lee, "WAMIT Theory Manual," Cambridge, Massachusetts, 1995.
[11] J. Jonkman, "Dynamics of offshore floating wind turbines - Model development and verification," Wind
Energy, vol. 12, no. 5, pp. 459-492, 2009.
[12] J. Morison, J. Johnson and S. Schaaf, "The force exerted by surface waves on piles," Journal of Petroleum
Technology, vol. 2, no. 05, pp. 149-154, 1950.
[13] F. Madsen, A. Pegalajar-Jurado, H. Bredmose, R. Faerron-Guzman, K. Müller and F. Lemmer, "LIFES50+
D4.6: Model validation against experiments and map of model accuracy across load cases," 2018.
[14] T. Duarte, A. Sarmento and J. Jonkman, "Effects of second-order hydrodynamic forces on floating offshore
wind turbines," in Proceedings of the 32nd ASME Wind Energy Symposium, 2014.
[15] M. Hall, "MoorDyn," 2017. [Online]. Available: http://www.matt-hall.ca/moordyn.html.
[16] F. Vigara, L. Cerdán, R. Durán, S. Muñoz, M. Lynch, S. Doole, C. Molins, P. Trubat and R. Guanche,
"COREWIND D1.2: Design Basis," 2019.
[17] The International Electrotechnical Commission (IEC), "IEC 61400-3, Wind turbines - Part 3: Design
requirements for offshore wind turbines," 2009.

corewind Public design and FAST models of the two 15MW floater-turbine concepts 71
[18] IEC, "Wind energy generation systems - Part 3-2: Design requirements for floating offshore wind turbines,"
2019-04-05.
[19] J. Journée and W. Massie, , Offshore hydromechanics, Delft University of Technology, 2001.
[20] A. Campos, C. Molins, X. Gironella, P. Trubat and D. Alarcón, "Experimental rao’s analysis of a monolithic
concrete spar structure for offshore floating wind turbines," in Proceedings of the 34th International
Conference on Ocean, Offshore and Arctic Engineering. OMAE 2015, St. John’s, NL, Canada, 2015.
[21] S. Hoerner, Fluid-dynamic drag, theoretical, experimental and statistical information, Bakersfield, CA: by
the author, 1965.
[22] A. Pegalajar-Jurado, F. Madsen, M. Borg and H. Bredmose, "LIFES50+ D4.5: Qualification of innovative
floating substructures for 10MW wind turbines and water depths greater than 50m," 2018.
[23] DNVGL, "Environmental conditions and environmental loads," 2017.
[24] L. Tao and D. Dray, "Hydrodynamic Performance of Solid and Porous Heave Plates," Ocean Engineering,
vol. 35, pp. 1006-1014, July 2018.

corewind Public design and FAST models of the two 15MW floater-turbine concepts 72
10 Appendix
10.1 WindCrete
10.1.1 Extreme turbulence wind and stochastic waves (DLC 1.3)
8m/s

corewind Public design and FAST models of the two 15MW floater-turbine concepts 73
16m/s

corewind Public design and FAST models of the two 15MW floater-turbine concepts 74

corewind Public design and FAST models of the two 15MW floater-turbine concepts 75
20m/s
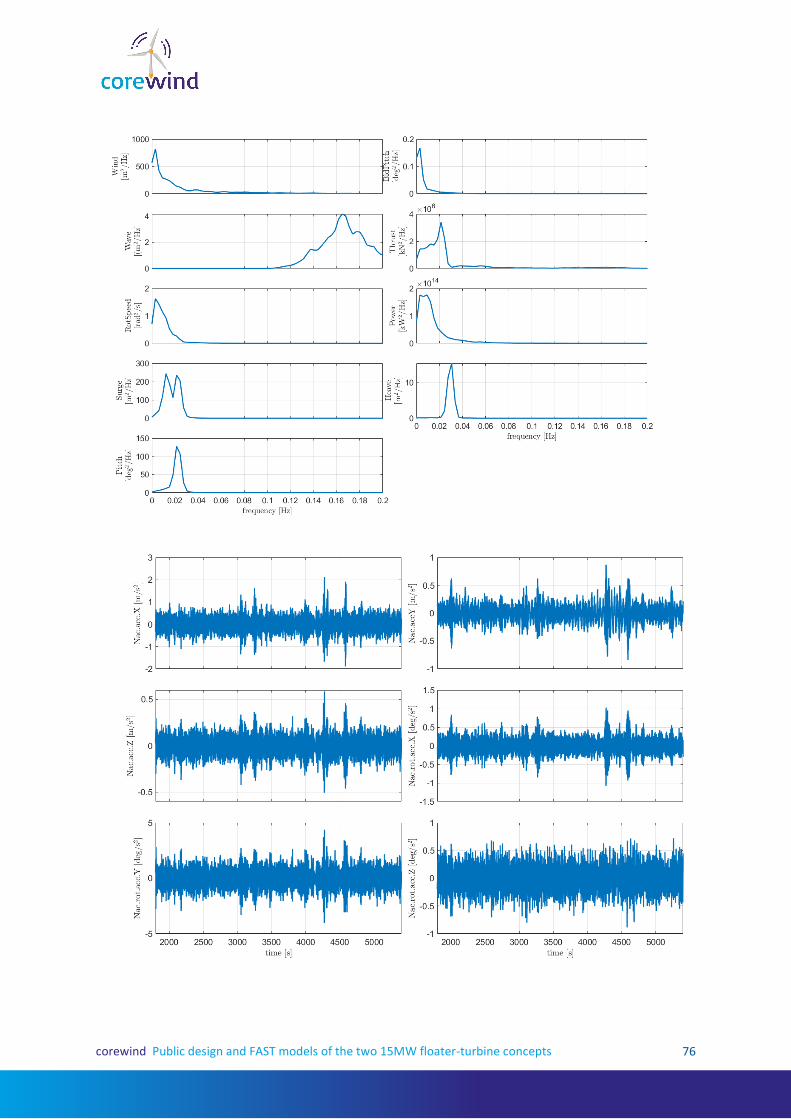
corewind Public design and FAST models of the two 15MW floater-turbine concepts 76

corewind Public design and FAST models of the two 15MW floater-turbine concepts 77
25m/s
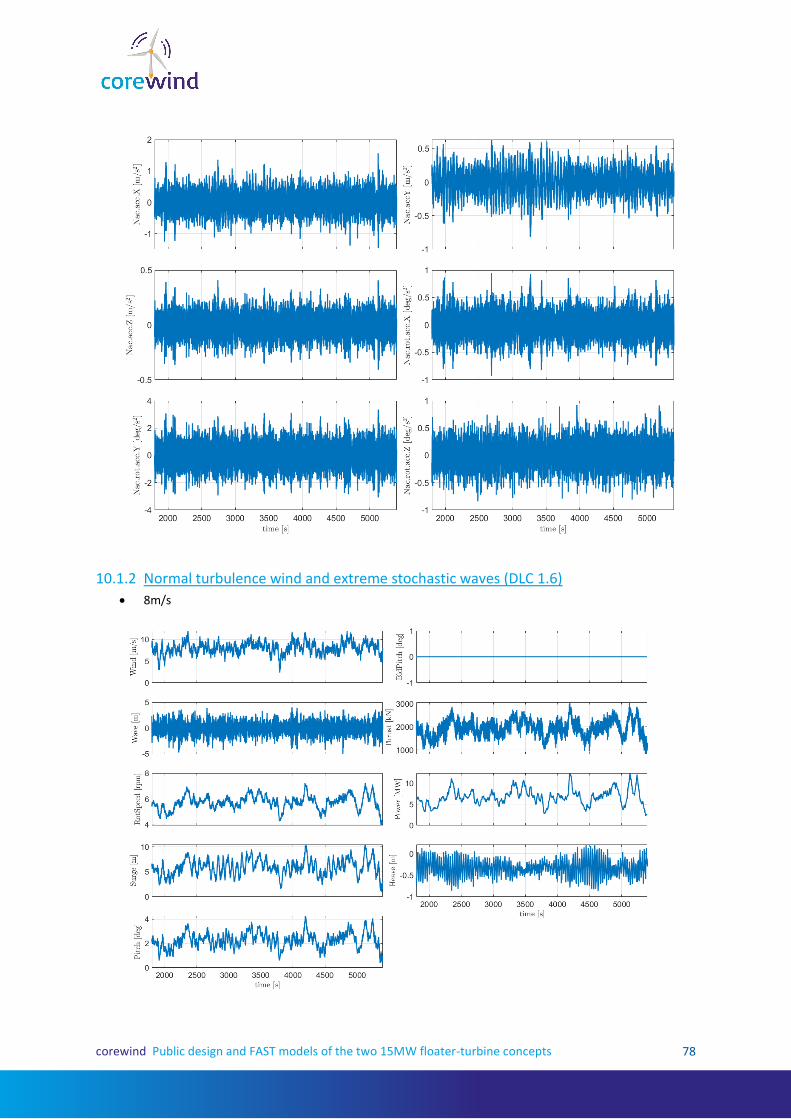
corewind Public design and FAST models of the two 15MW floater-turbine concepts 78
10.1.2 Normal turbulence wind and extreme stochastic waves (DLC 1.6)
8m/s
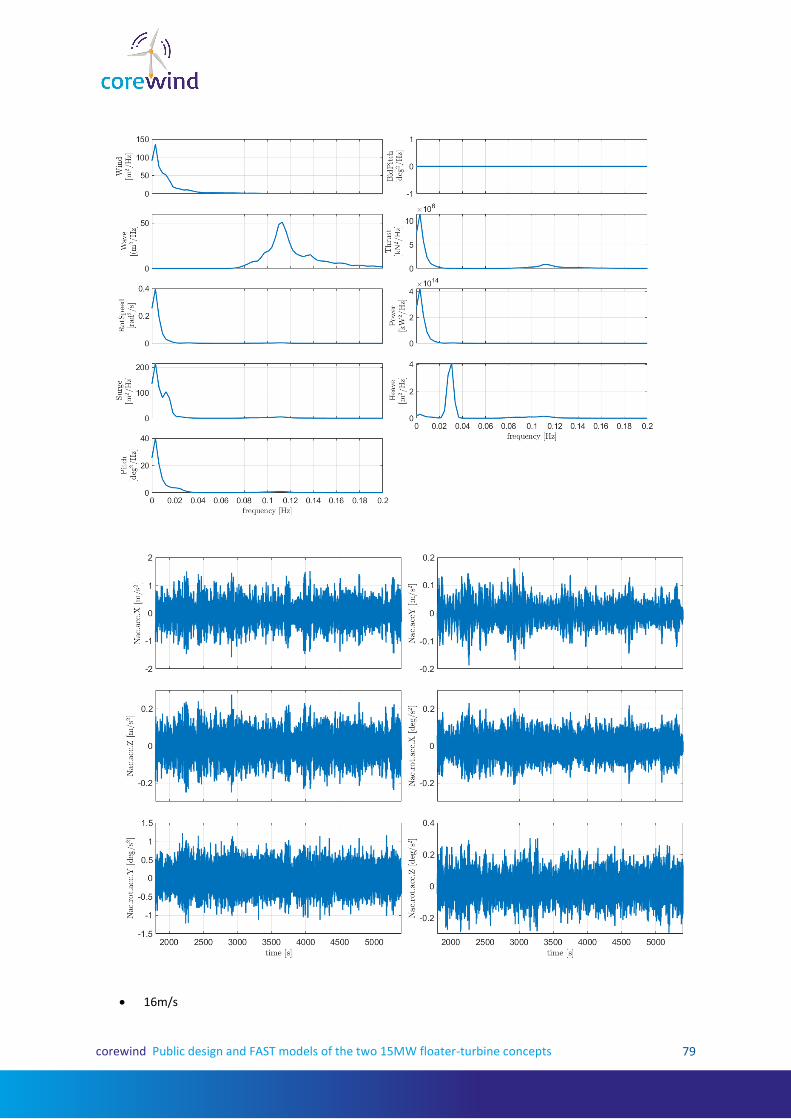
corewind Public design and FAST models of the two 15MW floater-turbine concepts 79
16m/s

corewind Public design and FAST models of the two 15MW floater-turbine concepts 80

corewind Public design and FAST models of the two 15MW floater-turbine concepts 81
20m/s
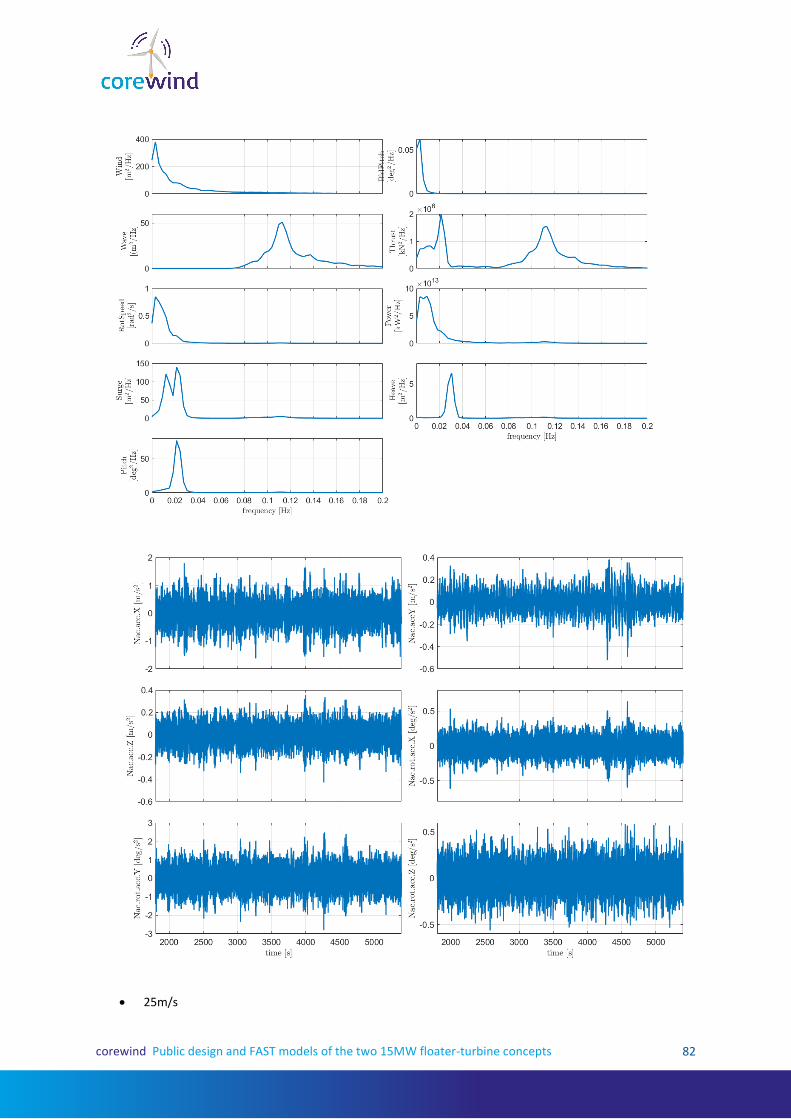
corewind Public design and FAST models of the two 15MW floater-turbine concepts 82
25m/s

corewind Public design and FAST models of the two 15MW floater-turbine concepts 83

corewind Public design and FAST models of the two 15MW floater-turbine concepts 84
10.2 ActiveFloat
10.2.1 Extreme turbulence wind and stochastic waves (DLC 1.3)
8m/s

corewind Public design and FAST models of the two 15MW floater-turbine concepts 85

corewind Public design and FAST models of the two 15MW floater-turbine concepts 86
16m/s

corewind Public design and FAST models of the two 15MW floater-turbine concepts 87
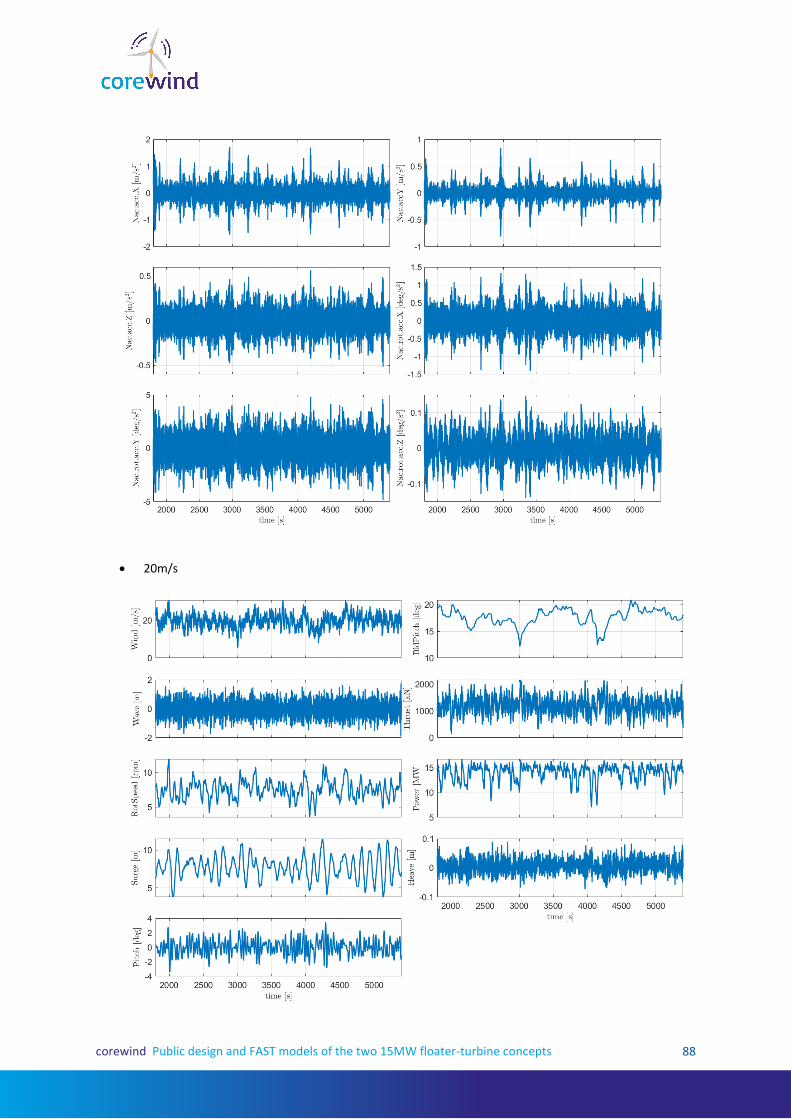
corewind Public design and FAST models of the two 15MW floater-turbine concepts 88
20m/s

corewind Public design and FAST models of the two 15MW floater-turbine concepts 89
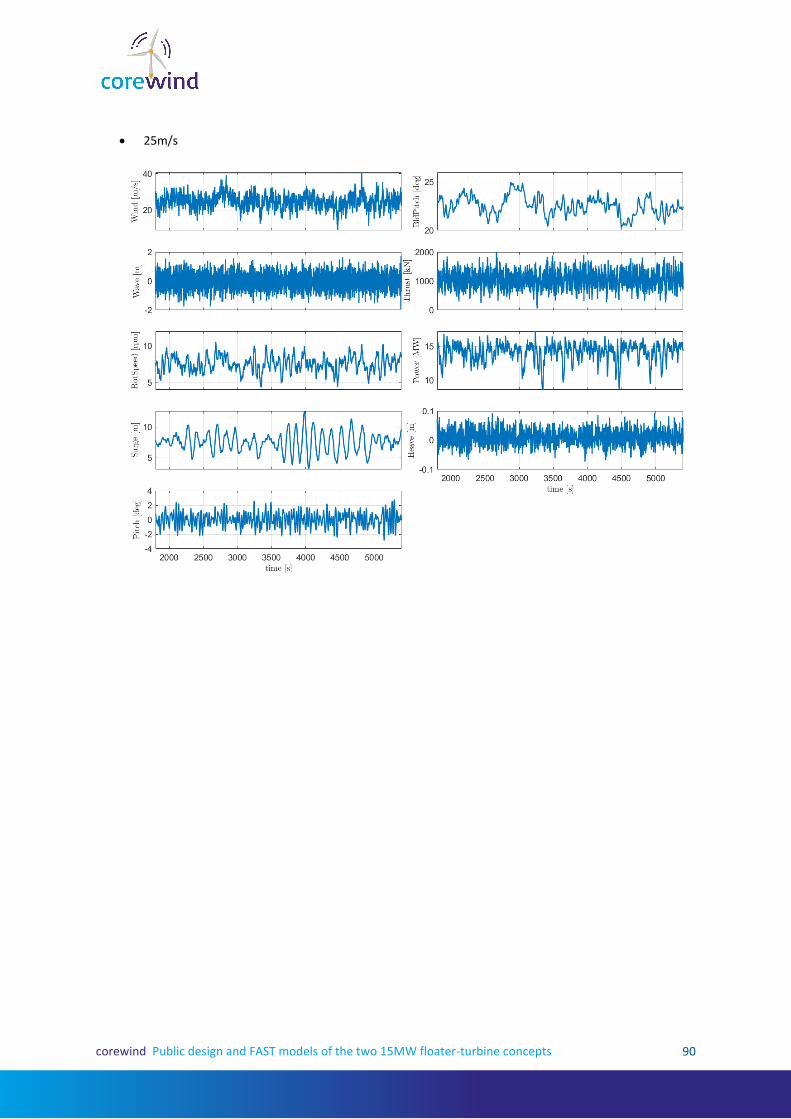
corewind Public design and FAST models of the two 15MW floater-turbine concepts 90
25m/s

corewind Public design and FAST models of the two 15MW floater-turbine concepts 91

corewind Public design and FAST models of the two 15MW floater-turbine concepts 92
10.2.2 Normal turbulence wind and extreme stochastic waves (DLC 1.6)
8m/s

corewind Public design and FAST models of the two 15MW floater-turbine concepts 93

corewind Public design and FAST models of the two 15MW floater-turbine concepts 94
16m/s

corewind Public design and FAST models of the two 15MW floater-turbine concepts 95

corewind Public design and FAST models of the two 15MW floater-turbine concepts 96
20m/s

corewind Public design and FAST models of the two 15MW floater-turbine concepts 97
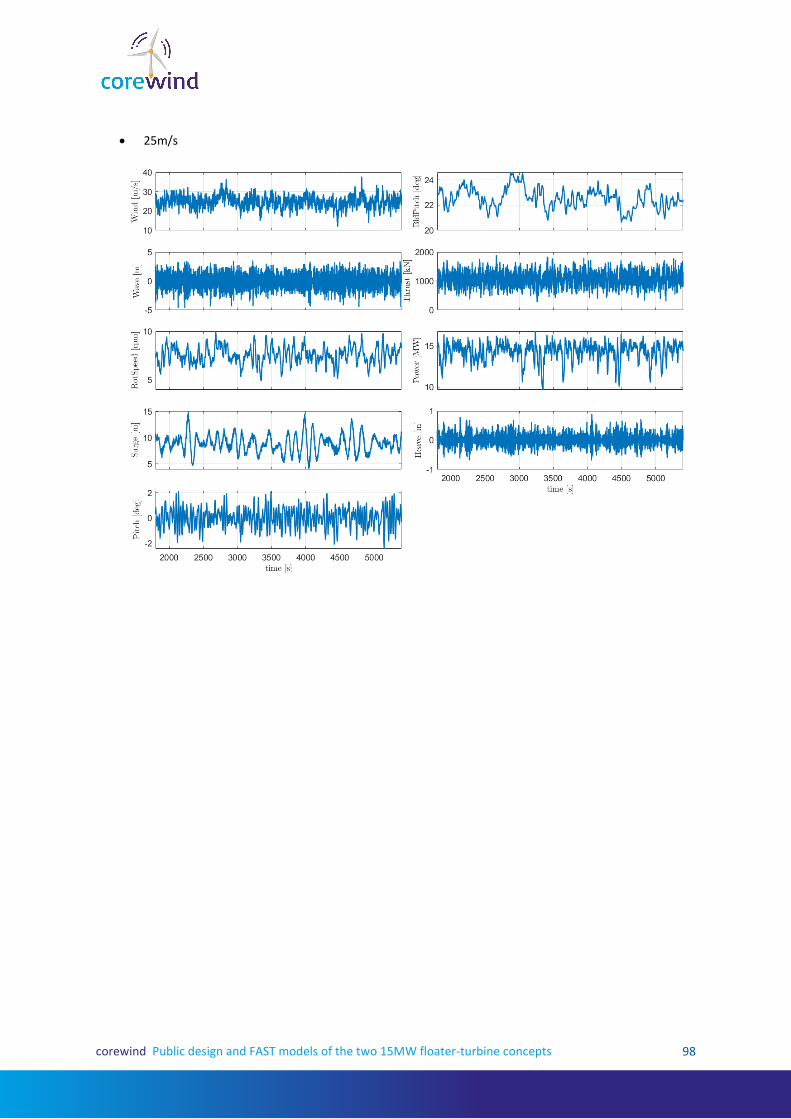
corewind Public design and FAST models of the two 15MW floater-turbine concepts 98
25m/s

corewind Public design and FAST models of the two 15MW floater-turbine concepts 99