public attitudes to air quality - gov.uk
TRANSCRIPT

Public Attitudes to Air QualityHeadline Report for Defra by
Dr Michael Turner & Robert Struthers
May 2018
1

Contents
1. About the research
2. How concerned were respondents about air quality?
3. How much did respondents know about air quality issues?
4. What were respondents prepared to do about air quality?
5. What did respondents think about certain air quality
improvement levers?
6. What did respondents want to know about air quality and
from whom?
7. Conclusions
8. Appendix
9. Quality standards
2

1 About the research
3
Aims and Objectives
The overarching aim of the research was to enhance understanding of public behaviours, attitudes to, and knowledge of,
issues surrounding air quality (AQ). There were six specific research questions, which are addressed individually in this
summary report:
1. How concerned are people about AQ?
2. How much do people know about AQ issues?
3. What behaviours are people prepared to take to improve AQ / decrease their exposure?
4. How do people feel about the range of things that are being, or could be done, to improve AQ?
5. What kind of information on AQ do people want to be able to access and from whom?
6. How are people’s behaviours, attitudes to, and knowledge of AQ issues and policy shaped?
Approach & Methodology
The research was conducted in March 2018.
It consisted of a UK wide online survey and seven discussion groups.
The survey was completed by 3,252 people in total: 2,132 interviews reflective of national demographics and a boost
sample of 1,120 interviews from key audiences.
The discussion groups took place in different locations across the UK. A broad spectrum of people participated in the
groups and each group had a different demographic profile.
Additional information on the methodology (including detailed sample breakdowns) can be found in the main body of
the report.
1%
2%
3%
4%
4%
5%
11%
11%
12%
21%
26%
Other
Noise pollution
Overuse of land / naturalresources
Deforestation
Pollution of fresh water(rivers and lakes)
Loss of green belt
Conservation of endangeredspecies
Air pollution
Pollution of the oceans
Litter / Plastics
Global warming / Climatechange
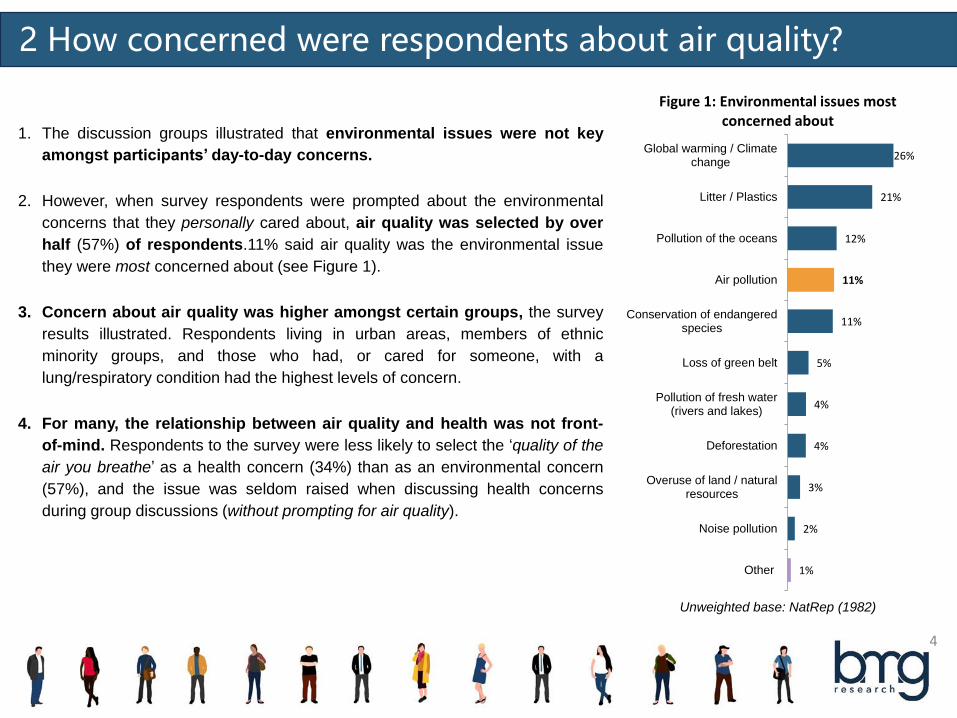
Figure 1: Environmental issues most concerned about
2 How concerned were respondents about air quality?
4
1. The discussion groups illustrated that environmental issues were not key
amongst participants’ day-to-day concerns.
2. However, when survey respondents were prompted about the environmental
concerns that they personally cared about, air quality was selected by over
half (57%) of respondents.11% said air quality was the environmental issue
they were most concerned about (see Figure 1).
3. Concern about air quality was higher amongst certain groups, the survey
results illustrated. Respondents living in urban areas, members of ethnic
minority groups, and those who had, or cared for someone, with a
lung/respiratory condition had the highest levels of concern.
4. For many, the relationship between air quality and health was not front-
of-mind. Respondents to the survey were less likely to select the ‘quality of the
air you breathe’ as a health concern (34%) than as an environmental concern
(57%), and the issue was seldom raised when discussing health concerns
during group discussions (without prompting for air quality).
Unweighted base: NatRep (1982)

32%
48%
50%
51%
Doesn't have, or carefor someone with, a
lung condition (2393)
Cares for someonewith lung condition
(312)
Has lung conditionand cares for
someone with lungcondition (154)
Has lung condition(701)
Figure 2: Air quality as a health concern: Lung conditions
5
2 How concerned were respondents about air quality?
5
5. Perceptions of air quality as a concern to health was highest amongst
survey respondents who had or cared for someone with a lung/respiratory
condition (see Figure 2). By contrast, the same difference was not evident
among those who had or cared for someone with a heart condition, or that were
pregnant or cared for very young children.
6. A variety of reasons were given in the discussion groups for a lack of
concern about the environment, including people:
• not having considered the issue;
• not feeling impacted;
• seeing the issue as unimportant;
• not feeling it is within their control to change.
A feeling of redundancy: “I think about it [the environment] but I don’t overthink about it. I listen to it when it's on the news to see what's going
on, and [if] it affects the weather and all that. But I don’t worry about it, to
be honest I don’t think we'd be able to fix something like that”
45-54, Male, SEG - D, Lydgate
Unweighted base: NatRep + Boost (3252)
= Significantly
higher than the total
= Significantly lower
than the total

6
3 How much did respondents know about air quality issues?
42%
24%16%
71%
10%6%
Transport/Traffic Industry Energy generation(e g fossil fuels)
18-24(284) 75+ (211)
Figure 3: Differences in perceptions ofmain causes of poor air quality in the UKby age
1. (Self-reported) knowledge of the effects of air quality on people’s health and
wellbeing was relatively low compared with their knowledge in other areas.
Around one in five survey respondents (21%) said they knew ‘a lot’ about the effects
of air quality on health. The proportions were higher amongst those who cared for
others with lung or heart conditions and/or were sufferers themselves. However
there was little difference between those who were pregnant or responsible for
young children and the overall figure.
2. Transport and traffic were considered to be the main cause of poor air quality.
A majority of survey respondents selected transport and traffic as the principle
cause of poor air quality in the UK (59%), far ahead of the proportion selecting
industry (18%), which was the second most cited response. Burning of wood and
coal in homes was only seen as the main cause of poor air quality by 3% of
respondents.
o This said, younger respondents were less likely to select transport as the
main cause of poor air quality than older respondents. Instead, their views
were more split (Figure 3).
3. Just under half (46%) of survey respondents felt the air quality in their local
area was ‘good enough’, with considerable differences in perceptions based
on geographical location and ethnicity. 42% of those living in urban areas said
the air quality in their area was ‘good enough’, compared to 67% of rural
respondents (Figure 4); and while half (49%) of white British/Irish respondents were
satisfied, this was only 28% of BME participants.
67%
42%
Rural (567)
Urban (2681)
Figure 4: Air Quality in my local area is ‘good enough’ by Urban/Rural
Unweighted base: NatRep + Boost (3252)
Unweighted base: NatRep + Boost (3252)

20%
21%
23%
23%
24%
25%
27%
32%
40%
50%
Minimising the number ofdeliveries to homes/ workplaces
Using environmentally-friendlycleaning products or paints
Eco-driving (e.g. minimisingbreaking and acceleration,…
Burning less/not at all the home(e. g. in stoves, wood burners,…
Using less energy at home
Buying your electricity from asustainable energy supplier
Not idling a vehicle
Using public transport instead ofmaking journeys in their own…
Switching to driving a lesspolluting vehicle
Walking or cycling instead ofmaking short journeys in a…
7
4 What were respondents prepared to do about air quality?
1. Transport related changes were regarded as those most likely
to have the greatest impact on reducing levels of air pollution,
according to the survey results (Figure 5). This is consistent with
transport being regarded as the main cause of air pollution.
2. Cost implications, inconvenience and force of habit were seen
as the main barriers to behaviour change. Cost was the most
frequently cited barrier to switching to less polluting cars (selected by
63% of survey respondents), buying energy from a sustainable
energy supplier (selected by 52%) and buying less polluting cleaning
products or paints (selected by 54%). Inconvenience and force of
habit were seen as the biggest barriers to behaviour change for the
other behaviours tested in the survey. For example, 60% said that
inconvenience was a reason people did not make fewer journeys by
car/motorcycle, with force of habit (38%) and preferring current
modes of transport (36%) the next most often selected responses.
Unweighted base: NatRep (2132)
Figure 5: Behaviours that were perceived to have a largeimpact on improving air quality
8
4 What were respondents prepared to do about air quality?
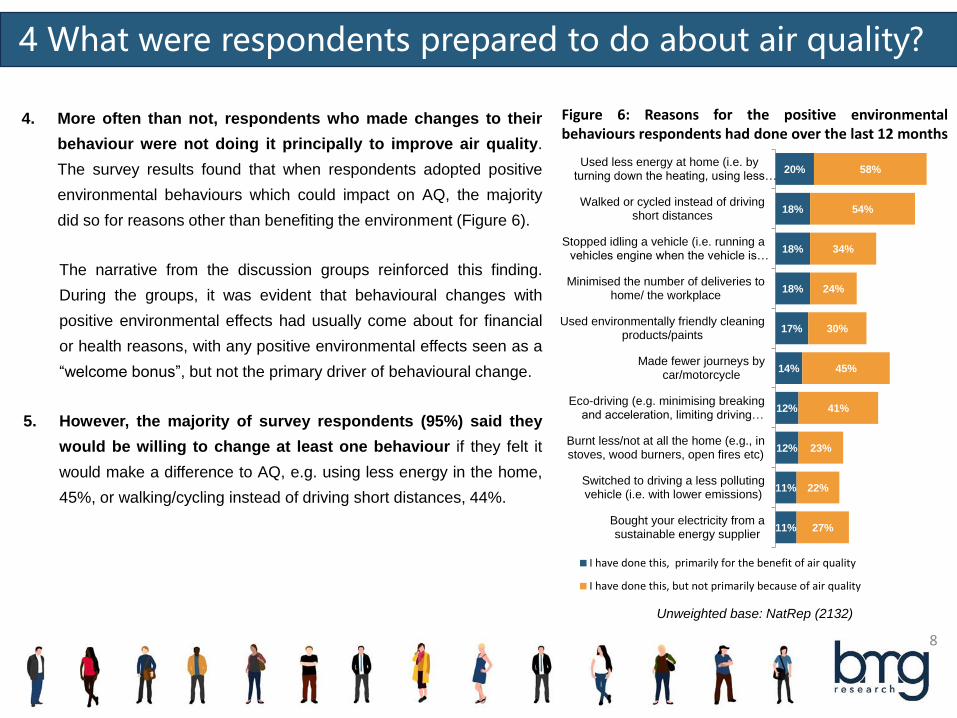
4. More often than not, respondents who made changes to their
behaviour were not doing it principally to improve air quality.
The survey results found that when respondents adopted positive
environmental behaviours which could impact on AQ, the majority
did so for reasons other than benefiting the environment (Figure 6).
The narrative from the discussion groups reinforced this finding.
During the groups, it was evident that behavioural changes with
positive environmental effects had usually come about for financial
or health reasons, with any positive environmental effects seen as a
“welcome bonus”, but not the primary driver of behavioural change.
5. However, the majority of survey respondents (95%) said they
would be willing to change at least one behaviour if they felt it
would make a difference to AQ, e.g. using less energy in the home,
45%, or walking/cycling instead of driving short distances, 44%.
11%
11%
12%
12%
14%
17%
18%
18%
18%
20%
27%
22%
23%
41%
45%
30%
24%
34%
54%
58%
Bought your electricity from asustainable energy supplier
Switched to driving a less pollutingvehicle (i.e. with lower emissions)
Burnt less/not at all the home (e.g., instoves, wood burners, open fires etc)
Eco-driving (e.g. minimising breakingand acceleration, limiting driving…
Made fewer journeys bycar/motorcycle
Used environmentally friendly cleaningproducts/paints
Minimised the number of deliveries tohome/ the workplace
Stopped idling a vehicle (i.e. running avehicles engine when the vehicle is…
Walked or cycled instead of drivingshort distances
Used less energy at home (i.e. byturning down the heating, using less…
I have done this, primarily for the benefit of air quality
I have done this, but not primarily because of air quality
Figure 6: Reasons for the positive environmentalbehaviours respondents had done over the last 12 months
Unweighted base: NatRep (2132)

9
5 What did respondents think about certain air quality improvement levers?
“Increasing taxes, if it hurts them in the
pocket it could change their behaviour”
"I support number two [increased taxes]. I wouldn't be happy
about it, but I can see the initiative it would
create."
“unfair on the lowest paid
workers”
“Worst [policy idea] is increasing taxes on high
polluting products because I don’t think it’s a good idea to just tax
everything”
1. Actions from government or other bodies that have no direct cost to the
individual were viewed as the most reasonable interventions, according to
the survey and discussion group results. When asked what policies they felt were
reasonable to take on air pollution, the options most frequently selected by
survey respondents were “Applying stricter controls on emissions from new
vehicles” (52%) and “Requiring industry to use best available technology” (52%).
2. Tax breaks for lower emitting vehicles were considered reasonable by just
under a half of the survey respondents (45%).
3. Overall, 38% of survey respondents felt that increasing taxes on the
highest polluting products was reasonable, with higher income, degree-
educated respondents most likely to support this.
4. There was less support for restrictions on in-home burning than there was
for other policy proposals. This may reflect a lack of awareness of the air
quality risks related to burning. However it was especially true for respondents
who burned in their homes: only 24% of burners felt that “Restricting burning
wood or coal in homes to clean up the most polluted areas” was reasonable,
compared with 35% of those who did not burn at home. Similarly, only 27% of
burners felt that introducing “Stricter controls on emissions from new stoves” was
reasonable compared with 38% of non-burners.
65-74, Female, SEG - B, London
25-34, Male, SEG - C1,
Birmingham 2
25-34, Female, SEG - C2, Birmingham 1
55-64, Male, SEG - C2,London

10
6 What did respondents want to know about air quality and from whom?
Figure 7: Who do you think hasresponsibility for improving thequality of the air in your local area?
1. Improving local air quality was regarded as a joint responsibility between local
and central government, local residents and local businesses, the survey
results suggested (Figure 7).
2. Many survey respondents were keen to be kept informed about air quality,
including wanting to know where the pollution hotspots were (52%), what was being
done to tackle them (51%), what people could do themselves to improve air quality
(41%), what they could do to protect themselves/others (36%); and up- to-date
measurement information (34%).
3. Under one in five (17%) had actively looked for a forecast on air quality
conditions over the last 12 months. Respondents with lung (30%) or heart (31%)
conditions were more likely to have searched for a forecast.
4. The majority of respondents (87%) felt the UK government had a duty to
inform the public about the risks associated with poor air quality. This was
echoed by discussion group participants.
5. There was strong support for poor air quality being reported in the media in
the same way as the pollen count. 82% of survey respondents agreed that it
should be. Unweighted base: NatRep (2132)
3%
10%
16%
16%
26%
26%
40%
48%
51%
59%
Other
Don’t know
Businesses outside thisarea
Farmers
Your local MP
People travelling throughthe area
Local businesses
Central government
Those living here
The local council
11
Domestic Burner (751):
26%
Non-Domestic Burner(2501):
12%
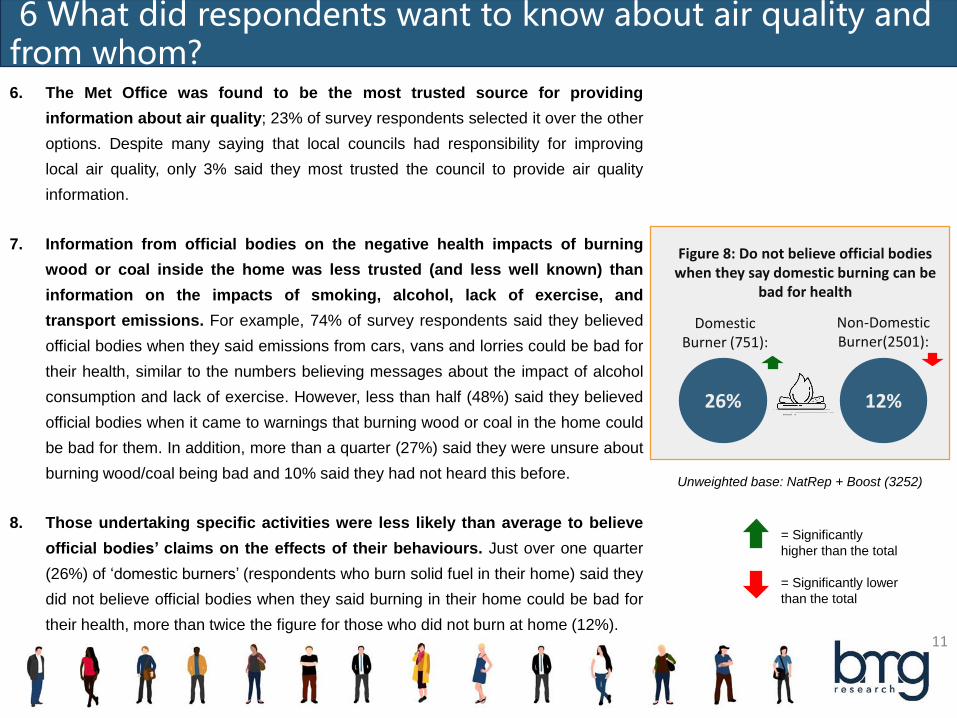
6. The Met Office was found to be the most trusted source for providing
information about air quality; 23% of survey respondents selected it over the other
options. Despite many saying that local councils had responsibility for improving
local air quality, only 3% said they most trusted the council to provide air quality
information.
7. Information from official bodies on the negative health impacts of burning
wood or coal inside the home was less trusted (and less well known) than
information on the impacts of smoking, alcohol, lack of exercise, and
transport emissions. For example, 74% of survey respondents said they believed
official bodies when they said emissions from cars, vans and lorries could be bad for
their health, similar to the numbers believing messages about the impact of alcohol
consumption and lack of exercise. However, less than half (48%) said they believed
official bodies when it came to warnings that burning wood or coal in the home could
be bad for them. In addition, more than a quarter (27%) said they were unsure about
burning wood/coal being bad and 10% said they had not heard this before.
8. Those undertaking specific activities were less likely than average to believe
official bodies’ claims on the effects of their behaviours. Just over one quarter
(26%) of ‘domestic burners’ (respondents who burn solid fuel in their home) said they
did not believe official bodies when they said burning in their home could be bad for
their health, more than twice the figure for those who did not burn at home (12%).
6 What did respondents want to know about air quality and from whom?
Figure 8: Do not believe official bodies when they say domestic burning can be
bad for health
Unweighted base: NatRep + Boost (3252)
= Significantly
higher than the total
= Significantly lower
than the total

12
Levels of environmental concern: Those who were more concerned about the environmentseemed more likely to have greater knowledge of air quality issues, and more likely to bewilling to, or already be taking, actions to improve air quality.
Proximity to areas with poor AQ: Those that lived in urban areas, closer to areas of higher air pollution, were more likely to be concerned about poor air quality.
Health conditions: Those with health conditions affected by the quality of the air, such as asthma or bronchitis, were more likely to be concerned about air quality, and take actions that will improve the quality of the air.
Additional demographic factors: Younger respondents, those with higher qualifications and BME respondents were the main demographic groups to show statically significant variation in the levels of concern about and knowledge of AQ and key AQ behaviours.
1.
2.
3.
4. Influence o
n v
iew
s &
be
havio
urs
KEY FINDING: Throughout this research project it has become evident that there are a wide number of factors associated with
respondents’ knowledge of, attitudes towards, and behaviours relating to AQ issues. However, having examined the results in some
detail, it is the authors’ view that there is likely to be a hierarchy of influence. First, as one might expect, it was clear from both the
survey and the discussion group results that level of environmental concern was strongly associated with knowledge, attitudes and
behaviour on AQ issues. Below that came respondents’ physical and medical proximity to the subject; with those who lived in areas
likely to have poorer AQ, and those with health conditions that are susceptible to poor AQ, being more likely to be aware of and
concerned about AQ. Finally, demographic and socioeconomic effects on attitudes and behaviours were evident from the results, but
these associations tended to be much weaker than those influences already described.
7 Factors that shape attitudes, knowledge & behaviours
13
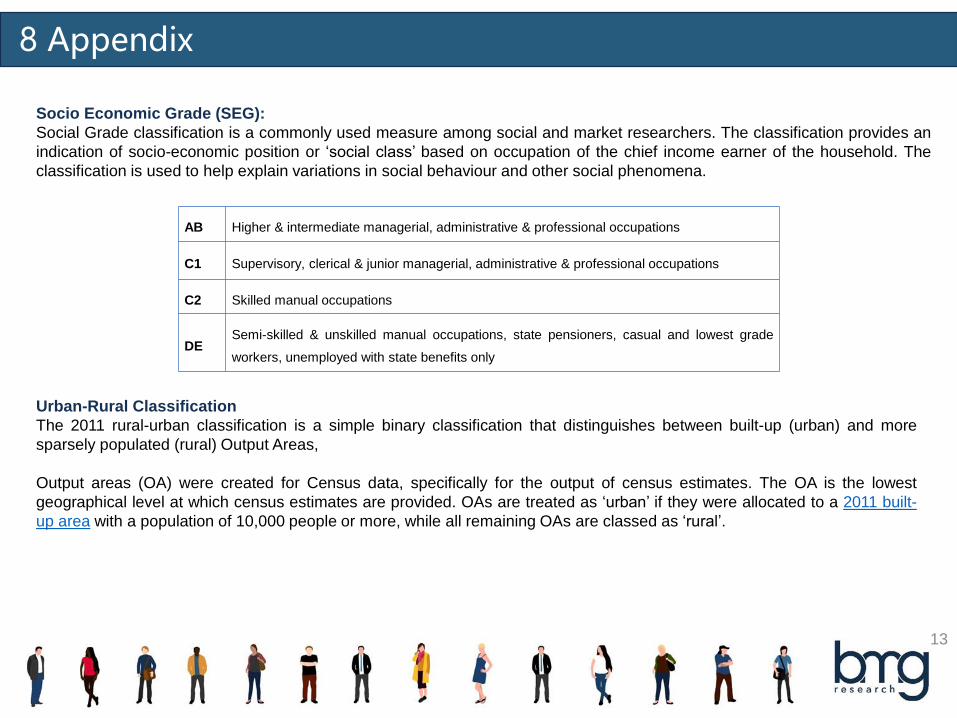
Socio Economic Grade (SEG):
Social Grade classification is a commonly used measure among social and market researchers. The classification provides an
indication of socio-economic position or ‘social class’ based on occupation of the chief income earner of the household. The
classification is used to help explain variations in social behaviour and other social phenomena.
AB Higher & intermediate managerial, administrative & professional occupations
C1 Supervisory, clerical & junior managerial, administrative & professional occupations
C2 Skilled manual occupations
DESemi-skilled & unskilled manual occupations, state pensioners, casual and lowest grade
workers, unemployed with state benefits only
Urban-Rural Classification
The 2011 rural-urban classification is a simple binary classification that distinguishes between built-up (urban) and more
sparsely populated (rural) Output Areas,
Output areas (OA) were created for Census data, specifically for the output of census estimates. The OA is the lowest
geographical level at which census estimates are provided. OAs are treated as ‘urban’ if they were allocated to a 2011 built-
up area with a population of 10,000 people or more, while all remaining OAs are classed as ‘rural’.
8 Appendix

14
BMG Research adheres to a number of industry recognised standards; including:
• Market Research Society Company Partner
• The provision of Market Research Services in accordance with ISO 20252:2012
• The provision of Market Research Services in accordance with ISO 9001:2008
• The International Standard for Information Security Management ISO 27001:2013
• Investors in People Standard - Certificate No. WMQC 0614
• Interviewer Quality Control Scheme (IQCS) Member Company
• A Fair Data organisation
• Cyber Essentials certification
• Registered under the Data Protection Act - Registration No. Z5081943
9 Quality Standards

15