public alternative schools and programs for …. department of education office of educational...
TRANSCRIPT
U.S. Department of EducationOffice of Educational Research and ImprovementNCES 2002–004
Public Alternative Schools and Programsfor Students At Risk of Education Failure:2000–01
Statistical Analysis Report
U.S. Department of EducationED Pubs8242-B Sandy CourtJessup, MD 20794-1398
Official BusinessPenalty for Private Use, $300
U.S. POSTAGE PAIDU.S. DEPARTMENTOF EDUCATION
PERMIT NO. G-17
NC
ESPub
lic A
lterna
tive Sc
hoo
ls and
Prog
ram
s for Stud
ents A
t Risk o
f Educ
atio
nal Fa
ilure: 2000–01
2002
NATIONAL CENTER FOR EDUCATION STATISTICS
Statistical Analysis Report September 2002
Public Alternative Schools andPrograms for Students At Risk ofEducation Failure: 2000–01
Brian KleinerRebecca PorchElizabeth FarrisWestat
Bernard GreeneProject OfficerNational Center for Education Statistics
U.S. Department of EducationOffice of Educational Research and Improvement NCES 2002–004

U.S. Department of EducationRod PaigeSecretary
Office of Educational Research and ImprovementGrover J. WhitehurstAssistant Secretary
National Center for Education StatisticsGary W. PhillipsDeputy Commissioner
The National Center for Education Statistics (NCES) is the primary federal entity for collecting, analyzing,and reporting data related to education in the United States and other nations. It fulfills a congressionalmandate to collect, collate, analyze, and report full and complete statistics on the condition of education inthe United States; conduct and publish reports and specialized analyses of the meaning and significanceof such statistics; assist state and local education agencies in improving their statistical systems; andreview and report on education activities in foreign countries.
NCES activities are designed to address high priority education data needs; provide consistent, reliable,complete, and accurate indicators of education status and trends; and report timely, useful, and highquality data to the U.S. Department of Education, the Congress, the states, other education policymakers,practitioners, data users, and the general public.
We strive to make our products available in a variety of formats and in language that is appropriate to avariety of audiences. You, as our customer, are the best judge of our success in communicatinginformation effectively. If you have any comments or suggestions about this or any other NCES product orreport, we would like to hear from you. Please direct your comments to:
National Center for Education StatisticsOffice of Educational Research and ImprovementU.S. Department of Education1990 K Street, NW Suite 900Washington, DC 20006–5650
September 2002
The NCES World Wide Web Home Page is: http://nces.ed.govThe NCES World Wide Web Electronic Catalog is: http://nces.ed.gov/pubsearch
Suggested CitationKleiner, B., Porch, R., and Farris, E. (2002). Public Alternative Schools and Programs for Students AtRisk of Education Failure: 2000–01 (NCES 2002–004). U.S. Department of Education. Washington, DC:National Center for Education Statistics.
Contact:Bernie Greene(202) 502–7348email: [email protected]

iii
EXECUTIVE SUMMARY
Background
Concern among the public, educators, andpolicymakers about violence, weapons, and drugson elementary and secondary school campuses,balanced with concern about sending disruptiveand potentially dangerous students “out on thestreets,” has spawned an increased interest inalternative schools and programs (U.S.Department of Education 1996). Many studentswho, for one reason or another, are not succeedingin regular public schools are being sent toalternative placements. In general, students arereferred to alternative schools and programs ifthey are at risk of education failure, as indicatedby poor grades, truancy, disruptive behavior,suspension, pregnancy, or similar factorsassociated with early withdrawal from school(Paglin and Fager 1997). The 2001 “DistrictSurvey of Alternative Schools and Programs,”conducted by the National Center for EducationStatistics (NCES) through its Fast ResponseSurvey System (FRSS), is the first national studyof public alternative schools and programs forstudents at risk of education failure to provide dataon topics related to the availability of publicalternative schools and programs, enrollment,staffing, and services for these students. Theresults presented in this report are based onquestionnaire data from a nationally representativesample of 1,534 public school districts. Althoughthere is no single commonly accepted definition ofwhat constitutes alternative schools and programs(Lange and Sletten 2002), this survey includedonly public alternative schools and programs thatwere geared towards students at risk of educationfailure, that were administered by regulardistricts1, and where students spent at least 50percent of their instructional time.
1 Regular districts are defined in the 1998–99 Common Core of Data
(CCD) as one of two types: 1) A local school district that is not acomponent of a supervisory union, and 2) a local school districtcomponent of a supervisory union sharing a superintendent andadministrative services with other local school districts.
Key Findings
Availability of and Enrollment in PublicAlternative Schools and Programs for At-RiskStudents
Few national-level measures are available withrespect to features of availability and enrollment inpublic alternative schools and programs forstudents at risk of education failure. The FRSSDistrict Survey of Alternative Schools andPrograms asked districts for information regardingoverall availability and locations of alternativeschools and programs; grades at which instructionwas offered; and a variety of questions related toenrollment, including overall numbers of studentsenrolled in alternative schools and programs aswell as the existence of capacity limitations andhow districts treat such problems. Results includethe following:
• Overall, 39 percent of public school districtsadministered at least one alternative school orprogram for at-risk students during the 2000–01 school year (table 1).2
• Urban districts, large districts (those with10,000 or more students), districts in theSoutheast, districts with high minority studentenrollments, and districts with high povertyconcentrations were more likely than otherdistricts to have alternative schools andprograms for at-risk students during the 2000–01 school year (table 1).
• Overall, there were 10,900 public alternativeschools and programs for at-risk students inthe nation during the 2000–01 school year(table 2).
• Fifty-nine percent (6,400) of all publicalternative schools and programs for at-risk
2 If elementary districts (i.e., districts with grades no higher than
grade 8) are excluded from consideration, 48 percent of (unified andsecondary) districts had at least one alternative school or programduring the 2000–01 school year.

iv
students were housed in a separate facility(i.e., not within a regular school) during the2000–01 school year (table 2). Results alsoindicate that districts administered fewalternative schools and programs that were injuvenile detention centers (4 percent of allpublic alternative schools and programs), thatwere in community centers (3 percent), or thatwere charter schools (1 percent).
• Overall, districts with one or more alternativeschool or program for at-risk students weremost likely to have just one such school orprogram (65 percent) (table 3). Large districtswere more likely than moderate-size districts,which in turn were more likely than smalldistricts, to have three or more alternativeschools or programs (56 percent vs. 16 percentvs. 7 percent, respectively).
• Of those districts offering alternativeeducation for at-risk students during the 2000–01 school year, alternative schools andprograms were offered at the secondary level(grades 9 through 12) by 88 to 92 percent ofdistricts, at the middle school level (grades 6through 8) by 46 to 67 percent of districts, andat the elementary school level (grades 1through 5) by 10 to 21 percent of districts(figure 1).
• As of October 1, 2000, 612,900 students, or1.3 percent of all public school students, wereenrolled in public alternative schools orprograms for at-risk students (table 2).3 Forty-three percent of districts with alternativeschools and programs for at-risk students hadless than 1 percent of their student populationenrolled in such schools and programs (table4).
• Overall, 12 percent of all students inalternative schools and programs for at-riskstudents were special education students withIndividualized Education Programs (IEPs)
3 Percentages are based on total district enrollment figures according
to the 2000–01 NCES CCD. In 2000–01, there were about 47million students in the nation’s public schools.
(not shown in tables).4 This percentage is notsignificantly different than the overallpercentage of special education students withIEPs enrolled in all public schools during the2000–01 school year (13 percent) (not shownin tables).5 While 29 percent of districts withalternative schools and programs had less than3 percent of alternative education studentswho were special education students withIEPs, roughly as many districts (34 percent)had 20 percent or more (table 5).
• About one-third (33 percent) of districts withalternative schools and programs for at-riskstudents had at least one such school orprogram that did not have the capacity toenroll new students during the 1999–2000school year (table 6). This was more likely tobe the case for large and moderate-sizedistricts than for small ones (43 and 39 percentvs. 25 percent).
• Fifty-four percent of districts with alternativeschools and programs for at-risk studentsreported that within the last 3 years there werecases where demand for enrollment exceededcapacity (not shown in tables). These districtsreported employing a variety of procedures insuch cases. Putting students on a waiting listwas the most common procedure of districtswhere demand exceeded capacity (83 percent)(table 7).
Alternative Schools and Programs: Entranceand Exit Criteria
Student enrollment in the nation’s publicalternative schools and programs is highly fluid.Students are removed from and returned to regularschools on an individual and daily basis, for avariety of reasons. Many public alternative schoolsand programs aim to return at-risk students toregular schools as soon as students are prepared todo so. Some students do return to regular schoolsless “at risk,” but many are sent back to or simply 4 An IEP is a special education program that is tailored to each
student’s needs according to his/her learning disability(s).
5 Percentage derived from the 2000–01 NCES CCD.

v
remain in (by choice or decree) an alternativeschool or program for the duration of theireducation (Quinn and Rutherford 1998). Resultsof the FRSS District Survey of AlternativeSchools and Programs include the followingfindings on criteria for transferring students intoand out of alternative schools and programs duringthe 2000–01 school year:
• Roughly half of all districts with alternativeschools and programs reported that each of thefollowing was a sufficient reason fortransferring at-risk students from a regularschool: possession, distribution, or use ofalcohol or drugs (52 percent); physical attacksor fights (52 percent); chronic truancy (51percent); continual academic failure (50percent); possession or use of a weapon otherthan a firearm (50 percent); disruptive verbalbehavior (45 percent); and possession or useof a firearm (44 percent) (table 8).6 Teenpregnancy/parenthood and mental healthneeds were least likely to be sole reasons fortransfer (28 and 22 percent).7
• With respect to the manner in which at-riskspecial education students with IEPs arrive atalternative schools and programs (e.g.,through the support of a director of specialeducation, or the recommendation of regularschool staff), an IEP team decision was themeans most commonly employed to a “largeextent” in these students’ placement (66percent) (table 9).
• While 74 percent of districts with alternativeschools and programs for at-risk studentsreported a policy that allowed all alternativeeducation students to return to a regularschool, 25 percent of districts allowed some,but not all, students to return, and 1 percentallowed none to return (table 10).
6 The counterintuitive result that a smaller percentage of districts
transferred students solely for possession of a firearm comparedwith other reasons may be due to the fact that districts may havepolicies requiring expulsion in case of firearm possession, andtransfer to an alternative school or program is not an option.
7 The finding for teen pregnancy/parenthood does not include the 27elementary districts that were asked this question.
• The reasons most likely to be rated as “veryimportant” in determining whether a studentwas able to return to a regular school wereimproved attitude or behavior (82 percent) andstudent motivation to return (81 percent) (table11).
Staffing, Curriculum and Services, andCollaboration
Whether students at risk of education failure areable to transfer back to regular schools orsuccessfully graduate from alternative schools andprograms may depend in part on the quality of theeducation and services they receive. Variousfactors have been identified as beneficial to at-riskstudents in alternative education environments,including dedicated and well-trained staff,effective curriculum, and a variety of supportservices provided in collaboration with an array ofagencies (Quinn and Rutherford 1998). Results ofthe FRSS District Survey of Alternative Schoolsand Programs include the following on suchfactors:
• Eighty-six percent of districts with alternativeschools and programs for at-risk students hiredteachers specifically to teach in such schoolsand programs (table 12). A smaller percentageof districts transferred teachers by choice froma regular school (49 percent), and an evensmaller percentage assigned teachersinvoluntarily to positions in alternative schoolsand programs (10 percent).
• Overall, many districts with alternativeschools and programs for at-risk students hadpolicies requiring a wide variety of servicesand practices for alternative education students(table 13).8 Over three-quarters of the districtshad curricula leading toward a regular highschool diploma (91 percent), academiccounseling (87 percent), policies requiring a
8 Since some of the services were not relevant at the elementary level
(e.g., career counseling, preparation for the GED exam, etc.), toensure comparability across services, the 27 elementary districtsthat were asked questions about services were excluded from thefindings presented in table 13.
vi
smaller class size than in regular schools (85percent), remedial instruction (84 percent),opportunity for self-paced instruction (83percent), crisis/behavioral intervention (79percent), and career counseling (79 percent).Least commonly required were extendedschool day or school year (29 percent),security personnel on site (26 percent), andevening or weekend classes (25 percent). Onaverage, districts required 9.5 of the 16services asked about in the survey (not shownin tables).
• The type of collaboration most widelyreported by districts with alternative schoolsand programs for at-risk students was with thejuvenile justice system (84 percent). Seventy-five percent of districts collaborated withcommunity mental health agencies, 70 percentcollaborated with police or sheriff’sdepartments, and 69 percent collaborated withchild protective services (table 14).Collaboration with parks and recreationdepartments was least commonly cited bydistricts (23 percent).
vii
Table of Contents
Section Page
Executive Summary................................................................................................. iii
1 Introduction............................................................................................................. 1
Previous Research .................................................................................... 2Survey Background................................................................................... 2Organization of Report.............................................................................. 4
2 Availability and Enrollment in Public Alternative Schools and Programs for StudentsAt Risk of Education Failure .................................................................................... 5
Availability of Public Alternative Schools and Programs for At-RiskStudents ....................................................................................... 5
Enrollment in Public Alternative Schools and Programs forAt-Risk Students........................................................................... 10
3 Alternative Schools and Programs for Students At Risk of Education Failure:Entrance and Exit Criteria ........................................................................................ 17
Entrance Criteria ....................................................................................... 17Exit Criteria .............................................................................................. 21
4 Staffing, Curriculum and Services, and Collaboration................................................. 25
Staffing .................................................................................................... 25Curriculum and Services ........................................................................... 27Collaboration with Other Agencies ............................................................ 29
5 Summary and Conclusions ....................................................................................... 33
Availability and Enrollment....................................................................... 33Entrance and Exit Criteria ......................................................................... 34Staffing, Curriculum and Services, and Collaboration.................................. 34
References .............................................................................................................. 37
List of Appendices
Appendix Page
A Survey Methodology................................................................................................ A-1
B Tables of Standard Errors......................................................................................... B-1
C Survey Questionnaire............................................................................................... C-1

viii
Table of Contents (continued)
List of Text TablesTable Page
1 Percent of districts with alternative schools and programs for at-risk students, bydistrict characteristics: Academic year 2000–01.......................................................... 6
2 Total number of public alternative schools and programs for at-risk students, number ofstudents enrolled, and number of specific types: Academic year 2000–01...................... 7
3 Percentage distribution of districts with alternative schools and programs for at-riskstudents, grouped by number of schools and/or programs per district, by districtcharacteristics: Academic year 1999–2000 .................................................................. 8
4 Percentage distribution of districts with alternative schools and programs for at-riskstudents, grouped by percent of students enrolled as of October 1, 2000, by districtcharacteristics: Academic year 2000–01...................................................................... 11
5 Percentage distribution of districts with alternative schools and programs for at-riskstudents, grouped by percent of students with Individualized Education Programs(IEPs) in these schools and programs as of October 1, 2000, by district characteristics:Academic year 2000–01............................................................................................. 12
6 Percent of districts with alternative schools and programs for at-risk students that wereunable to enroll new students in an alternative school or program, by districtcharacteristics: Academic year 1999–2000 .................................................................. 13
7 Percent of districts with alternative schools and programs for at-risk students thatemployed various procedures when demand for enrollment exceeded available capacitywithin the last 3 years, by district characteristics: Academic years 1998–2001 ............... 15
8 Percent of districts with alternative schools and programs for at-risk students thatreported that students could be transferred to an alternative school or program solely onthe basis of various reasons, by district characteristics: Academic year 2000–01 ............ 18
9 Percentage distribution of districts with alternative schools and programs for at-riskstudents that reported the extent to which various means influence the placement ofspecial education students with Individualized Education Programs (IEPs) inalternative schools and programs: Academic year 2000–01........................................... 21
10 Percentage distribution of districts with alternative schools and programs for at-riskstudents that reported a policy that allows all, some, or no students enrolled to return toa regular school, by district characteristics: Academic year 2000–01............................. 22
11 Percent of districts with alternative schools and programs for at-risk students that citedvarious reasons as “very important” in determining whether an enrolled student canreturn to a regular school, by district characteristics: Academic year 2000–01................ 23
ix
Table of Contents (continued)
List of Text TablesTable Page
12 Percent of districts with alternative schools and programs for at-risk students that usedvarious practices for hiring alternative school and program teachers, by districtcharacteristics: Academic year 2000–01...................................................................... 26
13 Percent of districts with alternative schools and programs for at-risk students thatreported various required services or practices be made routinely available to enrolledstudents, by district characteristics: Academic year 2000–01 ........................................ 27
14 Percent of districts with alternative schools and programs for at-risk students thatcollaborated with various agencies in order to provide services for enrolled students, bydistrict characteristics: Academic year 2000–01........................................................... 30
List of Text FiguresFigure Page
1 Percent of districts with alternative schools and programs for at-risk students thatoffered alternative schools and programs for prekindergarten through grade 12:Academic year 2000–01............................................................................................. 9
2 Percent of districts with alternative schools and programs for at-risk students wherenew enrollment needs exceeded available capacity between the months of August 1999and June 2000, by month: Academic year 1999–2000 .................................................. 14
3 Percentage distribution of districts with alternative schools and programs for at-riskstudents, grouped by the number of various services or practices made routinelyavailable to enrolled students: Academic year 2000–01 ............................................... 29
4 Percentage distribution of districts with alternative schools and programs for at-riskstudents, grouped by the number of various agencies the district reported collaboratingwith to provide services to enrolled students: Academic year 2000–01 .......................... 32

x

1
1. INTRODUCTION
Although alternative forms of education took rootin the United States in the early 19th century, theirwidespread adoption and proliferation did notoccur until the 1960s and 1970s (Miller 1995).Alternative education has historically serveddiverse populations of students, including thosewhose family’s academic, social, political, orreligious values diverged from the mainstream, aswell as those who were unsuccessful within theregular public school system. Raywid (1994, p.26) notes that despite the multiplicity of forms ofalternative education, two characteristics havebeen present from the start: “They have beendesigned to respond to a group that appears not tobe optimally served by the regular program, andconsequently they have represented varyingdegrees of departure from standard schoolorganization, programs, and environments.”9
Concern among the public, educators, andpolicymakers about violence, weapons, and drugson elementary and secondary school campuses,balanced with concern about sending disruptiveand potentially dangerous students “out on thestreets,” has spawned an increased interest inalternative schools and programs (U.S.Department of Education 1996). Many studentswho, for one reason or another, are not succeedingin regular public schools are being sent toalternative placements. In general, students arereferred to alternative schools and programs ifthey are at risk of education failure, as indicatedby poor grades, truancy, disruptive behavior,suspension, pregnancy, or similar factors
9 Raywid classified alternative schools and programs into 3 main
types, although particular schools or programs may have features ofmore than one type. Type I alternatives are schools of choice andgenerally have high success rates. Type II alternatives are schools inwhich students are placed, usually as a last chance prior toexpulsion. They focus on behavior modification, but involve littleattention to pedagogy or curriculum. Type III alternatives focus onremediation or rehabilitation. Students are usually referred to typeIII alternatives. Although the difference between choice, placement,and referral is a significant one, the current study focuses on allalternatives for students at risk of education failure, and does notplace emphasis on the distinction between these types.
associated with early withdrawal from school(Paglin and Fager 1997). With the passage of theGun Free Schools Act (GFSA) (U.S. Public Law103–882), districts are required to expel studentsfor at least one year for bringing a firearm toschool. However, the GFSA permits local districtsto refer expelled students to alternativeplacements. During the 1998–99 school year,3,523 students were expelled for bringing afirearm to school, and 44 percent were referred toan alternative placement (Gray and Sinclair 2000).
Few existing national-level measures have focusedon topics related to the availability of publicalternative schools and programs, enrollment,staffing, and services for students at risk ofeducation failure. The agencies that requested thissurvey (Safe and Drug-Free Schools Program andthe Office of Special Education and RehabilitativeServices) were especially interested in examiningwhy students are transferred to alternative schoolsand programs (for example, weapon or drugpossession), and whether special educationstudents are overrepresented in the nation’salternative schools and programs. The 2001“District Survey of Alternative Schools andPrograms,” conducted by the National Center forEducation Statistics (NCES) through its FastResponse Survey System (FRSS), is the firstnational study of public alternative schools andprograms for students at risk of education failurein the United States to provide data on thesetopics. Although there is a great variety of types ofalternative schools and programs (Mintz 1995),this survey included only public alternativeschools and programs that were geared towardsstudents at risk of education failure, that wereadministered by regular districts10, and wherestudents spent at least 50 percent of theirinstructional time.
10Regular districts are defined in the 1998–99 Common Core of Data
(CCD) as one of two types: 1) A local school district that is not acomponent of a supervisory union, and 2) a local school districtcomponent of a supervisory union sharing a superintendent andadministrative services with other local school districts.

2
Previous Research
Little is known about the overall current state ofpublic alternative education across the nation.Although estimates vary, data indicate that thenumber of alternative schools increased during the1990s. For example, according to the NationalCenter for Education Statistics (NCES) CommonCore of Data (CCD), in the school year 1993–94,there were 2,606 public alternative schools,compared to 3,850 public alternative schools in1997–98 (Hoffman 2001). Note that these findingsdid not include alternative programs locatedwithin regular schools.11 The National AlternativeHigh School Youth Risk Behavior Survey(Grunbaum et al. 1999) found that in 1998–99there were 1,390 alternative high schools servingapproximately 280,000 students at risk ofeducation failure (2 percent of all high schoolstudents).12
Individual states appear to be stepping up theprovision of alternative education for students thatare not meeting public school expectations. Forinstance, the state of Washington expanded itsnumber of alternative schools from 44 in the mid-1970s to more than 180 in 1995, and Oregon lawnow requires that districts provide alternativeeducation to students who are not succeeding inregular schools (Boss 1998). In 2000, a Michiganstatewide study revealed that 5 percent of all highschool students were enrolled in the state’s 360alternative education programs, most of whichserve at-risk students (Michigan AlternativeEducation Study Project 2000).
Although advocates have reported the successes ofmany at-risk students at alternative schools andprograms, “there is still very little consistent,wide-ranging evidence of their effectiveness oreven an understanding of their characteristics”(Lange and Sletten 2002, p. 2). This is due, in part,to there being as yet no clearly established, widely
11Even less is known about alternative programs located in regular
schools.
12The National Alternative High School Youth Risk Behavior Surveyfindings may differ from those of the 1997–98 CCD because ofdefinitional differences – the former study included public, private,and Catholic secondary schools that were not programs or schoolswithin other regular schools.
accepted definitional framework of alternativeschools and programs. In addition, national-levelstudies on the characteristics of alternative schoolsand programs and rigorous evaluation research onthe links between characteristics and outcomes arein short supply (Lange and Sletten 2002).
Survey Background
The FRSS District Survey of Alternative Schoolsand Programs was conducted in early 2001.Questionnaires were sent to a nationallyrepresentative sample of 1,609 regular districts,along with a cover letter introducing the surveyand requesting that the questionnaire be completedby the person(s) most knowledgeable about thealternative schools and programs (if any) in thesampled district. Of the 1,609 districts sampled,completed surveys were received from 1,540districts (a response rate of 97 percent). Of the1,540 districts that completed surveys, 6 were laterexcluded from the sample because they were notregular districts, but rather were “regional”districts that served multiple districts and specialpopulations of students (i.e., at-risk or specialeducation). Regular districts included in thissurvey were of three types: unified, secondary, andelementary. Unified districts serve students acrossall grade levels and comprised 83 percent of thetotal sample. Secondary districts comprised 2percent, and elementary districts comprised 15percent of the sample.13
Although alternative education is provided in theUnited States in a multitude of forms for variedpopulations by a wide range of agencies, thisstudy’s scope was limited to:
• public 14 alternative schools or programs for at-risk students,
13Elementary districts were comprised of grade levels no higher than
grade 8. They were included in the sample in order to ascertain thefull range of grade levels at which public alternative education isavailable for at-risk students.
14The survey was limited to public alternative schools and programsfor several reasons. First, including the private sector along with thepublic sector would have been beyond the scope of FRSS surveys,which have always been limited to a single education sector.

3
• public alternative schools or programsadministered by districts, and
• public alternative schools or programs wherethe majority of students attend for at least halfof their instructional time,
and included:
• charter schools (for at-risk students),
• alternative schools or programs (administeredby districts) within juvenile detention centers,
• community-based schools or programs(administered by districts, but located withincommunity organizations), and
• alternative schools or programs that operatedduring weekday evenings or weekends.
Excluded from the scope of the survey were:
• alternative schools or programs that were notfor at-risk students (e.g., gifted and talentedprograms, magnet schools),
• alternative schools or programs notadministered by districts (e.g., regionalschools, private schools),
• alternative schools or programs where themajority of students attend for less than half oftheir instructional time,
• alternative schools or programs thatexclusively serve special education students,
• vocational education programs (unlessspecifically designated for at-risk students),
• child care/day care centers,
• privately run sites contracted by districts, and
• short-term in-school suspension programs(lasting 2 weeks or less), detention, or in-homeprograms for ill or injured students.
For the purposes of the survey, “at-risk” wasdefined as involving the risk of education failure,as indicated by poor grades, truancy, disruptive
Second, there is nothing comparable to a “district” for privateschools.
behavior, pregnancy, or similar factors associatedwith temporary or permanent withdrawal fromschool. Alternative schools were defined as being“usually housed in a separate facility wherestudents are removed from regular schools,”whereas alternative programs were defined asbeing “usually housed within regular schools.”Providing districts with the list of inclusions andexclusions constituting the scope of the studymeant that certain populations and forms ofalternative education would not fall within thepurview of the study (e.g., schools and programsfor gifted and talented students, private schools,regional schools and other schools notadministered by districts, and schools or programswhere students spend a small portion of theirschool time).
Since public school districts are mostknowledgeable about the schools and programsthat they actually administer (whereas they mightnot be appropriate respondents with respect toalternative forms of education outside their owndirection), limiting the scope of the survey in thisway should lend greater credence to the validity ofthe findings. For instance, some alternativeschools are administered by “regional districts.” Insuch cases, students from more than one districttypically attend the same regional alternativeschool, but none of the districts from which thestudents come actually administer the alternativeschool. Such districts would not be asked to reporton those regional alternative schools since theymight not be able to provide valid information.
The district characteristics used as analysisvariables for this report are metropolitan status(urban, suburban, and rural), district enrollmentsize, geographic region, percent minorityenrollment, and poverty concentration. Thesevariables are defined in appendix A. It should bekept in mind that certain district characteristicsmay be related to each other. Also, particulardistrict characteristics may be related to districttypes (unified, elementary, and secondary).Questionnaire responses were weighted to producenational estimates representing all regular publicschool districts in the United States. Allcomparative statements in this report were testedfor statistical significance using t-tests adjusted formultiple comparisons using the Bonferroni

4
adjustment and are significant at the 0.05 level.Not all significant comparisons, however, arecited. Throughout this report, differences thatappear large may not be statistically significant.This is due in part to the relatively large standarderrors surrounding the estimates (because of therelatively small sample size), and the use of theBonferroni adjustment to control for multiplecomparisons. Appendix A provides a detaileddiscussion of the sample and survey methodology.
Organization of Report
The following pages present findings related tovarious facets of public alternative education inthe United States during the 2000–01 school year(and for several survey items, the 1999–2000
school year). Chapter 2 provides results regardingthe availability of and enrollment in alternativeschools and programs for at-risk students.Information is also presented on proceduresfollowed when available capacity for enrollment isexceeded. Chapter 3 presents findings on howstudents arrive at and exit from alternative schoolsand programs for at-risk students. Chapter 4discusses staffing, services provided for studentsat alternative schools and programs, andcollaboration with other agencies in the provisionof services. The concluding chapter highlightsfindings from the study and draws some generalconclusions. Technical information on the study’smethodology and tables of standard errors for alldata presented in this report are included inappendices A and B. Appendix C presents thesurvey questionnaire.
5
2. AVAILABILITY AND ENROLLMENTIN PUBLIC ALTERNATIVE SCHOOLSAND PROGRAMS FOR STUDENTS AT
RISK OF EDUCATION FAILURE
The 1998 National Youth Risk Behavior Surveycited 1,390 alternative high schools servingapproximately 280,000 at-risk students (2 percentof all high school students) across the nation(Grunbaum et al. 1999). However, that study waslimited to high school populations in alternativeschools located on separate campuses, and further,included both public and private alternativeschools. The current survey presents findings onall grades offered in public (and not private)alternative schools or programs that may belocated in separate facilities or within regularschools.
Few national level measures are available withrespect to features of enrollment in publicalternative schools and programs for at-riskstudents. The FRSS District Survey of AlternativeSchools and Programs asked districts a variety ofquestions related to availability and enrollment.Presented below are findings regarding overallavailability and locations of alternative schoolsand programs, grades offered, and a set of findingsrelated to enrollment, including overall numbers ofstudents enrolled in alternative schools andprograms, as well as the existence of capacitylimitations and how districts treat such problems.
Availability of Public AlternativeSchools and Programs forAt-Risk Students
Districts with alternative schools and programsfor at-risk students. Districts were first askedwhether they administered alternative schools andprograms for students at risk of education failureduring the 2000–01 school year, and if so, how
many.15 Table 1 shows the level of district-administrated alternative schools and programs, bydistrict characteristics. Overall, 39 percent ofpublic school districts administered at least onealternative school or program for at-risk studentsduring the 2000–01 school year.16
The presence of alternative schools and programsfor at-risk students varied by districtcharacteristics. For example, urban districts (66percent) were more likely than suburban (41percent) and rural ones (35 percent) to havealternative schools and programs. Large districts(those with 10,000 or more students) were morelikely than moderate-size ones (2,500 to 9,999students), which in turn were more likely thansmall districts (less than 2,500 students) to havealternative schools and programs for at-riskstudents (95 percent vs. 69 percent vs. 26 percent).
Districts in the Southeast were more likely thanthose in the Northeast, Central, and Westernregions to have alternative schools and programsfor at-risk students (80 percent vs. 28 to 44percent). Also, districts in the West were morelikely than those in the Northeast and Centralregions to have them (44 percent vs. 31 and 28percent). With respect to minority enrollment,districts with 5 percent or less of minority students
15“Regional alternative schools” (i.e., those shared by more than one
district) not administered by sampled districts were not included.However, a follow-up study (see appendix A) revealed that a smallpercentage of districts (roughly 3 percent) mistakenly includedsome alternative schools that they did not administer.
16If elementary districts are excluded (i.e., districts with grades nohigher than grade 8), 48 percent of (unified and secondary) districtshad at least one alternative school or program during the 2000–01school year.

6
Table 1.—Percent of districts with alternativeschools and programs for at-riskstudents, by district characteristics:Academic year 2000–01
Characteristic Percent
Total ................................................... 39
Metropolitan statusUrban...................................................... 66Suburban ................................................. 41Rural....................................................... 35
District enrollment sizeLess than 2,500 ........................................ 262,500 to 9,999.......................................... 6910,000 or more......................................... 95
RegionNortheast ................................................. 31Southeast ................................................. 80Central .................................................... 28West ....................................................... 44
Percent minority enrollment1
5 percent or less........................................ 266 to 20 percent ......................................... 4321 to 50 percent........................................ 51More than 50 percent ................................ 62
Poverty concentration2
10 percent or less...................................... 3111 to 20 percent........................................ 43More than 20 percent ................................ 45
1Estimates are based on the 1,515 districts for which data on percentminority enrollment were available.2Estimates are based on the 1,503 districts for which data on povertyconcentration were available. Poverty concentration is based onCensus Bureau data on the percentage of children ages 5–17 infamilies below the poverty level within districts in 1996–97.
SOURCE: U.S. Department of Education, National Center forEducation Statistics, Fast Response Survey System, “District Surveyof Alternative Schools and Programs,” FRSS 76, 2001.
were less likely to have alternative schools andprograms for at-risk students than those with 6 to20 percent, 21 to 50 percent, and more than 50percent minority enrollments (26 percent vs. 43 to62 percent). As for poverty concentration, districtswith a low poverty concentration (10 percent orless of students at or below the poverty level) wereless likely than those with moderate (11 to 20percent of students in poverty) and high (morethan 20 percent in poverty) poverty concentrationsto have alternative schools or programs for at-risk
students (31 percent vs. 43 and 45 percent).17
Table A-2 in appendix A presents the number andpercentage distribution of districts with alternativeschools and programs for at-risk students acrossdistrict characteristics.
Number and sites of alternative schools andprograms for at-risk students within districts.Districts indicating that they administeredalternative schools or programs for at-risk studentsduring the 2000–01 school year were then askedhow many they administered. Overall, there were10,900 public alternative schools and programs forat-risk students in the nation (table 2).18 Manypublic alternative schools had sites in separatefacilities (i.e., not within a regular school),sometimes specifically within juvenile detentioncenters or community centers. In addition, somedistricts operated charter schools that serve at-riskstudents. Districts with alternative schools andprograms for at-risk students were asked howmany were: a) housed within a separate facility(i.e., not within a regular school), b) charterschools, c) in juvenile detention centers, and d) incommunity-based schools.19
17It should be kept in mind that some district characteristics used for
independent analyses are related to each other. For example, districtenrollment size and region are related, with districts in theSoutheast typically being larger than those in other regions.Similarly, poverty concentration and minority enrollment are alsorelated to district size (and to each other), since districts with highpoverty concentration and high minority enrollment tend to havehigher enrollments. In addition, the distribution of district types(unified, elementary, secondary) may be related to particular districtcharacteristics. For example, among all 1,534 districts in thesample, 2 percent of districts in the Southeast were elementary ones,whereas 20 percent of districts in both the Northeast and West wereelementary ones. Because of the relatively small sample used in thisstudy, it is difficult to separate the independent effects of thesevariables. Their relationship, however, should be considered in theinterpretation of the data presented in this report.
18Estimates in table 2 are based on results from the relatively small setof 848 surveyed districts that had at least one alternative school orprogram, weighted to national totals. Standard errors for theseestimates may be found in table B-2 in appendix B.
19Responses to these questions were not mutually exclusive, so that,for example, charter schools might be housed in a separate facility.Also, it should be noted that the list of possible sites was not meantto be exhaustive, but reflected the specific interests of the Safe andDrug-Free Schools Program and the Office of Special Educationand Rehabilitative Services.

7
Table 2 shows that 6,400 (59 percent) of the10,900 public alternative schools and programs forat-risk students were housed in separate facilities(i.e., not within a regular school) during the 2000–01 school year. Results also indicate that districtsadministered few alternative schools and programs
for at-risk students that were in juvenile detentioncenters (450, or 4 percent of all public alternativeschools and programs), that were in communitycenters (350, or 3 percent), or that were charterschools (150, or 1 percent).
Table 2.—Total number of public alternative schools and programs for at-risk students, number ofstudents enrolled, and number of specific types: Academic year 2000–01
Public alternative school and program types and enrollments Number
Public alternative schools and programs......................................................................................... 10,900
Students enrolled in public alternative schools and programs1........................................................... 612,9003
Special education students with IEPs enrolled in public alternative schools and programs1 .................. 70,3004
Public alternative schools and programs housed in a separate facility ................................................ 6,4005
Public alternative schools and programs in juvenile detention centers2............................................... 4506
Public alternative schools and programs that are community-based2.................................................. 3507
Public alternative schools and programs that are charter schools for at-risk students2 .......................... 1508
1Numbers reflect enrollment figures as of October 1, 2000, according to survey results.
2The survey asked about sites like juvenile detention centers, community centers, and charter schools due to interest by the data requesters, butthis list is not exhaustive. Responses to these questions were not mutually exclusive.3The number of students enrolled in public alternative schools and programs represents about 1.3 percent of the total number of students enrolledin all public schools (about 47,000,000).
4The number of special education students with IEPs enrolled in public alternative schools and programs represents about 12 percent of the totalnumber of at-risk students enrolled in public alternative schools and programs.5The number of public alternative schools and programs housed in separate facilities represents about 59 percent of the total number of publicalternative schools and programs for at-risk students.
6The number of public alternative schools and programs in juvenile detention centers represents about 4 percent of the total number of publicalternative schools and programs for at-risk students.7The number of public alternative schools and programs that are community-based represents about 3 percent of the total number of publicalternative schools and programs for at-risk students.
8The number of public alternative schools and programs that are charter schools for at-risk students represents about 1 percent of the total numberof public alternative schools and programs for at-risk students.
SOURCE: U.S. Department of Education, National Center for Education Statistics, Fast Response Survey System, “District Survey of AlternativeSchools and Programs,” FRSS 76, 2001.
8
The distribution of districts that had one, two, orthree or more alternative schools or programs forat-risk students is presented in table 3. Overall,these districts were most likely to have just onesuch school or program (65 percent). Of those thathad three or more alternative schools or programs,results varied by metropolitan status, district size,and minority enrollment.20 Urban districts (52percent) were more likely than suburban ones (18percent), which were more likely than rural ones
20Although districts in the Southeast are relatively larger in size and
are more likely to have at least one alternative school or program,these findings indicate that this region is no more likely than otherregions to administer higher numbers of alternative schools andprograms.
(8 percent), to have three or more schools orprograms. Similarly, large districts (56 percent)were more likely than moderate-size districts (16percent), which in turn were more likely thansmall districts (7 percent), to have three or morealternative schools or programs. With respect tominority enrollment, districts with more than 20percent minority enrollment were more likely thanthose with 5 percent or less of minority students tohave three or more (22 percent vs. 10 percent).
Table 3.—Percentage distribution of districts with alternative schools and programs for at-riskstudents, grouped by number of schools and/or programs per district, by districtcharacteristics: Academic year 1999–2000
CharacteristicOne alternative
school or program
Two alternative
schools and/or
programs
Three or more
alternative schools
and/or programs
Total .............................................................................................. 65 18 17
Metropolitan statusUrban................................................................................................ 33 15 52Suburban............................................................................................ 63 19 18Rural ................................................................................................. 74 17 8
District enrollment sizeLess than 2,500................................................................................... 82 11 72,500 to 9,999 .................................................................................... 58 26 1610,000 or more................................................................................... 27 17 56
RegionNortheast ........................................................................................... 71 13 16Southeast ........................................................................................... 71 14 15Central............................................................................................... 65 21 14West .................................................................................................. 60 20 21
Percent minority enrollment1
5 percent or less.................................................................................. 75 15 106 to 20 percent.................................................................................... 63 20 1721 to 50 percent .................................................................................. 63 16 22More than 50 percent .......................................................................... 58 20 22
Poverty concentration2
10 percent or less................................................................................ 68 15 1611 to 20 percent .................................................................................. 59 22 20More than 20 percent .......................................................................... 71 15 14
1Estimates are based on the 840 districts with alternative schools and programs for which data on percent minority enrollment were available.2Estimates are based on the 843 districts with alternative schools and programs for which data on poverty concentration were available. Povertyconcentration is based on Census Bureau data on the percentage of children ages 5–17 in families below the poverty level within districts in 1996–97.
NOTE: Percentages are based on the 39 percent of districts that reported administrating at least one alternative school or program during the2000–01 school year. Detail may not sum to totals because of rounding.
SOURCE: U.S. Department of Education, National Center for Education Statistics, Fast Response Survey System, “District Survey of AlternativeSchools and Programs,” FRSS 76, 2001.

9
Of those districts with alternative schools andprograms for at-risk students during the 2000–01school year, alternative schools and programswere offered at the secondary level (grades 9through 12) by 88 to 92 percent of districts, at the
middle school level (grades 6 through 8) by 46 to67 percent of districts, and at the elementaryschool level (grades 1 through 5) by 10 to 21percent of districts (figure 1).
Figure 1.—Percent of districts with alternative schools and programs for at-risk students thatoffered alternative schools and programs for prekindergarten through grade 12:Academic year 2000–01
92929288
6763
46
2117
131110
17
0
20
40
60
80
100
PK K 1st 2nd 3nd 4th 5th 6th 7th 8th 9th 10th 11th 12th
Grade
Percent
NOTE: Percentages are based on the 39 percent of districts that reported administrating at least one alternative school or program during the2000–01 school year.
SOURCE: U.S. Department of Education, National Center for Education Statistics, Fast Response Survey System, “District Survey of AlternativeSchools and Programs,” FRSS 76, 2001.

10
Enrollment in Public AlternativeSchools and Programs forAt-Risk Students
Overall enrollment as of October 1, 2000. As ofOctober 1, 2000, 612,900 students, or 1.3 percentof all public school students, were enrolled inpublic alternative schools or programs for studentsat risk of education failure (table 2).21 Overall, 43percent of districts with alternative schools andprograms for at-risk students had less than 1percent of their student population enrolled in suchschools or programs (table 4). Of the 16 percent ofdistricts with 3 percent or more of total studentsenrolled, there was little variation by districtcharacteristics.22 One exception was variation byregion; districts in the West were more likely thanthose in the Northeast and Southeast to enroll 3percent or more of their students in alternativeschools and programs as of October 1, 2000 (23percent vs. 8 and 5 percent). Also, districts in theCentral region were more likely than those in theSoutheast to do so (20 percent vs. 5 percent).These differences show that whereas districts inthe Southeast were more likely than districts inother regions to have alternative schools andprograms (see table 1), smaller proportions of theirstudents were actually enrolled in them (at leastcompared to districts in the West and Centralregions).
Enrollment of special education students.Districts were asked how many of the alternativeeducation students who were enrolled as ofOctober 1, 2000 were special education studentswith Individualized Education Programs (IEPs).An IEP is a special education program that istailored to each student’s needs according tohis/her disability(s). Overall, 12 percent of allstudents in alternative schools and programs forat-risk students were special education studentswith Individualized Education Programs (IEPs)(not shown in tables). This percentage is not
21Percentages are based on total district enrollment figures according
to the 2000–01 NCES CCD. In 2000–01, there were about47,000,000 students enrolled in public schools.
22Although percentage differences across subgroups appear large insome cases, these differences were not statistically significant, dueto high standard errors.
significantly different than the overall percentageof special education students with IEPs enrolled inall public schools during the 2000–01 school year(13 percent)23 (not shown in tables). Furthermore,linear regression analysis reveals that there is astatistical correlation between the overallenrollment of students in alternative schools andprograms for at-risk students and the overallenrollment of special education students with IEPs(i.e., districts that have higher proportions ofstudents in alternative schools and programs alsohave higher proportions of special educationstudents with IEPs in alternative schools andprograms).
Table 5 shows that 29 percent of districts withalternative schools and programs for at-riskstudents reported that less than 3 percent of theiralternative education students had IEPs, while 34percent of districts had alternative educationenrollments composed of 20 percent or more ofthe special education students with IEPs. Twenty-seven percent of districts that had studentsenrolled in alternative schools and programs as ofOctober 1, 2000 reported having no specialeducation students with IEPs (not shown intables).
Results varied across district characteristics fordistricts with alternative school and programenrollments of 20 percent or more students withIEPs. For instance, small and moderate-sizedistricts with alternative schools and programs forat-risk students were more likely than large ones(37 and 35 percent vs. 25 percent) to have 20percent or more special education students withIEPs within alternative schools and programs.Districts in the Southeast were more likely thanthose in the Central region and West (45 percentvs. 30 and 26 percent), and districts in theNortheast were more likely than those in the West(47 percent vs. 26 percent) to have 20 percent ormore special education students with IEPs withinalternative schools and programs for at-riskstudents. Districts with 5 percent or less minoritypopulations were more likely than those with morethan 50 percent minority populations to have thischaracteristic (44 percent vs. 25 percent).
23Percent derived from the 2000–01 NCES CCD.

11
Table 4.—Percentage distribution of districts with alternative schools and programs for at-riskstudents, grouped by percent of students enrolled as of October 1, 2000, by districtcharacteristics: Academic year 2000–01
Characteristic
Less than 1 percent
of total district
enrollment
1 to 1.99
percent of total
district enrollment
2 to 2.99
percent of total
district enrollment
3 percent
or more of total
district enrollment
Total...................................................................... 43 27 14 16
Metropolitan statusUrban........................................................................ 36 30 17 16
Suburban ................................................................... 49 26 12 13
Rural......................................................................... 38 28 16 18
District enrollment sizeLess than 2,500 .......................................................... 39 26 15 20
2,500 to 9,999............................................................ 46 29 13 12
10,000 or more........................................................... 46 25 17 12
RegionNortheast ................................................................... 63 21 7 8
Southeast ................................................................... 60 25 10 5
Central ...................................................................... 37 31 13 20
West ......................................................................... 27 28 22 23
Percent minority enrollment1
5 percent or less.......................................................... 49 26 11 14
6 to 20 percent ........................................................... 48 22 14 16
21 to 50 percent.......................................................... 38 32 18 12
More than 50 percent .................................................. 34 28 16 22
Poverty concentration2
10 percent or less........................................................ 56 24 10 10
11 to 20 percent.......................................................... 40 27 17 16
More than 20 percent .................................................. 38 29 15 181Estimates are based on the 840 districts with alternative schools and programs for which data on percent minority enrollment were available.2Estimates are based on the 843 districts with alternative schools and programs for which data on poverty concentration were available. Povertyconcentration is based on Census Bureau data on the percentage of children ages 5–17 in families below the poverty level within districts in1996–97.
NOTE: Percentages are based on the 39 percent of districts that reported administrating at least one alternative school or program during the2000–01 school year. Detail may not sum to totals because of rounding.
SOURCE: U.S. Department of Education, National Center for Education Statistics, Fast Response Survey System, “District Survey of AlternativeSchools and Programs,” FRSS 76, 2001.

12
Table 5.—Percentage distribution of districts with alternative schools and programs for at-riskstudents, grouped by percent of students with Individualized Education Programs (IEPs)in these schools and programs as of October 1, 2000, by district characteristics:Academic year 2000–01
Characteristic
Less than 3 percent
of students have
IEPs1
3 to 9.99 percent of
students have IEPs
10 to 19.99 percent
of students have
IEPs
20 percent or more
of students have
IEPs
Total ................................................................. 29 16 21 34
Metropolitan statusUrban.................................................................... 20 25 30 25
Suburban ............................................................... 32 16 18 34
Rural..................................................................... 28 14 21 37
District enrollment sizeLess than 2,500 ...................................................... 36 11 16 37
2,500 to 9,999........................................................ 25 16 24 35
10,000 or more....................................................... 16 31 28 25
RegionNortheast ............................................................... 32 9 12 47
Southeast ............................................................... 22 12 21 45
Central .................................................................. 40 10 20 30
West ..................................................................... 24 26 25 26
Percent minority enrollment2
5 percent or less...................................................... 35 8 13 44
6 to 20 percent ....................................................... 30 16 21 33
21 to 50 percent...................................................... 22 20 25 32
More than 50 percent .............................................. 26 23 26 25
Poverty concentration3
10 percent or less.................................................... 35 14 17 34
11 to 20 percent...................................................... 24 15 23 38
More than 20 percent .............................................. 31 19 21 291The “less than 3 percent” category includes 27 percent of districts with alternative schools and programs that had no students with IEPs.2Estimates are based on the 840 districts with alternative schools and programs for which data on percent minority enrollment were available.3Estimates are based on the 843 districts with alternative schools and programs for which data on poverty concentration were available. Povertyconcentration is based on Census Bureau data on the percentage of children ages 5–17 in families below the poverty level within districts in1996–97.
NOTE: Percentages are based on the reported number of special education students with IEPs within alternative schools and programs divided bythe overall number of students in alternative schools and programs as of October 1, 2000. Detail may not sum to totals because of rounding.
SOURCE: U.S. Department of Education, National Center for Education Statistics, Fast Response Survey System, “District Survey of AlternativeSchools and Programs,” FRSS 76, 2001.

13
Exceeding enrollment capacity. Districts wereasked to report whether, during any month of the1999–2000 school year, any of their alternativeschools or programs for at-risk students wereunable to enroll new students because of staffingor space limitations.24 About one-third of districtswith alternative schools and programs for at-riskstudents (33 percent) were unable to enroll newstudents in at least one alternative school or
24Districts were asked to report for the 1999–2000 school year
because at the time of data collection, the 2000–01 school year wasstill in progress, and results were needed for an entire school year.
program during the 1999–2000 school year(table 6). This was more likely to be the case forlarge and moderate-size districts than for smallones (43 and 39 percent vs. 25 percent). Districtswere least likely to name months at the beginningand end of the school year (August, September,and June) as months during which demandexceeded capacity (figure 2).
Table 6.—Percent of districts with alternative schools and programs for at-risk students that wereunable to enroll new students in an alternative school or program, by districtcharacteristics: Academic year 1999–2000
Characteristic Percent
Total................................................................................................................................. 33
Metropolitan statusUrban ................................................................................................................................... 40
Suburban............................................................................................................................... 36
Rural..................................................................................................................................... 28
District enrollment sizeLess than 2,500 ...................................................................................................................... 25
2,500 to 9,999........................................................................................................................ 39
10,000 or more ...................................................................................................................... 43
RegionNortheast ............................................................................................................................... 25
Southeast ............................................................................................................................... 32
Central.................................................................................................................................. 38
West ..................................................................................................................................... 32
Percent minority enrollment1
5 percent or less ...................................................................................................................... 33
6 to 20 percent ........................................................................................................................ 34
21 to 50 percent ...................................................................................................................... 36
More than 50 percent............................................................................................................... 25
Poverty concentration2
10 percent or less .................................................................................................................... 35
11 to 20 percent ...................................................................................................................... 37
More than 20 percent............................................................................................................... 251Estimates are based on the 840 districts with alternative schools and programs for which data on percent minority enrollment were available.2Estimates are based on the 843 districts with alternative schools and programs for which data on poverty concentration were available. Povertyconcentration is based on Census Bureau data on the percentage of children ages 5–17 in families below the poverty level within districts in 1996–97.
NOTE: Percentages are based on the 39 percent of districts that reported administrating at least one alternative school or program during the 2000–01 school year.
SOURCE: U.S. Department of Education, National Center for Education Statistics, Fast Response Survey System, “District Survey of AlternativeSchools and Programs,” FRSS 76, 2001.
14
Figure 2.—Percent of districts with alternative schools and programs for at-risk students wherenew enrollment needs exceeded available capacity between the months of August 1999and June 2000, by month: Academic year 1999–2000
35
45
21 23
5352 55 575857 56
0
20
40
60
80
100
Aug
ust
Sept
embe
r
Oct
ober
Nov
embe
r
Dec
embe
r
Janu
ary
Febr
uary
Mar
ch
Apr
il
May
June
Percent
NOTE: Percentages are based on the 39 percent of districts that reported administrating at least one alternative school or program during the2000–01 school year.
SOURCE: U.S. Department of Education, National Center for Education Statistics, Fast Response Survey System, “District Survey of AlternativeSchools and Programs,” FRSS 76, 2001.
Month

15
Thus, it is evident that many districts were fallingshort with respect to available capacity and theability to enroll new students in their alternativeschools and programs for at-risk students. Butwhat recourse do such districts have? In the surveyquestionnaire, all districts with alternative schoolsand programs were asked a series of questionsregarding their procedures when, in the past 3years, demand for enrollment exceeded capacity.Forty-six percent of districts reported that withinthe last 3 years there were no cases where demandfor enrollment exceeded capacity (not shown intables). The other 54 percent reported employing a
variety of procedures to varying degrees (responsecategories not mutually exclusive). Table 7 showsthat putting students on a waiting list was the mostcommon response of districts to exceeded capacity(83 percent). Following that, 41 percent of districtsresponded that they increased capacity by addingstaff or space, and 26 percent reported providinghome-bound instruction. Smaller percentages ofdistricts reported referring students to anotherdistrict (14 percent), opening a new site (10percent), and referring students to a private facility(9 percent).
Table 7.—Percent of districts with alternative schools and programs for at-risk students thatemployed various procedures when demand for enrollment exceeded available capacitywithin the last 3 years, by district characteristics : Academic years 1998–99 to 2000–01
Characteristic Waiting listAdd staff
or space
Provide home-
bound instructionRefer students to
another districtOpen new site Refer students to
private facility
Total.................................. 83 41 26 14 10 9
Metropolitan statusUrban .................................... 81 59 36 5 23 11
Suburban................................ 83 43 28 17 9 10
Rural...................................... 83 33 22 13 7 8
District enrollment sizeLess than 2,500 ....................... 84 30 24 17 7 8
2,500 to 9,999......................... 83 42 23 14 6 12
10,000 or more ....................... 81 62 40 7 24 8
RegionNortheast ................................ 75 42 33 6 11 16
Southeast ................................ 81 42 30 5 7 5
Central................................... 88 29 22 20 10 7
West ...................................... 83 50 25 17 12 12
Percent minority enrollment1
5 percent or less ...................... 92 31 29 14 8 9
6 to 20 percent ........................ 77 42 24 17 10 12
21 to 50 percent ...................... 85 48 24 13 9 8
More than 50 percent............... 75 49 30 9 16 7
Poverty concentration2
10 percent or less .................... 84 39 31 12 11 7
11 to 20 percent ...................... 86 40 23 18 9 13
More than 20 percent............... 77 43 28 11 10 61Estimates are based on the 502 districts with alternative schools and programs where demand for enrollment exceeded capacity within the lastthree years, for which data on percent minority enrollment were available.2Estimates are based on the 505 districts with alternative schools and programs where demand for enrollment exceeded capacity within the lastthree years, for which data on poverty concentration were available. Poverty concentration is based on Census Bureau data on the percentage ofchildren ages 5–17 in families below the poverty level within districts in 1996–97.
NOTE: Percentages are based on the 21 percent of districts that reported administrating at least one alternative school or program during the2000–01 school year and where demand for enrollment exceeded capacity within the last three years. Procedures were not mutually exclusive.
SOURCE: U.S. Department of Education, National Center for Education Statistics, Fast Response Survey System, “District Survey ofAlternative Schools and Programs,” FRSS 76, 2001.
16
Districts with 6 to 20 percent minority enrollmentor more than 50 percent minority enrollment wereless likely to put students on a waiting list thandistricts with 5 percent or less minority students(77 and 75 percent vs. 92 percent). Urban districtswere more likely than suburban and rural districtsto increase capacity by adding staff or space(59 percent vs. 43 and 33 percent). Similarly, largedistricts were more likely than moderate-sizedistricts, which were in turn more likely than smalldistricts to add staff or space (62 percent vs.42 percent vs. 30 percent). Also, districts in theWest were more likely to add staff or space thandistricts in the Central region (50 percent vs.29 percent).
Large districts were more likely than small andmoderate-size districts to provide home-boundinstruction for at-risk students when demand foralternative schools and programs exceededcapacity during the 3 years prior to the survey(40 percent vs. 24 and 23 percent). Similarly, largedistricts were more likely than both small andmoderate-size districts to open a new site(24 percent vs. 7 and 6 percent), and urbandistricts were more likely than suburban and ruralones to do so (23 percent vs. 9 and 7 percent).Suburban districts were more likely than urbanones (17 percent vs. 5 percent), and districts in theCentral region were more likely than those in theNortheast and the Southeast (20 percent vs. 6 and5 percent) to refer students to another district whendemand exceeded capacity.

17
3. ALTERNATIVE SCHOOLS ANDPROGRAMS FOR STUDENTS AT RISK
OF EDUCATION FAILURE: ENTRANCEAND EXIT CRITERIA
Student enrollment in the nation’s publicalternative schools and programs is highly fluid.Students are removed from regular schools on anindividual and daily basis, for a variety of reasons.Some are removed for disruptive behavior, such aspossession of weapons, fighting, disruptive verbalbehavior, criminal activity, or the use ordistribution of alcohol or drugs (Paglin and Fager1997). Others are removed for other reasons thatput them at risk of education failure, such aschronic truancy, continual academic failure, teenpregnancy/parenthood, or mental health problems.
Similarly, students are returned to regular schoolslargely on an individual basis, for a variety ofreasons. Many public alternative schools andprograms aim to return at-risk students to regularschools as soon as they are prepared to do so.Some students do return to regular schools less “atrisk,” but many are sent back to or simply remainin (by choice or decree) an alternative school orprogram for the duration of their education (Quinnand Rutherford 1998). This chapter addressesquestions relating to how students arrive at andexit from the nation’s public alternative schoolsand programs for at-risk students.
Entrance Criteria
Reasons for transfer. The survey questionnaireasked districts whether at-risk students could betransferred to alternative schools and programssolely on the basis of various reasons, includingtypes of disruptive behavior and for other reasonsthat put students at risk. Roughly half of alldistricts with alternative schools and programsreported that each of the following was sufficientreason for transferring students from a regular
school: possession, distribution, or use of alcoholor drugs (52 percent); physical attacks or fights(52 percent); chronic truancy (51 percent);possession or use of a weapon other than a firearm(50 percent); continual academic failure (50percent); disruptive verbal behavior (45 percent);and possession or use of a firearm (44 percent)(table 8).25 Teen pregnancy/parenthood and mentalhealth needs were least likely to be sole reasonsfor transfer (28 and 22 percent). Thirty-eightpercent of districts reported arrest or involvementwith the juvenile justice system as a sufficientreason for transfer to an alternative school.
Overall, 20 percent of districts indicated that noneof these reasons were sufficient in themselves totransfer students to alternative schools andprograms for at-risk students (not shown in tables).What is more, the reasons for transfer may bemitigated by the fact that in more serious cases,such as weapon possession or violence, districtsmay have policies that require suspension orexpulsion, and transfer to an alternative school orprogram is not an option available to suspended orexpelled students. Districts reported a mean of 4.3sole reasons (out of 10 possible) for transfer toalternative schools and programs (not shown intables).
25The counterintuitive result that a smaller percentage of districts
transferred students solely for possession or use of a firearmcompared with other reasons may be due to the fact that districtsmay have policies requiring expulsion in case of firearm possession,and transfer to an alternative school or program is not an option.

18
Table 8.—Percent of districts with alternative schools and programs for at-risk students thatreported that students could be transferred to an alternative school or program solely onthe basis of various reasons , by district characteristics: Academic year 2000–01
Characteristic
Possession,
distribution, or
use of alcohol or
drugs
Physical attacks
or fightsChronic truancy
Possession or use
of a weapon
(other than a
firearm)
Continual
academic
failure
Total............................................................... 52 52 51 50 50
Metropolitan statusUrban .................................................................. 60 65 54 61 52
Suburban.............................................................. 54 48 47 52 46
Rural.................................................................... 49 52 54 46 54
District enrollment sizeLess than 2,500 ..................................................... 42 46 53 41 52
2,500 to 9,999....................................................... 56 51 47 54 48
10,000 or more ..................................................... 76 72 53 72 51
RegionNortheast .............................................................. 41 40 40 42 44
Southeast .............................................................. 70 71 50 65 43
Central................................................................. 39 42 56 35 60
West .................................................................... 56 52 53 55 50
Percent minority enrollment1
5 percent or less ................................................... 45 45 52 44 58
6 to 20 percent ..................................................... 46 46 47 43 45
21 to 50 percent ................................................... 59 56 51 57 49
More than 50 percent............................................ 65 63 54 62 46
Poverty concentration2
10 percent or less ................................................. 44 40 46 41 49
11 to 20 percent ................................................... 47 49 51 45 51
More than 20 percent............................................ 65 62 54 62 51
NOTE: See footnotes at end of table.
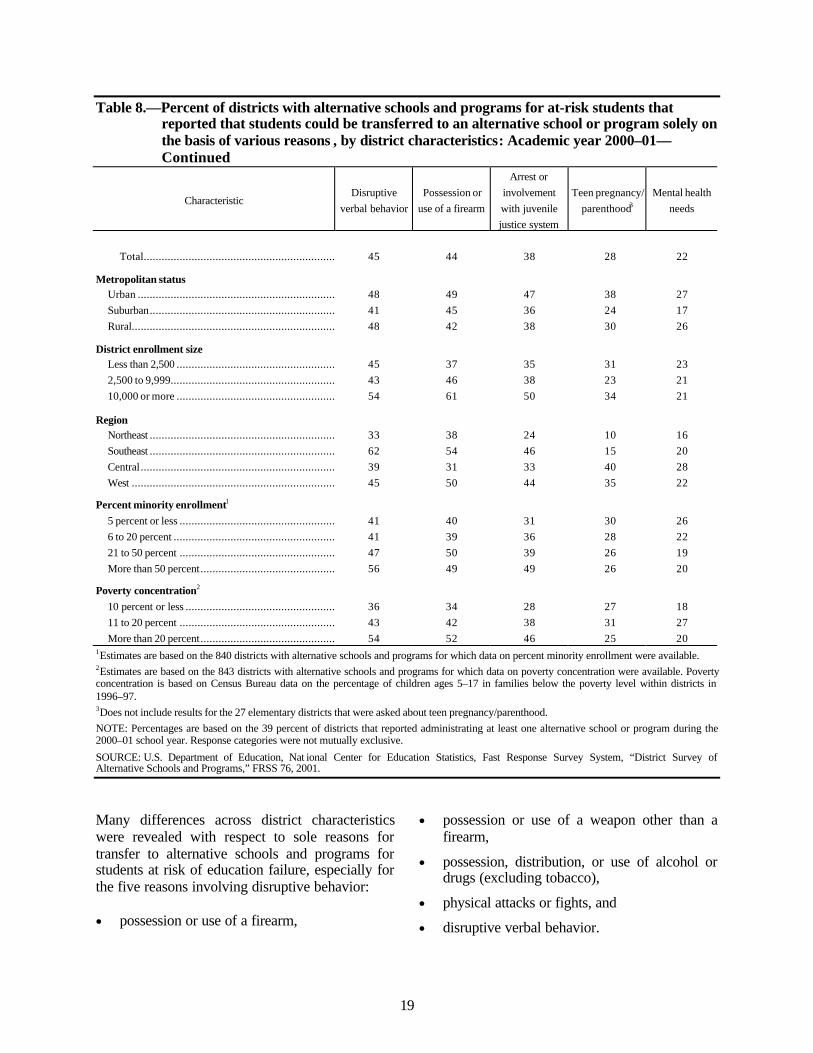
19
Table 8.—Percent of districts with alternative schools and programs for at-risk students thatreported that students could be transferred to an alternative school or program solely onthe basis of various reasons , by district characteristics: Academic year 2000–01—Continued
CharacteristicDisruptive
verbal behavior
Possession or
use of a firearm
Arrest or
involvement
with juvenile
justice system
Teen pregnancy/
parenthood3
Mental health
needs
Total................................................................ 45 44 38 28 22
Metropolitan statusUrban .................................................................. 48 49 47 38 27
Suburban.............................................................. 41 45 36 24 17
Rural.................................................................... 48 42 38 30 26
District enrollment sizeLess than 2,500 ..................................................... 45 37 35 31 23
2,500 to 9,999....................................................... 43 46 38 23 21
10,000 or more ..................................................... 54 61 50 34 21
RegionNortheast .............................................................. 33 38 24 10 16
Southeast .............................................................. 62 54 46 15 20
Central................................................................. 39 31 33 40 28
West .................................................................... 45 50 44 35 22
Percent minority enrollment1
5 percent or less .................................................... 41 40 31 30 26
6 to 20 percent ...................................................... 41 39 36 28 22
21 to 50 percent .................................................... 47 50 39 26 19
More than 50 percent............................................. 56 49 49 26 20
Poverty concentration2
10 percent or less .................................................. 36 34 28 27 18
11 to 20 percent .................................................... 43 42 38 31 27
More than 20 percent............................................. 54 52 46 25 201Estimates are based on the 840 districts with alternative schools and programs for which data on percent minority enrollment were available.2Estimates are based on the 843 districts with alternative schools and programs for which data on poverty concentration were available. Povertyconcentration is based on Census Bureau data on the percentage of children ages 5–17 in families below the poverty level within districts in1996–97.3Does not include results for the 27 elementary districts that were asked about teen pregnancy/parenthood.
NOTE: Percentages are based on the 39 percent of districts that reported administrating at least one alternative school or program during the2000–01 school year. Response categories were not mutually exclusive.
SOURCE: U.S. Department of Education, Nat ional Center for Education Statistics, Fast Response Survey System, “District Survey ofAlternative Schools and Programs,” FRSS 76, 2001.
Many differences across district characteristicswere revealed with respect to sole reasons fortransfer to alternative schools and programs forstudents at risk of education failure, especially forthe five reasons involving disruptive behavior:
• possession or use of a firearm,
• possession or use of a weapon other than afirearm,
• possession, distribution, or use of alcohol ordrugs (excluding tobacco),
• physical attacks or fights, and
• disruptive verbal behavior.

20
First, large districts were more likely than smalland moderate-size districts to transfer studentssolely on the basis of each of the five kinds ofdisruptive behavior.26 In general, districts in theSoutheast region were more likely than those inthe Northeast, Central, and Western regions to doso. For example, districts in the Southeast weremore likely than districts in the Central region totransfer students solely on the basis of possessionor use of a firearm (54 percent vs. 31 percent) andwere more likely than districts in the Northeastand Central regions to transfer for possession oruse of a weapon other than a firearm (65 percentvs. 42 and 35 percent) (table 8). Further, districtsin the Southeast were more likely than those in theNortheast, Central, and Western regions to transfersolely for alcohol or drugs (70 percent vs. 41, 39,and 56 percent, respectively), for physical attacksor fights (71 percent vs. 40, 42, and 52 percent,respectively), and for disruptive verbal behavior(62 percent vs. 33, 39, and 45 percent,respectively).
Districts with 50 percent or more minority studentpopulations were generally more likely than thosewith 5 percent or less and 6 to 20 percent minorityenrollments to transfer students solely fordisruptive behaviors, as in possession or use of aweapon other than a firearm (62 percent vs. 44 and43 percent), alcohol or drugs (65 percent vs. 45and 46 percent), physical attacks or fights (63percent vs. 45 and 46 percent), and disruptiveverbal behavior (56 percent vs. 41 and 41 percent).Finally, districts with high poverty concentrationswere more likely than those with low andmoderate concentrations to transfer solely forpossession or use of a weapon other than a firearm(62 percent vs. 41 and 45 percent), alcohol ordrugs (65 percent vs. 44 and 47 percent), physicalattacks or fights (62 percent vs. 40 and 49percent), and disruptive verbal behavior (54percent vs. 36 and 43 percent).
26An exception to this was that large districts were not more likely
than small districts to transfer students solely on the basis ofdisruptive verbal behavior.
There were few differences across districtcharacteristics with respect to sole reasons fortransfer that are less disruptive to other students,such as chronic truancy, continual academicfailure, teen pregnancy/parenthood, and mentalhealth needs. One exception was that transfer toalternative schools and programs solely because ofteen pregnancy/parenthood differed by region;districts in the Northeast and Southeast were lesslikely than those in the Central region and theWest to do so (10 and 15 percent vs. 40 and 35percent, respectively).
Placement of special education students withIndividualized Education Programs (IEPs).Data from the survey help to shed some light onthe issue of how at-risk special education studentswith IEPs may arrive at alternative schools andprograms. Districts with alternative schools andprograms for at-risk students were asked the extentto which special education students with IEPswere placed in alternative schools and programsthrough each of a variety of means (thus, responsecategories were not mutually exclusive). An IEPteam decision was most commonly employed to a“large extent” in placing special educationstudents with IEPs in alternative schools andprograms (66 percent) (table 9). Eighteen percentof districts did so to a “moderate extent.”Following an IEP team decision, districts weremore likely to rely on support of a director ofspecial education (37 percent) and a regular schoolstaff recommendation (31 percent) to a largeextent, compared to other means (12 to 15 percent)when placing special education students inalternative schools and programs.27
27Functional Behavioral Assessment (FBA) is a systematic process for
describing problem behavior, identifying environmental factors andevents that predict problem behavior, and guiding the developmentof behavior support plans.

21
Table 9.—Percentage distribution of districts with alternative schools and programs for at-riskstudents that reported the extent to which various means influence the placement ofspecial education students with Individualized Education Programs (IEPs) in alternativeschools and programs: Academic year 2000–01
Means of placement Not at all Small extent Moderate extent Large extent
IEP team decision................................................................... 6 10 18 66
Support of director of special education .................................... 19 21 23 37
Regular school staff recommendation ....................................... 16 19 33 31
Student request ....................................................................... 29 33 23 15
Parent request ........................................................................ 21 31 33 15
As a result of a Functional Behavioral Assessment (FBA)* ......... 36 25 26 14
Referral by juvenile justice system ........................................... 33 31 24 12
*Functional Behavioral Assessment is a systematic process for describing problem behavior, identifying environmental factors and events thatpredict problem behavior, and guiding the development of behavior support plans.
NOTE: Percentages are based on the 32 percent of districts that reported having alternative schools or programs and at least some specialeducation students with IEPs in these alternative schools and programs. Detail may not sum to totals because of rounding.
SOURCE: U.S. Department of Education, National Center for Education Statistics, Fast Response Survey System, “District Survey of AlternativeSchools and Programs,” FRSS 76, 2001.
Exit Criteria
Although many public alternative schools andprograms for at-risk students aim to returnstudents to regular schools as soon as they areprepared for it, not all districts allow all alternativeeducation students to do so. Districts were askedwhether it was their policy to allow all, some, orno students enrolled in alternative schools andprograms for at-risk students to return to regularschools. Table 10 shows that while 74 percent ofdistricts reported a policy that allowed allalternative education students to return to a regularschool, 25 percent of districts allowed some, butnot all students to return, and 1 percent allowednone to return. These findings were consistentacross district characteristics, with the exceptionof differences by minority student population;districts with more than 50 percent minorityenrollment were more likely than those with 21 to50 percent minority enrollment to allow allalternative education students to return to a regularschool (81 percent vs. 68 percent).
Although most alternative education studentsattending alternative schools and programs for at-risk students are allowed to return to regularschools, some schools are reluctant to bringstudents back into the regular classroom(Harrington-Lueker 1995). Moreover, even ifprovided the opportunity, some students elect toremain in alternative schools and programs, andsome are never adequately prepared to return to aregular school (Quinn and Rutherford 1998).Whether a student returns to a regular publicschool depends on a variety of factors, includingdistrict policies regarding criteria for return.District respondents were asked to rate theimportance of a variety of reasons in determiningwhether a student is able to return to a regularschool, including those involving studentbehavior, performance, and attitude, as well as theapproval of regular school and/or alternativeschool or program staff.

22
Table 10.—Percentage distribution of districts with alternative schools and programs for at-riskstudents that reported a policy that allows all, some, or no students enrolled to return toa regular school, by district characteristics: Academic year 2000–01
Characteristic Yes, for all studentsYes, for some
students
No, never for any
students
Total.............................................................................................. 74 25 1
Metropolitan statusUrban ................................................................................................ 76 24 0
Suburban............................................................................................ 71 28 (#)
Rural.................................................................................................. 75 23 2
District enrollment sizeLess than 2,500 ................................................................................... 73 25 2
2,500 to 9,999..................................................................................... 76 24 (#)
10,000 or more ................................................................................... 71 29 0
RegionNortheast ............................................................................................ 75 25 0
Southeast ............................................................................................ 75 25 0
Central............................................................................................... 69 29 2
West .................................................................................................. 76 23 2
Percent minority enrollment1
5 percent or less ................................................................................... 72 26 1
6 to 20 percent ..................................................................................... 74 26 0
21 to 50 percent ................................................................................... 68 31 1
More than 50 percent............................................................................ 81 17 1
Poverty concentration2
10 percent or less ................................................................................. 75 24 1
11 to 20 percent ................................................................................... 70 29 1
More than 20 percent............................................................................ 77 23 1
# Estimate less than 0.5 percent.1Estimates are based on the 840 districts with alternative schools and programs for which data on percent minority enrollment were available.2Estimates are based on the 843 districts with alternative schools and programs for which data on poverty concentration were available. Povertyconcentration is based on Census Bureau data on the percentage of children ages 5–17 in families below the poverty level within districts in1996–97.
NOTE: Percentages are based on the 39 percent of districts that reported administrating at least one alternative school or program during the2000–01 school year. Detail may not sum to totals because of rounding.
SOURCE: U.S. Department of Education, National Center for Education Statistics, Fast Response Survey System, “District Survey of AlternativeSchools and Programs,” FRSS 76, 2001.
The reasons most likely to be rated as “veryimportant” in determining whether a student wasable to return to a regular school were improvedattitude or behavior (82 percent) and studentmotivation to return (81 percent) (table 11).Following that, approval of alternative school orprogram staff was next most commonly cited as“very important” (67 percent), followed byimproved grades (52 percent), then approval ofthe regular school administrator or counselor (40percent). Least commonly cited as a “veryimportant” reason was student readiness as
measured by a standardized assessment(12 percent), followed by availability of space inregular schools (3 percent).
Some variation existed by enrollment size. Smalldistricts were more likely than large ones to viewstudent motivation to return as very important (85percent vs. 75 percent). Small districts were alsomore likely than moderate-size ones, which werein turn more likely than large districts to regardapproval of the regular school administrator orcounselor as a very important reason in
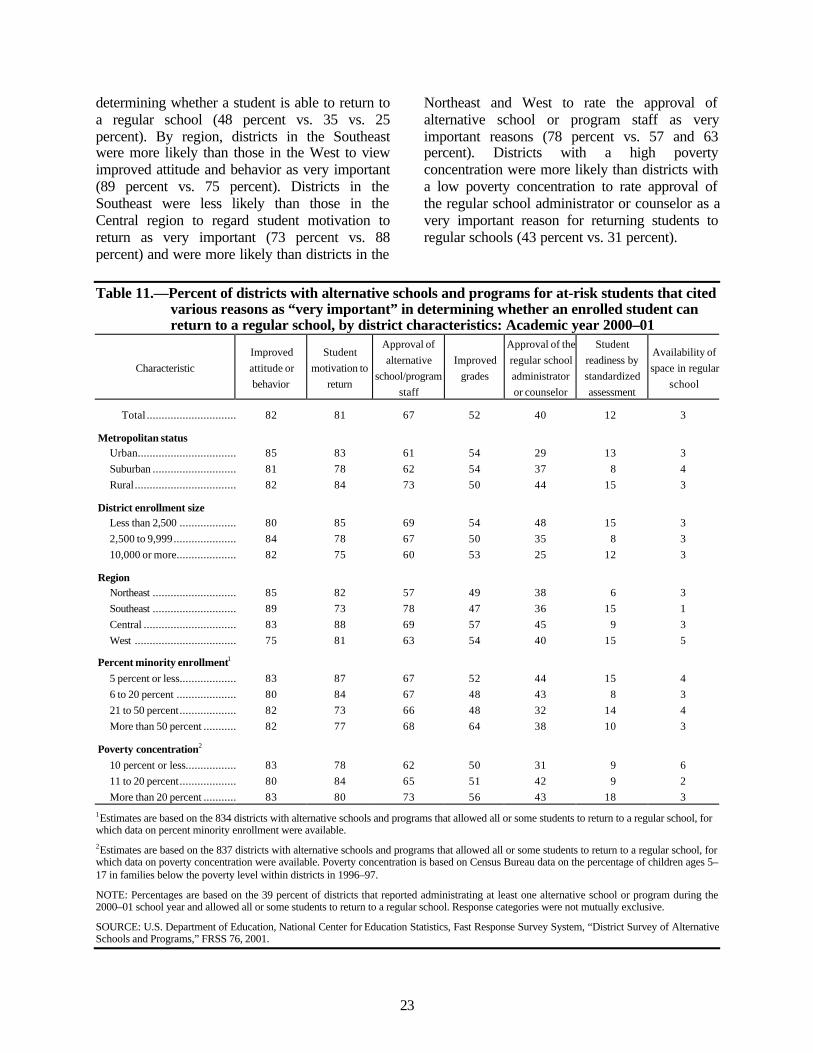
23
determining whether a student is able to return toa regular school (48 percent vs. 35 vs. 25percent). By region, districts in the Southeastwere more likely than those in the West to viewimproved attitude and behavior as very important(89 percent vs. 75 percent). Districts in theSoutheast were less likely than those in theCentral region to regard student motivation toreturn as very important (73 percent vs. 88percent) and were more likely than districts in the
Northeast and West to rate the approval ofalternative school or program staff as veryimportant reasons (78 percent vs. 57 and 63percent). Districts with a high povertyconcentration were more likely than districts witha low poverty concentration to rate approval ofthe regular school administrator or counselor as avery important reason for returning students toregular schools (43 percent vs. 31 percent).
Table 11.—Percent of districts with alternative schools and programs for at-risk students that citedvarious reasons as “very important” in determining whether an enrolled student canreturn to a regular school, by district characteristics: Academic year 2000–01
Characteristic
Improved
attitude or
behavior
Student
motivation to
return
Approval of
alternative
school/program
staff
Improved
grades
Approval of the
regular school
administrator
or counselor
Student
readiness by
standardized
assessment
Availability of
space in regular
school
Total .............................. 82 81 67 52 40 12 3
Metropolitan statusUrban................................. 85 83 61 54 29 13 3
Suburban ............................ 81 78 62 54 37 8 4
Rural.................................. 82 84 73 50 44 15 3
District enrollment sizeLess than 2,500 ................... 80 85 69 54 48 15 3
2,500 to 9,999..................... 84 78 67 50 35 8 3
10,000 or more.................... 82 75 60 53 25 12 3
RegionNortheast ............................ 85 82 57 49 38 6 3
Southeast ............................ 89 73 78 47 36 15 1
Central ............................... 83 88 69 57 45 9 3
West .................................. 75 81 63 54 40 15 5
Percent minority enrollment1
5 percent or less................... 83 87 67 52 44 15 4
6 to 20 percent .................... 80 84 67 48 43 8 3
21 to 50 percent................... 82 73 66 48 32 14 4
More than 50 percent ........... 82 77 68 64 38 10 3
Poverty concentration2
10 percent or less................. 83 78 62 50 31 9 6
11 to 20 percent................... 80 84 65 51 42 9 2
More than 20 percent ........... 83 80 73 56 43 18 3
1Estimates are based on the 834 districts with alternative schools and programs that allowed all or some students to return to a regular school, forwhich data on percent minority enrollment were available.2Estimates are based on the 837 districts with alternative schools and programs that allowed all or some students to return to a regular school, forwhich data on poverty concentration were available. Poverty concentration is based on Census Bureau data on the percentage of children ages 5–17 in families below the poverty level within districts in 1996–97.
NOTE: Percentages are based on the 39 percent of districts that reported administrating at least one alternative school or program during the2000–01 school year and allowed all or some students to return to a regular school. Response categories were not mutually exclusive.
SOURCE: U.S. Department of Education, National Center for Education Statistics, Fast Response Survey System, “District Survey of AlternativeSchools and Programs,” FRSS 76, 2001.

24

25
4. STAFFING, CURRICULUM ANDSERVICES, AND COLLABORATION
Whether at-risk students are able to transfer backto regular schools or successfully graduate fromalternative schools and programs for students atrisk of education failure may depend in part on thequality of the education and services they receiveat their alternative schools and programs. Variousfactors have been identified as beneficial to at-riskstudents in alternative education environments,including dedicated and well-trained staff,effective curriculum, and a variety of supportservices provided in collaboration with an array ofagencies (Quinn and Rutherford 1998). The finalsection of the survey questionnaire askedquestions pertaining to staffing, curriculum andservices, and collaboration of alternative schoolsand programs with outside agencies.
Staffing
Teachers play an integral role in the nation’salternative schools and programs. Researchsuggests that better outcomes are obtained whenteachers are well-trained, caring, demanding,highly motivated, and responsive to the specialneeds of at-risk students (Barr and Parrett 2001).In addition, it has been found that teachers who areinvoluntarily assigned are less likely to servestudents well than those who choose to teach inalternative schools and programs (Barr and Parrett2001). At the time of this survey, there were nonational data on how teachers come to teach atpublic alternative schools and programs. Someteachers may be hired specifically for a position inalternative education, while others may haveexperience in regular schools and are thenwillingly transferred. Still others may be requiredby their districts to transfer involuntarily toalternative schools and programs. Districts wereasked whether their alternative school andprogram teachers were hired specifically to teachin alternative schools and programs, transferred bychoice from a regular school, and/or were
involuntarily assigned to teach in an alternativeschool or program (these response choices werenot mutually exclusive).
Results indicate that 86 percent of districts withalternative schools and programs for at-riskstudents hired teachers specifically to teach insuch schools and programs (table 12). A smallerpercentage of districts transferred teachers bychoice from a regular school (49 percent), and aneven smaller percentage assigned teachersinvoluntarily to positions in alternative schoolsand programs (10 percent). There wasconsiderable variation across districtcharacteristics. For instance, large and moderate-size districts were more likely than small districtsboth to hire teachers specifically to teach at analternative school or program and to transferteachers voluntarily from regular schools (93 and89 percent vs. 81 percent, and 83 and 60 percentvs. 31 percent). In addition, large districts weremore likely than small ones to assign teachersinvoluntarily to alternative schools and programsfor at-risk students (17 percent vs. 8 percent). Byregion, districts in the West were more likely thanthose in the Southeast to hire teachers specificallyto teach at an alternative school or program for at-risk students (90 percent vs. 81 percent). Districtsin the Southeast and West were more likely thanthose in the Northeast and Central regions totransfer teachers by choice (61 and 56 percent vs.33 and 40 percent) and also to assign theminvoluntarily (16 and 14 percent vs. 3 and5 percent).
Districts with 50 percent or more minorityenrollment were more likely than those with5 percent or less and 6 to 20 percent minorityenrollments to transfer teachers by choice(62 percent vs. 37 and 46 percent) and to assignthem involuntarily to alternative schools andprograms (20 percent vs. 5 and 8 percent).Districts with a low poverty concentration were

26
more likely than those with a high povertyconcentration to hire teachers specifically to teachin alternative schools and programs (91 percent vs.80 percent), but were less likely than districts with
moderate and high poverty concentrations toassign teachers involuntarily (3 percent vs. 10 and15 percent).
Table 12.—Percent of districts with alternative schools and programs for at-risk students that usedvarious practices for hiring alternative school and program teachers, by districtcharacteristics: Academic year 2000–01
Characteristic
Hired specifically to
teach in alternative
schools and programs
Transferred by choice
from a regular schoolInvoluntarily assigned
Total ........................................................................ 86 49 10
Metropolitan statusUrban........................................................................... 93 81 17
Suburban ...................................................................... 88 46 9
Rural............................................................................ 83 46 10
District enrollment sizeLess than 2,500 ............................................................. 81 31 8
2,500 to 9,999............................................................... 89 60 11
10,000 or more.............................................................. 93 83 17
RegionNortheast ...................................................................... 85 33 3
Southeast ...................................................................... 81 61 16
Central ......................................................................... 85 40 5
West ............................................................................ 90 56 14
Percent minority enrollment1
5 percent or less............................................................. 87 37 5
6 to 20 percent .............................................................. 92 46 8
21 to 50 percent............................................................. 86 56 11
More than 50 percent ..................................................... 77 62 20
Poverty concentration2
10 percent or less........................................................... 91 43 3
11 to 20 percent............................................................. 87 49 10
More than 20 percent ..................................................... 80 54 151Estimates are based on the 840 districts with alternative schools and programs for which data on percent minority enrollment were available.2Estimates are based on the 843 districts with alternative schools and programs for which data on poverty concentration were available. Povertyconcentration is based on Census Bureau data on the percentage of children ages 5–17 in families below the poverty level within districts in1996–97.
NOTE: Percentages are based on the 39 percent of districts that reported administrating at least one alternative school or program during the2000–01 school year. Response categories were not mutually exclusive.
SOURCE: U.S. Department of Education, National Center for Education Statistics, Fast Response Survey System, “District Survey ofAlternative Schools and Programs,” FRSS 76, 2001.

27
Curriculum and Services
Findings from the survey show that many districtswith alternative schools and programs for at-riskstudents have policies that require a wide varietyof services and practices for alternative educationstudents (table 13).28 For example, over three-quarters of the districts had policies requiringcurricula leading toward a regular high schooldiploma (91 percent), academic counseling
28Since some of the services were not relevant at the elementary level
(e.g., career counseling, preparation for the GED exam, etc.), toensure comparability across services, the 27 elementary districtsthat were asked questions about services were excluded from thefindings presented in table 13. Response categories were notmutually exclusive.
(87 percent), a smaller class size than in regularschools (85 percent), remedial instruction(84 percent), opportunity for self-paced instruction(83 percent), crisis/behavioral intervention(79 percent), and career counseling (79 percent).Least commonly required were extended schoolday or school year (29 percent), security personnelon site (26 percent), and evening or weekendclasses (25 percent).
Table 13.—Percent of districts with alternative schools and programs for at-risk students thatreported various required services or practices be made routinely available to enrolledstudents, by district characteristics: Academic year 2000–01
Characteristic
Curricula for
regular
high school
diploma
Academic
counseling
Smaller class
size
Remedial
instruction
Opportunity
for self-
paced
instruction
Crisis or
behavioral
intervention
Career
counseling
Psycho-
logical
counseling
Total......................... 91 87 85 84 83 79 79 58
Metropolitan statusUrban ........................... 98 93 93 90 87 88 84 70
Suburban....................... 92 87 87 83 80 78 77 57
Rural............................. 89 86 82 83 84 78 80 58
District enrollment sizeLess than 2,500 .............. 89 87 81 82 82 75 79 57
2,500 to 9,999................ 92 86 86 84 82 81 77 58
10,000 or more .............. 96 89 95 89 85 85 84 66
RegionNortheast ....................... 95 91 93 81 74 84 80 71
Southeast ....................... 90 87 92 84 81 80 80 61
Central.......................... 89 85 80 82 80 74 79 46
West ............................. 92 87 81 86 90 80 79 62
Percent minorityenrollment1
5 percent or less ............. 91 89 83 83 78 78 81 60
6 to 20 percent ............... 91 85 85 81 80 78 75 50
21 to 50 percent ............. 94 88 88 85 87 80 77 63
More than 50 percent...... 88 86 84 86 88 81 83 61
Poverty concentration2
10 percent or less ........... 92 86 84 79 74 75 75 55
11 to 20 percent ............. 91 87 88 87 84 80 79 57
More than 20 percent...... 91 87 82 82 87 81 83 61
NOTE: See footnotes at end of table.

28
Table 13.—Percent of districts with alternative schools and programs for at-risk students thatreported various required services or practices be made routinely available to enrolledstudents, by district characteristics: Academic year 2000–01—Continued
CharacteristicSocial work
services
Vocational or
skills training
Opportunity
to take classes
elsewhere
Preparation
for the GED
exam
Peer
mediation
Extended
school
day/year
Security
personnel on
site
Evening or
weekend
classes
Total.......................... 55 48 44 41 37 29 26 25
Metropolitan statusUrban ............................ 69 58 59 48 50 39 54 34
Suburban........................ 53 46 44 36 37 25 30 22
Rural.............................. 54 48 42 43 36 30 18 27
District enrollment sizeLess than 2,500 ............... 50 45 42 39 34 25 15 24
2,500 to 9,999................. 57 47 43 40 36 29 29 24
10,000 or more ............... 65 61 55 48 52 39 59 35
RegionNortheast ........................ 52 47 34 23 30 25 29 23
Southeast ........................ 61 46 24 48 41 21 33 14
Central........................... 56 51 53 37 39 32 19 30
West .............................. 51 47 56 46 38 33 27 30
Percent minorityenrollment1
5 percent or less .............. 51 50 45 35 36 26 16 27
6 to 20 percent ................ 47 48 41 41 35 25 18 26
21 to 50 percent .............. 58 52 48 44 38 27 33 25
More than 50 percent....... 66 40 43 44 41 36 44 24
Poverty concentration2
10 percent or less ............ 48 46 48 33 30 28 20 25
11 to 20 percent .............. 53 52 46 43 41 31 27 29
More than 20 percent....... 61 45 40 43 38 25 30 231Estimates are based on the 840 districts with alternative schools and programs for which data on percent minority enrollment were available.2Estimates are based on the 843 districts with alternative schools and programs for which data on poverty concentration were available. Povertyconcentration is based on Census Bureau data on the percentage of children ages 5–17 in families below the poverty level within districts in1996–97.
NOTE: Percentages are based on the unified and secondary districts that reported administrating at least one alternative school or program duringthe 2000–01 school year. Since some of the services were not relevant at the elementary level (e.g., career counseling, preparation for the GEDexam, etc.), to ensure comparability across services, the 27 elementary districts that were asked questions about services were excluded from thefindings presented in this table. Response categories were not mutually exclusive.
SOURCE: U.S. Department of Education, National Center for Education Statistics, Fast Response Survey System, “District Survey of AlternativeSchools and Programs,” FRSS 76, 2001.

29
On average, districts required 9.5 of the 16services asked about in the survey (not shown intables). About one-fifth (18 percent) of districtsrequired 0 to 6 of the 16 specified services,52 percent required 7 to 11, and 30 percentrequired 12 to 16 of the services (figure 3).
Figure 3.—Percentage distribution of districtswith alternative schools andprograms for at-risk students,grouped by the number of variousservices or practices made routinelyavailable to enrolled students:Academic year 2000–01
18%
30%
52%
0 to 6 services
7 to 11 services
12 to 16 services
NOTE: Percentages are based on the unified and secondary districtsthat reported administrating at least one alternative school or programduring the 2000–01 school year. Since some of the services were notrelevant at the elementary level (e.g., career counseling, preparationfor the GED exam, etc.), to ensure comparability across services, the27 elementary districts that were asked questions about services wereexcluded from the findings presented in this figure.
SOURCE: U.S. Department of Education, National Center forEducation Statistics, Fast Response Survey System, “District Surveyof Alternative Schools and Programs,” FRSS 76, 2001.
Large districts were more likely than small ones torequire 10 of the 16 services listed in the survey(smaller class size, crisis/behavioral intervention,social work services, peer mediation, extendedschool day/year, evening weekend classes,curricula leading towards regular diploma,vocational or skills training, opportunity to takeclasses elsewhere, and security personnel on site).
Districts with more than 50 percent minorityenrollment were more likely than those with 6 to20 percent minority enrollment to require socialwork services (66 percent vs. 47 percent). Districtswith more than 50 percent and 21 to 50 percentminority enrollments were more likely thandistricts with 5 percent or less and 6 to 20 percentminority enrollments to require security personnelon site (44 and 33 percent vs. 16 and 18 percent).Districts with a high poverty concentration weremore likely than those with a low concentration torequire security personnel on site (30 percent vs.20 percent).
Collaboration with Other Agencies
Alternative schools and programs for students atrisk of education failure often collaborate withagencies, centers, or departments outside of thepublic school system. These partnerships makeavailable to students an array of social andpsychological support services that might nototherwise be available. The survey asked districtswith alternative schools and programs if theycollaborated with 12 types of agencies, such asmental health organizations, job placementcenters, crisis intervention centers, and drug and/oralcohol clinics.
The most widely reported type of collaborationwas with the juvenile justice system (84 percent)(table 14). Seventy-five percent of districts withalternative schools and programs for at-riskstudents reported collaboration with communitymental health agencies, 70 percent collaboratedwith police or sheriff’s departments, and 69percent collaborated with child protective services.Of the services asked about, collaboration withparks and recreation departments was leastcommonly cited by districts (23 percent).

30
Table 14.—Percent of districts with alternative schools and programs for at-risk students thatcollaborated with various agencies in order to provide services for enrolled students,by district characteristics: Academic year 2000–01
CharacteristicJuvenile justice
system
Community
mental health
agency
Police or
sheriff's
department
Child protective
services
Health and
human services
agency or
hospital
Drug and/or
alcohol clinic
Total ....................................... 84 75 70 69 65 59
Metropolitan statusUrban.......................................... 88 82 72 78 76 73
Suburban ..................................... 81 73 71 61 56 59
Rural........................................... 86 76 69 73 70 56
District enrollment sizeLess than 2,500 ............................ 82 70 67 64 64 55
2,500 to 9,999.............................. 83 77 71 71 63 59
10,000 or more............................. 92 88 79 77 72 74
RegionNortheast ..................................... 67 68 47 57 52 53
Southeast ..................................... 88 82 79 78 67 55
Central ........................................ 84 70 65 67 70 66
West ........................................... 89 77 79 69 65 60
Percent minority enrollment1
5 percent or less............................ 81 69 60 67 64 58
6 to 20 percent ............................. 82 77 71 68 62 57
21 to 50 percent............................ 87 81 75 76 67 58
More than 50 percent .................... 87 74 76 64 65 63
Poverty concentration2
10 percent or less.......................... 77 65 58 59 55 58
11 to 20 percent............................ 85 78 73 74 68 59
More than 20 percent .................... 87 78 74 68 67 59
NOTE: See footnotes at end of table.

31
Table 14.—Percent of districts with alternative schools and programs for at-risk students thatcollaborated with various agencies in order to provide services for enrolled students,by district characteristics: Academic year 2000–01—Continued
CharacteristicCommunity
organization
Family
organizations or
associations
Crisis
intervention
center
Family
planning/child
care/child
placement
agency
Job placement
center3
Parks and
recreation
department
Total ................................... 58 52 47 46 40 23
Metropolitan statusUrban...................................... 76 73 58 63 54 42
Suburban ................................. 56 53 46 39 35 21
Rural....................................... 55 47 45 48 42 20
District enrollment sizeLess than 2,500 ........................ 49 44 43 43 38 18
2,500 to 9,999.......................... 62 55 46 44 39 25
10,000 or more......................... 75 72 62 59 51 33
RegionNortheast ................................. 47 46 43 33 40 17
Southeast ................................. 57 50 42 37 34 22
Central .................................... 56 51 46 50 40 21
West ....................................... 64 56 53 53 44 27
Percent minority enrollment1
5 percent or less........................ 51 45 42 43 40 18
6 to 20 percent ......................... 53 50 49 39 36 21
21 to 50 percent........................ 66 58 50 49 43 27
More than 50 percent ................ 64 56 48 52 40 28
Poverty concentration2
10 percent or less...................... 52 47 44 33 34 19
11 to 20 percent........................ 60 55 49 52 46 26
More than 20 percent ................ 59 52 47 47 37 21
1Estimates are based on the 840 districts with alternative schools and programs for which data on percent minority enrollment were available.2Estimates are based on the 843 districts with alternative schools and programs for which data on poverty concentration were available. Povertyconcentration is based on Census Bureau data on the percentage of children ages 5–17 in families below the poverty level within districts in1996–97.3Does not include results for the 28 elementary districts that answered the question about a job placement center.
NOTE: Percentages are based on the 39 percent of districts that reported administrating at least one alternative school or program during the2000–01 school year. Response categories were not mutually exclusive.
SOURCE: U.S. Department of Education, National Center for Education Statistics, Fast Response Survey System, “District Survey of AlternativeSchools and Programs,” FRSS 76, 2001.

32
On average, districts collaborated with 6.9 of the12 different agencies listed (not shown in tables).Figure 4 shows the distribution of districts thatreported collaboration with 0 to 4, 5 to 8, and 9 to12 agencies. Twenty-eight percent of districtscollaborated with 0 to 4 agencies, 34 percent ofdistricts collaborated with 5 to 8 agencies, and theremainder (38 percent) collaborated with 9 to 12agencies in providing services to alternativeeducation students.
Figure 4.—Percentage distribution of districtswith alternative schools andprograms for at-risk students,grouped by the number of variousagencies the district reportedcollaborating with to provideservices to enrolled students:Academic year 2000–01
28%
38%
34%
0 to 45 to 89 to 12
NOTE: Percentages are based on the 39 percent of districts thatreported administrating at least one alternative school or programduring the 2000–01 school year.
SOURCE: U.S. Department of Education, National Center forEducation Statistics, Fast Response Survey System, “District Surveyof Alternative Schools and Programs,” FRSS 76, 2001.
The results viewed across district characteristicsreveal several noteworthy patterns. For instance,urban districts tended to have a higher percentageof collaboration with agencies than suburbanand rural districts for 5 of the 12 types of
collaboration: community organizations (76percent vs. 56 and 55 percent), drug and/or alcoholclinics (73 percent vs. 59 and 56 percent), familyorganizations or associations (73 percent vs. 53and 47 percent), family planning/child care/childplacement agencies (63 percent vs.39 and 48 percent), and parks and recreationsdepartments (42 percent vs. 21 and 20 percent).Additional differences were found between urbanand suburban districts; urban districts were morelikely than suburban ones to collaborate with childprotective services (78 percent vs. 61 percent), jobplacement centers29 (54 percent vs. 35 percent),and health and human services agencies orhospitals (76 percent vs. 56 percent).
Differences were also evident by districtenrollment size. For example, of the 12 agenciesthat districts with alternative schools and programswere asked about, large districts were more likelythan small and moderate-size ones to collaboratewith 8 of them, including community mentalhealth agencies (88 percent vs. 70 and 77 percent),community organizations (75 percent vs. 49 and62 percent), crisis intervention centers (62 percentvs. 43 and 46 percent), drug and/or alcohol clinics(74 percent vs. 55 and 59 percent), familyorganizations or associations (72 percent vs. 44and 55 percent), family planning/child care/childplacement agencies (59 percent vs. 43 and 44percent), the juvenile justice system (92 percentvs. 82 and 83 percent), and police or sheriff’sdepartments (79 percent vs. 67 and 71 percent).
Collaboration between districts and police orsheriff’s departments was higher in districts with21 to 50 percent and more than 50 percentminority enrollments than in districts with 5percent or less of minority students (75 and 76percent vs. 60 percent). Similarly, districts withmoderate and high poverty concentrationscollaborated with a police or sheriff’s departmentmore frequently than districts with a low povertyconcentration (73 and 74 percent vs. 58 percent).
29Does not include results for the 28 elementary districts that were
asked about a job placement center.

33
5. SUMMARY AND CONCLUSIONS
Few existing national-level measures have focusedon public alternative education for students at riskof education failure. This report presented findingsabout a broad range of issues regarding publicalternative education, including the availability ofpublic alternative schools and programs,enrollment, entrance and exit procedures, staffing,and services. Although the original respondentsample contained 1,534 districts, most of the datapresented in this report are based on questionnairedata for the 848 districts that reported havingalternative schools and programs for at-riskstudents during the 2000–01 school year. Thequestionnaire responses were weighted to producenational estimates that represent all regular publicschool districts in the United States. This chapterprovides a summary of findings as well as overallconclusions.
Availability and Enrollment
Overall, 39 percent of districts had alternativeschools or programs for at-risk students thatenrolled a total of 612,900 students during the2000–01 school year. It should be kept in mind,however, that this does not mean that no at-riskstudents from the remaining 61 percent of districtsattended an alternative school or program duringthis period. Some students might have attendedalternative schools or programs that fell outside ofthe scope of this study (e.g., private alternativeschools or regional alternative schools).
Despite the fact that the majority of districts in thenation did not have any alternative schools orprograms, it should not be concluded necessarilythat these districts were inadequately serving theirat-risk students. Many of the districts without anyalternative schools or programs were those withsmall enrollment sizes in rural areas, and thus maynot have had sufficient need for alternativeeducation. In addition, 22 percent of the districts inthe total sample were elementary districts, whichpresumably have less need for alternative
education for students at risk of education failure.Further, some smaller districts may havecontracted with private alternative schools, whichwould not have been included in the surveyresults.
Findings across survey questions revealedconsiderable variation by district characteristics,such as metropolitan status, enrollment size,region, percent of minority students, and povertyconcentration. For instance, with respect to thepresence of alternative schools and programs forat-risk students, large districts (ones with 10,000or more students) were more likely than smallerdistricts to have alternative schools and programs.This finding is not surprising, however, sincelarger districts typically serve greater numbers ofat-risk students and generally have more resourcesat their disposal to address the needs of thesestudents.
Districts in the Southeast, districts with highminority enrollments, and districts with highpoverty concentrations were more likely than theircounterpart districts to have alternative schoolsand programs for at-risk students. This pattern wasrepeated across findings for many of the questionsin the survey. It should be kept in mind, however,that this may be related to the fact that districts inthe Southeast, districts with high percentages ofminority students, and districts with high povertylevels tended to have higher enrollment levels (notshown in tables).
Of the 39 percent of districts that had alternativeschools and programs for at-risk students, 65percent had only 1 alternative school or programduring the 2000–01 school year, and 18 percenthad 2 schools and/or programs. This may indicatethat some districts (i.e., most probably smallerones) were able to address the needs of their at-risk students with only one or two alternativeschools and programs. On the other hand, it mightindicate that districts are reluctant to expand theirofferings of alternative education: Raywid (1994)

34
asserts that “…alternatives have continued to lack‘institutional legitimacy.’ Even districts that arepleased to have one or two alternatives remaincool to the prospect of multiplying them orconverting the district entirely” (p. 30).
The present study revealed that alternative schoolsand programs for at-risk students were not limitedto secondary grade levels. Some districts wereadministering alternative schools and programs atthe middle school level, and some even at theelementary level. These findings are in accordwith the prediction of Paglin and Fager (1997): “Itappears there will be a growing number ofalternative middle schools and perhaps evenelementary schools.”
Altogether, 1.3 percent of all public schoolstudents attended public alternative schools andprograms for at-risk students during the 2000–01school year.30 Of the students who attended publicalternative schools and programs, 12 percent werespecial education students with IEPs. According tothe 2000–01 CCD, roughly the same proportion ofspecial education students with IEPs existedwithin the entire population of public schoolstudents (13 percent).
Not all at-risk students in need of alternativeeducation were able to be placed in alternativeschools and programs during the 1999–2000school year; 33 percent of districts with alternativeschools and programs reported that at least one oftheir schools or programs was unable to enroll newstudents because of staffing or space limitations.In cases where demand for enrollment exceededavailable capacity, most of these districts (83percent) reported putting students on a waiting list.
Entrance and Exit Criteria
Students enter and exit public alternative schoolsand programs for students at risk of educationfailure for a variety of reasons and on anindividual basis. Survey findings indicate that a
30This figure may be higher, because at-risk students enrolled in
public alternative schools not administered by sampled districts(e.g., regional schools) were not counted in this survey.
variety of behaviors were sufficient reasons inthemselves for transfer to alternative schools andprograms among districts. Of the behaviors thatmight be considered disruptive to others(possession or use of a firearm or other weapon,possession or distribution of alcohol or drugs,physical attacks or fights, and disruptive verbalbehavior), results show that large districts, districtsin the Southeast, districts with a high minorityenrollment, and districts with a high povertyconcentration tended to be more likely than theircounterparts to regard these reasons as sufficientin themselves for transfer to an alternative schoolor program.
Most districts (74 percent) have a policy allowingall students to return to regular schools, althoughsome districts (25 percent) allow only somestudents, and a 1 percent of districts do not allowany students to return. The reasons most likely tobe deemed “very important” by districts indetermining whether students could return toregular schools were improved attitude andbehavior (82 percent) and student motivation toreturn (81 percent).
Staffing, Curriculum and Services,and Collaboration
Although 86 percent of districts hired teachersspecifically to teach in alternative schools andprograms for at-risk students, and 49 percent ofdistricts reported that teachers were transferred bychoice from a regular school, 10 percent ofdistricts assigned teachers involuntarily to teach insuch schools and programs. Large districts,districts with a high minority enrollment, anddistricts with a high poverty concentration weremore likely than their counterpart districts toreport assigning teachers involuntarily.
With respect to curriculum and services, findingsindicate that the nation’s districts with publicalternative schools and programs for at-riskstudents are making efforts to ensure that at-riskstudents are supported by a network of servicesand innovations in curriculum that help promotetheir success. For example, over 75 percent of thedistricts had policies requiring curricula leading
35
toward a regular high school diploma, academiccounseling, remedial instruction, smaller classsize, opportunity for self-paced instruction, careercounseling, and crisis/behavior intervention. Ofthe 16 services and practices listed in the survey,districts reported policies requiring a mean of 9.5.For the most part, large districts were more likelythan small ones to require individual services andpractices.
Many districts with public alternative schools andprograms also appeared to be collaborating with avariety of agencies to provide services to students.Overall, districts collaborated with a mean of 6.9agencies (out of 12 listed in the survey) inproviding services. Again, for the most part, large
districts were more likely than small ones tocollaborate with various agencies.
This study has presented a snapshot of alternativeschools and programs for students at risk ofeducation failure during the 2000–01 school year.Since this is the first national survey of its kind, itis difficult to say in which direction districts aremoving with respect to various facets of publicalternative education. Future research will need toemploy similar measures to determine whetherpublic alternative education is becoming more orless established in the nation’s public schoolsystem and whether it is progressing in its serviceto the nation’s at-risk students.

36

37
REFERENCES
Barr, R.D. and Parrett W.H. (2001). Hope Fulfilled for At-Risk and Violent Youth. Needham Heights,MA: Allyn and Bacon.
Boss, S. (1998). Learning From the Margins: The Lessons of Alternative Schools. Northwest EducationMagazine, 3(4): 6–20.
Gray, K., and Sinclair, B. (2000). Report on State Implementation of the Gun-Free Schools Act: SchoolYear 1998–99. Washington, DC: U.S. Department of Education.
Grunbaum, J.A., Kann, L., Kinchen, S.A., Ross, J.G., Gowda, V.R., Collins, J.L., and Kolbe, L.J. (1999).Youth Risk Behavior Surveillance—National Alternative High School Youth Risk BehaviorSurvey. Morbidity and Mortality Report, 48 (SS–7). Centers for Disease Control and Prevention.Washington, DC: U.S. Government Printing Office.
Harrington-Lueker, D. (1995). Ideas for Alternative Schools for Troubled Kids. American School BoardJournal, 181, 16–21.
Hoffman, L. (2001). Key Statistics on Public Elementary and Secondary Schools and Agencies: SchoolYear 1997–98 (NCES 2001–304r). U.S. Department of Education. Washington, DC: NationalCenter for Education Statistics.
Lange, C.M. and Sletten, S.J. (2002). Alternative Education: A Brief History and Research Synthesis.Alexandria, VA: National Association of State Directors of Special Education.
Michigan Alternative Education Study Project. (2000). The Promises and Challenges of AlternativeEducation in Michigan. Kalamazoo, MI: Michigan Alternative Education Study Project.
Miller, R. (1995). Alternative Education: A Brief History—and Today’s Major Trends. In J. Mintz (Ed.),The Almanac of Education Choices: Private and Public Learning Alternatives andHomeschooling (pp. 39–44). New York: MacMillan Publishing.
Mintz, J. (1995). Introduction: An Idea Whose Time Has Come. In J. Mintz (Ed.), The Almanac ofEducation Choices: Private and Public Learning Alternatives and Homeschooling (pp. 1–3).New York: MacMillan Publishing.
Paglin, C. and Fager, J. (1997). Alternative Schools: Approaches for Students at Risk (By Request series).Portland, OR: Northwest Regional Educational Laboratory. Available:http://www.nwrel.org/request/sept97/
Quinn, M.M. and Rutherford, R.B. (1998). Alternative Programs for Students With Social, Emotional, orBehavioral Problems. Reston, VA: Council for Children with Behavioral Disorders.
Raywid, M.A. (1994). Alternative Schools: The State of the Art. Educational Leadership, 52(1): 26–31.
U.S. Department of Education (1996), Safe and Drug-Free Schools. Alternative Education Programs forExpelled Students. Available: http://www.ed.gov/offices/OESE/SDFS/actguid/altersc.html
U.S. Public Law 103–882. 103rd Cong., 2nd sess., 20 October, 1994. Gun-Free Schools Act of 1994.

38

A-1
Appendix A
Survey Methodology

A-2

A-3
Table of Contents
Page
Fast Response Survey System........................................................................................... A-5Sample Selection .............................................................................................................. A-5Respondent and Response Rates ........................................................................................ A-6Sampling and Nonsampling Errors..................................................................................... A-7Variances......................................................................................................................... A-8Evaluation of Program Type.............................................................................................. A-9Definitions of Analysis Variables ...................................................................................... A-10Survey Sponsorship and Acknowledgements ...................................................................... A-11
Appendix Tables
Table
A-1 Number and percentage distribution of districts overall, and districts withalternative schools and programs for at-risk students, by district type: 2001 ............ A-6
A-2 Number and percentage distribution of districts in the sample, districts withalternative schools and programs in the sample, and respective estimated numbersand percentage distributions in the nation, by district characteristics: 2001.............. A-7

A-4
A-5
Fast Response Survey System
The Fast Response Survey System (FRSS) wasestablished in 1975 by the National Center forEducation Statistics (NCES), U.S. Department ofEducation. The FRSS is designed to collect smallamounts of issue-oriented data with minimalburden on respondents and within a relativelyshort timeframe. Surveys are generally limited tothree pages of questions, with a response burdenof about 30 minutes per respondent. Sample sizesare relatively small (usually about 1,000 to 1,500respondents per survey) so that data collection canbe completed quickly. Data are weighted toproduce national estimates of the samplededucation sector. The sample size permits limitedbreakouts by classification variables. However, asthe number of categories within the classificationvariables increases, the sample size withincategories decreases, which results in largersampling errors for the breakouts by classificationvariables. The FRSS collects data from stateeducation agencies, local education agencies,public and private elementary and secondaryschools, public school teachers, and publiclibraries.
Sample Selection
Before the main survey was mailed out, a pilotstudy was conducted. Given the lack of availableinformation about the numbers of alternativeprograms across the nation (the Common Core ofData (CCD) only includes data on alternativeschools), the pilot study aimed to determine thenumber of alternative programs that existed inregular districts31 both with and without alternativeschools. The results of the pilot study were used toinform the main study’s sample to increase thelikelihood that the districts sampled would berepresentative of the nation’s districts withalternative schools and programs for at-riskstudents and provide a sufficient number of cases
31Regular districts are defined in the 1998–99 CCD as one of two
types: 1) A local school district that is not a component of asupervisory union, and 2) a local school district component of asupervisory union sharing a superintendent and administrativeservices with other local school districts.
to allow breakouts of results by classificationvariables (such as district size and region). Inaddition, it was anticipated that the pilot studywould shed light on the extent to which the 1998–99 NCES CCD was up-to-date and complete withrespect to information on the nation’s alternativeschools. Three hundred and thirty-seven districtsfrom the 1998–99 NCES CCD Public UniverseFile were selected for the pilot.
Based on the results of the pilot study, it wasconcluded that an estimated 45 to 55 percent of thedistricts in the CCD file had at least onealternative school or program. Moreover, theinformation available in the 1998–99 CCD fileabout the presence of alternative schools was notin line with the pilot study results. For example,the pilot study revealed that while 87 percent ofdistricts did not report any alternative schools inthe CCD, over 40 percent of these actually had atleast one alternative school. Further, among the 11percent of districts (about 1,800) that reported oneor more alternative schools in the CCD, about 10percent did not operate such schools at the time ofthe pilot study. These differences may have beendue to the time elapsed between 1998–99 and2000–01; alternative education is variable andfluid, and while many districts may haveestablished new alternative schools between 1998and 2001, others may have eliminated them. Also,there may have been differences in the definitionsof alternative schools employed for the pilot studyand for the CCD (e.g., unlike the CCD, the pilotstudy was limited to alternative schools forstudents at risk of education failure). Theimplication of these results was that considerable“oversampling” was required to obtain the desirednumber of eligible districts for analysis purposes.
Information from the pilot study helped guide theallocation of the total sample to the two majorcategories of districts: districts that reportedalternative schools in the CCD and those that didnot report alternative schools in the CCD. Withineach category, the samples were further allocatedto district size strata (less than 2,500, 2,500 to9,999, 10,000 or more) in rough proportion to theaggregate square root of the enrollment in thestratum. The sampling frame was also ordered bymetropolitan status (urban, suburban, rural) and

A-6
region (Northeast, Southeast, Central, West) toinduce additional implicit stratification. Withineach primary stratum, districts were selectedsystematically and with equal probabilities.
The sampling frame constructed consisted of14,619 regular public school districts during the1998–99 school year. After the stratum samplesizes were determined, a final sample of 1,609districts was systematically selected from thesorted file using independent random starts. The50 states and the District of Columbia wereincluded in the sample, while school districts inthe outlying U.S. territories were excluded.Districts are of three types: unified, secondary, andelementary. Unified districts serve students acrossall grade levels and comprised 83 percent of thetotal sample (table A-1). Secondary districtscomprised 2 percent, and elementary districts (i.e.,serving grades no higher than grade 8) comprised15 percent of the sample.
Respondent and Response Rates
Questionnaires and cover letters were mailed todistricts in January 2001. The cover letterindicated that the questionnaire was to becompleted by the district-level personnel mostknowledgeable about the district’s alternativeschools and programs. The cover letter also
indicated that collaboration was encouraged ifneeded.
Telephone followup was conducted from mid-February 2001 through mid-April 2001 fordistricts that did not respond to the initialquestionnaire mailing. Completed questionnaireswere received from 1,540 districts. Of the 1,540districts that completed surveys, 6 were laterexcluded from the sample after determining thatthey were not regular districts, but rather, were“regional” districts that served multiple districtsand special populations of students (i.e., at-risk orspecial education). The weighted response ratewas 97 percent. Weighted item nonresponse ratesfor 93 percent of individual questionnaire itemswere below 1 percent. Weighted item nonresponserates for the remaining 7 percent (8 questionnaireitems) ranged between 1 to 2.6 percent.
In addition to the survey questionnaires,respondents were asked to complete lists of thealternative schools and programs in their districts(if applicable). Data retrieval included telephonefollow-up calls for lists that did not include thesame number of schools and programs as reportedin question 2 of the survey, as well as for lists thatincluded schools or programs that did not appearto fit the survey definition (i.e., ABC MagnetSchool, or XYZ School for the Gifted andTalented). The weighted response rate for the listcollection was 97 percent.
Table A-1.—Number and percentage distribution of districts overall, and districts with alternativeschools and programs for at-risk students, by district type: 2001
District sampleNational estimate
of all districts
Districts with
alternative schools
and programs
in sample
National estimate
of all districts with
alternative schools
and programs
District type
Number Percent Number Percent Number Percent Number Percent
Unified................................................. 1,266 83 10,820 76 796 94 5,124 92
Elementary ........................................... 230 15 3,103 22 28 3 240 4
Secondary ............................................ 36 2 365 3 23 3 194 3
NOTE: Two sampled districts were not included, because no data were available on grades levels for them in the 2000–01 CCD.
SOURCE: U.S. Department of Education, National Center for Education Statistics, Fast Response Survey System, “District Survey of AlternativeSchools and Programs,” FRSS 76, 2001.

A-7
Sampling and Nonsampling Errors
The responses were weighted to produce nationalestimates (see table A-2). The weights weredesigned to adjust for the variable probabilities ofselection and differential nonresponse. Thefindings in this report are estimates based on thesample selected and, consequently, are subject tosampling variability.
The survey estimates are also subject tononsampling errors that can arise because ofnonobservation (nonresponse or noncoverage)errors, errors of reporting, and errors made in datacollection. These errors can sometimes bias thedata. Nonsampling errors may include suchproblems as misrecording of responses; incorrectediting and coding; differences related to the
Table A-2.—Number and percentage distribution of districts in the sample, districts withalternative schools and programs in the sample, and respective estimated numbers andpercentage distributions in the nation, by district characteristics: 2001
District sampleNational estimate of
all districts
Districts with
alternative schools
and programs in
sample
National estimate of
all districts with
alternative schools
and programs
District characteristic
Number Percent Number Percent Number Percent Number Percent
Total.............................................. 1,534 100 14,321 100 848 100 5,574 100
Metropolitan statusUrban.............................................. 179 12 810 6 153 18 535 10
Suburban.......................................... 717 47 5,896 41 407 48 2,390 43
Rural ............................................... 638 42 7,616 53 288 34 2,649 48
District enrollment sizeLess than 2,500................................. 739 48 10,423 73 215 25 2,683 48
2,500 to 9,999 .................................. 501 33 3,090 22 351 41 2,123 38
10,000 or more................................. 294 19 808 6 282 33 768 14
RegionNortheast ......................................... 303 20 2,908 20 129 15 895 16
Southeast ......................................... 249 16 1,588 11 221 26 1,264 23
Central............................................. 493 32 5,415 38 192 23 1,490 27
West ................................................ 489 32 4,411 31 306 36 1,925 35
Percent minority enrollment1
5 percent or less................................ 539 35 6,422 45 181 22 1,669 30
6 to 20 percent.................................. 380 25 3,390 24 222 26 1,448 26
21 to 50 percent ................................ 323 21 2,489 18 225 27 1,275 23
More than 50 percent ........................ 273 18 1,840 13 212 25 1,142 21
Poverty concentration2
10 percent or less.............................. 483 31 4,393 32 225 27 1,383 25
11 to 20 percent ................................ 558 36 5,109 37 333 39 2,189 40
More than 20 percent ........................ 462 30 4,366 31 285 34 1,949 351Estimates are based on the 1,515 districts for which data on percent minority enrollment were available.2Estimates are based on the 1,503 districts for which data on poverty concentration were available.
NOTE: Details may not sum to totals because of rounding.
SOURCE: U.S. Department of Education, National Center for Education Statistics, Fast Response Survey System, “District Survey of AlternativeSchools and Programs,” FRSS 76, 2001.

A-8
particular time the survey was conducted; or errorsin data preparation. While general sampling theorycan be used in part to determine how to estimatethe sampling variability of a statistic, nonsamplingerrors are not easy to measure and, formeasurement purposes, usually require that anexperiment be conducted as part of the datacollection procedures or that data external to thestudy be used.
To minimize the potential for nonsampling errors,the questions were pretested with respondents likethose who completed the questionnaire. During thedesign of the survey and survey pretest, an effortwas made to check for consistency ofinterpretation of questions and to eliminateambiguous items. The questionnaire andinstructions were extensively reviewed by theNational Center for Education Statistics, theOffice of Special Education and RehabilitativeServices (OSERS), and the Office of Elementaryand Secondary Education (OESE), U.S.Department of Education. Manual and machineediting of the questionnaire responses wereconducted to check the data for accuracy andconsistency. Cases with missing or inconsistentitems were recontacted by telephone. Data werekeyed with 100 percent verification.
Variances
The standard error is a measure of the variabilityof estimates due to sampling. It indicates thevariability of a sample estimate that would beobtained from all possible samples of a givendesign and size. Standard errors are used as ameasure of the precision expected from aparticular sample. If all possible samples weresurveyed under similar conditions, intervals of1.96 standard errors below to 1.96 standard errorsabove a particular statistic would include the truepopulation parameter being estimated in about 95percent of the samples. This is a 95 percentconfidence interval. For example, the estimatedpercentage of suburban districts that reportedhaving alternative schools or programs during the2000–01 school year was 40.8 percent, and theestimated standard error was 2.09 percent. The 95percent confidence interval for the statistic extends
from [40.8 – (2.09 times 1.96)] to [40.8 + (2.09times 1.96)], or from 36.7 to 44.9 percent. Tablesof standard errors for each table and figure in thereport are provided in appendix B.
Estimates of standard errors were computed usinga technique known as jackknife replication. Aswith any replication method, jackknife replicationinvolves constructing a number of subsamples(replicates) from the full sample and computingthe statistic of interest for each replicate. Themean square error of the replicate estimatesaround the full sample estimate provides anestimate of the variances of the statistics. Toconstruct the replications, 50 stratified subsamplesof the full sample were created and then droppedone at a time to define 50 jackknife replicates. Acomputer program (WesVar4.0) was used tocalculate the estimates of standard errors.WesVar4.0 is a stand-alone Windows applicationthat computes sampling errors for a wide varietyof statistics (totals, percents, ratios, log-oddsratios, general functions of estimates in tables,linear regression parameters, and logisticregression parameters).
The test statistics used in the analysis werecalculated using the jackknife variances and thusappropriately reflected the complex nature of thesample design. In particular, an adjusted chi-square test using Satterthwaite’s approximation tothe design effect was used in the analysis of thetwo-way tables. Bonferroni adjustments weremade to control for multiple comparisons whereappropriate. For example, for an “experiment-wise” comparison involving g pairwisecomparisons, each difference was tested at the0.05/g significance level to control for the fact thatg differences were simultaneously tested. TheBonferroni adjustment results in a moreconservative critical value being used whenjudging statistical significance. This means that acomparison that would have been significant witha critical value of 1.96 may not be significant withthe more conservative critical value. For example,the critical value for comparisons between any twoof the four categories of region is 2.64, rather than1.96 which would be used for two categories. Thismeans that there must be a larger differencebetween the estimates when there are multiple

A-9
pairs of comparisons for there to be a statisticallysignificant difference.
Evaluation of Program Type
Given the importance of the definition ofalternative schools and programs for this survey,and given that studies have shown thatrespondents do not always carefully readdefinitions, two steps were taken. First, asmentioned earlier, telephone followup was carriedout during data collection in cases where lists didnot include the same number of schools andprograms as reported in question 2 of the survey.In addition, followup was conducted for lists thatincluded schools or programs that did not appearto fit the survey definition (i.e., ABC MagnetSchool, or XYZ School for the Gifted andTalented). These subsequent conversations withrespondents allowed for resolution ofdiscrepancies and the removal of schools orprograms from lists that did not fit the surveydefinition.
Second, a follow-up study was conducted todetermine whether respondents had read thesurvey definition when completing thequestionnaire. Respondents who returnedquestionnaires by mail or fax were of concernbecause there was no phone interviewer to ensurethat the respondent understood and had readthrough the definition. Of the 848 districts thatreported having at least one alternative school orprogram for students at risk of education failure,771 completed the questionnaire by mail or fax.Of these, a random sample of every seventhdistrict was selected, resulting in a sample size of111 districts.
An initial call was made to districts in the sampleto ascertain whether the original respondent wasstill at the district, to identify some otherrespondent if necessary, and to arrange anappointment. The survey definition was then faxedto the respondent. When respondents were
recontacted, interviewers stated that the purpose ofthe call was to examine data collection procedures.After confirming that the respondent had readthrough the definition, respondents were askedhow many alternative schools and programs werein their district during the 2000–01 school yearthat fit the definition. If the number reported wasthe same as in the original survey, the interviewerclosed the interview. If the number was smaller orlarger, the interviewer attempted, by referring tothe schools and programs originally reported byrespondents in the list collection, to ascertain whythis was the case.
Of the 111 districts in the sample, data werecollected from 100. Of these, 86 reported anumber of alternative schools and programs thatmatched the number reported in the main survey.Fourteen cases did not match, and while 7 reporteda number that was smaller, 7 reported a numberthat was larger than the one given at the time ofthe main survey. Of the 7 districts that reported alarger number than in the main survey, the reasonsfell into 2 categories. First, in 5 cases, respondentsadmitted their oversight in neglecting to reportalternative schools or programs in the originalsurvey. Second, in 2 cases, respondents said thatthe definition was unclear or “did not sink in.” Ofthe 7 districts that reported a smaller number,reasons given fell into two categories. In 4 cases,respondents mistakenly reported programs wherestudents spent less than 50 percent of theirinstructional time. In 3 cases, respondentsmistakenly reported schools or programs that werenot administered by their district. There were nodistricts in the sample that reported a smallernumber in the follow-up study because of havingmistakenly included schools or programs not forat-risk students in the main survey. It may beconcluded then that all of the schools andprograms reported in the main survey (at least bysampled districts in the follow-up) were forstudents at risk of education failure.

A-10
Definitions of Analysis Variables
District enrollment size – total number ofstudents enrolled in the district, according to the1998–99 CCD.
Less than 2,500
2,500 to 9,999
10,000 or more
Metropolitan status – metropolitan status ofdistrict, as defined in the 1998–99 CCD.
Urban: Primarily serves a central city ofa Metropolitan Statistical Area (MSA).
Suburban: Serves an MSA, but notprimarily its central city.
Rural: Does not serve an MSA.
Geographic region – One of four regions used bythe Bureau of Economic Analysis of the U.S.Department of Commerce, the NationalAssessment of Educational Progress, and theNational Education Association. Obtained fromthe 1998–99 CCD.
Northeast: Connecticut, Delaware, District ofColumbia, Maine, Maryland,Massachusetts, New Hampshire,New Jersey, New York,Pennsylvania, Rhode Island, andVermont
Southeast: Alabama, Arkansas, Florida,Georgia, Kentucky, Louisiana,Mississippi, North Carolina,South Carolina, Tennessee,Virginia, and West Virginia
Central: Illinois, Indiana, Iowa, Kansas,Michigan, Minnesota, Missouri,Nebraska, North Dakota, Ohio,South Dakota, and Wisconsin
West: Alaska, Arizona, California,Colorado, Hawaii, Idaho,Montana, Nevada, New Mexico,Oklahoma, Oregon, Texas, Utah,Washington, and Wyoming
Percent minority enrollment in the school – Thepercent of students enrolled in the district whoserace or ethnicity is classified as one of thefollowing: American Indian or Alaska Native,Asian or Pacific Islander, Black (non-Hispanic), orHispanic, based on data in the 1998–99 CCD file.
5 percent or less
6 to 20 percent
21 to 50 percent
More than 50 percent
Percent of students at or below the povertylevel – This item served as the measurement of theconcentration of poverty within the district. It isbased on Title I data, which the U.S. Departmentof Education uses for estimates of school-agechildren in poverty to allocate federal funds underTitle I of the Elementary and Secondary EducationAct for education programs to aid disadvantagedchildren. The estimates are provided by the Bureauof the Census, and, for the purpose of this report,were broken into the following categories, basedon the percentage of children ages 5–17 in familiesbelow the poverty level within districts in 1996–
97:
10 percent or less
11 to 20 percent
More than 20 percent
It is important to note that some of the districtcharacteristics used for independent analyses arerelated to each other. For example, internalanalysis of sampled districts’ characteristics withinthe data set revealed that enrollment size andmetropolitan status of districts are related, withurban districts typically being larger than ruraldistricts (data not shown in tables). Similarly,poverty concentration and minority enrollment arerelated, with districts with a high minorityenrollment also more likely to have a highconcentration of poverty. In addition, arelationship may exist between district type(unified, elementary, and secondary) andparticular district characteristics. Otherrelationships between analysis variables may exist.

A-11
Because of the relatively small sample used in thisstudy, it is difficult to separate the independenteffects of these variables. Their existence,however, should be considered in theinterpretation of the data presented in this report.
Survey Sponsorship andAcknowledgements
The survey was performed under contract withWestat, using the Fast Response Survey System.Westat’s Project Director was Elizabeth Farris,and the Survey Manager was Brian Kleiner.Bernie Greene was the NCES Project Officer. Thedata were requested by the Office of SpecialEducation and Rehabilitative Services (OSERS)and the Office of Elementary and SecondaryEducation (OESE), U.S. Department of Education.
This report was reviewed by the followingindividuals:
Outside NCES
• Stephanie Cronen, American Institutes forResearch, Education Statistics ServicesInstitute
• Kelly Henderson, Office of Special Educationand Rehabilitative Services, U.S. Departmentof Education
• Lawrence Lanahan, American Institutes forResearch, Education Statistics ServicesInstitute
• Cheryl Lange, Lange Consultants,Bloomington, Minnesota
• Carolyn S. Lee, Office of Vocational andAdult Education, U.S. Department ofEducation
• David Miller, American Institutes forResearch, Education Statistics ServicesInstitute
• Jane Razeghi, Graduate School of Education,George Mason University
• Deborah Rudy, Office of Elementary andSecondary Education, U.S. Department ofEducation
• Mary Shifferli, Office for Civil Rights, U.S.Department of Education
Inside NCES
• Janis Brown, Assessment Division
• Kathryn Chandler, Elementary/Secondaryand Libraries Studies Division
• William Hussar, Early Childhood,International, and Crosscutting StudiesDivision
• Karen O’Conor, Office of the DeputyCommissioner
• Valena Plisko, Associate Commissioner,Early Childhood, International, andCrosscutting Studies Division
• John Ralph, Early Childhood, International,and Crosscutting Studies Division
• Marilyn Seastrom, Chief Statistician,Office of the Deputy Commissioner
For more information about the Fast ResponseSurvey System or the district survey of alternativeschools and programs, contact Bernie Greene,Early Childhood, International, and CrosscuttingStudies Division, National Center for EducationStatistics, Office of Educational Research andImprovement, U.S. Department of Education,1990 K Street, NW, Washington, DC 20006, e-mail: [email protected], telephone (202)502–7348.

B-1
Appendix B
Tables of Standard Errors

B-2

B-3
Table of Contents
Tables of Standard Errors for Text Tables and Figures
Table Page
B-1 Standard errors for table 1: Percent of districts with alternative schools and programsfor at-risk students, by district characteristics: Academic year 2000–01......................... B-5
B-2 Standard errors for table 2: Total number of public alternative schools and programs forat-risk students, number of students enrolled, and number of specific types: Academicyear 2000–01............................................................................................................. B-6
B-3 Standard errors for table 3: Percentage distribution of districts with alternative schoolsand programs for at-risk students, grouped by number of schools and/or programs perdistrict, by district characteristics: Academic year 1999–2000....................................... B-7
B-4 Standard errors for table 4: Percentage distribution of districts with alternative schoolsand programs for at-risk students, grouped by percent of students enrolled as ofOctober 1, 2000, by district characteristics: Academic year 2000–01............................. B-8
B-5 Standard errors for table 5: Percentage distribution of districts with alternative schoolsand programs for at-risk students, grouped by percent of students with IndividualizedEducation Programs (IEPs) in these schools and programs as of October 1, 2000, bydistrict characteristics: Academic year 2000–01........................................................... B-9
B-6 Standard errors for table 6: Percent of districts with alternative schools and programsfor at-risk students that were unable to enroll new students in an alternative school orprogram, by district characteristics: Academic year 1999–2000 .................................... B-10
B-7 Standard errors for table 7: Percent of districts with alternative schools and programsfor at-risk students that employed various procedures when demand for enrollmentexceeded available capacity within the last 3 years, by district characteristics:Academic years 1998–2001........................................................................................ B-11
B-8 Standard errors for table 8: Percent of districts with alternative schools and programsfor at-risk students that reported that students could be transferred to an alternativeschool or program solely on the basis of various reasons, by district characteristics:Academic year 2000–01............................................................................................. B-12
B-9 Standard errors for table 9: Percentage distribution of districts with alternative schoolsand programs for at-risk students that reported the extent to which various meansinfluence the placement of special education students with Individualized EducationPrograms (IEPs) in alternative schools and programs: Academic year 2000–01 ............. B-14
B-10 Standard errors for table 10: Percentage distribution of districts with alternative schoolsand programs for at-risk students that reported a policy that allows all, some, or nostudents enrolled to return to a regular school, by district characteristics: Academic year2000–01.................................................................................................................... B-15

B-4
Table of Contents (continued)
Tables of Standard Errors for Text Tables and Figures (continued)
Table Page
B-11 Standard errors for table 11: Percent of districts with alternative schools and programsfor at-risk students that cited various reasons as “very important” in determiningwhether an enrolled student can return to a regular school, by district characteristics:Academic year 2000–01 ............................................................................................ B-16
B-12 Standard errors for table 12: Percent of districts with alternative schools and programsfor at-risk students that used various practices for hiring alternative school and programteachers, by district characteristics: Academic year 2000–01 ........................................ B-17
B-13 Standard errors for table 13: Percent of districts with alternative schools and programsfor at-risk students that reported various required services or practices be maderoutinely available to enrolled students, by district characteristics: Academic year2000–01.................................................................................................................... B-18
B-14 Standard errors for table 14: Percent of districts with alternative schools and programsfor at-risk students that collaborated with various agencies in order to provide servicesfor enrolled students, by district characteristics: Academic year 2000–01 ...................... B-20
B-15 Standard errors for figures and for data not shown in tables: Academic years 1999–2001.......................................................................................................................... B-22

B-5
Table B-1.—Standard errors for table 1: Percent of districts with alternative schools and programsfor as-risk students, by district characteristics: Academic year 2000–01
Characteristic Percent
Total ............................................................................................................................... 1.3
Metropolitan statusUrban.................................................................................................................................. 5.4
Suburban ............................................................................................................................. 2.1
Rural................................................................................................................................... 1.7
District enrollment sizeLess than 2,500 .................................................................................................................... 1.8
2,500 to 9,999...................................................................................................................... 2.1
10,000 or more..................................................................................................................... 1.4
RegionNortheast ............................................................................................................................. 2.4
Southeast ............................................................................................................................. 3.6
Central ................................................................................................................................ 2.2
West ................................................................................................................................... 2.4
Percent minority enrollment5 percent or less.................................................................................................................... 1.9
6 to 20 percent ..................................................................................................................... 2.8
21 to 50 percent.................................................................................................................... 3.1
More than 50 percent ............................................................................................................ 4.1
Poverty concentration10 percent or less.................................................................................................................. 2.2
11 to 20 percent.................................................................................................................... 2.2
More than 20 percent ............................................................................................................ 2.2
SOURCE: U.S. Department of Education, National Center for Education Statistics, Fast Response Survey System, “District Survey of AlternativeSchools and Programs,” FRSS 76, 2001.

B-6
Table B-2.—Standard errors for table 2: Total number of public alternative schools and programsfor at-risk students, number of students enrolled, and number of specific types:Academic year 2000–01
Characteristics of alternative schools and programs Number
Public alternative schools and programs........................................................................................ 309
Students enrolled in alternative schools and programs..................................................................... 36,065
Special education students with IEPs enrolled in alternative schools and programs............................. 3,588
Alternative schools and programs housed in a separate facility......................................................... 243
Alternative schools and programs in juvenile detention centers........................................................ 52
Alternative schools and programs that are community-based............................................................ 66
Charter schools for at-risk students................................................................................................ 28
SOURCE: U.S. Department of Education, National Center for Education Statistics, Fast Response Survey System, “District Survey of AlternativeSchools and Programs,” FRSS 76, 2001.
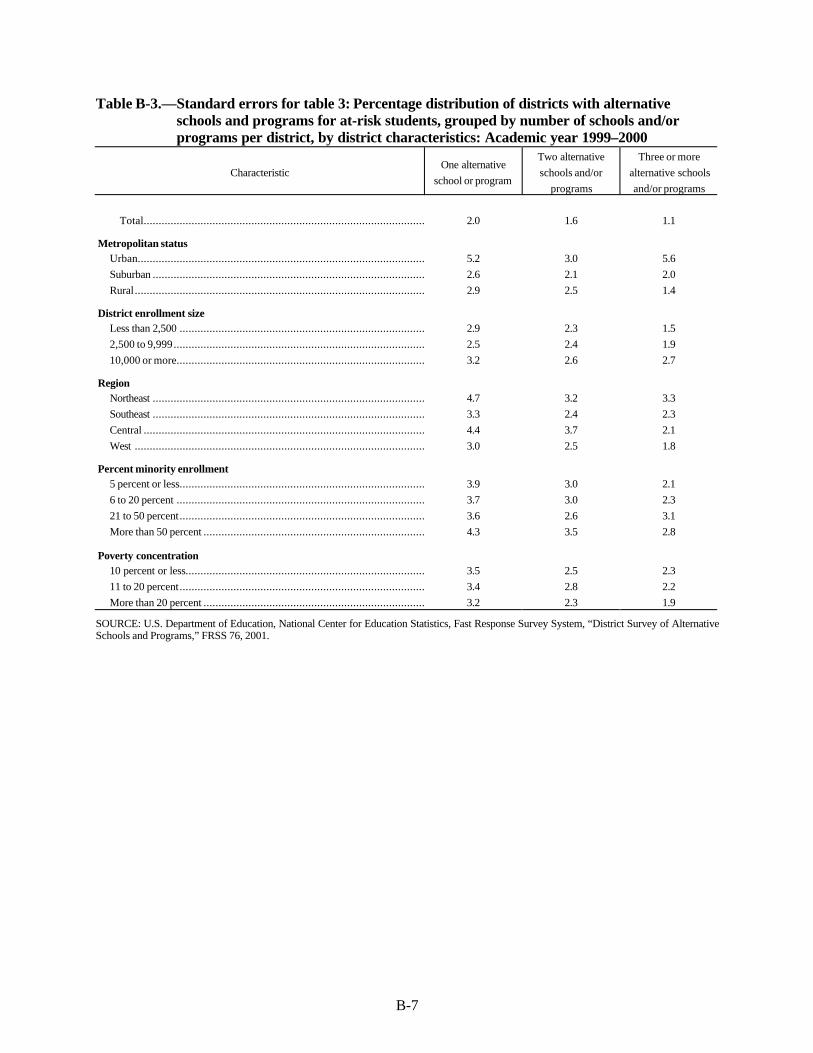
B-7
Table B-3.—Standard errors for table 3: Percentage distribution of districts with alternativeschools and programs for at-risk students, grouped by number of schools and/orprograms per district, by district characteristics: Academic year 1999–2000
CharacteristicOne alternative
school or program
Two alternative
schools and/or
programs
Three or more
alternative schools
and/or programs
Total.............................................................................................. 2.0 1.6 1.1
Metropolitan statusUrban................................................................................................ 5.2 3.0 5.6
Suburban ........................................................................................... 2.6 2.1 2.0
Rural................................................................................................. 2.9 2.5 1.4
District enrollment sizeLess than 2,500 .................................................................................. 2.9 2.3 1.5
2,500 to 9,999.................................................................................... 2.5 2.4 1.9
10,000 or more................................................................................... 3.2 2.6 2.7
RegionNortheast ........................................................................................... 4.7 3.2 3.3
Southeast ........................................................................................... 3.3 2.4 2.3
Central .............................................................................................. 4.4 3.7 2.1
West ................................................................................................. 3.0 2.5 1.8
Percent minority enrollment5 percent or less.................................................................................. 3.9 3.0 2.1
6 to 20 percent ................................................................................... 3.7 3.0 2.3
21 to 50 percent.................................................................................. 3.6 2.6 3.1
More than 50 percent .......................................................................... 4.3 3.5 2.8
Poverty concentration10 percent or less................................................................................ 3.5 2.5 2.3
11 to 20 percent.................................................................................. 3.4 2.8 2.2
More than 20 percent .......................................................................... 3.2 2.3 1.9
SOURCE: U.S. Department of Education, National Center for Education Statistics, Fast Response Survey System, “District Survey of AlternativeSchools and Programs,” FRSS 76, 2001.

B-8
Table B-4.—Standard errors for table 4: Percentage distribution of districts with alternativeschools and programs for at-risk students, grouped by percent of students enrolled asof October 1, 2000, by district characteristics: Academic year 2000–01
Characteristic
Less than 1 percent
of total district
enrollment
1 to 1.99
percent of total
district enrollment
2 to 2.99
percent of total
district enrollment
3 percent
or more of total
district enrollment
Total...................................................................... 1.6 1.9 1.6 1.5
Metropolitan statusUrban........................................................................ 4.5 3.6 3.1 3.0
Suburban ................................................................... 2.8 2.7 2.4 1.7
Rural......................................................................... 2.9 2.7 2.3 2.8
District enrollment sizeLess than 2,500 .......................................................... 3.2 3.3 2.9 3.0
2,500 to 9,999............................................................ 2.1 2.3 1.6 1.5
10,000 or more........................................................... 2.8 2.7 2.5 2.0
RegionNortheast ................................................................... 4.7 4.6 2.4 3.1
Southeast ................................................................... 4.1 3.8 2.3 2.0
Central ...................................................................... 3.6 4.0 2.7 3.6
West ......................................................................... 3.2 2.9 2.9 2.7
Percent minority enrollment5 percent or less.......................................................... 3.5 3.7 2.3 3.2
6 to 20 percent ........................................................... 4.0 3.4 2.8 2.6
21 to 50 percent.......................................................... 3.4 3.5 3.6 2.6
More than 50 percent .................................................. 3.8 3.8 3.5 4.0
Poverty concentration10 percent or less........................................................ 3.9 3.4 2.4 2.7
11 to 20 percent.......................................................... 2.6 2.9 2.6 2.3
More than 20 percent .................................................. 3.3 3.2 2.5 2.8
SOURCE: U.S. Department of Education, National Center for Education Statistics, Fast Response Survey System, “District Survey of AlternativeSchools and Programs,” FRSS 76, 2001.

B-9
Table B-5.—Standard errors for table 5: Percentage distribution of districts with alternativeschools and programs for at-risk students, grouped by percent of students withIndividualized Education Programs (IEPs) in these schools and programs as ofOctober 1, 2000, by district characteristics: Academic year 2000–01
Characteristic
Less than 3 percent
of students have
IEPs
3 to 9.99 percent of
students have IEPs
10 to 19.99 percent
of students have
IEPs
20 percent or more
of students have
IEPs
Total ................................................................... 2.0 1.4 1.4 1.7
Metropolitan statusUrban...................................................................... 5.3 4.4 4.0 4.3
Suburban ................................................................. 3.0 2.0 2.4 2.5
Rural....................................................................... 2.7 2.2 2.2 2.6
District enrollment sizeLess than 2,500 ........................................................ 3.3 2.2 2.6 2.9
2,500 to 9,999.......................................................... 2.0 1.7 2.3 2.1
10,000 or more......................................................... 2.8 2.7 2.7 2.2
RegionNortheast ................................................................. 5.5 2.4 3.4 5.7
Southeast ................................................................. 3.7 2.2 2.6 4.2
Central .................................................................... 4.3 2.2 3.3 3.7
West ....................................................................... 3.1 3.0 2.7 3.3
Percent minority enrollment5 percent or less........................................................ 4.0 2.1 2.5 4.2
6 to 20 percent ......................................................... 4.0 2.6 3.5 4.0
21 to 50 percent........................................................ 3.3 2.9 3.3 4.6
More than 50 percent ................................................ 3.5 3.1 3.4 4.1
Poverty concentration10 percent or less...................................................... 4.4 2.6 2.9 3.6
11 to 20 percent........................................................ 2.6 1.9 2.8 3.0
More than 20 percent ................................................ 2.7 2.7 2.1 2.9
SOURCE: U.S. Department of Education, National Center for Education Statistics, Fast Response Survey System, “District Survey of AlternativeSchools and Programs,” FRSS 76, 2001.
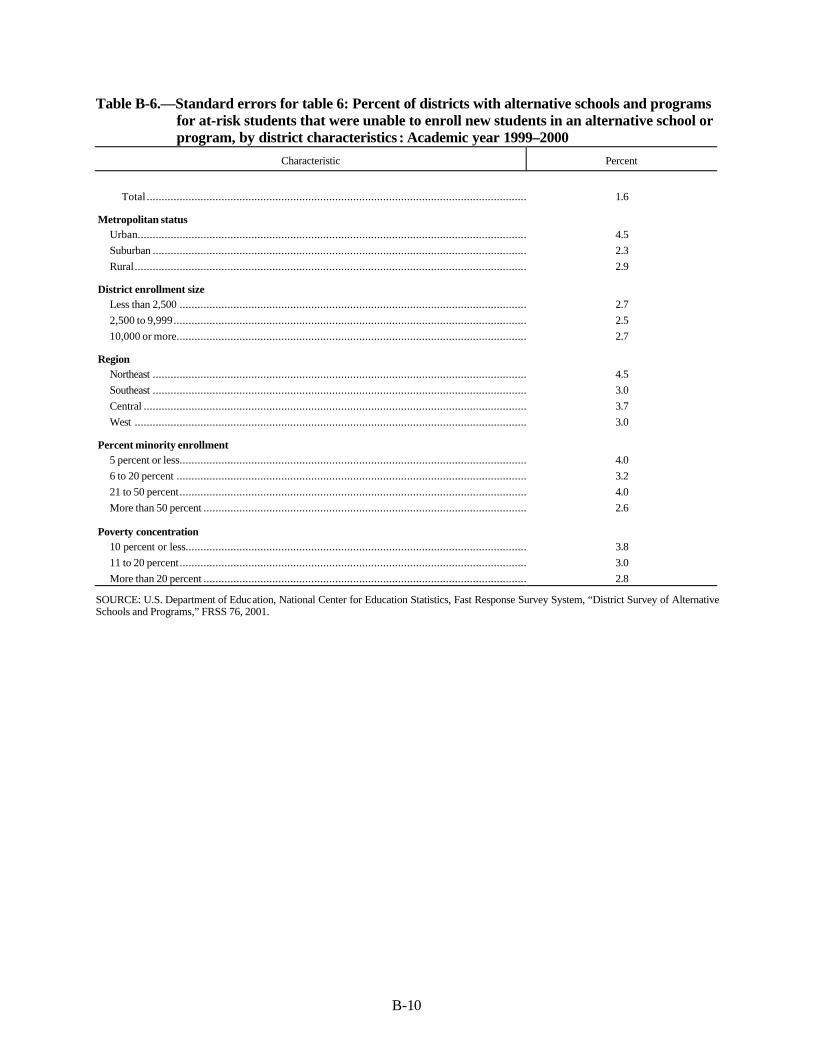
B-10
Table B-6.—Standard errors for table 6: Percent of districts with alternative schools and programsfor at-risk students that were unable to enroll new students in an alternative school orprogram, by district characteristics : Academic year 1999–2000
Characteristic Percent
Total ............................................................................................................................... 1.6
Metropolitan statusUrban.................................................................................................................................. 4.5
Suburban ............................................................................................................................. 2.3
Rural................................................................................................................................... 2.9
District enrollment sizeLess than 2,500 .................................................................................................................... 2.7
2,500 to 9,999...................................................................................................................... 2.5
10,000 or more..................................................................................................................... 2.7
RegionNortheast ............................................................................................................................. 4.5
Southeast ............................................................................................................................. 3.0
Central ................................................................................................................................ 3.7
West ................................................................................................................................... 3.0
Percent minority enrollment5 percent or less.................................................................................................................... 4.0
6 to 20 percent ..................................................................................................................... 3.2
21 to 50 percent.................................................................................................................... 4.0
More than 50 percent ............................................................................................................ 2.6
Poverty concentration10 percent or less.................................................................................................................. 3.8
11 to 20 percent.................................................................................................................... 3.0
More than 20 percent ............................................................................................................ 2.8
SOURCE: U.S. Department of Education, National Center for Education Statistics, Fast Response Survey System, “District Survey of AlternativeSchools and Programs,” FRSS 76, 2001.
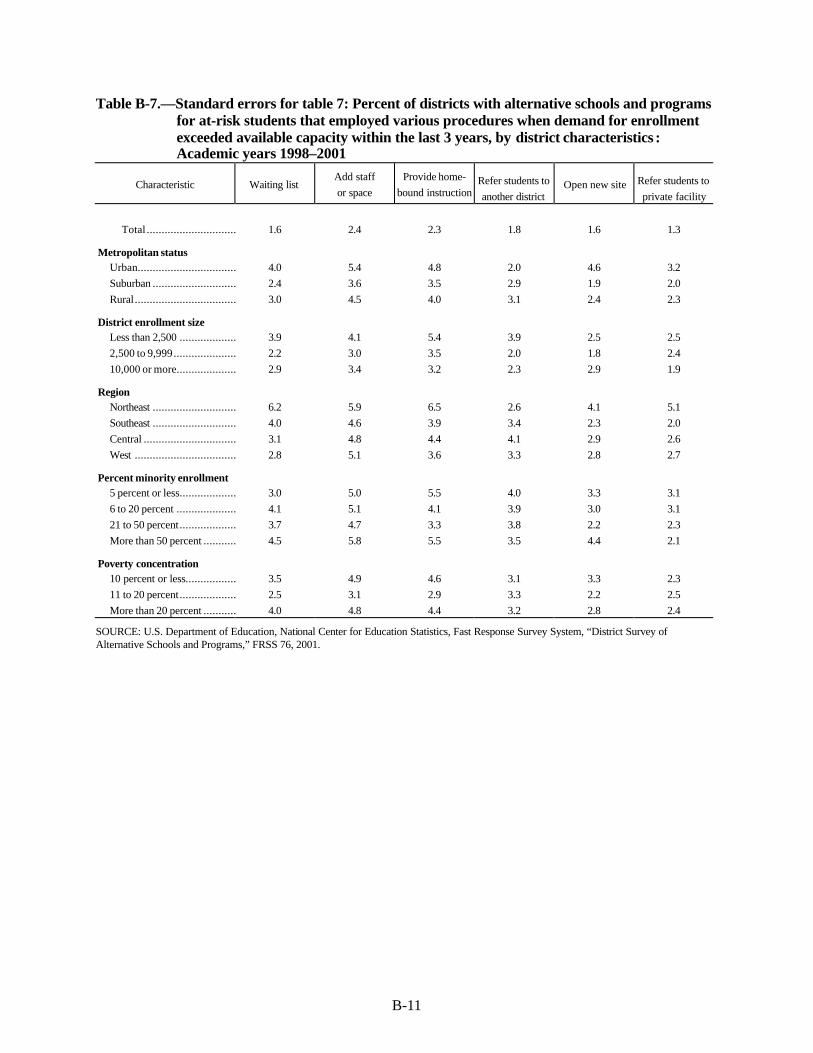
B-11
Table B-7.—Standard errors for table 7: Percent of districts with alternative schools and programsfor at-risk students that employed various procedures when demand for enrollmentexceeded available capacity within the last 3 years, by district characteristics :Academic years 1998–2001
Characteristic Waiting listAdd staff
or space
Provide home-
bound instructionRefer students to
another districtOpen new site Refer students to
private facility
Total .............................. 1.6 2.4 2.3 1.8 1.6 1.3
Metropolitan statusUrban................................. 4.0 5.4 4.8 2.0 4.6 3.2
Suburban ............................ 2.4 3.6 3.5 2.9 1.9 2.0
Rural.................................. 3.0 4.5 4.0 3.1 2.4 2.3
District enrollment sizeLess than 2,500 ................... 3.9 4.1 5.4 3.9 2.5 2.5
2,500 to 9,999..................... 2.2 3.0 3.5 2.0 1.8 2.4
10,000 or more.................... 2.9 3.4 3.2 2.3 2.9 1.9
RegionNortheast ............................ 6.2 5.9 6.5 2.6 4.1 5.1
Southeast ............................ 4.0 4.6 3.9 3.4 2.3 2.0
Central ............................... 3.1 4.8 4.4 4.1 2.9 2.6
West .................................. 2.8 5.1 3.6 3.3 2.8 2.7
Percent minority enrollment5 percent or less................... 3.0 5.0 5.5 4.0 3.3 3.1
6 to 20 percent .................... 4.1 5.1 4.1 3.9 3.0 3.1
21 to 50 percent................... 3.7 4.7 3.3 3.8 2.2 2.3
More than 50 percent ........... 4.5 5.8 5.5 3.5 4.4 2.1
Poverty concentration10 percent or less................. 3.5 4.9 4.6 3.1 3.3 2.3
11 to 20 percent................... 2.5 3.1 2.9 3.3 2.2 2.5
More than 20 percent ........... 4.0 4.8 4.4 3.2 2.8 2.4
SOURCE: U.S. Department of Education, National Center for Education Statistics, Fast Response Survey System, “District Survey ofAlternative Schools and Programs,” FRSS 76, 2001.

B-12
Table B-8.—Standard errors for table 8: Percent of districts with alternative schools and programsfor at-risk students that reported that students could be transferred to an alternativeschool or program solely on the basis of various reasons , by district characteristics :Academic year2000–01
Characteristic
Possession,
distribution, or
use of alcohol or
drugs
Physical attacks
or fightsChronic truancy
Possession or use
of a weapon
(other than a
firearm)
Continual
academic failure
Total ..................................................... 1.9 2.0 2.1 2.1 2.0
Metropolitan statusUrban......................................................... 4.5 5.1 4.9 4.6 4.8
Suburban .................................................... 3.5 3.7 3.0 3.6 3.1
Rural.......................................................... 2.9 2.8 3.3 2.9 2.9
District enrollment sizeLess than 2,500 ........................................... 3.6 3.5 3.5 3.5 3.3
2,500 to 9,999............................................. 2.7 2.7 2.7 2.8 3.0
10,000 or more............................................ 2.5 2.7 3.1 2.6 3.4
RegionNortheast .................................................... 5.4 5.2 5.4 5.3 5.3
Southeast .................................................... 3.9 3.6 3.9 3.9 4.8
Central ....................................................... 4.4 3.4 4.0 3.9 4.2
West .......................................................... 3.1 3.1 2.9 3.1 3.1
Percent minority enrollment5 percent or less.......................................... 4.3 4.2 4.6 4.7 2.9
6 to 20 percent ........................................... 4.4 3.6 3.5 4.4 3.8
21 to 50 percent.......................................... 4.3 4.2 3.8 4.6 3.9
More than 50 percent .................................. 4.3 4.2 4.0 4.5 4.7
Poverty concentration10 percent or less........................................ 4.3 4.0 4.0 4.4 4.0
11 to 20 percent.......................................... 3.2 3.3 3.3 2.9 3.1
More than 20 percent .................................. 3.6 3.3 3.1 3.6 3.5

B-13
Table B-8.—Standard errors for table 8: Percent of districts with alternative schools and programsfor at-risk students that reported that students could be transferred to an alternativeschool or program solely on the basis of various reasons , by district characteristics :Academic year 2000–01—Continued
CharacteristicDisruptive verbal
behavior
Possession or
use of a firearm
Arrest or
involvement
with juvenile
justice system
Teen pregnancy/
parenthood
Mental health
needs
Total.............................................................. 2.0 2.1 2.1 1.5 1.8
Metropolitan statusUrban ................................................................ 4.4 4.1 4.2 4.9 4.2
Suburban............................................................ 3.4 3.6 3.4 2.5 2.2
Rural.................................................................. 3.1 3.3 2.9 2.3 2.9
District enrollment sizeLess than 2,500 ................................................... 3.9 3.5 3.3 2.9 3.0
2,500 to 9,999..................................................... 2.7 2.7 3.1 2.0 2.8
10,000 or more ................................................... 3.3 3.1 2.9 2.9 2.8
RegionNortheast ............................................................ 4.8 5.2 4.3 2.7 3.8
Southeast ............................................................ 3.9 3.8 3.8 3.3 4.9
Central............................................................... 3.5 3.7 3.6 3.8 4.0
West .................................................................. 2.8 3.2 3.4 3.1 2.8
Percent minority enrollment5 percent or less .................................................. 3.8 4.6 4.0 3.1 3.3
6 to 20 percent .................................................... 3.3 3.9 3.5 3.7 3.2
21 to 50 percent .................................................. 3.8 4.2 4.1 3.3 3.4
More than 50 percent........................................... 3.7 5.0 4.7 3.7 3.6
Poverty concentration10 percent or less ................................................ 3.7 4.6 3.8 3.4 3.0
11 to 20 percent .................................................. 3.0 2.9 3.4 2.7 3.0
More than 20 percent........................................... 3.2 3.8 3.6 2.5 3.2
SOURCE: U.S. Department of Education, National Center for Education Statistics, Fast Response Survey System, “District Survey of AlternativeSchools and Programs,” FRSS 76, 2001.

B-14
Table B-9.—Standard errors for table 9: Percentage distribution of districts with alternativeschools and programs for at-risk students that reported the extent to which variousmeans influence the placement of special education students with IndividualizedEducation Programs (IEPs) in alternative schools and programs: Academic year2000–01
Means of placement Not at all Small extent Moderate extent Large extent
IEP team decision................................................................... 1.0 1.3 1.6 1.9
Support of director of special education .................................... 1.6 1.8 1.9 2.3
Regular school staff recommendation ....................................... 1.7 1.6 2.1 1.8
Student request ....................................................................... 1.9 2.3 2.2 1.6
Parent request ........................................................................ 2.0 2.2 2.2 1.5
As a result of Functional Behavioral Assessment (FBA)............. 2.1 1.6 1.8 1.4
Referral by juvenile justice system ........................................... 2.1 1.9 1.7 1.6
SOURCE: U.S. Department of Education, National Center for Education Statistics, Fast Response Survey System, “District Survey of AlternativeSchools and Programs,” FRSS 76, 2001.

B-15
Table B-10.—Standard errors for table 10: Percentage distribution of districts with alternativeschools and programs for at-risk students that reported a policy that allows all, some,or no students enrolled to return to a regular school, by district characteristics:Academic year 2000–01
Characteristic Yes, for all studentsYes, for some
students
No, never for any
students
Total ............................................................................................. 1.9 1.8 0.5
Metropolitan statusUrban................................................................................................ 3.6 3.6 †
Suburban ........................................................................................... 2.6 2.6 0.3
Rural................................................................................................. 2.7 2.6 0.9
District enrollment sizeLess than 2,500 .................................................................................. 3.4 3.2 0.9
2,500 to 9,999.................................................................................... 2.1 2.1 0.2
10,000 or more................................................................................... 3.0 3.0 †
RegionNortheast ........................................................................................... 4.4 4.4 †
Southeast ........................................................................................... 3.8 3.8 †
Central .............................................................................................. 4.2 4.1 1.0
West ................................................................................................. 3.3 3.3 1.1
Percent minority enrollment5 percent or less.................................................................................. 4.3 4.0 0.9
6 to 20 percent ................................................................................... 3.0 3.0 †
21 to 50 percent.................................................................................. 3.8 3.7 1.1
More than 50 percent .......................................................................... 3.0 3.0 1.4
Poverty concentration10 percent or less................................................................................ 2.9 2.8 1.0
11 to 20 percent.................................................................................. 3.0 3.0 0.7
More than 20 percent .......................................................................... 2.9 2.9 0.8
† Estimate of standard error is not derived because it is based on a statistic estimated at 0 percent.
SOURCE: U.S. Department of Education, National Center for Education Statistics, Fast Response Survey System, “District Survey of AlternativeSchools and Programs,” FRSS 76, 2001.

B-16
Table B-11.—Standard errors for table 11: Percent of districts with alternative schools and programsfor at-risk students that cited various reasons as “very important” in determiningwhether an enrolled student can return to a regular school, by district characteristics:Academic year 2000–01
Characteristic
Improved
attitude or
behavior
Student
motivation to
return
Approval of
alternative
school/progra
m staff
Improved
grades
Approval of
the regular
school
administrator
or counselor
Student
readiness by
standardized
assessment
Availability
of space in
regular school
Total ................................... 1.5 1.8 1.6 2.0 2.1 1.4 0.8
Metropolitan statusUrban...................................... 2.8 3.7 4.2 4.1 4.1 3.5 1.4
Suburban ................................. 2.0 2.4 2.7 2.1 3.0 1.7 1.3
Rural....................................... 2.6 2.5 2.5 3.5 3.2 2.7 1.0
District enrollment sizeLess than 2,500 ........................ 2.5 2.5 2.9 3.4 3.6 2.7 1.2
2,500 to 9,999.......................... 2.0 2.2 2.5 2.3 2.3 1.3 0.9
10,000 or more......................... 2.1 2.9 3.4 3.3 2.8 2.1 1.1
RegionNortheast ................................. 4.9 3.8 5.8 5.5 5.0 2.4 1.7
Southeast ................................. 2.7 3.6 3.5 4.4 3.8 3.1 0.7
Central .................................... 3.1 2.4 3.1 4.2 4.6 2.6 1.5
West ....................................... 3.2 2.5 3.5 3.3 3.5 2.3 1.6
Percent minority enrollment5 percent or less........................ 3.0 3.0 3.5 3.9 4.1 3.3 1.5
6 to 20 percent ......................... 3.0 3.0 3.5 4.1 4.2 2.0 1.3
21 to 50 percent........................ 2.8 3.7 3.3 3.9 3.2 3.1 1.8
More than 50 percent ................ 3.2 3.9 3.9 4.4 4.2 2.3 0.9
Poverty concentration10 percent or less...................... 3.0 3.2 3.6 3.4 3.7 2.3 2.1
11 to 20 percent........................ 2.7 2.5 3.2 3.1 3.0 2.0 0.8
More than 20 percent ................ 2.6 3.0 2.9 3.6 3.3 2.8 1.2
SOURCE: U.S. Department of Education, National Center for Education Statistics, Fast Response Survey System, “District Survey of AlternativeSchools and Programs,” FRSS 76, 2001.

B-17
Table B-12.—Standard errors for table 12: Percent of districts with alternative schools andprograms for at-risk students that used various practices for hiring alternative schooland program teachers, by district characteristics: Academic year 2000–01
Characteristic
Hired specifically to teach
in alternative schools and
programs
Transferred by choice
from a regular schoolInvoluntarily assigned
Total ....................................................................... 1.6 2.1 1.1
Metropolitan statusUrban.......................................................................... 2.4 4.5 3.9
Suburban ..................................................................... 2.0 2.6 1.4
Rural........................................................................... 2.6 3.4 1.8
District enrollment sizeLess than 2,500 ............................................................ 2.7 3.5 1.8
2,500 to 9,999.............................................................. 1.7 2.6 1.5
10,000 or more............................................................. 1.4 2.3 2.4
RegionNortheast ..................................................................... 3.9 4.1 1.1
Southeast ..................................................................... 3.2 3.7 2.9
Central ........................................................................ 2.7 4.2 2.2
West ........................................................................... 2.0 3.9 1.9
Percent minority enrollment5 percent or less............................................................ 2.9 3.9 2.0
6 to 20 percent ............................................................. 2.3 3.0 2.0
21 to 50 percent............................................................ 3.0 5.0 2.2
More than 50 percent .................................................... 3.8 4.9 3.2
Poverty concentration10 percent or less.......................................................... 2.4 3.6 1.1
11 to 20 percent............................................................ 2.4 3.4 1.8
More than 20 percent .................................................... 3.2 3.5 2.5
SOURCE: U.S. Department of Education, National Center for Education Statistics, Fast Response Survey System, “District Survey of AlternativeSchools and Programs,” FRSS 76, 2001.
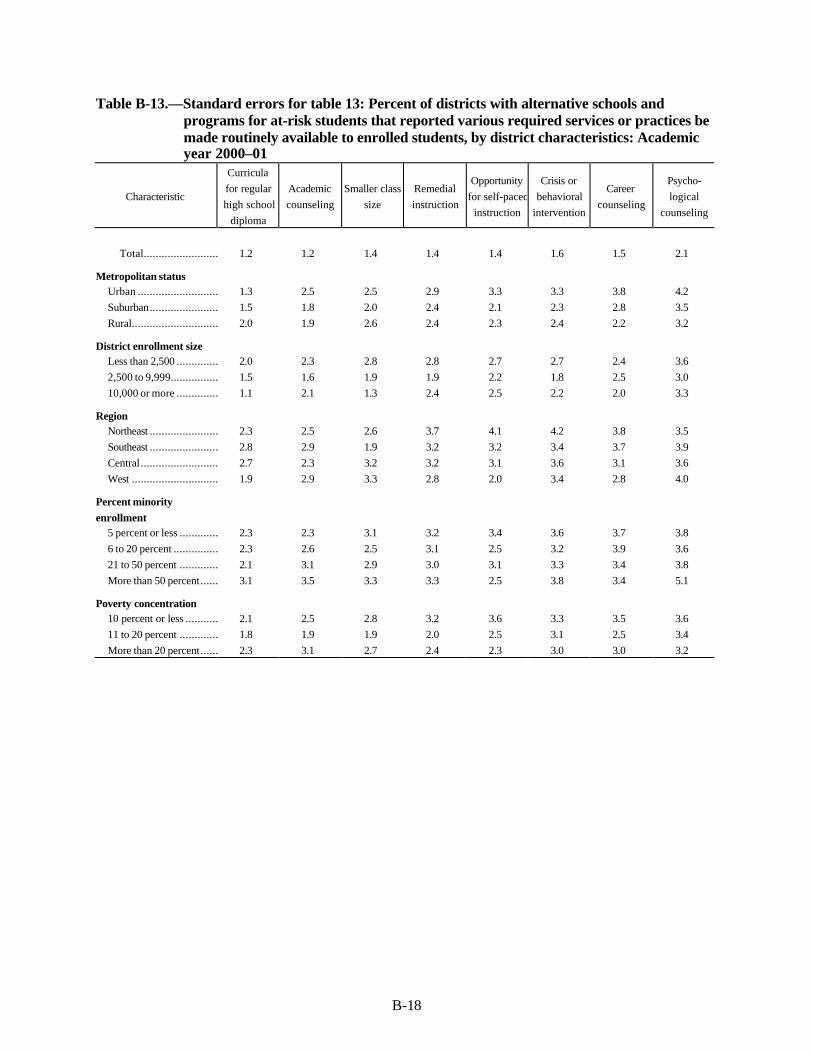
B-18
Table B-13.—Standard errors for table 13: Percent of districts with alternative schools andprograms for at-risk students that reported various required services or practices bemade routinely available to enrolled students, by district characteristics: Academicyear 2000–01
Characteristic
Curricula
for regular
high school
diploma
Academic
counseling
Smaller class
size
Remedial
instruction
Opportunity
for self-paced
instruction
Crisis or
behavioral
intervention
Career
counseling
Psycho-
logical
counseling
Total......................... 1.2 1.2 1.4 1.4 1.4 1.6 1.5 2.1
Metropolitan statusUrban ........................... 1.3 2.5 2.5 2.9 3.3 3.3 3.8 4.2
Suburban....................... 1.5 1.8 2.0 2.4 2.1 2.3 2.8 3.5
Rural............................. 2.0 1.9 2.6 2.4 2.3 2.4 2.2 3.2
District enrollment sizeLess than 2,500 .............. 2.0 2.3 2.8 2.8 2.7 2.7 2.4 3.6
2,500 to 9,999................ 1.5 1.6 1.9 1.9 2.2 1.8 2.5 3.0
10,000 or more .............. 1.1 2.1 1.3 2.4 2.5 2.2 2.0 3.3
RegionNortheast ....................... 2.3 2.5 2.6 3.7 4.1 4.2 3.8 3.5
Southeast ....................... 2.8 2.9 1.9 3.2 3.2 3.4 3.7 3.9
Central.......................... 2.7 2.3 3.2 3.2 3.1 3.6 3.1 3.6
West ............................. 1.9 2.9 3.3 2.8 2.0 3.4 2.8 4.0
Percent minority
enrollment5 percent or less ............. 2.3 2.3 3.1 3.2 3.4 3.6 3.7 3.8
6 to 20 percent ............... 2.3 2.6 2.5 3.1 2.5 3.2 3.9 3.6
21 to 50 percent ............. 2.1 3.1 2.9 3.0 3.1 3.3 3.4 3.8
More than 50 percent...... 3.1 3.5 3.3 3.3 2.5 3.8 3.4 5.1
Poverty concentration10 percent or less ........... 2.1 2.5 2.8 3.2 3.6 3.3 3.5 3.6
11 to 20 percent ............. 1.8 1.9 1.9 2.0 2.5 3.1 2.5 3.4
More than 20 percent...... 2.3 3.1 2.7 2.4 2.3 3.0 3.0 3.2

B-19
Table B-13.—Standard errors for table 13: Percent of districts with alternative schools andprograms for at-risk students that reported various required services or practices bemade routinely available to enrolled students, by district characteristics: Academicyear 2000–01—Continued
CharacteristicSocial work
services
Vocational or
skills training
Opportunity
to take classes
elsewhere
Preparation
for the GED
exam
Peer
mediation
Extended
school
day/year
Security
personnel on
site
Evening or
weekend
classes
Total.......................... 2.2 2.2 1.9 2.0 2.1 1.8 1.5 2.0
Metropolitan statusUrban ............................ 4.4 5.0 4.5 5.1 5.3 4.2 4.8 4.4
Suburban........................ 3.0 3.2 2.6 3.1 2.6 2.2 2.5 2.3
Rural.............................. 3.4 2.9 2.8 3.1 3.5 3.1 2.1 3.4
District enrollment sizeLess than 2,500 ............... 4.0 3.6 3.4 3.3 3.7 2.8 2.4 3.3
2,500 to 9,999................. 2.9 2.8 2.5 2.8 2.5 2.7 2.3 2.5
10,000 or more ............... 3.3 2.8 3.0 3.7 2.8 3.1 3.3 3.1
RegionNortheast ........................ 4.6 4.9 4.7 3.7 4.6 4.8 4.0 5.0
Southeast ........................ 4.4 4.1 3.6 4.0 3.8 2.9 2.9 3.1
Central........................... 4.3 4.6 4.3 4.0 4.2 3.6 3.3 4.1
West .............................. 4.2 4.2 4.0 3.8 3.5 3.5 2.2 3.5
Percent minority
enrollment5 percent or less .............. 4.4 4.9 4.1 4.3 4.2 3.5 2.9 3.6
6 to 20 percent ................ 3.4 4.5 4.0 3.8 3.8 3.2 2.9 3.4
21 to 50 percent .............. 4.2 4.9 3.6 3.7 3.8 3.5 3.5 3.3
More than 50 percent....... 4.6 4.5 4.9 4.8 4.2 4.9 3.8 3.9
Poverty concentration10 percent or less ............ 4.1 3.6 3.4 4.0 3.5 3.2 2.9 3.3
11 to 20 percent .............. 3.7 3.4 3.0 3.4 3.3 2.9 2.6 3.0
More than 20 percent....... 4.0 4.1 4.1 3.7 3.1 3.1 3.0 3.5
SOURCE: U.S. Department of Education, National Center for Education Statistics, Fast Response Survey System, “District Survey of AlternativeSchools and Programs,” FRSS 76, 2001.

B-20
Table B-14.—Standard errors for table 14: Percent of districts with alternative schools andprograms for at-risk students that collaborated with various agencies in order toprovide services for enrolled students, by district characteristics: Academic year2000–01
CharacteristicJuvenile justice
system
Community
mental health
agency
Police or
sheriff's
department
Child protective
services
Health and
human services
agency or
hospital
Drug and/or
alcohol clinic
Total ..................................... 1.7 1.9 1.9 2.5 2.1 2.0
Metropolitan statusUrban........................................ 3.9 4.6 4.5 4.1 4.3 4.4
Suburban ................................... 2.5 2.4 2.6 3.8 3.1 3.0
Rural......................................... 2.6 3.1 3.7 3.5 2.8 2.8
District enrollment sizeLess than 2,500 .......................... 3.1 3.4 3.5 3.9 3.2 3.6
2,500 to 9,999............................ 1.9 2.0 2.0 3.0 2.8 2.6
10,000 or more........................... 1.8 2.3 2.8 3.0 2.8 3.2
RegionNortheast ................................... 4.9 4.7 4.7 5.4 5.0 5.2
Southeast ................................... 2.8 3.2 3.2 3.6 4.1 4.1
Central ...................................... 3.6 4.2 3.6 4.5 3.5 4.4
West ......................................... 2.1 2.9 3.1 3.5 3.5 3.5
Percent minority enrollment5 percent or less.......................... 3.4 4.3 4.0 4.7 3.9 4.2
6 to 20 percent ........................... 2.5 2.9 3.6 3.7 3.2 3.9
21 to 50 percent.......................... 3.0 2.9 3.7 3.8 3.6 3.4
More than 50 percent .................. 3.1 4.0 3.9 4.3 4.8 4.4
Poverty concentration10 percent or less........................ 3.9 3.1 3.5 4.8 3.9 4.2
11 to 20 percent.......................... 2.7 2.8 2.9 3.4 2.9 3.4
More than 20 percent .................. 2.5 3.0 3.6 3.5 3.9 3.3

B-21
Table B-14.—Standard errors for table 14: Percent of districts with alternative schools andprograms for at-risk students that collaborated with various agencies in order toprovide services for enrolled students, by district characteristics : Academic year2000–01—Continued
CharacteristicCommunity
organization
Family
organizations or
associations
Crisis
intervention
center
Family
planning/child
care/child
placement
agency
Job placement
center
Parks and
recreation
department
Total ................................... 2.1 2.2 1.9 2.0 2.3 1.5
Metropolitan statusUrban...................................... 4.8 4.0 4.7 4.2 5.0 5.1
Suburban ................................. 2.7 3.1 3.0 2.9 2.6 2.3
Rural....................................... 3.5 3.4 2.9 2.8 3.7 2.4
District enrollment sizeLess than 2,500 ........................ 3.7 3.9 3.4 3.5 3.8 2.8
2,500 to 9,999.......................... 2.7 2.6 3.0 2.8 2.6 2.2
10,000 or more......................... 2.5 2.7 3.5 2.9 3.3 2.7
RegionNortheast ................................. 4.7 4.2 4.2 4.8 4.2 3.3
Southeast ................................. 3.8 3.6 3.4 3.5 4.0 3.0
Central .................................... 4.4 4.6 3.8 4.5 4.5 3.5
West ....................................... 3.1 3.6 3.2 3.3 3.6 3.0
Percent minority enrollment5 percent or less........................ 4.4 5.0 3.8 4.1 4.5 3.0
6 to 20 percent ......................... 3.5 3.4 3.7 3.1 4.0 2.9
21 to 50 percent........................ 3.2 3.7 3.4 4.2 3.8 3.7
More than 50 percent ................ 3.9 3.9 4.3 4.3 4.2 3.7
Poverty concentration10 percent or less...................... 4.4 4.4 4.1 3.8 4.0 3.1
11 to 20 percent........................ 3.5 3.2 2.7 2.8 4.0 2.9
More than 20 percent ................ 3.7 3.3 3.1 3.4 3.3 2.9
SOURCE: U.S. Department of Education, National Center for Education Statistics, Fast Response Survey System, “District Survey of AlternativeSchools and Programs,” FRSS 76, 2001.
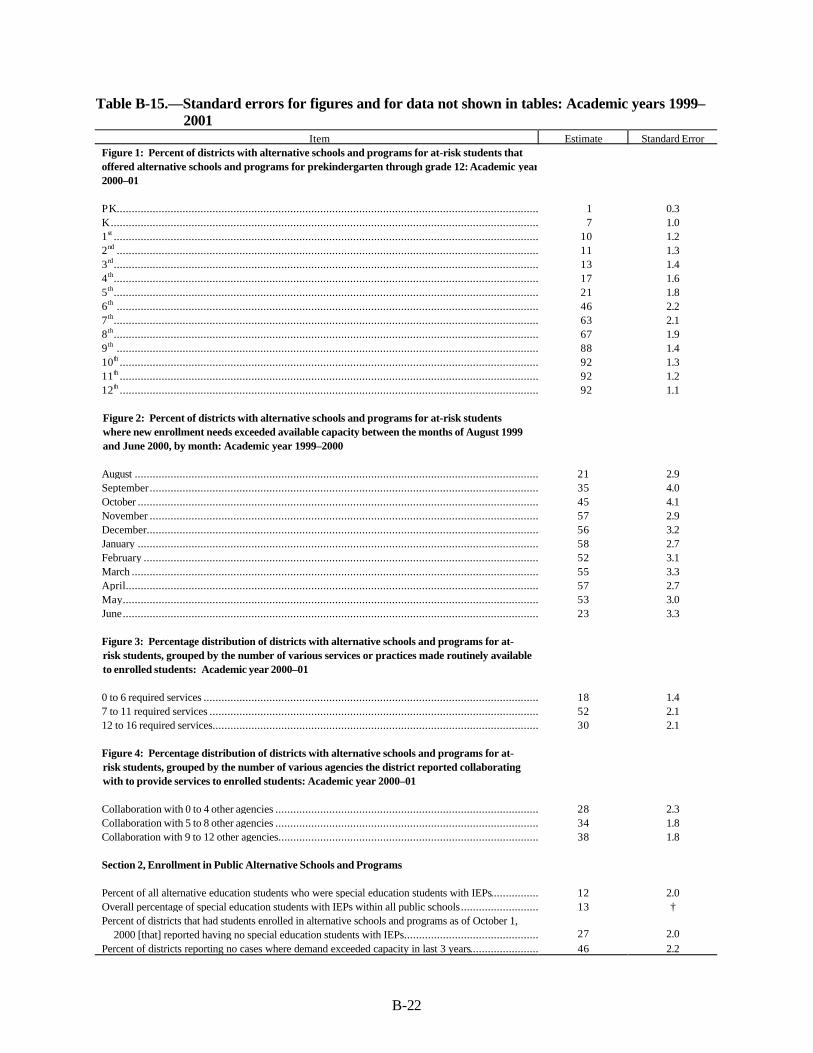
B-22
Table B-15.—Standard errors for figures and for data not shown in tables: Academic years 1999–2001
Item Estimate Standard ErrorFigure 1: Percent of districts with alternative schools and programs for at-risk students thatoffered alternative schools and programs for prekindergarten through grade 12: Academic year2000–01
PK............................................................................................................................................. 1 0.3K............................................................................................................................................... 7 1.01st .............................................................................................................................................. 10 1.22nd ............................................................................................................................................. 11 1.33rd.............................................................................................................................................. 13 1.44th.............................................................................................................................................. 17 1.65th.............................................................................................................................................. 21 1.86th ............................................................................................................................................. 46 2.27th.............................................................................................................................................. 63 2.18th.............................................................................................................................................. 67 1.99th ............................................................................................................................................. 88 1.410th ............................................................................................................................................ 92 1.311th ............................................................................................................................................ 92 1.212th ............................................................................................................................................ 92 1.1
Figure 2: Percent of districts with alternative schools and programs for at-risk studentswhere new enrollment needs exceeded available capacity between the months of August 1999and June 2000, by month: Academic year 1999–2000
August ....................................................................................................................................... 21 2.9September.................................................................................................................................. 35 4.0October ...................................................................................................................................... 45 4.1November .................................................................................................................................. 57 2.9December................................................................................................................................... 56 3.2January ...................................................................................................................................... 58 2.7February .................................................................................................................................... 52 3.1March ........................................................................................................................................ 55 3.3April.......................................................................................................................................... 57 2.7May........................................................................................................................................... 53 3.0June........................................................................................................................................... 23 3.3
Figure 3: Percentage distribution of districts with alternative schools and programs for at-risk students, grouped by the number of various services or practices made routinely availableto enrolled students: Academic year 2000–01
0 to 6 required services ................................................................................................................ 18 1.47 to 11 required services .............................................................................................................. 52 2.112 to 16 required services............................................................................................................. 30 2.1
Figure 4: Percentage distribution of districts with alternative schools and programs for at-risk students, grouped by the number of various agencies the district reported collaboratingwith to provide services to enrolled students: Academic year 2000–01
Collaboration with 0 to 4 other agencies ........................................................................................ 28 2.3Collaboration with 5 to 8 other agencies ........................................................................................ 34 1.8Collaboration with 9 to 12 other agencies....................................................................................... 38 1.8
Section 2, Enrollment in Public Alternative Schools and Programs
Percent of all alternative education students who were special education students with IEPs................ 12 2.0Overall percentage of special education students with IEPs within all public schools.......................... 13 †Percent of districts that had students enrolled in alternative schools and programs as of October 1,
2000 [that] reported having no special education students with IEPs............................................. 27 2.0Percent of districts reporting no cases where demand exceeded capacity in last 3 years....................... 46 2.2
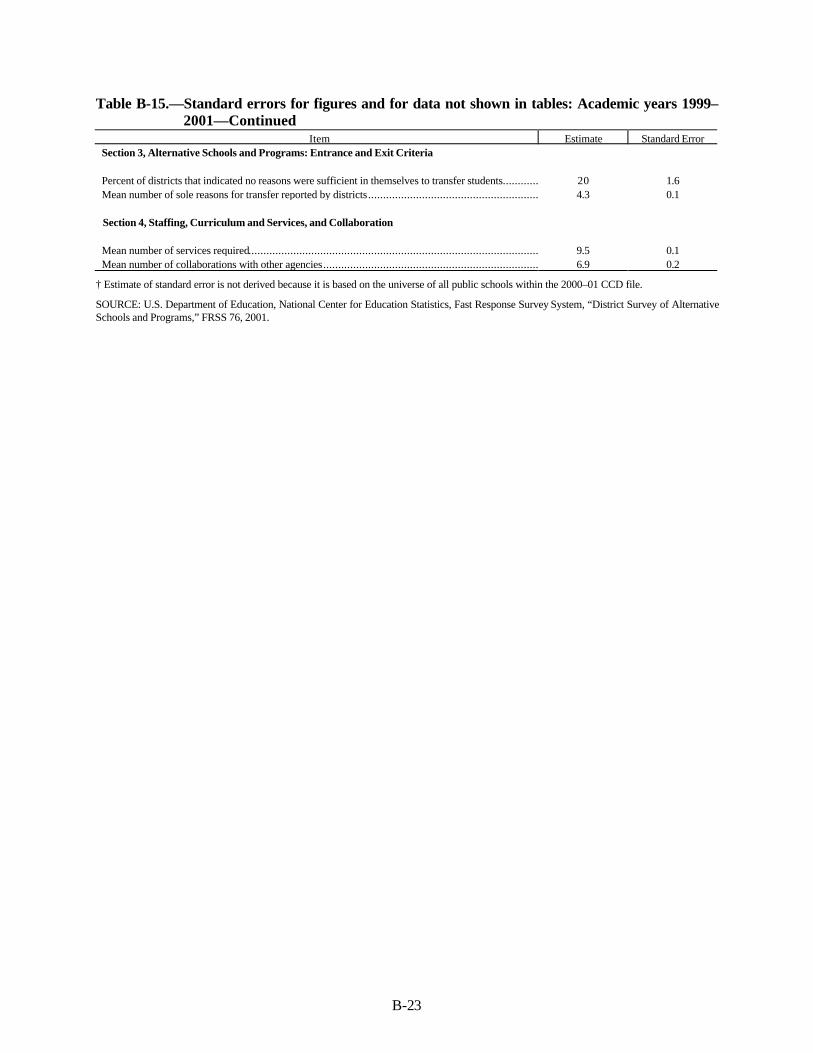
B-23
Table B-15.—Standard errors for figures and for data not shown in tables: Academic years 1999–2001—Continued
Item Estimate Standard ErrorSection 3, Alternative Schools and Programs: Entrance and Exit Criteria
Percent of districts that indicated no reasons were sufficient in themselves to transfer students............ 20 1.6Mean number of sole reasons for transfer reported by districts......................................................... 4.3 0.1
Section 4, Staffing, Curriculum and Services, and Collaboration
Mean number of services required................................................................................................. 9.5 0.1Mean number of collaborations with other agencies........................................................................ 6.9 0.2
† Estimate of standard error is not derived because it is based on the universe of all public schools within the 2000–01 CCD file.
SOURCE: U.S. Department of Education, National Center for Education Statistics, Fast Response Survey System, “District Survey of AlternativeSchools and Programs,” FRSS 76, 2001.

B-24

C-1
Appendix C
Survey Questionnaire

C-2

C-3
U.S. DEPARTMENT OF EDUCATION FORM APPROVEDNATIONAL CENTER FOR EDUCATION STATISTICS O.M.B. NO.: 1850-0733
WASHINGTON, D.C. 20006 EXPIRATION DATE: 07/2002
DISTRICT SURVEY OF ALTERNATIVE SCHOOLS AND PROGRAMS
FAST RESPONSE SURVEY SYSTEM
This survey is authorized by law (P.L. 103-382). While participation in this survey is voluntary, your cooperation is critical to make the results of thissurvey comprehensive, accurate, and timely.
LABEL
IF ABOVE INFORMATION IS INCORRECT, PLEASE MAKE CORRECTIONS DIRECTLY ON LABEL.
Name of person completing form:____________________________________ Telephone:_______________________
Title/position: ____________________________________________ Number of years at this school: _______________
Best days and times to reach you (in case of questions): ____________________________________________________
E-mail:___________________________________ Fax: _____________________________________
THANK YOU. PLEASE KEEP A COPY OF THIS SURVEY FOR YOUR RECORDS.
PLEASE RETURN COMPLETED FORM TO: IF YOU HAVE ANY QUESTIONS, CONTACT:
WESTAT Brian KleinerAttn: Brian Kleiner (716614) 800-937-8281, ext. 4469 or 301-294-44691650 Research Boulevard Fax: 800-254-0984Rockville, Maryland 20850-3819 E-mail: [email protected]
According to the Paperwork Reduction Act of 1995, no persons are required to respond to a collection of information unless it displays a valid OMBcontrol number. The valid OMB control number for this information collection is 1850-0733. The time required to complete this information collection isestimated to average 30 minutes per response, including the time to review instructions, search existing data resources, gather the data needed, andcomplete and review the information collected. If you have any comments concerning the accuracy of the time estimate(s) or suggestions for improvingthis form, please write to: U.S. Department of Education, Washington, D.C. 20202-4651. If you have comments or concerns regarding the status ofyour individual submission of this form, write directly to: National Center for Education Statistics, 1990 K Street, N.W., Washington, D.C. 20006.
FRSS Form No. 76, 1/01

C-4
DEFINITIONS FOR THIS SURVEY
Alternative schools and programs are designed to address the needs of students that typically cannot bemet in regular schools. The students who attend alternative schools and programs are typically at risk ofeducation failure (as indicated by poor grades, truancy, disruptive behavior, pregnancy, or similar factorsassociated with temporary or permanent withdrawal from school).
Alternative schools are usually housed in a separate facility where students are removed from regular schools.Alternative programs are usually housed within regular schools.
For the purposes of this survey, include:
• only alternative schools or programs for at-risk students,• only alternative schools or programs administered by your district,• only alternative schools or programs where the majority of students attend for at least half of their
instructional time,• charter schools (for at-risk students),• alternative schools or programs (that are administered by your district) within juvenile detention centers,• community-based schools or programs (administered by your district, but located within community
organizations (e.g., boys and girls clubs, community or recreational centers)),• alternative schools or programs that operate during weekday evenings or weekends.
For the purposes of this survey, exclude:
• alternative schools or programs that are not for at-risk students (e.g., gifted and talented programs, magnetschools),
• alternative schools or programs not administered by your district,• alternative schools or programs where the majority of students attend for less than half of their instructional
time,• schools or programs that exclusively serve special education students,• vocational education programs (unless specifically designated for at-risk students),• child care/day care centers,• privately run sites contracted by your district,• short-term in-school suspension programs (lasting 2 weeks or less), detention, or in-home programs for ill
or injured students.
Functional behavioral assessment (FBA) is a systematic process for describing problem behavior, identifyingenvironmental factors and setting events that predict the problem behavior, and guiding the development ofeffective and efficient behavior support plans.

C-5
This questionnaire is intended for the person or persons most knowledgeable about the alternativeschools and programs in your school district. Please feel free to collaborate with others who are able tohelp provide the required information.
I. Basic Information About Alternative Schools and Programs in Your District
1. During the current school year (2000-2001), are there any alternative schools or programs in your district?
Yes ........ 1 (Continue with question 2.) No......... 2 (Stop. Complete respondent section onfront and return questionnaire.)
2. How many alternative schools and programs do you currently have in your district? __________
3. Of those schools and programs in question 2, how many are…
a. Housed within a separate facility, i.e., not within a regular school?............................... _____________b. Charter schools?...................................................................................................... _____________c. Schools in juvenile detention centers?....................................................................... _____________d. Community-based programs?................................................................................... _____________
4. During the current school year (2000-2001), what grades are taught in your district’s alternative schools andprograms? (Circle all that apply.)
PK K 1 2 3 4 5 6 7 8 9 10 11 12 Ungraded
II. Enrollment
5. As of October 1, 2000, about how many students in your district were enrolled in alternative schools andprograms? __________ students
6. Of those students, about how many were special education students with an Individualized EducationProgram (IEP)? __________ students
7a. In any month during the 1999-2000 school year, were any of your district’s alternative schools and programsunable to enroll new students because of staffing or space limitations?
Yes ................. 1 (Continue with question 7b.) No................... 2 (Skip to question 8.)
7b. During which months of the 1999-2000 school year were any of your district’s alternative schools andprograms unable to enroll new students because of staffing or space limitations? (Check all that apply)
a. August g. Februaryb. September h. Marchc. October i. Aprild. November j. Maye. December k. Junef. January
8. In the past 3 years, what was your district’s procedure when demand for enrollment in alternative schools andprograms exceeded available capacity? If not applicable, check here and skip to question 9.
(Circle one on each line.)Yes No
a. Put students on waiting list................................................................. 1 2b. Increase capacity by adding staff/space.............................................. 1 2c. Provide home-bound instruction.......................................................... 1 2d. Open new site................................................................................... 1 2e. Refer students to another district ........................................................ 1 2f. Refer students to private facility.......................................................... 1 2g. Other (specify) _______________________________________________ 1 2

C-6
III. Entry and Exit Procedures
9. Can students in your district be transferred to alternative schools and programs solely on the basis of any ofthe following reasons? (Circle one on each line.)
Yes No
a. Possession or use of a firearm ................................................................. 1 2b. Possession or use of weapon other than a firearm..................................... 1 2c. Possession, distribution, or use of alcohol or drugs (excluding tobacco) ...... 1 2d. Arrest or involvement with juvenile justice system...................................... 1 2e. Physical attacks or fights.......................................................................... 1 2f. Disruptive verbal behavior........................................................................ 1 2g. Chronic truancy ...................................................................................... 1 2h. Continual academic failure ....................................................................... 1 2i. Pregnancy/teen parenthood..................................................................... 1 2j. Mental health needs ................................................................................ 1 2k. Other(specify) ___________________________________________________ 1 2
10. To what extent are special education students with IEPs placed in alternative schools or programs througheach of the following means? If you have no special education students, check here and skip to question11. (Circle one on each line.)
Means of placement Not at allSmallextent
Moderateextent
Largeextent
a. Support of Director of Special Education (district level)........ 1 2 3 4b. IEP team decision............................................................. 1 2 3 4c. Regular school staff recommendation (e.g., teacher,
administrator, or counselor) ............................................... 1 2 3 4d. Student request................................................................ 1 2 3 4e. Parent request.................................................................. 1 2 3 4f. As a result of Functional Behavioral Assessment (FBA) ...... 1 2 3 4g. Referral by the juvenile justice system ............................... 1 2 3 4h. Other(specify)_______________________________________ 1 2 3 4
11. Is it your district’s policy to allow students enrolled in alternative schools and programs to return to a regularschool in your district? (Circle one.)
a. Yes, for all students ....................................... 1 (Continue with question 12.)b. Yes, for some students .................................. 2 (Continue with question 12.)c. No, never for any students ............................. 3 (Skip to question 13.)
12. According to your district’s policy, how important are each of the following in determining whether a student isable to return to a regular school? (Circle one on each line.)
Factor Notimportant
Somewhatimportant
Veryimportant
a. Improved grades ................................................................ 1 2 3b. Improved attitude/behavior.................................................. 1 2 3c. Student motivation to return................................................ 1 2 3d. Student readiness as measured by a standardized
assessment ....................................................................... 1 2 3e. Availability of space in regular school .................................. 1 2 3f. Approval of the regular school administrator or counselor ..... 1 2 3g. Approval of alternative school/program staff (e.g., teacher,
administrator, or counselor)................................................. 1 2 3
h. Other(specify) _______________________________________ 1 2 3

C-7
IV. Staffing
13. Were any of the teachers in your district’s alternative schools and programs… (Circle one on each line.)
Yes No
a. Hired specifically to teach in alternative schools and programs? .................. 1 2b. Transferred by choice from a regular school to an alternative school or
program? ................................................................................................ 1 2c. Involuntarily assigned to teach in an alternative school or program?............. 1 2
V. Curriculum and Services Offered
14. According to district policy, are any of the following services or practices required to be made routinelyavailable in alternative schools and programs? (Circle one on each line.)
Yes No
a. Smaller class size than regular schools.................................................... 1 2b. Remedial instruction for students performing below grade level ................ 1 2c. Academic counseling.............................................................................. 1 2d. Career counseling .................................................................................. 1 2e. Psychological counseling ........................................................................ 1 2f. Crisis/behavioral intervention................................................................... 1 2g. Social work services ............................................................................... 1 2h. Peer mediation....................................................................................... 1 2i. Extended school day or school year......................................................... 1 2j. Evening or weekend classes ................................................................... 1 2k. Curricula leading toward a regular high school diploma............................. 1 2l. Preparation for the GED exam................................................................. 1 2m. Vocational or skills training ...................................................................... 1 2n. Opportunity to take classes at other schools, colleges, or local institutions . 1 2o. Security personnel on site....................................................................... 1 2p. Opportunity for self-paced instruction....................................................... 1 2q. Other (specify) ________________________________________________ 1 2
15. Does your district collaborate with any of the following agencies to provide services to students in alternativeschools and programs? (Circle one on each line.)
Yes No
a. Child protective services ......................................................................... 1 2b. Community mental health agency............................................................ 1 2c. Community organization.......................................................................... 1 2d. Job placement center.............................................................................. 1 2e. Crisis intervention center......................................................................... 1 2f. Drug and/or alcohol clinic ........................................................................ 1 2g. Family organizations or associations ........................................................ 1 2h. Family planning/child care/child placement agency ................................... 1 2i. Health and human services agency or hospital ......................................... 1 2j. Juvenile justice system ........................................................................... 1 2k. Parks and recreation department ............................................................. 1 2l. Police or sheriff’s department .................................................................. 1 2m. Other(specify)__________________________________________________ 1 2
VI. Background Question About Schools in Your District
16. What percent of the students in your district are eligible for free or reduced-price lunch? ________percent
THANK YOU! PLEASE KEEP A COPY FOR YOUR RECORDS.

U.S. Department of EducationOffice of Educational Research and ImprovementNCES 2002–004
Public Alternative Schools and Programsfor Students At Risk of Education Failure:2000–01
Statistical Analysis Report
U.S. Department of EducationED Pubs8242-B Sandy CourtJessup, MD 20794-1398
Official BusinessPenalty for Private Use, $300
U.S. POSTAGE PAIDU.S. DEPARTMENTOF EDUCATION
PERMIT NO. G-17
NC
ESPub
lic A
lterna
tive Sc
hoo
ls and
Prog
ram
s for Stud
ents A
t Risk o
f Educ
atio
nal Fa
ilure: 2000–01
2002