pubinternational federation of surveyors (fig)57 full
DESCRIPTION
Report on the Economic Benefitsof HydrographyTRANSCRIPT

Report on the Economic Benefits of Hydrography
INTERNATIONAL FEDERATION OF SURVEYORS (FIG)
FIG Commission 4 Working Group 4.4 – Capacity Building and the Economic Benefits of Hydrography
FIG PUbLIcATION NO 57
FIG REPORT


INTERNATIONAL FEDERATION OF SURVEYORS (FIG)
Report on the Economic Benefits of Hydrography
FIG Commission 4 Working Group 4.4 – Capacity Building and the Economic Benefits of Hydrography

Copyright © International Federation of Surveyors, June 2011
All rights reserved
International Federation of Surveyors (FIG) Kalvebod Brygge 31–33 DK-1780 Copenhagen V DENMARK
Tel. + 45 38 86 10 81 Fax + 45 38 86 02 52 E-mail: [email protected] www.fig.net
Published in English
Copenhagen, Denmark
ISBN 978-87-90907-94-5
Published by International Federation of Surveyors (FIG)
Front cover: Left: Welland Canal Flight Locks, St. Catharines, Ontario, Canada © St. Law-rence Seaway Authority; Middle: 1996 CHC poster © Canadian Hydrographic Confer-ence; Right: Oil Tanker M/V Tuvaq in the (Arctic) Northwest Passage © Canadian Hydro-graphic Service.
Back cover: Technical Session on Capacity Building and the Economic Benefits of Hy-drography, XXIV FIG Congress, Sydney 2010. Left to right: Brian Connon USA, Gordon Johnston (United Kingdom), Olumide Omotoso (Nigeria), Joseph Kuanda (Papua New Guinea), Rod Nairn (Australia) and Michael Sutherland, Canada. © FIG.
Design: International Federation of Surveyors, FIG

Contents
Foreword.....................................................................................................................................................4Andrew Leyzack, Canada
IntroduCtIon.............................................................................................................................................5Gordon Johnston, United Kingdom
eConomIC.ImpaCt.oF.HydrograpHIC.surveys................................................................................ 10Brian Douglas Connon, United States of America and Rod Nairn, Australia
tHe.eConomIC.BeneFIts.oF.HydrograpHy.and.oCean.mappIng............................................... 22Gordon Johnston, United Kingdom
tHe.value.oF.HydrograpHIC.InFormatIon.and.Its.InFluenCe................................................. 27Hugo M Gorziglia, IHO
tHe.Cost-BeneFIt.oF.CHartIng.Cameroon.waters....................................................................... 37Cyril Mbeau Ache, Cameroon and Victor Abbott, United Kingdom
metHods.to.assess.tHe.FInanCIal.value.oF.tHe.sea.parCel.and.tHe.eConomIC..oF.tHe.Coastal.and.marIne.area.wItHIn.a.marIne.Cadastre.Framework......................... 49
Johanes P. Tamtomo, Indonesia
assessment.and.Future.prospeCts.For.HydrograpHy.In.western..and.Central.aFrICa;.marItIme.saFety.and.Coastal.gloBal.development........................ 62
Dominique Baggio, France
eConomIC.BeneFIts.oF.HydrograpHy.In.tHe.CanadIan.arCtIC.–.a.Case.study................... 75Andrew Leyzack, Canada
wHy.a.natIonal.HydrograpHIC.servICe?........................................................................................ 86Prepared by Hugo Gorziglia, IHO Presented by Gordon Johnston, United Kingdom
papua.new.guInea.HydrograpHIC.servICe.(pngHs).and.tHe.Future.–..papua.new.guInea.HydrograpHIC.servICe,.an.ant.wItH.tHe.gIants..................................... 93
J. Kaunda, Papua New Guinea
eConomIC.BeneFIt.oF.HydrograpHy:.land.reClamatIon.In.Bayelsa.state.–..a.Case.study.oF.saIpem.Camp.............................................................................................................. 98
Angela Kesiena Etuonovbe, Nigeria
restruCturIng.oF.a.natIonal.HydrograpHIC.servICe.–..CroatIan–norwegIan.HydrograpHIC.InFormatIon.proJeCt.(Crono.HIp)......................... 108
Egil Aarstad, Norway
marIne.geospatIal.soFtware:.generatIng.eConomIC.BeneFIts..From.HydrograpHIC.data.and.CalCulatIon.oF.marItIme.BoundarIes.............................. 114
Serge Levesque and Alexis Cardenas, Canada
tHe.eConomIC.ImpaCt.oF.approprIate.eduCatIon.In.HydrograpHy.................................... 123David DODD, Canada, Gordon Johnston, United Kingdom and Andrew Hoggarth, Canada
new.developments.For.tHe.proFessIonal.eduCatIon..In.HydrograpHy.at.HaFenCIty.unIversIty.HamBurg.(HCu)..................................................... 130
Peter Andree, Volker Böder, Peter Bruns, Delf Egge and Harald Sternberg, Germany

4
ForewordHydrography involves the surveying and mapping of rivers, lakes and oceans which gives us information about what the seafloor and movement of water above that sea-floor looks like. Hydrographic information is typically published in the form of nautical charts and sailing directions both in hardcopy and digital form. These nautical publi-cations are critical for providing mariners with the information they need to navigate ships safely and efficiently. Used in conjunction with meteorological information, nau-tical publications provide a basis for decisions on where and when a ship can be taken. High resolution hydrographic information in the form of seabed imagery provides a basis for engineering decisions on matters such as where to locate a sub-sea pipeline or communications cable.
Much like towns and cities which have grown because of their close proximity to rail-roads, superhighways and airports, access to navigable waters has provided the earliest cornerstone for discovery and economic development the world over. But what makes waters navigable? Fundamentally it is knowledge of water depth, hazards, tides and currents that enables navigation. Hydrographic information is of course the basis for this knowledge however it may be communicated. What makes waters navigable also makes waters safe and thus ensures the preservation of Safety Of Life at sea (SOLAS), the “sea room” to run out a storm or to find an alternate ice free course to steer are all supported by sound hydrographic information.
Bringing goods to and from market by sea and access to fisheries, sources of energy and other natural resources at sea depends on sound hydrographic information. When “just-in-time” service is not so critical, the economic efficiencies and reduced carbon footprint associated with marine transportation can outweigh all other modes of trans-portation. Frontier exploration and development, harvesting and extraction, transpor-tation, national sovereignty and defence, all constructs supporting economic devel-opment are enabled by hydrographic information. Access to and an understanding of land, including submerged lands, is essential to claiming, developing and realising economic sustainability. Surveyors have always played a role in supporting land tenure and development and thus provide an essential connection between surveys, map-ping (charting) and the economy.
The International Federation of Surveyors (FIG), through the efforts of the Commis-sion 4 workgroup 4.4 on Capacity Building and the Economic Benefits of Hydrography, has sought to bring awareness and promote the role of hydrography as an essential investment in economic development. This publication provides a snapshot of the workgroup’s efforts from various conferences and symposia to stimulate thought and exchange ideas in this regard.
I would like to thank our working group chair, Mr. Gordon Johnston, the authors who have contributed to this working group through various FIG Working Weeks and Re-gional Meetings and those authors whose work has been selected for this publication.
andrew.leyzack,.C.l.s..Chair.of.FIg.Commission.4,.2007–2010

5
IntroduCtIonThis publication aims to fulfil the objective of FIG Commission 4’s Working Group 4.4, to develop an awareness of hydrographic surveying and raise its profile in terms of how it can benefit society, cultures and developing states. In the process of developing the project, the Work Group identified a general lack of information and research to support the case for Hydrography across different uses, businesses and interests. Ad-ditionally, the FIG Costa Rica Declaration on Pro-Poor Coastal Zone Management (FIG Publication no. 43, 2008) has developed the interest and the importance of the coastal zone and its associated marine areas.
Consequently Work Group 4.4 has developed this document as a compilation of pa-pers, case studies and supporting articles to illustrate the tangible benefits of hydrog-raphy and the potential economic benefits that may be derived from developing and maintaining an appropriate hydrographic capacity.
This publication covers three different areas concerning the provision of Hydrographic survey capability.
The first 3 papers relate to institutional and national Hydrographic services and how these can generate a basis for developing and generating good economic conditions. The papers outline the inherent value of Hydrographic surveys and illustrate the con-text of Hydrography in terms of potential stakeholder benefits and how Hydrographic information can have a positive influence.
The second series of articles provides a number of case studies from around the globe that serve to illustrate how Hydrography has been able to provide a basis for generat-ing economic growth and benefits.
The final section of three papers concentrates on the development of the personnel to establish a sustainable Hydrographic capacity. The papers provide example experi-ences of achieving recognition at the International Standard level and combining with industry to create cost efficient and effective training solutions in the work place.
Background to the Working Group As part of its 2007–2010 workplan, Commission 4 created Working Group 4.4 further to the XXIII FIG Congress in 2006 as it was identified that there is a real lack of up-to-date material on the applications and uses of Hydrographic data and products. In particular, information on how these products can support the development of economic growth was missing and the Working Group sought to increase the profile of Hydrographic Surveying at a strategic level. Since its inception, the Working group has produced a number of cutting edge articles, presentations and papers to further the subject and to raise awareness. Technical sessions at the FIG working weeks, regional conferences and congress meetings have generated interest, debate and further knowledge culmi-nating in this publication. The following table outlines various meetings and technical sessions whereby over 20 papers and articles have been generated to provide a rich source of information on capacity building and the economic benefits of hydrography:

6
1 Economic Impact of Hydro-graphic Surveys
Connon B. D., UNITED STATES OF AMERICA, Nairn R., AUSTRALIA
TS 8I – Economic Benefits of Hydrography - Facing the Challenges – Building the Capac-ity XXIV FIG Congress Sydney, Australia, April, 2010
2 The Economic Benefits of Hydrography and Ocean Mapping
Johnston G., Venture Geomatics Limited, UNITED KINGDOM
TS-21 Economic Benefits of Hydrography
Coastal Areas and Land Administration – Building the Capacity, 6th FIG Regional Confer-ence San Jose, Costa Rica, November 12-14, 2007
3 The Value of Hydrographic Information and its Influ-ence
Gorziglia H., IHB MO-NACO
TS-21 Economic Benefits of Hydrography
Coastal Areas and Land Administration – Building the Capacity 6th FIG Regional Confer-ence San Jose, Costa Rica, November 12-14, 2007
4 The Cost-benefit of Charting Cameroon Waters
Mbeau Ache C., CAM-EROON and Abbott V., UNITED KINGDOM
TS 6E – Economic Benefits of Hydrography
7th FIG Regional Conference Spatial Data Serv-ing People: Land Governance and the Environ-ment – Building the Capacity Hanoi, Vietnam, 19-22 October 2009
5 Methods to Assess the Financial Value of the Sea Parcel and the Economic of the Coastal and Marine Area within a Marine Cadastre Framework
Tamtomo J. P., INDO-NESIA
TS 11 – Coastal Areas: Administering and Planning Marine Spaces - Shaping the Change XXIII FIG Congress Munich, Germany, October 8-13, 2006
6 Assessment and Future Pros-pects for Hydrography in Western and Central Africa; Maritime Safety and Coastal Global Development
Baggio D., FRANCE TS 20 – Hydrography 1/14
Promoting Land Administration and Good Governance 5th FIG Regional Conference Ac-cra, Ghana, March 8-11, 2006
7 The Economic Benefits of Hydrography in the Cana-dian Arctic – A Case Study
Leyzack, A. CANADA TS 6E – Economic Benefits of Hydrography
7th FIG Regional Conference Spatial Data Serv-ing People: Land Governance and the Environ-ment – Building the Capacity Hanoi, Vietnam, 19-22 October 2009
8 Why a National Hydrograph-ic Service?
Gorziglia H., IHB MO-NACO. Presented by Johnston G., UNITED KINGDOM
TS 6E – Economic Benefits of Hydrography
7th FIG Regional Conference Spatial Data Serv-ing People: Land Governance and the Environ-ment – Building the Capacity Hanoi, Vietnam, 19-22 October 2009
FIg.meeting Host.venue technical.session no..of.papersGeneral Assembly & Regional Meeting Hong Kong TS 8F 46th Regional Meeting San Jose, Costa Rica TS 21 3Working Week Stockholm, Sweden TS 3F 7Working meeting Eilat, Israel TS 5F 37th Regional Meeting Hanoi, Vietnam TS 6E 5XXXIth General Assembly Sydney, Australia TS 8I 4
This report includes a selection of work to underscore just how Hydrography can gen-erate benefits for the wider community. The following table lists the articles, papers and authors who have contributed to this Working Group publication:
Table 2: Presentations on Capacity Building and the Economic Benefits of Hydrography.
Table 1: FIG Meetings.

7
9 Papua New Guinea Hydro-graphic Service and the Future
Kuanda, J. PAPUA NEW GUINEA
TS 8I. – Economic Benefits of Hydrography - Facing the Challenges – Building the Capac-ity XXIV FIG Congress Sydney, Australia, April, 2010
10 Economic Benefit of Hydrog-raphy: Land reclamation in Bayelsa State: A Case Study
Etuonovbe, A., NI-GERIA
TS 8F – Economic Benefits of Hydrography
Strategic Integration of Surveying Services FIG Working Week 2007 Hong Kong SAR, China, 13-17 May 2007
11 Restructuring of a National Hydrographic Service
E. AARSTAD, Norway TS 6E – Economic Benefits of Hydrography
7th FIG Regional Conference Spatial Data Serv-ing People: Land Governance and the Environ-ment – Building the Capacity Hanoi, Vietnam, 19-22 October 2009
12 Marine Geospatial Software: Generating Economic Bene-fits from Hydrographic Data and Calculation of Maritime Boundaries
Levesque, S. and Cardenas, A , CANADA
TS-21 Economic Benefits of Hydrography
Coastal Areas and Land Administration – Building the Capacity 6th FIG Regional Confer-ence San Jose, Costa Rica, November 12-14, 2007TS 7F – Hydrographic Capacity Building
13 The Economic Impact of Appropriate Education in Hydrography
Dodd D,, CANADA Johnston G., UNITED KINGDOM and Hog-garth A., CANADA
TS 6E – Economic Benefits of Hydrography
th FIG Regional Conference Spatial Data Serv-ing People: Land Governance and the Environ-ment – Building the Capacity Hanoi, Vietnam, 19-22 October 2009TS 5. – Education and Training Shaping the Change XXIII
14 New Developments for the Professional Education in Hydrography at HafenCity University Hamburg (HCU)
Andree P., BÖder V., Bruns P., Egge D., Sternberg H., GER-MANY
TS 5 - Education and Training [6TS05]
XXIII FIG Congress Munich, Germany, October 8-13, 2006
The papers listed in table 2 present case studies and examples of the economic benefits of Hydrography. These can be found in the FIG Surveyor’s Reference Library (http://www.fig.net/srl/), and may be accessed directly via the hyperlink provided with the outline for each in technical summary section of this document.
ConclusionThis has proven to be a very interesting initiative as the links between Hydrographic services and products would appear to have a logical sequence and relationship step. However the direct nature of the benefits has not been so easily described. What has become apparent is the wide range of locations and countries where the practice of Hydrography is having positive benefits.
In developing this document, Working Group 4.4 has gathered together a group of articles and papers to illustrate the potential benefits of hydrographic surveys and the products they create.
Early in the 1990’s both Canada and Australia undertook reviews of the contribution made by their Hydrographic Services. They offered a very positive situation in terms of the benefits at a national level; however these studies failed to put precise monetary figures on the value gained from a specific level of investment. More recent papers and articles promoting Hydrography, as well as the UN conventions mandating hydro-graphic services, have also provided general support but still some links are missing in the value chain from investment of resources to the benefits to the wide array of
8
potential stakeholders. This document aims to rectify this shortcoming and provides a useful resource that connects Hydrographic services with their ultimate benefits both in direct and indirect terms.
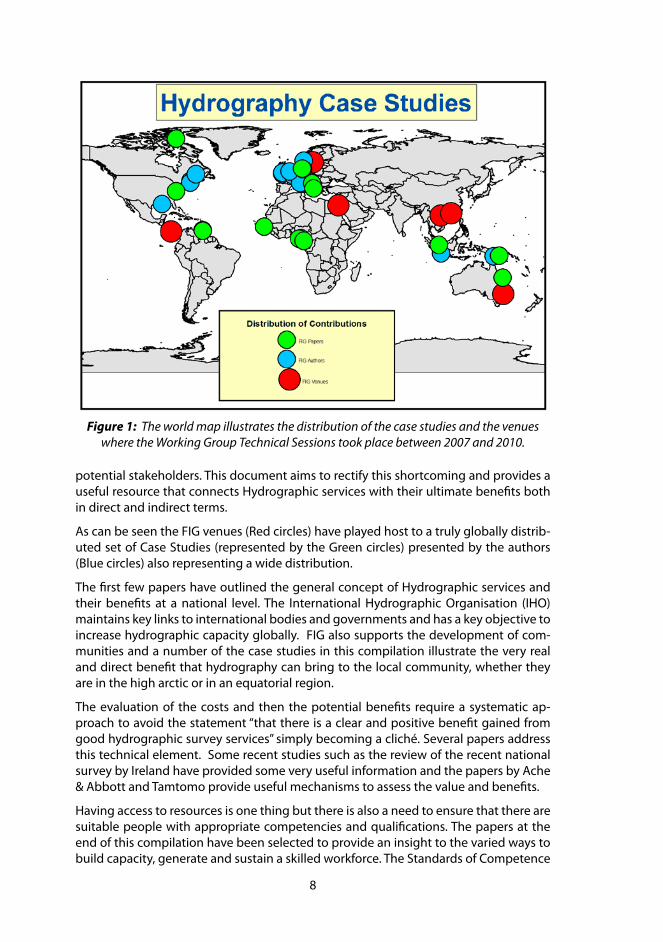
As can be seen the FIG venues (Red circles) have played host to a truly globally distrib-uted set of Case Studies (represented by the Green circles) presented by the authors (Blue circles) also representing a wide distribution.
The first few papers have outlined the general concept of Hydrographic services and their benefits at a national level. The International Hydrographic Organisation (IHO) maintains key links to international bodies and governments and has a key objective to increase hydrographic capacity globally. FIG also supports the development of com-munities and a number of the case studies in this compilation illustrate the very real and direct benefit that hydrography can bring to the local community, whether they are in the high arctic or in an equatorial region.
The evaluation of the costs and then the potential benefits require a systematic ap-proach to avoid the statement “that there is a clear and positive benefit gained from good hydrographic survey services” simply becoming a cliché. Several papers address this technical element. Some recent studies such as the review of the recent national survey by Ireland have provided some very useful information and the papers by Ache & Abbott and Tamtomo provide useful mechanisms to assess the value and benefits.
Having access to resources is one thing but there is also a need to ensure that there are suitable people with appropriate competencies and qualifications. The papers at the end of this compilation have been selected to provide an insight to the varied ways to build capacity, generate and sustain a skilled workforce. The Standards of Competence
Figure 1: The world map illustrates the distribution of the case studies and the venues where the Working Group Technical Sessions took place between 2007 and 2010.

9
for Hydrographic Surveyors and Nautical Cartographers, as maintained by the FIG/IHO/ICA International Board, as well as the growing links between educational establish-ments, training facilities and industry are of great benefit to Hydrographic Practice. Consequently investment in Hydrographic training will benefit Hydrography which in turn will benefit the wider community.
As this compilation highlights only a selection of the papers, presentations and articles generated over the last 4 years, the remainder can be found through the FIG website either in the Surveyors Reference Library section or in the Proceedings of the various meetings and events. The Economic Benefits of Hydrography have been described and clarified throughout the term of this working group and it is apparent that the benefits from Hydrography are huge compared to the investment where returns have been as-sessed as generally exceeding a ratio of 5 to 1 over costs. However it should be recog-nized that this figure was arrived at by considering all the stakeholders available to use and adopt the services and products.
So for prospective government departments, expanding hydrographic offices, services and other potential stakeholders there are benefits that outweigh the investments and this must surely be of interest, certainly good news for the profession, the end users of nautical publications and other Hydrographic products , maritime communities and those who dwell within the world’s coastal zones.
gordon.Johnston.Chair.FIg.working.group.4.4,.2007–2010

10
eConomIC.ImpaCt.oF.HydrograpHIC.surveysBrian.douglas.Connon,.united.states.of.america,.rod.nairn,.australia.
abstract..This paper discusses the inherent value of hydrographic services and bathy-metric surveys beyond the obvious benefit of improved nautical charts. These direct and indirect benefits are not traditionally recognized for their economic value to coast-al States as they are difficult to quantify. Also their actual value is somewhat depend-ent on the specific economic, recreational, and defence activities of each coastal State. Convincing governments to invest in hydrography and bathymetry can be difficult. However even without quantitative analysis, there is strong logical and qualitative ar-gument that recognizes the critical value of hydrographic services as an essential ele-ment of national infrastructure and a critical enabler of other maritime activities. Thus, providing government with information detailing the second and third order benefits of bathymetric surveys and hydrographic services may further influence investment in these essential enablers of economic growth.
key.words: Hydrography, economics, bathymetry, coastal zone management, hazard mitigation.
1. IntroduCtIon.
The economic impacts of hydrography and bathymetry on safety of navigation have been studied and reported for a number of years. However it is important to rec-ognize that many aspects of hydrographic services fall into the category of ‘public goods’. A public good or service is that which is in the public interest but would not be supplied at optimal levels by market forces alone. There are three characteristics of a public good; non-rivalness in consumption, non-excludability and impossibil-ity of rejection. The nautical chart is a noteworthy example of a public good. An individual using a chart does not impair another individual’s ability to use a chart to navigate safely, hence satisfying non-rivalness in consumption. It displays non-excludability as it is impossible to prevent any member of the public from using the information the hydrographic service provides. Also, an individual cannot abstain from the benefits of the hydrographic service even if he or she wished to (impossibil-ity of rejection). (Coochey, 1992)
Several studies have estimated that the return on investment from having a national hydrographic program is on the order of 1:10. (IHO, 2004) This certainly should be an incentive for coastal nations to invest in hydrographic services and to have properly charted waters that can support an ever growing need for maritime commerce. Im-proved charts may allow for faster transits of ships with deeper draughts, resulting in a greater amount of goods moving through navigational choke points and ports. Per-haps just as important is the need for hydrography and bathymetry to support the development of national and local strategies to preserve and protect ocean resources. Coastal zone management, hazard response and mitigation, national defence and mar-itime boundary delimitation are but a few examples of activities that require knowl-edge of the seafloor. (IHO, 2004) Hydrography and bathymetry provide the foundation
11
layer on which many other programs can be built to provide essential, nationally sig-nificant information to government authorities.
Whilst the provision of hydrographic services can thus be seen as a fundamental ena-bler and an important boost to many aspects of economic development, it is also ger-mane that large scale hydrographic surveys are extremely expensive. Whereas land mapping can be effectively conducted over large areas using satellite remote sensing techniques (which is relatively inexpensive), hydrographic surveying can not.
2. areas.oF.ImpaCt.
The Canadian Hydrographic Service (CHS) conducted a study of the cost benefits of having a hydrographic service. (Brinkman and Caverley, 1992) While specific to Cana-da, the general lessons of this study apply to any maritime nation. This study looked at six areas of impact: commercial shipping, commercial fishing, recreational boating, national defence, Arctic development, and environment. For this discussion, similar themes will be built upon to capture the direct and indirect benefits of hydrography.
2.1 Marine Transportation and Safety of Navigation A recent study by the U.S. International Trade Commission cites, for numerous countries, one of the main barriers to economic growth is the lack of adequate port facilities and infrastructure. (U.S. International Trade Commission, 2005) Improved ports will require dredging, new piers, enhanced terminal functionality and, of course, up-to-date nautical charts. Maritime transport remains the backbone of international trade with over 80 per cent of world merchandise trade by volume being carried by sea. During the past three decades, the annual average growth rate of world seaborne trade is estimated at 3.1 per cent. At this rate, global seaborne trade would be expected to increase by 44 per cent in 2020 and double by 2031, potentially reaching 11.5 billion tons and 16.04 billion tons, respectively. (UNCTAD, 2008) In the United States, more than 78 percent of overseas trade by volume and 43.5 percent by value comes and goes by ship, including nine million of barrels of imported oil daily. (Department of Transportation, 2007). Nearly 80% of U.S. import and export freight is transported through seaports (RITA, 2009); more than 80% of the nation’s economy is supported in coastal states; and more than 50% of the popula-tion and U.S. economic activity are found in coastal management counties. (NOEP, 2009) In Australia these figures are even more empowering with a staggering 99.9% of trade by weight and 78% by value being carried by sea. (BTRE, 2007)
Commercial shipping relies on current nautical charts for one important reason, time is money. Good charts provide the most direct routes between ports, reduce the number of pilots required, decrease the number of groundings (and reduce insurance rates), and allow deeper draft vessels (i.e. more cargo) to be used. The National Oceanograph-ic and Atmospheric Administration (NOAA) reported that one additional foot of draft may account for between $36,000 and $288,000 of increased profit per transit into Tampa, FL. (NOAA, 2000) This is also demonstrated in a study completed by Thomp-son Clarke Shipping (AMSA, 2007) which examined Torres Strait shipping trends and investigated the economic impact of increasing the maximum draught of the Prince Of Wales Channel, currently 12.2 metres, by 30 cm and 60 cm. In the financial year of 2005-2006, 602 vessels with a draught in excess of 11.0m transited via the Torres Strait and

12
of these, 161 were loaded to exactly the maximum draught. If the maximum draught can be increased to 12.5m, the increase in cargo carried would amount to AUD 10.3 million. If extended to 12.8m, it would increase again to AUD13.3 million. Given this potential for substantial economic benefit, re-surveying the Prince of Wales Channel to a very high degree of confidence has been allocated high priority for the Australian Hydrographic Service.
In areas with inadequate charting, shipping companies deploy a fleet that is older, less efficient and capable, and more likely to be involved in a maritime accident due to the age of the equipment and calibre of the crew. (Brinkman and Caverley, 1992) The eco-nomic benefits and savings associated with preventing marine accidents through more adequate survey are significant. The cost of an oil spill can be measured by the revenue lost through the loss of cargo, the vessel and days at sail, as well as the cost of cleanup. For example, the Exxon Valdez oil spill of 1989 cost Exxon USD 2.1 billion for clean up, USD1.1 billion for settlements and in 1994, a US jury found Exxon negligent and fined them USD 5 billion for the incident. The destruction of wildlife, habitat and future re-sources are more difficult to assign dollar value to however the estimated price that the residents affected were willing to give their pristine environment for one degraded by the spill was approximately USD 7.9 billion.
Additionally, most marine accidents, (groundings in particular) are the result of opera-tor error. Approximately 25% of all serious ship accidents occur in coastal waters or dur-ing harbour approach. Of these, greater than 75% result from insufficient information, mistaken interpretation or assessment, and lack of timely preventative action. (Hecht, et al, 2002) The introduction and implementation of Electronic Chart Display and Infor-mation Systems (ECDIS and Electronic Navigation Charts (ENC into the maritime indus-try has the potential to significantly reduce the margin for human error during pilotage navigation scenarios such as that which afflicted the Exxon Valdez and therefore reduce the monetary costs to companies and environmental cost to the global community.
In Africa’s Gulf of Guinea, commercial shipping is the primary method of trade for coast-al nations, whereas interior landlocked countries rely on train and truck connections to seaports. Increased production of oil and gas requires substantial infrastructure to support the export of petroleum products, as well as the import of commercial goods into the region. U.S. imports from Africa increased 40.2% in 2005. Oil-producing coun-tries showed the greatest increases; Nigeria up 48.9%, Angola 87.7%, Gabon 14.1%, and Congo 89.5%. U.S. exports to West Africa are dominated by heavy machinery & equip-ment, oilseeds & grains, and industrial chemicals; products that must be transported by maritime commerce. (US Dept. of Commerce, 2006)
Three ports in the Gulf of Guinea rank in the top ten African container ports: Abidjan, Lagos, and Tema. As container traffic flow continues to rise, not only from the United States, but also from Europe and Asia, new shipping companies expand into the region. For example, the Gold Star Line from China has established a direct trade route into West Africa from Chennai, India. (UNCTAD, 2006) On average, the current charts for the region are based on surveys that are over 25 years old and were not conducted with the benefit of GPS and modern echosounders. The US Navy conducted a cooperative hydrographic survey in Tema, Ghana and observed discrepancies of 35-125 m in shore-line (horizontal) features and .5m -5.8m in depths when compared to available charts. It can be expected that similar discrepancies exist in the many areas of the world uti-lizing charts based on dated surveys or with insufficient data. Unless there is further

13
investment in improving the standard of surveys and charting it is likely that increasing shipping volumes will yield a similar increase in navigational incidents.
2.2 Marine Resources Marine resources can be broken down into two categories, living and mineral, which cover the majority of renewable and non-renewable resources found in the ocean. Ac-tivities associated with marine resources include: commercial and recreational fishing, aquaculture, sand and gravel mining, ocean dumping, oil, gas, and mineral exploration and extraction, channel dredging, dredge material disposal, pipeline/cable installation, and pollution. Control/regulation of these activities is critical to the overall success of a coastal region, either as a protected area or as an economically viable fishing ground.
2.2.1. living.resources.As marine living resources, such as those associated with fishing and aquaculture, are so vital to the economies of coastal nations, the information that hydrography can pro-vide to ensure efficient use of these resources is equally as vital. In 2006, commercial and recreational fisheries supported over 2 million jobs and contributed over $73 bil-lion to the United States gross national product. (NMFS, 2009) Commercial fisherman benefit from accurate charting through safe navigation, knowledge of preferred fish habitats, locating wrecks and other hazards that can interfere with nets, and improving the speed and efficiency of onload/offload operations. Bathymetry is a critical com-ponent of the characterization and delineation of fish habitats, as well as, the proper location and extent of aquaculture areas.
The United States has undertaken significant efforts to characterize and describe sea-floor and open ocean habitats and associated fish assemblages on spatial scales rel-evant to fishery management and habitat protection. In order to manage these re-sources they must be mapped. Substantial hydrographic effort has been expended to delineate and map important habitats including coastal shorelines, estuaries, salt marsh wetlands, anadromous streams, riparian zones, submerged aquatic vegetation (e.g. eelgrass), deepwater corals, pinnacles, seamounts, and fishing grounds on the Continental Shelf and Slope. (NMFS, 2009) Coastal, estuarine, and marsh waters serve as the nursery for many species of fish that live in the deep ocean as adults. Fresh water streams and rivers also serve as vital pathways for ocean fish, such as salmon, which travel upstream to spawn. By carefully mapping the features mentioned above, it is possible to effectively manage, protect, and preserve marine living resources through mechanisms like marine sanctuaries, protected areas, and reserves. Proper planning of aquaculture projects based on modelling of the ocean environment can not only maximize production, but also help developers avoid areas that will undoubtedly fail to meet financial expectations.
2.2.2. mineral.resources.Mineral resources include sand, gravel, oil, and other economically important resources found on, or below, the ocean bottom. Hydrography, by definition, characterizes the nature of the seafloor and thereby is a direct contributor to the discovery of areas of mineral resources available for exploitation. Sidescan sonars, or acoustic backscatter from multi-beam echosounders, are capable of bottom provincing—a technique that

14
allows hydrographers to determine the type and extent of different bottom character-istics. This incidental activity can significantly reduce the cost of exploration by private businesses whilst at the same time continuing to improve navigation safety. Bathymet-ric information is also critical to selection of routes for submarine pipelines and cables.
Whilst exploration companies may focus their data collection on sensors such as sub-bottom profilers and magnetometers to gain detailed information of what is lying on and below the seabed, the concurrent collection of standard hydrographic informa-tion and these additional data is cost efficient means of satisfying the dual purposes of improved safety of navigation and marine resource development. Clearly, the national interest is best served when the base hydrographic information collected by oil and gas companies is added to the national archive.
2.3 Environmental Concerns Hydrographic surveys provide the base layer for environmental monitoring, impact modelling and consequence management. Physical environmental characteristics, such as bathymetry, are required to support numerical modelling efforts in order to provide accurate representations of the impact from a variety of man-made and natu-rally occurring events. If no controls on the use of the environment are in place, nations developing their coasts may be vulnerable to degradation as industrialization and eco-nomic expansion occurs.
2.3.1. Coastal.Zone.management.As more of the world’s population is concentrated around our coasts, the focus on coastal zone management must continue to grow if we are to maximize utilization without damaging the environment. In the United States, population density along coasts is five times greater than that of the rest of the nation... (OCRM, 2007) Interna-tionally, government authorities and resource managers struggle to find the balance in allocation of valuable water space to a diversity of interests including recreational and commercial fishing, diving, pleasure yachting, professional navigation, beach access, tourism activities, and marine farming. Archaeological studies of areas with historic or cultural value require precise mapping of the ocean bottom. Bathymetry also provides the necessary information for underwater construction and development. Pipelines, telecommunication cables, and offshore drilling platforms cannot be arbitrarily placed; bathymetry must be used to ensure their locations are safe from potential hazards.
Without proper governance over coastal construction and development, significant negative impacts to property and people may occur. For example, groins, jetties or revetments built along a coast to create a clear channel or safe harbour for fishing boats may result in the erosion of sand downdrift of the structure area due to blocking of sediment transport by longshore currents and subsequent accretion of sand in other areas. Proper modelling of the environmental consequences of proposed man-made features along a coast must be conducted to avoid potentially significant economic im-pacts due to loss of shoreline and beaches. Hydrographic survey provides information that is essential to enable proper planning to ensure that coastal zones are effectively and sustainably managed.

15
2.3.2. offshore.aquaculture.Offshore aquaculture, although in its infancy, is an exciting development into sustain-able fish farming. Aquaculture, probably the fastest growing food-producing sector, now accounts for almost 50 percent of the world’s food fish and is perceived as hav-ing the greatest potential to meet the growing demand for aquatic food. Given the projected population growth over the next two decades, it is estimated that at least an additional 40 million tonnes of aquatic food will be required by 2030 to maintain the current per capita consumption. (FAO, 2006) One of the major barriers to development is finding suitable sites in coastal areas, where aquaculture must compete with many other coastal uses. (NOAA Aquaculture Program, 2006) The selection of an Aquaculture site is a process that not only involves market forces but also governmental designation of sites. The planning of offshore aquaculture zones takes into account not only hydro-logical and biographical factors, but also topographical and hydrographical factors. Ac-curate hydrographic information can provide assistance in the selection of appropriate aquaculture sites to enhance a nation’s ability to plan efficiently for sustainable harvest into the future
2.3.3. Climate.Change,.natural.disasters,.pollution,.and.Hazard.mitigation.Many natural and man-made occurrences can have a significant impact on the ecol-ogy and biology of a coastal region. Rising atmospheric and ocean temperatures can have adverse affects on marine vegetation and organisms which, in turn, can impact the economy of a coastal nation. By surveying habitat boundaries, changes in expanse or volume can be easily monitored and immediate actions taken to mitigate negative trends, where possible. Increased erosion can be expected with rising seas and more energetic storms, which will decrease water clarity and quality, as well as increase sedi-mentation and silting.
The results of a rise in sea level along a typical beach profile are twofold: first, a direct landward encroachment takes place (shoreline recession) followed by a beach face re-adjustment by waves to a flatter slope (erosion above the waterline and some accretion offshore). (CHL-ERDC, 2007) It is possible to predict the extent of a sea-level rise and take early action to mitigate negative impacts on economic activities in the coastal zone.
Increased oil and gas production/export and increases in commercial shipping increas-es the possibility of a major environmental disaster in coastal regions. Coastal devel-opment can also heighten chances of introduction of contaminants into the marine environment. For example, placing a pipeline over rock outcrops or coral heads can place stress on the pipeline and possibly result in a break and release of the pipeline’s contents. Pollution from ports, agricultural run-off, and other sources is becoming a significant issue for maritime nations. Hydrographic survey is imperative to environ-mental monitoring through the establishment of baseline conditions and will thereby assist in the development of mitigation plans in the event of a maritime accident.
2.4 Maritime Boundaries The United Nations Convention on the Law of the Sea (UNCLOS) has established the basic framework for boundary definitions of territorial seas, the exclusive economic zone (EEZ), and the continental shelf. The delineation of these zones is increasingly im-

16
portant in determining the rights and responsibilities of coastal states. One of the most important economic impacts of UNCLOS is the ability of a coastal nation to extend their claims beyond the 200 mile EEZ based on the bathymetry, change in slope of the continental shelf and geology of the seafloor. National hydrographic offices are the recognized, official provider of this information. (IHO, 2004) As noted above, marine resources can provide viable economic activity for coastal nations and any opportu-nity to increase area available for exploitation should be seriously considered. In 1998 Australia entered into a program of detailed offshore surveying to map the limits of the extended continental shelf. After submission in November 2004, Australia’s extended continental shelf claim was approved by the United Nations in 2008 and resulted in the recognition of an additional 2.5 million square kilometres of continental shelf. Clearly, the additional seabed resources in the region justify the cost of surveying and charting to support the claim.
Hydrographic surveys are also the source of the fundamental data used to provide the baseline information for determining maritime boundaries between countries. For example, if two countries have agreed that their maritime boundary will follow the thalweg of a channel, bathymetry is the only method to accurately determine where the thalweg is located. In other cases where maritime boundaries are in dispute the de-termination by courts will invariably rely substantially on the positions, and delineation of offshore islands, reefs and outcrops determined by detailed hydrographic surveys.
2.5 Law Enforcement and Defence Coastal nations generally desire to organically monitor maritime activities and conduct law enforcement and defence operations within their territorial waters and EEZ. Small navies and coast guards with limited assets are often under-resourced to deal with the host of threats found on today’s oceans. People, drug and weapons smuggling, piracy, illegal fishing, and proliferation of terrorism provide significant threats to the economies of coastal nations, which must protect their commerce, marine resources and residents.
The economic value of the knowledge that a hydrographic service provides cannot be underestimated in terms of its ability to enable ‘Maritime Power’. Maritime power is described by Bateman and Bergin as a countries ability to use the sea to promote it national interests – economic, political, strategic and environmental. (Bateman and Bergin, 2009) It in turn ensures that “good order at sea” is maintained, to permit the free flow of seaborne trade. The free flow of trade not only improves economic growth by opening the most efficient routes and thereby cutting transportation costs, but also minimises other economic losses. These monetary losses can be incurred through pi-racy, maritime terrorism, the illegal trade of people, arms or drugs and the unregulated pollution of the marine environment. The strategic benefit that hydrographic surveys provide is not only immense but immeasurable. Accurate charts provide increased freedom of manoeuvre for the law enforcement agencies of these countries - a tactical advantage when dealing with the threats discussed here. In addition, hydrographic surveys can provide critical information for mine warfare applications. Locating mines, determining mine burial rates, modelling mine drift, and choosing mine avoidance routes are all enabled through high resolution bathymetry and acoustic imagery that is gathered during hydrographic surveys.

17
3. opportunItIes.For.assIstanCe.to.developIng.natIons..
As can be seen for the above discussion, hydrographic surveys of national waters and in particular the provision of comprehensive hydrographic services provide substantial intrinsic value to a nation’s economy and the opportunity to participate more actively in the global economy. The non-intrusive, environmentally supportive and non-con-troversial nature of hydrography also makes it an ideal avenue for economic assistance to developing nations. Below, an example is presented for a specific region to dem-onstrate how developing states might benefit from the investment in hydrographic services.
3.1 Pacific Island Context Of geopolitical interest to the US and Australia are the Pacific Island countries which typically have small economies, are remote in geographic and political position and could be characterized as developing. Often these counties are unable to take hydro-graphic responsibility for themselves, and rely on the assistance of regional powers with larger hydrographic services. This section aims to describe how the provision of hydrographic services in developing island states can contribute to sustainable eco-nomic development of island nations by opening up these often poorly surveyed and therefore inaccessible areas to trade and tourism. This can be counted as a direct injec-tion into the local economy of these counties, and should be considered as a key target area for overseas aid.
3.1.1. Investment.in.Infrastructure.Shipping to Pacific island states is currently very expensive due to long distances be-tween ports, low trade volumes, imbalanced trade (exports far outweigh imports) and poor facilities suffering from inadequate investment and maintenance. Many of these aspects can be addressed by improving hydrographic services in the region. For ex-ample, many inter-island routes contain archipelagic routes that are unattractive and dangerous to the bulk carrier. More accurate surveys of these areas could open shorter, safer and more efficient sea lanes which could increase trade to the region. Once acces-sibility is improved, industry will be more willing to improve port facilities in the region, which in turn, will require regular surveys in order to maintain its functionality. (Asian Development Bank, 2007) Hydrographic surveys therefore contribute to building much needed infrastructure in the region, eventually enabling Pacific island states to take advantage of economic opportunities and better participate in the global economy.
3.1.3. Contribution.of.tourismIn a study conducted by Carnival Australia, a multinational in charge of recreational cruise providers such as P&O and Princess cruises, it was recognised that currently, the cruise ship industry cannot meet the demand in the sector. (Access Economics, 2008) The larger the demand for cruise holidays, the larger the cruise ships required in order to satisfy demand and obtain economies of scale. However, the larger the cruise ship the larger the draught and the more restricted the access to certain ports. Pacific Island port visits make up a majority of destinations of Australian based cruise liners. The report indicates that new larger cruise ships are unable to access the ports they wish

18
due to inadequate hydrographic information, for example Yasawa and the Lau Group, Fiji. The report concludes that development of cruise tourism in the region is being seriously restricted by the low levels of marine infrastructure and there is potential for substantial growth. Clearly, there are untapped opportunities awaiting those island states that could provide adequate hydrographic information and port facilities. There are also the second order benefits of increased local employment as cruise companies prefer to recruit from the island nations, as well as enhanced incentives and opportuni-ties to showcase and preserve customs and culture.
4. ConClusIon.
Despite the comprehensive justifications offered above, when allocating funds to re-quirements, governments often give a low priority to hydrography. The reasons range from a lack of interest or a lack of understanding to the pragmatisms of political sur-vival. Investments in national infrastructure, in genuine public goods such as hydrog-raphy, just don’t attract the populist gratitude of a tax reduction or a welfare handout, neither do they satisfy the feel-good sentiment of an industry sector assistance pack-age. Hydrographic infrastructure provides benefits to the nation as a whole and not to any one lobby group in particular. Investing in hydrography saves lives by making navi-gation safer, it enables maritime activities that support national security and economic prosperity while contributing to protection of the environment. It is akin to investing in infrastructure and insurance, perhaps not very exciting but invariably a very sound investment!
This paper does not seek to argue that every coastal State should establish its own or-ganic hydrographic organization as the dollar and personal resource costs may exceed the capacity of many developing States. It does however; argue the high national value of hydrographic services and where such capability is beyond a nation’s own means, it recommends the provision of hydrographic support as a prime area for a coopera-tive bilateral arrangement or foreign aid support. It also emphasizes the criticality of national governments recognizing the value and importance of hydrographic informa-tion and putting in place arrangements that ensure any hydrographic information col-lected within that nation’s waters is contributed to the national hydrographic database.
Finally, this paper provides supplemental information that can be used to overcome at least one of the impediments to hydrographic investment referred to above, the deficiency in knowledge. It provides a comprehensive overview of the ‘public good’ benefits and intrinsic economic values of hydrography. This information may assist in imparting the importance of the requirement for hydrographic surveys among gov-ernment officials. In doing so it also provides arguments to support the provision of hydrographic infrastructure as a viable, effective and indeed attractive avenue of pro-viding external aid to developing coastal States.

19
reFerenCes.
Access Economics, Commercial In Confidence for Carnival Australia, The Economic Con-tribution of the Cruise Shipping Industry to Australia, 08 May 2008
Asian Development Bank, Oceanic Voyages: Aviation and Shipping in the Pacific, Pacific Studies Series, Philippines, 2007
Australian Maritime Safety Authority (AMSA), Implementation of an Under Keel Clear-ance System for the Torres Strait, March, 2007.
Bateman, S., and Bergin, A. Seachange: Advancing Australia’s Ocean Interests, Australian Strategic Policy Institute, Barton, ACT, March 2009
Brinkman, G. L., and S. L. Caverley. Benefit-Cost Assessment of the Canadian Hydrographic Service. Report prepared by Intercambio Limited for Canadian Hydrographic Survey, Ottawa. 1992
Bureau of Transport and Regional Economics [BTRE] 2007, Australian maritime trade: 2000–01 to 2004–05, Working Paper 69, BTRE, Canberra, ACT.
Coastal and Hydraulics Laboratory - Engineer Research and Development Center (CHLERDC) Beach Basics, Vicksburg, Mississippi. June 2007
Coochey. J, An Economic Analysis of the Benefit of the RAN Hydrographic Programme Aus-tralian Government Publishing Service, July 1992
Department of Transportation, Bureau of Transportation Statistics, 2007: National Transportation Statistics, Washington, DC, [502 pp.] ONLINE. Available: http://www.bts.gov/publications/national_transportation_statistics/pdf/entire.pdf
Food and Agriculture Organization (FAO) of the United Nations, Inland Water Resources and Aquaculture Service, Fishery Resources Division, FAO Fisheries Technical Paper 500, State of World Aquaculture 2006. Rome. 2006.
Hecht, H., Berking, B., Buttgenbacj, G.,Jonas, M., Alexander, L: The Electronic Chart, Func-tions, Potential and Limitations of a New Marine Navigation System, GITC, December 2002
International Hydrographic Organization: Miscellaneous Publication 2: National Mari-time Policies and Hydrographic Services. International Hydrographic Bureau. Monaco. 2004.
Minister for Resources and Energy: UN Confirms Australia’s Rights Over Extra 2.5 Million Square Kilometres of Seabed. Press Release. ONLINE. Available: http://minister.ret.gov.au/.
National Marine Fisheries Service (NMFS). Our living oceans: Habitat. Status of the habi-tat of U.S. living marine resources. Policymakers’ summary, 1st edition. U.S. Dep. Commer., NOAA Tech. Memo. NMFS-F/SPO-83, 32 p. May 2009. ONLINE. Available: http://spo.nwr.noaa.gov/TM83.pdf.
National Oceanic and Atmospheric Administration (NOAA) Aquaculture Program,

20
Aquaculture in the United States. February 2009. ONLINE. Available: http://aquaculture.noaa.gov/us/welcome.html
National Oceanic and Atmospheric Administration (NOAA) Technical Report NOS CO-OPS 031, National Physical Oceanographic Real-Time Systems (PORTS
tm
) Management Re-port. Silver Spring, Md. 2000
National Ocean Economics Program (NOEP). State of the U.S. Ocean and Coastal Econo-mies 2009. ONLINE. Available: http://www.oceaneconomics.org/NationalReport/ [June 2009]
Office of Ocean and Coastal Resource Management, Strategic Plan 2007-2012. ONLINE. Available: http://coastalmanagement.noaa.gov/resources/docs/ocrm_strategicplan.pdf
Research and Innovative Technology Administration (RITA). 2009. Bureau of Trans-portation Statistics. Pocket Guide to Transportation. 2007. ONLINE. Available: http://www.bts.gov/publications/pocket_guide_to_transportation/2009/pdf/entire.pdf
United Nations, United Nations Convention on the Law of the Sea, Publication No. E97.V10, United Nations, New York. 1997
United Nations Conference on Trade and Development (UNCTAD), Review of Maritime Transport 2006. Geneva. ONLINE. Available http://www.unctad.org/en/docs/rmt2006_en.pdf
United Nations Conference on Trade and Development (UNCTAD), Review of Maritime Transport 2008. Geneva. ONLINE. Available: ttp://www.unctad.org/en/docs/rmt2008ch1_en.pdf
U.S. International Trade Commission, Export Opportunities and Barriers in African Growth and Opportunity Act Eligible Countries, October 2005
U.S. Dept of Commerce International Trade Administration, U.S.-African Trade Profile, March ‘06
BIograpHICal.notes.
CDR Connon currently serves as Expeditionary Warfare Program Manager for the Naval Meteorology and Oceanography Command and the Vice Chairman of the IHO’s Capac-ity Building Subcommittee. He holds a BS in Geography from the University of South Carolina, a MS in Meteorology and Physical Oceanography from the Naval Postgradu-ate School, and a MS in Hydrography from the University of Southern Mississippi. He is qualified as a Naval Hydrographer and a Surface Warfare Officer. His previous notable assignments include: Commanding Officer of the US Navy’s Fleet Survey Team and Staff Oceanographer for Carrier Strike Group Five.
CDRE Nairn is the Hydrographer of Australia and Director General of Navy Hydrogra-phy, Meteorology and Oceanography. His naval career includes 4 sea commands and commissioning commander of the world’s first Laser Airborne Depth Sounder. He holds tertiary qualifications in Strategic Studies, Surveying and Management and is

21
a graduate of the Australian Institute of Company Directors. He is a certified Level 1 Hydrographic Surveyor and currently chairs the Australasian Hydrographic Surveyors Certification Panel, the Ports Australia Port Surveyors Working Group, and the ICSM Per-manent Committee on Tides and Mean Sea Level.
ContaCts.
CDR Brian CONNON Naval Meteorology and Oceanography Command 1100 Balch Blvd Stennis Space Center, MS USA Tel. +011 228 688 5222 Fax + 011 228 688 5232 Email:[email protected].
CDRE Rod NAIRN Australian Hydrographic Office Locked Bag 8801 Wollongong NSW 2500 AUSTRALIA Email: [email protected].

22
tHe.eConomIC.BeneFIts.oF.HydrograpHy.and.oCean.mappInggordon.Johnston,.united.kingdom.
abstract..To generate discussion around the need and justification for the develop-ment and sustained use of hydrographic services to support and expand a national, regional or local economy, this paper sets out to examine the current status of hydrog-raphy in several areas in relation to a number of disciplines and user groups. The use and benefit form Hydrographic data and products for stakeholders are often promot-ed however there appear to be few direct and tangible outcomes rather than simply vague links and indirect consequences. This paper aims to offer a summary of some example assessments. For the increasingly competitive market place of the global economy, coupled with a consumer group of increasing knowledge and awareness of environmental issues the baseline and framework for many activities relies upon good quality, reliable and objective data sets. The paper offers some thoughts on how mod-ern Hydrographic data and products as well as the Hydrographic community could influence and aid in the strategic development of areas and regions by working with the various stake holders.
key.words: Hydrography, economics, bathymetry, ###capacity building, stakeholders
1. IntroduCtIon.
Over 90% of international trade is transported by sea. A fundamental requirement for the safe transportation of goods is adequate nautical charting. Yet despite this massive reliance upon sea transportation many areas and regions do not have adequate carto-graphic coverage.
In the 4 years of the FIG Commission 4 Working Group several regions have been re-viewed to assess their current status with respect to nautical charting and the potential Stakeholders who may benefit from good survey data and products.
2. .regIonal.status.
There are quite a number of important factors that may influence the status of Hydrog-raphy and Hydrographic services for a maritime state. For many Small Island Developing States there is a huge challenge in terms of the logistics and the areas requiring coverage, such that the financial burden would be enormous without some aid from developed states. These nations are often motivated by the need for safe transportation of goods and exports as well as the safety of life at sea; a perceived benefit in terms of keeping the shipment of goods safe. For other developing areas such as West Africa, the challenge is more the political will to focus on the sea and the value that the maritime coastal zone can contribute to a state’s wealth and prosperity. Many consider that the beneficiaries are only the local inhabitants who make their living from the fishing and tourism. This is a limited view which should be reconsidered. The IHO maintains a publication, C-55, on the IHO website that aims to detail and describe the current status of Hydrographic surveys for each maritime state (http://www.iho-ohi.net/iho_pubs/IHO_Download.htm).

23
For some regions, such as the Caribbean or the Far East, there is a growing demand for good Hydrographic surveys and coverage due to the interest of ocean cruise compa-nies that wish to visit more exclusive and unexplored islands and areas of our seas and coasts. These large commercial enterprises form a strong demand for up to date prod-ucts. Such regions are under pressure to balance the increase in maritime traffic and to preserve their, often little known, environmental regime.
Island states and many of the maritime states of West Africa may be relatively far from the modern developed urbanized growth taking place however their remoteness means that these states must compete at the international level even more effectively so as to not lose out on expanding markets. Some countries have only a few ports and well established routes for shipping. Others rely upon smaller ports and a less well de-veloped infrastructure of maritime routes as well as the ports and harbours that must act as trade hubs.
Regional studies indicate that there is a lack of up to date charting and hydrographic survey data in many developing maritime areas. However that is not to say that there is no hydrographic survey activity. It is thought most likely that the specific surveys being undertaken either, do not meet the required international specifications to enable the data to be used for hydrographic purposes, or the data is restricted or lost.
Whatever the reason for the lack of suitable Hydrographic surveys and data, it’s clear that regions and maritime states must look to find the beneficiaries of any up to date hydrographic data and create a facility to ensure as many users as possible of the data gain access. These Stakeholders may form a vital focal point to support the develop-ment of Hydrographic services.
3. stakeHolders.
There are quite a number of potential Stakeholders when the uses and applications of Hydrographic data and products are considered. There may be government agen-cies and departments, ports and harbours, environmental organizations, tourism and aquaculture and administrative groups. These varied government and commercial en-terprises may form a strong demand for up to date products.
Commercial. shipping: Coastal freighters and Panamax container vessels as well as cruise operators require good and up to date information. The impact of poor routing into and out of ports restricted berthing and anchoring as well as general safe traffic movements have significant cost implications. Fleets are being replenished, vessels re-newed or replaced and owners should have the confidence that investment in modern and efficient techniques will ensure quick and safe passage.
tourist.organisations: Aim to offer new and “unspoilt” locations and many involve sea and coastal spots. Maintaining coastal waters, bays, beaches and islands all require and benefit from modern up to date Hydrographic data.
ports.and.Harbours:.As the economic hubs for many maritime states, the infrastruc-ture of modern ports require that the seaward routes and passages are also surveyed, maintained and made available for the transportation of goods and exports etc. These authorities often are direct beneficiaries of good up to date Hydrographic data. The case for the collection and management of survey data can be made on the basis of the direct benefits to the coastal region and local interior to the port. The Middle East is cur-

24
rently seeing a series of port expansion projects that are investing millions to develop their ports and ensure the viable transportation of goods. In the Caribbean region port developments have relied upon dredging and channel surveys to ensure safe access. What is vital to the success of these ventures is adequate Hydrographic survey data to provide safe berthing and passage for the ever increasing numbers and size of vessels.
local.Communities: The residents and communities that live on or near the sea de-pend directly upon its ability to provide them with a source of food and income. These communities rely upon their habitat often without the benefit of a benchmark assess-ment and survey. Consequently it is a challenge to allow development and change without being able to understand if there will be a negative impact.
Fishing. and. aquaculture:. Often the local communities, referred to above, are in-volved in commercial fishing and farming. However it requires care in the placement of a fish farm to avoid pollution and health risks to the fish. The audience at the Costa Rica FIG meeting heard of just such a situation occurring locally in the region. Fish stocks and quotas are all too familiar concepts but without good monitoring and surveys, the management of stocks and the spatial distribution of resources are very difficult. Recent Hydrographic surveys in areas of the north Atlantic have supported the man-agement of fish sticks using efficient use of data.
There are many other potential Stakeholders, all with their own specific interests and requirements of the data and products. New Stakeholders will probably appear if some of the experiences of the developed maritime states are to be followed. The benefits of modern up to date Hydrographic data has been shown, in the case of the Irish Seabed Mapping Programme, to provide benefits to over seven categories of Stakeholders as well as over 100 research initiatives.
4. tHe.HydrograpHIC.value.CHaIn.
The value chain that represents Hydrographic data starts with data collection. This is an activity that requires up to date highly technical equipment and suitably trained per-sonnel both of which represent a relatively high investment. However without the data no further progress can be made to develop and improve the situation. Data collection alone is not sufficient, as the data collected must be of a suitable standard and then be processed to create products that are of interest and value to as many Stakehold-ers as possible. The data products must also be made available to as many as possible through data management facilities, mapping and web enabled access points.
The starting point for many coastal, marine and water based developments must be a good map and this requires that a good Standard of survey is executed to provide that basis. A national Hydrographic Service to provide a national focal point and to collect and maintain the data can serve to add value and sustain the value chain from data collection to data products for Users.
5. InternatIonal.studIes.
Only a very few studies and reports have been generated that provide any detail re-garding the need for a Hydrographic service in terms of the benefits it can bring to a maritime state or the major Stakeholders in a region. Two examples are given here:

25
5.1 APEC Transportation Working Group Study (2002)This study concentrated upon archipelagic states in the Pacific but its findings and recommendations offer some fundamental points that seem relevant to any maritime state wishing to develop and benefit from Hydrography. It recommends a state to un-dertake a study of its Hydrographic Office or Service to identify areas that need atten-tion. The report also developed a high level model to facilitate the economic analysis for the Hydrographic requirements. Further the APEC report recommended that a 5 year plan was created and that the objectives were included in national or ministerial development plans. Regular review and assessment of the progress was to be achieved through the introduction of co-ordination arrangements allowing the identification of the benefits.
5.2 UN Maritime Transportation Development Study (1989)This study, although now relatively old, indicates some of the institutional areas that also need to be recognised and addressed if relevant to a maritime state or region.
The UN study identified that delays in the processing of permits and clearances to ac-cess partner organizations often impacted on the efficiencies of projects. Further the outdated procedures, procurement policies and relatively inadequate human resourc-es and labour combined to stall or even prevent capacity being developed. For any groups wishing to develop and sustain Hydrographic services these potential obstacles will be no exception and the UN urged that strategic plans recognize and address these to create suitable conditions for sustainable development of capability and capacity.
6. Case.studIes.
As well as the international studies some maritime states have also reviewed the situ-ation.
Canada undertook a review of the cost of the Canadian Hydrographic Service in 1992 and concluded that, on the basis that the charts were the “maps” of the maritime high-ways supporting better, safer, cheaper transportation then the return on Hydrography was 10 to 1.
More recently in 2008, the Irish Seabed Survey reported their conclusion that the ben-efit of their surveys is likely to be in the order of 6 to1 based on a wider group of Stake-holders.
Consequently maritime states recognizing the benefits as outlined by these studies, will wish to seek support in developing their capacity and Hydrographic capability, if not for the direct economic benefits but for other political and geo-spatial purposes. Countries such as Bangladesh, Papua New Guinea and states bordering the Red Sea have all benefitted from the direct support and collaboration with other maritime states whose Hydrographic services are developed and can contribute expertise and training to develop a sustained capability.

26
7. summary
Direct links between Hydrographic surveys and the economic benefits to the local community and developing maritime states have usually not been easily identified and quantified. This has hindered the creation of up-to-date Hydrographic capacity and re-sulted in the loss of economic benefits due to a lack of recognition that Hydrographic surveys can and do provide a basis to develop a value chain of data products and serv-ices to support their socio-economic needs and challenges.
Strategic plans and investments should include Hydrographic surveys as a fundamen-tal component to building capacity that directly benefits the local communities, indus-try, transport and economies, with a return in excess of 5 to 1.
seleCted.reFerenCes
Australian Dept. of Defence: An economic analysis of the benefits of the RAN hydro-graphic programme, 1992.
Brinkman, G. L., and S. L. Caverley. Benefit-Cost Assessment of the Canadian Hydrographic Service. Report prepared by Intercambio Limited for Canadian Hydrographic Survey, Ottawa. 1992.
A Study for the APEC Transportation Working Group “An Analysis of the Economic Ben-efits of the Provision of Hydrographic Services in the APEC Region” in 2002.
BIograpHICal.notes.
Gordon Johnston is director of Venture Geomatics Limited, an independent consult-ing and technical training group in the UK. He joined Decca Survey as a field surveyor, working in Europe and Africa and became Chief Surveyor of Racal Survey in 1993. In 2004 he started consulting for non government, commercial and international organi-sations providing strategic technical, market and commercial services. He is based in the UK and is the chair of the FIG/IHO/ICA International Board on the Standards of Com-petence for Hydrographic Surveyors and Nautical Cartographers and a vice chair of FIG Commission 4.
ContaCt
Gordon JOHNSTON, Director, Venture Geomatics Limited, UK [email protected].

27
tHe.value.oF.HydrograpHIC.InFormatIon.and.Its.InFluenCe.Hugo.m.gorziglia,.IHo.
abstract..The International Hydrographic Organization (IHO) and its objectives of aiming at improving hydrographic capabilities worldwide are introduced in this paper. Hydro-graphic development contributes to safety of life at sea and the protection of the marine environment, while also contributes to sustainable development. Highlights the impor-tance of capacity building and invites countries in the region to consider joint work with the Meso American and Caribbean Hydrographic Commission, the regional structure of the IHO. The definition of hydrography and nautical chart and nautical publications is provided to fix the scope of the paper, including some economic characteristics of these products. The paper makes to these products and identifies some elements of main value. These elements are also cross-referenced with several other different activities for which such information is required. The influence of hydrographic information has in the decision making process of different activities of national importance is described and some conclusions are offered as invitation for further consideration.
key. words:. capacity building, cartography, coastal zone management, engineering survey, hydrography, marine cadastre, real estate development, risk management.
1. IntroduCtIon.
The International Hydrographic Organization is an intergovernmental organization with a consultative and technical character, contributing to safety to navigation and protec-tion of the marine environment through the coordination of the activities of National Hy-drographic Services. The organization seeks for the greatest uniformity of nautical charts and complementary publications, as well as the adoption of the safest and most efficient methods of conducting hydrographic surveys and production of nautical charts.
The IHO has a structure that comprises of a Conference – meeting of all member states, today 80; a Secretariat the headquarters of which is in the Principality of Monaco, 15 Regional Hydrographic Commission, including the Meso American and Caribbean Sea Hydrographic Commission at which Costa Rica as well as all Central American countries can participate. Also the IHO has different Working Groups, Committees and Commis-sions to deal with technical specific topics. One of the Committees is the Capacity Build-ing Committee that looks after the improvement of existing hydrographic capabilities and develop strategies to establish new hydrographic offices where they do not exist, provided that expression of interest are received from interested countries.
The IHO is doing a great effort in raising awareness on the importance of hydrography worldwide and this FIG Regional Conference was identified a an excellent opportunity to flag this matter in a region where hydrography does not look to be developed, de-spite of the maritime characteristics of the countries in Central America.
For senior hydrographers and hydrographic surveyors this paper does not constitute any surprise, but a reiteration and an opportunity to call for a higher priority to an activity that no doubt contributes to sustainable development for national and regional initiatives of

28
economic importance. Safety to navigation and protection of the marine environment cannot be achieved without a national hydrographic agency and a coordinated struc-ture. Hydrography needs to be seen as a national objective of strategic importance.
Let us go now to some early definitions that shall help us to get a better understanding of the importance of hydrography.
Understanding that there might be several definitions for Hydrography, I invite you to consider for the purpose of this presentation the definition adopted by the Interna-tional Hydrographic Organization that says:
“Hydrography is that branch of applied sciences which deals with the measure-ment and description of the features of the seas and coastal areas for the pri-mary purpose of navigation and all other marine purposes and activities, includ-ing –inter alia- offshore activities, research, protection of the environment, and prediction services”.
In this context, first of all I would like to identify some of the main hydrographic in-formation we are referring to, those we think are of great general value ; what type of activities can be benefited from the hydrographic information to finally attempt to give some thoughts as regard to the influence this information plays in the decision making process.
From our perspective we also differentiate hydrographic data from hydrographic in-formation, being the later the result of a process that makes the original raw data of use for a particular purpose. In this context we shall consider nautical charts and nautical publications as the two main traditional products compiling hydrographic information.
It might be prudent to consider the definition of these two elements given by the Inter-national Maritime Organization (IMO), for which:
. ‘nautical.chart.or.nautical.publication.is.a.special-purpose.map.or.book,.or.a.specially.compiled.database.from.which.such.a.map.or.book.is.derived,.that.is.issued.officially.by.or.on.the.authority.of.a.government,.authorized.Hydrographic. office. or. other. relevant. government. institution. and. is. de-signed.to.meet.the.requirements.of.marine.navigation.*’.
. ‘*. refer. to. appropriate. resolutions. and. recommendations. of. the. Interna-tional. Hydrographic. organization. concerning. the. authority. and. respon-sibilities.of.coastal.states.in.the.provision.of.charting.in.accordance.with.regulation.9.’...
(See Regulation 9 “Hydrographic Services” in Annex A).
It is difficult to find a maritime country that does not depend on the availability of nau-tical cartography. It might be said on the contrary that almost all maritime countries are strongly dependant on nautical cartography and nautical publications for their maritime commerce and development. Nevertheless it is extremely difficult to make an analysis that could easily show the economic benefit for a country derived from the use of these two information sources.
Products such as Nautical Charts and Nautical Publications Nautical have some very interesting characteristics from an economic perspective, being these characteristics the ones that make any economic analysis a challenging exercise. They are:

29
a) an intermediate good
b) almost always a good from the public sector
c) a public good or a public service
A nautical chart or nautical publication is an intermediate good as on its own has little utility and therefore must be incorporated to another good, activity or service, to have a real economic value. As an example, a paper chart is just a paper with information. Its value only becomes important when it is used, for example in the shipping activity, but a paper chart on a shelf in a store worth very little.
Being a good almost always prepared by the public sector, it is very difficult to quantify its value as they are marketed by the national authority or dealers with a referenced price. Also, are subject to subsidies the costs of which are normally very difficult to determine.
Being a public good or a public service, its value cannot be determined precisely and this situation precludes the private sector to participate in 100% of the full process, from the planning to the provision of the product.
Finally there is no competence in the consumption, that is to say that the service pro-vided to one user can also be provided to many other users without an extra cost. The edition of a nautical chart or the provision of the marine safety information service constitutes a product and service the costs of which are independent of the number of users. Also, a person might decide not to use the service, but the service must be provided anyway as regulations request the use of nautical charts and publications for safety to navigation purposes, independent of the number of users. The last particular-ity of these services is that they cannot be refused; for example, a mariner will pay for the services of lighthouses in a particular route, no matter if he decides not to use the service.
Normally Hydrographic Offices sell their products at a marginal cost, that is to say, to recover the printing costs and the manpower used in the editing and printing phases. The recovery of costs such as ship’s days, helicopter’s hours, salaries of those gathering and processing the data, instrumentation maintenance and others, normally are not considered.
Well this introduction has located us in the general context of this paper. Now, let us move into some details.
2. HydrograpHIC.InFormatIon.oF.maIn.value.
The nautical chart and the nautical publications contain a complete set of information aiming at providing the mariner with the required information to sail safely. The follow-ing are some of this information:
a). Coastline:.For the mariner the representation of this line in the chart serves as a reference to interpret the representation offered by the radar, getting a good feeling of the ship position. But also this is the natural limit between the sea and the land at a particular moment, low water as marked on large-scale charts of-ficially recognized by the coastal State. This line constitutes the normal baseline of a country and the bases for the establishment of the straight baselines, if ap-

30
ply according to UNCLOS. From here it is measured the breadth of the Territorial Sea, Contiguous Zone and Economic Exclusive Zone and the Definition of the Continental Shelf external limits or extension beyond 200 nautical miles if ap-plies. Also constitutes an important limit for the definition of the beach and the neighbouring proprietary of the land, either of public or private domains.
b). Coordinates:.The coordinates provide the mariner a standardize language to indicate his position, normally in degrees of latitude and longitude. This stand-ardized system allows assigning each feature its corresponding coordinates. This coordinates are universally well known and facilitates delimitations, meas-urements and planning for different purposes.
c). Currents:.The indication of the currents in the chart and its description in rel-evant nautical publications provides the mariner with the conditions he might expect during his voyage in different places and at different times. Also this in-formation is requested for all submarine operations, coastal engineering works, and many others, as it will provide a forecast of the direction and speed of the current expected. Normally the information provided in charts and publications correspond to the mean values extracted after long observation periods. Hydro-graphic Offices might have detailed records of current observations available for other uses.
d). depths:.Depths provided in the nautical charts as well as the isobaths consti-tute an extremely valuable information, as they set the bathymetric characteris-tics of a particular sea area. The steepness or the flatness of the sea floor as well as the actual clearance between the sea surface and the sea bottom could be ex-tracted from this information. It must be understood that not all the information can be made available in the nautical chart and much more information in the form of profiles are with the hydrographic offices that collected and processed the data.
e). geographic.description:.A nautical chart is self explanatory, but there is infor-mation that must be made available in written form as it constitutes a geograph-ic description of a particular area. One of the nautical publications that contains such description is known as Sailing Directions. In truth the description is an historical record or compilation of experiences offered by the hydrographers that surveyed the area and many mariners, port authorities and others that have contributed to enrich the description of the area. This will benefit mariners sail-ing the area for the first time as well as others aiming at knowing the particulari-ties of the area for different uses.
f). limits:.A nautical chart and the complementary nautical publications draws and describes, respectively, the different limits established for different purposes. It can be international maritime limits; other administrative limits as in UNCLOS; or national resolutions as for example areas forbidden for a particular activity or areas where a precise activity shall take place. This information is of the utmost importance as the situation is opposite to the land situation, where the limits are materialized with clear marks and indications. Limits also contribute to the management and protection of marine spaces.
g). navaids:.The information on aids to navigation that are included on charts and publications represents identifiable marks that physically exists or systems that

31
could provide a standardize position to a user. Also can be a service contributing to the safety of live at sea or to safety to navigation.
h). sea.bottom:.It is a characteristic of the nautical chart to indicate the type of the first layer of the sea bottom. This information helps the mariner mainly to decide where to anchor. Also where landing crafts could land in the shore. Information collected by hydrographic offices could be much complete than the general in-formation included in the chart.
i). tides,.levels.and.datum:.The information on tides, the different levels adopted and the identification of the datum selected in the vertical control go all togeth-er. Long period of tide observation and the determination of the respective lev-els such as the Mean Sea Level, or any other, together with the adopted datum for depth reduction are decisions taken at each hydrographic office. A nauti-cal chart indicates certain tides parameters and the datum. A special nautical publication known as tide tables provides the forecast for heights of the tide at relevant ports. Hydrographic Offices might have detailed records of tide gauges observations available for other uses.
j). wrecks:.This information included on the nautical chart prevents from hitting a sunken ship of which no evidence is seen from the surface of the sea water. Its precise position and clearance could avoid accidents, lost of fishing equipment and nets and collisions, with unexpected results.
I have provided a very brief description of each of these 10 elements, included in nauti-cal charts and nautical publications, highlighting the use a mariner makes of each of this information.
The effort different national entities made to gather, process and generate hydro-graphic information, products and services is not trivial. The important message is to understand that this effort is a “national” effort. The cost/benefit ratio of the investment required for this to happen is improved if the information is shared and all potential national users benefit from this information to support their particular objectives. This requires a national coordination structure in the form of a National Hydrographic Com-mittee or similar body.
By the way, all countries signatories of the Safe of Life at Sea Convention (SOLAS) and members of the International Maritime Organization (IMO) have agreed to undertake several obligations as regard to the provision of charts, publications and services. This matter is no longer of a voluntary character but a commitment of maritime countries. I invite you to give a close reading to this regulation accepted and adopted by signatory countries.
In the next section I would like to associate each of these elements with some key ac-tivities of relevance to maritime countries.
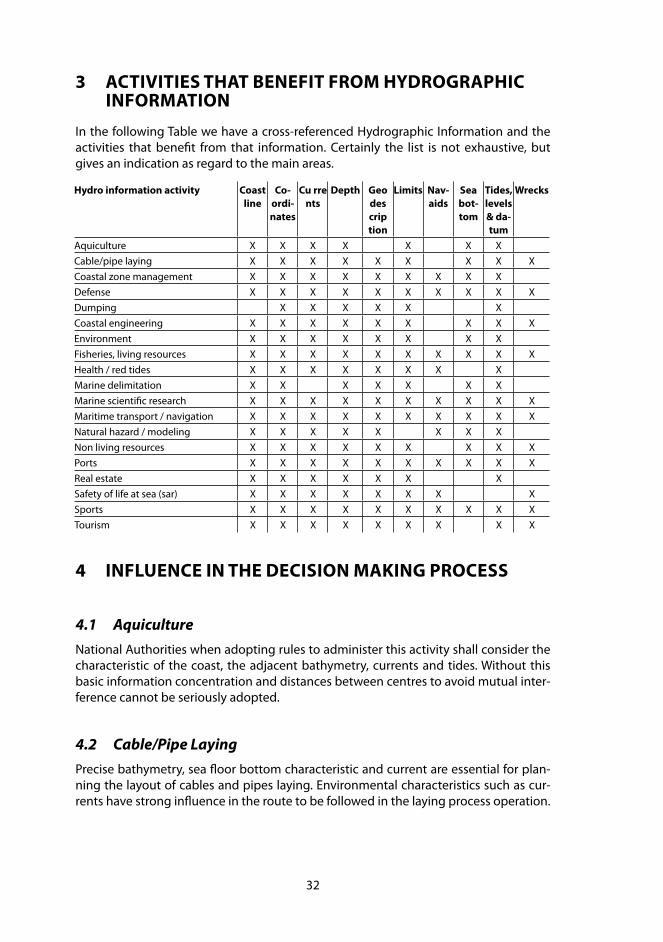
32
3. aCtIvItIes.tHat.BeneFIt.From.HydrograpHIC.InFormatIon.
In the following Table we have a cross-referenced Hydrographic Information and the activities that benefit from that information. Certainly the list is not exhaustive, but gives an indication as regard to the main areas.
Hydro.information.activity. Coast.line.
Co-ordi-nates.
Cu.rre.nts.
depth. geo.des.crip.tion.
limits. nav-aids
sea.bot-tom
tides,.levels.&.da-tum.
wrecks.
Aquiculture X X X X X X X Cable/pipe laying X X X X X X X X X Coastal zone management X X X X X X X X X Defense X X X X X X X X X X Dumping X X X X X X Coastal engineering X X X X X X X X X Environment X X X X X X X X Fisheries, living resources X X X X X X X X X X Health / red tides X X X X X X X X Marine delimitation X X X X X X X Marine scientific research X X X X X X X X X X Maritime transport / navigation X X X X X X X X X X Natural hazard / modeling X X X X X X X X Non living resources X X X X X X X X X Ports X X X X X X X X X X Real estate X X X X X X X Safety of life at sea (sar) X X X X X X X X Sports X X X X X X X X X X Tourism X X X X X X X X X
4. InFluenCe.In.tHe.deCIsIon.makIng.proCess.
4.1 Aquiculture National Authorities when adopting rules to administer this activity shall consider the characteristic of the coast, the adjacent bathymetry, currents and tides. Without this basic information concentration and distances between centres to avoid mutual inter-ference cannot be seriously adopted.
4.2 Cable/Pipe Laying Precise bathymetry, sea floor bottom characteristic and current are essential for plan-ning the layout of cables and pipes laying. Environmental characteristics such as cur-rents have strong influence in the route to be followed in the laying process operation.

33
4.3 Coastal Zone Management A precise description of the coast and the consideration of bathymetry, currents, and tides are required to adopt administrative measures for a better planning. The use of the coastal zone needs to prioritised and regulated in function of its particular charac-teristic. Questions such as which is the best use or what type of activities can coexist re-quire an in depth study of these parameters. Criteria to manage and control maritime concessions are also dependant on hydrographic information.
4.4 Defence Naval exercises and operations require an excellent knowledge of the whole spectrum of hydrographic information. Special submarine exercise areas are to be defined and probably limitation for other activities shall be determined based on bathymetric char-acteristics of the area.
4.5 Dumping Dredging operations are commonly executed in almost all ports. Following strict cri-teria the dumping areas are to be defined, based mainly on depth, currents and eco-systems present. Dredges cannot discharge material elsewhere, but in areas predeter-mined and authorized.
4.6 Coastal Engineering The study of the coast line and the influence of tides, currents, waves and the bathym-etry constitute a must in all coastal engineering projects. The impact of any work on the coastal dynamics needs to be assessed through models for which detailed information in mandatory.
4.7 Environment Environment is at permanent risk of accidents and plans are required to react in case of emergencies. By knowing the characteristic of the area the administration can adopt the most effective measures to control pollution.
4.8 Fisheries, Living Resources The fishing activity is very dependent on the bathymetry. Serious accidents could take place if the submarine topography is ignored as nets can be get caught by pinnacles or wrecks if not known. Administrative measures to protect certain species or to regulate its catch are as well bathymetric dependent.
4.9 Health / Red Tides Monitoring of harmful algae blooms can be best achieved if parameters such as cur-rents, tides and bathymetry are known. Adopted contingency plans shall be more suc-cessful if these parameters are considered.

34
4.10 Marine delimitation Nautical charts are vital for the establishment of maritime delimitations as requested by UNCLOS. Bathymetry and the characteristic of the sea floor sediment’s layers are mandatory to access to extension to the continental shelf beyond the 200 nautical miles. The decision making process in this case has a strong international impact.
4.11 Maritime Transport / Navigation Navigational routes are determined based mainly on the bathymetric characteristics of the area. Routes must provide ships a safe clearance and sufficient manoeuvring area for the operations, especially in restricted waters, due to the narrow of the passages, the existing depths and currents. Nautical charts, representing all the required hydro-graphic information for this purpose, is considered to be main aid to navigation.
4.12 Natural Hazard / Modelling The success in protecting coastal communities from natural hazards such as tsuna-mis and storm surges are dependant on the availability of hydrographic information. Planning evacuation routes requires inundation charts that are prepared after running models based on some parameters and under some conditions. Coastal bathymetry and topography are a must in this approach.
4.13 Non Living Resources The decision to exploit marine non living resources is also dependent on the geomor-phology and characteristic of the sediments of the sea floor. The extraction of mineral or as simple as the extraction of sand to nourish rocky beaches demands a detailed knowledge of the regime that affects the coastal zone, such as depths, tides and cur-rents.
4.14 Ports Ports are extremely important national economic units. The exploitation of the best draft a cargo ship can have obliges to have a detailed command of two basic elements, bathymetry and tides. This information is nowadays monitored in real time to optimise the cargo limitations. As regard to the exploration of areas apt for the development of new ports, the full set of hydrographic information is vital for a wise decision.
4.15 Real Estate As in land, the coastline and also the sea are exposes to a high pressure of increasing uses. New regulations and policies are put in place and innovative figures are demand-ing as well innovative legislations. Artificial islands for example. Perhaps hydrographic information is mostly required to set standards and new practice in the administration and control of such spaces.

35
4.16 Safety of Life at Sea (SAR) Search and Rescue operations are well known. People and means participate in this normally risky operations. A complete hydrographic knowledge of the area of the emergency is required and special hydrographic missions are conducted whenever are necessary to support these activities.
4.17 Sports The definition of areas apt to practice nautical sports also should consider hydro-graphic information, such as bathymetry, currents and coast line. Sports at sea can take different forms. They can be on surface or submerged and therefore to authorize any particular area, this one must be specially examined according to the environmental conditions, minimizing risks.
4.18 Tourism There is a difference to be considered between shipping routes and cruise liners routes. The objective of the first is to transport goods from one port to another in the most safely and economic way (shorter route). Cruise liners privilege the scenery, the beauty. The identification of potential new routes and finally the decision to open new routes depend on hydrographic information.
Our message is that hydrographic information is absolutely necessary to adopt a number of decisions, all of which have an economic impact on the development of maritime nations.
5. ConClusIons.
1. The International Hydrographic Organization provides all maritime countries the opportunity to benefit from its experience in improving or establishing national hydrographic capabilities. Due to the incipient or lack of national hy-drographic structure in several countries in Central America, countries as for example Costa Rica, might wish to consider approaching to the IHO bodies, to get advice on how Hydrographic Services as established in SOLAS Regulation 9 could be achieved.
2. Capacity building is a key issue to achieve development. IHO structure consid-ers regional hydrographic commissions to address regional problems for which a collective solution could be explored, identified and put in place. Countries in Central America should strongly consider participating in the activities of the Meso American and Caribbean Sea Hydrographic Commission and apply for technical support to develop its hydrographic capabilities.
3. Hydrographic Information the traditional representation of which constitutes the nautical chart or nautical publication has an immense value. The concept that hydrographic information only serves the purpose of producing these two products is wrong. Being the main purpose to contribute to safety to navigation and protection of the marine environment, hydrographic information strongly contributes to many other initiatives of economic interest.

36
4. The lack of hydrographic information precludes national authorities to adopt the best possible technical and administrative regulations aiming at the devel-opment and welfare of their communities in a sustainable manner. Funding hy-drographic surveys and studies shall not be considered as expenditure but as an investment, and a real national asset of strategic importance.
ContaCt
Captain Hugo Gorziglia 4 quai Antoine 1er B.P. 445 MC 98011 MONACO CEDEX Tel. + 377 93 10 81 00 Fax: + 377 93 10 81 40 Email: [email protected] Website: http://www.iho.int/
anneX.a.
solas.CHapter.v..saFety.oF.navIgatIon..
regulation.9.Hydrographic.services.1. Contracting Governments undertake to arrange for the collection and compila-
tion of hydrographic data and the publication, dissemination and keeping up to date of all nautical information necessary for safe navigation.
2. In particular, Contracting Governments undertake to co-operate in carrying out, as far as possible, the following nautical and hydrographic services, in the man-ner most suitable for the purpose of aiding navigation:
a. to ensure that hydrographic surveying is carried out, as far as possible, adequate to the requirements of safe navigation;
b. to prepare and issue nautical charts, sailing directions, lists of lights, tide tables and other nautical publications, where applicable, satisfying the needs of safe navigation;
c. to promulgate notices to mariners in order that nautical charts and publications are kept, as far as possible, up to date.
d. to provide data management arrangements to support these services.
3. Contracting Governments undertake to ensure the greatest possible uniformity in charts and nautical publications and to take into account, whenever possible, relevant international resolutions and recommendations.*
4. Contracting Governments undertake to co-ordinate their activities to the great-est possible degree in order to ensure that hydrographic and nautical informa-tion is made available on a world-wide scale as timely, reliably, and unambigu-ously as possible.

37
tHe.Cost-BeneFIt.oF.CHartIng.Cameroon.waters.Cyril.mbeau.ache,.Cameroon.and.victor.abbott,.united.kingdom.
abstract..The aim of the investigation was to examine the cost benefit to Cameroon of charting her navigational waters. This paper concentrates on examining the economic benefit of maritime trade in Cameroon and the potential economic consequences that result from poorly updated nautical charts. A cost benefit ratio was determined. The paper addresses:
– International and national trading activities
– The cost of surveying and charting activities
– The relationship between commercial, insurance and environmental costs.
The initial investigation compares Cameroon with other developing states. From a de-scription of the waters and trade in Cameroon, the paper addresses resources in terms of ports, fishing, hydrocarbons and environmentally sensitive areas. It describes the role of navigational charts and its contribution to the growth of a state’s economy. In order to determine the benefit of charting Cameroon Waters this paper provides a gen-eral assessment of the economic value and importance of shipping operations out of the three major ports in Cameroon, including fishery landings and foreign commerce. The estimated cost associated with implementing a hydrographic programme for Cam-eroon is examined and a cost- benefit ratio of 1:8 determined. Most coastal countries in the developing world especially on the West coast of Africa are still to appreciate the relationship and importance of hydrographic surveying to their economies. It is hoped that this paper will benefit countries in transition to understand this relationship and embrace the importance of implementing hydrographic programmes in their coun-tries and charting their own waters.
key.words: Hydrography, charting, cost-benefit analysis, Cameroon
1. IntroduCtIon.
In part fulfilment of the MSc Hydrography, Mr Mbeau Ache undertook an investigation into charting the waters of Cameroon. With membership of the International Hydro-graphic Organisation approved but waiting upon the Instrument of Accession (IHO, 2009), Cameroon is dependent on the French Hydrographic Office (SHOM) for a major-ity of its charting. It is a country that will benefit from increased national expertise.
The authors deliver and have been studying on an FIG/IHO Category A accredited pro-gramme, a year-long academic course with significant field work ranging from land surveying though single beam surveys to fully digital swathe surveys and flythrough of digital ground models.
As part of the studies, the students are required to utilise time within an 18 week sum-mer period to investigate and write up an academic study on a mutually acceptable topic. The dissertation, from which this paper derives, has recently been submitted to fulfil this requirement.

38
2. Cameroon.
The Republic of Cameroon is located on the west, central African coast, with the port of Douala at approximately 04o 03’ North and 009o 42’ East. It has land borders with Ni-geria, Chad, the Central Africa Republic, the Republic of the Congo, Gabon and Equato-rial Guinea. Cameroon’s coastline lies on the Bight of Bonny, part of the Gulf of Guinea in the east, central Atlantic Ocean. Cameroon has a total area of 475,440 km² of which 6,000 km² are inland waters and claims a 200 nautical miles EEZ with a continental shelf area of 13,062k m² (Sayer et al 1992). The coastal environment of Cameroon is open to the Atlantic Ocean with a length of about 402 km (Sayer et al 1992). Cameroon has a population of about seventeen million people (NISC, 2008).
From the Nigeria border to Idenau (Figure 1), the coast is low and marshy. It is watered by the mouths of Rivers Akwayafe, Ndian, Lokete and Meme which together form the Rio-del-Rey estuary. The vegetation along this coast is mainly mangrove and swamp.
Figure 1: The characteristics of the Cameroon coastline. Taken from Folack, 1997.

39
From Idenau to Limbe, the coast is volcanic and overhung by Mount Cameroon (with a peak of 4,095 metres). The coastal vegetation type is low altitude mountain forest, rich in endemic species. It is characterised by frequent lava flows and the industrial planta-tions of the Cameroon Development Corporation (Folack and Gabche, 2009)
Limbe to River Nyoung is a low coast characterised by the presence of estuary and river mangroves and separated from the Atlantic forest by a marshy complex of brackish water. The rivers discharge a considerable quantity of sediments to the sea. The River Mungo enters the sea through a delta which other rivers forms the Cameroon estuary.
From the mouth of River Nyong to Campo the coast is high with rocky outcrops alter-nating with sandy mud. There are occasional mangroves (Folack and Gabche 2009). Table 1 below shows the Cameroon coastal river system and hydrological zones. River Sanaga has the greatest length followed by river Nyoung.
With rich oil resources and favourable agricultural conditions Cameroon has a strong primary commodity economy. Coincident development of the oil sector led to rapid economic growth between 1970 and 1985, ending in 1986 with the steep decline in the prices of major exports: coffee, cocoa and petroleum. By 2007, growth was estimated at 3.6% (OECD, 2008).
The overall trade balance shows a surplus of about US$477 million from oil revenue and US$488 million from non-oil trade (Ministry of Planning, Programming and Regional Development, 2006). Revenue and grants amount to about US$4.5 billion and expend-iture stood at about US$ 3.7 billion. The investment budget for the Ministry of Transport was US$ 32 million (OECD, 2009).
The Ministry of Transport (MoT) is responsible for safety at sea, maritime and navigation regulations in Cameroon waters. Thus, the MoT should be responsible for collecting and disseminating maritime safety information as required by the IMO SOLAS Conven-tion (IMO, 2009). However Cameroon has neither a national hydrographic service nor any investment directed towards this. A limited hydrographic capability is available at the port of Douala (Eastern Atlantic Hydrographic Commission report, 2004), managed by the port authority but with no responsibility to conduct surveys outside the port. Thus any issues of navigational significance beyond the port limit are neither detected nor charted.
major.rivers. length.(km).
drainage.catch-ment.(area;.km2).
sediment.yield..(kg.yr-1).
annual.mean.flow.(m3s-1).
Cross 160 800 - 171,570 Ndian - - - 246 Meme - - - 300 Mungo 150 2,420 ###1.0 109 27,236 Wouri 250 82,000 - 49,1425 Dibamba 150 2,400 - 480
Sanaga 890 135,000 28,109 500,5700 Nyoung 800 1,400 - 26,376 Lekoundge 185 - - -Kienke 100 - - -Lobe 80 1,900 - -Ntem 460 31,000 - 50,764
Table 1: Cameroon’s coast, modified from Angwe and Gabche (1997).

40
2.1 Maritime trade In one publication (Pedlow, 2001), 15 ports and offshore terminals are listed, although three coastal ports, Limbe, Kribi and Douala, have greater significance. Limbe is Cam-eroon’s second largest port, lying at the foot of Mount Cameroon. It consists of:
– Limboh Oil terminal, for the transportation of crude oil, capable of handling ves-sels ranging from 33,000 DWT class to 95,000 DWT class. It has a minimum water depth at low water of 17m with the maximum allowable draft of 14m. The 14m sounding line is marked by three yellow buoys on the east side of the terminal. A report from a U.S Navy fleet has indicated various short comings on the avail-able charts, with uncharted objects and visual aids not visible at night.
– Currently only about 800,000 tonnes of goods are handled by the Limbe Sea port (Cameroon national shippers’ council). It is very small with a short single jetty. The main use of the port jetty is the small ferries running along the coast to Nigeria.
Kribi is a small coastal town with a small port with a very picturesque coastline.
– It has busy artisanal fishing activities and timber exports. There is also an off-shore terminal and an anchorage without restrictions.
– The river port is situated 300metres from the mouth of the river Kienke running through Kribi. Dredging is often needed to maintain the navigational channel.
The principal port is Douala International Seaport and 97% of commercial trade in Cameroon passes through Douala. It is situated on the South East shore of the River Wouri estuary, about 40km from the Atlantic Ocean. It is the largest city in Cameroon, with an estimated population of 2.5 million people (Asangwe, 2002) and the principal centre of economic development.
– It handles a high percentage of the international exchange of goods with its neighbouring countries, Chad and the Central African Republic. Therefore, Douala plays a central role in foreign trade. At low water it can receive non-oil cargoes in ships to 6.2 m draft and oil tankers to 9.5 m. There is a 2.2 m tide.
– The volume of cargo at the Douala port has increased since its creation from about 4.1million tonnes in 1995 to more than 7.1 million tonnes in 2008. The number of ships entering the port per year has increased from about 1,053 to 1,236 (Cameroon National Shippers’ Council, 2009).
3. CHartIng.
The French Naval Hydrographic and Oceanographic Service (SHOM) publishes infor-mation for navigation security in certain zones of the West African Coast, including Cameroon. This is made possible through bilateral agreements between Cameroon and France. However many nautical charts on the African coast are old and were es-tablished in the fifties. The local geodetic reference systems are uncertain, making GPS navigation difficult (Table 2).
Cameroon is a member of the International Hydrographic Organisation and partici-pates in other maritime and charting bodies. However, of waters less than 200 metres depth, only 9% are adequately surveyed and none of the waters deeper than 200 me-

41
Country. IHo.member.
eatHC.member. nHC..proposed.
phase.1.Capacity.
phase.2.Capacity.
phase.3.Capacity.
Cameroon Yes Associate Yes Partial Partial No Republic of the Congo No No Yes Partial Partial No Gabon No No Yes Partial Partial No Equatorial Guinea No No Yes No No No Nigeria Yes MS Yes Partial Partial Partial
NHC: National Hydrographic Commission Phase 1: Collection and circulation of nautical information, neces-sary to maintain existing charts and publication up to date Phase 2: Creation of a surveying capability to conduct: coastal projects and offshore projects Phase 3: Produce charts and publications independently
Table 2: National Hydrographic Capability (Eastern Atlantic Hydrographic Commission, 2002).
Country. 200.<.status.of.survey.depth. 200.>.status.of.survey.depth.A1 B1 A2 B2
Adequate % % resurveyed Adequate % % resurveyed Cameroon 9 0 0 100 Republic of the Congo 0 100 0 0 Gabon 37 0 0 100 Equatorial Guinea 0 100 0 0 Nigeria 21 70 10 10
A1/A2 = % adequately surveyed 0–200m/ >200m B1/B2 = % requiring re-survey at larger scale or to mod-ern standards 0–200m/ >200m
Table 3: Status of Hydrographic Survey in Cameroon and Neighbouring countries (after IHO, 2006).
Country. offshore..passage/small.
landfall.coastal..passage/medium.
approaches.ports/large.
A B C A B C A B C Cameroon 100 100 100 100 100 0 100 100 0
Republic of the Congo 100 100 100 100 100 0 100 100 0
Gabon 100 100 100 100 100 0 100 100 0 Equatorial 100 100 100 100 100 0 100 100 0 Nigeria 100 100 100 100 100 0 100 100 0
A = % covered by international charts B = % covered by Raster navigational charts C = % covered by Elec-tronic navigational charts
Table 4: Status of charts in Cameroon and neighbouring countries (after IHO, 2006).
Country. local. note. Coast. note. nav. note. port.Infor-mation
note.
Cameroon No Not provided No Not No Not Yes Partial data for Douala harbour is received by SHOM
Republic of the Congo
Yes Partial informa-tion provided
No Not No Not Yes Partial information provided
Gabon No Not provided No Not No Not No Not provided Equatorial Guinea No Not provided No Not No Not No Not provided Nigeria Yes Partial No Not Yes Available Yes To UKHO
Local = Local MSI warning provided Coastal = Coastal MSI warnings provided NAV = NAVAREA warnings provided
Table 5: Status of Maritime Safety Information (IHO, 2006).

42
tres. Even that area surveyed to date requires resurvey to modern standards. (Table 3, IHO, 2006).
Charts at scales larger than 1:1,000,000 are not referenced to WGS84. Some countries in the region yet to market digital charts in vector form (Table 4), denying mariners and the wider community the significant safety improvements which are associated with the use of electronic charts.
Cameroon is also a member of the International Maritime Organisation (IMO) and a sig-natory to the Safety of Life at Sea (SOLAS) convention obligating contracting Govern-ments to arrange for the collection and compilation of hydrographic data and the pub-lication, dissemination and maintenance of all nautical information necessary for safe navigation. Yet, there is a clear shortage of maritime safety information (IHO, 2006).
It is fundamentally important to provide maritime safety information timely to mari-ners to alert them of any changes in charted information through the system of “No-tices to mariners” which are published regularly. This is crucial as, lights and buoys and underwater obstructions are changing their character and position all the time. In the entire region these information is lacking. In Cameroon only partial data is made avail-able to the French Hydrographic office (SHOM) for the port of Douala (Table 5).
4. opportunItIes.
Hydrography is most commonly associated with updating nautical charts, but hydro-graphic information is essential for numerous non-navigation purposes. Accurate and up to date hydrographic products (e.g. nautical charts) and services (e.g. notice to mari-ners) are paramount for navigation safety, and for supporting and expanding safe and reliable maritime commerce and tourism for the continuous sustainable growth of the global economy.
More than 80% of global trade is carried by sea (IHO 2005). The shipping industry has seen a general trend of increases in total trade volume over the last century. In 2007, interna-tional seaborne trade was estimated at 8.02 billion tons of goods loaded (UNCTAD, 2007). Increasing industrialization and the liberalization of national economies have fuelled free trade and a growing demand for consumer products (UNCTAD, 2007). The global econo-my cannot simply function without ships and the shipping industry (UNCTAD, 2007) and national boundaries offer little impediment to multi-national corporations.
Accurate charts are an important factor for the protection of the environment. Pollu-tion resulting from spills can have serious economic consequences - the 1989 Exxon Valdez oil spill on the South-Central Alaska’s fisheries resulted in serious economic losses, with up to an
11.1 % reduction in the local commercial fishing economy. It was the most expensive oil spill in history with cleanup costs in the region of US$2.5 billion and total costs (includ-ing fines, penalties and claims settlements) estimated atUS$9.5 billion (Cohen, 1995).
The Cameroon coastline that stretches from Rio Del Rey to Campo (a distance of about 402 km) and the adjacent marine environment is rich in aquatic organisms and man-groves of serious economic benefit to the country. The Cameroon coastal zone is sited along major international petroleum transportation routes, such as internally to Chad or along the coast to Equatorial Guinea, and Gabon (Alemagi, 2007). Also, important

43
petroleum exploration and exploitation activities take place within the country. For ex-ample the terminal of the pipeline that transports crude oil from Doba in Chad to Kribi in Cameroon is located some 12 km from the seashore. Any oil spill or wrecks would inevitably lead to serious economic consequences to the country.
Promoting the safety of navigational activities, protecting the environment and its natural resources, and the management of coastal areas should be the main objectives of the government and/or government-authorized hydrographic institutions (Kopacz et al, 2003)
Excellent charts are particularly important to the development of the economically im-portant industry of tourism, especially involving cruise ships. The potential of cruise ship industry is very important to the developing countries. This important source of revenue cannot be exploited if safe navigation to remote touristic sites is limited due to poor charts. Tourism is one of the sectors on which the State of Cameroon is counting to sustainably revive the economy. With the coastline open to the Atlantic Ocean, Cam-eroon has an environment conducive to resort tourism, with the natural sandy beaches of Kribi and Limbe and the mangroves along its coast. Most of these tourist sites are in remote areas of the country. The potential for a cruise ship industry is an exciting prospect for Cameroon.
In the 2008 investment budget, the government allocated 8659075 USD (Services du Premier Ministre, 2009) for the tourism industry. Yet there was no investment in hydro-graphic surveying to produce better charts for the coastline that would help protect the mangroves and beaches from possible pollution resulting from ship related acci-dents in her waters or for the development of the cruise shipping industry.
Maritime safety and insurance costs are inextricably linked. The structure of the global marketplace requires that goods and materials be delivered not only to the geographi-cal location where they are required but also within a very precise timeframe. This can only happen if the mariners are using up to date charts. The risks from poorly produced charts are enormous. Accidents are not only undesirable outcomes in themselves; they also lead to the loss of lives. Lloyd’s Register of Shipping estimates that between 1983 and 1992, 10,013 lives were lost either from collision or wreck resulted accidents (Alder-ton, 2004). A very good example of the attribution of poor charts to maritime accidents is the case of the Sea Diamond that sunk off the Aegean island of Santorini in April 2007 (Lloyds List, 2007) (www.lloydslist.com/ll/news/...chart.../20017602633.htm).
There have been accidents in Cameroon waters, though the causes are rarely estab-lished. The reduction of accidents through the use of good charts and provision of maritime safety information could contribute to the lowering of insurance costs, which is a major operating cost factor for shipping companies. Anecdotal evidence suggests ships using waters with little hydrographic survey information have a high insurance premium related to the risk. When transportation is subject to risk factors the cost of transportation and product is increased (Bryant pers com, 2009)
Hydrography plays a crucial role in the definition for establishing the maritime delimi-tation of the different zones recognized in the United Nations Third Convention on the Law of the Sea (UNCLOS III). They allow the countries to extend their territory far be-yond the coastline. The Territorial Waters, the Contiguous Zone, the Exclusive Economic Zone and the Continental Shelf provide countries with the opportunity to explore, through scientific research, the better use of water, sea floor, and of the existing living

44
and non-living organisms. A number of maritime boundary delimitation disputes exist in the West African region, for example the Cameroon/ Nigeria case (Merrils and Evans, 2000) requiring foreign expertise (consultants and contractors) rather than a national hydrographic programme from where local expertise could be employed. These op-portunities can only be supported with a clear knowledge of the associated hydro-graphic regime of the environment.
Fishing is also an important source of national wealth in Cameroon. Trends in the an-nual catches of Cameroon’s marine fish industry showed that the total fluctuated be-tween 30,000 and 45,000 metric tonnes (t) between 1970 and 1978 with an increase to 70,000 t between 1979 and 1981 (Gabche et al 2001). Fishermen need marine informa-tion not only for the safe navigation of their vessels but also for the safe deployment of their fishing gear.
Economic security is interwoven with national security of a country. Navies are major users of charts and must rely on accurate and up to date charts. Accurate charts are essential in providing quick response and maximum and safe manoeuvrability. A visit by the West African Action Team (WAAT) formed from the East Atlantic Hydrographic Commission in 2004 described maritime and security arrangements as weak. Concerns have been raised about piracy and criminal activity off the coast Cameroon (Associated Press, 2009).
Good quality and well managed spatial data are important ingredients for commercial and economic development as well as for the protection of the environment. Hence many nations tend to establish national spatial data infrastructures that brings togeth-er services and data sets of major national spatial data providers, for example topog-raphy, geodesy, geophysics, meteorology, and bathymetry. A Hydrographic Office is therefore an integral part of the national spatial data infrastructure. Cameroon has a National Oceanographic Data Centre. There is however no good system to track data from national and regional institutions and data gathering capacity in many institu-tions is weak. The centre does not have data for tidal readings from the port of Limbe and only partial data for the port of Kribi and Douala (Folack, 2003). This stresses the need for the implementation of a national hydrgraphic programme that should be an integral part of the data centre.
5. Cost-BeneFIts.
Cost-benefit analysis helps in the appraisal of a potential project, and in this study, the im-plementation of a national hydrographic programme for Cameroon to chart her waters.
Cost-benefit analysis faces both conceptual and practical challenges, not being an exact methodology for evaluating the benefits a project can generate. Project assess-ment is only based on a limited set of factors that are clearly measurable in monetary terms while ignoring factors that cannot be readily quantified. One economic study, including a cost-benefit analysis of nautical charting was by the Royal Australian Navy’s Hydrographic Office (Australian Department of Defence, 1992). It indicated that it is difficult to obtain exact cost-benefit ratios, but concluded that,
“What is beyond reasonable doubt is that the existence of official up-to-date charts has a benefit to the national economy that greatly exceeds the cost of the hydrographic programme”.

45
A similar study was carried out by the Canadian Hydrographic Service, which in 1989 cited benefit to cost ratios ranging between 9.49 and 11.85, (Intercambio Ltd, 1992).
The method used to evaluate the cost-benefit to Cameroon of charting her waters, is as described in ‘Charting a Course into the Digital era’: Guidance for NOAA’s Nautical Charting Mission (Dorman 1994). It explains the principles of cost-benefit analysis ap-plied to surveys. It states that,
‘It is not realistic to encompass all the costs and benefit associated with imple-menting a project. So long as all the major costs and benefits are considered, this should be sufficient to give an estimate of the cost-benefit’.
The United Kingdom Hydrographic recently announced a net profit of £7.6 million (http://www.epsiplus.net/news/hydrographic_data_is_essential). This reflects the ben-efit that a national hydrographic programme can bring to state’s economy.
For Cameroon the estimated cost associated with implementing a hydrographic pro-gramme to collect data for the production of a nautical Chart was examined and the economic benefits associated with the accomplishment was calculated in economic terms. The next step was to determine the net benefits of implementing a hydrograph-ic programme minus the same measures if the project is not executed. Thus, a benefit cost ratio was calculated.
The critical surveys require up-to-date charts of the harbour approaches and harbours. This is crucial for ships to enter and leave the port safely. Only the Douala port chan-nel and port harbour are routinely re-surveyed; Limbe and Kribi are not. These charts should be of scales 1: 5,000 to 1: 50,000.
Charts of the vessel routes to ports and harbours should be the next priority at a scale of 1: 100,000 to 1: 300,000. Charting the remainder of the coastal region is not pressing. Even though this could be essential for fishing and other related activities, a careful prioritization would have to take place based on the availability of fund and against the requirement to improve the economy by international trade. These later charts should be at a scale of at least 1: 300,000.
Maritime safety information must be obtained and promulgated. Other opportunities exist in the charting of the Exclusive Economic Zone and surveys to allow for boundary delimitation.
There is a limited survey capability available at the Douala port but this is the logi-cal base on which to build a national hydrographic programme. A survey spread and survey personnel were costed at US$1.0M and US$0.1M annually respectively. Chart compilation and production were planned to be covered through bi-lateral agree-ments. Fishing was estimated at an export value of US$3.0M, and shipping revenue at the three principal ports as US$13.1M. The expected benefit from implementing a national hydrographic programme was estimated as US$ 24.1M. A simple annual cost: benefit computes as 1:8
6. ConClusIons.
Many coastal countries in Africa are still to appreciate the relationship and importance of hydrographic surveying to their economies. Cameroon has significant economic de-pendence on maritime trade and extensive offshore economic interests in the oil and

46
gas, fisheries, minerals and developing tourist industry. Competitiveness in trade can be seriously impaired and national development slowed, when the waters of coastal state are not charted to modern standards. It also exposes the country to high risk of pollution.
Cameroon, being a member of the International Maritime Organization (IMO), is a sig-natory to the SOLAS convention. Yet the coastline and much of her waters remains un-charted to an adequate standard (Tables 2 and 3); even the provision of maritime safety information is still ineffective with only partial information received by SHOM from the Douala autonomous port. Most of the large scale charts require modernization (Table 3). The visit of the West Africa Action Team formed from the EAtHC (East Atlantic Hy-drographic Commission) to assess the national hydrographic capability observed that there was a limited capability existing in Douala port (Table 2).
Yet, Douala port would be a logical base upon which to build a national hydrographic capability for the country. It is true that the implementation of a national hydrographic programme is costly (training, equipment acquisition) but the cost is low compared to total port revenues, safety, continued trade and environmental protection. Many hydrographic surveys could be conducted with a single beam echo sounder, tide poles and GPS. The report on the Douala port by a United States Navy ship, suggested the need for some of the port revenue to be reinvested in the maintenance of the buoys.
Further, companies carrying out exploration activities off the coast of Cameroon should be encouraged to submit information on surveys carried out prior to their exploration - there is a clear need for co-ordination between these entities.
It is beyond reasonable doubt that the benefit to Cameroon of implementing a hydro-graphic programme that would allow her to chart her waters far outweighs the cost. Using a COST-benefit criterion, the benefit accrued from such an implementation com-pares favourably to the cost. An implementation of a hydrographic program for Cam-eroon could realise a theoretical cost:benefit of about 1:8. Further to this estimate, the real value would be exceeded if as-yet unquantified benefits are included.
reFerenCes.
Alderton, P, 2004, Reeds Sea Transport: Operation And Economics, Fifth Edition, London Alemagi, D, 2007, The oil industry along the Atlantic coast of Cameroon: assessing impacts and possible solutions, Science Direct Vol 32 Angwe, CA and Gabche, CE, 1997, Quantita-tive estimation of land-based sources of pollution to the coastal and marine environment of the republic of Cameroon, Research Centre for Fisheries and Oceanography, Limbe, Cameroon Vol. 33 Asangwe, CKA, 2002, Managing the Dynamics of the Estuarine systems on the Douala Lagoon in Cameroon in Robin, G. And J. Jakeways (eds) Instability. Plan-ning and Management. Thomas Telford, London, 581-588 Associated Press, 2009, ‘Pi-rates free hostages taken off coast of Cameroon’ [NewsPaper], http/www.news.boston-herald.com/…/20090721pirates_free_hostages_taken_off_coast_of_ca meroon
Australian Department of Defence, 1992, An Economic Analysis of the Benefits of the Roy-al Australian Navy’s Hydrographic Programme, Australia
Bryant J, 2009, Personal Communication with Mbeau Ache Cameroon National Ship-pers’ Council, 2009, Les cahiers statistiques du CNCC No 003, 3
e
trimestre, 2007, http://www.cncc-cam.org/en/index.php Cohen MJ, 1995, Technological disasters and natural

47
resource damage assessment. An evaluation of the Exxon Valdez oil spill, Land econom-ics Vol 71 Dorman, E, 1994,Charting a Course into the Digital Era: Guidance for NOAA’s Nautical Charting Mission, National Academic Press, Technology and Engineering ’Euro-pean Public Sector Information (PSI) Platform’ [Online], http://www.epsiplus.net/news/hydrographic_data_is_essential [26 August 2009] Folack, J, 1997, Impact of human ac-tivities on river resources in Cameroon, in Folack J, Gabche CE, 2009, Natural and an-thropogenic characteristics of the Cameroon coastal zone, http://www.nodc-cameroon.org/anthropo.pdf, Folack J, 2003, Iode National Report for Cameroon IHO, 2006, Publi-cation S-55, Status of National Charting, International Hydrographic Organisation, Mo-naco IHO, 2009, http://www.iho-ohi.net/english/home/about-the-iho/about-member-states/status-of-approvals.htm
IMO, 2009, http:// www.imo.org/Conventions/mainframe.asp?topic_id=250
Intercambio Ltd, 1992, Canadian Hydrographic Service Report, Canada
Kopacz, Z, Morgas, W, Urbanski, J, 2003, Hydrography: Its Present State and Future De-velopment, Institute of Navigation and Hydrography, National University of Gdynua, International Hydrographic Review, April, Vol. 4, No. 1 Lloyds List, 2007, (www.lloydslist.com/ll/news/...chart.../20017602633.htm
Merrils JG and Evans D, 2000, The land and Maritime Boundary Case (Cameroon v. Ni-geria): The Intervention by Equatorial Guinea. The International and Comparative Law Quarterly, Vol. 19, No. 3
Ministry of Planning, Programming and Regional Development, 2006, Cameroon Pov-erty Reduction Strategy Paper Progress Report, Yaounde
OECD, 2008, Organization for Economic Co-operation and Development (2008), African Economic Outlook, http://www.oecd.org/dev/publications/africanoutlook Pedlow R (Editor), 2001, The Ships Atlas, Shipping Guides Ltd, Reigate Rame, E (editor), , African In-land fisheries, Aquaculture and the environment, FAO fishing New Books Yaounde, Cam-eroon, 15-25 NISC, 2009, National Institute of Statistics, http://www.statistics-cameroon.org Sayer, J.A., Harcourt, C.S. and Collins N.M (eds), 1992, The conservation atlas of tropi-cal forest-Africa, Macmillan publishing Ltd, London Services du Premier Ministre, 2009, Cameroon, http://www.spm.gov.cm/showdoc.php?rubr=600&srubr
UNCTAD, 2007, Review of Maritime Transport, United Nations
aCknowledgments.
The authors acknowledge the support of the Plymouth Devon International College and the Student Enterprise Award Scheme. Mr Cyril Mbeau Ache was the winner, PDIC Student Enterprise Award, 2009. Other funding arose from short courses run by Dr Ab-bott.
BIograpHICal.notes.
mr.Cyril.mbeau.ache.graduated from the University of Dschang, Cameroon in 1999 with a BSc Zoology. He taught in a Government Bilingual High School (GBHS) at Fon-tem, Cameroon from September 2002 to February 2007 and commenced the MSc Hy-drography at the University of Plymouth in September 2008. He recently completed

48
his course. He will be looking for work in the offshore hydrocarbon exploration indus-try, in charting or in environmental support.
dr.victor. abbott, worked as a land and hydrographic surveyor from 1976 to 1987. He took up lecturing, first at the (now) University of East London, UK and then at the University of Plymouth. He is the Lecturer in Hydrographic Surveying with research interests stretching from the mitigation of the effects of seismic exploration activity on marine mammals to the visualisation of surface and sub-surface objects in 3D through chromo-stereoscopy. He has worked variously for the Hydrographic Society, the Royal Institution of Chartered Surveyors, and the Institute of Marine Engineering, Science and Technology. He has recently published in Marine Policy and The Hydrographic Journal.
ContaCts.
Mr Cyril Mbeau Ache, Dr Victor Abbott The University of Plymouth A504 Portland Square Drake Circus Plymouth UNITED KINGDOM Tel. +44. (0)1752.584587 Fax + 44.(0)1752.584710 Email: [email protected] Web site: http://www.research.plymouth.ac.uk/geomatics/

49
metHods.to.assess.tHe.FInanCIal.value.oF.tHe.sea.parCel.and.tHe.eConomIC.oF.tHe.Coastal.and.marIne.area.wItHIn.a.marIne.Cadastre.FrameworkJohanes.p..tamtomo,.Indonesia.
abstract..Within a “land” cadastre, methodologies of property valuation were not new drawn back to year 2,000 B.C. when the Egyptians inhabited lands surrounds the Nile. The economic valuation of coastal and marine areas was not new since Turner et al. (1998) introduced it; nonetheless it is a newborn within a marine cadastre.
This paper elaborates a broad sense of a marine cadastre definition, coastal and marine parcels, and a method to assess the financial value of the parcels as well as the eco-nomic value of the areas and resources. In the marine environments, the value of the parcel is usually tricky, because it is not the land that could “easily” be assessed. An ap-propriate way is to use the Financial.valuation.method (FVM) to assess the projects, activities, and or resource products or uses in the sea parcel. Dixon and Hufschmidt’s formula (1986) is still widely used today to calculate NPV (Net Present Value), B/C ratio, and IRR (Internal Rate of Return). Meanwhile, the economic value of the coastal and marine area is measured by two tools, i.e. total.asset.value (TAV) of the area, and total.economic.value (TEV) of the zone; both consist of (DUV + IUV + OV + EV + BV) with different indicators.
For specific reference, this paper takes a case study in the coastal and sea areas of Bintan Island, Indonesia. This region has been exploited over years. The mining of sea sands and the devastation of mangroves and coral reefs have brought about vast det-riments. The terrestrial and sea sands exported to Singapore islands for “filling” the sea water (some say “reclamation” as a misleading term) of its shores, so the islands become wider. The coastal and shallow sea areas have also been degraded caused by the misuses of the mangroves and coral reefs. Learning from these cases, this paper also suggests the role of a marine cadastre in the management of coastal and sea resources and areas.
key. words: marine cadastre, sea parcel financial valuation, coastal and marine area economics valuation, integrated coastal and ocean zone management (ICOZM), ad-ministering and planning marine spaces
1. IntroduCtIon.
Inherent conflict of interests in the coastal and marine space use have occurred since as old as the human civilizations. According to Cicin-Sain and Knecht (1998), there are 29 activities in the coastal seas, and if each activity is put orderly into an activity matrix, then there will be 100 pairs of activities conflict each other and 60 pairs of activities en-dangering one to another. The fact that the administration of coastal and sea regions is a must. There have been many researches concerning the Integrated Coastal and Ocean Zone Management (ICOZM); however not too many researches have been conducted in the framework of a “marine cadastre” concept.
50
Problems occur in the coastal and marine areas could be brought about by many reasons. Nevertheless, according to the researchers (Clark, 1992; Patji and Salipi, 1995; Cicin-Sain and Knecht, 1998; Kay and Alder, 1999; Kusumastanto, 2001), the roots of the problems are generally as follows: (a) the conflict of interests caused by: high ecological potency, con-centration of citizens’ means of livelihood to the same resources, increasing the number of population, the quality of live, interests upon the area, changing and competition on the technology, and market distribution process; (b) the increasing of demands towards natural resources and coastal environmental services; (c) the unsustainable management practices; (d) constraints on the optimally of the execution of the coastal and marine spa-tial planning; (e) human behaviors: innocence, ignorance, poverty, and greedy; and (f ) the three failures: market and ownership failures, policy failures, and information failures.
The extraction of all the conceptual and empirical problems on the use of coastal and space mentioned above, indicating that the conflict of interests directly associated with “the.value”.of the three main components of natural facts and phenomena, those are ABC (a-biotic, biotic, and culture). The a-biotic components are all the structural and functional of physical areas (natural resources). The biotic constituents are all bio-logical (flora and fauna) structures and functions, whilst the culture parts are all human activities (economics, social and customs) and their outcomes (manmade resources).
2. value.and.valuatIon.on.Coastal.and.marIne.envIronments.
Within a “land” cadastre, methodologies of property valuation were not new drawn back to year 2,000 B.C. when the Egyptians inhabited lands surrounds the Nile. The reconstruction of property boundaries after the vast flood was immediately conducted for the reason of the.value of the properties. From this period, historians say that the cadastre began.
Now, does “sea parcel” also have value? Obviously it does. The value of sea parcel and the value of coastal and marine areas have brought about the conflict of interests, and as it is said, it has taken place since as old as the human coastal and marine civiliza-tions. But, how could one estimate it? It will be discussed in the next section. On the other hand, the economic valuation of coastal and marine areas was not also new since Turner et al. (1998) introduced it. Nonetheless, it is a newborn within a marine cadastre.
2.1. a.Broad.sense.of.a.marine.Cadastre.(operational).definition.Enough, it is as much as necessary having definitions of the marine cadastre! Does it really enough? Among them not many do the definitions share a common element with their land-based counterparts and concern with the value, except the definition given by the U.S. DOC: United States Department of Communication–NOAA: National Oceanic and Atmospheric Administration (2002):
“The U.S. Marine Cadastre is an information system, encompassing both nature and spatial extent of interests in property, value and use of marine areas. Marine or maritime boundaries share a common element with their land-based counter-parts in that, in order to map a boundary, one must adequately interpret the rel-evant law and its spatial context. Marine boundaries are delimited, not demarcated, and generally there is no physical evidence of the boundary”.

51
The author agrees with this definition, simply because the marine cadastre domain shall share common elements in accordance with the notion of the “coastal area”. A marine cadastre is a cadastre with the object on the territorial sea. It is not possible applying a marine cadastre in the Exclusive Economics Zone (EEZ), because there is no tenure system in this zone and EEZ is not the territorial sea of a state (Rais, 2002; UNC-LOS, 1982).
The territorial sea means the coastal zone up to 12 nautical mails away from the shore line. Well, then what really means, that the domain of a marine cadastre shall include the two of one inseparable area, the shore (shallow) water space and the sea (deeper) water space. The classification of the two inseparable areas is needed, because it will affect the different type of tenureships system with different types of 3R (right, restric-tion, and responsibility):
– The “shallow” shore water space is a fragile area, firstly, it is perceived in physical and environmental aspects and secondly it is legal and socio-economical as-pects as well; it is tightly connected to the shore land tenureships system; and on the other hand
– The “deeper” sea water space is the territorial water space outside the shore wa-ter space which is usually not bonded to land-based tenureships system.
Again, one more question, does it really enough? No, it does not. Among the marine ca-dastre definitions not many do the notions consider the.value of marine areas, except the U.S. DOC-NOAA’s. The value is one of extremely important parts of the marine cadastre:
– Today, the world’s population in coastal zone is equal to the entire global popu-lation in the 1950s (Beukenkamp and Gunter et al. in World Coast Conference, 1993); – In 30 years more people will live in the world’s coastal zones than are alive today (NASA 1994); – Up to 75% of the world population could be living
Figure 1: The Coastal Areas (soft pink) according to Pernetta and Milliman, 1995.

52
within 60 km of shoreline by 2020 (Edgren in World Coast Conference, 1993); – Two third of the earth surface is water, and one third is land, whilst the interface between the land and the sea is a narrow path called the coastal area;
– Indeed, the coastal area is only 15% of the land surface, but 50–70% men living and working in this area; – Although the coastal area is only 8% of the total earth surface, it produces 26% global biological outcomes, especially fisheries’ prod-ucts (Rais, 2002).
Considering all those arguments, here it comes to the “operational” definition of a ma-rine cadastre:
“A marine cadastre is a public administration system arrangement, managing le-gal and administrative documents, encompassing both natural and spatial extent of interests in forms of rights, restrictions, and responsibilities, including the values, taxes, and the legal relationships and actions, within the shore water and the sea water space tenureships”.
2.2. sea.parcel.valuation.What is a sea parcel? A sea parcel is a (usually three dimensional) space at the sea, which is identified by: (a) delineation of its clear boundaries (coordinates); (a) explanation of its quantity (the area); (c) declaration of its right; and (d) statement of its use. A sea parcel could be an object that has a.sale.value, it could have a.service.value (public access, marine tourism, shipping lane, national park, marine protected area, conserva-tion area); and it could also have an economic.value (after Rais, 2002).
When it comes up to the land or property valuation, then some approaches are com-monly used, those are:
(a) Sales comparison (market) approach: the estimated amount for which an asset should exchange on the date of valuation between a willing buyer and a willing seller in an arm’s length transaction after proper marketing wherein the parties had acted knowledgeably, prudently and without compulsion;
(b) Income capitalization approach: the current value of future yearly net income remaining value at the end of the calculation period; This method uses income approach by projecting all future incomes deducted by operational costs with the return of investment calculation; This approach is especially suitable for the valuation of hotels, offices, apartments, malls or shopping centers, and enter-tainment sites;
(c) Cost approach: estimation of the costs spent for procurement and development the valued property, usually for valuation of buildings;
(d) Development technique: similar to cost approach.
But, when it comes to the valuation of a sea parcel, it is not the case that those methods could straightforwardly be applied. In the marine environments, the value of the parcel is usually tricky, because it is not the land that could “easily” be assessed. Except for the “sea parcel” located at the shore water space, when the tenure system tightly as-sociated with land-based tenureships or ownerships, and as long as it is available the market data, then the sales comparison approach might be used.

53
Among other methods, the sales comparison approach are widely used for some rea-sons, such as: (a) most efficient for property and resource valuation; (b) acceptable for all parties; (c) used by most states in the world; (d) transparent and fair enough; (e) many actors involved in determining the market value; and (f ) simple, easily under-stood, and not too expensive.
Unfortunately, it is not the case that the market data are available, especially for the sea parcel that has no association with land-based tenureships. The valuation approach suggests is the.combination of income capitalization approach, cost approach, and development technique that could be summarized as the Financial Valuation Method (FVM). It is proposed with the arguments that a sea parcel (even though it is contained natural resources there in), the parcel remains “a dead capital” without human interven-tion or development.
The usage of the Capital Budgeting Method (CBM), as a tool in the financial valuation method (Dixon and Hufschmidt, 1986), which is still widely used today, is to calculate NPV (Net Present Value), B/C ratio, and IRR (Internal Rate of Return). The value of a sea parcel will be the NPV, obtained from the calculation as follows:
– C (investments): costs spent for all human activities and the structures built on the sea parcel;
– B (incomes): all revenues expected to be gained during the developments, ac-tivities, and uses of the sea parcel;
– Net Benefit = (Incomes – Investments)– Today Value: the existing resources value of the sea parcel– Cash Flow = (Net Benefit + Today Value)– DR (Discount Rate) = %
– DF (Discount Factor) =
1(1 ) year thDR+
– PV (Present Value) = Cash Flow * DR– npv.(net.present.value):
1( ) ( )
(1 )d d e e
t
B C B C MNPVr
− + − −=
−
.
0 0 1 1 2 22 2
( ) ( )( ) ( )1 (1 ) (1 ) (1 )
n nn
B C B CB C B CNPVr r r
− −− −= + + +
+ + +�
– Net B/C (Benefit & Cost Ratio) = (1 )/ 1
(1 )
ttn
n t
BrB C ratio t Cr
+− = =
+
– IRR (Internal Rate of Return) = ( ) NPVIRR i i iNPV NPV
++ + −
+= + −−
2.3. Coastal.and.marine.area.valuation.The sea parcel valuation discussed above is the parcel-based valuation approach, but when it moves towards the coastal and marine area valuation, then it is no longer par-cel-based but area-based method. The valuation approach, therefore slightly different, meaning that the formula used is the same, but the components of the valuation consist

54
of wider items, not only takes into account the financial (market) values, but also non-market values. It does not only count the use values, but also non-use values as well.
Within the environmental studies, the method is called: Total Economic Value (TEV) ap-plying the formula as follows: (Turner et al. 1998; Kusumastanto, 2002)
By using the same formula above, the NPV, as the value of coastal and marine area, could be calculated, as well as all other components, i.e. Net B/C-R and IRR.
(TEV) = (DUV + IUV + OV) + (EV + BV)
DUV = Direct Use Value: output (goods and services) that could directly be used IUV = Indirect Use Value: goods and services that could not be directly used OV = Option Value: direct and indirect resources potencies that could be used in
the future with the assumption that the resources will not permanently dev-astated;
BV = Bequest Value: the value associated with protection and conservation (pres-ervation) certain resources that could be inherited to the next generations, so that they are able to take the advantages from the resources that have been taken by the previous generations;
EV = Existent Value: existing value of the resources, irrespective of whether the benefits of the resources could be taken directly or indirectly.
The TEV does usually not take the land value into consideration but socio-environmen-tal and resource-economical ones. In case that the assessment acquire the land value as a part of the component, i.e. as a part of DUV, especially when assessing the coastal (shallow sea water) areas, then the method as well as the value is named: total.asset.value (TAV).
3. a.Case.study.The main goals of the case study are two folds: firstly, to exercise the calculatio2n of NPV as the value of the coastal and marine area, and secondly, to demonstrate how the simulation could give a picture that a marine cadastre is able to contribute to the sound management of coastal and marine spaces and resources.
Over thirty years since 1970’s, the coastal and marine areas in Bintan Islands have been exploited for the development reasons and or the impact of the developments. There had been under way the sea sand mining and the mangrove and coral reef devasta-tions. Sea sands were exported to Singapore islands for “filling” the sea water (some say “reclamation” as a misleading term) of its shores, so the islands become wider. The Singapore’s sea-sand imported needs are amazingly huge: i.e. (a) 1.1 trillion cubic me-ter for Jurong Island, (b) 900 million cubic meters for Western Island, (c) 400 million cubic meters for North Island, (d) 300 million cubic meters for Changi Bay, (e) 200 million cubic meters for Pulau Tekong; These number will be added by the needs for Pasir Panjang Phase II as many as 150 million cubic meters, Tuas needs 40 million cubic meters, Pulau Sentosa needs million cubic meters, and Pungol needs10 million cubic meters (KOMPAS, 29 November 2002).
Twenty years ago, the total areas of Singapore lands = 527 kilometer squares, but in 1991 became 633 kilometer squares, in 1998 became 674 kilometer squares, in 2001 became

55
no.. eConomIC.Costs. million.€. no.. eConomIC.BeneFIts. million.€.A program.and.development. (the 0th year) A DUV: Direct Use Value (the 0th year) 1 Fisheries & marine affairs 0.48 1 Landing fisheries 3.48 2 Tourism & telecommunica-
tion 0.87 2 Maritime industries 40.43 3 Environment & spatial plan-
ning 3.21 3 Eco-tourism 2.10 4 Industries 0.44 4 Sea transportation 4.30 5 Transportation & public
works 9.07 5 Supported services 0.16 6 Transportation 0.88 6 Tourist spending 171.74 B The Value of Resource Dev-
astations 7 Investments on maritime in-dustries 161.48
1 Mangroves 98.23 B IUV (Indirect Use Value) 2 Coral reefs 138.93 1 Mangrove functions 31.11 3 Sea sand mining 295.96 2 Coral reef functions 2.73
C NON-USE VALUE C.1 OV (Option Value) 1 Biodiversity mangrove 0.05 2 Biodiversity coral reef. 0.06 C.2 EV (Existent Value) 1 Existent mangrove 7.07 2 Existent coral reef 8.82
1 DR = 8% (takes the inflation rates during 6 years lately (Bank of Indonesia 2000–2005)
Table1: Analysis of existing TEV of coastal & marine policy; Bintan Island, Riau Islands Regency, Indonesia.
C.3 Bv.(Bequest.value).1 Mangrove preservation 19.25 2 Coral reef preservation 25.10
TOTAL ECONOMIC COSTS 548.07 total.eConomIC.BeneFIts. 477.88 NET BENEFITS –70.18.CASH FLOW –70.18.DR (r) 0.08.DF=SOCC (8 %) 1.0.PV –70.18.npv(8%,B37:K37) –64.36. –.69.51. SUM(B42:K42) EIRR –1.18%. (Neg) Net B/C 0.01.NPV + 0.0 –12.86. (Neg) Even though with DR (r) = 0% EIRR Simulation void. NPV is still negative

56
760 kilometer squares, and up to the year of 2010 targeted to become 834 kilometer squares (KOMPAS, 21 October 2003; WALHI Riau, 10 September 2004). There are many questions remain: i.e. does any body may stop this? What are the environmental impacts caused by the change of the shore lines? How much is the (economic, environment, and social) lost suffered by the citizens and the states caused by the sea-sand mining? How does this changing of Singapore’s shore lines affect the position of sea boundaries to In-donesian and Malaysian territorial seas? The last question can be answered directly. Ac-cording the UNCLOS 1982, it is the sovereignty right of a coastal state to develop its shore up to its territorial sea boundary, but it will not affect the boundary. Once the boundary has been agreed and stated between two (or more) neighboring countries, then it won’t change, unless otherwise agreed and stated by them.
The components of existing TEV are as follows:
1. Economic Costs, consist of:
a. Local Government Budget: APBD fiscal year 2005;
b. The total (economic, environment, and social) lost suffered by the citizens and the state since 1970s is approximately: – €290.9 million caused by the sea sand mining; – €98.2 million caused by the devastation of 10,600 hectares man-groves; and – €138.9 million caused by the devastation of 12,654 hectares coral reefs (Toepler, 2005; DKP, 2003; WAHLI Riau, 2005, Bintan Islands Mining Division, 2005).
2. Economic Benefits, consist of:
a. duv: Direct Use Value, is the Gross Domestic Products 2005 of the coastal and marine sectors; tourists spending in 2005; and maritime industries up to the year 2005;
b. Iuv: Indirect Use Value, based on the research conducted by Global Environ-ment Facility/ United Nations Development Program/International Maritime Or-ganization (GEF/UNDP/IMO) Regional Programme for the Prevention and Man-agement of Marine Pollution in the East Asian Seas in the Malaka Straits (Chua, Thia-Eng, 1999), the values are: – The function value of spawning and nursery ground by mangroves = 50% total fish landings; – The function value of seques-tration carbon by mangroves = €1,598.24/ hectare; – The function value of ero-sion prevention by mangroves = €172,374.00/ hectare; – The function value of organics and sequestration carbon in the coral reefs = €158.36/ hectare; – The function value of shore lines prevention by coral reefs = €469.68/km;
c. ov: biodiversity values of mangroves and coral reefs = €13.24/ hectare;
d. ev: €1,903.32/hectare for mangroves, €2,093.64/ hectare for coral reefs;
e. Bv: €1,916.56/ hectare for mangroves, and = €2,093.64/ hectare for coral reefs.
From the TEV calculation, it is shown that with the existing coastal and marine policy, the value of the zone (NPV) is – €64.36 million (with DR = 8%). And even though the DR (r) is reduced into 0%, the value is still – €12.86 million. Next, as a comparison, it will be simulated as if the concept of a marine cadastre was applied to the coastal and marine policy. The results are shown in Table 2 below.

57
Table 2: Simulation Analysis of TEV HBU (Highest & Best Use) of coastal and marine policy in Bintan Island, Riau Islands Regency, Indonesia.
NET BENEFITS –67.00 CASH FLOW –67.00 DR (r) 0.08 DF = SOCC (8 %) 1.0 PV –67.00 npv(8%,B37:K37) 277.93 300.16 SUM(B42:K42) EIRR 33.03 % Net B/C 5.48 NPV + 33.0 0.11 NPV – 33.1 (0.23) EIRR Simulation 33.00 %
Interpretation of “ex-post” (existing coastal and marine policy) and “ex-ante” (coastal and marine policy with a marine cadastre):
a. The existing coastal and marine policy is inconsistent to the spatial planning, it is only good in the paper but it is bad in the implementation. Within this policy, there is no control on the use of coastal and marine spaces. On the other hand, through the administering and law enforcement of 3R: rights, restrictions, and responsibilities on coastal and marine spaces (the implementation of a ma-rine cadastre), it is shown the distinct tracks towards the achievement of “good ocean governance”: the EES: economical objectives, ecological objectives, and social objectives;
b. NPV 2005 values €277.93 million and €300.16 using different formulas. This val-ues continue increase as they are represented by NB and PV values, although they start with initial negative value (-) €67.00 million at the 0
th
year (2005), but by the 9
th
year (2014) each value reaching €198.94 million and €96.34 respec-tively (the complete TEV assessment that demonstrates the ten years calculation periods is not shown/attached in this paper).

58
c. EIRR (Economic Internal Rate of Return) value reaches 33.03 % together with EIRR simulation = 33.00 %, and Net B/C value = 5.48;
d. Result conclusions: NPV > 0, B/C-R > 1, and EIRR > DR (r), therefore the simulation approves that running the coastal and marine policy through implementing the marine cadastre concept is strongly feasible.
By using a dynamic modeling tool, STELLATM
v.4.2, the two NPVs are then simulated as it is shown in the Figure 2 below. During ten years of the policy implementations, the graph of the NPV’s existing policy (ex-post) indicates the negative values (below zero), whereas the Marine Cadastre policy (ex-ante) shows the positive values, even though the two PVs (Present Values) start with the same negative values from the 0
th
year (see Table 1 and 2).
Figure 2: The NPV graph: the existing policy’s (ex-post) versus the policy with a marine cadastre’s (ex-ante) simulated by STELLATM v.4.2 dynamic modeling.
4. ConCludIng.remarks.
There are two things are often not considered in the discussion of a marine cadastre concept, those are: the common elements with the land-based counterparts and the value of sea parcel and the coastal and marine area. A broad sense of a marine cadastre concept should have: (a) a clear differentiation between “sea parcel” that has direct as-sociation with “land based” tenureships system (i.e. sea parcel at the shore or shallow water, both the sea parcel that directly “stands” on the shore-water bed, and the sea parcel that becomes one inseparable part with the shore-land tenureships or owner-ships); (b) a contain of the value of the sea parcel; and (c) a contain of the value of the coastal and marine area.
The method to assess the value of the sea parcel and the coastal and marine area could be offered as follows:

59
(a) sales.Comparison.approach, or other three methods, for the land-based.sea.parcel;
(b) Financial.valuation.method for the sea.parcel that has no association with the land-based parcel or the land-based tenureships or ownerships; and
(c) total. asset.valuation (TAV) for coastal. areas when takes the land value as a part of DUV components, and total.economic.valuation (TEV) method for the coastal. and. marine. zones when considers the socio-environmental and resource-economical values are the main components.
The simulation of the implementation of a marine cadastre concept in the case study re-gion provides a picture, that the marine cadastre has forceful contribution in the sound management of coastal and marine resources and areas, which ends up to the three de-velopment objectives: economical objectives, ecological objectives, and social objectives.
reFerenCes.(seleCted).
Bowen, Robert E. 2003. Socio-Economic Indicators and Integrated Coastal Management. Environmental, Coastal, and Ocean Sciences (ECOS), University of Massachusetts, Bos-ton, MA 02125, USA. http://www.elsevier.com/locate/ocecoaman
Burke, Lauretta, Liz Selig, Mark Spalding. 2002. Reef at Risk in Southeast Asia, UNEP-WCMC, Cambridge, U.K.
Canning, Robert, Paul Gilliland. 2003. The Elements of Marine Spatial Planning: Key Drivers and Obligations. In “Spatial Planning in the Coastal and Marine Environment: Next Steps to Action”. A CoasNET Conference, 1 October 2003, SOAS, University of London, UK.
Chua, Thia-Eng. 1999. Total Economic Valuation: Coastal and Marine Resources in the Straits of Malacca, GEF/UNDP/IMO, Quezon City, Philippines. Cicin-Sain, Biliana, Robert W. Knecht. 1998. Integrated Coastal and Ocean Management,
Concepts and Practices. Island Press, Washington DC. Clark, John R. 1992. Integrated Management of Coastal Zones. FAO, Rome. Cockburn, Sara, Susan Nichols. (2002). Effects of the Law on the Marine Cadastre: Title,
Administration, Jurisdiction, and Canada’s Outer Limit. Paper presented at FIG XXII Inter-national Congress, Washington, D.C. USA, April 19-26.
Dixon, John A., Maynard M. Hufschmidt. 1986. Economic Valuation Techniques for the Environment: A Case Study Workbook. The John Hopkins University Press, Baltimore and London.
Giupponi, C. 2001. From the DPSIR Reporting Framework to a System for a Dynamic and Integrated Decision Making Process. Paper presented at the MULINO Conference on “Euro-pean Policy and Tools for Sustainable Water Management”, 21-23 November, Venice, Italy.
Haslett, Simon K. 2000. Coastal Systems. Routledge Taylor & Francis Group, London.Kay, Robert, Jackie Alder. 1999. Coastal Planning and Management. Routiedge, New York. Kronvang, Brian, Soren E. Larsen, Jens P. Jensen, Hans Estrup Andersen, Kristi Gran-lund.2005. Trend Analysis, Retention, and Source Apportionment. EUROHARP Report No.13-2005, Catchment Report: Eurajoki, Finland. NIVA Report SNO 5004-2005, Oslo, Norway. http://www.euroharp.org.

60
Kusumastanto, Tridoyo. 2002. Indonesia Ocean Outlook 2004 “Laut Masa Depan Bangsa”. PKSPL-IPB dan PT Gramedia Pustaka Utama.
Kusumastanto, Tridoyo 2003.a. Ocean Policy Dalam Membangun Negeri Bahari di Era Ot-onomi Daerah. PT Gramedia Pustaka Utama, Jakarta.
Government of Riau Islands Regency. 2005a. Marine Spatial Planning 2006 – 2015: Plan-ning Repot, Badan Perencanaan Pembangunan Daerah Kabupaten Kepulauan Riau, Tanjungpinang, Juli.
Government of Riau Islands Regency. 2005b. Marine Spatial Planning 2006 – 2015: Data Compilation, Badan Perencanaan Pembangunan Daerah Kabupaten Kepulauan Riau, Tanjungpinang, Desember.
Government of Riau Islands Regency. 2005c, “Data Compilation of Economics Perform-ance”, Badan Perencanaan Pembangunan Daerah Kabupaten Kepulauan Riau, Tanjung-pinang, Desember.
Rais, Jacub. 2002. “Marine Cadastre” in Indonesia, a Marine Area Management Concept. Makalah pada Seminar Sehari tentang Marine Cadastre, Departemen Kelautan dan Perikanan, Jakarta.
Rais, Jacub dan J.P. Tamtomo. 2005. Ambalat Block: a“Misleading” Public Opinion? “Make Marine Cadastre Not War”. KOMPAS, Senin 11 April: p. 48.
Marseli-Libelli, Stefano, Francesco Betti, Susanna Cavalieri. 2003. Introducing River Mod-eling in the Implementation of the DPSIR Scheme of the Water Framework Directive. Uni-versity of Florence, Italy.
Picollo, Andre, G. Albertelli, S. Bava, D. Verardi, S. Coppo. 2003. The Role of Geographic Information System (GIS) and of DPSIR Model in Ligurian Coastal Zone Management. Uni-versity of Genova, Italy.
Ruddle, Kenneth. 1992. Administration and Conflict Management in Japanese Coastal Fisheries. FAO-UN, Rome, Italy.
Skibicki, Andrew J. (1995). Preliminary Boundary Analysis of the Greater Pukaskwa Na-tional Park Ecosystem Using the ABC Resource Survey Approach. Occasional Paper No. 6, Department of Canadian Heritage, Parks Canada, National Parks.
Tamtomo, Johanes P. 2004. The Needs for Building Concept and Authorizing Implementa-tion of Marine Cadastre in Indonesia. 3
rd
FIG (Federation Internationale des Geometres) Regional Conference, Jakarta, Indonesia, October 4-6.
Turner, R. Kerry, W. Neil Adger, Irene Lorenzoni. 1998. Towards Integrated Modeling and Analysis in Coastal Zones: Principles and Practices. LOICZ Reports & Studies No. 11. LOICZ International Project Office, Netherlands Institute for Sea Research, Texel, Netherlands.
University of Melbourne. 2000. The Concept Diagram of a Marine Cadastre. Melbourne, Australia.
University of New Brunswick. Fredericton. 2003. Report on the Outcomes of the UNB-FIG Meeting on Marine Cadastre Issues. Canada.
[U.S. DOC]: United States Department of Communication – NOOA: National Oceanic and Atmospheric Administration. 2002. U.S. Marine Cadastre. http://www.csc.noaa. gov/mbwg/htm/cadastre.htm

61
Vàzquez, J. Feàs. 2003. A Methodology for Policy Analysis in Water Resources Manage-ment. FEEM: Fondazione Eni Enrico Mattei, Venice, Italy. WALHI Riau.04. The greedy natu-ral resources management. http://www.walhi.org.id/
BIograpHICal.notes.
The author earned his master degree in Land Management at the Department of Geod-esy and Geomatics Engineering, the University of New Brunswick, Fredericton, Canada. He is now completed his doctoral degree at the Coastal and Marine Resources Man-agement Study, Faculty of Fisheries and Marine Affairs, Bogor Agricultural University, Bogor, Indonesia. The author serves as Director of Land Potency Survey, National Land Agency, the Republic of Indonesia, Jakarta. The author also serves as General Secretary II of Indonesian Federation of Surveyors (ISI) 2005–2009.
aCknowledgement.
The author kindly expresses many thanks to Prof. Dr. Tridoyo Kusumastanto (head of the supervision commission) and all the members of the commission: Prof. Dr. Jacub Rais, Prof. Dr. Maria S.W. Sumardjono, and Dr. Mennofatria Boer, the excellent persons who guide him to the completion of his doctoral degree. He also gratefully thanks to all persons and institutions can not be mentioned one by one, but Head of the National Land Agency, the Republic of Indonesia, Deputy of Land Surveying and Mapping all together with the Directors and Officials, and the KAPTI DKI Jakarta’s members, last but not least, all friends in Bintan Land Offices, are extraordinary persons who support and contribute to the completion of the author’s works.
ContaCts.
Johanes P. Tamtomo Director of Land Potency Survey National Land Agency – the Republic of Indonesia Jl. Kuningan Barat I No. 1 Jakarta, 12710 INDONESIA Tel. + 62 21 520 2328 and 520 7030 Fax +62 21 526 0516 Email: [email protected] Web site: http://www.bpn.go.id

62
assessment.and.Future.prospeCts.For.HydrograpHy.In.western.and.Central.aFrICa;.marItIme.saFety.and.Coastal.gloBal.development.dominique.Baggio,.France.
abstract..This article provides some information collected by a team of international hydrographic experts representing the International Hydrographic Organisation (IHO) Eastern Atlantic Hydrographic Commission (EAtHC). Goals of this initiative were to au-dit and advice in West and Central African countries, in order to determine what could be done to improve maritime charting not only for safety of navigation but also for sustainable coastal development in the area.
Conclusions of this international assessment can be reported through three kinds of proposals: −proposals for co-ordination and capability building −proposals for techni-cal assistance −proposals for agreement (SOLAS).
Three main phases for developing hydrographic surveying and nautical charting ca-pabilities are given. An international definition study for “maritime highways” from Gi-braltar to Congo, called CHARMER
1
is going to be carried out. It will be an opportunity to protect coastal sensitive areas and also simultaneously to develop hydrographic ca-pabilities for coastal states. At the same time, the project COAST CHART intends to de-terminate an exact coast line from Senegal to Congo. Lessons learned this experiment could be applied to other maritime areas of the world.
key. words: Hydrographic and maritime charting, Africa, EAtHC, CHARMER, COAST CHART.
1. tHe.new.solas.ConventIon.and.tHe.west.aFrICan.needs.
The International Maritime Organization (IMO) has revised the ‘Convention on Safety of Life at Sea’ (SOLAS). A newly revised chapter V was adopted in December 2000, enter-ing into force on 1 July 2002. This revision details the obligation of maritime states to provide hydrographic services. Rules 4, 9 and 31 chapter V (appendix1) are the most significant and respectively describe navigational warnings, hydrographic services and danger messages. Taken as a whole, governments of maritime nations are now obliged to take all necessary steps to collect, handle, disseminate, and keep up to date nautical information and hydrographic services necessary for safe navigation in their waters.
In many African states, such “hydrographic services” are provided by European coun-tries with which strong institutional links have been established. Countries like Spain, France, Portugal and the United Kingdom keep nautical charts and publications up-dated, based on data collected by the African states concerned. Unfortunately, much of the data displayed on these charts go back more than 40 years and, therefore is in-adequate for the current requirements of international maritime navigation, protection of the environment or exploitation of resources.

63
At the sixth and seventh meetings of the Eastern Atlantic Hydrographic Commission (EAtHC), in June 2000 and October 2002, the present situation was deemed worrying by the participating Member States of the IHO, Associate Members of the Commission and Observers. As a result it was decided to create a team of experts in hydrography, marine cartography and nautical information, tasked to visit countries where a lack of surveys, charts and nautical information has been identified, provided that the coun-tries concerned would welcome such a visit. This team became known as the West Afri-can Action Team (WAAT). The aim of the visit would be to assess national hydrographic capacity with a view to offering advice to the relevant national authorities on how to improve the collection and dissemination of nautical information in the region and engender progress through regional co-operation.
2. tHe.tHree.pHases.oF.HydrograpHIC.CapaBIlIty.development.and.tHe.oBlIgatIon.to.FormalIZe.tHe.proCess.wItH.BIlateral.agreements.
Generally, the development of a national capability can be examined in three phases (appendix2):
– The first phase, the most urgent and easiest to implement, consists of organizing the collection and circulation of nautical information, necessary to maintain and update existing charts and publications. Such an organisation brings together all the institutions involved in maritime activities. It provides an immediate ad-vantage to international shipping and allows for real integration of the country into the World-Wide Navigational Warning Service (WWNWS).
– Logically, the second phase is the creation of a hydrographic survey capability, first to collect data in the coastal zone where the needs are usually the most pressing. Generally, a small structure is sufficient to collect the data required for most coastal projects e.g. surveys to assure port access. Cartographic exploita-tion of such new surveys can often best be handled by the historical charting authority.
– The third phase consists of the acquisition of the means to produce charts and publications independently. This phase cannot be achieved hastily, and will be facilitated by close co ordination with the historical charting authority. This phase requires not only human and financial resources, but also a capacity to distribute world-wide the documents and the capability to keep them up to date.
While the first phase is relatively inexpensive and the most easily implemented, phase two requires longer term planning because training and equipment acquisition are required. The cost of implementing phase two is low compared to total harbour rev-enues. On the other hand, the third phase, requires more human and financial invest-ments, and takes longer to implement. This phase can usually be subcontracted to an existing hydrographic office, at least during the transition period.
While not specifically spelled out in Chapter V of the new SOLAS convention, contract-ing governments are by default required to formalize the process, due to their new responsibilities. Writing and signing technical arrangements at the national level is nec-

64
essary to clearly define the disposition of data, especially national holdings that are to be made available to a foreign government.
3. tHe.vIsIts.
The French Naval Hydrographic and Oceanographic Service (SHOM), in charge of co-ordinating the project, invited all the littoral states in West Africa, from Morocco to the Democratic Republic of Congo, to consider accepting a visit from the team of hydro-graphic experts. Seventeen nations responded positively, and sixteen have been vis-ited in four trips made between the fall of 2002 and the spring of 2004 (table 1). The team comprised of members from those nations which have charting responsibility in the region (France, UK and Portugal) and a representative from the US.
All the visited countries are members of IMO and many of them are members of Mari-time Organisation of West and Central Africa (MOWCA) and Port Management Associa-tion of West and Central Africa (PMAWCA).
In most cases, the team was able to meet local people at three different levels:
− at the highest level, with Ministers or Permanent Secretaries, where it was pos-sible to sensitize the government to their responsibilities and highlight the im-portant contribution that can be made by hydrography to development of the maritime arena.
− at the management level, with officials and managers of the government or port authorities who play a key role in planning, funding and overseeing maritime af-fairs. It is this level of management that will play a key role in implementing most of the follow-on actions provided in the Country Reports.
− at the practical level, with those individuals (Port Surveyors and Harbour Mas-ters) who appreciated encouragement, advice and support in their work.
4. general.overvIew.
The team was struck by how different the maritime situation of each country visited was from another (table 1). In many cases the authority with overall responsibility for safety of navigation had not been long established, and often division of areas of re-sponsibility between Port Authorities, National Maritime Authorities and Naval Forces were not entirely clear.
In many of the countries visited, the determination of maritime borders is still ongoing. Discussions with authorities of the various countries gave the WAAT the opportunity to explain the importance of modern hydrographic surveys and subsequent marine charts. Unlike land borders, which can be marked with such things as boundary stones or a barbed wire fence, the delimitation of maritime borders is not so easy. The marine chart is the only instrument that can be used to depict marine boundaries. This is true from a practical as well as a legal point of view. Additionally, this also applies to the EEZ delimitation, which is determined from baselines drawn from the coastline.
Maritime defence and security arrangements were generally considered to be a weak area in most of the countries visited. Concerns were often expressed about piracy and other criminal activity at sea. Naval and Coast Guard forces were often found to be

65
under-funded and under-resourced to carry out their tasks and there is a lack of infra-structure to enable adequate coastal surveillance and communications. Hence these forces are generally not in a position to play a strong role in co-ordination of Maritime Safety Information (MSI) broadcasts and Search and Rescue (SAR).
Therefore priority must be given to implement phase 1 of hydrographic development, which could clarify tasks and responsibilities of the various involved players and iden-tify a focal point for collecting and disseminating Maritime Safety Information (MSI)
5. detaIled.sItuatIon.and.proposals.For.CapaCIty.BuIldIng.
5.1 National Hydrographic Committee or Maritime Safety Committee
The visits helped draw attention to the importance of hydrography to the develop-ment of a maritime state. It was well understood at all levels that a high-level group could easily be created to study hydrographic matters within the broader context of maritime safety and security issues. Besides problems of coastal erosion in many coun-tries, as well as offshore oil production in others, it was noted that maritime security, particularly in response to the threat posed by piracy and criminal activity, was a major concern and appeared to dominate the agenda. The team drew attention to the new SOLAS regulation regarding the government’s responsibility to provide hydrographic services, noting that the only hydrographic capability very often resided in the Port Au-thority. This emphasized the need for high-level co ordination and planning in order to
Country. IHo..member..
Imo.member.
Iala.member..
eatHC.member.2.
nHC3.
.proposed.phase.1.
Capacity.phase.2.
Capacity.phase.3.
Capacity.Cap.verde. No Yes No Assoc M Yes Partial No No mauritania4. Pending Yes No Assoc M No No No No senegal. No Yes Yes Assoc M Yes Partial Yes Partial the.gambia. No Yes No No Yes Partial No No guinea-Bissau. No Yes No No Yes No No No guinea. No Yes No Assoc M Yes Partial Partial No sierra.leone. No Yes Yes No No No No No ghana. No Yes Yes Assoc M Yes Partial Partial No togo. No Yes No No Yes Partial No No Benin. No Yes Yes Assoc M Yes In process Yes No nigeria. Yes Yes No Member Yes Partial Partial Partial Cameroon. In
progress Yes Yes Assoc M Yes Partial Yes No
equatorial.guinea. No Yes Yes No Yes No No No gabon. No Yes No No Yes Partial Partial No Congo. No Yes No No Yes Partial No No d.r.C. No Yes No No Yes No No? No 2 Eastern Atlantic Hydrographic Commission 3 National Hydrographic Committee 4 Mauritania membership pending deposit of adhesion
Table 1: Assessment of National Hydrographic Capability.

66
make the most of limited resources in developing a national hydrographic service. The defence forces invariably have a role to play in this high-level body; always as expert users of hydrographic data, and sometimes as qualified surveyors. In countries with offshore oil production, it appears that the collection of hydrographic and other MSI data from the private oil companies is not effective. Participation by an expert of the main petroleum companies to the National Hydrographic Committee and/or Maritime Safety Committee is advised. A suggested Terms of Reference and tasks for a national maritime safety committee is suggested (appendix 3).
5.2 Potential for Development of National Capability, or for Improved Liaison with Co ordinating Authorities
Countries generally expressed a desire to improve the safety of navigation in their waters and to build a national hydrographic capability to serve their needs into the future. The team was careful to emphasise that the development of a national capa-bility must proceed in logical steps, the first of which is to have an organisation that can deal with the collection and dissemination of nautical information. In most cases there was a great deal of important safety information that was known locally but not transmitted to the correct authority for navigational warnings or charting action. The most logical focal point was normally the Harbour Master’s organisation, however, information in the coastal waters was often gathered by other agencies such as the Navy or Fisheries Department or the Energy Department in case of oil producing na-tions. Hence the need for improved co-ordination between these types of authorities clearly exists.
In some of the countries Port Surveyors represented the only national hydrographic experts and were generally identified as the logical base upon which to build a national Hydrographic Service. In the some countries, having several trained hydrographers to monitor subcontracted hydrographic surveys seems to be a pragmatic and practical approach. Tasks beyond the port limits need to be identified and prioritised before con-sidering what additional trained personnel are needed and what equipment should be purchased. Several issues arise that need close co-ordination between authorities. For example, wrecks outside of the port limits are usually the responsibility of the National Maritime Authority, but the Port Authority, or the Navy, might have the only means to find and position them. Once again, co ordination and communication is the key to building an effective organisation.
5.3 Regional Co-Operative Opportunities The differences between each country (language, political situation, capabilities…) seem to outweigh a regional approach. Except in very few cases this regional concept has not been successfully explored.
Equally, there must be a degree of political and economic stability within a region be-fore joint initiatives can be launched between neighbouring countries. Nevertheless some cooperation exists and more should be developed: – one example is Mauritania, Senegal, and The Gambia using complementary and unique means, i.e., the sharing of a buoy tender and a dredger -the Tema radio coastal station, could broadcast informa-tion towards neighbouring countries and mariners.

67
Developing the first phase of hydrographic services could be an opportunity for re-gional co operation between the identified agencies, for instance under the aegis of EAtHC.
5.4 Training The team provided information, whenever appropriate, on training which is available in North America and Europe, including the International Maritime Academy in Trieste. The Regional Maritime Academy in Accra, Ghana, is one example of a potential location for regional hydrographic training in the future.
5.5 Funding In general, some of the revenues from the port fees could and should be reinvested in the maintenance of the fairways and buoys.
Moreover, many sources of incomes from maritime activities could be made available (for example fishing and off-shore exploration) and some financial aid might be found which could be linked to those activities. Funding for the pursuit of hydrography and charting in and of itself is not attractive to donor organizations. However hydrography is a necessary first step for many needed maritime projects, (e.g. buoyage, environmen-tal protection, fishing, aquaculture, etc. and of course infrastructure development).
5.6 Examples Of Propositions And First Results The seventeen visit reports show more than 120 proposals which can be listed in three categories:
− Proposals for co-ordination and capacity building; they can in general be con-ducted at national level. The main items are: National Hydrographic Committee, MSI organisation and GMDSS, reversion from hydrographic initiatives benefits, and establishing a hydrographic capability (phase 2).
− Proposals for assistance; the main matters are: training, equipment and funding; they can involve a foreign country. Training opportunities are usually not a prob-lem.
− Follow up actions:
− formation of a National Hydrographic Committee
− provision of hydrographic services in accordance with SOLAS
− encouragement of effective and timely collection and promulgation of hy-drographic information (easy to set up)
− encouragement of development of a Hydrographic Capability − clarifica-tion through bilateral agreement of the way SOLAS commitments are en(d)forced
Positive results have already come to light: examples:
− Cape Verde has strengthened links between the Port Authority and the Portu-

68
guese Hydrographic Office; 7 actions are now ongoing, initiated by the Cape Verde Minister of Infrastructures and Transportation
− Morocco, Mauritania and Senegal have sent representatives to visit SHOM and NAVAREA II coordination centre in Brest,
− France and Senegal have entered into an agreement in order to address respon-sibilities as outlined in the new SOLAS Convention
− Togo has formed a national hydrographic committee and such a committee is under development in Nigeria
– Benin and Nigeria are receiving hydrographic training in France and in United Kingdom
− Cameroon will apply for joining the IHO.
At the same time American survey ships LITTLEHALES and HENSON and French hydro-graphic ships LAPÉROUSE and BORDA have recently surveyed off some main ports.
After these visits, the 8th EAtHC conference took place in Brest in October 2004 and was an opportunity to strengthen links between the maritime countries in hydrographic and maritime charting matters and to prepare future. A technical workshop concerning SOLAS and MSI was planned to coincide with this conference and was an opportunity for a major initiative: a definition study called “CHARMER” (Cooperation in Hydrography for African Reliable Maritime Electronic Routes).
6. CHarmer.proJeCt.
This project federates the majority of the other recommendations and the other cur-rent decisions from the 8
th
EAtHC, in order to insure maritime safety in this area of the world, and to take into account submarine and coastal resources. The ships traffic be-tween Cap of Good Hope and Europe is very important; the traffic between Cap of Good Hope and the Gulf of Guinea is increasing. Moreover off-shore maritime oil activ-ity is also dramatically increasing in the Gulf of Guinea.
This project has a deliberately wide scope in order to insure coherence of all the actions and the necessary national and international coordinations due to geography and also to the technical characteristics of means used. This extended scope also improves the search for savings by avoiding the redundancy of means and or their incompatibility.
The specific objectives of this complete project are:
− to increase the safety of navigation by assessing the risks of catastrophic acci-dents and taking action to gradually reduce the risks and prevent accidents by providing suitable hydrographic information
− to assist countries to undertake technical work needed to translate the provi-sions of SOLAS Convention chapter V into national laws and regulations
− to strengthen the capacity of countries to cooperate among themselves in man-aging their common marine and coastal resources
− to build capacity in countries to assess the necessary measures to control hy-drography.

69
These objectives are necessary for other purposes like:
− to build capacity in countries to assess the necessary measures to control ship-based pollution
− to strengthen capacity of countries to improve safety of navigation to ensure that coastal and marine resources are managed sustainably
− to develop financing and institutional mechanisms to sustain capacity of coun-tries to address issues of navigation safety, and to enforce in coordination with other countries laws and regulations governing the shipping and fishing indus-tries.
The project components proposed at this stage are (see details in annexes):
− developing a West African marine highway electronically supported (associated with ashore basic safety maritime means).
− developing the basic national hydrographic services (IHO phases 1 and 2 recom-mendations).
− increase regional coordination and project management in accordance with IMO, IHO regulations and recommendations, and also SOLAS Convention
− developing training of surveyors and regional academy.
These four components are necessary for components other than the HWP; for instance:
− contribute to developing regional coastal environment and oceanographic data centre
− developing search and rescue capacity
− developing regional oil spill contingency capacity.
7. Coast.CHart.proJeCt.
By quite the same time, the COAST CHART project, led by SHOM, as well as the British, Spanish and Portuguese hydrographic services, with the European Space Agency. This project intends to determine an exact coast line from Senegal to Congo, using mainly radar satellite images, and so will provide an input for the updating of the charts of this area. It concerns 6 000 km of coast lines in 15 countries. In a first phase, charts at a scale of 1 / 50 000 will be produced, and later some charts at a scale of 1 / 15 000 derived from optical satellites pictures in complement.
The products of COAST CHART project will be countries disposal which have a hydro-graphic or cartographic responsibilities in these area, in order to be used with their own uses. So charts and maps will be precise and updated. Moreover, they will be compat-ible with works from others local hydrographic or topographic specialised offices be-cause they will use a common geodesic reference: the world system WGS84.
In order to improve precision of the exact coast line, it will need some “ground truth points” to fit with the satellite images. So, the interested African countries, who have capabilities and who which to participate in the project, are invited to give to ESA ex-isting topographic maps concerning sea-side (ports, town….). and to give also GPS data of some details easily identifiable with the satellite images in the area (runways,

70
bridges, crossroads, jetties….). SHOM will be pleased to send to people interested in this project, some proposals with details to be done. Transfer the ground truth points data for the COAST CHART project could be officialised by an agreement with SHOM with the all the details and eventually the confidentiality restrictions.
So many decisions have to be taken at the political level to improve safety life at sea. The first actions could take momentum and eventually snowball. They speak in favour of a reinforcement of coordination and exchanges between hydrographers and survey-ors about the coastal areas. This area has an increasing interest and many ministries are involved in. These experiences could also be applicable to maritime countries in other navigation areas.
ContaCts.
Capitaine de Frégate (r) Dominique Baggio Chargé de mission Bureau études générales SHOM BP 8 29240 Brest Armées FRANCE Tel. + 33 1 53 66 97 85 Fax + 33 1 41 74 94 25 Email: [email protected] Web site: www.shom.fr

71
appendIX.1.
Imo.solas.ConventIon.(safety.of.life.at.sea).(excerpts).CHapter.v,.saFety.oF.navIgatIon.
regulation.4.:.navigational.warnings.Each Contracting Government shall take all steps necessary to ensure that, when intel-ligence of any dangers is received from whatever reliable source, it shall be promptly brought to the knowledge of those concerned and communicated to other interested Governments(1).
regulation.9.:.Hydrographic.services.− Contracting Governments undertake to arrange for the collection and compila-
tion of hydrographic data and the publication, dissemination and keeping up to date of all nautical information necessary for safe navigation.
− In particular, Contracting Governments undertake to co-operate in carrying out, as far as possible, the following nautical and hydrographic services, in the man-ner most suitable for the purpose of aiding navigation:
− to ensure that hydrographic surveying is carried out, as far as possible, ad-equate to the requirements of safe navigation;
− to prepare and issue nautical charts, sailing directions, lists of lights, tide ta-bles and other nautical publications, where applicable, satisfying the needs of safe navigation;
− to promulgate notices to mariners in order that nautical charts and publica-tions are kept, as far as possible, up to date; and
− to provide data management arrangements to support these services.
− Contracting Governments undertake to ensure the greatest possible uniformity in charts and nautical publications and to take into account, whenever possible, relevant international resolutions and recommendations(2).
− Contracting Governments undertake to co-ordinate their activities to the great-est possible degree in order to ensure that hydrographic and nautical informa-tion is made available on a world-wide scale as timely, reliably, and unambigu-ously as possible.
regulation.31:.danger.messages.Each Contracting Government will take all steps necessary to ensure that when intel-ligence of any of the dangers specified in paragraph 1 is received, it will be promptly brought to the knowledge of those concerned and communicated to other interested Governments.
(1) Refer to the Guidance on the IMO/IHO World-Wide Navigational Warning Service adopted by the Organization by resolution A.706 (17), as amended. (2) Refer to the appropriate resolutions and recommendations by the International Hy-drographic Organization Appendix 2.

72
appendIX.2

73
appendIX.3.
suggested.terms.oF.reFerenCe.and.tasks.For.a.natIonal.marItIme.saFety.CommIttee.
tasks.oF.tHe.natIonal.marItIme.saFety.CommIttee.– To acquire official recognition by the Government
– Submit a structure for taking responsibilities for:
∗ maritimesafetyinformation∗ hydrographicsurveys∗ nauticalcharting∗ aidstonavigation∗ oilspillresponse∗ searchandrescue∗ lawenforcementinmaritimezones
– Advise the government on the relevant international standards and the means for achieving them
– Submit to the Government proposals for recovery of revenues and funding of the services
– Advise the Government on the application of relevant international regulations

74
appendIX.4.

75
eConomIC.BeneFIts.oF.HydrograpHy.In.tHe.CanadIan.arCtIC.–.a.Case.study.andrew.leyzack,.Canada.
abstract. Remote communities in the Canadian Arctic are accessed and re-supplied by air and by sea. The latter mode of transportation presents a more cost-effective solution for re-supply and in recent years, an extended navigation season has seen an increase in both cargo and passenger vessel traffic. Traditionally, communities in the Western Canadian Arctic have been re-supplied by barge and tug however deep draught ocean-going vessels are now starting to compete for service to these same communities. The cost savings realised from deep draft vessel re-supply are significant and modern hydrographic surveys are an enabling factor for deep draft access to Arctic trade routes, for both cargo and passenger liners, especially where under keel clear-ance is a concern. Citing case study, this paper will endeavour to illustrate the eco-nomic benefits of hydrography in the Canadian Arctic, with focus on reducing the costs associated with shipping goods and materials.
key.words: Hydrography, Capacity Building, Economic Benefits
1. Foreword.–.tHe.Case.For.arCtIC.HydrograpHy.
Communities throughout the Canadian Arctic are continually growing1. This is clearly evident when we compare the cultural information on hydrographic field sheets and charts compiled from the 1960’s through to the 1980’s with what we see upon return-ing to update hydrography some 20 to 40 years later. Within the Kitikmeot Region, of Nunavut Territory, Cambridge Bay is the largest community and serves as the region’s administrative centre. This community has seen a population growth of 12.8% during the 5-year period between the last two census counts. As of 2006, its population was 1,477 and presently it is unofficially over 1,800, a 22% increase in just 4 years. It has become the regional hub for both air and sea lift cargo service for this part of the Cana-
Figure 1: Vessel Traffic by Port (Kitikmeot Region, NU).

76
dian Arctic, the latter made possible by deep water access (greater than 9 m) and mod-ern charting. With a decade of relatively ice-free navigation throughout the Northwest Passage, Cambridge Bay has harboured the greatest number of sea-going vessels of all other communities within the Kitikmeot Region (see Figure 1). “’Sealift’ is a strategic and vital link for all Nunavut communities and their residents to obtain their annual re-supply of goods and materials needed throughout the year. It remains the most eco-nomical way to transport bulk goods to the arctic. Each year, ocean going ships travel from several southern Canada Ports with a variety of goods ranging from construction materials, vehicles, heavy equipment, house wares and non-perishable items”.2 Since these communities use diesel generators to produce electricity, the need for bulk die-sel to be shipped by barge and tanker is significant. It wasn’t until the first large-scale modern chart, Pelly Bay, was published in 1993 that ice-breaking ships could deliver fuel to Kugaaruk. Prior to this time, the only way for fuel to be shipped in was by air freight. Here, the cost savings were significant.
1.1 Population Growth in Kitikmeot Region3 Communities are listed in order of population as of the last census in 2006. The percent-age of growth is based on a five year period between 2001 and 2006:
Table 1: Growth by Community (Kitikmeot Region, NU).Community. population. growth.Cambridge Bay 1,477 12.8% Kugluktuk (Coppermine) 1,302 7.4% Gjoa Haven 1,064 10% Taloyoak (Spence Bay) 809 8.6% Kugaaruk (Pelly Bay) 688 13.7%
This growth has placed an increased emphasis on efficient and cost effective Arctic resupply.
Anyone who has travelled the Canadian Arctic will be aware of the high cost of goods and services in the north. For example 4 litres of milk can cost upwards of $14.00 CDN dollars4, about 3 times the price of southern markets. This is primarily due to the cost of transporting freight to the north. In 2007, Nunvut households spent nearly twice the national average on food ($14K vs $7K)5 and this coupled with low income has cre-ated food insecurity in the north. A 2003 study on food insecurity found that 5 out of 6 households in Kugaaruk were classified as ”food insecure.”6
Resupply by sea provides a less expensive alternative to air freight ($0.80/kg versus over $9/kg)7 Where under-keel clearance permits, resupply of large volume, general cargo and fuel by deep draught vessels can be even more cost efficient than supply by barge and tug. The deeper the vessel draught, the greater the cargo capacity for a single trip and the faster the delivery time. Also, the maximum speed for a typical tug/barge combination is 5–7 knots whereas a deep draught vessel can cruise at 10–15 knots, effectively halving the delivery time.

77
1.2 Cost-Effective Transportation Sample Freight Tariffs (in Canadian Dollars) for a metric tonne (1,000kg) of general car-go from Montreal, QC to Cambridge Bay, NU):
Table 2: Cost of Freight by Mode of Transportation.mode.of.transportation. vessel. Cost.Airfreight 737 $9,080.00 Overland + Sealift Tug and Barge $1,200.008
Sealift Deep Draught General Cargo $510.009
In view of the above data, the cost savings realized from deep draught sealift can be up to $8,500.00 per tonne when compared to air freight. It must be noted when com-paring the two types of sea lift tariffs (tug and barge vs. deep draught) the overall cost of sealift by tug and barge will more than double that of deep draught because of the additional cost to truck cargo overland from Montreal, QC to the inland port of Hay River, NWT.
These tariffs demonstrate the overall cost effectiveness of transportation by deep draught (ocean-going) vessels. However, deep draught transportation to and from the Arctic depends upon reliable information including ice conditions, meteorology and most importantly hydrography. Under keel clearance is an issue for deep draught transportation in the Kitikmeot Region, perhaps more than any other region in the Arctic. Almost all northern ports do not have deep sea docking facilities and ships are required to anchor as close to shore as possible to transfer cargo to the beach (above the high water line) using self-contained barges and tugs. Fuel is transferred by large diameter hoses, floated ashore to a supply manifold on beach. Large-scale modern
Figure 2: An Arctic Perspective (Source: Northern Transportation Company Ltd.)

78
charting is needed to not only enable close, inshore access to northern communities and other commercial destinations such as mining or oil and gas sites but to provide alternate routes in situations where ice navigation is neither practical nor cost effective or should be avoided.
Where alternate routing to avoid ice navigation does not exist, the cost of icebreaker escort support may apply, effectively reducing the overall cost effectiveness of deep draught transportation. In southern waters, this cost is recovered through an Icebreak-ing Service Fee (ISF) administered by the Canadian Coast Guard. Presently in Arctic waters (north of latitude 60 degrees north) this fee has been waived as part of the Canadian Government’s Northern Strategy which promotes actions that support eco-nomic and social development in Canada’s Arctic10 and is therefore subsidized by the public purse. Therefore, the cost of icebreaking as a hidden cost should be considered a government subsidy for shipping freight by sea. Icebreaker operating costs will vary depending on the area of operation and may range between $25,000 to $90,000 CDN dollars/per 24 hour period.
2. aCCess.to.arCtIC.waters.
Over the past decade, relatively “ice-free” conditions throughout the Northwest Pas-sage have resulted in an extended navigation season, a season which during summer months can exceed 3 months in duration. This is attracting more vessel traffic (com-mercial passenger & cargo ships as well as pleasure craft) to the Canadian Arctic. In response to this, federal, provincial and territorial governments are investing in port infrastructure for northern communities to better support transportation by sea.11 However, unlike southern trade routes and passages, navigation in the Canadian Arc-tic can be a far more complex affair. This is due to the large expanse of uncharted or incompletely charted waters (comprising approximately 90% of Arctic waters) and the ongoing potential for the presence of ice. Therefore, to access Arctic ports, an under-standing of anticipated ice regimes with up-to-date information on sea ice conditions
Figure 3: (Note: Bulk Cargo includes grain carriers to Port of Churchill, Hudson Bay).

79
is essential. Likewise, modern nautical charts enable the mariner to determine the most efficient routing as well an alternate route(s) to take when ice is present. Often, when a potential route around the ice edge appears, there is an absence of hydrogra-phy to support safe navigation.12 As will be demonstrated in the following cases, where local ice regimes exceed the limitations of vessel and no adequately charted alternative route(s) exist, the requirement for an icebreaker escort arises.
2.1 Ice Navigation and charting Charting a corridor centered about a recommended or preferred track of 2 to 5 nautical miles width may be an acceptable practice for ice-free waters, however, this approach will not hold true in areas where ice may be present. Transport Canada’s Zone/Date sys-tem has established 16 zones throughout the Canadian Arctic related to the probable ice conditions at specific times of year13. While experts in ice forecasting have been able to take into account prevailing environmental factors to develop models of the concentration, type and form of sea ice14, local variations in weather will introduce suffi-cient variables to seriously affect the accuracy of ice forecasts. Continued and on-going ice surveillance whether by aircraft or satellite remote sensing15 is therefore required.
In consideration of the uncertainty of ice movement, one must consider the need for alternate routes outside the preferred track in order to avoid ice. Depending on vessel draught and the quality of hydrographic information, a passage close to shore may be taken in shallow water where ice keels will cause the pack to find ground thus leaving a corridor of open water skirting the shoreline16. Furthermore, not all ice-strengthened vessels or vessels designed to break ice are capable of navigation through all ice condi-tions and therefore must seek alternate routes while breaking ice. For example, ice-breakers rated as Arctic class 2 will be capable of navigation through 1st year ice up to 1 meter in thickness versus Arctic class 4 vessels which are capable of navigation through tougher multi-year ice up to 3 metres in thickness. Whereas the concentration, thickness and/or type of ice will affect the speed of vessel transit, limitations in hydro-graphic charting may further increase ice-breaking costs as the availability of alternate “lighter-ice” routing for the icebreaker will not be available. In simple terms, the greater the concentration and thickness of the ice, the greater the power requirement vis a vis fuel consumption required to make way.
The Kitikmeot region is serviced by a class 2 ice breaker, CCGS Sir Wilfrid Laurier, whose operating cost is $28,000 per day.17 Where transit to and from the escort area plus the execution of icebreaking may take upwards of 2–3 days of ship time, the cost per day has the potential to multiply accordingly. Furthermore where analysis indicates that the local ice regime18 exceeds vessel construction limitations, ice-breaking costs could fur-ther escalate if the specific ice-regime warrants the use of a heavier-classed icebreaker.
2.2 Environmental Concerns There is a greater potential in the Arctic for environmental damage due to spills result-ing from groundings or ice damage. This is primarily due to limited spill response as-sets, the magnitude of the distance required to deploy these limited resources within the extreme weather conditions of the Arctic environment, and the nature of the Arctic ecosystem..Canada’s Arctic Waters Pollution Prevention Act asserts our obligation to

80
preserve the ”peculiar ecological balance that now exists in the water, ice and land areas of the Canadian arctic.”19 The latter factor provides for an environment which, un-like warmer waters to the south, would take significantly longer to breakdown water-borne pollutants..
The deployment of conventional booms for the containment of spills would be nearly impossible in ice covered waters. Adequate nautical charts serve first as a preventa-tive measure, however, used with relevant tidal and current information, they provide a ”base-map” for emergency response to threats to the environment and the safety of life at sea (SOLAS). Without adequate nautical information, authorities charged with mitigating environmental damage caused by vessel groundings and/or collisions (with ice or other vessels) and search and subsequent rescue operations would be severely challenged to model the movement and extent of pollutants.
3. Case.studIes.In.Cost/savIngs.In.ICeBreakIng.esCort.
The following examples are based on the author’s observations while at sea aboard CCGS Sir Wilfrid Laurier (Aug–Sept. 2009). In all cases, interviews were conducted with vessel captains to discuss both their navigation preferences and limitations. Mariner feedback has been instrumental in developing a new charting scheme for the region.
3.1 M/V Camilla Desgagnes – A Canadian Flagged, General cargo carrier, with lightering capabilities servicing
Kitikmeot Region ports.
– This vessel did not require icebreaker escort as it was able to transit an alterna-tive ice-free route through James Ross Strait using GPS waypoints derived from preliminary (unpublished) hydrographic data.
– The estimated escort savings: $56,000 (2-days combined transit and escort time).
– Since the ice-free routing also provided the most direct route to market ports, the vessel saved an estimated 1.5 days transit time.
Figure 4: M/V Camilla Desgagnes (Desgagnes Transarctik) in James Ross Strait.

81
3.2 Akademik Ioffe – A Russian Flagged, Research Vessel engaged in Arctic passenger trade.
– This vessel required icebreaker escort to reach Cambridge Bay.
– The ship’s owner did not authorize use of GPS waypoints in the absence of large scale published hydrographic data. Furthermore, the ship’s captain was reluc-tant to venture off adequately surveyed route while under escort despite heavi-er ice cover.
– The estimated escort costs: $125,000 (4-days combined transit and escort time).
Figure 5: Escorting Akedemik Ioffe out of the ice.
3.3 Lyobov Orlova – A Russian Flagged, Passenger Vessel enroute to Gjoa Haven.
– This vessel did not require icebreaker escort as it was able to transit an alterna-tive ice-free route through James Ross Strait using GPS waypoints derived from preliminary (unpublished) hydrographic data.
– The estimated escort savings: $125,000 (4-days combined transit and escort time).
3.4 M/V Umiavut (Nunavut Eastern Arctic Shipping Ltd.) – A Canadian Flagged, General cargo carrier, with lightering capabilities servicing
Kitikmeot Region ports.
– The ship’s captain was reluctant to transit James Ross Strait with GPS waypoints derived from preliminary hydrographic data until their load was first discharged at Kugluktuk and Cambridge Bay (thus reducing draught).
– Estimated escort savings: $56,000 (2-days combined transit and escort time).
The above-mentioned examples cite cases where only preliminary hydrographic data was available. Remarkably, in view of these limitations, those vessels engaged in the cargo trade were still willing to assume a certain level of risk in reaching their destina-tions.

82
Deep draught vessels have been servicing eastern Arctic ports for many years. Recent large-scale port surveys and electronic nautical charts (ENCs- see figure 8) have been published for the Nunavik region of Northern Quebec, Ungava and Hudson Bays. 2008 was the first year a deep draught cargo vessel serviced the ports within the Kitikmeot region and that number doubled to two in 2009. A program is currently underway to publish a number of new, large-scale charts for the Nunavut, Kitikmeot Region.
4. .ConClusIon.
Worldwide, hydrography enables cost effective transportation by sea, particularly seal-ift by deep draught ocean-going vessels with access to world markets. There is an eco-nomic benefit to having deep draft access to Arctic ports in that freight costs and tran-sit times are significantly reduced. In 2007 “the three carriers which were contracted to the GN [government of Nunavut] for community re-supply are estimated to have delivered in excess of 500,000 m3”.20 Assuming a modest weight of 100kg per m3 of cargo, the estimated savings over air freight would be $425,000,000 and $60,000,000 if shipped by deep draught sealift versus tug and barge alone. The requirement for adequate charting as an enabling factor for deep draught cargo access and increased water-borne tourism by passenger liner gives evidence of the Economic Benefits of Hy-drography in the Arctic.
Additionally, improvements to nautical charting in the Canadian Arctic will enable ves-sels to find alternate routes to avoid ice thus reducing the cost to the Canadian public for icebreaker escort. From the examples given for 2009, the estimated savings in ice escort costs alone would be $360,000 within the Kitikmeot Region. Simply stated, with modern hydrography (surveys, sea level monitoring and charting), complementing modern aids to navigation and improvements to marine infrastructure, hydrographers are playing a significant role in attracting and enabling more cost-effective means of transportation to support freight, passenger traffic and tourism in the Arctic.
The cost for conducting modern hydrographic surveying and charting must be consid-ered an investment to build capacity in many facets of economic development in Arctic coastal communities. While this paper has focused on hydrography’s beneficial impact on costs and accessibility for marine transportation it would probably require a second edition to justify hydrography as a significant investment in support of mineral and
Figure 6: M/V Umiavut. Figure 7: Tug and Barges.

83
oil and gas development, fishing, national sovereignty, national defence and coastal zone management. The concept of hydrography as an investment not only applies to economic development in Canadian Arctic but to other developing lands worldwide.
5. aCknowledgements.
Fisheries and Oceans Canada, Canadian Coast Guard, Arctic Traffic Reporting Zone (NORDREG)
Environment Canada- Canadian Ice Service
BIograpHICal.notes.
A graduate of Humber College’s Hydrographic and Land Survey Technologist program, Andrew has been surveying for over 20 years, with varied experience in topographic, cadastral, offshore/industrial and hydrographic surveys for nautical charting. He is a Canada Lands Surveyor, employed as an Engineering Project Supervisor with the Cana-dian Hydrographic Service, Central and Arctic Region (Federal Department of Fisheries and Oceans Canada). He is currently assigned as Hydrographer-in-Charge of the West-ern Arctic Survey, Kitikmeot Region. He is past president of the Canadian Hydrographic Association and the present chair of FIG Commission 4.
Figure 8. S-57 ENC of Gjoa Haven.

84
reFerenCes
1 The exception is Bathurst Inlet whose population decreased to 0 in 2006, from 5 in 2001. However with modern charting supporting sealift to a number of min-ing operations in this area and speculation of the contruction of a winter road to connect the inlet with mining operations to the south, there is strong potential for the community of Bathurst Inlet to re-establish in support of a potential ter-minus.
2 Nunavut, Department of Community and Government Services, Dry Cargo Re-supply Program, Activity Year 2007, Government of Nunavut, 2008.
3 Nunavut Bureau of Statistics, 2008.
4 Author’s observation from visit to community market store in Taloyoak, 2009.
5 Statistics Canada, Spending Patterns in Canada 2008, Catalogue no. 62-202-X, Minister of Industry, 2009.
6 Judith Lawn and Dan Harvey, Nutrition and Food Security in Kugaaruk, Nunavut. Ottawa: INAC, 2003
7 First Air, Domestic Cargo Tariff, Montreal, QC to Cambridge Bay, NU, 25 June, 2009.
8 Northern Transportation Company Ltd., 2009 Mackenzie-Western Arctic Gen-eral Cargo Rates, Originating at Hay River, NWT, 8 April, 2009. Rate is the sum of the cost of overland shipping from Montreal, QC to Hay River (approximately $340.00/tonne) plus sealift from Hay River, NWT to Cambridge Bay, NU ($859.00/tonne).
9 Nunavut Eastern Arctic Shipping Ltd., Freight Rates for the 2009 Season, 7 April, 2009.
10 Fisheries and Oceans, Canadian Coast Guard, Marine Service Fees – Information Bulletin, Number 23, 2008. http://www.ccg-gcc.gc.ca/eng/CCG/Marine_Serv-ices_Fees
11 Canada’s Economic Action Plan, Government of Canada, August, 2009.
12 Leyzack, Weaver , Hydrographic Capacity for Maritime Navigation and Coastal Protection in the Canadian Arctic, Proceedings from the First Northern Watch Conference, Department of National Defense, 2007.
13 Transport Canada, Arctic Ice Regime Shipping System (AIRSS), Ottawa.
14 Environment Canada, Canadian Ice Service, Egg Code Symbols for Visual and Radar observations, Ottawa.
15 Canada’s RADARSAT, space-borne Synthetic Aperture Radar (SAR) is a proven technology for the near real-time monitoring of sea ice conditions.
16 Interview with Capt. Mark Taylor, Canadian Coast Guard.
17 Canadian Coast Guard, Pacific Regional Operations Centre Ship Costing 2009.
18 Transport Canada, Arctic Ice Regime Shipping System (AIRSS).

85
19 Minister of Justice, Canada, Arctic Waters Pollution Prevention Act, (R.S., 1985, c. A-12), p. 1 http://laws-lois.justice.gc.ca
20 Nunavut, Department of Community and Government Services, Dry Cargo Re-supply Program, Activity Year 2007, Government of Nunavut, 2008.
21 Canadian Hydrographic Service, Western Arctic Survey- Kitikmeot Region, 2009
ContaCt.
Mr. Andrew Leyzack C.L.S. Canadian Hydrographic Service, Fisheries and Oceans Canada 867 Lakeshore Road Burlington, Ontario CANADA Email: [email protected] Website: www.charts.gc.ca

86
wHy.a.natIonal.HydrograpHIC.servICe?.prepared.by.Hugo.m.gorziglia,.IHo.presented.by.gordon.Johnston,.united.kingdom
abstract..This article is intended to generate discussion around the need and justifica-tion for a maritime state to have a national hydrographic office tailored to its real needs. Giving some examples, it is made known the influence and relationship of hydrography and several activities, different that shipping and defence, has. The existence of a Na-tional Hydrographic Committee or similar body is highlighted as the most appropriate coordination mechanism. Finally it is recalled the role of the IHO in supporting hydro-graphic capability development.
key.words:.National Hydrographic Services, cooperation, Capacity Building
1. BaCkground.
Assessing the worldwide hydrographic surveying and nautical charting status we can conclude that despite over 90% of international trade being conducted by sea, reli-able cartographic coverage has not yet been reached everywhere and still several areas within Central America and the Caribbean Sea, the South West Pacific, Africa and some regions in Asia represent a risk for shipping operations. Despite the understanding of the close relation and influence that exists between the ocean and climate change, and being aware of the severe effects of different natural hazards, the origin of which seems to be strongly related to global change, as a society we do not give priority to learning and better understanding the characteristics of oceans and seas. Moreover, despite the evident deterioration of the marine environment due to the increase of population living in the coastal region and the increase of activities that discharge dif-ferent elements to the sea, we, as a society are not keen to consider, with sufficient priority, the need to have reliable hydrographic information to adopt the most efficient and effective preventive and remedial measures to ensure clean seas.
Since the very early days of man’s presence the sea has been considered as a natural avenue that allows interconnectivity between different human groups, mainly to ex-change their goods. Therefore, hydrography and the representation of its results in a nautical chart have always been part of life and have contributed to mankind’s devel-opment as well. Due to its importance, the sea has also been the scene of disputes of its control. We can say that hydrography traditionally has contributed to both, commercial and naval operations.
Nowadays and without losing its original main application, hydrography is called to contribute to many other activities including playing a key role in maritime delimita-tions; exploitation of marine living and non-living resources; tourism and sports; and others, all needing to be properly regulated, managed and controlled, aiming at sus-tainability and protection of the marine environment.
It is evident that somebody needs to have the responsibility, at a national level, of con-ducting hydrographic surveys and producing nautical charts, also of building and keep-ing hydrographic databases for the preparation of special products required by those in charge of regulating, managing, controlling and operating in and on the oceans and seas.
87
This fact that is very well understood, - especially by countries with a maritime tradi-tion, conscious on the vital role the sea plays for their economies -, but not so by many other countries that do not give it priority, even to the development of a basic hydro-graphic capability.
Probably the relationship between hydrography and safety to navigation is more evi-dent than the existing relationship with other activities, due to international regula-tions. In fact, the SOLAS (Safe Of Life At Sea) Convention – under the aegis of the Inter-national Maritime Organization (IMO) –, provides clear regulations with regard to safety to navigation and all related elements. Particularly Regulation 9 “Hydrographic Serv-ices”, identifies what a contracting Government shall undertake. In brief, as detailed in this regulation they should arrange for the collection and compilation of hydrographic data and the publication, dissemination and keeping up to date, of all nautical informa-tion necessary for safe navigation. As can be appreciated, the main purpose is to guar-antee, as much as possible, safe navigation, taking into account the recommendations and resolutions of the International Hydrographic Organization (IHO). Through the co-ordination between hydrographic offices, the IHO aims at ensuring that hydrographic and nautical information is made available on a worldwide scale as timely, reliably, and unambiguously as possible.
In this case and as indicated earlier, the contribution of hydrography is evident, but it is not so evident to the common public, that the availability of this data and information has also a vital role to support in the development of other activities of national, social and economic importance.
2. governmental.and.prIvate.seCtor.HydrograpHIC.InFormatIon.demand
Hydrographic information is a national asset required by both, governments and pri-vate sectors.
We cannot conceive any activity conducted in the sea or the development of any coast-al or offshore project without hydrographic information. It is a government responsi-bility to administer, regulate, and control the use of the inland waters, interior waters, territorial sea, exclusive economic zone and continental shelf. How can government officials achieve this without knowing the characteristics of these environments? How can the private sector promote initiatives in these areas in the absence of Hydrographic information? Clearly the lack of hydro-cartographic information constitutes a strong limitation to achieve progress.
We will not, in this paper, concentrate on the importance of hydrography with regard to safe navigation, shipping and related activities. As was indicated, this sector eas-ily understands the contribution that hydrography makes to its development. On the contrary, we will concentrate on some other activities, some of them normally under government’s responsibility and others more in connection with the interests of the private sector.

88
2.1 Governments’ responsibility
a). maritime.delimitationAs it is on land, each country needs also to establish, agree and set its international borders and boundaries. In the case of the delimitation with other countries, the lim-it must be drawn on the commonly accepted nautical chart and that chart must be the product of a hydrographic survey complying with international agreed standards. Probably the hydrographic survey will be a joint operation but what if one of the coun-tries involved does not have any hydrographic capability? When establishing the limits of the territorial sea, contiguous zone, economic exclusive zone or the extension of the continental shelf, -if it applies -, the maritime state must base such delimitations on standard procedures where depths, distances, characteristics of the sediments, carto-graphic projections and representations must be considered. Finally lines representing such limits must be represented on nautical charts to make users aware. The mariner, the fisherman, the security forces and others, must be aware whose area and jurisdic-tion they are in, as for each area, different regulatory measures frequently apply. How are such measures and cartographic presentations made in the absence of a national hydrographic capability? To have this capability will the ministry of Foreign Affairs es-tablish a hydrographic unit as part of its structure?
b). natural.hazard.preparednessCoastal zone management is a subject on its own due to its complexity and multiple related and dependent factors. One of the aspects that call for special attention is the effect of natural hazards such as tsunamis and storm surges. Being both of a very dif-ferent origin, the point is that the coast is impacted by the rise of the water level and waves, respectively that have caused great lost of lives and damage to coastal commu-nities with tremendous economic effect. Probably it is nonsense to aim at stopping na-ture delivering its energy, the risk always exists, but we can adopt measures to reduce the effects by an appropriate policy of preparedness. The direction of the energy that approaches from the sea towards the shoreline is driven by the bathymetric character-istics of the place. Therefore if we know the bathymetry, we can run models to deter-mine the expected run-up under certain conditions. The result will be the zonification of areas of greater or lesser risk. This represents, especially for coastal communities, important information required to support the decision on where a settlement should or should not be established. In the absence of a national hydrographic capacity, will the National Emergency Agency establish a hydrographic unit to provide this vital in-formation for preparedness?
c).. oil.spills.and.ContaminationIf we are part of a conscious society we must take care of the environment, and that also includes the sea. There have been accidents and spills and nothing indicates that these will not happen again. Severe maritime accidents with oil spills that have required the action of concerted brigades to combat it can still make demands on the time, person-nel and funds available to coastal areas. It must be an aim to reduce as much as pos-sible the impact of such events on the marine environment, mainly close to the coast. Examples of accidents, unfortunately there are quiet a few, the effects of which have been assessed, have produced varying conclusions and ended with costs impossible to determine due their long lasting effect. It is not the cost of pumping or sweeping the

89
beaches, is the cost of the consequential losses to the habitat, flora and fauna as well as local trade and commerce that are not recovered. To help in managing this type of dis-aster, bathymetry, currents, tides, winds, as well as other parameters are required. One important aspect that has been recognized is that without suitable data and a nautical chart in the area of the disaster; operations will be surely more difficult. Will the ministry of Environment have a hydrographic unit to provide hydrographic intelligence?
2.2 Private Sector interest
a). Fish.FarmingIt is true that fish and seafood farming is an activity that cannot take place elsewhere, it has to be regulated and the area requires very special conditions from an environmen-tal point of view, including bathymetry. How can the private sector go ahead with fish farming project? Certainly they need to comply with the regulations set by the authori-ties. How will authorities establish such policies if no environmental information and its variability are available? We agree that bathymetry is just one parameter, but that information and its representation on a chart is required, as knowledge of it can have a significant effect on establishing suitable sites that in turn may impact the routes used for surface navigation. Is it the farmer who shall establish a hydrographic unit to get the information? Will governmental officers consider that information valid? Will the ministry of Fisheries need a hydrographic unit to deal with this matter?
b). tourismTourism is a very wide title for this paper so we will concentrate on just a little seg-ment: the marinas for small vessels. Marinas provide shelter conditions to leisure yachts and boats, and constitute a focus of development due to the many activities that are associated. The provision of services and logistic support such as re-fuelling, restau-rants, maintenance, shops; just to mention a few, offer the opportunity of different jobs. Therefore in the selection of the place where to build a marina, several factors are to be taken into consideration; one of which is the hydrographic condition. The infrastructure to be developed has, as the main objective, to provide the best and safer conditions to yachts and boats. The engineering studies to be conducted before any decision is adopted must include hydrographic surveys and charts of the area. Later, when in operation, the variation of the hydrographic conditions shall be monitored in order to keep the conditions safe for use of the marina. Who would like to take the risk of not considering hydrography in the development of a marina? Will the neces-sary hydrographic studies conducted be used for the preparation of an official nautical chart of the area? Will the private sector produce such a nautical chart and assume the responsibility for its quality? Will the ministry of Tourism require a hydrographic unit to validate whatever hydrographic information is produced by the private sector?
c). Cable.layingNormally it is under a contract that the private sector works in cable laying. This en-gineering operation requires a very detailed representation of the seafloor; therefore special hydrographic surveys are conducted in order to decide on the best lay route of the cable. But that is not all. Due to the importance of the work, the position of the cable must be shown on the nautical chart to avoid any disruption caused by ships

90
anchoring in the nearby or fishing vessels conducting deep trawling. In this case the private sector needs hydrographic information before the laying and afterwards, with the assurance that the mariner will be aware of the existence of the cable as it will be indicated in the nautical chart, probably with some explanatory/regulatory notes. If the preliminary survey is conducted by the private sector, will that information be used in the preparation of the official nautical chart? On the contrary, if hydrographic infor-mation already exists due to different reasons, would it not be economic and efficient to make that information available to the private sector, especially if it is of national interest? Who keeps the records of previous hydrographic surveys? Is that information a national asset?
3. wHy.a.natIonal.HydrograpHIC.servICe
As we have explained in the previous paragraphs, hydrographic information has an im-mense value for many activities. In this paper we have just provided examples of some of those activities, but it is easy to imagine that this condition is valid for many others. We think that it is not effective and not efficient to have a hydrographic capability in each sin-gle national agency that might need hydrographic information. This might have a total cost that cannot be afforded nor justified. The development of individual hydrographic capabilities has no rationality, provided that a national hydrographic service exists aimed at offering reliable and timely service to all governmental stakeholders in a coordinated way. There are no fixed structures suggesting the organization, structure, components, mission and objectives of a national hydrographic service. Such a national agency needs to be tailored to provide the expected services that all these stakeholders require to com-ply with their individual missions and objectives. It must be seen as a national service of strategic importance capable of supporting the development of the highest maritime national objectives. It does not mean that due to the lack of a national hydrographic ca-pability, no hydrographic activity takes place in a country. That is a mistake, as the gov-ernment hires some work and the private sector executes some works too. The problem is that without a National Hydrographic Service, there is no standard quality control and quality assurance on the information generated through these individual efforts. Moreo-ver, the data and formation is not maintained and kept conveniently archived for future national uses. A maritime nation, with its strong dependency on the sea, cannot be ex-posed to not being capable of deciding and controlling any project at sea. It is true that conducting hydrographic surveys and producing nautical charts are activities that can be contracted, but it is a must to have the capability to understand and establish technical specifications and standards that must be followed; regulate the hydrographic activities conducted in national waters and control the accomplishment of that regulations. All this can only be managed by a centralized agency, the National Hydrographic Service, the characteristics of which shall be decided by the related stakeholders. Its mission and functions shall be considered a national objective and its administration shall receive the advised of a national hydrographic committee or similar coordination structure, integrat-ed by all the stakeholders.
4. eConomIC.assoCIated.BeneFIts
It is difficult to assess the economic benefit associated to the existence of a National Hydrographic Service, but if established according to the real needs of a country; its

91
cost shall not be considered expenditure, but an investment. To attempt to use figures does not make any sense as figures are irrelevant due to the different cost of life and its representation in different parts of the world, but we can get a very good feeling if we consider the activities to which we have referred in this paper and make ourselves, citizens of a fictitious country known as “Wonderland”:
a). maritime.delimitationWhat is the value of establishing national borders of “Wonderland”? How much re-sources are spent in court cases due to the lack of maritime delimitation of “Wonder-land”? What value has the resources we are not exploiting due to non availability of a clear maritime delimitation of Wonderland?
b). natural.hazard.preparednessWhat is the cost to re-establish a flooded village settled erroneously in a risky coastal zone in Wonderland? What is the cost of live of those in risk in Wonderland?
c). oil.spillsWhat has been the cost of cleaning beaches impacted by oil spills in Wonderland? What has been the overall operational cost to control oil spills in “Wonderland”?
d). Fish.FarmingWhat is the impact on food and work availability due to not having decided on poten-tial fish farming areas in “Wonderland”? What is the effect of fish-farming in “Wonder-land” due to restrictions in navigable areas?
e). tourismWhat is the cost of closing a marina in “Wonderland” for a certain period of time due to grounding? What is the operational cost of a marina in “Wonderland”? Should not we consider periodic surveys to ensure safety and environmental health?
f). Cable.layingWhat is the cost of adding 100 meters extra due to the non availability of proper hy-drographic information of “Wonderland”? What is the cost of replacement of damage section of the cable due to lack of a nautical chart shown precisely where the c able has been laid-out?
Please compare any imaginable figure associated to the above activities with the budg-et estimates for some national hydrographic service: 1M Euros (Sri Lanka); 1.7M Euros (Mozambique); 3.5M Euros (Chile); 7M Euros (Portugal); 11M Euros (Finland); 23M Euros (Norway); 43M Euros (Australia) (Approximate values in millions of Euros based on in-formation reported to the IHB for the IHO Year Book).
It must be recognized that establishing a basic National Hydrographic Service of ap-propriate dimensions will without a doubt contribute to the maritime sector progress of our fictitious country “Wonderland”.

92
5. ConClusIons
1. Hydrographic data and information is required to produce nautical charts as well as to contribute to the decision making process on many other different activities that take place in and on the sea.
2. Hydrographic activities are taking place due to different needs no matter the in-existence of a national hydrographic service. Different governments’ agencies spent part of their budget hiring “pieces and bits” without any national coordi-nation.
3. Not being an agency in charge of keeping the data and information collected by different projects, a cost recovery policy cannot be implemented. It is not exploited the idea that data collected can be used for other purposes today and for sure, tomorrow.
4. A National Hydrographic Committee or similar coordination structure, com-posed by all stakeholders needing hydrographic information is required to de-fine the size, mission, objectives and policies of the National Hydrographic Serv-ice, as well as its annual work program.
5. A National Hydrographic Service is a “must” for any maritime country with the willingness to offer its citizens the advantages of having the sea as part of its ter-ritory.
6. One of the objectives of the IHO is to tender guidance and advice to Maritime States engaged in setting-up or expanding their hydrographic services.
BIograpHIes
Captain Hugo Gorziglia is a Director of the International Hydrographic Organisation is based in Monaco at the International Hydrographic Bureau. A Captain in the Chilean Navy Captain Gorziglia spent a distinguished career in the Hydrographic Service before being appointed to Monaco in 2002.
Gordon Johnston is director of Venture Geomatics Limited, an independent technical consulting group in the UK. He is chair of the FIG/IHO/ICA International Board on the Standards of Competence for Hydrographic Surveyors and Nautical Cartographers.
ContaCts.
Captain Hugo GORZIGLIA, Director, International Hydrographic Bureau Monaco, [email protected]
Gordon JOHNSTON, Director, Venture Geomatics Limited, UK, [email protected]

93
papua.new.guInea.HydrograpHIC.servICe.(pngHs).and.tHe.Future.–..papua.new.guInea.HydrograpHIC.servICe,.an.ant.wItH.tHe.gIantsJ..kaunda,.papua.new.guinea
abstract..The hydrographic development is very important even though it’s expen-sive; but it has high economic returns to the country. Papua New Guinea has directly seen current economic expansion in all industry. It has seen the international vessels of all size call into the coastal waters and harbours. The Papua New Guinea government has made a right decision to update all its nautical charts to modern datum (WGS84) with the assistance from Asian Development Bank. With the long relationship and the Memorandum of Understanding regarding Hydrography between PNG and Australia has put PNG hydrographic service in good position to update its charts to modern da-tum.
1. IntroduCtIon
The hydrographic development is very important even though it’s expensive; but it has high economic returns to the country. Papua New Guinea has directly seen current economic expansion in all industry. It has seen the international vessels of all size call into the coastal waters and harbours. The Papua New Guinea government has made a right decision to update all its nautical charts to modern datum (WGS84) with the assistance from Asian Development Bank. With the long relationship and the Memo-randum of Understanding regarding Hydrography between PNG and Australia has put PNG hydrographic service in good position to update its charts to modern datum. The contractor, the L3 Nautronix (then HSA Systems) provided the contracted charts. To date continuous cooperation with Charting Authority (Australian Hydrographic Serv-ice) has enhanced priority for more large scale charts to assist the economic develop-ment.
2. png.HydrograpHIC.servICe.maIn.FoCus.oF.responsIBIlIty
The PNG Hydrographic Service Department is a department of the National Maritime Safety Authority and is responsible for the administration and implementation of the Memorandum of Understanding between the Charting Authority (AHS) and national programs and activities.
These program activities are based on the three phased hydrographic development model derived from the IHO Publication M-2, “National Maritime Policies and Hydro-graphic Services”, which has been used as a guide for PNGHS development. It has de-veloped its priority into the second development phase; under this model all national activities are planned for implementation over the next 3 to 5 years. The main focus being capacity building;

94
3. tHe.natIonal.aCtIvIty
The last three years PNGHS collaborated with its charting authority, and has success-fully linked and established strong relationships with stakeholders and established strong network with its partners and maritime operators in collecting, assessing and circulating nautical information for timely chart updates and nautical publications and updated existing charts and publications.
Since its inception the Papua New Guinea Hydrographic Services has implemented the following in accordance with Hydrographic development model 1:
– Formed the Nautical Information Committee
– Created/Improved current infrastructure to collect and circulate Information
– Strengthened links with charting authority to enable updating of charts and publications
– Training and human resource development.
3.1 Nautical Data CommitteeThrough the Nautical Data Committee, surveys and charts priority is based on the eco-nomic development identified by the stakeholders. The stakeholders consist of the shipping industry and the government representative. The Committee convened four meetings over the last three years. Representatives from the Charting Authority; the Australian Hydrographic Service (AHS) have attended these meetings. The approved surveys are scheduled into the in the 3 years HYDROSCHEME (Australia’s Hydrographic surveying and charting programme).
3.2 Communication Infrastructure to Collect and Circulate Information
The communication infrastructure setup to collect and circulate information are phones (Landline and Mobile), facsimile and email; this provide the effective means of receiving and disseminating the information through the industry distribution da-tabase. Normal mailing system is used when other delivery services are not available.
3.3 Links with Charting Authority to Enable Updating of Charts and Publications
The existing Memorandum of Understanding on Hydrographic Arrangements between the Department of Transport and Civil Aviation, Papua New Guinea and Department of Defence, Australia; which came into effect on 26th June 1978 has provided the linkage. The linkage has provide PNG hydrographic Services to come this far. The existing MOU is under review to modernise the department responsible for the MOU.

95
3.4 Training (Capacity building)PNGHS has been fortunate in receiving attachment training with AHS. One female of-ficer undertook training on chart maintenance, publications and distribution. Another officer did two weeks training on Cartographic skills and data process. This training has been useful in the development of PNGHS. The two officers have continued the relevant job training in Singapore and Japan.
4. FoCus.For.tHe.neXt.6.years.and.Beyond
The development of hydrographic model 2 has been captured in the PNGHS work-ing plan 2011–2015. The plan is to build capacity of the staff to have relevant train-ing on hydrographic and cartographic data processing; more into data quality control and standards. Therefore, the hydrographic data acquisition will be outsourcing to the private industry. Part of the hydrographic development plan 2011–2015 will be struc-tured to development awareness in private industry and as well abreast them on qual-ity control and data management capacity building within PNG.
PNGHS will work toward ISO 9001 - 2000 standards and a quality management system for hydrographic data. PNGHS has the support from the development partner in ac-quiring hydrographic data for offshore economic development purposes. PNGHS has developed standard contract documents based on the ADB (or where applicable) for outsourcing hydrographic data acquisition for future through formal contract.
Capacity building is crucial in the development of the hydrographic profession for hy-drographic data acquisition and processing. Two personnel are on the programme to undertake H2 and marine cartographic category B training. There is also a need to train more hydrographic surveyors for private industry.
The surveying standard is based on S-44 with assistance from the AHS to develop ports and harbours standards. This is important in monitoring and maintaining survey standards and data quality.
Below is the outline for the development model 2 which is structured in 2011-2015; the focus (short term) for the next 3–5 years:
– Build capacity to carry out surveys of ports and their approaches
– Maintain adequate aids to navigation which is an on going national activity
– Build capacity to enable surveys in support of coastal and offshore projects
– Identify resources and opportunities to further train and equip private firms out-sourcing survey/charting work
– Building strong PNGHS on Hydrographic data process and cartographic data management.
The objectives and goals will be set around these areas and will be used as an audit to measure our achievement between 3-5 years. This will be our short term goals toward our requirement while we continue to work with our Charting Authority through our MOU for survey and charting priority and continue to update our charts.
In a long term, the PNGHS understands that hydrographic development model 3 re-quires a large investment by the government and presents a big challenge for the long

96
term in future. This will required more commitment and dedication when PNG has enough hydrographic professions and marine cartographic.
5. development.CHarts.and.survey.prIorIty
On January 21 2007, Papua New Guinea received 39 recompiled charts in metric units from its Charting Authority (Australian Hydrographic Services); the project was con-tracted to L3 Nautronix, under the Maritime Navigational Rehabilitation program which commenced on 1 June 2005; funded by Asian Development Bank loan. Concur-rently, electronic versions of these paper charts were also prepared for use. There are 72 charts altogether but these cover only 40% of PNG Waters. The charting program is continued to grow based on the economic development of Papua New Guinea. That means more large scale charts need to be developed to cater for the economic devel-opment, which our Charting Authority is committed and continually supportive. This year we have all our PNG chart folio embossed with National Maritime Safety Authority Logo. Which is a way forward of give PNG a start to have the product as partly theirs. The priority for the survey and charting in the area is commercial high priority. The 3 year programme Hydroscheme is very successful, with excellent cooperation and most surveys are done as programmed. Most priority surveys in PNG waters are based on offshore economic development projects or for access to inshore economic develop-ment. The Nautical Data Committee provides assessment and supports the PNG survey priority and chart programs. This year (February to April,) we had HMAS LEEUWIN con-ducted the major survey around the Trobriand Island, Solomon Sea. The survey is for the purpose of development large scale charts for the cruise expedition.
6. plaCe.names.on.tHe.CHart
All names on the new charts are approved before it is placed on the chart. The new names are approved through public notices and for National Gazette by the National Place Names Committee. PNGHS has received queries from AHS on names which can-not be found in the 1998 Gazetteer, a matter over which PNGHS has no control. The Gazetteer 1998 is the official for all place names. The Office of the Surveyor-General has the power to call the meeting to approve the names where there is no dispute and we have sought the chairman’s consensus on the maritime names under the appropriate section and clause of the Place Names Act 1995 to have them on the charts. This has helped delay the names on the new charts, however, the Surveyor General endorse where appropriate to use the names.
7. marItIme.Boundary.delImItatIon
Hydrographic Service is actively involved in the National Maritime Boundary project with its delimitation program. New base points have been identified and a survey team with SOPAC assistance has completed the survey. The new PNG baseline with a new schedule to the National Seas Act 1977 is currently used until such time when the new act will supersede it. The new maritime Zones bill and the undersea mining bills are prepared for the country and are now under the process of enacting. The current na-tional legislation (PNG National Seas Act 1977) dealing with the maritime zones has no correlation to UNCLOS. The legislation (Maritime Zones Act) encompasses the UNC-

97
LOS. The main scope of the project was to submit PNG proposal on the Extended Con-tinental shelf beyond 200nm; which PNG did a joint submission with Federated States of Micronesia and the Solomon Islands before May 2009.
8. marIne.sCIenCe.researCH.(msr)
The Marine Science Research is strong in PNG, the committee identified the value of hydrographic data acquisition from research vessels and vessels carrying out surveys in PNG. The PNGHS is a member in the committee. MSR build a database profile on research vessels, their tracks, location of surveys and the type of data collected. We continue to maintain the committee.
9. ConClusIon
The work of hydrographic is new in the government and bureaucratic circles; there-fore, we make it our business with the help of our executive team to ensure they have a fair idea of what it is and its importance. The hydrographic service is confident that the short term goals and plans are structured around the Hydrographic Development Phases; which provide the guide as we build strong network regionally and with IHB. Continuous cooperation and support from our Charting Authority gives us confidence for future development. It provides useful guides to minimizing cost to update nautical information for safe navigation and effective marine environment protection manage-ment within PNG Waters.
It is strongly encouraged to create and maintain partnership with IHO, the Charting Au-thority and stakeholders, and industry participants. We are still struggling to educate the government and bureaucrats but we see it as an opportunity for open dialogue for future development if they appreciate it.
To advise and raise awareness of hydrographic to the local private firm is a challenge too and we will strategy to collaborate public – private partnership to invest in the Phase 3 hydrographic development; but it will be a long term plan to outsource most hydrographic and chart work in PNG. It the short term, we will look at developing ca-pacity to carry out ports and harbours. This is our challenges and we will continue to assist and commit through the capacity building and awareness. As I said early in the sub heading, we are just an ant hydrographic service trying to convince the giants (gov-ernment and the bureaucrats).
BIograpHIes.
Joseph Kunda, is the Manager of the Hydrographic Service Department of Papua New Guinea. The Papua New Guinea Hydrographic Service is part of the Navigation and Safety Services which is a division of the National Maritime Safety Authority.
ContaCts.
Level 2, MMI Insurance Building, Champion Parade. P O Box 668, Port Moresby, NCD, Pa-pua New Guinea. Phone: (675) 321-1244 Fax: (675) 321-0873 Website: www.nmsa.gov.pg

98
eConomIC.BeneFIt.oF.HydrograpHy:.land.reClamatIon.In.Bayelsa.state.–..a.Case.study.oF.saIpem.Camp.angela.kesiena.etuonovbe,.nigeria
abstract..Bayelsa State is a state in southern Nigeria in the heart of the Niger Delta. It is on the coast and between Delta State and Rivers State. It covers an area of 10,773 sq. Km. and has a population of 1,998, 349 (2005 estimate). Bayelsa has a riverine setting, a lot of her communities are almost (and in some cases) completely surrounded by water, hence making these communities inaccessible by road. It has one of the largest crude oil deposits in Nigeria and petroleum production is extensive in the state. The majority of Bayelsans, who live in poverty, are rural dwellers due to its peculiar terrain, lack of adequate transportation and poor road access. This has posed a large problem to the State since its creation and successive State Governments have not been able to fashion a way out. Apart from the subsistence fishing and canoe making, the state has virtually no stable commercial activity. It heavily depended on royalties (taxes) on crude oil pipeline and Federal Government Allocation. As a result reclamation would necessitate the availability of the required land space that will be needed for agrarian activities, industrialization, commercial activities (establishment of markets) and the development of a transport system, especially roads that will encourage inter-relation-ship of the people and advancement of the area and the people.
For now, the area is grossly untapped and closed to the open world because of the flooded and swampy nature of the terrain. To this extent, it is only land reclamation that can catapult this rather backward community to its prime of place amongst the community of elegant States of Nigeria.
Saipem Camp is a case study where this problem can be effectively articulated, the ex-tent to which Reclamation can meet this challenge, the attendant costs and the impact the solution(s) will have on the people and the State.
key.words:. Access to land, Cost Management, History, Hydrography, Land Manage-ment, Dredging, Benefits, Roads. Reclamation
1. HydrograpHy:.wHat.Is.It?.
According to the Encyclopaedia Britannica, hydrography is the science dealing with all of the waters of the earth’s surface, including the description of their physical features and conditions; the preparation of charts showing the positions of lakes, rivers, seas, the contours of the sea bottoms, the position of shallows, deeps, reefs, and the direc-tion and volume, configuration, motion, and condition of all waters of the earth.
2. saIpem;.yenegoa?.
Saipem is a major contractor to Shell Petroleum Development Company Nigeria Limit-ed (SPDC), and specializes in pipeline projects. The company came to Yenagoa, Bayelsa State, due to a pipeline project she had to execute and Yenagoa is closest to the loca-

99
tion and as a result, she decided to situate her base camp there. Her regional headquar-ter is in Port Harcourt Rivers State.
3. wHy.reClamatIon.
As earlier mentioned, Bayelsa has a riverine setting, and Yenagoa which is the State cap-ital is not left out. For Saipem to build its Camp in Yenagoa, the chosen site of course, re-quired reclamation for the site was acutely swampy. The site was dangerously swampy to the extent that one can hardly walk on it without using a swamp buggy. (See Figure 3a and 3b below).
Figure 1: Map of Nigeria. Figure 2: Niger Delta map.
Figure 3a: Saipem camp site prior to reclamation.

100
4. land.reClamatIon.
Land reclamation is either of two distinct practices. One involves a change from an area’s natural state, while the other is restoring an area to a more natural state (Wiki-pedia, the free encyclopaedia).It can also be defined as “the process of improving disturbed land (soil, vegetation, water) to achieve land capability equivalent to the pre-disturbed condition or for a specified end land use.”
5. dredgIng.and.reClamatIon:..
Dredging is an industry in constant transformation. It has changed tremendously in the last decades. The traditional dredging activity like construction and maintaining ports and harbours, desilting of drainage and irrigation channels, keeping reservoirs at depths and removing sediments from waterways is still of importance. However it is surpassed by other applications of dredging technology (H. van Muijen).
Reclamation is an important example in this respect, where large amounts of sand are dredged, transported over large distances and used to make new land for industrial-, housing-, airport- and other infrastructural purposes. Saipem, in line with the above resolved to dredge its own sand within the premises as this is more cost effective as compared with sand haulage. Due to the fact that the area was a vast one, and the job had a timely deadline, three dredging companies to be precise were engaged.
6. proJeCt.plan.
The following strategies were adopted for this project in other to effectively execute the task at hand.
6.1 Site study
− Determining the actual portion of the landfill area to be reclaimed. − Carrying out a study of geological features that is check if the quantity of sand needed could be dredged from the area.
Figure 3b: Swamp buggy creating a path into the site for the dredger.

101
− Check for stability of the surrounding area. − Also check for the proximity of ground water.
6.2 Assess project costs Project costs may also include the following:
a.. Capital.Costs.− Site preparation
− Rental or purchase of reclamation equipment
− Rental or purchase of safety equipment
− Construction or expansion of materials handling facilities
− Rental or purchase of hauling equipment.
b.. operational.Costs.− labour (e.g., equipment operation and materials handling)
− equipment fuel and maintenance
− hauling costs.
Part of the cost analysis involves determining whether the various aspects of the rec-lamation effort will result in reasonable cost reduction in relation to the anticipated economic benefits.
(U.S. EPA. 1997. Report)
7. tHe.eQuIpment.used.For.sand.mInIng.operatIon.at.tHe.sIte
See figures 4a–c.
Other equipment used are:
− Excavator
− Work boat (almarine work boat with 45 HP O?B engine.
8. tHe.role.oF.tHe.surveyor.In.reClamatIon.
The Surveyors role in land reclamation is simply inevitable. It is the Surveyor that deter-mines the quantum of sand to be dredged, and to achieve this, he/she needs to carry out a pre and a post dredge survey of the area in quo.
It is also the surveyor’s duty to carry a bathymetric survey of the river from where dredging is to be done.
The surveyor also carries out the geological survey of the area.

102
9. operatIon.at.sIte.
9.1 Geological Survey A recce was conducted round the area to be dredged. After the recce, boring was done at random. Five points were dug and gotten. The result is as shown on pages 3, 4, 5, 6, and 7 respectively.
The average width of 25.0 m x 25m away from the area where the previous dredger was situated was covered. Samples were taken at five different points to a depth of 15m.
Figure 4a: Heavy-duty cranes capable of lifting up to 80 tonnes
Figure 4b: A 12” x 10” ellicott truckable cutterhead suction dredge powered by a 370 hp caterpillar diesel engine, with a 10m ladder and maximum digging depth of 6.1m. Includ-
ed are 500 metres of 12 inch hdpe pipe with 300 metres of 8 inch hdpe floats.
Figure 4c: Caterpillar d6 v-track bulldozer.

103
From the samples taken, the following results were obtained.
On this project, the geological survey was done prior to the dredge mobilizing to site. (See results of geological survey below.)
9.2 Field operation results Bore-Hole.1:.0.0–3.0 m contains clay, from 3.0–6.0 m has reddish sharp sand, from 6.0– 8.0m contains white sharp sand while from 8.0–15.0 m has very smooth white sand.
Bore-Hole.2: 0.0–2.5m contains clay, from 2.5–6.0 m has reddish sharp sand, 6.0–8.0 m is made up of white sharp sand, while from 8.0–15.0 m contains smooth white sand.
Bore-Hole.3: 0.0–3.0 m contains clay, from 3.0–6.0 m has silt mixed with clay, from 6.0m – 8.0m contains clay and from 8.0–15.0 m has clay.
Bore-Hole.4: 0.0–3.0 m contains clay, from 3.0– 4.0 m, has reddish sharp sand, from 4.0m – 8.0m contains sharp sand mixed with clay and from 8.0– 15.0 m has clay
Bore-Hole.5: 0.0–3.0 m contains clay, from 3.0–6.0 m has reddish sharp sand, from 6.0–8.0 m contains white sharp sand, while 8.0–15.0 m is made up of smooth white sand.
9.3 Sub-soil investigation site sketch As stated earlier, as soon as the result of the geological information were on hand, the dredge mobilized to site, and the dredge was positioned by the surveyor on the spe-
Figure 5: Sub-soil investigation.

104
cific spot from where commercial quantity of materials (sand) could be produced. After the dredge has been positioned, sand mining had begun.
However it should be borne in mind that after that much material has been deposited, a post dredge survey was carried to determine the actual quantum of materials that was actually produced on site.
Prior to the sub-soil investigation, a pre-dredged survey of the site had earlier been carried out (See figure 6 below.)
Figure 6: Pre dredge survey and details of the proposed camp site.
10. BeneFIts.oF.reClamatIon.
− Providing needed land for use
− Extending land capacity at the site
− Lowering operational cost.
Costs for reclaiming the site were relatively low for the following reasons:
− The distance for transporting the produced materials was only a few metres away.
− The management authority avoided commercial hauling prices by using its own trucks and employees to transport the reclaimed for eventually this was resulted

105
to when the pace of work by the dredgers were dismally slow for the materials were not so easy to come by from the designated chosen spots…
− The landfill equipment was operated by the same management authority, thus no tipping fees were required.
11. proBlems.enCountered.
11.1 Collapse of bond walls There were series of this at the site due to the thickness of the mud. The mud was 3m thick, and as such while dredging was going on, the areas around where materials were being produced from, were always collapsing. The excavator had to be used to remove the mud before dredging could continue. If this is not done, the mud sticks to the dredge’s cutter and affects the production of the dredge. And this caused some down time while dredging.
Due to the above, surrounding farm owners were always at site complaining of such incessant pollution to their farm and as a result, the dredge had to relocate. This again means down time.
11.2 Increasing wear and tear of equipment Reclamation activities shorten the life span of the equipment. For excavators and bull-dozers are continuously on the use due to the high density of produce being handled. In fact there were series of breakdown of such equipment. It was always the case of overheating and as such the equipment had to stop work for some hours. Hence down time. The toll on the machine cannot be overemphasised
12. ConClusIon.
However , as had been mentioned earlier on in the course of this project, the company due to the slow pace of work by the contracted dredgers, that were small; (for only small dredgers that could enter the almost land - lock canal for they were virtually car-ried – in by excavators) and as such their capacity cannot produce the pace required. And again, due to the materials that could not be found in commercial quantity and the attendant muddy hiccups that were experienced, which resulted onto expensive downtime loss, the company had no choice but to resort to haulage of materials from nearby sand beach. In fact, so many tippers were engaged instantly, that within a few days, about five thousand cubic metres were hauled and spread on site. (See figure 7 below. )
At the moment, 75% of the area has been filled to capacity and work is going on at top speed. In fact the residential area has been completed with all its facilities and the workers are already resident.
This project has afforded the people currently with gainful employment, improved quality of life as cash is readily available, reduced incidence of crime, increase in gov-ernment revenue due from tax on company facilities, and from income tax, afforded

106
time and space for relaxation. Thus the joy and human satisfaction this has occasioned had in no small way made for the relative peace the State and thus Nigeria by extension now enjoys currently.
reFerenCes
Encyclopaedia Britannica Forster, G. 1994. Assessment of Landfill Mining and the ef-fects of Age on Combustion of recovered Municipal Solid Waste. Landfill Reclamation Conference, Lancaster, PA.
U.S. EPA. 1997. Report on Landfill Reclamation. EPA530-F-97-001. Washington, DC. June Van Muijen, H. Dredging and Reclamation: Trends and Future. Wikipedia, the free en-cyclopaedia
BIograpHICal.notes.
mrs..angela.kesiena.etuonovbe has a B.Sc.(Hons) degree in Surveying, Geodesy & Photogrammetry from the University of Nigeria, Enugu Campus. She is a Registered Surveyor and the first female Surveyor in Private Practice in Delta State. With over four-teen years of experience in the practice of Surveying, Engineering and Mapping. She also has a Master in Business Administration (MBA).
She is a Federal surveyor, a consultant of no mean repute, a prolific writer, a Lady of the Knights of Saint Mulumba Nigeria, Member of the Nigerian Institution of Surveyors, the indefatigable Public Relations Officer of the Nigerian Institution of Surveyors - Delta State Branch, and the Coordinator, Women – In - Surveying for Edo and Delta States.
Figure 7: Reclaimed land of the camp.

107
Over the period, she had successfully executed a research work on “road.ConstruC-tIon.In.nIgerIa.–.deFeCts.and.solutIons.” And she is currently on a research on lasting “solutIons.to.erosIon.proBlems.In.delta.state.nIgerIa.
From her school days, she has always been an icon to female Surveying Students and has been championing the course of Gender inequality in the Survey Profession in Ni-geria.
She presented two papers “Under Represented Group – Projecting the Image of the Nigeria Female Surveyor” and “Administering Marine Spaces: The Problem of Coastal Erosion In Nigeria – A case study of Forcados South Point, Delta State” at the XXIII Inter-national FIG Congress at Holiday Inn, Munich, Germany.
She had authored eight informative, educative exciting and highly spiritual books cur-rently on the Bookshelves. Over 5000 copies of god.the.Father.loves.you.personally.have been printed in the past two years and distributed freely to prisons, hospitals, communities, youths, schools and the needy. She is excited at challenges the Survey challenges not an exception.
ContaCts.
Mrs. Angela Kesiena Etuonovbe AnGene Surveys & Consultants 37 NNPC Housing Com-plex Road Ekpan, Delta State NIGERIA Tel. + 234 080 3358 4007; + 234 080 5272 4135 Email: [email protected]

108
restruCturIng.oF.a.natIonal.HydrograpHIC.servICe.–..CroatIan–norwegIan.HydrograpHIC.InFormatIon.proJeCt.(Crono.HIp)egil.aarstad,.norway.
abstract..The Norwegian Hydrographic Service (NHS) and the Hydrographic Institute of the Republic of Croatia (HHI) have successfully carried out a joint project named the Croatian-Norwegian Hydrographic Information Project (CRONO HIP).
The main goal of the project was to provide the Hydrographic Institute of the Republic of Croatia with new technology and methods for data collection, data management and nautical chart production. The project was carried out in co-operation between the Norwegian Hydrographic Service and the Hydrographic Institute of the Republic of Croatia. Jeppesen Marine was elected industry partner by international tender.
In addition to drawing from experience that the Norwegian Hydrographic Service had acquired from their own recent MINTEC (Maritime Infrastructure - New Technology for production/management of Electronic Navigational Charts and paper charts) project, the CRONO HIP project built also on experiences gained during the Croatian Norwe-gian Geographic Information Project (CRONO GIP), supporting the topographic map-ping activities in Croatia through support to the State Geodetic Agency (SGA) and the Croatian Geodetic Institute (CGI).
key.words: National Hydrographic Services, cooperation, Capacity Building, Public Pri-vate Partnerships, Croatia, Norway
1. proJeCt.oBJeCtIves.
1.1 Digital production line The main objective was to define a complete digital production line in the HHI and to implement a production and data management capacity within the organisation. The production line would have to cover the data flow from multibeam surveying, data processing, data management and chart/ENC-production. In addition, the project fa-cilitated scanning and vectorisation of existing analogue fair sheets. Special emphasis was put on establishing quality mechanisms in the production line
1.2 Scanning and vectorisation of analogue fair sheets. A relevant part of the HHI’s hydrographic fair sheets was scanned, vectorised and sub-mitted to a data management system that supports production of electronic and hard-copy nautical charts as a part of an overall digital production line. Through the project HHI was provided with the necessary software, hardware and training.

109
1.3 Multibeam survey system The HHI established adequate capacity to undertake multibeam survey data acqui-sition using HHI’s vessels, and also established data processing facilities. The HHI ac-quired multibeam echo sounder systems, together with a system for archiving, post processing, data reduction and data management, as a part of the production line.
1.4 Spatial data management system A task and object oriented database system was established in HHI for efficient man-agement of hydrographic information, as a central part of the HHI’s production line. The established database system also enables HHI to better manage other hydrographic information such as electronic chart data, tidal measurements, oceanographic data, Notice to Mariners, etc. The database system is closely integrated with the chart pro-duction and management system. Future interaction with Spatial database server in the State Geodetic Administration in Croatia was emphasised.
1.5 Chart production and management system A requirement from HHI was to strengthen the digital production facilities to support an integrated and synchronized production of electronic and hardcopy charts, as a part of a digital production line. The analysis performed during the specification process resulted in an approach of looking for one system/supplier covering the whole produc-tion line from post processing to chart production and subsequent maintenance.
1.6 Quality system The project was set out to be implemented in a way that it would simultaneously sup-port the establishment of a quality system in HHI. The implementation of a quality sys-tem was not part of the project
2. proJeCt.tasks.
2.1 Feasibility study for establishing a digital production line in HHIA technical-economical feasibility study for a new production line was conducted as the first stage of the project. The study outlined the requirements to the organisational system (structure, competence, capacity etc.) and evaluated which activities had to be done internally or externally. It discussed technical requirements and capacity for a new production system, outlined any constraints to be expected when changing tech-nology, analysed the total cost of the proposed solution(s), possible alternatives etc.. How to balance the capacity between the different activities in a digital production line was emphasised. It was also important to keep in mind that the capacity building in the project should be levelled with the goals/objectives of HHI on a longer time scale.

110
2.2 Scanning and vectorisation of analogue fair sheetsA scanner system should be operated by HHI or a partner, for example the State Geo-detic Agency (SGA). A few workstations would need to be installed at HHI for conver-sion of hydrographic fair sheets to digital form. In addition a file server is to be installed to support online storage and usage of scanned raster files. The fileserver shall have a basic backup system.
The vectorisation software shall be integrated with the spatial database system in the sense that an efficient way for uploading of vectorised data must be developed.
A specially tailored training program shall be conducted at SGA’s scanning centre in Zagreb. The supplier of the system should preferably establish a local entity in Croatia, which can provide support on the vectorisation software and general training in the software, both in Croatian language. Most of the training related to vectorisation soft-ware shall be given in Croatian language by supplier’s local support office. Software shall be delivered with support for the whole project period. The vectorisation software shall be tailored to Croatian fair sheets standard.
Croatia has approximately 25,000 hydrographic fair sheets, and one task is to qualify the most relevant subset of sheets for conversion. The final number of fair sheets will be determined during the Feasibility Study.
HHI will provide manpower for scanning and/or vectorisation activities as required.
An expert from Norwegian Hydrographic Service will assist in the specification of the system and in the initial phase of the scanning and vectorisation activities.
2.3 Establishing a multibeam survey system A multibeam echo sounder system should be delivered to HHI. The system must in-clude additional sensors (surface and profile), heading, gyrocompass, vessel motion compensation system and positioning system. Software for survey planning and data processing should be part of the delivery.
Experts from Norwegian Hydrographic Service (NHS) will give support to prepare re-quirement specifications, installation and testing (calibration) of the multibeam echo sounder system and additional sensors. The work is to be done in co-operation with HHI experts.
Training must be conducted on site both as classroom training and on board the vessel(s). The vendor of the system must play an extensive role in the training pro-gramme. Special attention should be made to testing and calibration methods.
HHI will provide manpower and make vessel(s) available for the survey activities during the test period.
Post processing, data reduction and management of the multibeam echo sounder data and related data, data storage and archiving must be defined in Feasibility Study. If necessary, experts from NHS will assist in these activities (depending of the type of equipment purchased).
Methods/routines for utilisation in a production environment should be described and documented.

111
2.4 Establishing a Spatial Data Management and Chart Production system
Based on the feasibility study, the project shall procure and implement a complete system for managing the spatial data and producing/managing ENCs and hardcopy charts. If required, the system shall include all data management and chart/ENC-pro-duction tools and processes.
The activity shall provide procedures, software and solutions to efficient transfer and preparation of data for uploading to the spatial database system. A data model will be developed to facilitate management of processed bathymetry data and vectorised fair sheets data. The data model shall be extendible for integration of other marine infor-mation.
The spatial data management system will preferably build on the existing Oracle data-base in HHI, to make the most of HHI’s experience with this system. Also, emphasis will be put on possible combined action between HHI and the State Geodetic Administra-tion in Croatia, which also is using an Oracle Spatial database.
HHI has done some investment in dKart software for editing and inspection of S-57 data, as well as training related to the software and S-57 in general. The new system may build on this software.
The NHS is currently procuring a new chart/ENC production system, and experience from the organisation’s technology development work will be input to the activity.
If needed, a consulting company will be given the task to produce necessary specifica-tions for the new system in close co-operation with HHI, and with contribution from NHS. HHI shall, in co-operation with NHS undertake the procurement based on the developed specifications.
3. proJeCt.management.and.organIsatIon.
The directors of HHI and NHS will lead the Steering Committee, and appoint the other members of the committee. The Steering Committee’s main role is to ensure that the project’s main goals are achieved, and to make decisions concerning the project’s over-all plan and budget.

112
The HHI will be responsible for appointing a project manager for the overall project. The project manager reports to the steering committee. His main duty is expert leading of the whole project and is responsible for progress, results, reporting and risk manage-ment, according to the suggestions of the Feasibility Study and Steering Committee. The project manager will work in HHI’s office and in close co-operation with HHI’s man-agement and staff. The HHI will also appoint an assistant project manager, responsible for advising and supporting of the project manager.
The NHS will appoint a project advisor who will manage the Norwegian contribution to the project, including manpower, expertise and funding. The project advisor will co-operate with the project manager.
Each main project task will have a task leader. The task leader will report to the project manager, and will be responsible for the task accomplishment. The task leader can be HHI staff or hired consultant. For procurement processes the task leader might be the vendor’s main representative.
4. proJeCt.sCHedule.
The project is expected to last for 36 months.
Within this time frame the scanning and vectorisation of analogue fair sheets, and the establishing of a multibeam surveying system, will be completed. The specifications for a production line will also be produced, but procurement and implementation of the complete system may require additional funding. This will be clarified through the feasibility study.
The project manager will be responsible for building and maintaining the project plan and schedule.
reFerenCes.
Croatian-Norwegian Hydrographic Information Project (CRONO HIP), Project Descrip-tion, Croatian-Norwegian Hydrographic Information Project (CRONO HIP), Require-ments Specifications Norwegian Hydrographic Service, MINTEC Project Description Jeppesen Marine, dKart Office System Description
Norwegian Hydrographic Service, Tore Haye Hydrographic Institute of the Republic of Croatia, Zvonko Gržetić and Željko Bradarić Jeppesen Marine, John K. Klippen
BIograpHICal.notes.
Egil O. Aarstad, Manager; Jeppesen Marine, has been working for the HydroService Business Unit in C-Map then Jeppesen since 2002. With a degree in electronics from Stavanger University he started his career in marine electronics product development. With additional education in international business he later took a special interest in developing, managing and training of international distribution networks. With ex-perience from management positions in Norwegian international companies he now heads the HydroService business unit of Jeppesen Marine. Jeppesen Marine is a mar-ket-leading provider of vessel operations services and digital navigation solutions,

113
based on worldwide vector chart data type approved to ISO19879, meteorological in-formation and transmission technologies. Jeppesen corporate information is available online at www.jeppesen.com.
ContaCts.
Egil O. Aarstad Jeppesen Marine Jeppesen Norway AS P.O. Box 212 4379 Egersund Norway Tel. + 47 51 46 47 00 Fax + 47 51 46 47 01 Email: [email protected] Web site: www.jeppesen.com/marine

114
marIne.geospatIal.soFtware:.generatIng.eConomIC.BeneFIts.From.HydrograpHIC.data.and.CalCulatIon.oF.marItIme.BoundarIes.serge.levesque.and.alexis.Cardenas,.Canada.
abstract.. With its suite of software specially designed for hydrographic and marine applications, CARIS can help generate economic benefits from marine geospatial data.
Economic benefits will arise from the extension of the maritime states’ sovereign terri-tory under the United Nations Convention on the Law Of the Sea (UNCLOS). In this case, CARIS LOTS provides geodetic calculation and analysing tools to better process and interpret bathymetric data. Deep bathymetric data is required to define the 2500 m iso-bath and the morphological foot of the slope, both of which are used in the definition of criteria for delimiting the extension of the juridical continental shelf under Article 76 of UNCLOS. Once defined or resolved (in the case of disputed boundaries) the maritime limits and boundaries geospatial information can help generate revenue from offshore resources and their management.
key.words: marine geospatial data, hydrography, economic benefits, maritime bound-aries
1. IntroduCtIon.
Hydrographic survey data is becoming more useful as it becomes the basis for eco-nomic geospatial applications. New software tools are necessary to insure that the eco-nomic benefits are realized by the countries owning these data. A tool for calculating maritime boundaries complying with the United Nations Convention on the Law of the Sea is presented as a way to use this survey information to establish or expand the national boundaries of coastal states.
2. geospatIal.tool.For.resolutIon.oF.marItIme.Boundary.dIsputes.and.eXtensIon.oF.tHe.natIonal.terrItory.
CARIS LOTS was designed to calculate maritime boundaries in compliance with the United Nations Convention on the Law Of the Sea. These maritime boundaries and limits include bilateral maritime boundaries, the 3 nautical mile (3M) , the territorial sea (12 M), the contiguous zone (24 M) , the exclusive economic zone (200 M) and the extension of the juridical continental shelf beyond 200 M. Calculating and resolving these maritime boundaries clarifies the jurisdiction of the sovereign governments to which they belong.
Requirements of the United Nations Convention on the Law Of the Sea (UNCLOS) call for geodetic tools (United Nations, 1999). Many of the maritime limits and boundaries must be calculated geodetically rather than using map projections coordinates which bias the results.

115
2.1 Territorial Sea Baseline (TSB) as the Starting Point A large majority of the maritime boundaries are derived from the territorial sea base-line model. One of the constraints of the juridical continental shelf’s extent is directly calculated from the TSB model. This TS baseline model is maintained by national hydro-graphic offices as part of their surveying mandate. It forms the delimitation between the internal water and the territorial sea. It can use capes, headlands and low water elevations with permanent structures such as light houses as well as low water eleva-tions within 12 M of the coast. More information on the use of low water elevations and their definition is described in the United Nations Convention on the Law Of the Sea (UNCLOS) (United Nations, 1983; United Nations,1993).
The territorial sea baseline is a vital national limit defined by hydrographic criteria. It is based on published nautical charts data and recognized surveyed and published geo-graphic points.
Two types of TS Baselines are used: straight baselines and normal baselines. To each type of baseline, a geodetic Envelope of Arcs (EoA) tool is associated. Straight segments from straight baselines contribute to the limits whereas each normal baseline point is considered individually to produce the EoA.
Support and maintenance of the Territorial Sea baseline is assured in LOTS by a provi-sion of good data import tools, specialized digitizing tools and raster data display:
– BSB raster nautical charts
– GeoTIFFs of scanned geo-referenced paper charts
– MrSID satellite imagery
– TFW/TIFF georeferenced images.
2.2 Resolving Disputed Boundaries In order to determine a state’s extension of its juridical continental shelf, bilateral boundary delineation or boundary dispute resolution may be necessary.
The extension of the national territory beyond 200 M means that new opposing neigh-bours can now share a boundary or that adjacent neighbours need to consider resolu-tion of disputed boundaries or seaward extension of their bilateral boundaries. LOTS provides a tool for a mathematical solution called the median (for opposite states) or equidistant line (for adjacent states). This theoretical solution uses the TSB of each state to calculate an unbiased bilateral boundary dependant on inflection points of the two TSB models. This theoretical boundary can form the starting basis for boundary nego-tiations between two states.
Only the major inflection points on the TSB will contribute to the equidistant or me-dian line between two states. Figure 1 (see next page) shows hypothetical median and equidistant lines that can be used for dividing the Arctic ocean beyond the 200 M limit. Figure 1 illustrates the construction lines of a hypothetical equidistant line between the US state of Alaska and Canada. Contributing points must come from both TSBs and have preferably 3 points at the same distance of the common equidistant point, 2 from one TSB and 1 from the other TSB. All distances for the median/equidistant line are calculated geodetically. The TSB for Canada is published on the United Nations internet

116
site for the Division for Ocean Affairs and Law Of the Sea (DOALOS), Office of Legal Af-fairs. The TSB for Alaska was approximated by digitizing the water line from the raster backdrop of LandSAT TM7 satellite mosaics with resolution of 15 m on the ground. The equidistant line was extended to 600 M to allow for a significant extension of the con-tinental shelf beyond 200 M. In the Canada Basin of the Arctic ocean, this assumption of a significant extension of the continental shelf is based on the large accumulation of sediment associated with the Mackenzie river delta.
Note that the Blue line along the meridian at 168° 58’ 37”W outlines a boundary agreed between the Russian Federation and the USA (United Nations, 1990). However, this mari-time boundary could be disputed by Canada and Denmark where it nears the north pole.
LOTS also provides other alternate tools for bilateral boundary delimitation: the bisec-tor line, the loxodrome and the geodetic line. Some of these tools will also require the contributing points of TSBs from opposing or adjacent countries in their calculations.
2.3 Extension of the Continental Shelf under Article 76 The extension of the juridical continental shelf under article 76 of UNCLOS requires ac-quisition of new constraining bathymetric and geophysical survey data. Although actual hydrographic data is required as proof for a submission to the United Nations, it is highly recommended to conduct a thorough desktop study using all available national data and public domain data to evaluate the level of effort involved in such a submission.
Coarse bathymetric grids derived from Satellite altimetry and available ship track data can be used within the framework of a desktop study. ETOPO2 and the World Sediment thickness grid available from National Geophysical Data Center in Boulder, Colorado, USA are used to display results obtained with LOTS’s tools.

117
The extension of the juridical continental shelf beyond 200 M is defined by 2 constraints and 2 formulae:
– The distance constraint: 350 M calculated from the TSB (EoA).
– The depth constraint: 2,500 m isobath + 100 M (EoA)
– The distance formula: Foot of the slope (FOS) + 60 M (EoA)
– The sediment formula or Gardiner line, sediment thickness equal to 1% of the distance from the FOS. As indicated, the Envelope of Arcs geodetic tool has an important role in the calculations.
2.3.1. Constraints.The distance constraint is based on the TSB. It is calculated as a 350 M geodetic enve-lope of arcs (EoA) in the same way as the 200 M EEZ was calculated.
The depth constraint is based on the 2500 m isobath. In the desktop study, this isobath can be extracted from a public domain gridded data set such as ETOPO5, ETOPO2 or GEBCO1. An envelope of arcs (EoA) tool is used to calculate the constraint at 2,500 m + 100 M. Each point on the 2,500 m contour is considered as a normal point for the EoA calculation.
The combination of the seaward-most part of each constraint will form the final con-straint beyond which the seafloor and its subsoil cannot be claimed as an extension of the continental shelf. The 2,500 m isobath from plateaus and submarine elevations of continental origin may push the constraint seaward as illustrated in Figure 2. Proof of the continental origin must however be provided.
2.3.2. Formulae.The formulae are based on a geo-morphological parameter, the foot of the slope (FOS) which indicates the boundary between the continental slope and the continental rise. UNCLOS defines this FOS as the maximum change in gradient found on the slope. LOTS provides a FOS profile analyzer tool to perform this task.
Note that the work of the analyzer tool to locate the foot of the slope is made easier by the availability of a complete profile covering all the morphological provinces of the continental shelf: the continental plateau, slope, rise and abyssal plain.
LOTS uses bathymetric profiles of the morphological continental shelf to determine the FOS see Figure 3). Two methods of filtering the bathymetric profile allow generalizing the seafloor to remove small wavelength noise and automatically detect candidates for the FOS. The first filter is a Douglas Puecker piecewise linear best fitting solution (blue). The tolerance can be adjusted and some of the noise features can be filtered manually. This filter is indicated in blue and will yield FOS candidates at points of major changes in gradient. The second filter is a Fast Fourier Transform (FFT) which allows to low-pass the long wavelengths. The frequency content of the low-pass filter is adjustable. The second order derivative (gold) of the generalized morphological shelf function (red), shows the rate of gradient change. The highest second derivative’s peak is then the slope’s maximum change in gradient (FOS).
The user can choose the best candidate for his FOS by choosing one of the filters can-didates which can define a conservative or an aggressive scenario. Selection of the FOS can also be done manually by dragging a FOS marker selector to the proper position.

118
FOS makers are created on the display and are used to calculate the FOS + 60 M. Stra-tegic location of these FOS on spurs rather than canyons can promote the sovereign country’s interests by pushing the formula seaward.
The Gardiner line also uses the FOS markers but requires sediment thickness informa-tion from seismic surveys. A special sediment 1% analyzer is used for this. A “sediment 1% marker” is placed where the sediment thickness is equivalent to 1% of the distance from a selected FOS marker. LOTS also provides a SEG-Y analyzer to allow digitizing of sediment sequences with different average seismic velocities to better extract seismic thickness from reflection seismic profiles
The distance Formula and Gardiner line are combined into the Formulae line. This For-mulae line is produced by retaining the seaward-most component of each formula line.

119
Large contributions to area gains are associated with plateaus and submarine eleva-tions of continental origin as seen in Figure 5.
2.3.3. outer.limit.The outer limit of the continental shelf is obtained by combining constraints and for-mulae.
Figure 6 shows an example of hypothetical outer limits of the juridical continental shelf for southern Africa. The juridical continental shelf can be extended up to the limit justi-fied by the formulae but not beyond the constraint. Combining the landward-most part of the constraints and the formulae lines defines the outer limit of the juridical

120
continental shelf under Article 76 of UNCLOS. Calculated hypothetical areas of conti-nental shelf extension for a desktop study of southern Africa are given in table 1 below.
In the cases where bilateral boundaries are disputed, these area calculation results will certainly change depending on the results of negotiations, treaties or international court rulings. Changes related to better, more accurate and more recent hydrographic and geophysical survey data will also affect the results. These areas of extension of the juridical continental shelf must be supported by accompanying proof of the validity of the continental origin of the associated plateaus and submarine elevations as evidence to the contrary (United Nations, 1983; United Nations 1999).
Once calculated, the claim for the new maritime limits must be submitted with sup-porting data and reports to the United Nations. After submission and acceptance, the new maritime limits will become national boundaries that can be published and in-cluded in official nautical charts. They also become available for inclusion in marine cadastres. These maritime limits and boundaries are then used to define rights and roy-
Hypothetical.continental.shelf.extension.under.unClos.article.76.restricted.to.Figure.6.results.of.the.geodetic.area.calculations
Country. area.to.gain.(.km2).
Angola 37138.89
Gabon 24544.75
Ile Europa (France) 15196.22
Madagascar 653320.07
Mauritius 282555.78
Mozambique 63453.15
Namibia 663704.07
Seychelles 67099.26
South Africa 782594.77
Table 1: Hypothetical extensions of the Continental Shelf.

121
alties on offshore leasing blocks, thus opening the way to additional national revenues from offshore natural resource exploration and exploitation.
4. ConClusIons.
Good quality hydrographic data combined with existing published marine geospatial data are key elements for generating economic benefits from the delineation of mari-time boundaries using marine geospatial software such as CARIS LOTS.
Accurate hydrographic and shoreline surveys along with published nautical chart data information are essential to define the territorial sea baseline (TSB) model which im-pacts many of the maritime boundaries. In the delimitation of the outer limit of the juridical continental shelf, bathymetric data in deep waters is also needed for locating the 2500 m isobath and the morphological foot of the slope (FOS). A coastal state can use the results of the desktop study to investigate improvements to the TSB and to plan necessary bathymetric survey coverage.
Some of the economic benefits generated by the definition of new maritime bounda-ries or resolution of disputed maritime boundaries are:
– Clarity of boundary definition abating conflict between neighbours
– Clarity of jurisdiction promoting national wealth through management of un-disputed offshore natural resource (such as offshore block leasing).
– Acquisition of new national territory under UNCLOS Article 76 where the natural resources of the seafloor and subsoil can be exploited.
As demonstrated in the hypothetical desktop study of southern Africa, significant gain in territory can be expected by many coastal states as a result of a claim for extension of their juridical continental shelf under Article 76 of UNCLOS. This endeavour, however, requires mobilization of resources both human and monetary, as well as the use of the right tools.
reFerenCes.
ETOPO2, 2-minute Global Relief Data (2001), US Department of Commerce, NOAA , Na-tional Geophysical Data Center, USA
United Nations (1983). The Law of the Sea: Official Text of the United Nations Convention on the Law of the Sea with Index and Final Act of the Third United Nations Conference on the Law of the Sea, United Nations, New York.
United Nations (1990), Office of Legal Affairs, Division of Oceans Affairs and Law Of the Sea (DOALOS), Legislation and Treaties, Agreement between the United States of America and the Union of Soviet Socialist Republics on the maritime boundary,1 June 1990. United Nations, New York.
United Nations (1993). Office of Legal Affairs: Division for Ocean Affairs and the Law of the Sea (DOALOS). The Law of the Sea: Definition of the Continental Shelf. An Examination of the Relevant Provisions of the United Nations Convention on the Law of the Sea., United Nations, New York.

122
United Nations (1999). Scientific and Technical Guidelines of the Commission on the Limits of the Continental Shelf, from the Fifth Session of the Commission on the Limits of the Continental Shelf (CLCS), New York May 13-14, 65 p.
BIograpHICal.notes.
Mr.José.alexis.primelles.Cárdenas, B.Sc. Geodesy and Cartography. CARIS.
Before joining CARIS as a technical subject matter expert in CARIS marine software products, he worked as a hydrographer and cartographer for the Cuban Hydrographic Service for eight years. Mr. Primelles Cárdenas has been in the Marine GIS industry for 15 years now. Since year 2000 he provides technical support, training and consultation in several languages on hydrographic data management for nautical charting purpos-es as well as on delimitation of maritime boundaries.
Mr.serge.lévesque, B.Sc. Geological Engineering, M.Sc Oceanography, CARIS Mr Serge Lévesque is Product Manager for CARIS LOTS at CARIS Headquarters in Fredericton, New Brunswick, Canada. As a consultant geophysicist, he worked for the Geological Survey of Canada on geophysical data compilations of the North Atlantic and Arctic oceans and on tectonic plate reconstructions at the Bedford Institute of Oceanography, Nova Scotia. Mr. Lévesque was Research Associate at the Atlantic Centre for Remote Sensing of the Oceans from 1993 to 1995. He worked in the private sector on remote sensing airborne surveys and in the offshore before joining CARIS in 1999. His fields of expertise at CARIS are in hydrographic data processing, digital chart production and the LOTS law of the sea software. He provides LOTS training and technical services since 2002.
ContaCts.
Mr Alexis Cardenas Technical support consultant CARIS 115 Waggoners Lane, Frederic-ton, New Brunswick CANADA Tel. +1 506 458 8533 Fax + 1 506 459 3849 Email : [email protected] Web site: http://www.caris.com
Mr Serge Lévesque CARIS LOTS Product Manager CARIS 115 Waggoners Lane, Frederic-ton, New Brunswick CANADA Tel. +1 506 458 8533 Fax + 1 506 459 3849 Email : [email protected]

123
tHe.eConomIC.ImpaCt.oF.approprIate.eduCatIon.In.HydrograpHy.david.dodd,.Canada,.gordon.Johnston,.united.kingdom.and.andrew.Hoggarth,.Canada.
abstract..The collection, processing and analysis of hydrographic data are highly tech-nical processes requiring specialize training and education. Personnel lacking in either of these areas run the risk of negating the validity of the information derived from a survey, leading to the need to re-survey; or even worse, leading to incorrect decision making based on faulty information. The costs in personnel and ship time surround-ing hydrographic surveys are extensive. The economic impact of erroneous decisions based on bad information is immeasurable. Competent hydrographers must be both well trained and well educated. Traditionally, training and education have been dealt with separately. Vendors of modern hydrographic instruments and software are in an excellent position to help combine the two. Collaboration between hydrographic or-ganization, hardware and software vendors, and academia can lead to the develop-ment of education/training modules that would benefit all in the industry.
key.words: Hydrography, Training, Education
1. IntroduCtIon.
One of the most challenging aspects of modern hydrography is the development of personnel. Technological advancements over the past few decades have led to signifi-cant changes in the methodology, and complexity, of data collection, processing and interpretation. While the science of hydrography has made great strides, education and training of the general workforce has not kept pace. This has led to a significant shortage of competent hydrographers, at all levels of the profession.
It is clear that an inadequately prepared workforce will be unable to conduct their work in an effective manner, leading to a negative impact on the economic aspects of hydro-graphic surveys and their products. The consequences of inadequate education and training are; misuse of software and hardware, low confidence in results, and expensive and inappropriate interpretation of those results.
Hydrographic education can take many forms from theoretical to hands-on, and have different methods of delivery, from in the classroom to out in the field. Ideally, it is a combination of all. This paper discusses some of the delivery methods utilized today and suggest some alternatives. Traditional education offerings are given by a variety of providers, including: naval academies, universities, private industry or other organisa-tions through bi-lateral agreements or capacity building initiatives.
Any educational provision is a step in the right direction but certain formulas are known to get excellent results. For example, by combining vendor training with formal educa-tion, attendees can learn the required theory while putting it into practice; this will be explored through the paper. Industry placement and work experiences extend the interaction of students and their potential employers. Some training relies upon this, whereas others may concentrate on classroom and laboratory based activities. Vendor and manufacturer provided academic licensing programmes can be an effective way

124
of making sure enough software and assets are available for educational activities, and can often be made with relatively minimal investment.
Practical training through short courses and workshops must meet the needs of the learner and the sponsor organization. A clear preference appears to support a modular based approach. Also, a mobile workforce requires that all individual modules, when-ever and wherever completed, be compiled for some form of recognition. This could be a certificate of completion, certificate of competence, diploma or degree.
2. BaCkground.
Preparation of individuals for the workforce varies from on-the-job-training through to university education. Most professions require a combination of both training and edu-cation, and there is a distinction. Training provides the leaner with the skills necessary to complete a particular task; for example; the procedure necessary to operate specific hydrographic data collection software, whereas education provides the background necessary to understand what that software does. Some would say that if a person has the appropriate education, they can easily be trained to operate any hydrographic related software package. On the other hand, someone without the appropriate edu-cation can be trained to operate a particular software package, given time, but will not have the educational background necessary to understand that software, or the ability to transfer that training to another application.
Modern hydrography is a profession that requires both training and education. It is a highly technical field requiring knowledge of computers, software applications, hard-ware integration, power sources, data communications, vessel operations and dynam-ics, and equipment mobilization, to name just a few. It is also a field that requires an ex-tensive academic grounding in math, physics, geodesy, acoustics, oceanography, GIS, GPS, etc. In short, a hydrographer in today’s workforce must be both well trained and well educated. It is for this reason that most hydrographic academic institutions and accreditation bodies emphasize both aspects of the learning process.
3. tHe.need.For.traInIng..
Ignoring either training or education in the development of professional hydrogra-phers can lead to significant economic consequences. Hydrographers without the ap-propriate educational background can be trained to operate equipment and software; however, they will not have sufficient knowledge to evaluate the information being received and recorded. Modern hydrographic surveying equipment has enabled hy-drographers to very accurately survey the seafloor. However, the equipment and soft-ware necessary are very complex and a complete understanding of all processes is nec-essary to meet specified requirements, and to show that the standards have been met. For example: multibeam echosounders require accurate sound velocity measurements at the transducer face as well as through the water column. A solid understanding of oceanography and acoustics is essential to know where, when and how to obtain sound velocity measurements. For another example: determination of the horizon-tal position of a depth measurement is relatively straight forward, especially with GPS. However, a good understanding of the science behind GPS and the propagation of er-rors is necessary to evaluate the uncertainty associated with that position.

125
With appropriate training, the acquisition of modern hydrographic data can be a rela-tively straight forward process. Determining the validity of that information; however, requires a much deeper understanding of the science, which can only be acquired through education. Evaluating what uncertainly is achievable given a particular envi-ronment and survey platform is essential to planning a survey. Determining what un-certainty was achieved in the final product is essential to show that the desired stand-ards have been met. If the hydrographer does not have the education necessary to evaluate system capabilities and data, before, during and after a survey, that data may turn out to be useless, requiring a complete resurvey at great expense.
Dredging contracts are based on the amount of material removed. Often, the volume is computed by differencing pre and post-dredge surveys. An intimate understanding of all aspects of the process from data collection, through processing and final vol-ume calculations is necessary for proper volume calculations. Very slight changes in depth determination can lead to huge differences in the amount of money awarded, and some of these changes can be inserted into the results by the collection or compu-tation process. For example; high-accuracy vertical GPS positioning is becoming very popular in hydrographic surveying. It has been shown that features appearing in data can be generated by GPS processing, and do not, in fact, exist. An intimate understand-ing of everything that goes into the determination of a depth value is essential.
Hydrographic training and education has traditionally been carried out by the organi-sations that provide hydrographic services. For the most part, these groups have not had the time or resources necessary to adequately address the education component. At the same time, many contracts are simply focussed on a single project or discrete operation and therefore the investment and benefit of training is not implicitly tied into the work. Rather it remains a secondary requirement of the personnel to have gained knowledge and experience to compete the works. Organisations that have invested in their staff often benefit from improved survey and cartographic standards of work, less risk, better business relationships and consequently healthier revenues.
4. traInIng.&.eduCatIon.–.settIng.a.standard.
Whilst the industry has benefitted from a considerable number of new technologies over the last decade or so, there has not been quite the same development in the edu-cation and training of personnel. True the advent of the internet, electronic storage media and computers have all enabled a great richness of data and information to be made available at the click of a mouse, or the press of a button, but the need is for structured and focused training that can produce a knowledgeable individual who is competent to survey, acquire data and deliver appropriate results. Where then does one access such a structure that will ensure the correct result from the training? One source is the FIG/IHO/ICA Standards of Competence for Hydrographic Surveyors and Nautical Cartographers1.
These Standards were originally developed in the early 1970’s and are now on the 10th
edition. They address the course content required to enable a student attending a course to be qualified and competent at a certain level. There are two levels, Cat-egory B level for technicians and those starting out in the surveying and cartographic disciplines associated with the marine and nautical environment and the Category A level for the more advanced student who may take charge and lead a project. However

126
whilst these standards offer a Minimum Standard of subjects and detail and knowledge of the specific elements they do not offer a prescriptive means to delivery of the course content. The balance between the practical laboratories and the class room lectures is not defined so as to allow organizations to mould the content into their particular course structure, timetable and schedule. The aim of the Standards is to promote best practice and minimum standards of competence in the personnel completing such a course. In order to achieve this, the Standards are provided free and organisations set their Courses to meet the Standards and then submit their courses for review by the International Standards Board that is made up of experts from FIG, IHO and ICA.
Around the world there are less than 50 such recognised courses (see Figure 2) at the International level. Unfortunately there is an incomplete picture of the total number of official courses being provided but with the changes and developments in training that we are seeing it is likely that a considerable number of additional courses could submit for the Category B or Category A level.
Recognising the practical nature of the work involved there is an emphasis on the prac-tical work and field experience. These elements are representative of the early stages in the data flow of Hydrographic data from acquisition to final product but more and more there are also lengthy practical periods devoted to the processing and manage-ment of the data. However this can lead to a serious aspect for the organisation provid-ing the course and that is the availability and access to software and hardware assets for the training of students. There are many options and often the students are required to gain knowledge of quite complex systems. To this end there is a clear benefit in com-bining the Standards of the FIG/IHO/ICA Board and its documents to that of the train-ing modules of the vendors and manufactures who have both access to their resources but also a comprehensive appreciation of the capabilities and limits of their products and services.
Figure 1: The Distribution of FIG/IHO/ICA Category A & Category B Recognised Courses.

127
5. traInIng.–.delIverIng.tHe.message.
This partnering, of both the provider of the survey system components and the aca-demic institution with its structure and focus on the theoretical aspects, offers a tanta-lising mix of capabilities to deliver cost effective training at a level appropriate for the audience whilst meeting the recognised international Standards. A win-win situation.
Vendor software and hardware training plays a significant role in the development of hydrographers, in both academia and industry. The need for hands on experience within academic programs is very well understood. In order for students to take part in data collection and processing exercises, they must become familiar with the soft-ware and hardware they will be using. Often, industry vendors will supply software and equipment, along with training, at very reasonable rates. These academic partnerships are advantageous to all parties involved. Vendors get exposure to up-and-coming hy-drographers and academia gets access to up-to-date software and equipment, on rea-sonable terms.
In some cases, vendor software can be used as the basis for academic study. Going through the setup and configuration of hydrographic data acquisition or processing software provides incredible opportunities to segue into discussions of basic princi-ples. For example, setting up the geodetics of a project provides an opportunity to dis-cuss geodesy, datums and map projections. Setting up vessel configurations allows for the opportunity to discuss the effect of vessel offsets and vessel coordinate systems, as well as how errors propagate throughout the entire system. Not only do students have the opportunity to discuss the application of concepts, they also have the opportunity to see the effects of applying theory in a real-world situation. An entire course, such as Hydrographic Data Management, can be based on the collection, processing and anal-ysis of real-world hydrographic data using vendor supplied software and hardware.
6. traInIng.–.InCludIng.tHe.stakeHolders.
Hydrographic service providers often hire vendors to train personnel on the use of their software or equipment. The emphasis of the training is to provide the operators with the tools necessary to use the products, usually assuming the trainees have the back-ground necessary to understand the concepts involved, which is often not the case. This type of training provides an excellent opportunity to add education to the training process. For example, a standard software training course may include the use of a tool to compute tides from GPS derived heights at the vessel. This would be a good teach-ing opportunity to enhance the training experience by discussing the issues surround-ing the use of GPS heights in hydrographic surveying, including:
– The direct measurement of the seafloor relative to the reference ellipsoid, re-moving the effects of heave and tide.
– Vertical datum relationships including the geoid-ellipsoid separation, sea sur-face topography, and hydrodynamic modelling.
– The effect of pitch and roll on the vertical separation between antenna and ref-erence point (see Figure 2).

128
Figure 2: Effect of Pitch and roll on antenna to reference point vertical separation.
In many academic programs, training in the use of vendor equipment and software is not nearly as in-depth as it could be. In many training courses, the academic side of the issues usually receives little or no attention. What is need is a complete integra-tion of the two. Modules should be developed using hydrographic data collection and processing software as the basis for presenting theory. Each module could be used as a stand-alone training exercise for industry, and a series of which could be put together to make up a portion (or all) of an academic course. Modules would be generated to meet international standards, such as those in the FIG/IHO Standards of Competence for Hydrographic Surveyors syllabus. Industry and academia could use the models as part of an application for FIG/IHO program accreditation. Industry could also use the modules for employee career development.
7. ConClusIons.
Whilst the vendor may have an initial interest in selling a piece of hardware or software, there is a longer term relationship to be built with both the educational establishment and the students themselves who, it is hoped, will see the benefits of the systems used and upon making their way in the world will adopt and use these system.
Educational and training establishments themselves are able to leverage the expertise and knowledge of the vendors to better deliver practical and up-to-date technology awareness. This has often, in the past, required massive resources and personnel but the modular approach and shared cooperation, to focus a group of students on a spe-cific function and operation using the appropriate tools is proving very successful. A mix of theory and practical classes offers the opportunity to develop the knowledge and skills to both undertake relatively standard tasks and to solve problems.
129
reFerenCes.
1 S-5, The Standards of Competence for Hydrographic Surveyors and S-8, The Standards of Competence for Nautical Cartographers, IHO Publication available at http://www.iho-ohi.net/english/home
BIograpHICal.notes.
David Dodd received a B.Sc. and M.Sc. in Surveying Engineering from the University of New Brunswick (UNB) in Fredericton, NB, Canada. He completed a PhD in Marine Sci-ence at the University of Southern Mississippi (USM). Dr. Dodd spent eight years con-ducting research (high-accuracy GPS) and directing the Hydrographic Science Master’s program at USM and is now a Senior Research Associate with the department of Geod-esy and Geomatics Engineering at UNB. His current research activities are directed to-wards investigating all aspects of hydrographic surveying with respect to the ellipsoid.
Gordon Johnston is director of Venture Geomatics Limited, an independent consult-ing and technical training group in the UK. He joined Decca Survey as a field surveyor, working in Europe and Africa and became Chief Surveyor in 1993. In 2004 he started consulting for nongovernment, commercial and international organisations providing strategic technical, market and commercial services. He is based in the UK and is the chair of the FIG/IHO/ICA International Board on the Standards of Competence for Hy-drographic Surveyors and Nautical Cartographers.
Andrew Hoggarth received a B.Sc. in Mapping Science from the University of Luton in Bedfordshire, England. He then spent 6 years at Racal Survey / Thales GeoSolutions specialising in hydrography and specifically Multibeam Survey. In 2003 Andy moved to Fredericton, Canada to be the Customer Services Manager of CARIS, in 2007 he moved into the position of Marketing and Sales Manager the position that he still holds.
ContaCts.
David Dodd, University of New Brunswick, Fredericton, Canada. [email protected]
Gordon Johnston, Director, Venture Geomatics Limited, Cheam, UK. [email protected]
Andrew Hoggarth, CARIS, Fredericton, Canada. [email protected]

130
new.developments.For.tHe.proFessIonal.eduCatIon.In.HydrograpHy.at.HaFenCIty.unIversIty.HamBurg.(HCu).peter.andree,.volker.Böder,.peter.Bruns,.delf.egge.and.Harald.sternberg,..germany.
abstract.. For twenty years the seaport Hamburg has offered a study program for hydrography students. Since several years the course is certified by the Interna-tional Hydrographic Organization (IHO) as a Category A course. In the beginning of 2006 the „Hamburg University of Applied Sciences“ changed to „HafenCity University, Hamburg“(HCU). In February 2006, the first Master of Science graduates left the uni-versity.
The working and research group Hydrography mainly uses two vessels for education. One of them, the Level-A, has been constructed mainly for educational and research purposes. The equipment on board consists of a modular system including precise GPS positioning and attitude determination, precise INS attitude determination, multibeam echosounder and a parametric sediment echosounder. The students learn processing of the data with different tools like CARIS-HIPS and in projects and investigations for coastal zone management with ESRI products.
However, professional education should approach practical applications. A newly founded company takes on one hand advantage of the equipment and on the other hand helps the university financing the use of the survey vessels and to give their stu-dents an insight into practical surveys.
In times when universities reduce the possibilities for an education in hydrographic surveying, the HCU offers a new approach. The working group inside the Department of Geomatics plans to take part in projects of capacity building and offers an inter-national English spoken master course. The article presents the new concept of the professional education in Hydrography and a short overview of the equipment and processing software used at the HCU.
key.words: Master of Sciences (MSc) Program Hydrography, FIG/IHO Category A, pub-lic-private partnership
1. IntroduCtIon.
For twenty years the seaport Hamburg has offered a study program for hydrography students. Since several years the course is certified by the International Hydrographic Organization (IHO) as a Category A course. In the beginning of 2006 the „Hamburg Uni-versity of Applied Sciences“ changed to „HafenCity University, Hamburg“ (HCU). In Feb-ruary 2006, the first Master of Science graduates left the university.
The working and research group Hydrography mainly uses two vessels for education. One of them, the Level-A, has been constructed mainly for educational and research purposes. The equipment on board consists of a modular system including precise GPS positioning and attitude determination, precise INS attitude determination, multibeam echosounder and a parametric sediment echosounder. The students learn how to proc-ess the data with different tools like CARIS-HIPS and in projects and investigations for coastal zone management with ESRI products.

131
However, professional education should approach practical applications. A newly founded company takes on one hand advantage of the equipment and on the other hand helps the university financing the use of the survey vessels and to give their stu-dents an insight into practical surveys.
In times when universities reduce the possibilities for an education in hydrographic surveying the HCU offers a new approach. The working group inside the Department of Geomatics plans to take part in projects of capacity building and offers an international English spoken master course. The article presents the new concept of the professional education in Hydrography and a short overview of the equipment and processing soft-ware used at the HCU.
2. HIstorICal.overvIew.-20.years.HydrograpHIC.eduCatIon.In.HamBurg-
Professional education in Hydrography has a more than 20 year old tradition in Ham-burg, Germany. Until 1985 hydrographers in Germany usually had to finish two studies, one in nautical sciences and one in surveying. The first consecutive studies “Hydrogra-phy” started in 1985 with 3 additional semesters at the Hamburg University of Applied Sciences (HUAS) and a half-year practical training.
From this point of time Hamburg has offered the only professional education for stu-dents in Germany. After 5 years (6 semesters in Surveying, 3 semesters in Hydrography, 1 semester practical training) the students finished with the diploma in “Vermessung-swesen und Hydrographie” (Surveying Engineering and Hydrography).
For security reasons each professional training location for Hydrography has to fulfil special requirements, namely the Standards of Competence for Hydrographic Survey-ing of the International Federation of Surveyors (FIG) and the International Hydro-graphic Organization (IHO). The Standards of Competence distinguish two different levels for the quality of education, Category-A and Category –B. The higher Category-A courses are defined as follows:
A programme which provides a comprehensive and broad-based knowledge in all aspects of the theory and practice of hydrography and allied disciplines for individuals who will practise analytical reasoning, decision making and develop-ment of solutions to non-routine problems.
Category-B courses are directed to less qualified staff. The certificate has to be renewed every 10 years. In 1990 the International Advisory Board (IAB) of the FIG/IHO certified the consecutive studies “Hydrography” in Hamburg with the highest level Category-A (Academic).
In 2000 a new curriculum was has been established at the HUAS, offering studies in Geomatics with 8 semesters and a master program of 4 semesters in “Hydrography”. It is possible to combine modules from the diploma studies with the master program, so that the diploma in Geomatics and the Master of Science in Hydrography can be reached a total of 5 years. The Master of Science Program “Hydrography” has been re-certified by the IAB of the FIG/IHO at Category-A in 2001.
In January 2006 the Department of Geomatics has been moved from the Hamburg University of Applied Sciences (HUAS) to the HafenCity University (HCU) Hamburg,

132
founded by the Federal State of Hamburg. The HCU starts with the advantage of al-ready well-established departments (architecture, civil engineering, Geomatics, urban planning) coming from the Technical University, the University of Arts and the Univer-sity of Applied Sciences, all of them located in Hamburg. With its Master of Science Programme in Hydrography, the Department of Geomatics is still the only academic institution in Germany offering a two-year postgraduate program which is accredited according to the “Standards of Competence of Hydrographic Surveyors” by the IAB of FIG/IHO at category A.
3. HydrograpHIC.eduCatIon.at.HCu.
From the 1st
through the 4th
semester in the diploma or Bachelor course Geomatics at the HCU there are courses that are compulsory. For example, all Geomatics students (diploma or Bachelor) in Hamburg have to enrol in Hydrography I. The course (2 h) aims to give a basic understanding of and a first insight into hydrography.
For admission to study Hydrography in the Master of Science course at the Department of Geomatics, the following requirements have to be fulfilled:
– language requirements: foreign applicants whose first language is not English must provide proof of their language ability. The following certificates are ac-cepted: TOEFL (550/220) institution code 8226, IELTS (band 6), Cambridge Cer-tificate (CAE, CPE).
– academic / other requirements: Bachelor’s degree in a related field. A good score on the Bachelor’s exam is required. Applicants whose university qualification is from a country outside of the European Union have to take the Graduate Record Examination (GRE) general test.
The Master of Science course Hydrography is offered in English language, so that for-eign students can enter into the course. By taking the course in English language, the German students are well prepared to work abroad. Since Hydrography is an interna-tional study program, one has to prove his/her English language proficiency.
The master course covers modules such as Hydrography (Basics, I, II, III), Higher Geod-esy, GIS-Hydrography, Data Processing, Navigation, Marine Geology/Geophysics, Fun-damental Oceanography, Marine Environment, Software Technology, Practise, Project, and ends with the Master Thesis. Each module can reach 7.5 credit points, in total 120 credit points are possible. Normally students in the master course should absolve 24 hours a week. Details are shown in fig. 1.
According to the IHO Special Publication S-47 (March 2006) approximately one hun-dred courses in Hydrography, Nautical Charting, and Marine Sciences – lasting from one week to five years – are offered worldwide.
Only one third of these courses are recognized as category A or category B courses ac-cording to the “Standards of Competence for Hydrographic Surveyors” of the FIG/IHO/ICA International Advisory Board IAB. There are 19 Category-A courses (9 in the naval sector, 10 in the public/private sector) and 14 Category-B courses (8 naval and 6 public/private).
Due to stagnating public budgets more and more courses – especially Category-A – seem to disappear for years. On the other hand, mainly caused by increasingly used high-sophisticated techniques and software packages, there is a rising need for courses

133
providing a comprehensive and broad-based knowledge in all aspects of the theory and practice of hydrography and allied disciplines.
Additionally, the students in Hamburg can make use of the possibilities to absolve a practical training in the near-by institutions, dealing with hydrography or bathyme-try. For example, such as the Federal Maritime and Hydrographic Agency of Germany (BSH), the Alfred Wegener Institute (AWI, Bemerhaven), the Hamburg Port Authority (HPA) and various companies.
4. eQuIpment.and.logIstICs.
There are 3 survey craft in the HCU’s ship-pool, of which two, namely the LEVEL-A (length 8 m, optimized to operate in extremely shallow water) and the POSEIDON (length 15 m) are mainly used for education and research purposes (see fig. 2). The in-situ-facilities like survey craft, office- and storage-containers are located on the Ship and Buoy Yard in Wedel, belonging to the Water and Shipping Authority (WSA) Hamburg.
The outstanding equipment installed onboard of LEVEL-A offers best conditions for practical exercises: RESON Multibeam SeaBat 8101, INNOMAR Parametric Sub-Bottom Profiler SES-2000 fan incl. Side-Scan, IxSEA motion sensor Octans III, GNSS-Javad-Gyro-4 (GPS, GLONASS), Marine Magnetics Mini Explorer, RESON Sound Velocity Probe SVP 15 and other instruments. Software packages as PDS 2000, Qinsy, WinProfile, ISE for SES-2000, Geo++ ® GNNET-RTK and CARIS HIPS/SIPS/GIS are available for survey planning and data analysis.
Despite the high accuracy of all used sensors (position, heading, heave, roll, pitch and sound velocity), the main problem is to integrate these complementary sensors with the sonar systems with reference to timing and their relative locations to get reliable Digital Terrain
Figure 1: Course of Study Hydrography at the HCU.

134
Models (DTM). To solve this problem, a new Integrated Multi-Sensor System IMSS will be used to measure heading, heave, roll, and pitch under all topographical conditions (e.g. passing huge container ships, running/surveying under bridges and in water-ways between rows of houses as found in the Hamburg Harbour).
The data delivered by the IMSS components (GNSS-Javad-Gyro-4, Motion Sensor Oc-tans III, IMU Inertial Measurement Unit) are integrated by the software GNNET-RTK de-veloped by Geo++ GmbH, Garbsen.
5. tHe.nortHern.InstItute.oF.advanCed.HydrograpHICs.gmBH.(nIaH).
Mainly caused by the limited and stagnating budget for the practical education in hy-drography it became more and more difficult to ensure a high level in hydrographic education at the HUAS with state-of-the-art hard- and software and well trained staff during the past few years. To overcome this situation, the HUAS/HCU invested a lot of money in ship‘s capacity and state-of-the-art survey equipment. With this investment the HCU has entered into a commitment for a significant higher quality in practical education and the implementation of related research projects.
To guarantee a sustainable operation, continuous maintenance and regular upgrades of the equipment and for a greater independence of the public budget, NIAH was founded as a public-private partnership (70% HCU, 30% private companies) in January 2006.
NIAH is responsible to assure a high quality offering for practical exercises for students in hydrography at any time. Besides of the maintenance of the acquired systems it is one of the aims to integrate excellent trained staff into the company. The staff will be trained regularly in close cooperation with the suppliers of the systems and the soft-ware installed onboard the NIAH-vessels.
Figure 2: HCU survey craft for training, research and special purposes.

135
5.1 Advantages of NIAH Moving the operation of the vessels including the equipment from the university to a private company results in lots of benefits:
– highly educated and permanently trained staff,
– state of the art survey equipment,
– specialized exercises and intensive practical training for the students,
– flexible operation and application-oriented research.
To be effective and to keep or extend this high technical standard, NIAH will offer this platform not only for student education in hydrography but also for the use in national and international scientific projects in hydrography and for geophysical, environmen-tal, archaeological or biological investigations.
With the NIAH joint venture the HCU has unique possibilities for the practical educa-tion of its students. This will be most important for the many survey companies looking for hydrographic surveyors who are familiar with the state-of-the-art technology and equipment. These companies are also interested in keeping their staff well educated to ensure that their survey projects are realized with the highest possible accuracy and efficiency.
6. ConClusIons.
By the foundation of NIAH the education of hydrographic surveyors at the HCU will be-come more flexible and reinforced by the associated companies in terms of teaching, practical training and research. NIAH is going to take over new jobs in education and research like international institution-building, professional training and enhancement of positioning systems. First students benefiting from the new public-private partner-ship are the HCU’s master students in hydrography.
The perfectly equipped survey craft allow the HCU/NIAH to operate with an extremely short lead time nationally as well as internationally. The knowledge-transfer to survey companies and to countries developing new hydrographic services will be supported by workshops with all kinds of users. These efforts will create a huge knowledge return to the students at the HCU.
The new future-orientated model of an excellent public university with privately op-erated equipment will attract attention from international students of hydrography. The location in one of the biggest harbours of the world as well as the intention of the president of the HCU to push hydrography ahead will contribute to this goal.
The professional education in Hamburg starts into a new epoch with new ideas. The De-partment of Geomatics today offers it’s well known English language spoken Master of Sciences Program Hydrography at the newly founded HafenCity University, Hamburg (HCU). The study program is supported by a public-private partnership with companies that deal with hydrographic surveying and development of hydrographic instruments.
The HCU invites students all over the world to use the possibilities. Other companies and institutions are invited to take part in the new Hamburg way of securing and sup-porting the necessary professional education in hydrography.
136
reFerenCes.
Sternberg, H; P. Andree; G. Wendt (2006): New Approaches by NIAH supporting hydro-graphical Education. Hydro International, Volume 10, Number 5.
BIograpHICal.notes.
Peter Andree graduated in geodesy from the University Hannover in 1967 and received his Assessor Degree from the Government of the Federal State of Lower Saxonia in 1969. After being head of the Hydrographic Department of the Federal Water and Ship-ping Authority in Hamburg (1969–1974) he was senior lecturer in engineering survey-ing at Hamburg University of Applied Sciences (HUAS, 1974–1980).
He was professor in Surveying Engineering and Hydrography at HUAS/HCU (1980–2006), Senior Scientific Advisor of the Hydrographic Department in a Hamburg State owned consulting company (1982–1996) and vice-president and president of the Ger-man Hydrographic Society (1984–1992). Since 2006 he is scientific director of NIAH.
Volker Böder graduated in geodesy from the University Hannover in 1994. His doctoral thesis from 2002 is about the precise positioning and attitude determination in ma-rine applications. He received his Assessor Degree from the Government of the Federal State of Lower Saxonia in 2005. Since 2005 he is professor for practical geodesy and hydrography at the HafenCity University, Hamburg.
Peter Bruns graduated in geodesy at the University of Hannover in 1968. After work-ing as a research associate he finished his doctoral thesis about trigonometric height measurements in 1975. Since 1975 he was senior lecturer and since 1980 professor at Hamburg University of Applied Sciences.
Delf Egge graduated in geodesy at the University of Hannover in 1973 and passed the upper level state examination in 1975. In 1984 he received his doctorate degree at the University of Hannover in the field of satellite geodesy. Starting 1985, he spent two years as Assistant Professor of Civil Engineering at the University of Washington in Seat-tle. Since 1987 he holds the position of a Professor of Hydrography and Geodesy at the Department of Geomatics at the HafenCity University, Hamburg. He is Vice Chairman of the Department and member of the International Advisory Board on the FIG/IHO/ICA Standards of Competence.
Harald Sternberg graduated in geodesy from the Bundeswehr University, Munich in 1986. His doctoral thesis from 1999 is about the determination of the trajectory of road vehicles with a hybrid measuring system. Since 2001 he is professor for engineering geodesy at the Hamburg University of Applied Sciences and since 2005 he is the Chair-man of the Department of Geomatics at the HafenCity University, Hamburg.
ContaCts
HafenCity University, Hamburg Department of Geomatics Hebebrandstr.1 22297 Ham-burg GERMANY Tel. +49 (0)40 428 27 5300 Fax +49 (0)40 428 27 5399 Email: [email protected] Web site: www.hcu-hamburg.de

FIg.puBlICatIons
The FIG publications are divided into four categories. This should assist members and other users to identify the profile and purpose of the various publications.
FIg.policy.statementsFIG Policy Statements include political declarations and recommendations endorsed by the FIG General Assembly. They are prepared to explain FIG policies on important topics to politicians, government agencies and other decision makers, as well as sur-veyors and other professionals.
FIg.guidesFIG Guides are technical or managerial guidelines endorsed by the Council and record-ed by the General Assembly. They are prepared to deal with topical professional issues and provide guidance for the surveying profession and relevant partners.
FIg.reportsFIG Reports are technical reports representing the outcomes from scientific meetings and Commission working groups. The reports are approved by the Council and include valuable information on specific topics of relevance to the profession, members and individual surveyors.
FIg.regulationsFIG Regulations include statutes, internal rules and work plans adopted by the FIG or-ganisation.
List of FIG publicationsFor an up-to-date list of publications, please visit www.fig.net/pub/figpub

FIG PUbLIcATION 57
ISbN 978-87-90907-94-5
Hydrography involves the surveying and mapping of rivers, lakes and oceans which gives us information about what the seafloor and movement of water above that seafloor looks like. Hydrographic information is typically published in the form of nautical charts and sailing directions both in hardcopy and dig-ital form. These nautical publications are critical for providing mariners with the information they need to navigate ships safely and efficiently. Used in conjunc-tion with meteorological information, nautical publications provide a basis for decisions on where and when a ship can be taken. High resolution hydrographic information in the form of seabed imagery provides a basis for engineering deci-sions on matters such as where to locate a sub-sea pipeline or communications cable.
The International Federation of Surveyors (FIG), through the efforts of the Com-mission 4 workgroup 4.4 on Capacity Building and the Economic Benefits of Hy-drography, has sought to bring awareness and promote the role of hydrography as an essential investment in economic development. This publication provides a snapshot of the workgroup’s efforts from various conferences and symposia to stimulate thought and exchange ideas in this regard.