pub-np-012 rate mitigation options and impacts reference 2
TRANSCRIPT

PUB-NP-012 Information Requests Rate Mitigation Options and Impacts Reference
Newfoundland Power Inc. – Rate Mitigation Options and Impacts Reference Page 1 of 1
Q. Please provide any recent reports or analyses conducted by Newfoundland Power 1
assessing electrification possibilities for its service territories, or for the Province. 2 3 A. Newfoundland Power has conducted research on the electric vehicle market, including 4
potential adoption locally and related economic benefits. The Electric Vehicle Market 5 Assessment report is provided as Attachment A to this response. 6
7 In 2018, as part of an annual Newfoundland Power survey, customers were asked to assess 8
their probability of purchasing an electric vehicle in the next 5 years. Approximately 17% 9 of respondents were somewhat or very likely to purchase an electric vehicle. The 2 largest 10 barriers to electric vehicle adoption were: (i) the cost of purchasing an electric vehicle 11 (27%); and (ii) the fact that respondents were not planning to purchase a new vehicle in 12 the foreseeable future or had recently purchased a new vehicle (23%). Detailed 13 information on the survey results is provided as Attachment B to this response. 14
15 Newfoundland Power is currently working with Newfoundland and Labrador Hydro to 16
complete a new Conservation Potential Study. The study is expected to be completed by 17 mid-2019 and will include an assessment of electric vehicle adoption potential in the 18 province from 2020 to 2035. This will consider local market conditions and how various 19 pricing and infrastructure factors will impact adoption, as well as electrical system impacts 20 and strategies to optimize demand management at various adoption rates. 21
22 The new Conservation Potential Study will also assess the potential for fuel switching to 23 electricity in the residential and commercial sectors. This will include analyzing the size 24 of the market, conducting cost benefit analysis of conversion, and the potential for fuel 25 switching incentives. 26

PUB-NP-012 Attachment A
Information Requests Rate Mitigation Options and Impacts Reference
Newfoundland Power Inc. - Rate Mitigation Options and Impacts Reference
Electric Vehicle Market Assessment Report

PUB-NP-012, Attachment A Page 1 of 24

TABLE OF CONTENTS
Executive Summary ........................................................................................................... 3
EV Markets ....................................................................................................................... 4
EV Market Drivers ............................................................................................................. 5
EV Outlook ....................................................................................................................... 9
EVs in Newfoundland and Labrador .................................................................................. 10
Assessment .................................................................................................................... 15
Appendix A: Electric Vehicle Technologies ......................................................................... 17
Appendix B: Canadian Regulatory Experience .................................................................... 21
Appendix C: Canadian EV Incentive Programs.................................................................... 23
PUB-NP-012, Attachment A Page 2 of 24

3
Executive Summary
Transportation costs are one of the biggest financial decisions a consumer makes. Consumers consider
many factors when purchasing a vehicle including price, operating costs and lifestyle. Since 2010, electric
vehicles (“EVs”) have become an increasingly competitive option in the vehicle marketplace.
In 2017, the estimated global electricity demand from all types of EVs was 54 terawatt-hours.1 That is
enough electricity to power all of Newfoundland Power’s service territory for nine years. In that same
year, the number of EV passenger vehicles reached 3 million worldwide, representing an almost 60%
increase over the number of EVs in 2016. China has the largest EV market, accounting for almost 50%
of the units sold in 2017, followed by the United States. EV sales in Canada continue to grow as well.
EV growth is driven by public policy measures including: (i) financial incentives (ii) tightened regulations
on the emission of pollutants, (iii) low and zero emission vehicle mandates, (iv) investments in charging
infrastructure, and, (v) public education and awareness initiatives.
There are a number of barriers that may impact expected EV growth. These barriers are typically the
upfront capital cost, access to charging infrastructure and public perceptions about EVs. In many
countries, including Canada, public policy measures have been introduced to remove barriers and
advance the EV market. These have largely been related to government greenhouse gas (“GHG”)
emission reduction targets. Vehicle manufacturers are also implementing strategies that will help
increase the adoption of EVs globally.
EV growth is expected to continue across the globe. Bloomberg New Energy Finance predicts that EVs
will achieve price parity with conventional vehicles by 2025.2 They also project that 55% of all new global
car sales will be electric by 2040.3
The Muskrat Falls project will connect the province to the North American electricity grid. As a result,
surplus electricity will be available in Newfoundland and Labrador to fuel an EV market. The development
of new electricity markets is an opportunity to mitigate the impact of the Muskrat Falls project costs. The
net revenue gained from domestic sales could be used to offset the revenue that must be recovered to
pay for the Muskrat Falls project.
Further analysis is required to determine the impacts of EV adoption on the provincial electrical system.
Additionally, research and collaboration between governments and utilities is needed to determine the
appropriate achievable mix of public policy measures required to increase EV adoption in Newfoundland
and Labrador.
1 See International Energy Agency, Global EV outlook, 2018. 2 See Bloomberg New Energy Finance, Electric cars to reach price parity by 2025, June 2017. 3 See Bloomberg New Energy Finance, Electric vehicle outlook 2018.
PUB-NP-012, Attachment A Page 3 of 24

4
EV Markets Global EV stock is expanding rapidly. The number of EVs worldwide reached 3 million in 2017.4 This is
an almost 60% increase over the number of EVs in 2016. As of September 2018, EVs have reached
4 million units worldwide.5
From 2013 to 2015, the United States led EV growth globally. In 2016, China began offering substantial
EV subsidies that accelerated EV sales growth, surpassing the United States as the global leader. China
now has the largest EV car stock with
almost 1.3 million EVs sold, or
approximately 40% of units sold
worldwide. The United States has the
second-highest number of EVs sold.6
The greatest market penetration is in
Norway. By mid-2018, 47% of all new cars
sold in Norway were EVs.7 Norway has the
widest array of EV incentives and has a
goal of 100% zero-emission vehicles by
2025.
4 See International Energy Agency, Global EV outlook, 2018. 5 See Bloomberg New Energy Finance, Cumulative global EV sales hit 4 million. 6 See International Energy Agency, Global EV outlook, 2018. 7 See World Economic Forum, Electric vehicles are half the market in Norway, September 3, 2018.
2017 EV Sales in Canada by Province
Quebec Ontario BC Other
0
200
400
600
800
1000
1200
1400
China US Japan Norway Canada
Num
ber
of
Vehic
les
(000s)
EV Stock by Select Country2013-2017
2013 2014 2015 2016 2017
PUB-NP-012, Attachment A Page 4 of 24

5
EV sales in Canada vary significantly across the provinces. Almost 96% of the 48,000 EVs sold in Canada
by the end of 2017 were in Quebec, Ontario, and British Columbia.8 These provinces are the only
jurisdictions which have strong public policy supports in place and have invested in expanding access to
charging infrastructure.9 Newfoundland and Labrador has the third lowest number of EVs on a per capita
basis, with just 63 in the province, almost 30% of which were purchased in 2017.10
EV Market Drivers Policy Measures EV growth has mainly been driven by public policy measures. Policy measures typically include a
combination of: (i) financial incentives, (ii) tightened emissions regulations, (iii) low and zero emission
vehicle mandates, (iv) investments in charging infrastructure, and, (v) public education and awareness
initiatives.
In China, national subsidies have played a large role in the adoption of EVs. China is expected to continue
to invest heavily in the EV market, viewing the electrification of transportation as a major strategic
industry over the coming decades. The country is predicted to continue to be the largest EV market in
the world through 2040. Beginning in 2019, China will introduce a policy which will require automakers
of a certain size to ensure that 10% of vehicle sales are EVs.11
Progressive public policies in Europe are also expected to accelerate EV adoption. Some European
countries are considering a ban on conventional vehicle sales before 2050. Ireland, the Netherlands and
Germany are proposing bans as early as 2030.12 Norway, which has the most attractive incentives
8 See Electric Mobility Canada, Annual Report 2017. 9 See Appendix B: Canadian Regulatory Experience and Appendix C: Canadian EV Incentive programs. 10 Information provided by Service NL. 11 See Bloomberg Business, China gives automakers more time in the world’s biggest EV plan, September 2017. 12 See The Guardian, EU must end new petrol and diesel sales by 2030 to meet climate targets, September 2018.
252
187
122
29 18 17 14 12 11 10
-
50
100
150
200
250
300
QC BC ON AB MB NB NS NL PEI SK
EV
s p
er
10
0,0
00
Pe
op
le
Number of EVs per Capita in Canada
PUB-NP-012, Attachment A Page 5 of 24

6
globally, is leading the transition to EVs. Consumers who buy an EV benefit from incentives such as
exemption from import or purchase taxes and 25% value added tax. They also avoid road tax, road
tolls, pay half price on ferry transit, receive free municipal parking and are permitted to use bus lanes.
The Zero Emission Vehicle (“ZEV”) program has been one of the strongest drivers for EV development in
the United States. Since 2013, 10 states have adopted the program which requires that automakers
offer zero emission vehicles to improve local air quality and reduce the emissions contributing to climate
change. 13 Quebec and British Columbia have adopted similar policy mandates.14
In Canada, a number of provinces partnered with the federal government to take advantage of
$180 million included in the 2016 and 2017 federal budgets for EV and alternative fuel infrastructure.
Public policy measures which increase EV development can assist the federal and provincial governments
in meeting their GHG emission reduction targets, as the transportation sector accounts for 24% of GHG
emissions in Canada.15
Barriers In order to advance EV adoption, a number of barriers must be removed.
EV market barriers are typically the upfront capital cost, access to charging infrastructure, and public
perceptions about EVs. EVs typically have a higher up front purchase cost than conventional vehicles
13 The 10 states that adopted the ZEV program are: California, Connecticut, Maine, Maryland, Massachusetts,
New Jersey, New York, Oregon, Rhode Island, and Vermont. 14 See Canada’s National Observer, B.C.’s zero emission vehicle mandate may be the toughest in North America.
Here’s what you need to know, November 2018. 15 See Natural Resources Canada, Accelerating the deployment of zero emission vehicles: Atlantic Canada and the
Prairies, March 2018.
37%
27%
21%
7%
4% 4%
Canada's Transportation GHG EmissionsFreight Truck
Passenger LightTrucks
Passenger Cars
Freight Aviation, Rail,and Marine
Passenger Aviation,bus rail andmotorcycleOther
PUB-NP-012, Attachment A Page 6 of 24

7
but lower ongoing operating costs. The typical incremental capital cost difference between a
conventional family sedan and a similar model EV is approximately $19,000.16 The main cost driver for
EVs is the large battery that represents approximately 75% of the vehicle’s power train cost.17 Fuel costs
on the other hand are approximately 60%-70% lower for an EV compared to a conventional vehicle.18
A real or perceived lack of charging infrastructure creates the consumer perception that EVs will run out
of battery power and be left ‘stranded’ or unable to reach their destination. A report published by Bruce
Power L.P., Plug’n Drive, Pollution Probe and University of Waterloo states that 92% of Canadians believe
there are very few places to charge EVs outside the home, and that 86% of Canadians don’t realize
charging an EV at home is an option.19 Despite research that shows most charging events occur at
home, drivers want the extra security that comes from sufficient public access to EV charging.20
16 The purchase price of six EVs were compared to similar internal combustion engine vehicles. The average
difference in price between EVs and the internal combustion engine vehicles was $18,650. 17 Power train typically consists of the main components of a vehicle that generate power. This typically includes
the engine, transmission, drive shafts, etc. 18 Based on electricity rates as of July 2018 ($0.11391/kWh). 19 See Bruce Power L.P., Plug’n Drive, Pollution Probe and University of Waterloo, Accelerating the deployment of
plug-in electric vehicles in Canada and Ontario, 2016. 20 See Esource, EV charging technology and trends can guide utility strategy, November 2015
Annual Fuel Cost of an
EV vs. Conventional Vehicle
Once Muskrat Falls come online, even if rates increase to $0.17/kWh, fuel
costs will still be, on average, 40-50% lower for an EV.
$650
$850
$1,950
0
500
1000
1500
2000
2500
Battery EV Plug-in Hybrid EV Conventional Vehicle
PUB-NP-012, Attachment A Page 7 of 24

8
In most cases, the distance that EV drivers
travel each day is well within the range
capacity of an EV. For example, the average
passenger vehicle in Newfoundland and
Labrador travels approximately 50 km each
day.21 The range that EVs can travel in a
single charge has been increasing in recent
years. The average range has grown from
117 km in 2011, to 183 km in 2017.22 Based
on this range capacity, the 50 km traveled
each day by drivers in Newfoundland and
Labrador can be accommodated.
Despite advances in vehicle capacity, EV charging is impacted by temperature; especially colder
temperatures. The range of an EV can be reduced by approximately 50% in below-freezing
temperatures, mostly due to the operation of the vehicle’s heating system.23 Under these conditions,
twice as much electricity is required to charge the vehicles for daily use.
Consumer knowledge and public perceptions about EVs are another barrier to EV adoption. A consumer
survey conducted by McKinsey & Company in 2017 shows that 50% of all consumers today are not yet
familiar with EVs and related technology.24 There are also difficulties with EV availability at dealerships
and limited local service and maintenance options. In addition, many auto dealers are unaware or
uninformed about EVs. A 2018 survey of auto dealerships conducted for the Government of Canada
shows that 1/3rd of respondents knew little about operating costs, range, and where to find charging
stations.25 Experience in other jurisdictions indicates this barrier can be addressed through public
education initiatives.
21 Natural Resources Canada, 2008 Canadian vehicle survey update report, 2008. 22 Electrek, Median electric car range increased by 56% over the last 6 years, December 2017. 23 AAA, AAA Electric Vehicle Range Testing, February 2019. 24 McKinsey & Company, Electrifying insights: How automakers can drive electrified vehicle sales and profitability. 25 See the Financial Post, Electric vehicle sales growing, but supply, lack of knowledge remain barriers, August 20,
2018.
EV Charging Behaviours
Over 95% of EV charging occurs at home or at work.
Public 2%
Work 34%
Home64%
PUB-NP-012, Attachment A Page 8 of 24

9
EV Outlook Future Projections The outlook for the degree of future EV sales growth varies.
Navigant Research’s conservative forecast places the EV market at over 7 million units sold globally in
2025.26 An aggressive scenario sees the global market maintain around a 30% growth rate through the
forecast, achieving over 13.5 million sales in 2026. This range of scenarios produces a global population
of between 39 million and 57 million EVs in 2026. In addition, Bloomberg New Energy Finance predicts
that EVs will achieve price parity with conventional vehicles by 2025. They also project that 55% of all
new car sales will be electric by 2040.27
China is expected to lead EV adoption, with sales
accounting for almost 50% of the global EV market in
2025, and 39% in 2030. EVs will account for 19% of all
passenger vehicle sales in China in 2025.28 Market share
in 2025 is forecast to be 14% in Europe and 11% in the
United States.29
Future expected growth is based on the continued
strengthening of public policy measures, financial
incentives and fuel efficiency standards.
Potential Risks Although strong growth of EVs is projected, there is also a significant degree of uncertainty.
Policy changes in the United States have reduced pressure on manufacturers for EV production by
decreasing the penalties of non-compliance with Corporate Average Fuel Economy (CAFE) and GHG
standards.30 A more significant setback to the United States market would be the elimination of federal
tax credits for EV purchases. This change would have immediate repercussions in terms of EV sales and
thus make compliance with CAFE, GHG, and ZEV standards difficult and costlier for automakers.
26 Navigant is a market research and advisory firm that provides subject matter expertise and an extensive library
of data related to the power & utilities industry. See Edison Electric Institute, Plug-in Electric vehicle Sales forecast through 2025 and the charging infrastructure required, June 2017.
27 See Bloomberg New Energy Finance, Electric vehicle outlook 2018. 28 See World Economic Forum, China is leading surge in electric vehicle sales, May 2018. 29 See Bloomberg New Energy Finance, Electric vehicle outlook 2018. 30 Corporate Average Fuel Economy standards are regulations enacted by the United States Congress in 1975 to
improve the average fuel economy of cars and light trucks produced for sale in the United States.
PUB-NP-012, Attachment A Page 9 of 24

10
Another potential risk to the EV market is the cobalt shortage that is predicted to occur in the early
2020s.31 A shortage could slow down the battery cost declines seen recently as cobalt is a primary
material used in EV batteries.
EVs in Newfoundland and Labrador Background The transportation sector in Newfoundland
and Labrador represents 34% of provincial
GHG emissions.
The Government of Newfoundland and
Labrador set a goal to reduce GHG emission
levels within the transportation sector.32
Government fulfilled its commitment to
“examine the state of technology,
infrastructure requirements and market
developments for EVs”.33
Passenger cars and light trucks represent over
40% of the province’s transportation GHG
emissions.34 As such, this segment offers a
significant opportunity to reduce GHG
emissions and meet provincial climate change
objectives. Starting in 2018, the federal
government has mandated that provinces and
territories have a carbon pricing plan in place.35
The Government of Newfoundland and Labrador released its carbon pricing plan in the fall of 2018.36
New revenue generated through the provincial carbon pricing plan could be reinvested to assist in the
development of the provincial EV market and support the province in meeting its GHG emission reduction
targets.
31 See Bloomberg, Threat of cobalt shock is a top risk for electric vehicles, May 2018. 32 See Government of Newfoundland and Labrador’s Charting our Course: Climate Change Action Plan. This plan
commits to reducing provincial GHG emissions to 10% below 1990 levels by 2020, and 75 to 85% below 2001
levels by 2050. 33 See Government of Newfoundland and Labrador’s Electric Vehicle Report, November 2015. 34 Data provided by the Government of Newfoundland and Labrador. 35 This pricing must be in the form of either a direct price on carbon starting at $10 per tonne, rising by $10 each
year to $50 per tonne in 2022; or a cap-and-trade system with emission reductions equal to both Canada's
target and the reductions expected in places with a direct price. 36 See Government of Newfoundland and Labrador’s NL Carbon Plan, October 2018.
Transportation GHG Emissions in
Newfoundland and Labrador
30%
28%
15%
9%
5%
13%
Freight
PassengerLight Trucks
PassengerCars
FreightAviation &Marine
PassengerAviation &Motorcyle
Other
PUB-NP-012, Attachment A Page 10 of 24

11
Electrical System Outlook The surplus electricity generated from the interconnection of the
Muskrat Falls project could support potential new load growth
associated with an EV market.
Generating assets at Muskrat Falls are expected to produce
approximately 5 TWh of energy by 2020. Approximately 2 TWh will
be reserved to meet Newfoundland and Labrador’s electricity
requirements; however, this amount may be in excess of provincial
needs. Emera will receive approximately 1 TWh for 35 years. The
remaining surplus of 2 TWh, along with any energy in excess of
domestic needs, will be available to be sold on the North American
market.37 Potential exports of surplus electricity generated at
Muskrat Falls would face price competition tied to natural gas on the
North American market that are estimated to be as low as
$0.037/kWh.38
Alternatively, surplus electricity could be sold to new electricity
markets within the province. If the revenue that could be generated
from additional sales within the province exceeds that available in
export markets, then selling the surplus electricity domestically to
serve new load growth is a potentially attractive proposition.
37 Government of Newfoundland and Labrador, Department of Finance. The total number of road vehicle
registrations is 391,934. If all of these vehicles were converted to EVs, the total energy required, based on
average use of 5,000 kWh, equals approximately 1.96 TWh (391,934 x 5,000 kWh = 1.96 TWh). If such conversion occurred, almost the entire surplus of 2 TWh could be utilized.
38 See Nalcor’s 2018 3rd Quarter Report, 2018.
EV Fleet Opportunities
A number of jurisdictions in Canada and the United States are investigating the cost effectiveness of electrifying public transportation. For example, the transit authorities in the City of Montreal operate a battery electric bus pilot program with the aim of becoming fully electric in the future. The city recently ordered 30 new battery electric buses. This pilot is supported by provincial and federal funding.1 Other Canadian municipalities have made similar investments such as Edmonton, Charlottetown, Toronto and Halifax. 1See New Flyer, New Flyer awarded contract for 40 electric buses from Montreal and Laval
PUB-NP-012, Attachment A Page 11 of 24

12
Increased domestic market sales will benefit all electricity customers. The development of new electricity
markets within the province is an opportunity to mitigate the impact of the Muskrat Falls Project costs
on existing island customers’ rates. The net revenue gained from additional sales within the province
could be used to reduce the overall revenues that must be recovered from customers.39
The development of an EV market in Newfoundland and Labrador is expected to have minimal impacts
on the electrical distribution system in the near term. It would take approximately 12,000 EVs to increase
Newfoundland Power’s energy sales by 1%, or approximately 0.06 TWh. In comparison, Newfoundland
Power’s energy sales have grown by approximately 1 TWh over the past 10 years. Growth of 1 TWh is
equivalent to the deployment of approximately 200,000 EVs.
Illustration of Potential Economic Impacts EVs are anticipated to reach price parity with conventional vehicles by 2025. Elimination of this cost
differential may increase EV adoption in the long term. In the near term, government and utility
intervention could accelerate EV adoption.
Increased EV adoption would create new demand for electricity that does not exist today. This
increase in domestic demand for electricity could offer economic benefit for the province.40 The
following calculation illustrates potential annual revenue impacts at electricity rates of $0.17/kWh.
39 A June 2017 project cost update indicates that in the absence of rate mitigation measures, rates for domestic
customers on the island will increase to approximately $0.23/kWh in 2021. Government has indicated that
rates may be lower than this forecast. See Government of Newfoundland and Labrador news release September 2018, Premier Ball Brings PUB Back into Muskrat Falls.
40 Economic impacts will vary depending on future customer electricity rates, which are uncertain at present. See
the July 28, 2017 Telegram article which provides “…Premier Dwight Ball said his government’s mission is to make sure rates don’t go much above 17 cents per kWh when Muskrat Falls is fully online in 2021…”. At the
time, the all-in residential rate (including the basic customer charge) was approximately 11.7¢/kWh.
Potential Annual Revenue Impact Of Each Electric Vehicle
Potential EV Revenue
(Avg. annual use x forecasted retail rate)
5,000 kWh X $0.17/kWh = $850
Potential Export Revenue (Avg. annual use x avg. price for exports)
5,000 kWh X $0.037/kWh= $185
Potential EV revenue vs. Export revenue
(Potential EV Revenue - Potential Export Revenue)
$850 - $185 = $665
PUB-NP-012, Attachment A Page 12 of 24

13
Potential domestic electricity sales revenue per EV is estimated to be materially higher than potential
revenue from export of this energy. Based on average annual EV energy consumption of 5,000 kWh
per unit, and a retail rate of $0.17/kWh, potential revenue is approximately $850 for each EV deployed.
Alternatively, if this same amount of energy was sold in export markets at the average price of
$0.037/kWh, potential revenue is approximately $185. As a result, the annual revenue opportunity of
using surplus energy for domestic EV load growth instead of selling to export markets is approximately
$665 per EV. 41 The expected life of an EV is approximately 10 years.42 If revenues of $665 per EV are
achieved in each year the EV is in service, total revenue over the 10-year life of the vehicle is estimated
to be approximately $5,000 on a present value basis.43
Potential EV Adoption Scenarios The overall economic impact of accelerated EV adoption varies depending on the level of adoption
achieved. On average, there are approximately 35,000 new vehicles sold annually in Newfoundland and
Labrador.44 This represents the potential market that could purchase an EV instead of a conventional
vehicle each year.
While annual EV sales represent only 0.05% of passenger vehicle sales in Newfoundland and Labrador,
the potential for EV sales growth can be estimated based on experience in other provinces. 45 EV sales
currently represent 4% of total passenger vehicle sales in BC and QC, and 2.7% in ON. 46 EV sales
represent 0.5% of vehicle sales in the rest of Canada. 47 Total potential revenue impacts in this province
can be assessed based on a range of scenarios reflecting this Canadian experience.
41 This calculation is a simple illustration of the potential annual revenue from EVs when an electricity rate of
$0.17/kWh is used. The potential annual revenue calculation will change depending on what electricity rate is used as an input into the calculation. For example, if the current electricity rate of approximately $0.12/kWh
was used instead, the potential annual revenue impact would look more like $415: Potential EV Revenue
(Avg. annual use x current retail rate)
5,000 kWh X $0.12/kWh = $600
Potential Export Revenue
(Avg. annual use x avg. price for exports)
5,000 kWh X $0.037/kWh= $185
Potential EV revenue vs. Export revenue (Potential EV Revenue - Potential Export Revenue)
$600 - $185 = $415
42 See Fleetcarma, The facts about electric vehicles, August 2018. 43 Present value is a financial calculation that measures the worth of a future amount of money in today’s dollars.
This considers the annual forecast cash flows of $665, assuming an annual discount rate of 6% over the 10
year period. PV = $665 [1-(1 + 6%)-10/6%] = $4,894, or approximately $5,000.
Potential revenue does not include potential utility investments such as distribution system upgrades and supply capacity considerations.
44 Data obtained from Statistics Canada, New Motor Vehicle Sales, by Type of Vehicle, Table 20-10-0002-01. 45 35,000*0.0005 = 18. 46 35,000*0.027 = 945 and 35,000*0.04 =1,400. 47 35,000*0.005 = 175.
PUB-NP-012, Attachment A Page 13 of 24
14
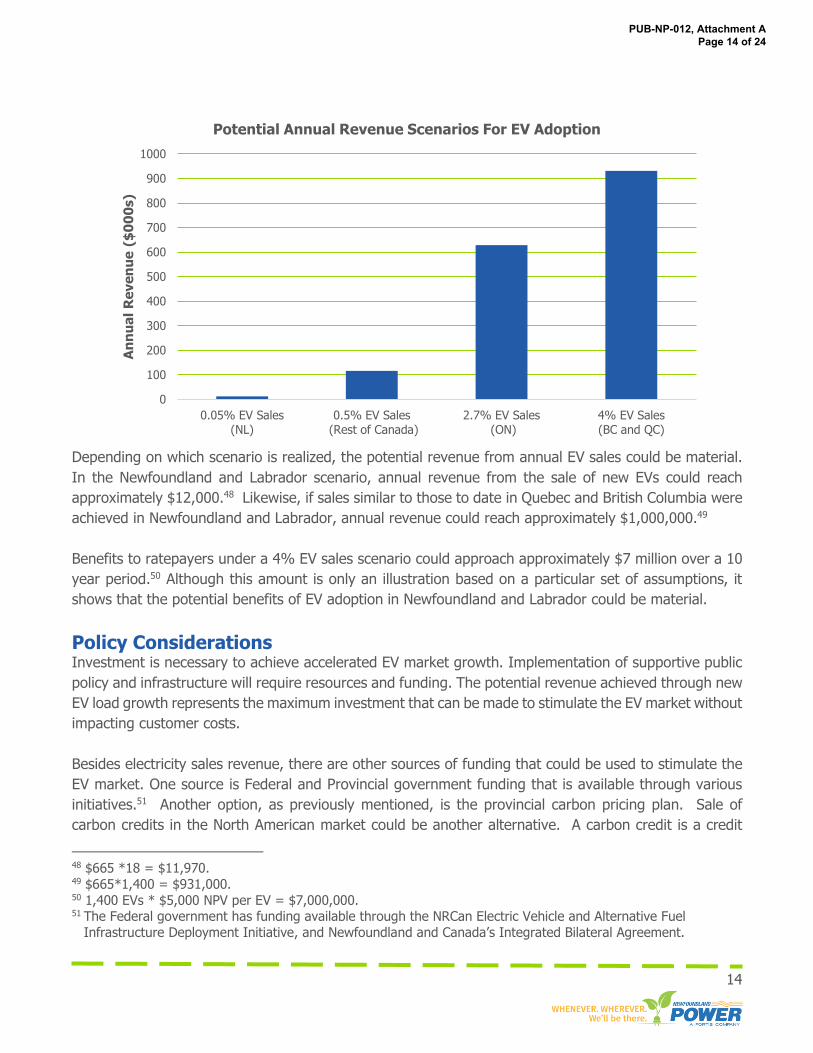
Depending on which scenario is realized, the potential revenue from annual EV sales could be material.
In the Newfoundland and Labrador scenario, annual revenue from the sale of new EVs could reach
approximately $12,000.48 Likewise, if sales similar to those to date in Quebec and British Columbia were
achieved in Newfoundland and Labrador, annual revenue could reach approximately $1,000,000.49
Benefits to ratepayers under a 4% EV sales scenario could approach approximately $7 million over a 10
year period.50 Although this amount is only an illustration based on a particular set of assumptions, it
shows that the potential benefits of EV adoption in Newfoundland and Labrador could be material.
Policy Considerations Investment is necessary to achieve accelerated EV market growth. Implementation of supportive public
policy and infrastructure will require resources and funding. The potential revenue achieved through new
EV load growth represents the maximum investment that can be made to stimulate the EV market without
impacting customer costs.
Besides electricity sales revenue, there are other sources of funding that could be used to stimulate the
EV market. One source is Federal and Provincial government funding that is available through various
initiatives.51 Another option, as previously mentioned, is the provincial carbon pricing plan. Sale of
carbon credits in the North American market could be another alternative. A carbon credit is a credit
48 $665 *18 = $11,970. 49 $665*1,400 = $931,000. 50 1,400 EVs * $5,000 NPV per EV = $7,000,000. 51 The Federal government has funding available through the NRCan Electric Vehicle and Alternative Fuel
Infrastructure Deployment Initiative, and Newfoundland and Canada’s Integrated Bilateral Agreement.
0
100
200
300
400
500
600
700
800
900
1000
0.05% EV Sales(NL)
0.5% EV Sales (Rest of Canada)
2.7% EV Sales (ON)
4% EV Sales(BC and QC)
An
nu
al
Re
ve
nu
e (
$0
00
s)
Potential Annual Revenue Scenarios For EV Adoption
PUB-NP-012, Attachment A Page 14 of 24

15
for GHG reductions achieved by one party that can be purchased and used to compensate the emissions
of another party. For example, carbon credits representing a reduction of 1 tonne of CO2 will be available
for sale in the United States in 2019. The revenue generated from the sale of carbon credits could be
invested to help accelerate EV adoption and expansion of EV charging infrastructure while also reducing
emissions.52
Investment in the EV market may be economically attractive for various levels of government, as well as
utilities. However, investments do not guarantee adoption. Customer decisions can be constrained by
important factors such as higher upfront cost, longer payback periods, lack of product performance
information and lack of product availability. The rate at which customers accept and purchase
technologies, such as EVs, will be influenced by the combination of financial incentives, information and
other measures put in place by the utilities, various levels of government and the private sector to reduce
the barriers such as those noted above.
Newfoundland Power, through its existing energy conservation capabilities, has experience in identifying
and addressing barriers to the adoption of new customer technologies. This experience includes
education, market capacity building and financial incentives, all of which can be applied to advancing the
EV market.
Assessment The global EV Market is expanding rapidly
Countries such as Norway, China and the United States will continue to lead global growth in the future.
An aggressive scenario sees the global market maintaining a 30% growth rate, achieving over 13.5
million sales in 2026.
EV growth is dependent on public policy supports
Global leaders in EV market growth have implemented strong public policy support in a variety of forms
which have driven growth in these markets. This includes a mix of financial and non-financial measures.
Examples include federal and provincial funding for: (i) EV purchase incentives, (ii) public charging
infrastructure, particularly supporting long distance travel and (iii) establishment of low and zero-
emission vehicle mandates. Current EV penetration in Newfoundland and Labrador is negligible,
reflecting the need for public policy and infrastructure supports. These types of supports are necessary
in order to make EVs a viable option in Newfoundland and Labrador.
52 See S&P Global, In 'game-changer,' EV charging stations to tap carbon credit market in 2019, September 2018.
PUB-NP-012, Attachment A Page 15 of 24

16
Increased numbers of EVs could assist the province in meeting its GHG emission reduction
targets
Passenger cars and light trucks represent over 40% of the province’s transportation GHG emissions. As
such, EVs offer a significant opportunity to reduce GHG emissions and meet provincial climate change
objectives. Revenue generated through a carbon pricing plan could be used to develop the provincial
EV market.
Surplus electricity from Muskrat Falls can support the EV market
Surplus electricity of 2 TWh will become available after the implementation of the Muskrat Falls project.
This surplus electricity can be used to electrify the transportation industry. This would create economic
benefits for the province because more revenue would be generated locally from EVs than would be
achieved in the North American export market.
Revenue from EV load growth will benefit electricity customers
Any revenue generated from EVs can be used to offset overall electricity system costs. This would benefit
electricity customers by reducing the revenue required to be collected from customers. Revenue
generated from EV load growth could be used to mitigate the impact of the costs associated with Muskrat
Falls on customers’ electricity rates.
Further analysis is required
The impacts of EV adoption on the provincial electrical system must be assessed. Newfoundland Power
is uniquely positioned to study the impact on its distribution system. The Company intends to perform
a series of modeling exercises to determine the effects of EV loads on its distribution system. The
Company will model a number of scenarios based on variances in location, level of charging, EV
penetration and distribution load characteristics. This work is expected to be completed in 2019.
Further research is also needed on the appropriate mix of public policy measures and incentives required
to increase EV adoption locally. Collaboration between governments and utilities is required to determine
what types of investments are needed and evaluate the options for economic and technical feasibility.
PUB-NP-012, Attachment A Page 16 of 24

17
Appendix A: Electric Vehicle Technologies Electric Vehicles An EV is an alternative fuel vehicle that uses
an electric motor for propulsion instead of
more common propulsion systems based on
gas powered internal combustion engines.
EVs contain batteries that store electricity
which powers the vehicle's wheels via an
electric motor. An EV that travels 20,000
km/year would use approximately the same
amount of electricity every year as a typical
electric water heater. This equates to
approximately $0.03/km driven compared to
a conventional vehicle that costs
approximately $0.10/km driven based on the
price of gas.53
There are two major types of EVs:
Battery Electric Vehicle (“BEV”) – this type of vehicle has an engine and is propelled by electricity that
comes from one or several high capacity batteries. BEVs are powered by electricity by plugging in to an
electrical outlet or specialty Electric Vehicle Charging Equipment (“EVCE”).
Plug-in Hybrid Electric Vehicle (“PHEV”) – this type of
vehicle combines a gasoline or diesel engine with an
electric motor and a rechargeable battery. Modern PHEVs
can be driven in electric mode over varying distances
before the combustion engine is required. Unlike earlier
hybrids that use gasoline as their main power source,
PHEVS can be plugged-in and recharged from an outlet,
allowing them to drive extended distances using only
electricity.
53 Gasoline rate of $1.38/litre approved by the PUB on July 19, 2018.
Refuel or Recharge
Vehicle Type Gasoline Electricity
Gas Only X
PHEV X X
BEV X
PUB-NP-012, Attachment A Page 17 of 24

18
The primary difference between a BEV and a PHEV is
the driving range. A BEV’s driving range is limited by
the storage capacity of its battery and availability of
charging infrastructure. A PHEV is equipped with a fuel
tank and an internal combustion engine which allows
for an increased driving range.54
EV efficiency is measured in kwh/km. EVs convert
about 59%–62% of the electrical energy to power that
allows the vehicle to operate. Conventional gasoline
vehicles only convert about 17%–21% of the energy in
gasoline to power the vehicle.55
The battery system in an EV is the key technology as it
defines its range and performance characteristics. EV
batteries are designed to last approximately 12 to 15
years in moderate climates and 8 to 12 years in severe
climates.56 The price of EV batteries has dropped by
80% between 2010 and 2016, and is predicted to
continue to decrease over the next 7 years.57
EV batteries can typically charge up to 80% of its
capacity fairly quickly. Using a Level 3 charger, they
can charge up to 80% in approximately 30 minutes.58
54 See Environmental Protection Agency, Explaining electric & plug-in hybrids electric vehicles. 55 See U.S. Department of Energy, All electric vehicles. 56 See U.S. Department of Energy, Electric vehicle benefits and considerations. 57 See Electrek, Electric vehicle battery cost dropped 80% in 6 years down to $227/kWh, January 2017. 58 See Fleetcarma, A simple guide to electric vehicle charging, August 2016.
EV Range The distance an EV can travel depends on:
Whether it’s a BEV or PHEV
battery capacity
weight carried
temperature
accessories
driving style
Hybrid vs. PHEV
The difference between a conventional
Hybrid and PHEV:
Hybrid PHEV
Gasoline is the
main power
source
Electricity is the
main power
source
Electricity is
generated by
regenerative
braking
Electricity is
supplied from
the grid
Minimal fuel
savings Substantial fuel
savings
PUB-NP-012, Attachment A Page 18 of 24

19
Electric Vehicle Charging Equipment Currently, there are over 3,500 public charging stations in Canada and that number continues to grow.59
Charging stations can be found in a variety of places, including shopping malls, restaurants, office
buildings, etc.
Level 1 Chargers
Level 1 chargers are most commonly used in residential applications and
have the longest charging time. Typically, EV owners would charge their
vehicle overnight. These chargers are compatible with common 120 volt
outlet found in garages, parking lots, and exteriors of homes.
Level 2 Chargers
Level 2 chargers provide a faster charge. They are typically used in public
or workplace parking areas but some are used for residential
applications. This type of charger installation is typically more
complicated and more expensive than Level 1, as it requires
considerable electrical and construction work. The majority of EV
models sold in North America use the same charging standard and can
use any Level 2 station across Canada and the United States.
Level 3 Chargers
Level 3 chargers, or fast chargers, have the highest power demands of
40-100 kW and a faster charging time of 0.5-1 hour to fully charge. They
are also the most expensive EVCE to install.
The development and proliferation of EVs must be accompanied by
EVCE. Table A-1 shows the types and the costs per level of EVCE.
Charging at home with a Level 1 charger is the most common way of
charging an EV. It is also the least expensive alternative of the 3 EVCEs.
It is likely the most convenient alternative as well, as it does not require
the EV driver to plan around the availability of public EVCE or wait in line
to charge their vehicle. The Level 1 EVCE is also the slowest charge.
Level 2 and Level 3 EVCE can charge a vehicle in a fraction of the time,
but installation costs are often prohibitive for EV drivers, business
owners and even municipalities.
59 See Natural Resources Canada, Electric charging and alternative fuelling stations locator, September 2018.
Level 1 Charger
Level 2 Charger
Level 3 Charger
PUB-NP-012, Attachment A Page 19 of 24

20
60 See Esource, EV charging technology and trends can guide utility strategy, November 2015. 61 See ChargeHub, Guide on charging your electric vehicle at home, 2019. 62 See Realtor.com, Electric Car charger installation in your home. November 2017. 63 See Inside EVs, Electric Vehicle charging Levels Explained, November 2015. 64 See Ontario Ministry of Transportation, Charging electric vehicles, July 2018. 65 See eMotorWerks, how long does it really take to charge and electric car. 66 See EV Obsession, Electric Car Charging 101 — Types Of Charging, Charging Networks, Apps, & More!,
September 2015. 67 See Avista Corporation, Docket UE-160082, March 10, 2016.
Table A-1
EV Charger Types
Type of
Charger
EVs
Supported
Current
Type
Typical
Voltage
(V)
Average
Charge
Time
(hours)
Demand
(kW)
Max
Range
per hour
of
charge
(km)
Common
Installation
Cost ($)
Level 1 All AC 12060 8-2061 1-260 865 Residential 0 - 2,30062
Level 2 All AC 24060 3 – 861 3.3-19.263 35-4865 Residential,
Public or
workplace
1,700 -
16,00062
Level 3 BEVs DC 48064 0.5-165 50-35066 24065 Commercial
or Highways
100,000 -
125,00067
PUB-NP-012, Attachment A Page 20 of 24

21
Appendix B: Canadian Regulatory Experience
There is currently no standard practice for the regulatory treatment of EV utility investment in
Canada. In British Columbia and Ontario, the regulator has approved limited utility investment in EV
infrastructure. In other jurisdictions, including Nova Scotia and New Brunswick, the regulator has denied
utility applications for similar investments. In these cases, the utility proceeded with EV infrastructure
investments outside of their regulated activities.
FortisBC Inc. applied to the British Columbia Utilities Commission (BCUC) in 2017 for approval of rate
design and rates for EV level 3 fast charging stations. The BCUC established an inquiry into the regulation
of EV charging stations in January 2018.68 A rate of $9 per half hour of level 3 charging was approved
on an interim basis. This inquiry will consider: (i) whether EV charging infrastructure should operate in
a competitive or monopoly environment, (ii) whether and why the BCUC should regulate EV charging,
(iii) rate design for EV charging (i.e. cost of service or utility wholesale rate), (iv) the appropriateness of
including EV charging infrastructure in utility rate base, and (iv) the risk of cross subsidization if EV
charging infrastructure is included in regulated business.69
Interveners submitted arguments which identified a number of considerations including the BCUC’s
jurisdiction to regulate 3rd party EV charging stations; role of public utilities in providing EV charging
services; the inclusion of EV charging stations in rate base; and how the BCUC could determine the
degree to which government policies should guide public utility investments. The inquiry will proceed in
3 phases. The first phase of the Inquiry will address the following: (i) do the words "for compensation"
in the definition of public utility mean that a person who does not expressly require customers to pay for
charging services but instead recovers the cost of charging from other services provided to the customers
is a "public utility"; (ii) should entities not otherwise public utilities supplying electricity to EV end users
be regulated at all; and (iii) where public utilities participate in the EV market as owners or operators of
EV charging stations, clarity is needed on whether public utilities are permitted to invest in EV charging
stations.70
The regulatory treatment of the EV market has been different in Ontario than the rest of Canada. The
Ontario Energy Board (“OEB”) has acknowledged the importance of EV adoption in reducing GHG
emissions and meeting the province’s climate change goals. Further, the OEB has recognized that
there are utility challenges that will need to be addressed to enable increased penetration of EVs.
The OEB determined that, similar to other conservation and demand management activities, the costs
associated with an EV market deployment programs could be eligible for recovery through rates. The
68 In 2012, the BCUC established principles regarding the provision of products and services outside of traditional
utility activities. The BCUC determined that regulation was appropriate only where necessary and should not
impede competitive markets. 69 See BCUC Order Number G-119-18. 70 See BCUC Order G-119-18, Appendix A.
PUB-NP-012, Attachment A Page 21 of 24

22
OEB is currently conducting research to examine and identify steps for pursuing cost-effective
opportunities for utilities to facilitate access to residential smart charging for EVs.71
NB Power has established a network of charging stations to allow EV drivers to travel around the province.
In its 2018/2019 general rate case, NB Power applied to the New Brunswick Energy and Utilities Board
(“EUB”) for $1.3 million to fund EV charging infrastructure. The EUB determined that EV charging stations
are not within the core business of NB Power. Such stations are currently provided by the private sector,
without any ratepayer investment. The Board disallowed the budgeted amount of $1.3 million.72
Nova Scotia Power (NS Power) submitted a request to the Nova Scotia Utility and Review Board (“UARB”)
in 2017 for approval of a $420,000 Electric Vehicle Charging Station Network Pilot Project. The project
proposed the purchase and installation of 12 charging stations at third party locations to understand the
impacts on the electrical system. The UARB acknowledged the value of EV charging stations, but found
that the evidence did not support the need for NS Power to be the owner of the EV charging stations to
accomplish the declared purpose of the project. The UARB concluded that NS Power’s application was
not in the best interest of ratepayers and denied the application.73 Despite this outcome, NS Power
proceeded with the installation of the fast charging stations through a cost sharing arrangement with
Natural Resources Canada.
71 See The Ontario Energy Board’s Implementation Plan in response to the Minister of Energy’s directive in
respect of the implementation of Ontario’s Long Term Energy Plan 2017: Delivering Fairness and Choice. 72 See New Brunswick Energy and Utilities Board Decision (Matter No.375), July 20, 2018. 73 See Nova Scotia Utilities and Review Board Decision 2018 NSUARB 1 M08224, January 4, 2018.
PUB-NP-012, Attachment A Page 22 of 24
23
Appendix C: Canadian EV Incentive Programs
British Columbia
- The Government of British Columbia offers a rebate of up to $5,000 for the purchase of an electric
vehicle and $2,500 for the purchase of a rechargeable hybrid vehicle.74
- The SCRAP-IT Program offers a rebate of up to $6,000 when you scrap an old gas-fuelled vehicle
and replace it with a new or used electric vehicle.75
- Plug In BC’s Residential Building Incentive provides funding for the purchase and installation of
one or multiple Level 2 charging stations in multi-unit residential buildings with 3 units or more.
The program covers 75% of total project costs up to $4,000 per station.76
- Plug In BC’s Workplace Charging Incentive provides companies and building owners or managers
with funding to support the installation of workplace charging infrastructure. The program
covers 50% of total project costs, up to $4,000 per Level 2 station.77
Quebec
- The Quebec government has set a goal of having 100,000 electric or hybrid vehicles on provincial
roads by 2020, and one million by 2030, similar to the ZEV policy in the US. The target is part of
Quebec’s plan to reduce GHG emissions by 37.5% below 1990 levels by 2030.78
- Through the Drive Electric Program, the Québec government offers a rebate of up to $8,000 when
you buy or lease a new electric vehicle. The discount is available to individuals, businesses,
organizations and municipalities.79
- The Quebec government also offers financial assistance of $350 for the purchase of a level 2
residential charging station and $250 for its installation and electrical supply infrastructure by a
licensed electrician, for a total of $600.80
- A number of municipalities offer additional rebates.81
- The City of Sherbrooke offers financial assistance of up to $500 for the purchase and
installation of a residential charging station.
- The City of Joliette offers financial assistance for the purchase and installation of a
residential charging station. The rebate covers 25% of the total costs, up to $250.
74 See Clean Energy Vehicles for British Columbia, Clean Energy Vehicle Program, https://www.cevforbc.ca/clean-
energy-vehicle-program 75 See Scrap-it, https://scrapit.ca/ 76 See Plug In BC, Residential Building Charging Incentive, https://pluginbc.ca/residential-building-charging-
incentive/ March 2016. 77 See Plug In BC, Charging solutions & incentives, https://pluginbc.ca/incentives/charging-solutions-incentives/ 78 See Quebec’s Commitments, Our GHG emission reduction targets,
http://www.environnement.gouv.qc.ca/changementsclimatiques/engagement-quebec-en.asp 79 See Transportation Electrification Action Plan, Purchase or lease program
http://vehiculeselectriques.gouv.qc.ca/english/particuliers/rabais.asp 80 See Transportation Electrification Action Plan, Charging Station Rebate
http://vehiculeselectriques.gouv.qc.ca/english/particuliers/remboursement.asp 81 See Flo, Rebates and incentives for EV drivers in Canada https://flo.ca/at-home/rebates-incentives
PUB-NP-012, Attachment A Page 23 of 24

24
- The City of Granby offers a rebate covering 25% of the purchase and installation costs of
a residential charging station for electric vehicle, up to $250 per station.
- The City of Prévost offers a rebate of $100 to its residents for the purchase and
installation of a residential charging station for electric vehicle.
- CAA-Québec gives back 100 CAA Dollars on the purchase of a home charging station.82
- The Branché au travail program offers a 50% rebate for the purchase and installation of charging
stations at workplaces, up to $5,000 per charging station.83
Ontario
Ontario’s EV incentive programs ended in September 2018.
- The Electric Vehicle Incentive Program provides individuals, businesses, and organizations that
purchase or lease a new plug-in hybrid EV or battery EV with a rebate of up to $14,000:
- Vehicles with a battery capacity from 5 to 16 kWh are eligible for incentives ranging
between $6,000 to $10,000 based upon the battery size of the vehicle;
- Vehicles with a battery capacity of larger than 16 kWh are also eligible for an additional
$3,000 incentive;
- Vehicles with five or more seats are also eligible for an additional $1,000 incentive;
- PHEVs with an Manufacturer's Suggested Retail Price (“MSRP”) of $75,000 to $150,000
are eligible for a maximum incentive value of $3,000;
- BEVs and PHEVS with an MSRP of $150,000 or greater are not eligible for an incentive;
and
- Vehicles with a 12 month lease term will receive 33% of the incentive, 24 month lease
term receives 66% of the incentive and leased vehicles with a 36 month or longer term
will receive the full incentive.84
- The Ontario Ministry of Energy is undertaking an electric school bus pilot program funded by the
province’s Climate Change Action Plan.85 The purpose of the pilot is to determine whether electric
school buses (“ESBs”) can operate reliably and cost effectively in all weather conditions.
- The ESB pilot provides funding up to $400,000 for the purchase of an ESB as well as Level 2 chargers
in a minimum of 5 municipalities.
- The pilot will begin in March 2018 with a final report is due in March 2019 which will
determine the role of ESBs in the future, if any.
82 See Canadian Automotive Association, Flo, https://www.caaquebec.com/en/caa-dollars-and-discounts/find-
discounts/flo/ 83 See Flo, EV charging incentives programs for business, https://flo.ca/business/incentive-programs 84 See Ontario Ministry of Transportation, About electric and hydrogen vehicles,
http://www.mto.gov.on.ca/english/vehicles/electric/about-electric-vehicle.shtml July 2018. 85 See Grants Ontario, Electric School Bus Pilot Program program guide, August 2017.
PUB-NP-012, Attachment A Page 24 of 24

PUB-NP-012 Attachment B
Information Requests Rate Mitigation Options and Impacts Reference
Newfoundland Power Inc. - Rate Mitigation Options and Impacts Reference
Results from the 2018 takeCHARGE Marketing Survey

PUB-NP-012 Attachment B
Information Requests Rate Mitigation Options and Impacts Reference
Newfoundland Power Inc. - Rate Mitigation Options and Impacts Reference
Results from the 2018 takeCHARGE Marketing Survey

PUB‐NP‐012, Attachment B Page 1 of 1
Results from the 2018 takeCHARGE Marketing Survey Table 1 shows the probability of survey respondents purchasing an electric vehicle and Table 2 shows the barriers identified by survey respondents to purchasing an electric vehicle.
Table 1: How likely are you to consider buying an electric vehicle in the next 5 years?
Total Respondents 510 Very likely 5% Somewhat likely 12% Not very likely 30%
Not at all likely 51%
Don't know 3%
Table 2: Why are you unlikely to consider buying an electric vehicle?1
Total Respondents 412 Cost to purchase 27% Not planning to purchase a new vehicle in the foreseeable future / recently purchased new vehicle
23%
Availability of charging stations 15% Not suitable / available for lifestyle (age, family size, employment requirements, style of vehicle, climate, etc.)
11%
Not interested / doesn't like them / doesn't need one (general) 10% Doesn't know enough about them / they are still too new to the market 8% Doesn't drive / uses public transportation 7% Concerned about reliability / charge range / running out of power / engine performance (long distance travel)
7%
Doesn't know 5% Cost of electricity 3% Miscellaneous 3% Have never considered it 1% Would prefer / used to using a gas powered vehicle 1% Cost (general) 1%
1 Question posed only to respondents who indicated they were not very likely or not at all likely to buy an electric
vehicle.