ptc report final - institute for energy...
TRANSCRIPT

Executive Summary This paper examines the distributional impacts of federal subsidies for wind energy across all 1
U.S. states, building on our December 2013 report on the same topic. The obvious difficulty with examining federal subsidies for wind is that, at different points in time, developers of wind facilities have had more than one type of subsidy available to them. For example, over the past 10 years of the wind Production Tax Credit (PTC), some eligible wind facilities elected to take the Investment Tax Credit (ITC) or the Section 1603 grant program instead of the PTC.
As we explain below, this does not change the distributional nature of federal wind subsidies, but merely the timing—when wind developers elected to collect the subsidy. Also, our 2
methodology likely underestimates the total amount of subsidies paid to wind developers over the ten-year period because the fact that many wind developers elected to take Section 1603 grants implies that the grants were more valuable than the PTC. To estimate the distributional impacts of federal wind subsidies, we assume the owners of all eligible U.S. wind facilities in operation over the last 10 years elected to take the PTC rather than other subsidies available to them. Essentially, we construct a new measure of wind subsidies based on the amount of the PTC (post-tax, per KWh) and the level of wind production in each state, and we call this the “federal wind subsidy burden” to differentiate this metric from actual PTC allocations (some of which were crowded out by other subsidy options).
In this report, we estimate that the cumulative magnitude of federal subsidy allocations from PTC, ITC, and Section 1603 to the wind industry over the past 10 years is at least $18.6 billion. Our estimate is based on generation data for the most recent 10 calendar years available (2005 through 2014). Crucially, our paper also examines the distributional impact of net transfers, which are tax credit allocations from the wind PTC minus the state’s federal tax burden related to funding the program.
In other words, we assess if taxpayers in a state spend more money on federal wind subsidies than wind developers in a state receive in federal subsidies. To calculate the net impact of federal wind subsidies on each state (and determine whether each state is a “net taker” or “net payer” of federal wind subsidies), we compare each state’s estimated subsidy allocations based on wind production data with its share of the tax burden related to federal wind subsidies. According to our calculations, taxpayers in 30 states and the District of Columbia paid more in taxes to the federal government over the past 10 years to support wind subsidies than wind producers who own wind facilities in those states received in subsidy allocations. Of those 30 net-paying states, 11 states and the District of Columbia had no wind production 3
and received zero subsidies but still paid their share of the tax burden related to federal wind subsidies.
! 1

!
In any study of the distributional impact of government policies, there are different “levels” of analysis that one might consider, ranging from the country as a whole down to individual households. However, in this study we choose the intermediate level of state-based analysis for two reasons: First, it makes the analysis tractable with available data, and second, it helps aid the understanding of the political process behind the various tax code provisions. To understand the details of federally imposed rules, it is often instructive to see how those rules will impact the constituents of the officials involved in crafting the broad outline of the rules.
Over the last decade, we estimate that the top-five states whose taxpayers suffered the largest net losses have paid upwards of $4.81 billion more to support federal wind subsidies than wind producers in those states have received in subsidy payments. That list includes California, New York, Florida, New Jersey, and Ohio. We also estimate that the wind producers in three states are “net takers” of at least $800 million: Texas, Iowa, and Oklahoma. Wind producers in those states have received much more in federal wind subsidies than taxpayers in those states allocated to support the subsidies.
Over the last ten years, the highest net losses and net subsidies go to California and Texas, respectively. California’s share of the federal wind subsidy burden over the last 10 years was $2.172 billion, while wind producers in the state
! 2
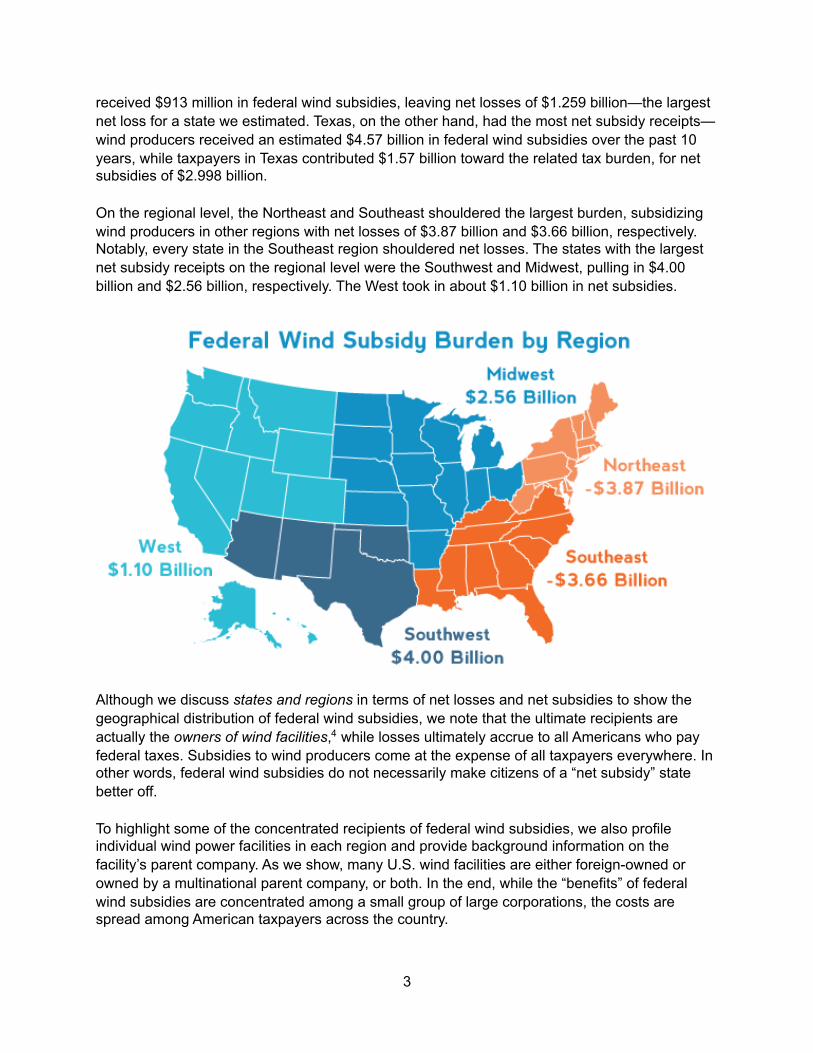
received $913 million in federal wind subsidies, leaving net losses of $1.259 billion—the largest net loss for a state we estimated. Texas, on the other hand, had the most net subsidy receipts—wind producers received an estimated $4.57 billion in federal wind subsidies over the past 10 years, while taxpayers in Texas contributed $1.57 billion toward the related tax burden, for net subsidies of $2.998 billion. On the regional level, the Northeast and Southeast shouldered the largest burden, subsidizing wind producers in other regions with net losses of $3.87 billion and $3.66 billion, respectively. Notably, every state in the Southeast region shouldered net losses. The states with the largest net subsidy receipts on the regional level were the Southwest and Midwest, pulling in $4.00 billion and $2.56 billion, respectively. The West took in about $1.10 billion in net subsidies.
Although we discuss states and regions in terms of net losses and net subsidies to show the geographical distribution of federal wind subsidies, we note that the ultimate recipients are actually the owners of wind facilities, while losses ultimately accrue to all Americans who pay 4
federal taxes. Subsidies to wind producers come at the expense of all taxpayers everywhere. In other words, federal wind subsidies do not necessarily make citizens of a “net subsidy” state better off.
To highlight some of the concentrated recipients of federal wind subsidies, we also profile individual wind power facilities in each region and provide background information on the facility’s parent company. As we show, many U.S. wind facilities are either foreign-owned or owned by a multinational parent company, or both. In the end, while the “benefits” of federal wind subsidies are concentrated among a small group of large corporations, the costs are spread among American taxpayers across the country.
! 3

Introduction The federal Production Tax Credit (PTC) for renewable electricity is one of the federal government’s primary policy tools for subsidizing renewable energy development. The PTC gives electricity producers a tax credit for each kilowatt-hour of electricity generated from qualifying renewable energy sources—currently 2.3 cents per kilowatt-hour (KWh) or $23 per megawatt-hour (MWh)—for the first ten years of operation, regardless of actual price of electricity on the wholesale market. This ignores market price signals such as negative prices that indicate the electricity is unwanted. Relative to the wholesale price of electricity, which hovered around $50 per MWh for most markets in 2014, the PTC represents an expensive direct subsidy of around 50 percent of the wholesale price of electricity. In terms of pre-tax value, the PTC is worth approximately $35 per 5
MWh, often making the federal subsidy equally as valuable to the owner of wind facilities as the 6
market price of electricity. Furthermore, since the PTC is not tied to the wholesale price of electricity, owners of wind facilities can afford to pay the electrical grid up to $35 per MWh to take their power and still make money. Federal subsidies for wind power have a long history. The PTC was enacted as part of the Energy Policy Act of 1992 and “provided an inflation-adjusted tax credit of 1.5 cents per 7
kilowatt-hour for generation sold from qualifying facilities during the first 10 years of operation,” according to the Energy Information Administration (EIA). 8
! In 2009, the American Recovery and Reinvestment Act (ARRA) gave project owners the option of receiving a 30 percent ITC rather than the PTC. The ITC allows wind producers to deduct 30 percent of their investment costs from their taxes. ARRA also created the section 1603 program, which allowed developers to receive cash grants in lieu of tax credits for 30 percent of the investment cost, but only if construction had begun before the end of 2011. 9
! 4

The PTC has expired and been renewed several times over its history. Most recently, the PTC expired at the end of 2013 but was renewed retroactively in January 2014, before expiring again at the end of 2014.
In 2014, wind installations generated 4.5 percent of the U.S. electricity supply despite receiving billions of dollars in subsidies. This year, the Senate Finance Committee estimated a two-year extension of the PTC would cost more than $10 billion over ten years. 10
History of Wind Power in the U.S.
While some claim today’s subsidies like the PTC, ITC, and section 1603 program support an “infant” industry, using wind power to generate electricity is nothing new—the practice actually dates back to the late 1800s. In 1887, James Blyth, a professor at Anderson's College in Glasgow, Scotland, constructed the first known device that generated electricity from the wind.
A few months later, Charles Brush built a custom 12 KW wind turbine to provide electricity to his home in Cleveland, Ohio. Brush used the intermittent (off and on) energy from his wind turbine 11
to charge a large bank of batteries in his basement, which in turn provided reliable power to his home. At that time, pairing intermittent power from the wind with battery storage made 12
economic sense because power from the electric grid was still not an option in many U.S. cities.
From the late 1800s through the 1920s, the use of wind power expanded in rural areas, as wind-powered turbine generators were increasingly used on farms for charging batteries that powered lights, pumps, and radios. 13
In 1941, the first megawatt wind turbine was connected to the power grid in Vermont, but the 14
blades broke in 1945, and the turbine was never restarted. (By comparison, some coal-fired 15
power plants commissioned in the 1940s are operational today). In the 1970s, the federal government began a coordinated push to make commercial, on-grid wind turbines competitive with other sources.
On the policy front, the Public Utility Regulatory Policies Act of 1978 (PURPA) mandated that utilities take wind power as it was produced, which forced utilities and grid operators to give wind facilities preference above other, more reliable sources of electricity. 16
This is similar to the subsidy scheme of many European countries, including Spain and Germany, whose electricity rates are three times higher than the United States.
Today’s wind PTC is just the latest version of decades-old federal support for the wind industry, dating back to the 1970s. Furthermore, the U.S. Government Accountability Office has tallied over 80 federal programs across nine agencies that support wind power. In short, there is 17
nothing about wind power or the subsidies for it that can be considered an “infant.”
! 5

Findings and Methodology In this report we examine which states suffer the most losses and which states receive the most federal wind subsidies. At the outset, we should note that the states themselves are not shouldering these losses or receiving these subsidies, and the subsidy “benefits” are much more concentrated than a color-coded map could indicate.
The recipients of these subsidies are the companies that own the wind facilities in the state—not the state as a whole—while the cost of the subsidies is spread among all Americans who pay federal taxes. There are a few challenges to estimating the state-by-state breakdown of recipients of wind subsidies. First, the federal government does not provide a state-by-state breakdown. Second, some wind producers elected to receive subsidies other than the PTC that preclude them from also receiving PTC subsidies.
The ARRA, for example, allowed wind producers to receive an investment tax credit (ITC) or a Section 1603 cash grant from the U.S. Treasury in lieu of the PTC if they began construction on a facility before the end of 2011. 18
While these alternative tax incentives reduce actual PTC subsidies, they do not reduce the total subsidy transfer to wind producers. The fact that many wind producers elected to take the ITC or Section 1603 grants instead of the PTC provides prima facie evidence that the ITC and Section 1603 grants were more “valuable” than the PTC at that time for those specific wind developers. 19
As a result, we likely underestimate cumulative federal wind subsidies. In this analysis, we estimate the subsidy allocations that would have occurred if all of the wind companies had taken the PTC instead of the other options. To calculate the subsidies to wind producers generating electricity between 2005 and 2014 (if they had all taken the PTC in lieu of the other subsidies), we start with the actual wind generation data from the EIA for each calendar year, which is broken down by state.
From that we subtract wind electricity generated from ten years prior for each state (e.g., for 2005, we subtract 1995 data) because the PTC only provides subsidies to wind developers for a given wind facility’s first 10 years of operation.
Since some portion of wind generation in each year (2005–2014) was in operation for more than 10 years, the owners of those older generators are no longer eligible to receive the PTC and hence we “net out” that older generation. After netting out ineligible generation, we estimate the total amount of subsidies that went to wind producers in each state from 2005 to 2014 by multiplying each eligible kilowatt-hour produced by the then-current PTC rate (the PTC was 1.8 cents per kilowatt-hour for 2005, 1.9 cents for 2006-2007, 2 cents for 2008, 2.1 cents for 2009, 2.2 cents for 2010–2012, and 2.3
! 6

cents for 2013–2014). We use this simplified calculation because accurate and comprehensive data on the exact amount of PTC allocations by state are not available, as noted above.
To estimate each state’s share of the PTC cost, we use data from the IRS that show the share 20
of the total federal tax burden borne by each state. From there, we multiply each state’s share of the total federal tax burden by our estimate of the sum total of all federal wind subsidies to arrive at that state’s share of the cost of federal wind subsidies.
For the purposes of this study, we assume the administrative costs of implementing subsidies are negligible (i.e., payments in equal payments out). Our estimate of the total federal wind subsidy burden over the last ten years is at least $18.58 billion.
!
To estimate the net impact of the federal wind subsidy burden on each state, we subtract each state’s share of the federal wind tax burden from the subsidies given to wind producers in each state.
For example, we estimate that Ohio’s share of the federal wind tax burden is $812.6 million, while wind producers in the state received an estimated $80.6 million in subsidies, indicating a net loss to the state taxpayers of about $732 million that went to support wind producers in other states.
As the following table shows, taxpayers in 30 states and the District of Columbia paid more in taxes to the federal government over the past 10 years to support wind subsidies than wind producers in those states received in subsidy allocations.
! 7

Complete Table of Findings
!
! 8

Regional Analysis Federal wind subsidies impact every state and region in the country. As has been shown in previous articles, studies, and testimony before Congress, subsidies such as the wind PTC 21 22 23
are inefficient policies that distort energy markets, threaten grid reliability, and encourage 24 25
rent-seeking rather than spur reliable energy production. This report shows that federal wind 26
subsidies are also terribly inequitable. A majority of U.S. states—generally states that lack the geography and wind supply to support wind power—unfairly shoulder the burden of these subsidies. IER has highlighted the pitfalls of having a one-size-fits-all federal energy policy that 27
takes from some states and gives to others. This study estimates the amount of this inequity. While federal wind energy subsidies are a losing proposition for a majority of states and their taxpayers, some states lose much more than others. On a regional level, the Northeast and Southeast shoulder the largest losses, subsidizing wind companies in other areas to the tune of $3.9 billion and $3.7 billion, respectively, over the last ten years. The regions that received the most net subsidies are the Southwest and Midwest, with wind producers in those states receiving $4 billion and $2.6 billion in net subsidies, respectively. Below we also highlight some of the largest wind power producers in each region.
The Northeast
The Northeast suffers the largest net losses, allocating $3.9 billion more in taxes from 2005 to 2014 than wind producers in their states received in federal wind subsidies. For the purposes of this study, states in the Northeast include Connecticut, District of Columbia, Delaware, Massachusetts, Maryland, Maine, New Hampshire, New Jersey, New York, Pennsylvania, Rhode Island, Vermont, and West Virginia.
Figure 1 below highlights net subsidies or net losses for each state in the Northeast.
!
! 9

As figure 1 shows, all but two states in the Northeast last year doled out more in federal taxes to support federal wind subsidies than wind producers in their state received in subsidies. Two states in the Northeast—New York and New Jersey—have net losses that exceed $800 million each.
State focus: New York shouldered the second largest amount of net losses in the country, at nearly $1.1 billion from 2005 to 2014. Despite producing the most electricity from wind of all the states in the Northeast region (driven by a high renewable energy mandate and participation in 28
the Regional Greenhouse Gas Initiative), New York suffered the largest net losses in the region. New York’s high wind power production and the related subsidies of about $454.5 million are trumped by its $1.53 billion share of the federal wind subsidy tax burden.
Facility focus: The largest wind facility in the Northeast region is owned by a foreign-based wind company called Iberdrola. Based in Bilbao, Spain, Iberdrola is a multinational electric utility that claims to have “the largest renewable asset base of any company in the world.” This 29
European company has more than 93 billion Euros in total assets, yet reaps billions of dollars 30
in subsidies from American taxpayers.
The following map shows Iberdrola’s U.S. renewable facilities, including wind:
! Source: Iberdrola Renewables
! 10

Iberdrola’s Maple Ridge wind project in Lewis, New York (a small upstate town near the Vermont border) is the largest wind facility in the Northeast, with 195 turbines and a nameplate capacity of 322 MW. In addition to federal subsidies, Iberdrola’s Maple Ridge facility also reaps a generous state production incentive and is exempt from property taxes. In fact, Iberdrola is 31
active across the Northeast. In Pennsylvania, two hours northwest of Philadelphia, sits Iberdrola’s Locust Ridge wind facilities. The two facilities have a nameplate capacity of 128 32
MW over 64 turbines, which span 5,700 acres of land. This is a vast amount of land for a small amount of electrical capacity. For example, the Arkansas Nuclear One Station has a nameplate capacity of 1,800 MW and requires just 1,100 acres. 33
The Southeast The Southeast region suffers the second largest net losses. Taxpayers in the Southeast allocated, in total, $3.7 billion more in taxes from 2005 to 2014 than wind producers in their states received in federal wind subsidies. In this study, the Southeast region includes Alabama, Arkansas, Florida, Georgia, Kentucky, Louisiana, Mississippi, North Carolina, South Carolina, Tennessee, and Virginia. Figure 2 below highlights net losses for each state in the Southeast.
! As Figure 2 shows, every state in the Southeast region shouldered net losses. Of the 11 states in the region, the largest losses go to Florida ($920.1 million), Georgia ($480 million), Virginia ($461.8 million), and North Carolina ($454 million). Taxpayers in the Southeast suffer net losses because their states simply do not have the wind availability of other regions. Since the Southeast does not have quality wind resources, the states in the region generally do not have Renewable Portfolio Standards (RPS), which require utilities to generate a certain percentage of their electricity from renewable sources. If lawmakers in Southeastern states were to impose renewable electricity mandates, these states
! 11

would most likely be forced to buy renewable energy credits (RECs) from states with higher wind potential, providing additional subsidies to wind producers in other states. 34
State focus: Florida suffers the third largest net losses nationwide and the biggest net loser in the Southeast. Its net losses of $920.1 million from 2005 to 2014 represent the all-pain, no-gain prospect of federal wind subsidies in the Southeast. Because the state of Florida had zero wind generation over the last decade but a high share of the federal wind subsidy-related tax burden, federal subsidies to wind power imposed a heavy tax on Floridians without conferring “benefits” to anyone in the state.
Facility focus: The proposed Amazon Wind Farm U.S. East will be the first utility-scale wind farm in North Carolina and one of the first in the Southeastern United States. The project is 35
owned by Spanish-based Iberdrola.” Perhaps because North Carolina has some of the lowest potential wind capacity in the nation, Amazon Wind Farm U.S. East is currently the only planned wind facility in the state. The Midwest On a regional level, the Midwest is the second largest net recipient of federal wind subsidies. Wind producers in Midwest states received, in total, about $2.6 billion more in federal wind subsidies from 2005 to 2014 than their states allocated in taxes to support those federal wind subsidies. For the purposes of this study, states in the Midwest region include Iowa, Illinois, Indiana, Kansas, Michigan, Minnesota, Missouri, Nebraska, North Dakota, Ohio, South Dakota, and Wisconsin.
Figure 3 below highlights net subsidies or net losses for each state in the Midwest.
! As figure 3 shows, wind producers in 8 out of 12 Midwestern states received more federal wind subsidies than taxpayers in those states contributed to their share of the wind subsidy tax burden. Wind producers in Iowa received $1.6 billion in net subsidies, making Iowa second only
! 12

to Texas in terms of largest net subsidies. Ohio, on the other hand, fares the worst out of all states in the Midwest, suffering net losses of $732 million.
Despite the Midwest region being a net recipient of federal wind subsidies, Michigan, Missouri, Ohio, and Wisconsin all shouldered net losses. Each of these states also has an RPS that requires electric utilities to generate a certain percentage of their electricity from renewable sources. Given that these states do not produce much wind but are still required to add renewables like wind to their generation mix, these states are most likely buying wind from states whose wind producers are net recipients of federal wind subsidies. State focus: Ohio provides a case study for how state renewable electricity mandates can force taxpayers to bestow additional subsidies on wind producers in other states. Ohio’s RPS, which in 2014 was frozen for two years, requires utilities to generate 12.5 percent of their electricity from renewable sources like wind by 2024. In annual compliance filings, Duke Energy Ohio, a 36
utility that provides electricity for much of the Cincinnati area, reported that they met one-half of their total non-solar renewable energy requirements for 2012 by purchasing RECs from “adjacent states.”
Similarly, FirstEnergy Ohio Utilities, which includes subsidiaries that provide electricity to 37 38
Akron, Cleveland, and Toledo, also purchased renewables from “other states deliverable into Ohio” to comply with the RPS in 2012.
In other words, Ohio taxpayers subsidize wind producers in other states not only through their federal tax dollars but also through the state RPS—which utilities cannot meet without purchasing electricity from wind producers in neighboring states.
Facility focus: The Flat Ridge 2 Wind Facility, jointly owned by Sempra U.S. Gas & Power and BP Wind Energy, is the largest wind facility in Kansas, with a nameplate capacity of 407 MW. 39
The project generated over 1.9 million MWh of electricity in 2014, more than any other wind facility in the Midwest. The 294-turbine facility is located in Barber, Harper, Kingman and Sumner Counties in the south-central region of the state, and accounts for nearly a fifth of the state’s PTC-eligible wind generation.
Wind facilities are exempt from property taxes in Kansas, and BP Wind Energy’s Director of Wind Development claimed that the company’s payments to the counties justifies the project’s property tax exemption in his testimony to the state’s Joint Committee on Energy and Environmental Policy in 2011. 40
However, the Kansas Policy Institute found that Flat Ridge 2’s exemption lost the state $35 million in property taxes in 2014—28 times larger than the $1.25 million annual payments the company pays out in lieu of the tax. 41
! 13

The Southwest The Southwest is the largest net recipient of federal wind subsidies, driven primarily by Texas. As a whole, wind producers in the Southwest received more than $3.97 billion more in federal wind subsidies than taxpayers in their states paid in taxes from 2005 to 2014 to support federal wind subsidies. For the purposes of this study, states in the Southwest include Arizona, New Mexico, Oklahoma, and Texas. Figure 4 highlights the net subsidies or net losses of each state in the Southwest.
! As figure 4 shows, wind producers in all but one Southwestern state received more federal wind subsidies from 2005 to 2014 than taxpayers in their states contributed to their share of the wind subsidy tax burden. The only state in the Southwest whose taxpayers paid more in taxes than their wind producers took in subsidies was Arizona, with net losses of about $207 million.
State focus: Texas is the biggest net recipient of federal wind subsidies nationwide, raking in nearly $3 billion in wind subsidies than its share of the federal wind subsidy-related tax burden.
From 2005 to 2014, Texas produced more than 209.8 million megawatt-hours of federal subsidy-eligible wind generation, more than double the second highest state’s eligible wind generation.
Texas has exceeded its RPS due to particularly good wind corridors within the state. States whose geography is not as conducive to wind generation as Texas—such as Ohio—have much more difficulty meeting their state renewable electricity mandates without importing wind energy from other states.
! 14

Facility focus: The Roscoe Wind Facility in Texas is the largest facility in the Southwest with a nameplate capacity of 782 MW. Commercial, residential, and industrial wind facilities are 42
exempt from property taxes in Texas, and the facility received $216 million subsidies from the 43
Section 1603 renewable grant program towards its estimated $1 billion construction costs. 44
Roscoe is owned by E.ON Climate Renewables (EC&R), a subsidiary of E.ON, an international power and gas company headquartered in Düsseldorf, Germany with over 125 billion euros in assets. 45
The West
The West is the third largest net recipient of federal wind subsidies. Wind producers in Western states received, in total, over $1.09 billion more in wind subsidies than their states’ taxpayers paid to support the wind subsidy tax burden from 2005 to 2014. For the purposes of this study, Western states include Alaska, California, Colorado, Hawaii, Idaho, Montana, Nevada, Oregon, Utah, Washington, and Wyoming.
Figure 5 highlights the net subsidies or net losses of each state in the West.
!
As Figure 5 shows, wind producers in 7 out of 11 Western states received net subsides. Wind producers in Oregon are the biggest net recipients, at more than $645.9 million, while taxpayers in California suffer the most net losses, at nearly $1.3 billion. State focus: From 2005 to 2014, California had the second highest installed wind capacity in the country and was the sixth largest taker in terms of gross subsidies, receiving a total of 46
almost $913.2 million in our ten-year snapshot. However, because California taxpayers contribute the largest share of the federal tax burden—almost 12 percent of the total—California actually shoulders the largest net losses.
! 15

Facility focus: The Shepherds Flat Wind Project is the biggest wind facility in Oregon, and its nameplate capacity of 845 MW ranks it among the largest wind facilities in the world. Shepherds Flat is located in Morrow and Gilliam counties in the north central region of the state. GE Energy Financial Services, Google, and Japanese firms Tyr Energy and Sumitomo Corporation invested in the project, partnering with the project manager Caithness Energy to “[expand] their renewable energy portfolios.” The project, which opened in 2012, was highlighted by White 47
House officials in an internal memo as an illustration of the flaws that plagued the Department of Energy’s loan guarantee program. The developer of the project, Caithness Energy, received 48
$1.2 billion in subsidies to fund the $1.9 billion project, covering nearly 64 percent of its costs, including a partial loan guarantee from the Department of Energy. In 2013, Caithness Energy 49
appeared to be taking advantage of government subsidies by claiming three separate tax credits totaling $30 million from the Oregon Department of Energy when the company likely only qualified for one, according to an investigation by The Oregonian. 50
Issues for Further Analysis This analysis evaluates the impacts of wind subsidies without adjusting the PTC-related tax burden for imports of wind-generated electricity. Likewise, our analysis does not adjust for exports of wind-generated electricity from states such as Iowa, which generates about 20 percent of the electricity it generates from wind due to its large wind resource availability, but also exports a major portion of that electricity. Further analysis could also analyze federal wind subsidies by recipient (on a facility-by-facility basis, using EIA data) and determine what percentage of federal subsidy allocations accrue to foreign-owned facilities. Such information could be useful to policymakers and voters but has not yet been published. Finally, another study could break down the magnitudes and distributional effects of each subsidy type—PTC, ITC, and 1603 grant. For the purposes of this white paper, we calculate wind subsidies based on the “value” of the PTC only.
Conclusion As this report highlights, federal wind subsidies such as the PTC “benefit” wind producers in a few states, but those subsidies to wind producers come at the expense of taxpayers everywhere. Furthermore, subsidies to wind producers in the relatively few states with excellent wind resources represent losses to the majority of the states within the U.S. Even in states that seem to accrue net “benefits” from federal wind subsidies, these subsidies merely redistribute wealth from taxpayers to wind companies. Federal wind subsidies—beyond being inefficient policies that distort energy markets, threaten grid reliability, and encourage rent-seeking—create an unfair redistribution of wealth across state lines that enriches wind companies in a handful of states at the expense of taxpayers in most other states.
! 16

In this study, we use the terms “subsidy” and “allocation” to refer to the granting of tax credits for 1
individual taxpaying entities under the auspices of the wind PTC program. Although in general there is an important distinction between a “tax credit” and a genuine disbursement of other taxpayer dollars to a recipient, in practice this distinction is blurred when it comes to the wind PTC. This is because the actual wind enterprises themselves often do not generate enough tax liability to fully enjoy the available credit, giving an incentive for outside firms (which show a higher net profit on other activities) to absorb the wind enterprise, with its tax credit one of the primary assets of acquisition.
See Government Accountability Office, Wind Energy: Additional Actions Could Help Ensure Effective 2
Use of Federal Financial Support, March 2013, http://www.gao.gov/products/GAO-13-136.
The 11 states with zero wind production in 2012 are Alabama, Arkansas, Connecticut, Florida, Georgia, 3
Kentucky, Louisiana, Mississippi, North Carolina, South Carolina, and Virginia.
As IER has explained, federal wind subsidies often support foreign industries rather than U.S. industries. 4
See: http://www.instituteforenergyresearch.org/2012/09/07/obamas-energy-tax-proposals-wind-vs-oil-and-gas/.
Averaging EIA’s weighted average wholesale price across all regions in 2014 yields $52.32 per MWh. 5
See: http://www.eia.gov/electricity/wholesale/.
See: Lisa Linowes, Wind Energy Without the PTC, Master Resource, May 12, 2012, http://6
www.masterresource.org/2012/05/wind-energy-without-ptc/, and Jonathan A. Lesser, Wind Intermittency and the Production Tax Credit: A High Cost Subsidy for Low Value Power, Oct. 2012, http://www.continentalecon.com/publications/cebp/Lesser_PTC_Report_Final_October-2012.pdf.
Energy Information Administration, EPACT2005 Summary, http://www.eia.gov/oiaf/aeo/otheranalysis/7
aeo_2006analysispapers/epa2005_summary.html.
Energy Information Administration, Tax Credits and Renewable Generation, http://www.eia.gov/oiaf/aeo/8
otheranalysis/aeo_2009analysispapers/tcrg.html.
IER, Breaking News: IRS Gives Big Cash to Big Wind, Apr. 3, 2013, http://9
www.instituteforenergyresearch.org/2013/04/03/breaking-news-irs-gives-big-cash-to-big-wind/.
Thomas A. Barthold, Joint Committee on Taxation, Sept. 24, 2013, http://10
www.instituteforenergyresearch.org/wp-content/uploads/2013/10/JCT-wind-PTC-cost-estimate-temporary-extension.pdf.
Sumeet Mohan Patil, Green hybrid energy harvesting system for rotational motion, Northeastern 11
University, December 01, 2012, http://iris.lib.neu.edu/cgi/viewcontent.cgi?article=1093&context=elec_comp_theses.
Danish Wind Industry Association, A Wind Energy Pioneer: Charles F. Brush, updated July 23, 2003, 12
http://www.motiva.fi/myllarin_tuulivoima/windpower web/en/pictures/brush.htm.
Niki Nixon, Timeline: The History of Wind Power. The Guardian, October 17, 2008, 13
http://www.theguardian.com/environment/2008/oct/17/wind-power-renewable-energy.
Nixon, Timeline: The History of Wind Power.14
History Channel, First Megawatt Wind Turbine Generates Electricity, This Day in HISTORY, 15
http://www.historychannel.com.au/classroom/day-in-history/885/first-megawatt-wind-turbine-generateselectricity.
Travis Fisher, PURPA: Another Subsidy for Intermittent Energies, Master Resource, 16
https://www.masterresource.org/energy-efficiency/purpa-renewable-energy-subsidies/.
! 17
Government Accountability Office, Wind Energy: Additional Actions Could Help Ensure Effective Use of 17
Federal Financial Support, March 2013, http://www.gao.gov/products/GAO-13-136.
Internal Revenue Service, 1603 Program: Payments for Specified Energy Property in Lieu of Tax 18
Credits, Mar. 4, 2013, http://www.treasury.gov/initiatives/recovery/Pages/1603.aspx.
For a few years, wind companies could choose between the PTC, the ITC, or Section 1603 grants. The 19
fact that wind companies chose the ITC or Section 1603 grants mean that for those companies, at that specific time, the ITC or the Section 1603 grants were the best choice. This choice implies that the proxy PTC is a lower-bound estimate of the cost of federal wind subsidies. After all, if the PTC were more valuable, the companies would have chosen the PTC and not the ITC or Section 1603 grants. The ITC and the Section 1603 were more valuable, but they also change the timing of the payments for the companies. For many companies, receiving the money up front, as happened with Section 1603 grants, was the most valuable choice.
Internal Revenue Service, SOI Tax Stats - Gross Collections, by Type of Tax and State, Fiscal Year - 20
IRS Data Book Table 5, http://www.irs.gov/uac/SOI-Tax-Stats-Gross-Collections,-by-Type-of-Tax-and-State,-Fiscal-Year-IRS-Data-Book-Table-5.
Robin Millican, Wind PTC Proponents Misconstrue the Facts, Institute for Energy Research, Dec. 5. 21
2012, http://www.instituteforenergyresearch.org/2012/12/05/ptc-proponents-misconstrue-the-facts/.
David E. Dismukes, Removing Big Wind’s “Training Wheels,” American Energy Alliance, Nov. 1, 2012, 22
http://www.americanenergyalliance.org/wp-content/uploads/2012/10/Dismukes-Removing-Big-Winds-Training-Wheels.pdf.
Institute for Energy Research, IER’s Robert Michaels to Testify on the Wind PTC, Oct. 1, 2013, http://23
www.instituteforenergyresearch.org/2013/10/01/iers-robert-michaels-to-testify-on-the-wind-ptc/.
Robert Murphy, Assessing the Production Tax Credit, Apr. 24, 2013, http://24
www.instituteforenergyresearch.org/2012/04/24/assessing-the-production-tax-credit/.
Travis Fisher & Alex Fitzsimmons, Wind PTC Threatens Grid Reliability, Institute for Energy Research, 25
Sept. 19, 2013, http://www.instituteforenergyresearch.org/2013/09/19/wind-ptc-threatens-grid-reliability/.
Institute for Energy Research, The Wind Giveaway, http://www.instituteforenergyresearch.org/windptc/.26
Robin Millican, Wind PTC Proponents Misconstrue the Facts, Institute for Energy Research, Dec. 5. 27
2012, http://www.instituteforenergyresearch.org/2012/12/05/ptc-proponents-misconstrue-the-facts/.
See: Database of Energy Efficiency, Renewable Energy, New York, http://programs.dsireusa.org/28
system/program/detail/2660, http://programs.dsireusa.org/system/program/detail/93.
Iberdrola Renewables, Transforming the Way the World Uses and Produces Energy, accessed October 29
28, 2015, available here: http://iberdrolarenewables.us/our-business.html.
Ernst & Young, S.L., “ Consolidated Financial Statements and Consolidated Management Report for 30
the Year ended December 31, 2014,” Iberdrola S.A., February 19, 2015, https://www.iberdrola.es/webibd/gc/prod/en/doc/IA_CuentasAnualesConsolidadas2014.pdf.
New York State Energy Research and Development Authority, New York State Renewable Portfolio 31
Standard: Performance Report ending March 2007, August 2007, http://www.nyserda.ny.gov/-/media/Files/Publications/Energy-Analysis/RPS/NYS-RPS-performance-report-2007.pdf.
Iberdrola Renewables, Locust Ridge Wind Power Projects, accessed October 19, 2015, http://32
iberdrolarenewables.us.files.s3.amazonaws.com/pdf/locust-ridge-fact-sheet.pdf.
Entergy, A Comparison: Land Use by Energy Source – Nuclear, Wind and Solar, accessed October 19, 33
2015, http://www.entergy-arkansas.com/content/news/docs/AR_Nuclear_One_Land_Use.pdf.
! 18

North Carolina already has a renewable energy mandate requiring that 12.5 percent of electricity 34
generation by investor-owned utilities in the state come from renewable sources by 2021. See: Database of Energy Efficiency, Renewable Energy, North Carolina, http://www.dsireusa.org/incentives/incentive.cfm?Incentive_Code=NC09R.
Iberdrola Renewables, Groundbreaking at North Carolina’s First Wind Farm, Press Release, July 14, 35
2015, http://iberdrolarenewables.us.files.s3.amazonaws.com/pdf/rel_15.07.14.pdf.
See: http://dis.puc.state.oh.us/TiffToPDf/A1001001A13E28B53949C83933.pdf36
FirstEnergy Service Company, In the Matter of the Annual Alternative Energy Status Report of Ohio 37
Edison Company, The Cleveland Electric Illuminating Company and The Toledo Edison, Case No. 13-9013-EL-ACP, http://dis.puc.state.oh.us/TiffToPDf/A1001001A13D15B02836I16206.pdf.
Public Utilities Commission of Ohio, Electric Service Areas of Ohio, http://www.puco.ohio.gov/pucogis/38
esa/index.cfm.
BP Wind Energy, The Flat Ridge 2 Wind Farm, Factsheet, accessed November 2, 2015, http://39
www.bp.com/content/dam/bp-alternate-energy/en/documents/us-wind-farm-flat-ridge-2-fact-sheet.pdf.
Karl Pierce, Testimony Provided to the Joint Committee on Energy and Environmental Policy, BP Wind 40
Energy, October 18, 2011, http://kslegislature.org/li_2012/b2011_12/committees/misc/ctte_jt_engy_envrn_plcy_1_20111017_29_other.pdf.
David Trabert, Testimony to House Taxation Committee HB 2396 – Renewable Energy Property Tax 41
Exemptions, Kansas Policy Institute, March 19, 2015.
Clean Energy Action Project, “Roscoe Wind Complex,” Factsheet, accessed November 2, 2015, http://42
www.cleanenergyactionproject.com/CleanEnergyActionProject/Wind_Power_Case_Studies_files/Roscoe%20Wind%20Complex.pdf.
State Energy Conservation Office, “Texas Tax Code Incentives for Renewable Energy,” 43
Factsheet, http://seco.cpa.state.tx.us/re/incentives-taxcode-statutes.php.
Department of Treasury, “1603 Program: Payments for Specified Energy Property in Lieu of Tax 44
Credits,” October 1, 2015, http://www.treasury.gov/initiatives/recovery/Documents/Section%201603%20Awards.xlsx.
E.ON, 2014 Annual Report, accessed November 2, 2015, https://www.eon.com/content/dam/eon-com/45
ueber-uns/publications/150312_EON_Annual_Report_2014_EN.pdf.
Department of Energy, Installed Wind Capacity, http://www.windpoweringamerica.gov/46
wind_installed_capacity.asp.
Chris Bowers et al., “Google, ITOCHU and Sumitomo Join GE and Developer Caithness Energy as 47
Owners of World’s Largest Wind Farm, in Oregon,” Press Release, BusinessWire, April 18, 2011, http://www.businesswire.com/news/home/20110418006332/en/Google-ITOCHU-Sumitomo-Join-GE-Developer-Caithness.
Daniel Simmons, “Corporate Welfare Masquerading Under an Environmental Rainbow,” Institute for 48
Energy Research, September 29, 2011, http://instituteforenergyresearch.org/analysis/its-not-green-energy-its-corporate-welfare-masquerading-under-an-environmental-rainbow/.
Ibid.49
Alex Fitzsimmons, “Shepherds Flat Still Feeding at the Public Trough,” Institute for Energy Research, 50
July 25, 2013, http://instituteforenergyresearch.org/analysis/shepherds-flat-still-feeding-at-the-public-trough/.
! 19