pt004 potato irrigation - development of irrigation ... · 4. surveys of potato grower irrigation...
TRANSCRIPT

PT004 Potato irrigation - development of irrigation scheduling guidelines
Murray Hegney Agriculture Western Australia

PT004
This report is published by the Horticultural Research and Development Corporation to pass on information concerning horticultural research and development undertaken for the potato industry.
The research contained in this report was funded by the Horticultural Research and Development Corporation.
All expressions of opinion are not to be regarded as expressing the opinion of the Horticultural Research and Development Corporation or any authority of the Australian Government.
The Corporation and the Australian Government accept no responsibility for any of the opinions or the accuracy of the information contained in this report and readers should rely upon their own enquiries in making decisions concerning their own interests.
Cover price: $20.00 HRDC ISBN 1 86423 626 4
Published and distributed by: Horticultural Research & Development Corporation Level 6 7 Merriwa Street Gordon NSW 2072 Telephone: (02)9418 2200 Fax: (02)9418 1352 E-Mail: [email protected]
©Copyright 1997
HRDVC
HORTICULTURAL RESEARCH & DEVELOPMENT CORPORATION
Partnership in horticulture
POTATO IRRIGATION - DEVELOPMENT OF IRRIGATION SCHEDULING GUIDELINES
CONTENTS
1. Project executive summary 2
2. Project staff and collaborators 4
3. Publications arising out of this work 4
4. Surveys of potato grower irrigation practices and irrigation system operation in the Manjimup-Pemberton area 6
5. Irrigation management of Delaware, Cadima and Kennebec potatoes 23
6. Irrigation and nitrogen management of Russet Burbank potatoes .... 61
7. Impact of potato tuber growth around access tubes on soil water measurement by neutron probe 104

1.0 PROJECT EXECUTIVE SUMMARY
This 3 year project began in 1989 in response to demand from both the fresh and processing sectors of the Western Australian potato industry for increased yields of higher quality potatoes. There was general recognition that irrigation management played a vital role in determining both of these factors, but the relative irrigation requirements of commonly grown varieties had not been adequately defined. Irrigation scheduling techniques had been developed overseas for a number of varieties based on optimum available soil moisture levels for different crop growth stages. No such techniques had been studied in Western Australia (WA) and it was believed that significant losses were being incurred by growers through the effects on yield and quality of suspected over-irrigation, poor timeliness of irrigation events, and possible leaching of fertilisers from the crop root zone.
The aims of the project were to (1) conduct a preliminary examination of the operating efficiency of commonly used irrigation systems in the Manjimup-Pemberton area of Western Australia and provide recommendations for system improvement where necessary, and (2) develop irrigation scheduling guidelines for important potato varieties, based on the use of simple soil moisture monitoring techniques, that would enable growers to maximise tuber yield and quality, and water use efficiency.
A survey of irrigation practices in eight representative commercial crops during the 1989/90 season showed that growers were using mostly fixed irrigation cycles and this resulted in crops being both over and under watered at varying times during their growth. The degree of over-watering was not high, averaging -6% over the entire crop growth period. Of greater concern was the tendency to supply inadequate amounts of water to crops, particularly during the important early to mid tuber bulking period between 60 and 100 days after planting. These problems highlighted the need for development and use of more precise irrigation scheduling techniques.
In the 1990/91 season, a survey of the set-up and management of irrigation systems in the Manjimup-Pemberton area revealed that low sprinkler operating pressure was the most common cause of poor irrigation uniformity within the most commonly used semipermanent sprinkler irrigation systems . Low operating pressure was, in turn, most commonly caused by having too many sprinklers along each lateral line. Simple pressure loss calculations can be performed to determine the optimum number of sprinklers per lateral (based on a maximum allowable pressure variation of 5%), and these calculations should be carried out before irrigation systems are installed in each new paddock.
Field experiments were used to examine the yield and tuber quality response of Delaware, Cadima, Kennebec and Russet Burbank potatoes to varying levels of soil moisture during different crop growth stages. For Delaware, WA's most common fresh market variety, it was found that to maximise both yield and the proportion of Premium grade tubers, the available soil moisture level should be maintained above 80% during the period between emergence and early tuber growth. This soil moisture level corresponded with a soil water potential (SWP), measured using tensiometers installed at 30cm depth, of between -20 and -25 kPa. High yields and tuber quality were achieved by maintaining this high soil moisture regime throughout all crop growth stages. However, provided adequate soil moisture levels were maintained between emergence and tuber growth, it was found that the available soil moisture level could be
2

allowed to fall to as low as 65% (SWP -60kPa) during later growth stages without impacting significantly on tuber yield or quality. If such low soil moisture levels were allowed to develop between emergence and early tuber growth then yield and tuber quality were reduced. In the soil type used in these studies (loamy sand), up to 55mm of water was required to return the profile to field capacity when the available soil moisture level fell to 65%. Applying this amount of water in a single application to crops grown on the sloping paddocks common to the Manjimup-Pemberton area may cause soil erosion problems. For this reason, it is recommended that the available soil moisture level not be allowed to fall below 75% (SWP -35kPa) at any growth stage in Delaware potatoes.
As with Delaware, it was found that high yields and acceptable tuber quality in Cadima and Kennebec potatoes could be achieved by maintaining the available soil moisture level above 80% (SWP -25 kPa) during all growth stages. However, the yield and quality of Cadima and Kennebec were not reduced when the available soil moisture level was allowed to fall to 72% (SWP -40 kPa) during all growth stages. This suggests that, compared with Delaware, Cadima and Kennebec may be more tolerant to low soil moisture levels during early growth stages. Further work is needed to more accurately define the irrigation requirements of Cadima and Kennebec during each crop growth stage.
On the sandy loam soils used for Russet Burbank irrigation studies in this project, regardless of the irrigation regime imposed, the yield of this variety was found to be strongly linearly related to the total amount of crop water use(CWU), up to 610mm (CWU = soil moisture content at emergence - soil moisture content at harvest + irrigation + rainfall). However, while total water applied, and hence CWU, appeared to be a dominant factor determining the yield and quality of Russet Burbank potatoes, like Delaware, Russet Burbank was found to be sensitive to low soil moisture levels in the period between emergence and early tuber growth. For maximum yield and optimum tuber quality, where quality was measured in terms of tuber shape, specific gravity and the level of internal defects, the results of studies in this project suggest that the SWP in Russet Burbank crops (measured at 30cm depth) should be maintained above -20kPa during this early growth period. During later growth periods, allowing the SWP to decline to -40kPa had no effect on tuber yield or quality.
In a single field experiment with Russet Burbank potatoes planted in mid November on a sandy loam soil type, no significant interaction was found between irrigation level (up to 125% estimated evapotranspiration) and nitrogen level (up to 600 kg N/ha). The optimum total nitrogen application level was found to be between 335 and 375 kg N/ha. Further work is required to determine whether such nitrogen levels are appropriate for other planting times, varieties and soil types. Also, the possible significant interaction between nitrogen and irrigation levels on sandier soil types than that used here deserves further investigation.
Tensiometers were used for the measurement of soil water potential in most of the crop water requirement studies in this project. We found them to be simple to install and monitor, and when properly maintained, they gave reliable readings of soil water potential that can be used for accurate irrigation scheduling in potato crops. However, other devices are commonly used for monitoring soil moisture and thus irrigation scheduling in potato crops. One such device is the neutron probe, which we also used in
3

this project. When inserted into the soil, via an access tube, the neutron probe emits fast neutrons which are moderated by water molecules in the soil. The count of resultant slow neutrons reflected back to the probe is used to calculate soil water content from established calibration functions. We were concerned that the emitted fast neutrons would not distinguish between the water contained in potato tubers and that in the surrounding soil, and that the presence of tubers close to access tubes installed in the potato ridge may result in the soil water content being over-estimated. Two field experiments were conducted to test this theory and it was found that as tuber fresh weight increased up to 1400g per 30cm length of row, the over-estimation of soil water content by the neutron probe at 20cm depth approached 9mm. This is a highly significant error when considered in relation to the optimum soil moisture depletion limits of 20-25mm for varieties like Delaware and Russet Burbank on the soil types used in this project. Estimates of soil water content by neutron probe at 30cm depth were not significantly affected by the presence of potato tubers in the ridge. Therefore, these data suggest that, when using neutron probes for monitoring soil moisture levels in potato crops, readings at 20cm depth should either be corrected according to the fresh weight of tubers present, or water content at this depth should be monitored by some other means (eg. gravimetrically).
Note: A summary of each chapter of this report is included at the start of the chapter.
2.0 PROJECT STAFF AND COLLABORATORS
Murray Hegney - Project Principal Investigator and Manager
Harold Hoffmann - Project Technical Officer
Gavin D'Adhemar - Technical Officer, Manjimup Horticultural Research Centre
Staff of Manjimup Horticultural Research Centre
3.0 PUBLICATIONS ARISING OUT OF THIS WORK
Seminar/Conference Proceedings
Hegney, M.A. (1991). Potato irrigation studies in Western Australia. Proceedings 6th
National Potato Research Workshop, Healesville, Victoria, pp 197-201.
Hegney, M.A. (1991). Irrigation requirements of Delaware and Cadima potatoes. Conference Proceedings, Horticulture research and extension update, June 13-14, Mandurah, WA Department of Agriculture.
Hoffmann, H.P. and Hegney, M.A. (1991). Effect of tuber growth on soil moisture estimation by neutron probe in the potato ridge. Conference Proceedings, Horticulture research and extension update, June 13-14, Mandurah, WA Department of Agriculture.
4

Extension Articles
Hegney, M.A. (1990). EflHcient irrigation - a high priority in W.A. Potato Australia 1, 29-30.
Hegney, M.A. and Hoffmann, H.P. (1991). Using tensiometers for scheduling irrigation for potatoes. WA Department of Agriculture Farmnote 107/91.
Hegney, M.A. (1992). Potato irrigation - development of irrigation scheduling guidelines. Progress report. Potato Grower September 1992, pp 27-30.
Hegney, M.A. (1992). Potato irrigation management - avoid stress and maximise yield and quality. Potato Grower December 1992, pp 2-6.
Hegney, M.A. (1993). Using tensiometers for irrigation scheduling. Edgells Technote, Processing Potato Production Manual, Edgells Field Service, Manjimup WA.
Hegney, M.A. (1993). Tensiometers - preparation, installation and maintenance. Edgells Technote, Processing Potato Production Manual, Edgells Field Service, Manjimup WA.
Hegney, M.A. (1994). Managing irrigation with limited water supplies. Potato Grower December 1994, pp 2-4.
5

4.0 SURVEYS OF POTATO GROWER IRRIGATION PRACTICES AND IRRIGATION SYSTEM OPERATION IN THE MANJIMUP-PEMBERTON AREA
M.A. Hegney
Summary
Until 1989, no objective data had been collected on the irrigation practices of potato growers in the Manjimup-Pemberton area of Western Australia. It was generally believed that most growers were over-irrigating and were not responding adequately to changes in crop water demand during the growing season.
In addition to a lack of information on irrigation scheduling practices, little was known about the relative operating efficiencies of irrigation systems commonly used in the area. Irrigation systems which uniformly deliver water are just as important as maintaining the correct irrigation schedule.
The objectives of the two brief surveys reported here, conducted between 1989 and 1991, were to estimate the extent of over and under watering within commercial potato crops grown in the Manjimup-Pemberton area; to collect preliminary data on the soil moisture deficits at which commonly grown potato varieties begin to experience moisture stress; to identify how the most common irrigation systems used by growers in the area were operated and any problems with system set-up and operation that should be corrected.
Major results
• The survey of irrigation practices provided anecdotal evidence that different potato varieties have different soil moisture depletion limits. The following soil moisture depletion limits were indicated for crops grown on sandy loam soils - Delaware 15-20mm, Russet Burbank 20-25mm, Kennebec 25-30mm.
• The mostly fixed irrigation schedules used by potato growers in the Manjimup-Pemberton area were inadequate to meet the changing water requirements of their crops during the entire growth period. Both over and under watering events were recorded. Under watering was particularly common in the period between 60 and 100 days after planting. Over irrigation occurred at various times during crop growth. Over the entire crop growth period, average percent excess water applied to the crops surveyed in 1989/90 was 6.13%. The use of objective irrigation scheduling techniques based on measurements of soil moisture levels in relation to appropriate critical limits could be used to help overcome these problems.
• In 1991, the most common irrigation system used by potato growers in the Manjimup-Pemberton area was a semi-permanent sprinkler system with Pope Premier® impact sprinklers on a 14 x 9m spacing with a single 3/16" jet operated at pressures ranging between 25 and 50 psi.
• Sprinkler systems of all types were commonly operated at pressures below those considered necessary to achieve acceptable application uniformities.
• A common reason for low sprinkler operating pressure was having too many sprinklers along a single lateral line, particularly where lateral lines were running up a slope. The problem could be rectified by calculating pressure loss in lateral lines
6

and then determining the optimum number of sprinklers per lateral to ensure the all sprinklers will operate at an acceptable pressure. Obviously, these simple calculations should be done before installing semi-permanent sprinkler systems in each new paddock.
• In 1991, the average pumping cost for irrigating potato crops in the Manjimup-Pemberton area was estimated at $708/ha/crop.
Recommendations
(a) Extension/adoption by industry
Results from these surveys were presented at the 6th National Potato Research Workshop, HealesviUe Victoria, February 1991, and at a seminar for potato growers in the Manjimup-Pemberton area in June 1992. Detailed reports were provided to all growers who participated in the surveys.
(b) Directions for future research
The survey of grower irrigation practices suggested that further detailed investigation was required to establish the soil moisture depletion limits which correspond with optimum yield and quality for the major potato varieties grown in the Manjimup-Pemberton area. This is, in part, addressed by the following reported work in this project.
To aid growers in the correct set-up of irrigation systems, tables or charts detailing pressure loss or recommended sprinkler number along lateral lines need to be published for all commonly used sprinkler types and arrangements.
(c) Financial/commercial benefits
Failure to respond to changes in crop water requirement during growth can result in lost income through reduced yield or tuber quality, or excessive water application levels and hence pumping costs. Variation in water application levels within a sprinkler pattern caused by poor system operating efficiency can cause significant yield variation within a potato crop, make accurate irrigation scheduling very difficult, and reduce grower returns. These surveys have identified a number of simple steps growers can take to help minimise these problems.
7

4.1 SURVEY OF POTATO GROWER IRRIGATION PRACTICES IN THE MANJIMUP - PEMBERTON AREA
Introduction Until 1989, very little was known about the irrigation practices of potato growers in Western Australia. There was no widespread use of objective irrigation scheduling techniques and it was generally believed that most growers were over-irrigating and were not timing irrigations correctly in relation to crop growth stages and water demand. Equally, there was no local data on potato crop water use or the optimal irrigation frequencies for different potato varieties.
Aims (1) To collect preliminary data on the soil water deficits at which potatoes, grown on
the sandy loam soils of the Manjimup-Pemberton area, begin to experience stress and hence should be watered.
(2) To estimate the frequency of over and under watering in commercial potato crops grown in the Manjimup-Pemberton area during the spring-summer period.
Materials and Methods Soil water monitoring During the 1989/90 growing season, eight commercial potato crops were monitored. A further five crops were monitored during the 1990/91 season. In each crop, immediately after emergence, when individual plants could be identified, three aluminium neutron probe access tubes (1.0 m long) were installed in a representative area of the crop. The soil moisture content of the top 75 cm of the profile was measured twice weekly throughout the life of each crop by integrating soil moisture measurements taken at depths of 20, 30, 45, 60 and 75 cm below the top of the potato ridge. The neutron probe used was a Model 503DR Hydroprobe from Campbell Pacific Nuclear, Pacheco, California, USA. The neutron probe was not separately calibrated for each site. Rather the calibration equations supplied by the manufacturer were used.
At each site, field capacity was estimated from soil moisture measurements taken 24 hours after significant rainfall or irrigation events early in the life of the crop.
At three additional sites during the 1989/90 season, one each for the varieties Delaware, Kennebec and Russet Burbank, daily soil moisture readings were taken immediately after one or more irrigation events during the early to mid tuber bulking growth stage. At each of these sites, three replicate neutron probe access tubes were installed in a small, representative area of crop. Then, immediately following an irrigation event considered sufficient to fill the soil profile to field capacity, the sprinklers surrounding this small site were blocked off for a 10 to 15 day period (drying cycle). Daily measurements of soil moisture content during these drying cycles then enabled crop water use to be closely monitored. When a clear change (i.e decrease) in the rate of water use occurred, the soil moisture content at that time was set as the refill point. The difference between field capacity and the refill point was then set as the soil water depletion limit for that variety at that site. The soil moisture depletion limits established in this way were then arbitrarily used at other sites with the same variety to determine
8

the number of times that the soil moisture content fell below the refill point, and hence when the crop was likely to have been under stress.
Tuber samples In addition to the soil moisture monitoring, tuber growth was monitored in five commercial crops of Russet Burbank potatoes planted during November 1989. All tubers (i.e. >10 mm diameter) were periodically sampled from a 1 m section of row. Average tuber fresh weight was recorded and related to the number of days after planting.
Results and Discussion
Refill point estimations Figures 1, 2 and 3 show the changes in soil moisture content during a representative drying cycle at the early to mid tuber growth stage in crops of Delaware, Kennebec and Russet Burbank, respectively. The data suggest that the soil moisture depletion level above which Delaware potatoes begin to experience moisture stress (15-20 mm) may be lower than for Russet Burbank (20-25 mm). Compared to both Delaware and Russet Burbank, these data suggest that Kennebec may be able to tolerate a higher soil moisture depletion level (25-30 mm). Given that the data for each variety was taken from a different site, it is difficult to confidently say that these apparent differences in tolerable soil moisture depletion levels are real. Replicated soil moisture deficit experiments, or data from surveys of a larger number of field sites, is required to establish the optimal soil moisture depletion limits for each variety. Nonetheless, for the purpose of determining the degree of over- or under-watering on individual sites in this survey, the soil moisture depletion limits established here were applied to other surveyed sites according to the variety used.
310
305
0) 300 SE 8 o 295 0)ip
= ,sr 290 ">o O ^" 285 b
285
oil
?R0 OT
275 0 2 4 6 8 10 12 14 16 18 20
Days after watering
Figure 1. Changes in soil moisture content with time during two drying cycles in a crop of Delaware potatoes growing on a loamy soil in the Manjimup - Pemberton region of WA at the mid tuber growth stage. Data points arc means of three replicate readings.
9
270
S
260 E
B 1 255 -<D O
•gin 250 -| ° 245 h | 240 K o E
235 230
6 8 10
Days after watering
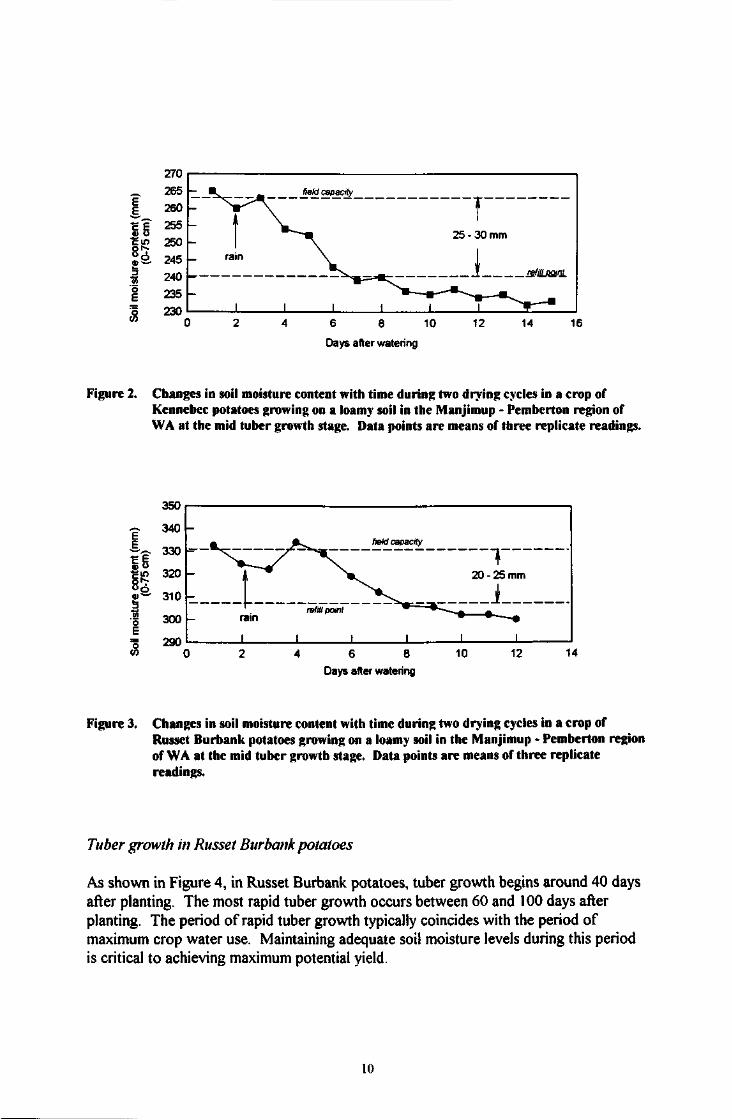
Figure 2. Changes in soil moisture content with time during two drying cycles in a crop of Kennebec potatoes growing on a loamy soil in the Manjimup - Pemberton region of WA at the mid tuber growth stage. Data points are means of three replicate readings.
350
4 6 8 Days after watering
14
Figure 3. Changes in soil moisture content with time during two drying cycles in a crop of Russet Burbank potatoes growing on a loamy soil in the Manjimup - Pemberton region of WA at the mid tuber growth stage. Data points are means of three replicate readings.
Tuber growth in Russet Burbank potatoes
As shown in Figure 4, in Russet Burbank potatoes, tuber growth begins around 40 days after planting. The most rapid tuber growth occurs between 60 and 100 days after planting. The period of rapid tuber growth typically coincides with the period of maximum crop water use. Maintaining adequate soil moisture levels during this period is critical to achieving maximum potential yield.
10

/LU\J •
(g) •
•
tube
r wei
ght
0 0
•
•
Ave
rage
D
O
V , 1 ^ y<
•
•
7 m •
1
•
20 40 60 80 Days after planting
100 120
Figure 4. Relationship between time after planting and average tuber weight for Russet Burbank potatoes. Data are from periodical one metre row samples from commercial crops during 1990/91. The equation of the fitted line is
235.7-13.35vH).23x2-1.036x\ R2=0.807
Over or under watering
For crops monitored during 1989/90, over-watering was more common during the second half of the crop growth period (>60 days after planting) than in the first (Table 1). In contrast, under-watering was more common during the first 60 days after planting. Below average rainfall was recorded during the spring of 1989 when the surveyed crops were planted and so soils were drier than normal at planting. In five of the eight crops surveyed, insufficient water was applied during the first 4 to 5 irrigation events to bring the soil moisture content up to field capacity. The result was that, in these five crops, field capacity was not reached until at or just after tuber initiation.
The average percent excess water applied to the crops surveyed during 1989/90 was 6.13% (data not shown). This compares with 32% average over-watering recorded by Marshall and Gowers (1987) in potato crops in Ballarat, Victoria. It would appear that growers in the Manjimup-Pemberton area have more of a problem with under- rather than with over-watering.
In the five crops monitored during 1990/91, both the number of over- and under-watering events were highest between 60 and 100 days after planting (Table 2). This suggests that growers found it difficult to maintain a relatively uniform soil moisture regime during this important crop growth period. The average number of times that soil moisture levels fell below the refill point was particularly high at 6.2. This reflects the fact that across all sites, despite a number of over-watering events being recorded,
11

average soil moisture levels declined during this period and were frequently not recovered until after 100 days after planting. Part of the reason for this problem is that the growers typically used fixed irrigation cycles (i.e. irrigation every 4-6 days) and applied similar amounts of water at each irrigation event (15-30 mm). There was insufficient manipulation of irrigation frequency and amount to account for changes in crop water use rates during the season.
Table 1. The number of times soil moisture content rose above field capacity (over-watering) and fell below the refill point (under-watering) during the growth of eight potato crops in the Manjimup-Pemberton area in 1989/90. (DAP = days after planting)
Site Number
No. times > field capacity No. times < refill point Site Number 0-60 DAP >60DAP 0-60 DAP >60DAP
1 2 5 4 0 2 0 4 6 1 3 2 2 6 6 4 2 3 5 7 5 1 4 6 4 6 2 4 3 2 7 1 0 1 1 8 0 1 1 0
Average 1.25 2.88 4 2.62
Table 2. The number of times soil moisture content rose above field capacity (over-watering) and fell below the refill point (under-watering) during the growth of five potato crops in the Manjimup-Pemberton area in 1990/91. (DAP = days after planting)
Site Number
No. times > field capacity No. times < refill point Site Number 0-60 DAP 60-100 DAP >100 DAP 0-60 DAP 60-100 DAP >100DAP
1 0 5 2 9 3 0 2 0 3 3 1 9 7 3 1 2 0 5 9 3 4 2 2 3 0 8 5 5 2 3 2 4 2 1
Average 1 3 2 3.8 6.2 3.2
Depth of water extraction
The dominant soils on which potatoes are grown in the Manjimup-Pemberton area are duplex in nature. Top soils consist of gravelly loams, loams, sandy loams and loamy sands, while the subsoil is generally a mottled sandy clay or clay. Depth to subsoil varies between 40 and 100 cm, though most commonly is encountered at c. 60 cm. In all of the crops surveyed, only minimal water extraction occurred below the depth at which the soil textured changed. Where over-watering occurred, water was observed to move into the subsoil. The greatest depth of measured water extraction by potatoes was 80 cm in crop 7 (1989/90) which was grown on a loamy sand soil with a top soil depth of 100 cm.
References
Marshall, D.J. and Gowers, A.F. (1987). Development of an irrigation scheduling service for potatoes. Technical Report No. 144, Department of Agriculture and Rural Affairs, Victoria, Aust.
12

4.2 SURVEY OF POTATO CROP IRRIGATION SYSTEMS IN THE MANJIMUP-PEMBERTON AREA
Introduction Irrigation systems which deliver water uniformly and at a known application rate are critical to the success of any irrigation scheduling program. Potato growers in the Manjimup-Pemberton area use a variety of irrigation systems with many different system configurations. While this project was aimed primarily at developing irrigation scheduling guidelines, a knowledge of existing irrigation systems and their operation was also considered important. This knowledge may enable the identification and correction of any major system problems prior to introducing irrigation scheduling. Also, factors such as correct placement of soil moisture sensors within a crop requires an ability to define areas within the sprinkler pattern which are receiving representative water application rates.
Aim The aim of the brief survey reported here was to identify how the most common irrigation systems used by potato growers in the Manjimup-Pemberton area are operated and any problems with system set-up and operation that need to be addressed.
Materials and Methods A written questionnaire was mailed to 72 potato growers in the Manjimup-Pemberton area in August 1991. The format of the questionnaire was kept simple by combining multiple choice questions with questions requiring only a single figure answer. It was known prior to the survey that semi-permanent sprinkler irrigation systems were the most common in the area. For this reason, the survey questions related mostly to this type of system.
39 growers responded by returning the completed questionnaires. Due to time limitations, no attempt was made to re-contact growers who failed to respond. Not all of the 39 respondents provided answers for all questions on the questionnaire.
Growers were asked what type of irrigation system they used - semi-permanent sprinklers, travelling guns or lateral move. Growers with semi-permanent sprinkler systems were asked what sprinkler heads they used and the sizes of front and back sprinkler jets. These growers were also asked for details on sprinkler and lateral spacings, lateral pipe sizes, average and maximum numbers of sprinklers per lateral, average system output (mm/hr) and sprinkler operating pressures. All growers were asked what their total irrigation pump electricity/diesel cost ($/ha) was for their 1990/91 potato crop. Finally, growers were asked what total area of potatoes they cropped during the 1990/91 season. Results were tabulated to provide an indication of the frequency of various systems and their configurations.
In addition to the questionnaire, average system application rates were measured in 11 randomly selected crops during the 1990/91 season. In each of the selected systems the sprinklers were arranged in an offset pattern. Precipitation rates (mm/hr) were measured during a standard irrigation cycle (1.5 to 3 hours) using five raingauges placed within the sprinkler pattern as shown in Figure 1. These measurements were carried out at three locations within the crop. The operating pressure of sprinklers immediately
13

adjacent to the raingauges was measured with a hand held Bourdon pressure gauge with attached pitot tube. Average system application rates were determined by calculating the mean of all 15 raingauge measurements. In addition to these measurements, the coefficient of uniformity (CU) (Christiansen, 1942) and distribution uniformity (DU) (Jensen, 1981) of system configurations as close as possible to those being used by the growers were determined using the Sprinkler Testing Software (STS) from the Australian Irrigation Technology Centre.
«V
Catch can
Lateral pipe
Sprinkler-* ^
T
Figure 1. Arrangement of catch cans within a typical sprinkler layout.
Results The average area of potatoes produced by the 39 questionnaire respondents during the 1990/91 season was 15ha. Cropped areas ranged between 2 and 50ha. 11 respondents produced more than 20ha and 11 produced less than lOha.
As anticipated, most growers used semi-permanent sprinkler irrigation systems (Table 1). 11 growers used both semi-permanent sprinkler systems and travelling guns. 3 growers used both semi-permanent systems and lateral move irrigators and one grower used all three irrigation systems. All of the growers with semi-permanent sprinkler systems used 50mm (i.d.) aluminium lateral pipes and 0.75 to 1.0m x 19mm (i.d.) galvanised iron sprinkler risers.
Within semi-permanent sprinkler systems the most common sprinkler type used was the Pope Premier® impact sprinkler (Table 2). The second most common sprinkler type was the Pope Monsoon® impact sprinkler.
14

Table 1. Irrigation systems used by the surveyed growers (n=39).
Irrigation System Frequency
Semi-permanent (sprinkler)
Travelling gun
Lateral move
33
18
4
Table 2. Frequency of various sprinkler types used within semipermanent sprinkler systems.
Sprinkler type Frequency
Pope Premier® Pope Monsoon®
Rainspray No. 4® Pope President®
Isralel
24 10 6 1 1
1. Of unknown origin
For systems using Premier® sprinklers, the most common spacing between laterals and sprinklers was 14m and 9m, respectively (Table 3). For systems using Monsoon® sprinklers, lateral x sprinkler spacing combinations varied widely from 12 x 9m to 18 x 18m (Table 4).
Table 3. Sprinkler spacings within systems using Premier® sprinklers (n=24).
Distance between Distance between Frequency laterals (m) sprinklers (m)
12 9 1 12 12 2 14 9 17 15 9 2 16 9 2
The average number of sprinklers per lateral in systems using Premier® sprinklers was 12 (range 5 - 22), and for systems with Monsoon® sprinklers it was 9 (range 5 - 20). The average maximum number of sprinklers per lateral was 15 (range 7 - 25) and 14 (range 7 - 26) for systems with Premier® and Monsoon® sprinklers, respectively.
15

Table 4. Sprinkler spacings within systems using Monsoon® sprinklers (n=10).
Distance between Distance between Frequency laterals (m) sprinklers (m)
12 9 1 14 14 1 15 14 2 16 14 1 16 18 2 18 14 1 18 15 1 18 18 1
All Premier® sprinklers were operated with a front jet only and the most common jet size was 3/16" (No. 12)(Table 5).
Table 5. Front jet sizes in Premier® sprinklers (n=24).
Pope Premier Jet Frequency Number Size (inches)
Frequency
8 10 12 13 14
1/8 5/32 3/16 13/64 7/32
1 1
15 4 3
Within 9 of the 10 Monsoon® sprinkler systems, both front and back jets were used and the most common front and back jet combinations were 5.6 x 3.2mm and 6.8 x 3.2mm (Table 6).
Table 6. Jet combinations in Monsoon® Sprinklers (n=10).
Jet size (mm) Frequency
Front Back Frequency
5.2 5.2 5.6 6.0 6.4 6.8
3.2 3.2 3.2 3.2 3.2
1 1 3 1 1 3
Twenty five respondents indicated they had a pressure gauge somewhere within their irrigation system. Of these, 16 were in semi-permanent sprinkler systems. All Monsoon ® sprinkler systems with pressure gauges (n=5) were said to operate at 50 pounds per square inch (psi) (sprinkler pressure). Within Premier® systems with pressure gauges (n=12), operating pressures varied between 25 and 52 psi (mean 41 psi).
16

The most common specified system application rate for Premier® systems was 12 mm/h (Table 7). Five of the 10 growers with Monsoon® sprinklers responded to the question on system application rate. 2 indicated an application rate of 12 mm/h. The other 3 indicated application rates of 6, 10 and 14 mm/h, respectively.
Table 7. Application rates from semi-permanent systems with Premier® sprinklers (n=17)
Application Rate Frequency (mm/lir)
7 3 8 1 10 3 11 1 12 8 13 1
Only 8 of the 39 respondents gave in estimate of the total cost for irrigation pump electricity or diesel during the 1990/91 growing season. The estimates ranged between $285/ha and $1000/ha., with a mean of $707/ha.
The average application rates measured within 11 grower irrigation systems were very close to the application rates determined for similar system configurations using the Sprinkler Testing Software (Table 8). Application rates recorded at raingauge locations 2 and 4 (Figure 1) were generally closest to the system average application rate. The very high application rate at grower number 9 resulted in obvious surface ponding towards the end of the 1 Vi hour monitored irrigation cycle. As would be expected, average system application rates increased in response to increases in operating pressure and nozzle sizes and decreased sprinkler spacing. For a given nozzle size and sprinkler spacing, the coefficient of uniformity (CU) and distribution uniformity (DU) tended to increase with increased pressure. CU and DU also increased with reduced sprinkler spacings. The highest CU and DU (97.1% and 95.5%, respectively) was recorded for a system with Monsoon® sprinklers with a front and back jet combination of 6.4x3.2mm, a lateral x sprinklers spacing of 12x9m and an operating pressure of 50 psi. No STS estimates were possible for grower sites 4 and 8 because the program did not contain the sprinkler nozzle combinations or pressures that these growers used.
Discussion and Conclusions The most common irrigation system in the Manjimup-Pemberton area was a semipermanent sprinkler irrigation system based on 50mm aluminium lateral piping with Pope Premier® impact sprinklers on a 14 x 9m spacing with a single 3/16" jet operated at pressures ranging between 25 and 50 psi. Discussions with growers about the reasons for the popularity of this system suggest that it is simply historic. When growers have needed to update or increase the size of their irrigation systems they have approached a local irrigation equipment supplier who has supplied them with this system "off the shelf. Little or no consideration has been given to where or how the system is to be operated, or whether it is the best system for the job. A similar set of circumstances applies to the use of Monsoon® and other sprinkler types.
17

Table 8. Sprinkler configurations, measured application rates and STS^ estimated application rates, coefficients of uniformity (C.U.) and distribution uniformities (D.U.) of eleven potato crop irrigation systems in the Manjimup/Pemberton area.
Grower Number
Sprinkler Type
Lateral x Sprinkler Spacing
(m)
Sprinkler Operating Pressure
(psi)
Nozzle Sizes
Measured Mean
Application Rate (mm/h)
1 Premier 14x9 25 3/16" 7.7 (±1.0)'
2 Premier 14x9 35 3/16" 11.3 (±1.3)
3 Premier 14x9 50 3/16" 12.6 (±1.6)
4 Premier 14x9 50 3/16" 13.1 (±1.4)
5 Monsoon 14x14 30 5.2x3.2mm 6.8 (±2.0)
6 Monsoon 18x14 35 5.6x3.2mm 9.2 (±1.3)
7 Monsoon 16 x 14 35 5.6x3.2mm 10.6 (±1.6)
8 Monsoon 16x18 75 6.8x3.2mm 16.9 (±1.8)
9 Monsoon 12x9 35 6.4x3.2mm 20.4 (±1.4)
10 Rainspray 12x 18 60 #15x#8 13.9 (±0.6)
11 President 14x14 35 4.9x- mm 7.5 (±0.7)
STS Estimates2
Sprinkler Pressure
(psi) C.U. D.U.
Applicatior Rate
(mm/hr)
22 76.1 62.1 7.7
36 81.1 70.3 10.1
51 84.8 78.2 12.0
29 83.7 76.4 8.4
36 80.5 69.2 9.2
36 80.1 71.3 10.3
36 92.6 86.4 24.4
58 94.2 92.0 13.7
44 88.9 81.2 7.9
1. Figures in parenthesis are standard errors 2. Sprinkler Testing Software (STS) from the Australian Irrigation Technology Institute, S.A.
The coefficient of uniformity (CU) and distribution uniformity (DU) are commonly accepted measures of the application uniformity of sprinkler irrigation systems. The internationally accepted minimums for CUs and DUs are 85% and 75%, respectively (ASAE Yearbook 1979). To achieve these minimum standards using the most common Premier® sprinkler configuration, a sprinkler operating pressure of at least 51 psi would need to be maintained. Only one of the STS evaluated Premier® sprinkler systems achieved both the minimum CU and DU (Grower No. 3). The mean operating pressure specified by the survey respondents who used Premier® sprinklers was 41 psi. At this pressure the uniformity of water application from these systems would be below the accepted minimum.
Half of the surveyed growers using Premier® sprinklers indicated that the application rate from their systems was 12 mm/h. Clearly, the application rate at pressures less than 51 psi will be less than 12 mm/h and so some growers may be over-estimating the quantities of water they are applying.
Sprinkler operating pressures must be adjusted according to the system configuration. Despite all survey respondents with Monsoon® sprinklers stating that their systems were operated at 50 psi, 4 of the 5 monitored Monsoon® systems had sprinkler operating pressures of 35 psi or less. At these low pressures, CUs and DUs were generally below the accepted limits. Dependent upon nozzle sizes and sprinkler spacing, 35 psi may be sufficient pressure for some Monsoon® sprinkler systems. If the operating pressure used by grower number 5 (Table 8) was increased to 35 psi, acceptable CUs and DUs would be achieved. However, higher pressures are required for other configurations. For example, for grower number 7, an operating pressure of 60 psi would be required to achieve acceptable CUs and DUs. The application
18

uniformities of each of these systems would also be improved by reducing the sprinkler and lateral spacings.
The application uniformity of the system used by grower number 9 (Table 8) was very high due to the close sprinkler spacing. However, the very high application rate of this system resulted in surface ponding which indicates that the infiltration rate of the soil was exceeded during the irrigation cycle. In this situation, runoff and soil erosion could become a problem. The infiltration rate of the soil is an important consideration when designing irrigation systems.
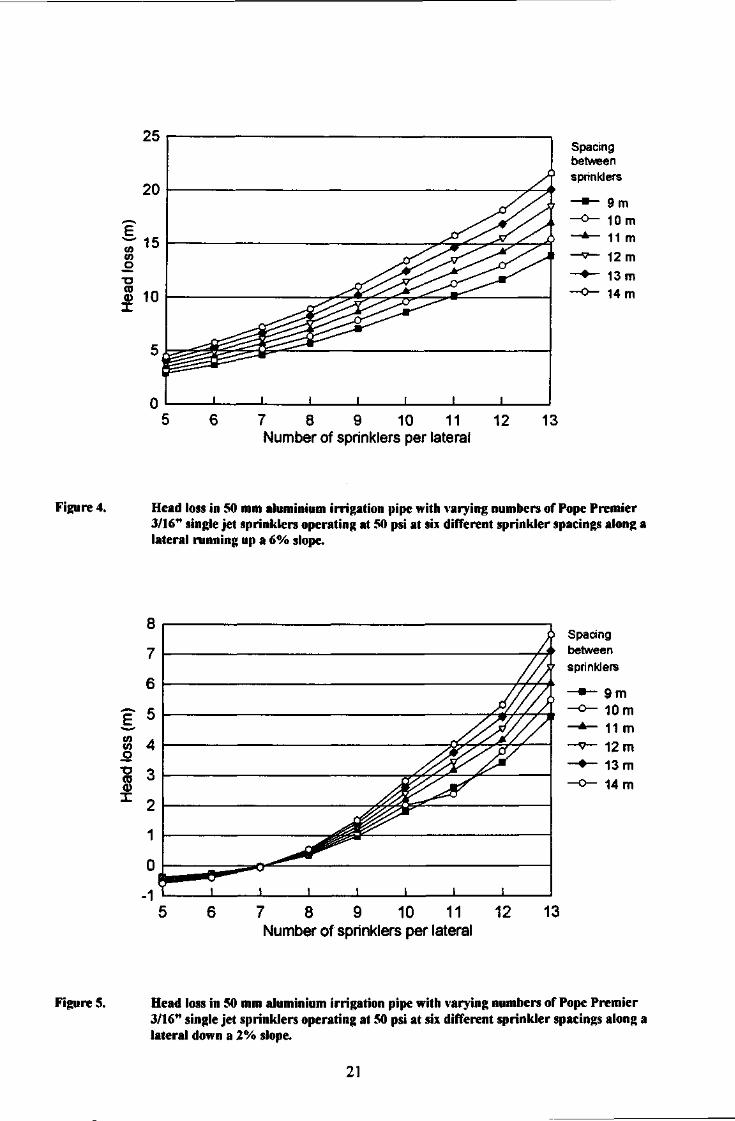
Pressure loss in lateral pipes must also be considered when designing irrigation systems. Factors such as slope of the ground and sprinkler spacing affect the number of sprinklers that can be operated efficiently along a lateral pipe. 10% variation in sprinkler operating pressure, above and below the average operating pressure, is considered satisfactory in an overhead sprinkler irrigation system (Luke, 1990). Therefore, if the average operating pressure should be 50 psi, the maximum recommended pressure loss along a lateral line in 5 psi (3.55 m of head). If Premier® sprinklers with 3/16'jets are spaced at 9 m intervals along 50 mm aluminium lateral pipe on flat ground, the maximum number of sprinklers per lateral is 10 (Figure 2). If the lateral pipe runs up a 2% slope, the optimum number of sprinklers is reduced to 8 (Figure 3). Slopes as high as 6% are common in the Manjimup/Pemberton area. Only 5 sprinklers per lateral should be used on lateral lines running up a 6% slope (Figure 4). When laterals run down a slope, the optimum number of sprinklers per lateral increases to 12 and >13 for 2% and 6% slopes, respectively (Figures 5 and 6). Similar calculations can, and should be performed for all sprinkler types and spacings prior to system installation.
The average cost per hectare of power or diesel for pumping estimated by 8 survey respondents ($708/ha) is similar to irrigation pumping costs listed in enterprise budgets for potatoes produced in the Manjimup-Pemberton area (Eckersley et al. 1991).
Acknowledgements Special thanks to Adrian Britza for his assistance with data collection in the field and to Tim Calder for his assistance with calculation of the head loss data presented in the figures.
References American Society of Agricultural Engineers (1979). Agricultural Engineers Yearbook.
St. Joseph, Michigan 49085, U.S.A. Christiansen, J.E. (1942). Irrigation by sprinkling. University of California Agricultural
Experiment Station Bulletin No. 670, pi24. Eckersley, P., Grieve, R., Phillips, D., Hegney, M. (1991). Vegetable Budgeting Handbook.
W.A. Department of Agriculture, Bulletin MA 1/92, Adgex No. 250/821. Jensen, M.E. (1981). Design and Operation of Farm Irrigation Systems. American Society of
Agricultural Engineers Monograph No. 3, Chapter 17.
19

(0
_o •a (0 <D X
Spacing between sprinklers
7 8 9 10 11
Number of sprinklers per lateral
12 13
9m
10m 11 m 12 m 13m 14 m
Figure 2. Head loss in 50 mm aluminium irrigation pipe with varying numbers of Pope Premier 3/16" single jet sprinklers operating at 50 psi at six different sprinkler spacings along a lateral on a 0% slope.
£ 1 w .o T3 TO
a> I
Spacing between sprinklers
9 m 10m 11 m 12 m 13m 14m
7 8 9 10 11 Number of sprinklers per lateral
13
Figure 3. Head loss in 50 mm aluminium irrigation pipe with varying numbers of Pope Premier 3/16" single jet sprinklers operating at 50 psi at six different sprinkler spacings along a lateral running up a 2% slope.
20
03 w jo
a> X
Spacing between sprinklers
• * - 9 m
- o - 10m - ^ - 11 m
• ^ - 12 m
- • - 13 m
• o - 14m
7 8 9 10 11 Number of sprinklers per lateral
12 13
Figure 4. Head loss in 50 mm aluminium irrigation pipe with varying numbers of Pope Premier 3/16" single jet sprinklers operating at 50 psi at six different sprinkler spacings along a lateral running up a 6% slope.
(0 05 j o •D «J 0)
X
Spacing between sprinklers
7 8 9 10 11 Number of sprinklers per lateral
9 m 1 0 m
11 m
12 m
13 m
14 m
13
Figure 5. Head loss in 50 mm aluminium irrigation pipe with varying numbers of Pope Premier 3/16" single jet sprinklers operating at 50 psi at six different sprinkler spacings along a lateral down a 2% slope.
21

CO CO
_o CO
a> X
Spacing between sprinklers
7 8 9 10 11 Number of sprinklers per lateral
9m 10m 11 m 12 m 13m 14 m
Figure 6. Head loss in SO mm aluminium irrigation pipe with varying numbers of Pope Premier 3/16" single jet sprinklers operating at 50 psi at six different sprinkler spacings along a lateral running down a 6% slope.
22

5.0 IRRIGATION MANAGEMENT OF DELAWARE, CADIMA AND KENNEBEC POTATOES
M.A. Hegney andHP. Hoffmann
Summary
Delaware is the most important fresh market potato variety in Western Australia, representing approximately 60% of total fresh potato production. Local experience has shown that, like many medium to long season potato varieties which produce oblong shaped tubers, Delaware is sensitive to is sensitive to water stress. Fresh potato consumers demand potatoes that have even shape and are without growth deformities, either external or internal. Therefore, to maximise returns, growers producing Delaware potatoes must manage all inputs to maximise both yield and tuber cosmetic quality. Irrigation management is critical in this regard.
Until 1992, Cadima potatoes were being used in Western Australia for both French fry and crisp manufacture out of storage. At present, only small quantities of this Western Australian bred variety are produced for crisp production. Local experience suggested that Cadima was less sensitive to water stress than Delaware and so may require a different irrigation regime.
Kennebec potatoes are commonly grown in Western Australia for use primarily in early season French fry production. Overseas experience suggests that the strong root system and relatively early maturity of this variety enable it to tolerate lower soil moisture levels compared with Delaware or Russet Burbank.
Experiments were conducted to define the soil moisture limits within which Delaware, Cadima and Kennebec potatoes should be irrigated to achieve maximum yield and tuber quality.
Major results
• When irrigation was applied in response to the same soil moisture deficit during all growth stages, total and marketable yield of Delaware was maximised by maintaining the available soil moisture level above -77%. On a sandy loam soil type, this available soil moisture level corresponded with a soil water potential (SWP), measured at 30 cm depth below the top of the ridge, of- -25 kPa.
• To maximise the proportion of Premium grade tubers (ie. tubers without malformations such as pointed stem ends), the available soil moisture level for Delaware potatoes should be maintained above 80% (SWP -20 to -25 kPa) during the period between emergence and early tuber growth. Subsequently, during the main tuber bulking period and crop senescence, the data presented here suggests that available soil moisture levels can be allowed to drop to as low as 65% (SWP -60 kPa) between irrigations without having a significant affect on yield or tuber quality. However, if the soil is permitted to dry to such levels, large amounts of water (50-55mm) need to be applied to return the soil profile to field capacity. Such large amounts of water applied in a single irrigation may lead to problems with soil erosion. Therefore, it is suggested that the available soil moisture levels should not be allowed to fall below 72 to 75% (SWP -40 to -35 kPa) when irrigating Delaware potatoes.
23

• Total and marketable yield of Cadima potatoes, together with tuber specific gravity, were significantly reduced when the available soil moisture level fell below 72% between all irrigation events during crop growth. On the soil types studied, this available soil moisture level corresponded with a soil water potential, measured at 30cm depth, of- -40kPa.
• No differences in the total and marketable yield were recorded when Kennebec potatoes were irrigated at soil water potentials, measured at 30 cm depth, ranging between -15 kPa and -40kPa. This suggests that there is no benefit in irrigating Kennebec crops at soil water potentials above -35 to -40 kPa.
Recommendations
(a) Extension/adoption by industry
The results from these field experiments were presented to Western Australian potato growers at seminars in September 1990, August 1991, June 1992 and September 1996. Several publications were also produced. These included two articles in the "Potato Grower" magazine, and a Farmnote (No. 107/91, Agdex 262/561) on the use of tensiometers for scheduling irrigation in potato crops
(b) Directions for future research
The results presented here provide a good foundation on which to base irrigation scheduling in Delaware potato crops grown on sandy loam soils in the Manjimup-Pemberton area of Western Australia. However, Delaware potatoes are grown on many other soil types (from deep sands to loams) in Western Australia and further work is required to develop irrigation scheduling guidelines for this variety on these other soil types and to examine the interaction between irrigation and nutrition management, particularly on sandy textured soils.
This work provides only a preliminary indication of the relative irrigation requirements of Cadima and Kennebec potatoes. More work is required for further refine a set of irrigation management guidelines for these varieties.
(c) Financial/commercial benefits
Improvement in yield and quality which can be made with the use of correct irrigation management practices contribute directly to industry efficiency and profitability. In the case of fresh market potatoes (eg. Delaware), increasing the proportion of Premium grade tubers significantly increases grower returns, while also having a positive impact on total potato sales. Similarly, the correct irrigation management is essential to the production of tubers free of internal quality problems and of the desired size.
24

5.1 EFFECT OF SOIL MOISTURE DEPLETION LEVELS ON YIELD AND QUALITY OF DELAWARE AND CADIMA POTATOES (Experiment 89MC18)
Introduction Delaware and Cadima are two important potatoes varieties for the Western Australian potato industry. In 1989/90, 85% of the fresh market potatoes grown in Western Australia were Delaware. In the same year, Cadima represented 35% of the processing potatoes produced in this State.
With the advent of quality marketing for fresh potatoes and the stringent quality requirements of potato processors, growers are now finding it more difficult to achieve consistently high returns for their potatoes. Tuber quality is now just as important as total yield. For this reason, growers have been forced to examine their production methods for areas where improvement can be made which will result in increased production of high quality potatoes. Irrigation is one area that has been identified as having considerable scope for improvement.
Potatoes are commonly accepted as being shallow rooted and more sensitive to moisture stress than many other crops (Singh, 1969; Epstein and Grant, 1973). Also, some potato cultivars are more sensitive to moisture stress than others (Miller and Martin, 1987). There is general agreement in the literature that for maximum yields of high quality tubers, available soil moisture levels in the crop root zone should never fall below 50%, and preferably should be kept above 50% (Wright and Stark, 1990). No studies have been published on the optimum soil moisture levels that should be maintained to ensure maximum yield and quality of Delaware and Cadima potatoes.
Aim The primary objective of this experiment was to determine the optimum allowable soil moisture depletion level to ensure maximum yield and quality of Delaware and Cadima potatoes grown in south Western Australia.
Materials and Methods Site details The experiment was located at the Manjimup Horticultural Research Centre (34° 18'S, 116° 7'E) on a loamy sand over mottled clay at 70-80cm (Dy5.31, Northcote, 1974) Some of the relevant soil physical characteristics are given in Table 1.
Experimental design and treatments The experiment consisted of a factorial complete block arrangement of 12 treatments - 2 varieties and 6 irrigation treatments. The irrigation treatments were six soil moisture depletion (SMD) levels - 15, 20, 25, 35, 45 and 55mm below field capacity. Given that the available soil moisture in the top 80cm of the profile is 89mm, these SMD levels corresponded with available soil moisture levels of 83, 77, 72, 61, 49 and 38%, respectively. SMD was measured daily in each plot using a neutron scattering probe (NP) calibrated on site. The SMD in the top 80cm of the profile was measured by integrating soil moisture measurements at depths of 20, 30, 45, 60 and 75cm. When the average SMD within a treatment reached the required level, that amount of water was applied to return the top 80cm of the profile to field capacity. Water was applied to
25

individual plots using plot irrigators, similar to those described by Riley and Wolfe (1958). Water quality was good (EC < lOOmS/m).
The treatments were arranged in four replications. Each plot consisted of 6 x 5.5m long rows, with a 1 Om buffer between plots. Row spacing was 0.8m.
Table 1. Soil characteristics of the experimental site. (Data are means of 10 samples at each depth).
Soil Field Wilting % % % % % PH Depth Capacity Point Gravel Coarse Fine Silt Clay (H20)
(cm) (%vol.) (% vol.) Sand Sand
0-30 20.4 7.2 9.6 40.5 44.3 6.5 9.5 5.5 30-75 16.2 6.6 10.6 39.6 47.6 4.0 9.3 6.0 75-120 25.2 12.4 29.2 29.1 39.8 7.8 24.0 6.0
(Note: Field Capacity was measured in the field by saturating a bare soil area and then measuring soil moisture content using a neutron probe. Wilting point is the measured soil moisture content at -15 bar suction. Gravel >2.0mm, coarse sand 2.0-0.2mm, fine sand 0.2-0.02mm, silt 0.02-0.002mm, clay <0.002mm.)
Site preparation A five year old grass-clover pasture was growing on the trial site prior to the experiment. This pasture was sprayed with glyphosate (3L/ha Roundup®) on 30 September, 1989. The area was cultivated using a mould board plough on 17 August, 1989. Fenamiphos (24L/ha Nemacur®) and chlorpyriphos (6L/ha Lorsban®), together with 265 kg/ha KC1, 50 kg/ha MgS04 and a trace element mix containing 15kg/ha CuS04, 7.5kg/ha ZnO, lOkg/ha MnS04 and I5kg/ha Borax were applied on 30 October and incorporated with a roto-tiller.
Crop management Two days before planting, Potato manure E (3.5% N, 7% P, 6.6% K) was banded at 3.0t/ha into ridges using a mechanical planter. Certified seed tubers which had been harvested the previous autumn and stored at 4°C were removed from storage 3 weeks before planting. The seed was cut to 45-55g setts and dusted with tolclophos-methyl (2kg/t Rizolex®) before being hand planted into preformed ridges on 3 November 1989. Delaware was planted at an in row spacing of 15cm (83333 plants/ha) and Cadima at 25cm (50000 plants/ha) in accordance with district recommendations. 100% emergence was recorded in both varieties on 29 November 1989 at which time final hilling occurred.
200kg/ha urea was applied on 13 December 1989 and again on 29 December 1989. Metribuzin (500g/ha Sencor 700®) was applied on 29 November 1989 for general weed control. Methamidophos (700mL/ha Nitofol®) and permethrin (150mL/ha Ambush®) were applied at regular intervals for the control of potato tuber moth and aphids. Chlorothalonil (2L/ha Rover®) was applied weekly for control of early blight {Alternaria solani).
26

Consumptive water use Total soil moisture (TSM) was measured immediately before and after the growing season in each plot to a depth of 120cm and consumptive water use (CWU) was estimated using the water balance method:
CWU = TSM at (11/12/89) - TSM at 90% plant senescence + applied irrigation + rainfall
Drainage below 120cm was considered negligible and was ignored.
Harvest and grading The trial was harvested on 1 March 1990 using a single row harvester. After the removal of rejects (greens, rots, knobs) which were counted and weighed, all remaining tubers were graded into different size categories according to variety:
Delaware- 30-80g Cadima- 0-1 OOg 80-150g 100-250g
150-350g 250-450g 350-450g >450g
>450g
In accordance with W.A. Potato Marketing Authority standards, Delaware tubers were also graded into Premium, Grade 1 and Grade 2 tubers based on their cosmetic quality after washing.
Specific gravity was determined on a 3.5kg sample of 150 - 350g tubers from each plot using the weight in air - weight in water method.
Data analysis
All data were analysed by analysis of variance using the MASS V3.5 statistical package.
Results
Growth periods Drier treatments generally remained green for longer than the wet treatments (Table 2).
Table 2. Average growth periods of the different soil moisture deficit (SMD) treatments for Delaware and Cadima.
SMD (mm)
Days from planting to 50% senescence SMD (mm) Delaware Cadima
15 111 111 20 HI 111 25 111 119 35 111 119 45 119 130 55 119 130
27

Water applied and irrigation frequency For both varieties, the total amount of water applied decreased as the SMD increased (Table 3). Irrigation frequency followed a similar trend.
Before irrigation scheduling commenced, both varieties received 96.3mm of irrigation and 20mm of rain. Due to the delay in harvest time and the need to maintain the surface soil moist when irrigation scheduling ceased, both varieties received a further 49mm of irrigation and 157.7mm of rain over a period of four weeks between crop senescence and harvest.
Table 3. Effect of soil moisture deficit (SMD) treatments on total irrigation water applied, irrigation frequency, consumptive water use (CWU) and water use efficiency (WUE = kg marketable yield/mm CWU) of Delaware and Cadima potatoes.
SMD Applied Irrigation No. of Irrigations CWU WUE (mm) (mm) (mm) (mm)
Del Cad Del Cad Del Cad Del Cad
15 402 355 23 22 478.4 447.9 110.5 104.0 20 356 337 16 15 433.6 432.1 120.7 106.7 25 384 356 14 14 472.4 453.1 96.1 99.5 35 313 301 10 9 399.0 404.7 116.2 103.5 45 230 228 6 6 336.7 336.7 136.9 110.0 55 166 224 4 5 281.0 335.5 125.2 99.0
l.S.d. (p<0.05) 14.1 15.5 20.7 ns
Consumptive water use The consumptive water use data shown in Table 3 do not include water used for establishment and maintenance after plant death which can vary with different growers according to their management practices. For both varieties, there was a clear trend of increasing CWU with decreasing SMD.
Water use efficiency (WlJE) Irrigation treatments had no significant effect on the WUE (kg marketable tubers/ha/mm of CWU) of Cadima with 99 to 110kg of marketable yield produced per mm of water consumed (Table 3). For Delaware, the 20, 35, 45 and 55mm SMD treatments had the highest WUE ranging from 116 to 137kg/mm.
Soil moisture extraction patterns Both varieties extracted most of their water requirements from the top 30cm of the profile. However, water extraction was observed down to 75cm, particularly in the drier treatments.
During the mid to late tuber bulking period for both varieties, field observations suggested that the surface soil in the more frequently irrigated treatments was becoming drier between each irrigation compared to the earlier crop growth periods. This trend was not supported by integrated measurement of the soil moisture content of the top 80cm of the profile. Examination of the soil moisture extraction data for each soil layer
28

showed that the average soil moisture level increased during the season at the 20cm depth, remained relatively constant at 30cm and declined at 45 and 60cm (data not shown). This suggests that the average soil moisture level in the upper profile layers increased, rather than decreased, during the growing season.
For both Cadima and Delaware, the average crop factor ranged from 0.8 in the early and late crop growth periods to 1.2 during the peak growing period in the highest yielding treatments (15, 20mm deficits for Delaware and the 15, 20 and 25mm deficits in Cadima)(data not shown).
Total and marketable yields The highest yield of both varieties was achieved with the most frequent irrigation (i.e. 15mm SMD's)(Table 4 & 5). For Delaware, both total and marketable yield was significantly (p<0.05) reduced when the SMD exceeded 20mm. The total yield of Cadima was significantly (p<0.05) reduced when SMD exceeded 35mm. However, marketable yield of Cadima was significantly reduced when the SMD between irrigations exceeded 25mm.
For Delaware, irrigation treatments had no significant effect on the number of tubers per plot. For Cadima, marketable tuber numbers were significantly (p<0.05) reduced when SMD exceeded 25mm (C25).
Table 4. Effect of soil moisture deficit (SMD) treatments on total and marketable yield, and total and marketable tuber numbers of Delaware potatoes.
SMD Total Yield Total No. Marketable Marketable (mm) (t/ha) tubers/plot Yield (t/ha) tubers/plot
15 59.1 555 52.9 471 20 59.8 584 52.4 485 25 52.2 539 45.3 449 35 51.2 526 46.3 453 45 51.1 506 46.0 431 55 40.4 490 35.2 406
l.S.d. (p<0.05) 5.3 60 6.7 57
29

Table 5. Effect of soil moisture deficit (SMD) treatments on total and marketable yield, and total and marketable tuber numbers of Cadima potatoes.
SMD Total Yield Total No. Marketable Marketable (mm) (t/ha) tubers/plot Yield (t/ha) tubers/plot
15 57.1 475 47.3 272 20 57.2 478 46.1 268 25 56.0 465 45.1 266 35 52.2 438 41.9 243 45 47.1 418 37.0 224 55 46.7 458 33.0 209
l.S.d. (p<0.05) 6.1 48 5.3 25
Tuber size grades and yield components For both varieties, reductions in tuber yield with increasing soil moisture deficit were the result of a combination of reduced tuber numbers and reduced average tuber weight. (Table 6).
Table 6. Effect of soil moisture deficit (SMD) treatments on the average weight of all tubers and the average marketable tuber weight of Delaware and Cadima potatoes.
SMD Average tuber weight Average marketable (mm) <P> tuberi weight (g) (mm)
Delaware Cadima Delaware Cadima
15 119.28 129.62 125.65 186.79 20 114.35 129.38 120.23 185.69 25 108.51 130.17 112.93 183.06 35 108.40 129.01 113.71 185.79 45 112.71 120.42 118.83 176.33 55 91.81 108.97 96.61 168.42
l.S.d. (p<0.05) N.S. 11.31 17.67 10.90
Increasing the SMD between irrigations above 20mm with Delaware significantly (p<0.05) reduced the yield of tubers in the 150-350g weight range (main marketable tuber weight range)(Table 7). For Cadima, a SMD of 55mm resulted in a significant increase in the yield of tubers in the 0-99g weight range and a decrease in the yield of tubers in the 100-450g weight range (Table 8). A SMD of 45mm decreased the yield of Cadima tubers in the 250-450g weight range.
30

Table 7. Effect of soil moisture deficit (SMD) treatments on the yield (t/ha) of various tuber size grades (No./plot & yield (t/ha)) of Delaware potatoes.
SMD 0-29g 30-79g 80-149g 150-349g 350-449g 450g+ (mm)
15 0.48 7.1 18.8 26.0 1.0 0.4 20 0.51 8.1 18.5 24.7 1.1 0.1 25 0.42 8.0 18.3 18.3 0.7 0.4 35 0.36 8.1 18.8 18.9 0.5 0.5 45 0.34 7.5 18.2 19.8 0.6 0.1 55 0.43 8.9 16.6 9.4 0.3 0.0
l.S.d. (p<0.05) ns ns ns 6.1 ns ns
Table 8. Effect of soil moisture deficit (SMD) treatments on the yield (t/ha) of various tuber size grades of Cadima potatoes.
SMD 0-99g 100-249g 250-449g 450g+ Rejects* (mm)
15 9.0 32.3 13.7 1.4 3.5 20 9.5 31.9 12.7 1.6 4.2 25 8.9 33.4 10.8 0.9 4.6 35 8.7 29.2 12.1 0.6 3.3 45 9.2 28.1 7.6 0.9 2.5 55 12.2 25.7 7.2 0.0 1.2
l.S.d. (p<0.05) 2.1 4.3 3.1 ns 1.3
* Rejects due to deformity, greening or insect damage.
Tuber quality Irrigating at a SMD greater than 15mm significantly (p<0.05) reduced the percentage of premium quality Delaware tubers (Table 9). The proportion of grade 1 tubers was reduced by the 55mm SMD treatment. The proportion of grade 2 and reject tubers was unaffected by irrigation treatments.
The specific gravity of both Delaware and Cadima potatoes increased as SMD decreased (Table 10). Significant decreases in specific gravity occurred when SMD increased above 45 and 35mm for Delaware and Cadima, respectively.
31

Table 9. Effect of soil moisture deficit (SMD) treatments on the percentage (on weight basis) of premium, grade 1, grade 2 and reject Delaware potatoes.
SMD % Premium
% Grade 1 % Grade 2 % 0-29g % Reject*
(mm)
15 7.2 31.9 36.5 0.8 23.7 20 3.6 28.8 35.7 0.9 31.0 25 4.4 28.9 35.3 0.8 30.7 35 2.1 25.4 44.8 0.7 27.0 45 2.3 26.3 40.3 0.7 30.4 55 1.7 19.9 39.3 1.1 38.1
I.s.d. 1.7 8.2 9.2 0.4 9.5 (p<0.05)
* Rejects due to deformity, insect damage, >450g.
Table 10. Effect of soil moisture deficit (SMD) treatments on the specific gravity of Delaware and Cadima potatoes.
SMD (mm) Delaware Cadima
15 1.0675 1.0785 20 1.0660 1.0793 25 1.0660 1.0770 35 1.0658 1.0725 45 1.0650 1.0743 55 1.0613 1.0710
l.S.d. (p<0.05) 0.00419 0.00361
Discussion Total yield of Cadima remained constant at soil moisture deficits (SMD) of 15 to 35mm. However, marketable yield and tuber specific gravity were reduced by soil moisture deficits higher than 25mm. Cadima is a variety used exclusively for the production of crisps and French fries, therefore specific gravity must be considered when defining optimum production practices. For the soil type on which this work was done, our results suggest that when growing Cadima, the soil moisture deficit should not exceed 25mm. 25mm represents 30% of the available soil moisture in the top 80cm of this soil. In a review of potato irrigation research, Singh (1969) concluded that high yields could be obtained by maintaining available soil moisture above 50%. However, most of the work reviewed considered only the available moisture in the upper 30cm of the profile. Other workers (e.g. Painter and Augustine, 1976; Larsen, 1984) have since found that when the entire root zone is considered, highest yields and tuber quality will be achieved when the available soil moisture does not fall below 65% (i.e. a maximum deficit of 35%). This agrees well with the results obtained for Cadima in our experiment.
32

The results show that Delaware is more sensitive to moisture stress than Cadima. The total and marketable yields of Delaware were significantly reduced when the SMD between irrigations increased above 20mm. Our field observations of Delaware suggest that it is less able to regulate its rate of water use, and so maintain turgor, than Cadima. Even when the soil was close to field capacity, a hot day (ie. high vapour pressure deficit) was sufficient to cause Delaware to obviously wilt. Such stress symptoms never appeared in Cadima until the SMD increased above 35mm. Levy (1983) found that varieties with a high capacity to lower leaf osmotic potential and so maintain turgor were less susceptible to drought stress than varieties with a lower capacity to regulate leaf osmotic potential. Delaware may fall into this later category.
In both varieties, reduced yields in response to increasing SMD were associated with a shift in the distribution of tubers in the various weight categories. Increased SMD resulted in an increased proportion of small tubers and a concomitant decrease in the proportion of large and marketable size tubers. As SMD increased, a smaller fraction of lower total yields reached the sizes desirable for ware or processing potatoes. Similar effects of imposed droughts have been reported elsewhere (Steckel and Gray, 1979; MacKerron and JefFeries, 1988). The distribution of tuber sizes is important because it impacts directly on crop profitability. For example, the size range for premium grade ware potatoes is 150 to 350g. While the determination of quality grade also depends on cosmetic quality, the probability of achieving a high proportion of premium grade potatoes will increase if the proportion of tubers in this weight range increases.
The proportion of premium grade Delaware potatoes was significantly higher when the SMD was kept below 15mm compared to a SMD of 20mm. The reason for this difference is unclear, particularly considering that these treatments produced a similar proportion of tubers in the 150-350g weight range. Within other treatments, the trend for a decreased proportion of premium tubers with increased SMD was primarily due to changes in the proportion of tubers in the 150-350g weight range. The importance of high levels of premium and grade 1 tubers in determining crop profitability is illustrated in Table 11. The pricing structure of ware potatoes in Western Australia provides considerable incentive to growers to achieve high levels of premium potatoes. Maintaining low soil moisture deficits, despite the higher pumping costs to apply more water and the higher labour costs to irrigate more frequently, leads to significant profit advantages. The data presented here suggest that, on the soil type on which this work was conducted, the SMD between irrigation should not exceed 15mm when irrigating Delaware potatoes. This is equivalent to maintaining the available soil moisture level above 80%.
The reason for the increase in average soil moisture content in the 0 to 20cm soil layer during the season is unclear. One possible explanation would be interference of the neutron probe readings at this depth by water in tubers. Potato tubers can contain between 72 and 85% water. There is some disagreement in the literature on the effect of tuber growth around access tubes on the estimates of soil moisture content made with a neutron probe. MacKerron and JefFeries (1987), in a laboratory study, found no effect
33

Table 13. Effect of soil moisture deficit (SMD) treatments on the crop gross margin for Delaware.
SMD Gross Margin* (mm) ($/ha)
15 4989 20 2996 25 2244 35 1887 45 1600 55 -1087
*Budget prices - Premium - $425/t Grade 1 - $265/t Grade 2 -$145/t
of tubers on neutron probe estimates of soil moisture content. Conversely, Foroud et al (1993), in a field study, demonstrated that tuber growth around access tubes resulted in an overestimation of soil moisture content using a neutron probe. If tubers do interfere with neutron probe estimates of soil moisture content then correction factors will need to be developed to adjust neutron probe readings when tubers are present.
References Epstein, E. and Grant, W.J. (1973). Water stress relations of the potato plant under field
conditions. Agron. J. 65:400-404. Foroud, N., Lynch, DR. and Entz, T. (1993). Potato water content impact on soil moisture
measurement by neutron meter. Plant and Soil. 148:315-321. Larsen, DC. (1984). Simplifying potato irrigation scheduling - the Idaho programme. Am.
Potato J. 61:215-227 Levy, D. (1983). Varietal differences in the response of potatoes to repeated short periods of
water stress in hot climates. 2. Tuber yield and dry matter accumulation and other tuber properties. Potato Res. 26:315-321.
MacKerron, D.K.L. and Jefferies, R.A. (1987). Access tube location within a simulated potato crop and the measurement of soil moisture with a neutron probe. Plant and Soil. 102:253-255.
MacKerron, D.K.L. and Jefferies, R.A. (1988). The distributions of tuber sizes in draughted and irrigated crops of potato. I. Observations on the effect of water stress on graded yields from differing cultivars. Potato Res. 31:269-278.
Miller, D.E. and Martin, M.W. (1987). Effect of declining or interrupted irrigation on yield and quality of three potato cultivars grown on sandy soil. Am. Potato J. 64:109-117.
Northcote, K.H. (1974). 'A Factual Key for the Recognition of Australian Soils.' 4th Edn. (Rellim Technical Publications:Glenside, S. Aust.).
Painter, C.G. and Augustin, J. (1976). The effect of soil moisture and nitrogen on yield and quality of the Russet Burbank potato. Am. Potato J. 53:275-284.
Riley, J.P. and Wolfe, J.W. (1958). A field plot sprinkler irrigator. Misc. Paper No. 57. Agric. Experiment Station, Oregon State College, Corvallis.
Singh, G. (1969). A review of the soil-moisture relationship in potatoes. Am. Potato J. 46:398-403.
Steckel, JR. A. and Gray, D. (1979). Drought tolerance in potatoes. J. Agric. Sci., Camb. 92:375-381*.
Wright. J.L.and Stark, J.C. (1990). 'Potato' In: Irrigation of Agricultural Crops. Eds. Stewart, B.A. and Nielsen, DR. Madison, Wise. USA. 859-888.
34

5.2 EFFECT OF VARYING SOIL MOISTURE DEFICITS DURING DIFFERENT GROWTH STAGES ON THE YIELD AND QUALITY OF DELAWARE POTATOES (Experiment 91MC21)
Introduction In a previous experiment (89MC18) it was found that the yield and quality of Delaware potatoes was reduced when the available soil moisture level was allowed to fall below 75% between each irrigation throughout all crop growth stages. However, no attempt was made to examine the possibility that the optimal soil moisture level may vary from one growth stage to another. Wright and Stark (1990) presented data which suggested that the available soil moisture level could be decreased as rooting depth increased during potato crop growth. Such a moisture regime would reduce the total number of irrigation events required and may reduce the total water requirement.
Before making changes to the available soil moisture level during the various potato crop growth stages, it is important to appreciate the effects of moisture stress at each growth stage on tuber yield and quality. Wright and Stark (1990) stated that moisture stress during early vegetative development generally had little if any effect on tuber yield or quality. In contrast, moisture stress during the relatively short (10-14 days) tuber formation period can reduce tuber numbers and yield (Slater and Goode, 1967; Jana et ai, 1989), increase the incidence of malformed tubers (Nichols and Ruf, 1967; van Loon, 1981) and reduce tuber cooking quality (Stark and McCann, 1992). Moisture stress during the main tuber bulking period has a greater effect of tuber yield than quality (Millar and Martin, 1987; Martin el ai, 1992). Therefore, if the available soil moisture level at which irrigation events are triggered is to be reduced as crop rooting depth increases, the timing and magnitude of the reductions will need to be managed to avoid the above mentioned stress related problems.
Aim The aim of the experiment reported here was to measure the effect of changing the available soil moisture level at which irrigation is triggered during 2 growth stages -emergence to early tuber bulking, and the main tuber bulking period - on the yield and quality of Delaware potatoes.
Materials and Methods Site details The experiment was located at the Manjimup Horticultural Research Centre (34° 18'S, 116° 7'E) on a loamy sand over mottled clay at 70-80 cm (Dy5.31, Northcote, 1979). Some of the relevant soil physical characteristics are shown in Experiment 89MC18 -Table 1.
Experimental design and treatments The experiment consisted of a randomised block arrangement of 8 soil moisture deficit treatments replicated 4 times. The treatments were based on soil water potential (SWP) measured at a depth of 30 cm below the top of the potato ridge using Irrometer® tensiometers. Sufficient water was applied at each irrigation to return the soil to field capacity when the SWP reached -20, -30, -40 or -60 kPa. These SWPs corresponded with available soil moisture levels of 85, 78, 71 and 65%, respectively, based on the top 80 cm of the profile. The SWP at which irrigation events were triggered varied across 3
35

growth stages - emergence to tuber initiation (ie. length of largest tuber = 10 mm), tuber initiation to 50 days after tuber initiation, 50 days after tuber initiation until crop maturity (ie. 50% senescence). Hereafter, these growth stages will be referred to as 1, 2 and 3, respectively. Details of the changes in SWP between the growth stages within each treatment are given in the tables of results.
Plots of the changes in SWP during growth in each treatment are shown in Appendix 1. Because readings were taken from the tensiometers only once per day, the target SWPs for each treatments were frequently exceeded. This was particularly the case in the higher SWP treatments and resulted from a policy of not irrigating until the target SWP was reached.
Trial establishment Prior to the experiment the site had been planted to lupins and oats. Site preparation began 10 weeks before planting when the site was cultivated using a mould-board plough. Metham sodium (500 L/ha Vapam®) was applied 8 weeks before planting and incorporated with a rotary hoe. A pre-planting fertiliser mix containing 95 kg nitrogen/ha (NH4NO3), 150 kg potassium/ha (KG) and 20 kg magnesium/ha (MgS04.7H20) was broadcast and incorporated with tyned harrows 4 weeks before planting.
Individual plots were 5.5 m long by 6 rows wide. Row spacing was 0.8 m. Plots within each replication were separated by a 0.5 m buffer which was planted with 2 plants of the red tuber potato variety Desiree. Each replication was separated by a 2 m wide access path.
One day before planting, Potato Manure E (3.5% N, 7% P, 6.6% K) was banded at 3.5 t/ha into ridges using a mechanical planter. The experiment was planted on 5 December 1991. 50 g hand-cut seed pieces, which were dusted with tolclofos-methyl (2 kg/t Rizolex®), were planted by hand into the preformed ridges at an in-row spacing of 0.15 m (88,333 plants/ha).
Irrigation Water was applied to individual plots using plot irrigators, similar to those described by Riley and Wolfe (1958). All plots were watered to field capacity at the first sign of emergence on 17 December 1991 and thereafter according to treatments. Water quality was good (EC <100 mS/m).
Soil moisture monitoring In addition to the tensiometer at a depth of 30 cm, a second tensiometer was installed in each plot at 60 cm. This tensiometer provided a check on the adequacy of water applications. All tensiometer readings were taken daily between 8.00 and 10.00 am. The soil moisture profile was measured periodically throughout the experiment in one replication only using a neutron probe which had been calibrated on site. Total volumetric soil moisture (VSM) was calculated by integrating readings at depths of 20, 30, 40, 50, 60, 80, 100 and 120 cm. This data provided a second check on the adequacy of water applications. Also, total consumptive water use (CWU) was estimated for each treatment from the water balance:
36

CWU = VSM on 18 December 1991 - VSM at 90% plant
senescence (14 April 1992) + applied irrigation + rainfall.
Drainage below 120 cm was assumed to be negligible.
Agronomic management
A total of 269 kg nitrogen/ha (Urea) was applied post-emergence as follows: 49 kg/ha on 10 January 1992, 98 kg/ha on 22 January 1992 and 3 February 1992, and 24 kg/ha on 4 March 1992. Also, 90 kg potassium/ha (K2S04) was applied on 7 February 1992. Paraquat + diquat (3 L/ha Sprayseed®) was applied at 5% emergence (19 December 1991) to control newly emerged weeds. Metribuzin (0.5 L/ha Sencor 700®) was applied when plants were approximately 15 cm high (14 January 1992) for annual weed control. Preventative control of fungal leaf diseases was achieved with weekly applications of either chlorothalonil (2 L/ha Bravo®) or iprodione (2 L/ha Rovral®) which began 2 weeks after emergence. Permethrin (150 mL/ha Ambush®) was used to control green looper and potato tuber moth and methamidophos (700 mL/ha Nitofol®) was used to control potato tuber moth and aphids when necessary. A minor infestation of wingless grasshoppers shortly after emergence was controlled with an application of maldison (500 mL/ha Malathion 500®).
Harvest and grading All plots were allowed to naturally senescence before harvest. Three inside, undisturbed rows from each plot were harvested using a single row harvester on 28 April 1992. After washing, all tubers were counted and weighed. Any tubers with greening or rots were counted and weighed separately. The remaining tubers were graded into the following size categories - 0-50g, 50-450g, >450g. Marketable tubers were >50g and free of any defects. Marketable tubers were also graded according to whether they had growth constrictions at the basal (pointed stem-ends), centre (dumb-bells) or apical (bottlenecks) region of the tuber. The proportion (wt./wt.) of marketable tubers falling into these shape categories was recorded.
Thirty tubers (>150g) from each plot were sliced in half longitudinally and inspected for hollow heart and other internal disorders.
Statistical analyses Data were analysed by analysis of variance using GENSTAT (GENSTAT 5 Committee 1987) and l.s.d.s (PO.05) calculated for comparison of treatment means.
Results Crop growth There were no significant treatment effects on the period between planting and 50% senescence. This period ranged between 123 days (treatment 1) and 127 days (treatment 8). Allowing the SWP to decrease to -60 kPa between emergence and tuber initiation (treatments 4 and 8) resulted in plants showing signs of severe water stress (darkened leaves, wilted, limp plants). In contrast, when the SWP was allowed to decrease to -60 kPa between irrigations during a 50 day period after the start of tuber initiation (treatment 6), no obvious signs of plant water stress were observed.
37

Water applied and number of irrigation events For treatments in which the SWP at which irrigation was triggered remained constant during all growth stages (treatments 1 to 4), the number of irrigation events and the total amount of irrigation water applied decreased as SWP decreased (Table 1). A similar trend was observed with the quantities of irrigation water applied, although in treatment 3, the quantity of water applied was similar to treatment 1. However, irrigation was applied to treatment 3 only 14 times, compared with 23 times in treatment 1.
Table 1 Irrigation water applied, number of irrigation events and consumptive water use (CWU) for each irrigation treatment.
Treat. SWP regime" Applied Irrigation3 Number of CWU No. (mm) Irrigations (mm)
1 20/20/20 627 23 688 2 30/30/30 602 17 665 3 40/40/40 610 14 684 4 60/60/60 530 10 618 5 20/30/20 667 21 730 6 20/60/20 680 18 729 7 30/20/20 641 24 696 8 60/20/20 576 19 640
a. 60.8 mm of rainfall was received during the irrigation treatment period. b. Example: 20/20/20 = irrigation applied at a SWP of -20 kPa during growth stage 1/
-20 kPa during growth stage 2/ -20 kPa during growth stage 3.
Compared with irrigating constantly at -20 kPa (treatment 1), decreasing the SWP to -30 or -60 kPa during growth stage 2 (treatments 5 and 6), resulted in a small reduction in the number of irrigation events, but an increase in the amount of irrigation water applied. In contrast, allowing the SWP to decrease to -60 kPa during growth stage 1 (treatment 8) resulted in a decreased amount of irrigation water being applied.
Consumptive water use Treatment effects on consumptive water use were similar to those on the amount of irrigation water applied. Consumptive water use was highest in treatments 5 and 6, in which the SWP was reduced to -30 and -60 kPa, respectively, during growth stage 2. Consumptive water use was lowest in treatments 4 and 8 in which obvious visual signs of water stress were observed.
Yield For treatments irrigated at the same SWP during all growth stages, irrigating at -20 kPa (treatment 1) produced the highest total and marketable yields (Table 2). Irrigating at -60 kPa during all growth stages (treatment 4) resulted in a significant (p<0.05) reduction in total yield. Marketable yield was also reduced in this treatment, but not significantly.
Allowing the SWP to decrease to -30 or -60 kPa during growth stage 2 (treatments 5 and 6, respectively) had no effect on total or marketable yields (Table 2). In fact, treatment 6 produced the highest yields of all treatments. Irrigating at -30 or -60 kPa
38

during growth stage 1, and at -20 kPa thereafter, resulted in a reduction in both total and marketable yields, though the reductions were not significant.
Table 2 Total tuber yield, marketable tuber yield, mean tuber weight for total tuber yield and marketable tuber yield and total number of tubers per plant Soil water potential (SWP) treatments are as described in Table 1.
Treat. No. SWP regime
Yield (t/ha) Mean tuber wt. (g) Total Marketable
Tuber no./ plant
Treat. No. SWP regime Total Marketable
Mean tuber wt. (g) Total Marketable
Tuber no./ plant
1 20/20/20 72.0 57.2 186 226 4.7 2 30/30/30 68.8 57.1 195 229 4.2 3 40/40/40 65.7 55.9 192 227 4.3 4 60/60/60 58.9 49.7 165 200 4.4 5 20/30/20 69.3 58.0 180 223 4.7 6 20/60/20 76.4 65.2 199 239 4.7 7 30/20/20 63.5 50.1 165 203 4.9 8 60/20/20 66.1 52.2 187 234 4.4
l.s.d. (p<0.05) 9.6 9.5 19 19 ns
Across all treatments, where yield reductions did occur, they were due to reductions in both the average tuber weight and the number of tubers per plant, although treatment effects on tuber number per plant were not significant (Table 2). Treatments effects on tuber size are also illustrated in Table 3, where it is shown that the highest yielding treatments produced the highest yields of tubers weighing more than 150 g.
The yield of tubers rejected due to greening or rots tended to decline as irrigation frequency declined (Table 3). Despite receiving higher total amounts of irrigation water, the yield of reject tubers in treatments 5 and 6 was significantly (p<0.05) lower than in treatment 1.
Table 3 Yield of tubers within tuber weight ranges and the yield of tuber rejected due to greening or rots. Soil water potential (SWP) treatments are as described in Table 1.
Treat. No.
SWP regime
Yield (t/ha) within tuber wei ght ranges Reject yield (t/ha)
Treat. No.
SWP regime 0-50 g 50-80 g 80-150 g 150-350 g 350-450 g >450g
Reject yield (t/ha)
1 20/20/20 1.8 2.2 6.8 28.4 10.3 9.5 13.1 2 30/30/30 1.5 2.1 7.5 29.2 10.9 7.3 10.4 3 40/40/40 1.5 2.0 6.2 31.1 10.2 6.4 8.4 4 60/60/60 1.8 2.1 8.4 28.0 6.8 4.4 7.5 5 20/30/20 1.9 2.3 6.9 30.6 10.0 8.3 9.4 6 20/60/20 1.6 1.8 6.5 33.2 10.7 12.9 9.5 7 30/20/20 1.8 2.3 8.6 26.6 7.9 4.7 11.6 8 60/20/20 2.1 1.6 6.7 26.7 8.5 8.6 11.8
l.s.d. ns ns 1.4 4.1 ns 4.1 2.8 (p<0.05)
39

Tuber quality No tubers were found with hollow heart. Internal brown fleck was observed in a small proportion of tubers (<5%) in all treatments, however, there were no significant treatment effects (data not shown).
The proportion of marketable tubers with pointed stem-ends increased significantly (p<0.05) as the SWP during growth stage 1 decreased (Table 4). Compared with irrigating constantly at -20 kPa, decreasing the SWP to -30 or -60 kPa during growth stage 2 had no effect on the proportion of tubers with pointed stem-ends. There were no significant treatment effects on the proportion of tubers with dumb-bell or bottleneck shape.
Table 4 Percentage (wt./wt MOO) of marketable tubers with pointed stem-end, dumb-bell or bottleneck shape. Soil water potential (SWP) treatments are as described in Table 1.
Treat. No. SWP Pointed regime stem-ends Dumb-bells Bottlenecks
1 20/20/20 15.8 4.1 0.5 2 30/30/30 22.3 8.6 0.3 3 . 40/40/40 27.1 8.0 0.2 4 60/60/60 29.0 6.0 0.1 5 20/30/20 16.0 7.0 1.2 6 20/60/20 15.1 6.2 0.5 7 30/20/20 25.3 6.7 0.1 8 60/20/20 33.9 5.6 0.0
l.s.d. (p<0.05) 7.0 ns ns
Discussion In this experiment, when irrigations were triggered at the same SWP during all growth stages, total and marketable yield tended to decrease as SWP decreased. However, a significant (p<0.05) reduction in yield was not recorded until the SWP decreased to -60 kPa. Given that a SWP of-60 kPa was equivalent to an available soil moisture (ASM) level of 65%, this result agrees with that obtained in experiment 89MC18 where irrigating at an ASM level of 61% resulted in a significant yield reduction.
In contrast to experiment 89MC18, where the yield of Delaware potatoes was significantly reduced when irrigation occurred at an ASM level of 72%, in the experiment reported here yields were not significantly reduced when the ASM level was allowed to fall to 71% (i.e. SWP -40 kPa) between irrigations. In experiment 89MC18, Delaware yields were not reduced when the ASM was maintained above 77%. Taking account of all of the above, it would be reasonable to suggest that, when applied across all crop growth stages, maximum yield of Delaware potatoes will be achieved by ensuring that the ASM level is maintained above 75% (SWP ~ -35 kPa).
Irrigating at a constant SWP (or ASM level) during all growth stages is not necessarily the optimum regime. Wright and Stark (1990) presented data which suggested that the
40

total ASM within a 50 cm profile could be decreased as rooting depth increased during crop growth and treatments 5 and 6 in our experiment confirm this result. For instance, in treatment 6, after irrigating at a SWP of-20 kPa (85% ASM) between emergence and tuber initiation, allowing the SWP to fall to -60 kPa (65% ASM) between irrigations during the tuber bulking period had no effect on tuber yield. This irrigation regime did not result in a reduction in the amount of water required by the crop, in fact CWU was higher in treatments 5 and 6 than in treatment 1. However, the total number of irrigation events was reduced thus making irrigation management less labour intensive. A similar result was recorded in experiment 92MC22 for Russet Burbank potatoes.
Adopting an irrigation regime in which the SWP was allowed to decrease to -60 kPa during one or more crop growth stages may not be wise in commercial crops. When the SWP decreased to -60 kPa, between 50 and 55 mm of water was required to return the soil profile to field capacity (see SWP plots in Appendix 1). Under the conditions in which this experiment was conducted (flat site with low impact, low application rate sprinklers), it was possible to apply such large amounts of water in a single application without any water run-off. Paddocks on which potatoes are grown in the Manjimup/Pemberton region of Western Australia frequently have slopes greater than 6% and the most commonly used irrigation systems apply between 8 and 12 mm/hr. Under these conditions, applying 50-55 mm of water in a single application may result in water run-off and soil erosion problems.
Contrasting the results obtained in treatments 4 and 6 suggests that, to achieve maximum yield of Delaware potatoes, if irrigation is to be triggered at -60 kPa during the main tuber growth and crop maturation period, the SWP must be maintained above -30 kPa during the period between emergence and early tuber growth. The results obtained in treatment 8 suggest that, in terms of yield alone, irrigating at -60 kPa between emergence and early tuber growth can be tolerated, provided higher soil moisture levels are then maintained during later growth stages. Given that yields were not significantly reduced in treatment 8, compared to treatment 1, despite the plants being obviously stressed during early vegetative growth, perhaps suggests that some compensatory growth occurred in this treatment when the SWP was maintained above -20 kPa during later growth stages.
While the effect of irrigating at high SWPs in the period leading up and including early tuber growth on tuber yield may be dependent upon the SWP at which irrigations are triggered at later growth stages, the effects of high SWPs during the early growth stage on tuber shape is more consistent. Maintaining high SWP in the period before and during tuber formation is important to avoid problems with poor tuber shape, no matter at what SWP irrigation is applied during later growth stages. The percentage of tubers with pointed stem-ends increased significantly in treatments irrigated at SWPs below -30 kPa during the period between emergence and early tuber growth (treatments 3,4, 7 & 8). This same effect was observed with Russet Burbank potatoes (92MC22). Given that Delaware is sold predominantly for use as a fresh potato in Western Australia, tuber shape is an important quality criteria. Tubers with pointed stem-ends do not meet the quality specifications for premium grade potatoes according to the standards set by the WA Potato Marketing Authority. These potatoes would be down graded to class 1 or 2 potatoes, depending on the severity of the deformation. We did not rate the severity of the stem-end pointing in this experiment (only whether it was present or absent) so an accurate economic analysis is not possible. However, suffice to say that the high level
41

of tubers with pointed stem-ends in treatments 3, 4, 7 & 8) would have resulted in reductions in the dollar return per tonne for these potatoes.
References Jana, P. K.; Das, S.; Mandal, B. B.; Bandyopadhyay, P. (1989). Effect of soil moisture
tension at different physiological stages of growth on yield and consumptive use of water by potato. Environ. Ecol. 7, 809-812.
Martin, R. J.; Jamieson, P. D.; Wilson, D. R.; Francis, G. S. (1992). Effects of soil moisture deficits on yield and quality of'Russett Burbank' potatoes. N.Z. J. Crop Hon. Set. 20, 1-9.
Miller, D. E.; Martin, M. W. (1987). Effect of declining or interrupted irrigation on yield and quality of three potato cultivars in sandy soil. Am. Potato J. 64, 109-117.
Nichols, D. F.; Ruf, R. H. Jnr. (1967). Relation between moisture stress and potato tuber development. Proc. of the Am. Soc. qfHort. Sci. 91, 443-447.
Northcote, K.H. (1974). 'A Factual Key for the Recognition of Australian Soils.' 4th Edn. (Rellim Technical Publications:Glenside, S. Aust).
Stark, J. C; McCann, I. R. (1992). Optimal allocation of limited water supplies for Russet Burbank potatoes. Am. Potato J.. 69, 413-421.
Wright, J.L.and Stark, J.C. (1990). Totato' In: Irrigation of Agricultural Crops. Eds. Stewart, B.A. and Nielsen, D.R. Madison, Wise. USA. 859-888.
Van Loon, C. D. (1981). The effect of water stress on potato growth, development and yield. Am. Potato J. 58, 51-69.
42

APPENDIX 1 Changes in soil moisture tension with time in each irrigation treatment. Note: upper line in each plot at 30 cm depth, and the lower line shows readings from the tensiometer installed at 60 cm.
Treatment 1
D
O
C o
*w c <D
•+->
(D
CO
o E *o
60
50
40
Irrigation HB 17 2013 23 3 20 99 29 47 3 0 2 0 2 3 48 20 23 3340 24 2 2 2 2
30 -
20
10
0
Treatment 2 0 / 2 0 / 2 0 cbars
13 •v
1 1 V V
2 V
1 V
v vv y v v w v w v v v v v v w w v
Dec Jan Feb
43

APPENDIX 1 conf Changes in soil moisture tension with time in each irrigation treatment. Note: upper line in each plot at 30 cm depth, and the lower line shows readings from the tensiometer installed at 60 cm.
Treatment 2
CO
D _Q O
C o
'co c
CD
CD
CO
'o E
o in
70
60
50 Irrigation 39 38 38 30 so 33 48
Treatment 3 0 / 3 0 / 3 0 cbars
13 v
1 1 V V
2 V
4 2 1 V V V
Dec Jan Feb
44

APPENDIX 1 conf Changes in soil moisture tension with time in each irrigation treatment. Note: upper line in each plot at 30 cm depth, and the lower line shows readings from the tensiometer installed at 60 cm.
Treatment 3
CO 90 L_ D
_Q 80 O
C 70 o CO 60 c (1)
- 4 - * bO CD i _ 1 3
• • * 40
CO
o 30 E
— 20 o
U) 10
• Treatment 4 0 / 4 0 / 4 0 cbars
Irrigation 47 3 so 40 40 40 DO
0
13 V
1 1 V V
2 V
so
4 2 1
V V V
SO 40 40 40 2 32
V V V V VV
Dec Jan Feb
45

APPENDIX 1 conf Changes in soil moisture tension with time in each irrigation treatment. Note: upper line in each plot at 30 cm depth, and the lower line shows readings from the tensiometer installed at 60 cm.
Treatment 4
CO i_ D
_Q O
C
o c CD
CD L_ 13
- M CO
*o E
• — o in
90
80
70
60
Treatment 60/60/60 cbars
46

APPENDIX lcont' Changes in soil moisture tension with time in each irrigation treatment. Note: upper line in each plot at 30 cm depth, and the lower line shows readings from the tensiometer installed at 60 cm.
Treatment 5
CO v_ D
_ Q O
C
o *co c CD
-4-»
CD
ZJ
CO
o E 'o CO
80
60
40
20
0
Treatment 20 /30/20 cbars
13 ¥
1 1 7 V V V*¥
4 v
Irrigation 2020 IS 40 2 20 20 40 20 3040 49 4S
V V » VV VV V VV V V V V V
30 34
V V
33
v
2 1 V V
42 32 2 3S
v v v v
Dec Jan Feb
47

APPENDIX lcont' Changes in soil moisture tension with time in each irrigation treatment. Note: upper line in each plot s at 30 cm depth, and the lower line shows readings from the tensiometer installed at 60 cm.
Treatment 6
CO i_ D
_Q O
C o
'co c
CD
CD L_
•+-> CO
'o E
o
100
80
60
40
Irrigation 18 20 2010 403 40 38 30 SO SO 50
v V V WV W V V V V V
^ 20
0
Treatment 20/60/20 cbars 13 ¥
1 1 V V
2 V
4 2 1 V V V
88 88 SB 2 88 V V V V V
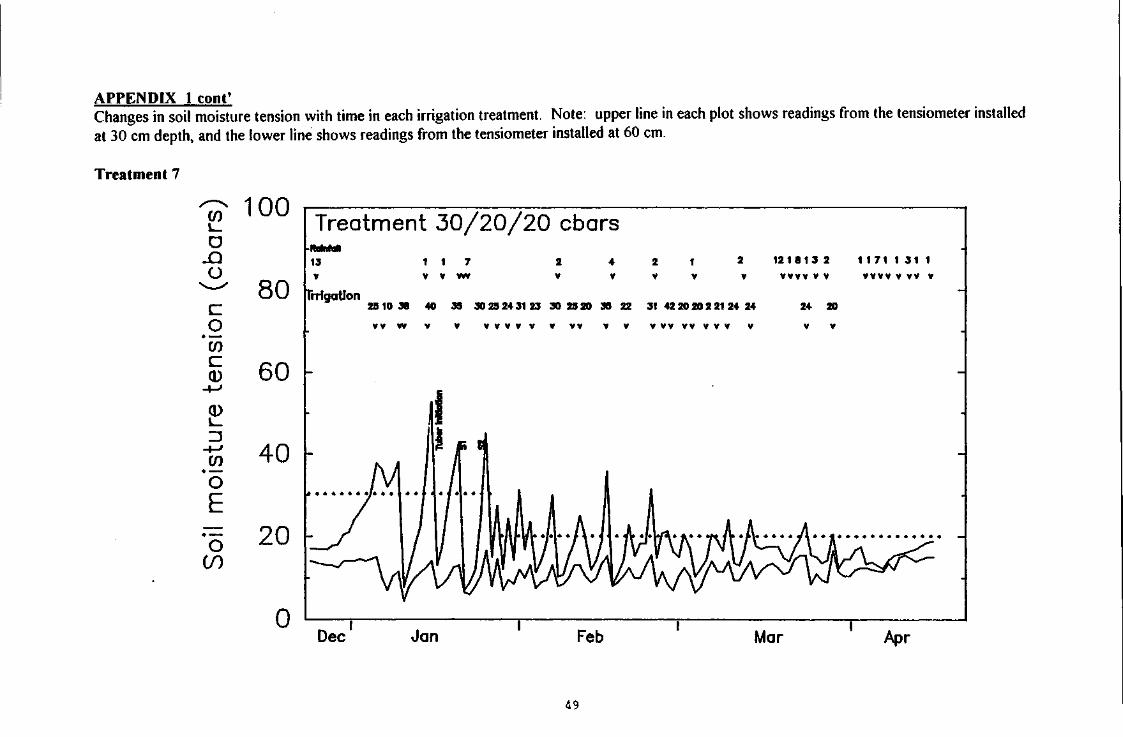
APPENDIX 1 conf Changes in soil moisture tension with time in each irrigation treatment. Note: upper line in each plot at 30 cm depth, and the lower line shows readings from the tensiometer installed at 60 cm.
Treatment 7
CO
D JO O
C O
*CO c CD
-4-»
CD L _ 13
•+ - '
*o E
*o GO
100
80 Irrigation
60 -
40
20
0
Treatment 30/20/20 cbars
13 ¥
1 1 V V
29 10 38 40
W W V
2 V
4 v
1 V
39 3029243123 30 2920 39 22 31 42 20 20 2 2124
V V V W V V V V V V V V W V V V V V V
Dec Jan Feb
49

APPENDIX 1 cont* Changes in soil moisture tension with time in each irrigation treatment. Note: upper line in each plot s at 30 cm depth, and the lower line shows readings from the tensiometer installed at 60 cm.
Treatment 8
CO
D
O
C
o co c CD
+-> CD L _ 13
•+-» CO
o
o CO
100
80
Treatment 60/20/20
60 *
40
20 -
0
1 1 7 V V W V
2 V
4 2 1 2 V V V
60 99 20 24 22 22 2124 322729 2122330 V W W W W W W W W W W W W W W
Dec Jan Feb
50

5.3 EFFECT OF IRRIGATION AT DIFFERENT SOIL WATER POTENTIALS ON THE YIELD AND QUALITY OF CADIMA AND KENNEBEC POTATOES (Experiment 90MC33)
Aim The aim of this experiment was to test the tuber yield and quality response of Kennebec and Cadima potatoes to irrigation applied at different soil water potentials (SWP) and thus to set an initial SWP limit below which the soil should not be allowed to dry out when irrigating these varieties.
Materials and Methods Site details The experiment was conducted at the Manjimup Horticultural Research Centre (34° 18' S, 116°7' E) during the 1990/91 season. The soil was a loamy sand over mottled clay at 70-80 cm (Dy 5.31, Northcote, 1974). Some of the relevant soil physical characteristics were presented previously (89MC18).
Experimental design and treatments The experiment consisted of a randomised complete block arrangement of two varieties (Kennebec and Cadima) x four irrigation treatments. The irrigation treatments were based on soil water potential (SWP) measured at a depth of 30 cm below the top of the potato ridge. Sufficient water was applied at each irrigation to return the soil to field capacity when the SWP reached 15, 22, 30 or 40 centibars (cb). The treatments were arranged in four replications. Each plot consisted of 6 x 5.5m long rows, with a 0.5m buffer between plots. Row spacing was 0.8m. Soil water potential was measured in each plot using 'Irrometer' type tensiometers (Irrometer Company, Riverside, California, USA) placed between two average plants in the second row in from the northern edge of the plot. Readings were taken daily between 8.00 and 10.00am and the readings from the four replicates were averaged.
Water was applied to individual plots using plot irrigators, similar to those described by Riley and Wolfe (1958). Water quality was good (EC < lOOmS/m).
Trial establishment Prior to the experiment the site used had been in a pasture/lupins rotation for five years. Site preparation began six weeks before planting when the site was sprayed with glyphosate (3 IVha Roundup®). The site was cultivated four weeks before planting using a mould-board plough. Fenamiphos (24L/ha Nemacur®) and chlorpyriphos (6L/ha Lorsban®), together with 200 kg/ha KC1, 100 kg/ha MgS04 and a trace element mix containing 15kg/ha Cu S04, 7.5kg/ha ZnO, lOkg/ha MnS04 and 15kg/ha Borax were applied four days before planting and incorporated with a roto-tiller. On 30 October, 1990, 3000 kg/ha of Potato E® fertiliser (3.5% N, 7% P, 6.6% K) was banded into ridges ready for planting. The experiment was planted on 1 November, 1990. 50g hand-cut seed pieces, which were dusted with tolclofos-methyl (2 kg/t Rizolex®), were planted by hand into the pre-formed hills at an in-row spacing of 0.2m (40,000 plants/ha) and 0.25m (50,000 plants/ha) for
51

Kennebec and Cadima, respectively. All plots were machine moulded three weeks after planting.
Soil moisture monitoring In addition to the tensiometer at a depth of 30 cm, a second tensiometer was installed in each plot at 50 - 60 cm. This tensiometer provided a check on the adequacy of water applications. The soil moisture profile was measured periodically throughout the experiment using a neutron probe which had been calibrated on site. Total volumetric soil moisture (VSM) contents were calculated by integrating readings at depths of 20, 30, 40, 50, 60, 80 and 100 cm. This data provided a second check on the adequacy of water applications. Also, total consumptive water use (CWU) was estimated for each treatment from the water balance:
CWU = VSM at emergence - VSM at harvest + applied irrigation + rainfall
Drainage below 100 cm was assumed to be negligible.
Agronomic management
Additional nitrogen was applied post-emergence in two applications - 297 kg NlfyNC^/ha on 28 November 1990 and 220 kg NlfyNC^/ha on 19 December 1990. Metribuzin (750 mL/ha Sencor 480 SC®) was applied one weeks after emergence for annual weed control. Preventative control of fungal leaf diseases was achieved with weekly applications of either chlorothalonil (2 L/ha Bravo®) or iprodione (2 L/ha Rovral®) which began six weeks after emergence. Permethrin (150 mL/ha Ambush®) was used to control green looper and potato tuber moth and methamidophos (700 mL/ha Nitofol®) was used for control of aphids and potato tuber moth when necessary.
Plant sampling Whole plant samples, consisting of 2 whole plants, were taken from an inside sampling row in each plot on 5 occasions during the crop growth period - 48, 63, 76, 90 and 103 days after planting. The samples were washed and separated into tubers, stems and leaves. The fresh weight of tubers was recorded. Tubers were then diced and all samples were dried at 70°C in a forced drought oven for 48 hours. Sample dry weights were recorded.
Harvest and grading All plots were allowed to naturally senescence before harvest. 5 m lengths from two inside rows in each plot were harvested using a single row harvester on 25 March 1991. Within each plot all tubers with any greening or rots were counted and weighed separately. The remaining tubers were counted and weighed into the following size categories: <100g, 100-250g, 250-450g and >450g. Processing grade tubers were >100g and free of any defects.
Tuber quality assessment Twenty tubers (>250g) were sliced longitudinally and inspected for hollow heart and other internal defects. Tuber specific gravity was measured on a 3.5 kg sample of 100-450g tubers from each plot using the weight in air - weight in water method (Redshaw and Fong, 1972). Within three weeks of harvest, a 13 mm French fry was cut longitudinally from the
52

centre of 10 tubers per plot. These were then cooked in palm oil at 180°C for 2 minutes and 45 seconds. Immediately after cooking, fry colour was assessed using a 1 to 7 colour scale, 1 being white and 7 dark gold, with a rating of 4 or less being acceptable. Also, the number of fries in each sample showing dark ends was recorded.
Statistical analyses Data were analysed by analysis of variance using GENSTAT (GENSTAT 5 Committee 1987), and l.s.d.s (P<0.05) calculated for comparison of treatment means.
Results Soil moisture tension, applied water and irrigation frequency The actual mean SWP trigger points and the maximum SWP for each treatment during the experiment are detailed in Table 1. Irrigation was never applied until the designated treatment SMP was reached. The fact that tensiometer readings were recorded only once per day meant that the designated SWP trigger points were frequently exceeded. The maximum SWPs were recorded in each treatment during a hot two day period around 1 January 1991 when readings from the tensiometers were not recorded.
Table 1. Actual mean and maximum soil water potential (SWP) trigger levels for each treatment during the experiment.
Target SWP trigger point
(-kPa)
Actual SWP trigger points Target SWP trigger point
(-kPa)
Mean Maximum Target SWP trigger point
(-kPa) Kennebec Caditna Kennebec Cadima
15 17 18 27 22 22 25 23 39 30 30 34 33 54 52 40 46 45 63 61
Total applied irrigation water applied and irrigation frequency decreased as SWP decreased in both varieties (Table 2). Compared to -15 kPa, irrigating at -40 kPa more than halved the number of irrigation events for both varieties.
Table 2. Total water applied and number of irrigations for each treatment. SWP trigger Total irrigation water (mm) Number of irrigations point (-kPa) Kennebec Cadima Kennebec Cadima
15 493 600 22 445 500 30 378 520 40 480 480
26 28 19 19 13 15 12 12
53

Growth periods Irrigation treatments had little affect on the duration of growth in both varieties (Table 3). The -40 kPa treatment shortened the growth period of Cadima.
Yield The total and processing tuber numbers and yields of both varieties were not significantly affected by irrigation treatments (Table 4). However, there was a significant (p<0.05) linear trend for increasing total and process yields with increasing SWP for Cadima potatoes.
Average growth period for each variety and irrigation tr SWP trigger point
(-kPa) Kennebec Cadima
15 22 30 40
105 105 105 109
116 116 116 105
Table 4. Effect of soil moisture tension treatments on total and marketable tubers numbers and fields.
SWP (-kPa) Total Yield (t/ha) Total tuber No./plot Marketable Yield (t/ha) Marketable tuber number / plot
SWP (-kPa)
Ken Cad Ken Cad Ken Cad Ken Cad
15 22 30 40
LSD (5%)
61.2 61.5 55.7 61.7
NS
59.0 56.1 56.7 54.5
NS
508 497 523 506
NS
482 466 458 432
NS
51.2 50.9 43.8 50.4
NS
49.3 46.2 46.9 45.8
NS
309 300 298 298
NS
312 280 272 277
NS
As with yields, average tuber weights and the distribution of tubers between various size ranges was not affected by irrigation treatments (data not shown). For Cadima, 66.5% and 29.5% and the processing tubers were in the 100-250g and 250-450g weight ranges, respectively. For Kennebec, the respective proportions were 71.9% and 25.2%.
Tuber quality For both varieties there were no significant treatment effects on any of the measured tuber quality parameters. The average specific gravity of Kennebec and Cadima potatoes was 1.069 and 1.078, respectively. No significant tuber internal defects were found and the fry colour rating in all treatments from both varieties was 0 (top rating, light coloured).
Water use efficiency Irrigation treatment had no significant effect on water use efficiency (WUE). However, the WUE of Kennebec (100 kg process yield/mm CWU) was significantly (p<0.01) higher than Cadima (82 kg process yield/mm CWU).
54

Plant growth Plant growth data are shown in Figures 1 to 10. Overall, there were no significant treatments effects on the measured plant growth parameters, although on some sampling dates, significant differences were recorded between parameters in some treatments. For Cadima, the trend for decreased field tuber yield with decreased SWP was also evident in the total plant dry weight and tuber dry weight data at samplings from 76 days after planting. During the main tuber bulking period (76 - 90 days after planting) in both varieties, tuber yield (both fresh and dry) tended to be lower in the -40 kPa treatment, but at the final sampling there were no obvious treatment effects.
Discussion The data presented here suggest that the tuber yield and quality of Kennebec and Cadima potatoes will be unaffected by an irrigation regime in which the SWP, measured at 30 cm depth, is allowed the fall to -40 kPa between irrigations throughout all growth stages. There is a need to test the response of these varieties to still lower SWPs.
Reference Riley, J.P. and Wolfe, J.W. (1958). A field plot sprinkler irrigator. Misc. Paper No. 57.
Agric. Experiment Station, Oregon State College, Corvallis.
55

CP
CD
600 r
500 -
400 D
E >> 300 ~o
B 200 -
100 -
0
[ o- 15 kPa • -22 kPa 1 - A - 30 kPa 1 A - 40 kPa
-^ M ^ JT
II 1 / S7 .A.
1
j.
i
1
0 20 40 60 80 100 Days after planting
120
Figure 1. Total (tubers, stems and leaves) dry matter accumulation in Kennebec potatoes under four irrigation regimes. Vertical bars are standards errors.
800
700
0)
% 500
o- 15 kPa • -22 kPa A - 30 kPa A - 40 kPa
0 20 40 60 80 100 Days after planting
120
Figure 2. Total (tubers, stems and leaves) dry matter accumulation in Cadima potatoes under four irrigation regimes. Vertical bars are standard errors.
56

cr>
40 60 80 100 120 Days after planting
Figure 3. Tuber dry matter accumulation in Kennebec potatoes under four irrigation regimes. Vertical bars are standard errors.
600 o — 15 kPa • — 22 kPa
500 A — 30 kPa CJ1 A — 40 kPa
-4-< 400 en <D
5 300 b
X I
(D 200 X I n
i— 100
0 _ i i <!
0 20 40 60 80 100 Days after planting
120
Figure 4. Tuber dry matter accumulation in Cadima potatoes under four irrigation regimes. Vertical bars are standard errors.
57

3000 o — 15 kPa • - 22 kPa
CT 2500 A — 30 kPa - i — >
A — 40 kPa
wei
gh
2000
fre
sh
1500
1000 -
Tubi
500
0 0 20 40 60 80 100
Days after planting 120
en
.5? "CD
sz CO CD
CD .a
= 5
Figure 5. Tuber fresh weight accumulation in Kennebec potatoes under four irrigation regimes. Vertical bars are standard errors.
3000
2500
2000
1500
1000
500
o- 15 kPa •
• -22 kPa - A - 30 kPa
A - 40 kPa
-
i
f £
™ i i 1 0 0 20 40 60 80 100 120
Days after planting
Figure 6. Tuber fresh weight accumulation in Cadima potatoes under four irrigation regimes. Vertical bars are standard errors.
58

en
300
250
CD
'55 200
Q. O
o
o
A
15 kPa 22 kPa 30 kPa 40 kPa
40 60 80 100 Days after planting
120
Figure 7. Total top (stem plus leaves) dry matter accumulation in Kennebec potatoes under four irrigation regimes. Vertical bars are standard errors.
Cn
-t-> _c Cn
'<D
Q. O
•*->
~B -4-> O
250 r
200
150 -
100 -
40 60 80 100 Days after planting
120
Figure 8. Total top (stem plus leaves) dry matter accumulation in Cadima potatoes under four irrigation regimes. Vertical bars are standard errors.
59
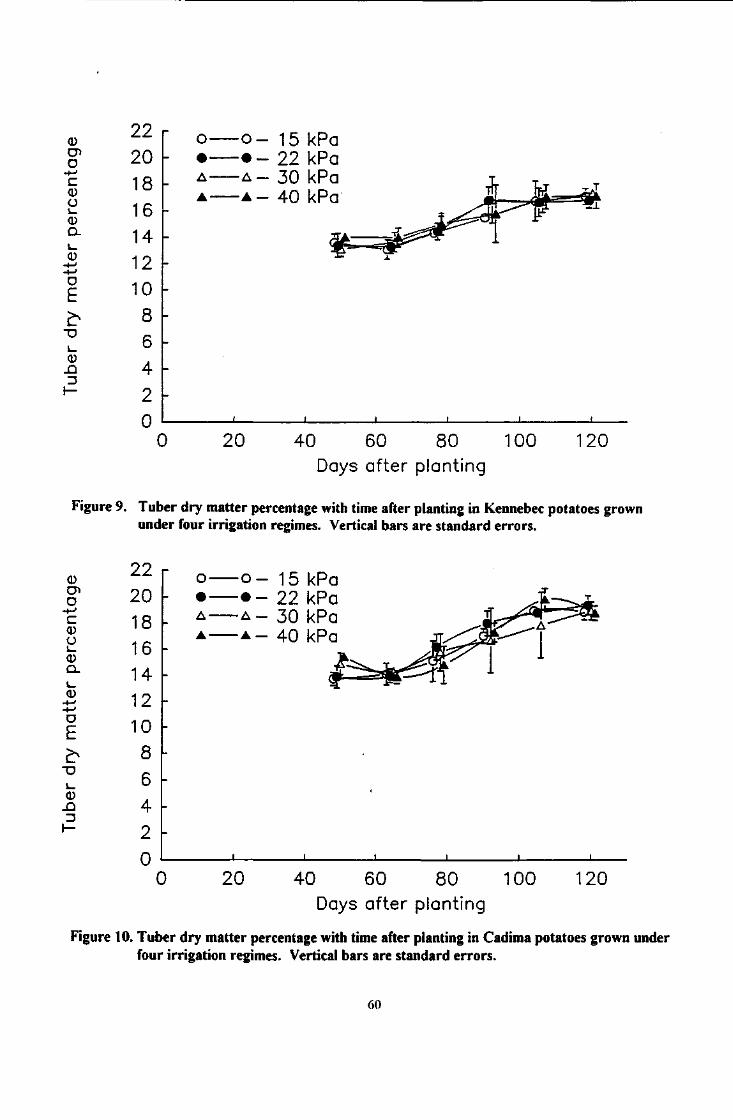
?? <D
O 20 •+->
18 O 16 <D D_ 14 i _
1? •*-> D
E 10
b 8 X> 6 CD
-O. 4 D K 2
0
o o • •
A A A •
15 kPa 22 kPa 30 kPa 40 kPa
0 20 40 60 80 100 Days after planting
120
Figure 9. Tuber dry matter percentage with time after planting in Kennebec potatoes grown under four irrigation regimes. Vertical bars are standard errors.
22 r Q)
D 20 -•*-> C 0 18 -o 1 _
16 -<D D_ 14 -L.
12 --4-> D
LU 10 -
b 8 -X> i _ 6 -<D
X I 4 -3 1— 2 -
0
o-• •
A-A-
• O —
•A —
15 kPa 22 kPa 30 kPa 40 kPa
0 20 40 60 80 100 Days after planting
120
Figure 10. Tuber dry matter percentage with time after planting in Cadima potatoes grown under four irrigation regimes. Vertical bars are standard errors.
60

6.0 IRRIGATION AND NITROGEN MANAGEMENT OF RUSSET BURBANK POTATOES
M.A. Hegney and H.P. Hoffmann
Summary
Russet Burbank is the preferred potato variety for the production of French fries in Western Australia. Overseas experience has shown that this variety is among the most sensitive to water stress. Leading up to 1991, growers in the Manjimup-Pemberton area had had difficulty producing high processing yields of this variety using traditional irrigation and nitrogen management practices.
Experiments were conducted to determine the total water and nitrogen requirements of Russet Burbank potatoes grown under Western Australian conditions, and to define the soil moisture limits within which Russet Burbank potatoes needed to be irrigated to achieve maximum yield and tuber quality.
Major results
• Total and processing yield of Russet Burbank potatoes, grown on sandy loam soil, increased linearly in response to increasing level of irrigation water applied up to approximately 470mm, and to increasing consumptive water use (soil moisture at emergence - soil moisture at harvest + irrigation + rainfall) up to approximately 610mm.
• On a sandy loam soil type, there was no significant interaction between irrigation and nitrogen level in terms of their effect on tuber yield.
• A combination of high nitrogen level (600 kg/ha) and high irrigation level (125% of estimated evapotranspiration) caused a significant reduction in processing yield.
• On a sandy loam soil type, the optimum total nitrogen level for mid November planted Russet Burbank potatoes was found to be between 335 and 375 kg N/ha.
• Tensiometers were found to be a useful tool for monitoring changes in soil moisture level and scheduling irrigations in Russet Burbank crops. Based on readings from tensiometers installed at a depth of 30cm below the top of the final ridge, the highest total and processing yields, and lowest level of tuber malformations were obtained by irrigating at a soil water potential (SWP) of-20 kPa during all growth stages. However, it was also found that, provided the SWP was maintained above -20 kPa between emergence and early tuber growth, allowing the SWP to decline to -40 kPa during later growth stages had no detrimental affect on tuber yield or quality. This latter regime did not result in any water saving, but significantly reduced the total number of irrigation events during the life of the crop. Allowing the SWP to decrease below -40 kPa in the period between emergence and early tuber growth resulted in a significant increase in the proportion of malformed tubers.
• Effects of different irrigation regimes on tuber specific gravity were generally small. Tuber specific gravity tended to decrease with increasing levels of total nitrogen applied.
61

Recommendations
(a) Extension/adoption by industry
The results from these field experiments were presented to Western Australian potato growers at seminars in September 1990, August 1991, June 1992 and September 1996. Several publications were also produced. These included two articles in the "Potato Grower" magazine, a Farmnote on the use of tensiometers for scheduling irrigation in potato crops, and two Technotes produced as part of a production manual for growers producing processing potatoes for the then Edgell-Bird Eye company (now Simplot (Aust.)).
Following this research, the Edgell-Bird Eye company subsidised the purchase price of tensiometers for all of their processing potato growers and continue to provide their growers with assistance to set-up and monitor tensiometers. As a consequence, in 1995, the company estimated that 85% of their Russet Burbank potato growers in the Manjimup-Pemberton area made use of tensiometers for irrigation scheduling.
(b) Directions for future research
The results presented here provide a good foundation on which to base irrigation scheduling in Russet Burbank potato crops. They also provide a preliminary estimate of the nitrogen requirements of this potato variety when grown on sandy loam soils in the Manjimup-Pemberton area of Western Australia. However, particularly in the area of irrigation scheduling and its effect on tuber internal quality, further work is required. For instance, the effects on internal tuber quality of maintaining different levels of soil moisture around the time of tuber formation and during early tuber growth need to be further investigated.
There is trend in Western Australia for increased levels of processing potato production on lighter textured (sandier) soils than those studied here. The irrigation requirements of Russet Burbank and other potato varieties on these soil types needs to be determined. As it is more likely that there will be a significant interaction between irrigation and nitrogen management on sandier soils, these factors should be examined together.
(c) Financial/commercial benefits
Irrigation management is a critical factor determining the yield and quality of Russet Burbank potatoes. This work has already contributed to an improvement in Russet Burbank production levels and grower profitability in the Manjimup-Pemberton area of Western Australia.
62

6.1 EFFECT OF EVAPORATION REPLACEMENT RATE AND NITROGEN RATE ON THE YIELD AND QUALITY OF RUSSET BURBANK POTATOES. (Experiment 89MC19)
Introduction The potato crop is commonly accepted as being shallow-rooted and more sensitive to water stress than many other crops (Singh, 1969; Epstein and Grant, 1973). As a result, in semi-arid regions, such as Western Australia, irrigation is an essential component of commercial potato production systems.
The potato cultivar "Russet Burbank' is used extensively around the world for french fry production, and has become important in the potato processing industry in Western Australia. Overseas experience has shown that this cultivar is more sensitive to water stress than other cultivars (Millar and Martin, 1983).
In developing irrigation management guidelines for potatoes produced in Western Australia, it was considered important to establish water production functions for the crop as a basis on which to assess and refine alternative irrigation management techniques. Various workers have found linear relationships between water applied and yield for potatoes (Shalhevet et ai, 1983; Hane and Pumphrey, 1984; Martin et ai, 1992). Total seasonal water use for Russet Burbank potatoes has been found to vary between 450 mm and 700 mm (Wright and Stark, 1990), depending on season and region of production.
Nitrogen is also an important factor affecting potato yields both in Australia (Laurence et ai, 1985) and worldwide (Perrenound, 1983). The interaction between irrigation and nitrogen in terms of potato crop response is well recognised (Middleton et ai, 1975; Ojala et ai, 1990). Given this interaction, it was considered important at the beginning of this project to examine the magnitude of any interaction between nitrogen and irrigation for potatoes grown on sandy loam soils. Also, an indication of the total nitrogen requirement of Russet Burbank potatoes grown under Western Australian conditions was required in order to ensure adequate levels were supplied in any future work. Overseas research has shown that the total nitrogen requirement of Russet Burbank potatoes varies between 200 and 400 kg N/ha (Westermann and Kleinkopf, 1985;Lauer, 1986a; Roberts and Cheng, 1988).
Aims The objectives of this experiment were (1) to determine the water production function for Russet Burbank potatoes produced in Western Australia, (2) to determine the extent of any interaction between irrigation and nitrogen rates, and (3) to determine the optimum nitrogen application level for Russet Burbank potatoes on a sandy loam soil.
Materials And Methods Site details The experiment was located at the Manjimup Horticultural Research Centre (34° 18' S, 116° 7 E) on a sandy loam soil with gravel over clay at about 0.5 m. Some of its relevant physical characteristics are given in Table 1.
63

Table 1. Soil characteristics of experimental site.
Soil Field Wilting % % % % % pH Depth Capacity Point Gravel Course Fine Silt Clay (H20) (cm) (%vol.) (%vol.) Sand Sand
0 - 5 0 20 10.9 31.8 37 40.6 0.2 13.2 5.9 50-80 25 12.4 29.2 29 39.8 7.8 24.0 6.0
Experimental design and treatments Differential irrigation treatments were imposed from the time of tuber initiation until crop maturity using a single line-source sprinkler arrangement as described by Hanks et al. (1976). The sprinkler line, with sprinklers 6.0 m apart, was placed parallel to the row direction in the middle of the field. Each sprinkler head (Pope Premier®), with a 4.8 x 2.4 mm nozzle combination, was operated at 280 kPa (40 psi) of pressure. The application rate was uniform down each row but decreased almost linearly across the field, from 16 mm/hr at the sprinkler line to a negligible amount at the edge of the experimental area, about 13 m from the line-source.
15 rows of potatoes were planted on each side of the line-source. Six rows on each side were selected as irrigation treatment locations (row numbers 3, 5, 7, 9, 11 and 13 from the sprinkler line, with the highest irrigation rate being received at row 3). Hereafter, these row numbers will be called 16,15,14,13,12 and II, respectively.
Six nitrogen rates (0, 50, 100, 200, 400, 600 kg N/ha total) were imposed in 7.0 m wide strips at right angles to the line-source. The nitrogen treatments were randomised within four replications, two on each side of the line-source. The nitrogen treatments were considered as main plots and the irrigation levels as subplots. Subplots were one row wide by 7 m long. The nitrogen was applied as NH4N03 hand topdressed along each row in three equal applications - at planting, 7 days after first emergence (DAE)(5 December) and 30 DAE(5 January 1990).
Site preparation A non-experimental oat crop was grown on the trial site in the previous season. Site preparation began when residual crop and weeds were sprayed with glyphosate (3 L/ha Roundup®) on 10 August, 1989. The area was ploughed on 17 August and then cultivated with a roto-tiller on 6 October. Fenamiphos (24 L/ha Nemacur 400®) and chlorpyriphos (6 L/ha Lorsban 500®), together with 265 kg K/ha and a trace element mix containing 15 kg/ha CuS04, 7.5 kg/ha ZnO, 10 kg/ha MnS04, 15 kg/ha Borax and 50 kg/ha MgS04, were applied on 8 November and incorporated with a roto-tiller.
Crop management Certified seed tubers which had been harvested the previous autumn and held in cool store at 4°C, were removed from storage on 16 October. They were held at ambient temperature, to allow sprouting, until 8 November when they were cut to c. 50 g sets and dusted with tolclofos-methyl fungicide (2 kg/t Rizolex®).
Furrows, 0.8 m apart were created by machine on 9 November. Superphosphate at 275 kg P/ha and one third of the total nitrogen allocation for each treatment was hand banded along the bottom of the furrows. This fertiliser was covered by hand with
64

approximately 50 mm of soil. Sets were then placed by hand at 0.35 m apart along each furrow on 10 November, to give a population density of 35,700 plants/ha. Nitrogen treatment plots within a row were seperated by four plants of a red-skinned variety (cv. Desiree). The furrows were then filled and moulded by machine. All plots were again machine moulded on 5 December when 50% of plants had emerged.
Paraquat plus diquat (1.0 L/ha Sprayseed®) was applied on 29 November for general weed control. Regular sprays of chlorothalonil (2 L/ha Rover®) and iprodione (2 L/ha Rovral®) were applied to control early blight (A/lernaria solani) and methamidophos (700 mL/ha Nitofol®) and permethrin (150 mL/ha Ambush®) were applied to control potato tuber moth, aphids and caterpillars. Fenitrothion (1 L/ha Fenitrothion 500®) was applied once to control wingless grasshoppers.
Irrigation management Between planting and when the line-source was first brought into operation on 5 January 1990 (30 days after emergence, DAE), the entire site was irrigated uniformly to replace 100% of estimated ET whenever 20 - 25 mm of pan evaporation (Ep) had accumulated. Throughout the experiment, ET was estimated by ET = K.Ep. The values of K that were used are shown in Table 2. The line-source was operated until 50% crop senescence (19 March 1990). During the operation of the line-source, the crop was irrigated so that irrigation treatment 4 (14) received 100% of ET whenever 20 - 25 mm of pan evaporation had accumulated. The water applied to each subplot was measured with raingauges following each irrigation. Irrigations were conducted only under calm conditions to avoid distortion of the water distribution pattern. Irrigation water quality was good with an EC of less than 100 mS/m.
Table 2. K values used to estimate evapotranspiration (ET).
Date K value
05/12/89-04/01/90 0.5 05/01/90-11/01/90 0.5 12/01/90-23/01/90 0.8 24/01/90-01/03/90 1.0 02/03/90 - 19/03/90 0.9
Petiole analysis On three occasions during the growth of the crop (18 January, 1 February and 20 February; 43, 57 and 78 DAE respectively) twenty petioles from youngest fully emerged leaves (P-YFEL) were sampled from the treatment rows. At the first sampling, the length of the longest tuber on plants in 200 kg N/ha plots was 15-20mm. The petioles were dried at 70°C for 48 hours and forwarded to CSBP & Farmers Ltd. Laboratories, Bayswater, W.A., for analysis of N03-N (ppm) and total nitrogen (%).
Harvest and Tuber Assessment The experiment was harvested after complete plant senescence using a single row harvester. Tubers from each plot were counted and weighed into the following size categories: 0-1 OOg, 100-250g, 250-450g and >450g. Processing grade tubers were >100g and free from obvious defects such as greening, rots or severe secondary growth
65

(tubers with minor second growth, such as bud swelling, were classed as processable; tubers with growth cracks were also considered processable). Tubers showing growth cracks or secondary growth were counted and weighed seperately. Specific gravity was determined on a 3.5 kg sample of tubers weighing between 250 and 450g from each plot using the weight in air - weight in water method.
Data analyses Data were analysed by analysis of variance using GENSTAT (GENSTAT 5 Committee 1987), and l.s.d.s (PO.05) calculated for comparison of treatment means. Linear and quadratic regression functions were fitted to yield data in response to water applied and petiole nitrate levels.
Results
Water application Between emergence and the start of line-source irrigation the experiment was irrigated 8 times applying a total of 96 mm water. 22 mm of rain was received during this period. During the period of line source irrigation, the experiment was irrigated 17 times. At the end of the line-source irrigation period, the wettest treatment (16) had received 125% ET, while the driest treatment (II) had received only 60% (Table 3). Total pan evaporation for the period between emergence and 50% senescence was 631mm.
Duration of growth Nitrogen rates lower than 200 kg/ha reduced the period between planting and 90% crop senescence by 10 to 20 days (Table 4). The crop growth period was also reduced by low irrigation rates (12 and II).
Table 3. Water applied and percent estimated ET for each irrigation treatment for various periods during crop growth'.
Irrigation Total Percent Total Percent Irrigation + Rainfall Irrigation Rainfall Water Estimated Water Estimated Treatment (mm) (mm) (mm) Applied
(mm) ET Applied
(mm) ET
AtoB BtoC BtoC BtoC BtoC AtoC AtoC
16 118 369 64 433 119 551 125 15 118 336 64 400 110 518 118 14 118 288 64 352 96 470 107 13 118 222 64 286 78 404 92 12 118 142 64 206 56 324 74 11 118 81 64 145 40 263 60
1. A = 100% emergence, B = start of line-source irrigation, C = 50% crop senescence.
66
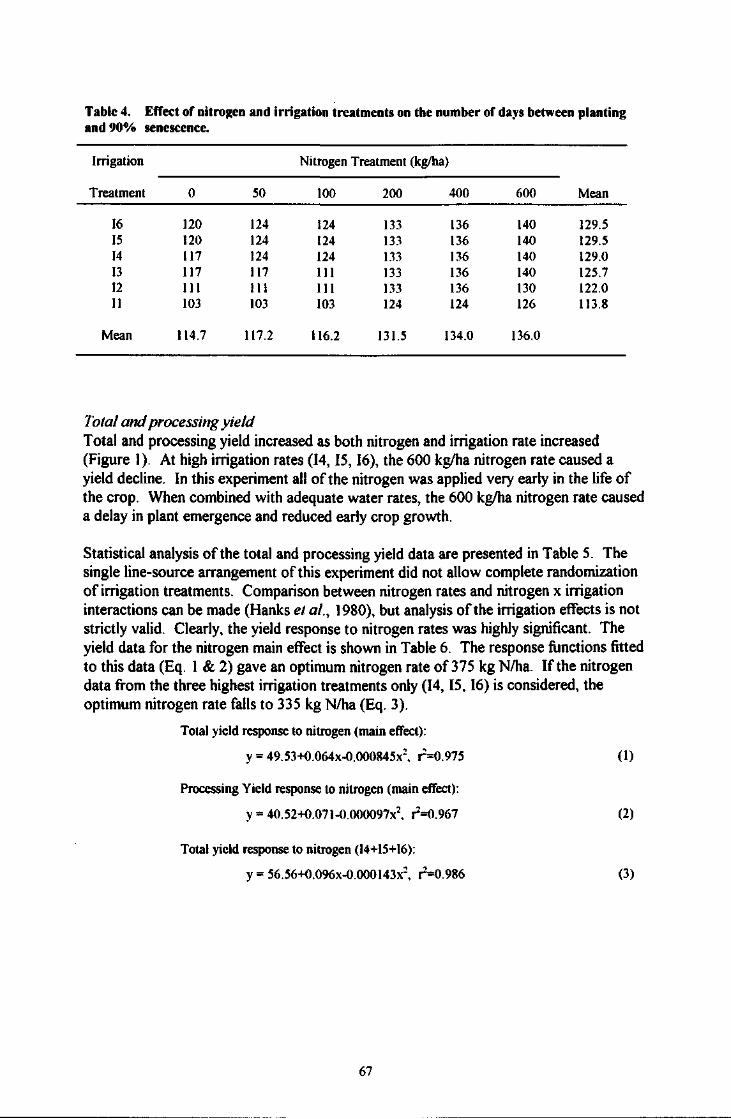
Tabic 4. Effect of nitrogen and irrigation treatments on the number of days between planting and 90% senescence.
Irrigation Nitrogen Treatment (kg/ha)
Treatment 0 50 100 200 400 600 Mean
16 120 124 124 133 136 140 129.5 15 120 124 124 133 136 140 129.5 14 117 124 124 133 136 140 129.0 13 117 117 111 133 136 140 125.7 12 111 HI 111 133 136 130 122.0 11 103 103 103 124 124 126 113.8
Mean 114.7 117.2 116.2 131.5 134.0 136.0
Total and processing yield Total and processing yield increased as both nitrogen and irrigation rate increased (Figure 1). At high irrigation rates (14,15,16), the 600 kg/ha nitrogen rate caused a yield decline. In this experiment all of the nitrogen was applied very early in the life of the crop. When combined with adequate water rates, the 600 kg/ha nitrogen rate caused a delay in plant emergence and reduced early crop growth.
Statistical analysis of the total and processing yield data are presented in Table 5. The single line-source arrangement of this experiment did not allow complete randomization of irrigation treatments. Comparison between nitrogen rates and nitrogen x irrigation interactions can be made (Hanks et al., 1980), but analysis of the irrigation effects is not strictly valid. Clearly, the yield response to nitrogen rates was highly significant. The yield data for the nitrogen main effect is shown in Table 6. The response functions fitted to this data (Eq. 1 & 2) gave an optimum nitrogen rate of 375 kg N/ha. If the nitrogen data from the three highest irrigation treatments only (14,15,16) is considered, the optimum nitrogen rate falls to 335 kg N/ha (Eq. 3).
Total yield response to nitrogen (main effect):
y = 49.53+0.064x-0.000845x\ r=0.975 (1)
Processing Yield response to nitrogen (main effect):
y = 40.52+0.071-0.000097x2. ^=0.967 (2)
Total yield response to nitrogen (14+15+16):
y = 56.56+0.096x-0.000143x2, r O.986 (3)
67

100 200 400
Nitrogen Rate ( k g / h a )
Fig. 1 Total and processing yield response of Russet Burbank potatoes to nitrogen and irrigation rates. LSD's are for the nitrogen main effect.
For total yield, there was no significant interaction between nitrogen and irrigation rate. For processing yield, the interaction was significant (p<0.05) suggesting that the toxic effects of the 600 kg N/ha rate at high irrigation rates reduced the proportion of processable tubers.
68

Table 5. Analysis of variance - mean square values for total and processing yield.
Source of df MS-Total Yield MS-Variation ProcessingYield
Total (subplots) 143
Main Plot Blocks. R 3 163.79 255.49 Nitrogen. N 5 499.55b 546.34b Error (a) 15 53.22 61.25
Irrigation. I 5 3138.88b 4095.87b N x l 25 44.09 77.49a Error, (b) 90 32.4 38.96
a. significant at 5% level, b. significant at 1% level.
Table 6. Effect of nitrogen rate on total and processing yield (means of all irrigation rates)
Nitrogen Rate Total Yield Processing Yield (kg/ha) (t/ha) (t/ha)
0 48.5 39.3 50 52.8 44.4 100 56.9 48.5 200 58.2 49.4 400 61.3 53.2 600 57.9 48.1
LSD (p<0.05) 4.4 4.7
As shown in Figure 1 and Table 6, there was no significant difference between yields at 200 and 400 kg N/ha. Therefore, the irrigation response data from these treatments was combined to produce the relationship between total and processing yield and water application levels shown in Figure 2. Total and processing yield increased linearly as total water application increased from 263 to 470mm (60 to 107% ET). Optimum yield occurred at a total water application level of c. 475mm. At higher water application levels yield remained unchanged. Irrigation levels had no effect on the proportion of total yield that was processable.
69

80
70
60
50
40
30
20 80
70
60
50
40
30
20
y = 0.15x-0.29
r 2 = 0.992 y = 79.53-0.017x
r i = 0.952
y = 76.12-0.024x
r~2 = 0.816
y = 0.179x-20.06
r i = 0.992
250 300 350 400 450 500 550
Total Water Applied (mm) (A to C)
600
Fig. 2 Total and processing yield response of Russet Burbank potatoes to total amount of water applied (irrigation plus rainfall) between the start of line-source irrigation (B) and 50% crop senescence ( C ).
Yield components Nitrogen and irrigation rates had no affect on tuber numbers per plant. Yield responses to both nitrogen and irrigation resulted from increases in average tuber weight (Table 7)( Appendix 1). The yield of tubers weighing less than lOOg was not affected by nitrogen rate, but decreased with increasing irrigation rates (Appendix 2). The most significant yield increases in response to both nitrogen and irrigation were in the 250-450g and >450g tuber weight ranges.
70

Table 7. Main effects of nitrogen and irrigation rate on average tuber weight and average processing tuber weight.
Average tuber Average processing weight (g) tuber weight (g)
Nitrogen Rate (kg/ha)
0 133 175 50 142 182 100 151 193 200 157 203 400 164 215 600 157 215
LSD (p<0.05) 14 13
Irrigation Treatment
11 108 164 12 125 173 13 156 202 14 169 213 15 175 217 16 171 214
Tuber Quality Tuber specific gravity decreased significantly when the nitrogen rate increased up to 200 kg/ha (Figure 3). Specific gravity did not decrease further at higher nitrogen rates. At the lowest irrigation rate, specific gravity was higher than at all other irrigation rates.
The proportion of tubers with growth cracks or second growth increased significantly at nitrogen rates of 400 and 600 kg/ha (Table 8). The proportion of tubers with growth cracks showed a decreasing trend with increasing irrigation, while the proportion of tubers with second growth appeared to be unaffected by irrigation rate. There was no significant interaction between irrigation and nitrogen rate with respect to these tuber malformations.
71

1.090
1.085 T \
1.080 I-
1.075
1.070
1.065
LSD (0.05) = 0.003 o — o M • — • 12 A — A I3 A A |4 • — • 15 • • 16
0 100 200 300 400 500 600 700
Nitrogen Rate ( k g / h a )
Fig. 3 The response of tuber specific gravity to nitrogen rates and irrigation treatments. The LSD is for the nitrogen main effect.
Tabic 8. Main effects of nitrogen and irrigation rate on the proportion of total yield comprised of tubers with growth cracks and second growth (knobs).
Growth Cracks Second Growth (%) (%)
Nitrogen Rate (kg/ha)
0 0a 3.5a 50 0.1a 3.0a 100 0.2a 5.1a 200 0.1a 6.1a 400 1:4b 8.5a 600 3.9c 11.8b
Irrigation Treatment
11 1.7 4.8 12 0.8 5.6 13 0.6 5.9 14 0.8 6.9 15 0.1 7.0 16 0.0 6.1
Numbers followed by the same letter are not significantly different at p<0.05
72

Petiole Nitrogen and Nitrate Total nitrogen levels in P-YFEL increased linearly with increasing nitrogen application rate at all sampling times (Figure 4). At each nitrogen rate, petiole total nitrogen levels remained constant from 43 to 78 DAE. At the first and second sampling times (43 and 57 DAE) total nitrogen levels showed a decreasing trend with increasing irrigation rate. Irrigation rate had no affect on petiole total nitrogen levels at the third sampling (78 DAE).
Petiole nitrate levels also increased significantly in response to applied nitrogen (Figure 5). However, in contrast to total nitrogen, at the first sampling time (43 DAE), petiole nitrate was depressed at the 600 kg N/ha rate. Petiole potassium levels were also depressed by the the 600 kg N/ha treatment at the early sampling (data not shown) suggesting that the toxic effects of this treatment were possibly the result of ammonia toxicity.
Unlike total nitrogen, petiole nitrate levels decreased with progressively later samplings. Irrigation rate had no affect on petiole nitrate levels at 43 and 78 DAE. At 57 DAE petiole nitrate showed a decreasing trend with increasing irrigation rate.
Figure 6 shows the relationship between petiole nitrate and total yield at each sampling time based on individual plot data from irrigation treatment 5 (15) only. The nitrate levels associated with maximum yield were 16,000, 14,000 and 8,000 ppm at 43, 57 and 78 DAE, respectively.
Discussion
The linear relationships between irrigation rate and total and processing yields in our experiment are similar to those found by other workers. For example, Hane and Pumphrey (1984) found that the total yield of Russet Burbank potatoes (Y) was related to water use (W) by the production function:
Y = 0.142W-28.7 (3)
where Y is in t/ha and W is in millimetres and was applicable over the range 300 to 650mm. They found that the amount of water required for maximum yield was 625-650mm. Similarly, Shalhevet et al. (1983), working in Israel, found a linear relationship between total yield and seasonal water application for Desiree potatoes given by:
Y = 0.119W-23.5 (4)
This function was applicable over the range 300 to 850mm, and 820mm was required for maximum yield. For marketable yield, Shalhevet et al. found a production function of:
Y = 0.128W-40 (5)
The slopes of these production functions are very similar to those found in our experiment (0.15 - total yield, 0.179 - processing yield). However, our optimum water application level
73

3.000
43 DAE
0.500
3.000
-Q 2.500
X
u O
O
2.000
1.500
57 DAE
£ 1.000
0.500
3.000
xi 2.500
LSD (0.05) = 0.14
X
§ 2.000
O
Z 1.500
J«> 1.000
0.500
78 DAE
LSD (0.05) = 0.18
100 200 300 400 500
Nitrogen Rate (kg/ha)
600 700
Fig. 4 Response of petiole total nitrogen levels of nitrogen rates and irrigation treatments. LSD's are for the nitrogen main effect.
74

25000
"P 20000 a. a.
« 15000 p
O
01
a.
E a. a.
a.
I jo « a.
10000
5000
25000
20000 -
J> 15000 p
10000 -
43 DAE
57 DAE
LSD (0.05) - 2204
LSD (0 .05 )= 1601
100 200 300 400 500
Nitrogen Rate (kg/ha) 600 700
Fig. 5 Response of petiole nitrate-nitrogen concentrations to rates of applied nitrogen and irrigation treatments. LSD's are for the nitrogen main effect.
75

5 V
"5
• u
43 DAE ••* •
70
•
• • • •
•
•
• •
•
60
• • •
50 •
ATI
y = 52.56+0.002x-0.000000062x-2.
. . i ... i _ i
r-2 =0.625
80
^ 70
3 60
o
£ 50 I-
40
• . % 57 DAE
^ ..... ^ ^ ^
• X .
• N
. •
y = 58.61 +0.0019x-0.0000007x~2. r~2=0.648
i i i i — — i . _
80
I 1
78 DAE
-2 60 -
50
40
y = 62.B2+0.00161X-0.000000101X-2, fT2=0.353
5 10 15 20
Petiole Nitrate ('1000 ppm)
25
Fig. 6 Relationships between petiole nitrate-nitrogen concentrations and total yield at three sampling times.
76

was considerably lower (475mm). The differences can be explained in terms of seasonal evaporative demand and temperature conditions. In our experiment, 475mm represented 107% estimated ET or 74% Class A pan evaporation. In the work of Hane and Pumphrey (1984), 650mm corresponded with 104% calculated potential ET averaged over two seasons. Shalhevet et al. (1983) did not present ET data, but 820mm corresponded with 104% of Class A pan evaporation. The higher Epan replacement level required in Israel may be due to higher temperatures leading to increased evaporative losses from exposed soil. As in our experiment, these workers found that yield remained unchanged at water application levels in excess of that required for maximum yield.
Soil texture is important in determining optimum irrigation levels. Millar and Martin (1983), also using a line source sprinkler system, found that on a sandy soil the total and marketable yield of Russet Burbank potatoes increased linearly with increased irrigation up to the equivalent of 100% estimated ET. However, on a loam soil, maximum total and marketable yield was achieved at irrigation levels equivalent to 70-80% estimated ET. Wright and Stark (1990) presented data which showed that sprinkler irrigated Russet Burbank potatoes required water equivalent to 52% Class A pan evaporation on a silt loam soil in southern Idaho, US. These workers did not present any detailed soil information. The soil type studied in our experiment had a sandy surface. The work of Hane and Pumphrey (1984) and Shalhevet el al. (1983), quoted above, was also conducted on loamy sands. It would appear important, therefore, to clearly define the target soil type when stipulating an optimum ET or Epan replacement level.
Previous research has shown that water stress before or at the time of tuber initiation can reduce tuber numbers and subsequently lead to reduced yields (MacKerron and Jefferies, 1986; Moorby and Milthorpe, 1978). In our experiment, differential irrigation treatments were imposed at or just after tuber initiation so tuber numbers were not affected. Water stress reduced yields through reductions in individual tuber weights. Van Loon (1981) found that water stress during tuber bulking was more detrimental to tuber size and final yield than early stress. High tuber yields require long tuber bulking periods which in turn require the maintenance of a large green leaf area for extended periods (Moorby and Milthorpe, 1975; Dyson and Watson, 1971). Based on the number of days from planting to 90% foliage senescence, we found that increased water stress reduced green leaf area duration.
Tuber specific gravities were significantly higher in the driest irrigation treatment. The very low average tuber size in this treatment may partly explain the high values. The transfer of water from tubers to leaves in water stressed plants, thereby increasing the concentration of soluble solids in tubers, has also been suggested as a possible explanation (Wolfe et al., 1983).
We have shown that tuber specific gravity decreases in response to increasing nitrogen up to rates sufficient for maximum yield (Fig. 3). At higher nitrogen rates, specific gravity remained unchanged. This response is in contrast to the pattern observed by Dahienburg el al. (1990) at two of four sites where they found specific gravity increased with nitrogen up to rates adequate for maximum yield and then decreased with' excessive nitrogen rates. The response of specific gravity is not always consistent. For example, in studies with Nooksack potatoes, Lauer (1986b) measured decreasing specific gravity
77

with increased nitrogen rates in two of six experiments. In the remaining four experiments nitrogen rate had little effect on specific gravity.
Millar and Martin (1987) found that the proportion of tubers with malformations such as second growth, increased with increasing water stress, particularly if the stress was imposed at an early growth stage. In our experiment, irrigation rate had no effect on the proportion of tubers with second growth. As with the tuber number response, this can be explained by the fact that our differential irrigation treatments were not imposed until the time of tuber initiation. The 600 kg/ha nitrogen rate significantly increased the proportion of tubers with second growth, suggesting that the early toxic effects of this treatment have been detrimental to tuber shape.
The lack of a positive interaction for yield between irrigation and nitrogen rates suggests that nitrogen leaching was not a problem on our experiment site. The nitrogen/irrigation interaction was partly over-shadowed by the toxic combination of 600 kg N/ha and high irrigation rates. However, as shown in Figure 1, the yield response to nitrogen rates up to 400 kg/ha tended to increase as irrigation rate increased. A similar result was found by Ojala <?/a/. (1990).
The total and processing yield responses to nitrogen were well described by quadratic functions. The optimum nitrogen rate suggested from these functions (335 to 375 kg N/ha) is similar to the optimum rates found by other workers (e.g. Lauer 1986a, 400-425 kg N/ha; Roberts and Cheng 1988, 336 kg N/ha).
Total and processing yields with nil nitrogen were 79 and 75% of the maximum yields, respectively. This suggests that the site had a relatively high residual soil nitrogen level. In a nitrogen response experiment conducted on a neighboring site with a lower residual soil nitrogen level (as indicated by the yield of the nil nitrogen treatment - 42% maximum yield) in the same season , an optimum nitrogen rate of 450 kg/ha was found (McKay, pers comm). Clearly, for accurate determination of total nitrogen requirements, knowledge of the residual soil nitrogen level is required.
Petiole NO3-N analysis at an early growth stage has been suggested as a means of overcoming the need to have detailed residual soil nitrogen data in order to determine total crop N requirements (Roberts and Cheng, 1988). Corresponding to our sampling times, these workers suggested that petiole NO3-N levels above 11000, 9200 and 7000 ppm at 43, 57 and 78 days after emergence respectively, were adequate for maximum yield of Russet Burbank potatoes. The critical levels we suggested are higher than these and are more in line with the levels suggested by Gardner and Jones (1975) and Sharma and Arora(1987).
References
Dahlenburg, A.P., Maier, N.A. and Williams, C.M.J. (1990) Effect of nitrogen on the size, specific gravity, crisp colour and reducing sugar concentration of potato tubers (Solanum tuberosum L.) cv. Kennebec. Aust. J. Exp. Agric. 30:123-30.
Dyson, P.W. and Watson. D.J. (1971) An analysis of the effects of nutrient supply on the growth of potato crops. Ann. appl. Biol. 69:47-63.
Epstein, E. and Grant, W.J. (1973) Water stress relations of the potato plant under field conditions. Agron. ./. 65:400-404.
78

Gardner, B.R. and Jones, J.P. (1975) Petiole analysis and the nitrogen fertilisation of Russet Burbank potatoes. Am. Potato J. 52:195-200.
Hanc, D.C. and Pumphrey, F.V. (1984). Yield-evapotranspiration relationships and seasonal crop coefficients for frequently irrigated potatoes. Am. Potato J. 61,661-668.
Hanks, R.J., Keller, J., Rasmussen, V.P. and Wilson, G.D. (1976). Line source sprinkler for continuous variable irrigation-crop production studies. Soil Sci. Soc. Am. J. 40,426-429.
Hanks, R.J., Sisson, D.V., Hurst, R.L. and Hubbard. KG. (1980). Statistical analysis of results from irrigation experiments using the line-source sprinkler system. Soil Sci. Soc. Am. J. 44,886-888.
Lauer, D.A. (1986a) Russet Burbank yield response to sprinkler-applied nitrogen fertiliser. Am. Potato J. 63:61-69.
Lauer, D.A. (1986) Response of Nooksack potatoes to nitrogen fertiliser. Am. Potato J. 63:251-262.
Laurence, R.C.N., Armour, J.D., Shepherd, R.K., Loader, L.R., and Dwyer. M.J. (1985). Nitrogen fertiliser requirements of irrigated potatoes on the Atherton Tableland, North Queensland. Aust. J. Exp. Agric. 25,954-958.
MacKerron, D.K.L. and Jefferies, R.A. (1986) The influence of early soil moisture stress on tuber numbers in potato. Potato Res. 29:299-312.
Martin, R.J., Jamieson, P.D., Wilson, D.R. and Francis, G.S. (1992). Effects of soil moisture deficits on yield and quality of'Russet Burbank' potatoes. New Zealand J. Crop Hort. Sci. 20,1-9.
Middleton, J.E., Roberts. S., James, D.W., Cline, T.A.. McNeal, B.L. and Carlile, B.L. (1975) Irrigation and fertiliser management for efficient crop production on a sandy soil. Bulletin 811, College Agric. Research Center, Wash. State Uni., Pullman.
Miller, D.E. and Martin, M.W. (1983) Effect of daily irrigation rate and soil texture on yield and quality of Russet Burbank potatoes Am. Potato J. 60:745-757.
Miller, D.E. and Martin, M.W. (1987) Effect of declining or interrupted irrigation on yield and quality of three potato cultivars grown on sandy soil. Am. Potato J. 64:109-117.
Moorby, J. and Milthorpe, F.L. (1975). Potato, p.225-257. In; L.J. Evans (ed.) Crop physiology. Cambridge Univ. Press, London.
Ojala, J.C, Stark, J.C. and Kleinkopf, G.E. (1990) Influence of irrigation and nitrogen management on potato yield and quality. Am. Potato J. 67:29-43.
Perrenoud, S. (1983). Potato fertilisers for yield and quality. In. Potash Inst. Bulletin No. 8, Berne, Switzerland, p.84.
Roberts, S. and Cheng, H.H. (1988) Estimation of critical nutrient range of petiole nitrate for sprinkler-irrigated potatoes. Am. Potato J. 65:119-124.
Shalhevet, J., Shimshi, D. and Meir, T. (1983). Potato irrigation requirements in a hot climate using sprinkler and drip methods. Agron. J. 75,13-16.
Sharma, U.C. and Arora, B.R. (1987) Critical NO3-N concetrations in potato leaves and petioles for higher yield. J. Indian Soc. Soil Sci. 35:661-666.
Singh, G. (1969) A review of the soil-moisture relationship in potatoes. Am. Potato J. 46:398-403.
Westermann, D.T. and Kleinkopf, G.E. (1985) Nitrogen requirements of potatoes. Agron. J. 77:616-621.
Wolfe, D.W., Fereres, E. and Voss, R.E. (1983) Growth and yield response of two potato cultivars to various levels of applied water. Irrig.Sci. 3:211-222.
Wright, J.L. and Stark, J.C. (1990) "Potato". In. Irrigation of Agricultural Crops. B.A. Stewart and D.R. Nielson (eds). Agron. Series No. 30, Madison, Wisconsin USA.
79

APPENDIX 1 Average tuber weights and yield components.
* There were no treatment effects on the number of tubers per plant which averaged 10.4
* There were no treatment effects on the number of tubers per stem which averaged 3.4
* Irrigation rates had no effect on the number of stems per plant. However, nitrogen rate had a small effect on stem number per plant:
Nitrogen Rate (kg/ha)
0 50 100 200 400 600 LSD (0.05)
Stems/plant 2.99 3.16 3.31 3.23 3.12 2.83 0.28
Average Tuber Weight (g)
Irrigation Treatment
Nitrogen Rate (kg/ha) 11 12 13 14 15 16 Mean
0 96 105 145 156 163 135 133 50 105 122 148 158 163 156 142 100 108 131 150 170 176 172 151 200 115 106 162 181 193 182 157 400 110 127 169 187 178 210 164 600 113 159 160 163 174 174 157
Mean 108 125
LSD (0.05) for nitrogen main effect 156 169 175
Mean 164 173
LSD (0.05) for nitrogen main effect
202 213 217
171
214
14
Average Processable Tuber Weight (g)
Irrigation Treatment
Nitrogen Rate (kg/ha) 11 12 13 14 15 16 Mean
0 157 146 182 192 200 172 175 50 152 174 185 191 197 193 182 100 164 167 198 213 211 204 193 200 174 164 212 216 227 228 203 400 162 182 218 233 235 260 215 600 174 205 215 236 232 228 215
13
80

APPENDIX 2 Yield of tubers in various size categories
0 99g Tuber Size Range (t/ha)
Irrigation Treatment
Nitrogen Rate (kg/ha) 11 12 13 14 15 16 Mean
0 12.3 12.2 7.4 6.3 6.1 9.0 8.9 50 10.5 10.3 7.6 7.0 6.4 5.9 7.9 100 11.1 8.4 8.9 6.2 6.1 4.8 7.6 200 11.2 11.4 6.1 5.6 6.1 6.0 7.7 400 10.6 10.1 6.3 4.9 6.6 5.0 7.3 600 9.5 7.1 6.9 7.4 6.8 6.3 7.3
Mean 10.9 9.9
LSD (0.05) for nitrogen main effect
7.2 6.2 6.4 6.2
NS
100 - 249g Tuber Size Range (t/ha)
Irrigation Treatment
Nitrogen Rate (kg/ha) 11 12 13 14 15 16 Mean
0 17.1 21.7 32.3 33.1 30.7 34.8 28.3 50 21.3 26.5 35.2 30.2 33.8 33.5 30.1 100 21.1 27.8 32.0 33.2 31.0 37.0 30.8 200 23.2 25.1 31.7 33.5 29.7 32.0 29.2 400 25.6 28.2 25.7 27.1 31.1 25.8 27.2 600 24.0 25.7 25.9 21.3 25.2 26.4 24.7
Mean 22.0 25.8
LSD (0.05) for nitrogen main effect
30.4 29.7 30.8 31.6
3.6
249 - 450g Tuber Size Range (t/ha)
Irrigation Treatment
Nitrogen Rate (kg/ha) 11 12 13 14 15 16 Mean
0 2.0 2.7 12.5 17.4 19.0 11.2 10.8 50 3.2 8.4 12.9 18.0 20.5 16.7 13.3 100 4.5 9.3 18.0 21.1 24.5 20.7 16.4 200 4.5 5.4 13.6 31.0 29.6 25.1 18.2 400 3.7 11.5 25.4 30.1 25.4 28.7 20.9 600 6.4 17.4 25.2 20.4 26.0 24.2 20.0
Mean 4.1 9.1
LSD (0.05) for nitrogen main effect
17.9 23.1 24.2 21.1
4.1
81
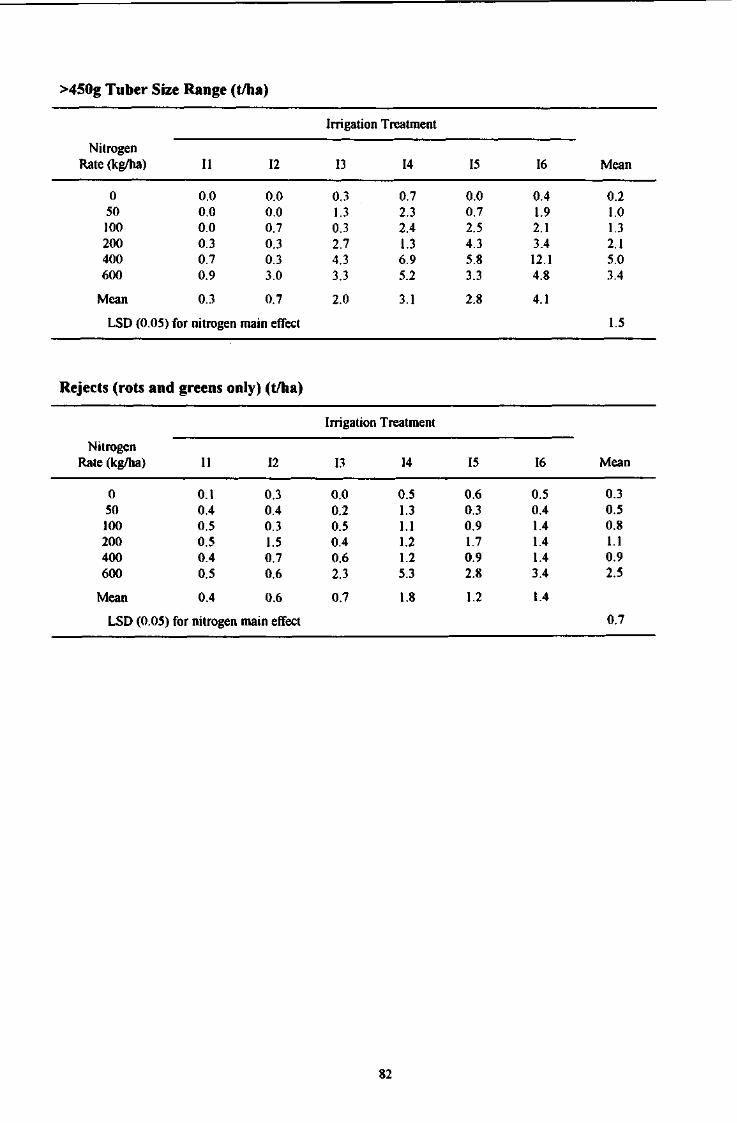
>450g Tuber Size Range (t/ha)
Irrigation Treatment
Nitrogen Rate (kg/ha) 11 12 13 14 15 16 Mean
0 0.0 0.0 0.3 0.7 0.0 0.4 0.2 50 0.0 0.0 1.3 2.3 0.7 1.9 1.0 100 0.0 0.7 0.3 2.4 2.5 2.1 1.3 200 0.3 0.3 2.7 1.3 4.3 3.4 2.1 400 0.7 0.3 4.3 6.9 5.8 12.1 5.0 600 0.9 3.0 3.3 5.2 3.3 4.8 3.4
Mean 0.3 0.7
LSD (0.05) for nitrogen main effect
2.0 3.1 2.8 4.1
1.5
Rejects (rots and greens only) (t/ha)
Irrigation Treatment
Nitrogen Rate (kg/ha) 11 12 13 14 15 16 Mean
0 0.1 0.3 0.0 0.5 0.6 0.5 0.3 50 0.4 0.4 0.2 1.3 0.3 0.4 0.5 100 0.5 0.3 0.5 1.1 0.9 1.4 0.8 200 0.5 1.5 0.4 1.2 1.7 1.4 1.1 400 0.4 0.7 0.6 1.2 0.9 1.4 0.9 600 0.5 0.6 2.3 5.3 2.8 3.4 2.5
Mean 0.4 0.6
LSD (0.05) for nitrogen main effect
0.7 1.8 1.2 1.4
0.7
82

6.2 EFFECT OF APPLYING IRRIGATION AT DIFFERENT LEVELS OF SOIL MOISTURE POTENTIAL ON THE YIELD AND QUALITY OF RUSSET BURBANK POTATOES (Experiment 90MC31)
Aim This preliminary experiment was designed to test the hypothesis that to achieve maximum yield and quality of Russet Burbank potatoes, the available soil moisture level needed to be maintained above 75%.
Materials and Methods Site details The experiment was conducted at the Manjimup Horticultural Research Centre (34° 18' S, 116°7' E). The soil was a gravelly loamy sand over mottled clay at 50-60 cm (Dy 3.11, Northcote, 1979). Some of the relevant soil physical characteristics are given in Table 1.
Table 1. Soil characteristics of experimental site1 (n=5).
% % % % % Bulk Field Wilting Avail. Depth Gravel Coarse Fine Silt Clay density Capacity Point Water (mm) Sand Sand (g/cm3) (%v/v) (%v/v) Capacity
(%v/v)
0-400 31.8 37.0 40.6 0.2 13.2 1.24 25.7 10.9 14.8 400-500 49.0 46.5 37.0 6.5 10.0 1.55 18.6 8.4 10.2 500-1000 29.2 29.1 39.8 7.8 24.0 1.59 25.2 12.4 12.8
1. gravel = >2mm, coarse sand = 2-0.2mm, fine sand = 0.2-0.02mm. silt = 0.02-0.002mm, clay = <0.002mm)
Experimental design and treatments The experiment consisted of a randomised block arrangement of 3 irrigation treatments replicated 4 times. Individual plots were 7.4 m long by 6 rows wide. Row spacing was 0.8 m. Plots were separated on all sides by a 5 m buffer that was allowed to return to natural pasture after the pre-planting cultivations. The treatments were based on soil water potential (SWP) measured at a depth of 30 cm below the top of the potato ridge using automatic Irrometer® tensiometers. Throughout the entire crop growth period, sufficient water was applied at each irrigation to return the soil to field capacity when the SWP reached -18, -26, or -50 kPa. These SWPs corresponded with available soil moisture levels in the top 60 cm of the profile of 80%, 72% and 53%, respectively.
Trial establishment Prior to the experiment the site used had been in a predominantly grass pasture for 8 years. Site preparation began 4 weeks before planting when the site was sprayed with paraquat + diquat (2 L/ha Sprayseed®). The site was cultivated 3 weeks before planting using a mould-board plough. A combination of fenamiphos (24 L/haNemacur 400®) and chlorpyriphos (6 L/ha Lorsban 500®), together with pre-planting fertilisers, were then incorporated with a rotary hoe. The pre-planting fertilisers consisted of 10 kg
83

magnesium/ha (MgS04.7H20) and a trace element mix containing 15 kg/ha CuS04, 7.5
kg/ha ZnO, 10 kg/ha MnS04 and 15 kg/ha Borax.
Prior to planting, 3000 kg/ha of Potato Manure E® fertiliser (3.5% N, 7% P, 6.6% K) was banded in twin rows to the side of and below seed piece placement level using a single row fertiliser applicator. Ridges were formed at the same time. The experiment was planted on 5 October 1990. Fourty five to 50 gram hand-cut seed pieces, which were dusted with tolclofos-methyl (2 kg/t Rizolex®), were hand planted into the preformed ridges at an in-row spacing of 0.35 m (35,700 plants/ha). The ridges were reformed 3 weeks after planting.
Irrigation The irrigation system was installed three weeks after planting. Individual plots were uniformly irrigated using a 3.0 m x 2.4 m arrangement of DAN 2001® (95 L/h) pressure regulated mini-sprinklers. Each sprinkler was fixed to a 1.0m stake which enabled them to be kept above the crop at all times. The water application rate was 8 mm/h. Separate electronic irrigation controllers were used to control the timing and amount of water applied to each treatment. When the average of the 4 automatic tensiometers in each treatment (one per replication) reached the desired SWP, an irrigation event was triggered. The amount of water applied to each plot was measured with raingauges which were emptied after each irrigation.
Irrigation treatments were imposed from the time of 50 % emergence (13 November 1990) and were terminated at the time of 50 % crop senescence in each treatment (~ 22 February 1991). Plants were considered to have emerged when one stem had visibly broken through the soil surface. Measurement of crop senescence was based on visual assessment of percent ground cover.
Soil moisture monitoring In addition to the tensiometer at a depth of 30 cm, a second tensiometer was installed in each plot at 50 cm. This tensiometer provided a check on the adequacy of water applications. In addition to the electronic monitoring, which did not record tensiometers readings, readings from all tensiometer were taken daily between 8.00 and 10.00 am. The soil moisture profile was measured periodically throughout the experiment using a neutron probe which had been calibrated on site. Total volumetric soil moisture (VSM) contents were calculated by integrating readings at depths of 20, 30, 40, 50, 60, 80 and 100 cm. This data provided a second check on the adequacy of water applications. Also, consumptive water use (CWU) was estimated for each treatment from the water balance:
CWU = VSM at emergence - VSM at harvest + applied irrigation + rainfall
Drainage below 100 cm was assumed to be negligible. Plots of the changes in soil water potential (SWP) in each treatment are shown in Figures 1, 2 and 3. Unfortunately, due to a system malfunction, at two consecutive irrigations during the critical tuber bulking period in the -50 kPa treatment, irrigation water was applied before the target SWP was reached (i.e. at -40 kPa instead of-50 kPa). As a result, this treatment did not experience as much stress as it otherwise may have done. (Note: -40 kPa is equivalent to -60% ASW).
84

Agronomic management A total of 150 kg nitrogen/ha was applied post-emergence in 2 equal applications: 220 kg NH4N03/ha on 13 November and 27 November 1991. Metribuzin (750 mL/ha Sencor 480 SC®) was applied one week after emergence for annual weed control. Preventative control of fungal leaf diseases was achieved with weekly applications of either chlorothalonil (2 L/ha Bravo®) or iprodione (2 L/ha Rovral®) which began six weeks after emergence. Permethrin (150 mL/ha Ambush®) was used to control green looper and potato tuber moth and methamidophos (700 mL/ha Nitofol®) was used for control of aphids and potato tuber moth when necessary.
Plant sampling Whole plant samples were taken from 0.7m sections of one row of each plot on 6 occasions during the crop growth period - 54, 68, 83, 96, 110 and 124 days after planting. The samples were washed and separated into tubers, stems and leaves + petioles. The fresh weight of tubers was recorded. Tubers were then diced and all samples were dried at 70°C in a forced draught oven for 48 hours. Sample dry weights were recorded.
Harvest and grading All plots were allowed to naturally senescence before harvest. 6 m lengths (17 plants) from three inside rows in each plot were harvested using a single row harvester on 10 March 1991. Tubers from each plot showing second growth were counted and weighed separately. Similarly, all tubers with any greening, rots or growth cracks were counted and weighed separately. The remaining tubers were counted and weighed into the following size categories: <100g, 100-250g, 250-450g and >450g. Processing grade tubers were >100g and free of any defects.
Tuber quality assessment Twenty tubers (>250g) from each plot were sliced longitudinally and inspected for hollow heart and other internal defects. Tuber specific gravity was measured on a 3.5 kg sample of 100-450g tubers from each plot using the weight in air - weight in water method (Redshaw and Fong, 1972).
Statistical analyses Data were analysed by analysis of variance using GENSTAT (GENSTAT 5 Committee 1987), and l.s.d.s (PO.05) calculated for comparison of treatment means.
Results
Water applied The number of irrigation events required to maintain the SWP above the preset levels decreased from 22 at -18 kPa to 8 at -50 kPa (Table 2). Similarly the total amount of irrigation water applied decreased as SWP decreased. Consumptive water use showed a similar trend. Insufficient replicate data was collected to determine whether the differences in CWU were statistically significant.
85

Table 2. Effect of irrigation treatments on the number of irrigation events , irrigation water applied and consumptive water use (CWU)
SWP treatment Number of Irrigation water CWU1
(-kPa) irrigations applied (mm)* (mm)
18 22 437 513 26 14 373 468 50 8 315 427
1. including 85 mm of rain
Yield and tuber quality The irrigation treatments had no significant (P<0.05) effect on any measured yield parameters (Table 3). In all treatments, 70% of processing grade tubers were in the 100-250 g weight range, with 27% weighing between 250 and 450 g. Less than 2% of all tubers weighed more than 450 g.
The proportion of all tubers with second growth increased from 14% in the -18 kPa treatment to 18% in the -50 kPa treatment, though the treatment effect was not significant.
The specific gravity of tubers was significantly (P<0.05) higher in the -50 kPa treatment than at -18 or -26 kPa.
For all treatments, the mean number of tubers per plant was 12, and the mean number of tubers per stem was 2.3.
No hollow heart was found in any tubers. Irrigating at -50 kPa resulted in a significantly (P<0.05) higher proportion of tubers with internal brown fleck (Anon 1986), compared with irrigating at higher SWPs.
Table 3. Effect of irrigation treatments on total and process yield, yield components and tuber specific gravity.
SWP (-kPa)
Total yield (1/ha)
Process yield (t/ha)
Yield in each tuber weight category (t/ha) SWP (-kPa)
Total yield (1/ha)
Process yield (t/ha)
0-100 g 100-250 g 250-450g >450g
18 26 50
l.s.d. (0.05)
56.8 52.3 57.3
ns
43.4 40.7 43.3
ns
8.5 9.1 8.4
ns
29.9 28.8 30.0
ns
12.3 10.9 12.2
ns
1.1 1.0 1.1
ns
Table 3. Cont'
SWP (-kPa)
Rejects (t/ha) Internal brown
fleck (%)
Specific gravity
SWP (-kPa) Second
growth Green Rots Cracks
Internal brown
fleck (%)
Specific gravity
18 26 50
l.s.d. (0.05)
7.9 7.7 10.5
ns
0.6 0.6 1.0
ns
0.05 0.07 0.13
ns
0.05 0 0
ns
3.0 6.4 8.9
4.1
1.08025 1.08025 1.08250
0.00150
86

Water use efficiency Water use efficiency (WUE, kg total tuber yield/mm consumptive water use) increased from 111 kg/mm in the -18 kPa treatment to 134 kg/mm in the -50 kPa treatment.
Plant growth As shown in Figures 1 - 4, there were no significant treatment effects on any of the measured plant growth components at any growth stage. Tuber dry matter percentage also increased throughout growth at the same rate in all treatments (Figure 5).
Discussion
Under the conditions in which this experiment was conducted, neither total nor processing tuber yield was reduced when the SWP was allowed to decrease to -50 kPa (i.e. 53% available soil moisture). Notwithstanding the problems experienced with the -50 kPa treatment, this result disproves our null hypothesis that yield would be reduced when ASW fell below 75%.
The reduction in the number of irrigation events and total irrigation water applied to the -50 kPa treatment, compared with irrigating at a higher SWP, represents a potential saving both in terms of labour and pumping costs. However, the significant increase in internal brown fleck caused by this treatment would likely lead to a small reduction in the dollar return per tonne of processing potatoes which may, in part, offset the irrigation cost savings.
200
150 I
+
I 50 -
40 60 80 100
Days after planting
140
Figure 1. Changes in leaf and petiole dry weight (g per sample) with time after planting in Russet Burbank potatoes when irrigated in response to three different soil moisture potentials. Data points are means of four replicates ± s.e.
87

'a
T3
E
200
_ 150
100 -
50 -
40 60 80 100
Days after planting
140
Figure 2. Changes in stem dry weight (g per sample) with time after planting in Russet Burbank potatoes when irrigated in response to three different soil moisture potentials. Data points are means of four replicates ± s.e.
4000
40 60 80 100
Days after planting
140
Figure 3. Changes in tuber fresh weight (g per sample) with time after planting in Russet Burbank potatoes when irrigated in response to three different soil moisture potentials. Data points are means of four replicates ± s.e.
88

1000
200 -
- • - -18 kPa 800 - - O - -26 kPa
s - * - -50 kPa
we 600
uber
dry
400
20 40 60 80 100
Days after planting
120 140
Figure 4. Changes in tuber dry weight (g per sample) with time after planting in Russet Burbank potatoes when irrigated in response to three different soil moisture potentials. Data points are means of four replicates ± s.e.
25
c 0)
o
I. 20 k . o> xs (0 E ^ 15 Urn 0) X I 3
10
-18kPa -26 kPa -50 kPa
_L _L J .
20 40 60 80 100
Days after planting
120 140
Figure 5. Changes in tuber dry matter percentage with time after planting in Russet Burbank potatoes when irrigated in response to three different soil moisture potentials. Data points are means of four replicates ± s.e.
89

When the SWP was allowed to decrease to -50 kPa between irrigations, up to 45 mm of water was required to return the soil profile to field capacity. In commercial practice, on paddocks with slopes exceeding 6%, which are common in the Manjimup-Pemberton area, such a large quantity of water applied in a single application using high impact sprinklers or high application rates may cause excessive runoff. To safely adopt such an irrigation schedule, the use of low impact sprinklers with a water application rate not exceeding 8 mm/hr may be required.
The water use efficiencies achieved in this experiment for Russet Burbank potatoes (111 to 134 kg/mm) are equivalent to those achieved in the work of Hane and Pumphrey (1984, 122 kg/ha) and of Martin etat. (1992, 108 kg/ha). However, Hane and Pumphrey found that maximum yield of Russet Burbank was associated with a CWU of between 625 and 650 mm. In the work of Martin et at., CWU of 678 mm was required for maximum yield. Maximum total yields achieved in both these studies exceeded 75 t/ha. By comparison, in our experiment, the maximum yield was only 57 t/ha with a CWU of between 427 and 513 mm. This difference in total yield can be partly explained by the shorter crop growth period (emergence to 50% senescence) in our work (100 days) compared with that in the work of Hane and Pumphrey (116 days) and Martin et at. (110 days). Increasing the total amount of nitrogen above the 255 kg N/ha applied in our experiment, may help extend the crop growth period and lead to higher total yields. Further investigation is required to determine the optimum nitrogen application level for Russet Burbank potatoes grown in the Manjimup-Pemberton area, and to examine the effect that increased nitrogen application levels have on crop irrigation requirements.
References
Hane, D.C. and Pumphrey, F.V. (1984). Yield-evapotranspiration relationships and seasonal crop coefficients for frequently irrigated potatoes. American Potato Journal 61,661-668.
Martin, R.J., Jamieson, P.D., Wilson, D.R. and Francis, G.S. (1992). Effects of soil moisture deficits on yield and quality of 'Russet Burbank' potatoes. New Zealand Journal of Crop and Horticultural Science 20, 1-9.
Northcote, K.H. (1979). 'A Factual Key for the Recognition of Australian Soils.' (Rellim Technical Publications, Glenside, South Australia)
90
6.3 DEFINING THE OPTIMUM SOIL WATER POTENTIAL REGIME FOR MAXIMUM YIELD AND QUALITY OF 'RUSSET BURBANK' POTATOES. (Experiments 91MC23 & 92MC22)
Summary
Field experiments were conducted in the 1991/92 and 1992/93 seasons in the lower south west of Western Australia to examine the effect of irrigating at different soil water potentials (SWP) (measured at 30 cm depth) on the yield and quality of Russet Burbank potatoes. The 1991/92 experiment consisted of four treatments which were irrigated at SWPs of-20, -35, -50 or -80 kPa throughout growth. Three similar treatments were imposed in the 1992/93 experiment with irrigation being applied at -20, -40 or -80 kPa. In the second experiment, 6 additional treatments examined the effects of irrigating at different SWPs during 3 growth stages (emergence to early tuber bulking, early bulking to late tuber bulking and late bulking to maturity - first, second and third growth stages, respectively). In both experiments, highest total and processing yields and lowest levels of tuber malformations were obtained by irrigating at a SWP of-20 kPa during all growth stages. However, in the 1992/93 experiment, allowing the SWP to decline to -40 kPa between irrigations during the second and third growth stages had no effect on yield or tuber quality. This latter regime did not result in any water saving, but reduced the total number of irrigation events from 26 to 18. Total yield was reduced by irrigating at -20, -40 and -80 kPa during the first, second and third growth stages, respectively. Both total and processing yields were reduced when irrigation was applied at -80 kPa during the second and third growth stages. Allowing the SWP to decrease to -80 kPa during the first growth stage, followed by irrigation at -20 kPa during later growth stages, had no effect on total or processing yields, but significantly increased the proportion of malformed tubers (malformed tubers were not removed from the processing grade). The proportion of tubers with second growth was not affected by irrigation treatments. In 1991/92, highest tuber specific gravity was achieved by irrigating at -35 kPa, while specific gravity was reduced by irrigating at -80 kPa. Tuber specific gravities were not significantly affected by irrigation treatments in 1992/93. Tuber yield increased linearly as consumptive water use (CWU) increased to 610 mm. Water use efficiency (kg total yield/mm CWU) was not affected by irrigation treatment and, for the highest yielding treatments, ranged between 140 and 152.
Introduction
Large scale production of French fries began in Western Australia in 1987, with the opening of a production plant at Manjimup, in the south west of the State. During the 1993/94 season, 35,000 tonnes of potatoes were processed through this plant. The preferred potato cultivar is 'Russet Burbank1 due to its consistently high dry matter content and large yield potential. However, local growers have had difficulty producing high processing yields of this cultivar using traditional cultural practices.
In Western Australia, irrigation is an essential component of potato production systems. Most growers currently irrigate their crops by experience based on a calender schedule or observations of the crop and soil. Very few growers use objective methods of irrigation scheduling such proportional replacement of Class A pan evaporation or direct measurement of soil moisture. Russet Burbank is well known for its high sensitivity to
91

moisture stress (Millar and Martin, 1987). Therefore, more objective irrigation scheduling guidelines for Russet Burbank potatoes are needed.
Tensiometers have been successfully used for irrigation scheduling in potatoes. Dubetz and Krogman (1973) compared the use of tensiometers for irrigation scheduling in potatoes with two other methods - irrigating when the crop first showed signs of moisture stress and an irrigation budget method designed to maintain at least 50% available soil moisture. They found that irrigating at a soil water potential (SWP) of -40 kPa gave significantly higher yields of Netted Gem potatoes compared with the other two methods. Jones and Johnson (1958) suggested that the best time to irrigate Sebago potatoes was when the SWP reached -30 kPa. Shimshi and Susnoshi (1985) found that the yields of five different potato cultivars was reduced when the SWP at the 30 cm depth dropped below -40 kPa. From a review of the available literature, Van Loon (1981) concluded that the optimum SWP for maximum yield was in the range between -20 kPa and -60 kPa, with the absolute optimum being dependent upon climate and plant and soil characters.
The impact of water stress on yield and quality depends on the timing and severity of the stress. Water stress during the period between planting and early tuber growth can reduce tuber numbers and yield (Slater and Goode, 1967; Jana el a/., 1989), increase the incidence of malformed tubers (Nichols and Ruf, 1967; van Loon, 1981) and reduce tuber cooking quality (Stark and McCann, 1992). Stress during mid tuber growth and crop maturation usually has a greater effect on yield than tuber quality (Millar and Martin, 1987; Martin el al., 1992). Larsen (1984) found that to avoid yield and quality losses in Russet Burbank potatoes, the available soil water level should be maintained above 65% throughout crop growth.
Aim The objective of the study reported here was to define the optimum soil water potential regime for Russet Burbank potatoes produced under Western Australian conditions.
Materials and methods
Site details Two experiments were conducted at the Manjimup Horticultural Research Centre (34° 18' S, 116°7 E), one in each of the 1991/92 and 1992/93 seasons. The soil was a gravelly loamy sand over mottled clay at 50-60 cm (Dy 3.11, Northcote, 1979). Some of the relevant soil physical characteristics are given in Table 1.
Experimental design and treatments Experiment 1 (91MC23) The first experiment (1991/92) consisted of a randomized block arrangement of 4 irrigation treatments replicated 3 times. The treatments were based on SWP measured at a depth of 30 cm below the top of the potato ridge using Irrometer® tensiometers. Throughout the entire crop growth period, sufficient water was applied at each irrigation to return the soil to field capacity when the SWP reached -20, -35, -50 or -80 kPa. These SWPs corresponded with available soil moisture levels in the top 60 cm of the profile of 78%, 64%, 53% and 40%, respectively (Fig. 1).
92

Table 1. Soil characteristics of experimental site1 (n=5).
% % % % % Bulk Field Wilting Avail. Depth Gravel Coarse Fine Silt Clay density Capacity Point Water (mm) Sand Sand (g/cm3) (%v/v) (%v/v) Capacity
(%v/v)
0-400 31.8 37.0 40.6 0.2 13.2 1.24 25.7 10.9 14.8 400-500 49.0 46.5 37.0 6.5 10.0 1.55 18.6 8.4 10.2 500-1000 29.2 29.1 39.8 7.8 24.0 1.59 25.2 12.4 12.8
gravel = >2mm, coarse sand = 2-0.2mm, fine sand:
<0.002mm) 0.2-0.02mm, silt = 0.02-0.002mm. clay =
110 u o 100 CO o, 90 CD i _
istu
80 o 5 70 o (/) 60 CD
labl
50 CO > <
40 ••-* c CD U 30 c CD Q. 20
10
0 10 20 30 40 50 60 70 80 90 100
Soil Moisture Potential at 30cm (- kPa)
Figure 1. Percent available soil moisture in the top 60 cm of the profile as a function of soil water potential measured at 30 cm depth. The equation of the fitted line is:
Y = 101 - 1.3X + 0.0066X2, R2 = 0.92
93

Experiment 2 (92MC22) The second experiment (1992/93) comprised a randomised block arrangement of nine irrigation treatments replicated four times. The treatments were based on SWP measured as in experiment 1, with irrigation being applied when the SWP reached -20 kPa, -40 kPa or -80 kPa. However, the SWPs at which irrigation events were triggered varied across three crop growth stages - planting to early tuber bulking (0-41 days after 50% emergence (DAE)), early tuber bulking to late bulking (42-81 DAE), and late tuber bulking to maturity (> 81 DAE). At 41 DAP the length of the longest tuber on plants in all treatments was between 40 and 50 mm. Details of the changes in SWP between these growth stages within each treatment are given in the tables. -40 kPa corresponded with an available soil moisture level of 60% in the top 60cm of the profile (Fig- 1).
Trial establishment Prior to each experiment the site used had been in a grass/clover pasture for five years. Site preparation began six weeks before planting when the sites were sprayed with glyphosate (3 L/ha Roundup®). The sites were cultivated four weeks before planting using a mould-board plough. Metham sodium (500 L/ha Vapam®) (1991/92) or a combination of fenamiphos (24 L/ha Nemacur 400®) and chlorpyriphos (6 L/ha Lorsban 500®) (1992/93), together with pre-planting fertilisers, were then incorporated with a rotary hoe. In Experiment 1, the pre-planting fertilisers consisted of 100 kg nitrogen/ha (NH4NO3), 50 kg potassium/ha (KCl), 10 kg magnesium/ha (MgS04.7H20) and a trace element mix containing 15 kg/ha CuS04, 7.5 kg/ha ZnO, 10 kg/ha MnS04 and 15 kg/ha Borax. In Experiment 2, the pre-planting fertilisers consisted of 70 kg nitrogen/ha (NH4NO3), 85 kg potassium/ha (K2SO4) plus the same levels of magnesium and trace elements as in Experiment 1.
In both experiments, individual plots were 7.5 m long by 6 rows wide. Row spacing was 0.8 m. Plots were separated on all sides by a 5 m buffer that was allowed to return to natural pasture after the initial cultivation. Experiment 1 was planted on 21 October, 1991 and Experiment 2 on 16 October, 1992. 50 g hand-cut seed pieces, which were dusted with tolclofos-methyl (2 kg/t Rizolex®), were planted at an in-row spacing of 0.35 m (35,700 plants/ha) by a single row tractor mounted planter/fertiliser applicator. At the same time, 3300 kg/ha of Potato E® fertiliser (3.5% N, 7% P, 6.6% K) was banded in twin rows to the side of and below the seed pieces. All plots were machine moulded one week after planting.
Irrigation The irrigation system was installed after final moulding. Individual plots were uniformly irrigated using a 3.0 m x 2.4 m arrangement of DAN 2001® (95 L/h) pressure regulated mini-sprinklers. Each sprinkler was fixed to a 1.0m stake which enabled them to be kept above the crop at all times. The water application rate was 10 mm/h. The amount of water applied to each plot was measured with raingauges which were emptied after each irrigation.
In each experiment, between planting and 50 % emergence, all treatments were uniformly irrigated to maintain adequate soil moisture levels. Irrigation treatments were imposed from the time of 50 % emergence and were terminated at the time of 50 % crop senescence. Plants were considered to have emerged when one stem had visibly broken
94

through the soil surface. Measurement of crop senescence was based on visual assessment of percent ground cover.
Soil moisture monitoring In addition to the tensiometer at a depth of 30 cm, a second tensiometer was installed in each plot at 50 - 60 cm. This tensiometer provided a check on the adequacy of water applications. All tensiometer readings were taken daily between 8.00 and 10.00 am. The soil moisture profile was measured periodically throughout each experiment using a neutron probe which had been calibrated on site. Total volumetric soil moisture (VSM) contents were calculated by integrating readings at depths of 20, 30, 40, 50, 60, 80 and 100 cm. This data provided a second check on the adequacy of water applications. Also, total consumptive water use (CWU) was estimated for each treatment from the water balance:
CWU = VSM at emergence - VSM at harvest + applied irrigation + rainfall
Drainage below 100 cm was assumed to be negligible, with the exception of 65 mm of rain received in a 36 hour period 2 days after first emergence in experiment 2. 26 mm of rain received during the day before this event had raised the soil water content to field capacity. Therefore, approximately 61 mm of the later rain was assumed to have drained through the profile and was not included in the calculation of CWU.
Agronomic management In experiment 1, a total of 250 kg nitrogen/ha was applied post-emergence as follows: 297 kg NH4N03/ha on 8 November 1991, 148 kg urea/ha on 29 November and 50 kg urea/ha on 23 December, 14 January 1992 and 3 February. In addition, 41.5 kg/ha of potassium (K2SO4) was applied on 23 December 1991. In experiment 2, a total of 245 kg nitrogen/ha and 76 kg potassium/ha was applied post-emergence as follows: 300 kg NRtNCVha on 24 November 1992, 200 kg urea/ha on 11 December, 200 kg KN03/ha on 24 December and 50 kg urea/ha on 12 January 1993.
Metribuzin (750 mL/ha Sencor 480 SC®) was applied two weeks after emergence for annual weed control. Preventative control of fungal leaf diseases was achieved with weekly applications of either chlorothalonil (2 L/ha Bravo®) or iprodione (2 L/ha Rovral®) which began six weeks after emergence. Permethrin (150 mL/ha Ambush®) was used to control green looper and potato tuber moth and methamidophos (700 mL/ha Nitofol®) was used for control of aphids and potato tuber moth when necessary.
Harvest and grading All plots were allowed to naturally senescence before harvest. 6 m lengths (17 plants) from three inside rows in each plot were harvested using a single row harvester on 25 March 1992 and 22 March 1993. Tubers from each plot showing second growth were counted and weighed seperately. Similarly, all tubers with any greening or rots were counted and weighed seperately. The remaining tubers were counted and weighed into the following size categories: <100g, 100-250g, 250-450g and >450g. Processing grade tubers were >100g and free of any defects. In experiment 2, processing grade tubers were further graded according to whether thay had growth constrictions at the basal (pointed stem-ends), centre (dumb-bells) or apical (bottlenecks) regions of the tuber. The proportion (wt./wt.) of processing grade tubers falling into each of these categories was recorded.
95

Tuber quality assessment Twenty tubers (>250g) from each plot were sliced longitudinally and inspected for hollow heart and other internal defects. Tuber specific gravity was measured on a 3.5 kg sample of 100-450g tubers from each plot using the weight in air - weight in water method (Redshaw and Fong, 1972). An additional sample of 10 tubers per plot were stored under ambient conditions for 2 weeks before the assessment of fry colour. For fry colour assessment, a single 13 mm French fry was cut longitudinally from the centre of the 10 tubers. These were then cooked in palm oil at 180°C for 2 minutes and 45 seconds. Immediately after cooking, fry colour was assessed using a USDA French Fry Colour Chart supplied by Edgell-Birds Eye, Manjimup. Also, the number of fries in each sample showing dark ends was recorded.
Statistical analyses Data were analysed by analysis of variance using GENSTAT (GENSTAT 5 Committee 1987), and l.s.d.s (P<0.05) calculated for comparison of treatment means.
Results
Crop growth In experiment 1, 50 % emergence was recorded 19 days after planting (DAP), while all plots were fully emerged by 25 DAP. Similarly, in experiment 2, 50 and 100 % emergence were recorded 20 and 26 DAP, respectively. In experiment 1, irrigation treatments had no effect on the time between planting and 50 % crop senescence (Table 2). Compared with irrigating at a SWP of-20 kPa, irrigating at -40 kPa or -80 kPa during all growth stages significantly (p<0.05) reduced the time betwen planting and 50 % senescence in experiment 2. Also, in experiment 2, the time between planting and 50 % senescence was reduced in treatments where the SWP was allowed to decrease to -80 kPa during the final crop growth stage, regardless of the SWP at which irrigation was triggered during the first two growth stages.
Irrigation and crop water use In experiment 1, the number of irrigations and the total amount of irrigation water applied decreased as the SWP decreased (Table 2). This same trend was evident in experiment 2 for treatments in which the SWP at which irrigation was triggered remained constant during all growth stages (treatments 5, 6 & 7). In experiment 2, compared with irrigating constantly at -20 kPa, decreasing the SWP to -40 or -80 kPa during one or more growth stages caused a reduction in the number of irrigations and the total amount of water applied.
96

Table 2. Number of days between planting and 50% senescence, number of irrigation events, total irrigation water applied and consumptive water use (CWU) for each treatment soil water potential (SWP) regime in experiments 1 and 2.
Treatment number
SWP regime
(0-41/42-81/>81)
No. of days (planting to
50% senescence) No. of
irrigations
Irrigation water
applied (mm) cwub
(mm)
Experiment 1 1 20/20/20 142 24 480 603 2 35/35/35 138 12 404 522 3 50/50/50 139 10 391 536 4 80/80/80 140 8 377 500
l.s.d (p<0.05) ns 29
Experiment 2 5 20/20/20 138 26 557 617 6 40/40/40 130 14 445 530 7 80/80/80 127 7 368 460 8 20/40/40 136 18 521 598 9 20/40/80 131 15 452 533 10 20/80/80 129 11 403 498 11 20/20/40 135 21 480 572 12 20/20/80 133 19 492 587 13 80/20/20 137 21 483 557
l.s.d (p<0.05) 4 28
a. Days after 50% emergence. b. Includes rainfall - 77 mm in experiment land 84 mm in experiment 2. In experiment 2, total
rainfall received between planting and 50% senescence was 146 mm. however, 61 mm was assumed to have drained below the crop root zone.
In the early stress treatment of experiment 2 (treatment 13), the targeted SWP of-80 kPa during the first growth stage was not reached until 40 DAE (i.e. the day before this treatment was reverted to being irrigated at -20 kPa for the remaining 2 growth stages). At 41 DAE, the largest tubers on plants in this treatment were around 40 mm long. Therefore, severe stress in this treatment occurred after the time of tuber initiation.
In both experiments, where the SWP at which irrigation was triggered remained the same during all growth stages, consumptive water use (CWU) tended to decrease as SWP decreased (Table 2). In experiment 1, irrigating at -20 kPa throughout growth resulted in significantly (p<0.05) higher CWU compared with irrigating at a lower SWP. Similarly, in experiment 2, irrigating at -20 kPa during all growth stages resulted in significantly (p<0.05) higher CWU than in all other treatments, with the exception of treatment 8, which was irrigated at -20 kPa between planting and early tuber growth and then at -40 kPa between early tuber growth and crop maturity.
Yield For treatments irrigated at the same SWP during all growth stages, irrigating at -20 kPa (treatment 1 & 5) produced the highest total and processing tuber yields in both experiments (Tables 3). In experiment 1, tuber yields were reduced when the SWP was reduced to -35 or -50 kPa, although the total and processing tuber yields at -50 kPa were not significantly different from those produced at -20 kPa. Irrigating at -80 kPa
97

throughout growth significantly (p<0.05) reduced total and process tuber yields in both experiments. These yield reductions were the result of reductions in both average tuber weight and/or tuber number per plant. Tuber numbers were not reduced in the early stress treatment in experiment 2 (treatment 13).
Table 3. Total tuber yield, process tuber yield (tubers >100 g), mean tuber weight for total tuber yield and process tuber yield, total tuber number per plant, percentage of total tubers with second growth, tuber specific gravity, and water use efficiency (WUE, kg total tuber yield/mm consumptive water use). Soil water potential (SWP) regimes as in Table 2.
Treatment SWP Yield (t/ha) Mean tuber (wt. Tuber no. Specific number regime Total Process Total Process /plant gravity WUE
Exp. 1 1 20/20/20 91.4 2 35/35/35 79.6 3 50/50/50 81.1 4 80/80/80 71.5
l.s.d 11.7 (p<0.05)
Exp. 2 5 20/20/20 86.1 6 40/40/40 73.4 7 80/80/80 65.5 8 20/40/40 84.4 9 20/40/80 72.1 10 20/80/80 70.7 11 20/20/40 82.4 12 20/20/80 78.6 13 80/20/20 78.7
l.s.d 10.8 (p<0.05)
In experiment 2, irrigating at -20 kPa during the first growth stage and then at -40 kPa thereafter (treatment 8), produced the same total and processing tuber yield as treatment 5 (Table 3). When the SWP was further decreased to -80 kPa during the third growth stage (treatment 9), or when irrigation was triggered at -80 kPa during both the second and third growth stages (treatment 10), total yield was significantly (p<0.05) reduced due to a reduction in average tuber weight. Processing tuber yield in treatments 9 and 10 was also reduced compared to treatments 5 and 8, but not significantly.
Irrigating at -20 kPa for the first two growth stages and then at -40 or -80 kPa during the last growth stage (treatments 11 and 12) had no affect on total or processing tuber yield. Irrigating at -80 kPa during the first growth stage and then at -20 kPa thereafter (treatment 13) also had not affect on yield.
78.7 197 230 13.1 1.076 152 67.8 197 230 11.4 1.079 152 70.2 195 231 11.7 1.077 151 60.5 178 210 11.3 1.072 147
9.5 ns 15 1.1 0.002 ns
73.2 234 289 9.8 1.082 126 57.1 215 261 9.2 1.083 129 52.7 197 247 8.8 1.078 136 71.6 221 274 10.4 1.084 127 62.4 197 250 9.5 1.082 124 61.3 197 248 9.5 1.081 135 72.8 217 259 10.1 1.084 127 67.9 218 268 9.6 1.087 122 63.3 219 278 9.7 1.082 128
11.9 22 18 ns ns 28
98

Within each experiment, relative tuber yields were calculated by dividing the mean total tuber yield for each treatment by the maximum mean total tuber yield. After combining the data from both experiments, we found that relative tuber yield increased linearly with increased CWU (Fig. 2). Given the high correlation between relative tuber yield and CWU, it is not surprising that water use efficiency was not affected by irrigation treatment in either experiment (Table 3).
105
100 h
r? 95 I-
' ^ 90 <D
1 85
.>
I 80
75
• Exp. 1 • Exp. 2
• / •
- •
• /
— J L_ I i 1 1 1
450 480 510 540 570 600
Consumptive water use (mm)
630
Figure 2. The relation of relative total tuber yield (Y) to consumptive water use (W). Combined data from both experiments. The equation of the fitted line is:
Y = 5.52 + 0.155W, R2 = 0.91
Tuber quality In experiment 1, irrigating at -35 kPa resulted in significantly (p<0.05) higher tuber specific gravity compared with other treatments (Tables 3 and 4). Irrigating at -80 kPa during all growth stages resulted in reduced tuber specific gravity in both experiments, though this effect was not significant in experiment 2. Decreasing the SWP to -80 kPa during the final growth stage, after irrigating at -20 kPa during the first two growth stages (treatment 12), tended to increase tuber specific gravity, though not significantly.
99
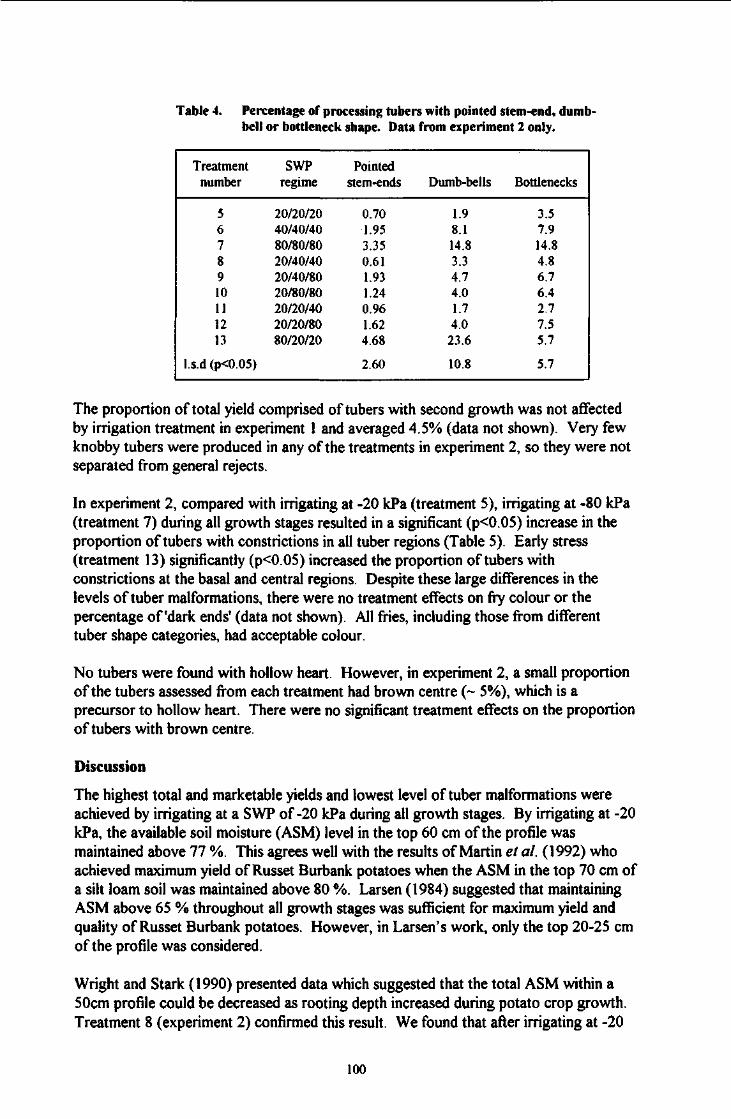
Table 4. Percentage of processing tubers with pointed stem-end, dumbbell or bottleneck shape. Data from experiment 2 only.
Treatment SWP Pointed number regime stem-ends Dumb-bells Bottlenecks
5 20/20/20 0.70 1.9 3.5 6 40/40/40 1.95 8.1 7.9 7 80/80/80 3.35 14.8 14.8 8 20/40/40 0.61 3.3 4.8 9 20/40/80 1.93 4.7 6.7 10 20/80/80 1.24 4.0 6.4 11 20/20/40 0.96 1.7 2.7 12 20/20/80 1.62 4.0 7.5 13 80/20/20 4.68 23.6 5.7
l.s.d (p<0.05) 2.60 10.8 5.7
The proportion of total yield comprised of tubers with second growth was not affected by irrigation treatment in experiment 1 and averaged 4.5% (data not shown). Very few knobby tubers were produced in any of the treatments in experiment 2, so they were not separated from general rejects.
In experiment 2, compared with irrigating at -20 kPa (treatment 5), irrigating at -80 kPa (treatment 7) during all growth stages resulted in a significant (p<0.05) increase in the proportion of tubers with constrictions in all tuber regions (Table 5). Early stress (treatment 13) significantly (p<0.05) increased the proportion of tubers with constrictions at the basal and central regions. Despite these large differences in the levels of tuber malformations, there were no treatment effects on fry colour or the percentage of'dark ends' (data not shown). All fries, including those from different tuber shape categories, had acceptable colour.
No tubers were found with hollow heart. However, in experiment 2, a small proportion of the tubers assessed from each treatment had brown centre (~ 5%), which is a precursor to hollow heart. There were no significant treatment effects on the proportion of tubers with brown centre.
Discussion
The highest total and marketable yields and lowest level of tuber malformations were achieved by irrigating at a SWP of-20 kPa during all growth stages. By irrigating at -20 kPa, the available soil moisture (ASM) level in the top 60 cm of the profile was maintained above 77 %. This agrees well with the results of Martin et al. (1992) who achieved maximum yield of Russet Burbank potatoes when the ASM in the top 70 cm of a silt loam soil was maintained above 80 %. Larsen (1984) suggested that maintaining ASM above 65 % throughout all growth stages was sufficient for maximum yield and quality of Russet Burbank potatoes. However, in Larsen's work, only the top 20-25 cm of the profile was considered.
Wright and Stark (1990) presented data which suggested that the total ASM within a 50cm profile could be decreased as rooting depth increased during potato crop growth. Treatment 8 (experiment 2) confirmed this result. We found that after irrigating at -20
100

kPa between emergence and early tuber growth, the SWP could be decreased to -40 kPa (ASM reduced from 77 to 61%) between early tuber growth and crop maturity without affecting tuber yield or quality. Compared to irrigating constantly at -20 kPa, the latter regime, while not resulting in any water saving, would simplify irrigation management for growers by reducing the required irrigation frequency.
If Russet Burbank potatoes are to be irrigated at a SWP of-40 kPa between early tuber growth and crop maturity, to avoid a yield reduction, it would appear to be important to maintain a higher SWP during the period between emergence and early tuber growth. When irrigation was triggered at -35 or -40 kPa during all growth stages, we found that both total and processing tuber yields were reduced. Water stress between emergence and early tuber growth has been shown to reduce root growth and leaf area development (Rab and Willatt, 1987). In our work, it is possible that scheduling irrigations at -35 or -40 kPa during this early growth stage caused sufficient moisture stress to reduce early root growth and leaf area. The crop may have then been unable to compensate for this early growth restriction when irrigation continued to be scheduled at these SWPs during later growth stages. In contrast, allowing the SWP to decrease to -80 kPa between emergence and early tuber growth, then irrigating at -20 kPa thereafter had no effect on final tuber yields. It is likely that early root and leaf growth was restricted in this treatment also. However, it would appear that any growth reduction caused by the early stress was not sufficient to reduce crop growth during the second and third growth stages when high SWPs were maintained. It is possible that some compensatory growth occurred in this treatment after the early stress was relieved. Krug and Wiese (1972) (cited by Van Loon 1981) showed that, compared to continuously high available soil moisture (ASM) levels, low ASM levels (30%) during the first 24 days after emergence, followed by high ASM levels (>80%) initially decreased leaf area, but later increased foliage weight, suggesting that some compensatory growth had occurred.
Previous studies have shown that water stress during early tuber bulking leads to increased percentages of malformed tubers (Robins and Domingo, 1956; Painter and Augustine, 1976). We found the same effect here in experiment 2 where the SWP in treatments 7 and 13 was allowed to decrease to -80 kPa during early tuber growth (tubers < 50 mm). The studies by Robins and Domingo, and Painter and Augustin, also support our finding that the percentage of tubers with malformations can be increased even if the early stress does not affect final tuber yield (treatment 13). We did not remove pointed stem-end, dumb-bell or bottleneck tubers from the processing yield category because Western Australian processors accept these tubers without penalty, provided they produce fries with acceptable colour. If Russet Burbank was marketed as a fresh potato in Western Australia the high proportion of malformations caused by early water stress would reduce saleable yields.
Despite the significant increase in the proportion of pointed stem-end and dumb-bell shaped tubers caused by allowing the SWP to decrease to -80 kPa during early tuber growth, stem-end fry colour was not affected. Variable effects of early water stress on fry colour have been reported. Iritani and Weller (1973) concluded that water stress during early tuber growth leads to an increased proportion of tubers that produce French fries with dark stem-ends. In contrast, Shock el al. (1992) found that the percentage of tubers that produce fries with dark stem-ends is reduced by water stress before and during tuber initiation. In our work, it is possible that the stress imposed in the early stress treatments was either not sufficiently intense or was not sustained for long enough
101

to affect stem-end fry colour. In the work of Shock et al., compared with frequently irrigated treatments, a soil water potential of < -60 kPa had to be maintained for a period of 20 days around the time of tuber initiation before a significant effect on fry colour was observed. In treatments 7 and 13 in our work, a soil water potential of < -60 kPa was never maintained for longer than 7 days.
Chung el al. (1988) and Martin et al. (1992) have found that second growth in Russet Burbank potatoes is not directly affected by irrigation management. The fact that the percentage of tubers with second growth was not affected by irrigation treatments in our work confirms their findings.
Smith (1975) suggested that tuber specific gravity could be increased by reducing irrigation late in the season. Our attempt to achieve this effect in experiment 2 failed. Allowing the SWP to decrease to -40 or -80 kPa between irrigations from 81 days after emergence until crop maturity (treatments 11 and 12), despite a slight upward trend at -80 kPa, had no significant effect on tuber specific gravity. While allowing the SWP to decrease below -80 kPa during this late growth stage may have resulted in a significant increase in specific gravity, final tuber yield may have been reduced. Given that commercially acceptable specific gravities (i.e. > 1.075) were achieved in all treatments in experiment 2, continued irrigation at a SWP above -40 kPa late in the season is suggested as the most appropriate strategy to ensure maximum yields and acceptable tuber quality.
Under the conditions in which these experiments were conducted, the relationship between relative tuber yield and consumptive water use (Fig. 2) suggests that maximum yield of Russet Burbank potatoes requires a consumptive water use of approximately 610 mm. Similar water use requirements for Russet Burbank have been reported elsewhere. For example, Hane and Pumphrey (1984) found that maximum yield of Russet Burbank grown in the Columbia Basin, Oregon, was associated with a consumptive water use of 625 to 650 mm. In New Zealand, maximum yield of Russet Burbank potatoes was associated with a consumptive water use of 678 mm (Martin et al. 1992). In contrast, due to higher tuber yields, the water use efficiencies of the highest yielding treatments in our work (140-152 kg tuber yield/mm) were higher than in the work of Hane and Pumphrey (122 kg/mm) or of Martin et al. (108 kg/mm). In a temperate climate, assuming an achievable yield of 100 t/ha, Burton (1989) suggested that a water use efficiency of approximately 180 kg/mm could be achieved, while in a hot, arid climate this would be reduced to around 120 kg/mm. Our results are consistent with the fact that the prevailing mild Mediterranean climate in the lower south west of Western Australia is medial between the temperate and arid climates discussed by Burton.
Conclusions
Maximum yield of Russet Burbank potatoes is associated with total consumptive water use of around 610 mm. Irrigating at a SWP of-20 kPa during all growth stages will ensure maximum yields and tuber quality of Russet Burbank potatoes. However, after the start of tuber growth, irrigation frequency can be reduced by allowing the SWP to decrease to -40 kPa between irrigations without affecting yield or tuber quality. Allowing the SWP to decrease to -80 kPa at the start of tuber growth will increase the proportion of malformed tubers.
102

References Dubetz, S. and Krogman, K.K. (1973). Comparisons of methods of scheduling irrigations of
potatoes. American Potato Journal 50, 408-414. Iritani, W.M. and Weller, L. (1973). The development of translucent end tubers. American
Potato Journal SO, 223-233. Jana, P.K., Sabyasachi Das, Mandal, B.B. and Bandyopadhyay. P. (1989). Effect of soil
moisture tension at different physiological stages of growth on yield and consumptive water use by potatoes. Environment & Ecology 7, 809-812.
Jones, ST. and Johnson, W.A. (1958). Effect of irrigation at different minimum levels of soil moisture and of imposed droughts on yield of onions and potatoes. Proceedings of the American Society of Horticultural Science 71, 440-445.
Larsen, D.C. (1984). Simplifying potato irrigation scheduling - the Idaho program. American Potato Journal 61, 215-227.
Martin. R.J., Jamieson, P.D., Wilson, D.R. and Francis, G.S. (1992). Effects of soil moisture deficits on yield and quality of 'Russet Burbank" potatoes. New Zealand Journal of Crop and Horticultural Science 20, 1-9.
Miller, D.E. and Martin, M.W. (1987). Effect of declining or interrupted irrigation on yield and quality of three potato cultivars grown on sandy soil. American Potato Journal 64. 109-117.
Nichols, D.F. and Ruf, R.H. Jnr. (1967). Relation between moisture stress and potato tuber development. Proceedings of the American Society of Horticultural Science 91, 443-447.
Northcote, K.H. (1979). 'A Factual Key for the Recognition of Australian Soils.' (Rellim Technical Publications, Glenside, South Australia)
Painter, C.G. and Augustin, J. (1976). The effect of soil moisture and nitrogen on yield and quality of the Russet Burbank potato. American Potato Journal 53, 275-284.
Rab, Abdur Md. and Willatt, ST. (1987). Water use by irrigated potatoes on a duplex soil. Australian Journal of Experimental Agriculture 27, 165-172.
Redshaw, E.S. and Fong, S.F. (1972). A specific gravity calculator. American Potato Journal 49,349-351.
Robins, J.S. and Domingo, C.E. (1956). Potato yield and tuber shape as affected by severe soil-moisture deficits and plant spacing. Agronomy Journal 48, 488-492.
Salter, P.J. and Goode, J.E. (1967). Crop responses to water at different stages of growth. Commonwealth Bureau Horticultural and Plantations Crops Research review no. 2. Famham Royal. C.A.B.
Shimshi, D. and Susnoshi, M. (1985). Growth and yield studies of potato development in a semi-arid region. 3. Effect of water stress and amounts of nitrogen top dressing on physiological indices and on tuber yield and quality of several cultivars. Potato Research 28, 177-191.
Shock, C.C., Zalewski, J.C, Stieber, T.D. and Burnett, D.S. (1992). Impact of early-season water deficits on Russet Burbank plant development, tuber yield and quality. American Potato Journal 69, 793-803.
Smidi, O. (1975). Effect of cultural and environmental conditions on potatoes for processing, p. 67-125. In W.F. Talburt and O. Smith (eds.) Potato Processing. 3rd Ed. The Avi Publishing Company, Westport, Connecticut.
Stark, J.C. and McCann, I.R. (1992). Optimal allocation of limited water supplies for Russet Burbank potatoes. American Potato Journal 69, 413-421.
van Loon, CD. (1981). The effect of water stress on potato growth, development, and yield. American Potato Journal 58, 51 -69.
Wright, J.L. and Stark, J.C (1990). Potato, p.859-888. In B.A. Stewart and D.R. Nielsen (eds.) Irrigation of Agricultural Crops. Agronomy Monograph no. 30, Madison, ASA, CSS A, and SSSA.
103

7.0 IMPACT OF POTATO TUBER GROWTH AROUND ACCESS TUBES ON SOIL WATER MEASUREMENT BY NEUTRON PROBE
M.A. Hegney andH.P. Hoffmann
Summary
Neutron probes have been widely used for water use studies and irrigation scheduling in potato crops. At about the time this project started, a commercial irrigation scheduling service based on the use of a neutron probe was initiated in the Manjimup-Pemberton area. The fact that potato tubers can contain more than 80% water and that they would develop in close proximity to any neutron probe access tubes installed in the potato ridge begged the question of whether their presence would affect estimations of soil water content made using a neutron probe.
The neutron method of measuring soil water content is based on the slowing-down by water of fast neutrons emitted by a radioactive source. The actual measurement is made by lowering a probe consisting of the radioactive source and a slow neutron detector to the required depth in a suitable access hole in the ground. Soil water content is calculated from the count rate of the slow neutrons and a calibration curve. Fast neutrons emitted from the probe are just as likely to be slowed-down by water contained in potato tubers within close proximity to access tubes as by water in soil pores.
The results reported here are from experiments designed to measure the possible effect of potato tuber growth on the estimates of soil water content by a neutron probe.
Major results
• Estimates of soil water content at 20 cm depth in the potato ridge by a neutron probe were found to be significantly affected by the presence of potato tubers. The neutron probe over-estimated the soil water content when potato tubers were present. The degree of over-estimation increased as tuber growth (fresh weight per length of row) increased and as the soil dried out. Under relatively dry soil conditions (ie. soil water potential of-65 kPa), as tuber fresh weight approached 1400 g per 30cm length of row, the over-estimation of soil water content by the neutron probe at 20 cm depth approached 9mm. At a soil water potential of-15 kPa, as tuber fresh weight approached 1400 g per 30cm length of row, the over-estimation of soil water content by the neutron probe at 20 cm depth approached 5mm. These are highly significant errors when considered in relation to the optimum total soil moisture depletions limits of 15 to 25 mm for some potato varieties.
• Estimates of soil water content by neutron probe at 30cm depth were not significantly affected by the presence of potato tubers in the ridge. Most tuber development occurred above this depth
Recommendations
If a neutron probe is used for irrigation scheduling in potato crops, estimates of soil water content at 20cm depth should be corrected according to the fresh weight of tubers per unit length of row. Alternatively, gravimetric measurements of soil water content should be made at depths less than 30cm, or tensiometers should be used in conjunction with, or in place of a neutron probe for irrigation scheduling.
104

7.1 IMPACT OF POTATO TUBER GROWTH AROUND ACCESS TUBES ON SOIL WATER MEASUREMENT BY NEUTRON P R O B E (Experiments 90MC26 & 91MC25)
Introduction Neutron probes have been widely used for water use studies and irrigation scheduling in crops of potato (Solanum tuberosum)(Shalhevet et al. 1983; Wolfe et al. 1983; MacKerron and Jeffereies 1985; Rab and Willatt 1987; Marshall and Gowers 1987). Access tubes are usually located between plants in the middle of planted ridges which have a flat top and are between 10 and 20 cm high. Due to inaccuracies caused by neutron loss close to the soil surface, measurements of soil moisture with the neutron probe generally begin at a depth of 20 cm below the top of the ridge. However, potato tubers develop mostly within the ridge and well within the zone of influence of neutron probe measurements at the 20 cm depth. The high water content of the tubers may moderate neutrons, resulting in an over-estimation of the soil water content at this depth, particularly in dry soil.
Two previous studies have examined the impact of potato water content on neutron probe measurements of soil water content. MacKerron and Jefferies (1987) in a laboratory study, developed correlations between neutron count ratios and volumetric soil water content, both within and between potato ridges, at depths of 10, 20, 30 and 40 cm. They concluded that there was no significant effect of tubers on soil water estimated by the neutron probe at any of these depths. In contrast, Foroud et al. (1993), in a field study, measured neutron count ratios and soil water contents within and between potato ridges throughout the normal growth of a crop. At the 20 cm depth, they found that the neutron count ratios within potato ridges were significantly higher than the neutron count ratios between the ridges, while the gravimetrically measured soil water contents tended to be lower in the ridges than between them. This suggested that the tubers did have an effect on the estimation of soil water content by the neutron probe at 20 cm depth. At 45 cm, the effect was inconsistent and at 75 cm there was no effect. As stated by Foroud et al., their study provided qualitative confirmation of the impact of potato tubers on neutron probe estimates of soil water content. However, if neutron probes are to be use to accurately measure soil water content in potato crops, relationships need to be developed which would allow neutron probe measurements to be corrected to take account of the water content of tubers around access tubes.
Aim The study reported here was conducted in the field to confirm the impact of potato tubers on the soil water content estimated by a neutron probe and to develop a possible means of quantifying the effect. We took a different approach to the studies by MacKerron and Jefferies (1987) and Foroud et al. (1993). We made the assumption that, while the water in potato tubers may affect the soil water content estimated by a neutron probe, it would have no effect on estimates of soil moisture tension made using tensiometers. Therefore, we tested the hypothesis that the relationship between volumetric soil moisture, measured by the neutron probe, and soil moisture tension, measured using tensiometers, would remain unchanged during the growth of a potato crop.
105

Materials and Methods Site details The study comprised 2 experiments conducted between November 1990 and April 1992 on the Manjimup Horticultural Research Centre (34° 18' S, 116°7' E). The soil was a loamy sand (84.7% sand, 10% gravel, 10% clay) with a bulk density of 1.35 (se ±0.065) g/cm3.
Experimental design and treatments The experiments involved potatoes in 1990/91 and potatoes and millet in 1991/92. Hand cut seed pieces of potato cultivar Delaware were planted 12-15 cm deep and 15 cm apart into 20 cm high ridges (basal width: 50-60 cm; dorsal width: 25-35 cm), 80 cm apart, on November 1, 1990 and December 26, 1991. The total potato plot area in both years was 60 m2 (6 rows, each 12.5 m long). On December 26, 1991, millet was hand seeded, 2 cm deep, on the top of ridges with the same proportions as for potatoes. The area of the millet plot was 30 m2 (6 rows, each 6.25 m long)
Aluminium access tubes, 1 m long, 50 mm external diameter and 3 mm wall thickness, were installed in all plots shortly after emergence, when individual plants could be clearly identified. The tubes were placed in the middle of the ridges. Six replicate access tubes were installed in the potato plots in both years, and 4 tubes in the millet plot in 1991/92. At the same time, tensiometers (Loktronic®, Irricrop Technologies Pty. Ltd., Narrabri, NSW, Australia) were placed in the top of the ridges at 20 cm distance from the access tubes and at 20 cm depth in 1990/91 and at 20 and 30 cm depth in 1991/92, for the determination of soil moisture tension (SMT) in centibars (cb).
Neutron probe (Model 503DR Hydroprobe, Campbell Pacific Nuclear, Pacheco, California, USA) and tensiometer readings were taken simultaneously during 4 drying cycles in 1990/91 and 3 drying cycles in 1991/92, where all crops were initially irrigated to field capacity and then allowed to dry out over a one to two week period.
Crop management All potato crop husbandry details were as described in experiments 90MC33 and 91MC21.
Except during the drying cycles, the crops were irrigated with 20 mm of water whenever the tensiometer reading at 20 cm depth was 20 cb, using overhead sprinkler systems. In 1991/92, the potato and millet plots were irrigated simultaneously.
The millet was cut down to 10-15 cm height on 2 occasions during the 1991/92 growing season, with the excess vegetative material being removed from the plot.
Tuber sampling Potato tuber samples were taken from a sampling row in the potato plots at 43, 63, 76, 90 and 119 days after planting (DAP) in 1990/91 and at 33, 47, 64, 78 and 106 DAP in 1991/92. On each sampling date two replicate samples were taken by inserting two metal sheets into the ridges 30 cm apart and perpendicular to the direction of the ridges. Each sample site was separated from a previous site by at least two plants. All tuber material, including parts of tubers that had been cut and were on the sampling side of the metal sheets
106

were dug by hand. The tuber samples were washed, surface dried and weighed for fresh weight determination. The samples were then diced and dried in a forced draught oven at 70°C. Tuber dry weight was recorded after weight loss ceased.
Data analysis Neutron count ratios (reading in soil/mean reading in water) were transformed into volumetric soil moisture (VSM) measurements using the following calibration equations -20 cm depth, V= -5.848+135.36T; 30 cm depth, Y= 2.114+59.3LY. These calibration equations had been determined previously in unplanted ridges. Previous water balance studies had shown best agreement between applied and measured irrigation water using these equations (unpublished data).
For each drying cycle," a linear function was fitted to the relationship between VSM and InSMT at each depth. To enable visual determination of differences between the relationships for each drying cycle, 95% confidence intervals were also plotted.
Quadratic equations were fitted to the relationship between time (days) after planting and tuber fresh weight.
Results and Discussion
Previous potato irrigation studies have shown that, for maximum yield of potatoes in the Manjimup-Pemberton area, the SMT should be maintained between 15 and 60 cb (see previous studies in this report). Therefore, it is within this approximate SMT range that any effect of tubers on estimates of VSM by the neutron probe will be most critical.
As shown in Figure 1, the relationship between VSM and SMT, at depths of both 20 and 30 cm, remained unchanged during the growth of a millet crop. This suggests that the growth of millet roots around access tubes, which was visually very dense at 20 cm depth, has not had any effect on estimates of soil moisture content by the neutron probe.
For potatoes, at the 30 cm depth, the relationship between VSM and SMT also remained unchanged during crop growth (Figure 2).
In contrast, in both of the experiments reported here, at 20 cm depth, the relationship between VSM and SMT changed during the growth of the potato crop (Figures 3 & 4). As crop growth proceeded, for a given SMT, the corresponding estimate of VSM increased. In both years, the increase in VSM at a given SMT increased as the soil dried out (i.e. SMT increased). This latter effect was more marked in 1991/92.
107

70
60
50
40 E E, 30
-•-( c
nte
20 o O t _ (D 50 CD
£
Soi
40
30
20
-20 cm
-* * * ^ s « 1
-
i
* s < 26/3-16/4 >V11/2-16/3
' 9/1-16/1
i
T ^
t
30 cm
i 1 i
T ''
i
11/2-16/3 26/3-16/4
i
****9/1-16/1
i
2 3 4 ln(Soil Moisture Tension)
Figure 1. Relationship between soil water content estimated by neutron probe and the natural logarithm of soil moisture tension, during three drying periods, at 20 and 30 cm depth in a 20 cm high ridge planted with millet For each drying period, fitted regression lines (solid) are shown together with the 95% confidence intervals (dotted). The equations of the fitted lines are:
SWC = 65.79 - 9.090 In(SMT), R2=0.97 (n=28)
SWC = 65.11-8.421ln(SMT), R2=0.92 (n=52)
SWC = 65.49 - 8.579 In(SMT), R2=0.85 (n=48)
SWC = 49.23 - 4.557 ln(SMT), R2=0.96 (n=28)
SWC - 52.21 - 5.729 In(SMT), R2=0.85 (n=52)
SWC - 51.38 - 5.251 In(SMT), R2=0.90 (n=48)
20 cm depth 9/1-16/1
11/2-16/3
26/3-16/4
30 cm depth 9/1-16/1
11/2-16/3
26/3-16/4
108

^ 40 E E, IE 35 CO *-^ C o U 30 £ "co
? 251-'o CO
20
11/3-31/3 9/1-16/1
1 2 3 4 Ln(Soil Moisture Tension)
11/2-21/2
Figure 2. Relationship between soil water content estimated by neutron probe and the natural logarithm of soil moisture tension, during three drying periods, at 30 cm depth in a 20 cm high ridge planted with potatoes. For each drying period, fitted regression lines (solid) are shown together with the 95% confidence intervals (dotted). The equations of the fitted lines are:
9/1-16/1
11/2-21/2
11/3-31/3
SWC = 39.22 - 3.922 In(SMT), R2=0.93 (n=42)
SWC = 37.81 - 3.308 In(SMT), R2=0.91 (n=66)
SWC = 38.37 - 3.755 In(SMT), R2=0.68 (n=72)
E
c c o o
£
o CO
•18/12-2/1
1 2 3 In (Soil MoistureTension)
Figure 3. Relationship between soil water content estimated by neutron probe and the natural logarithm of soil moisture tension, during three drying periods, at 20 cm depth in a 20 cm high ridge planted with potatoes in the 1990/91 season. For each drying period, fitted regression lines (solid) are shown together with the 95% confidence intervals (dotted). The equations of the fitted lines are:
SWC = 73.81 - 9.437 In(SMT), R2=0.80 (n=37)
SWC = 68.30 - 6.096 In(SMT), R2=0.84 (n=41)
18/12-2/1
8/1-17/1
22/1-8/2
13/2-25/2
SWC = 77.11 - 7.995 In(SMT), R2=0.80 (n=59)
SWC = 79.58 - 8.516 In(SMT), R2=0.84 (n=38)
109

CO
70
E E, 60 ** c <D C 50 o o l _
d) 40 (0
£
oil 30
20 _L
2 3 Ln (Soil Moisture Tension)
Figure 4. Relationship between soil water content estimated by neutron probe and the natural logarithm of soil moisture tension, during three drying periods, at 20 cm depth in a 20 cm high ridge planted with potatoes in the 1991/92 season. For each drying period, fitted regression lines (solid) are shown together with the 95% confidence intervals (dotted). The equations of the fitted lines are:
9/1-16/1
11/2-21/2
11/3-31/3
SWC = 39.22-3.922 In(SMT), R2=0.93 (n=42)
SWC = 37.81 - 3.308 In(SMT), R2=0.91 (n=66)
SWC = 38.37-3.755 In(SMT), R2=0.68 (n=72)
These data support the results of Foroud et al. (1993) who concluded from field studies that the presence of potato tubers in the ridge did impact on the estimation of VSM at 20 cm depth, but not at 45 or 75 cm depth.
From the relationships in Figures 3 and 4, and using the first drying cycle as a base line, the over-estimation (excess) of VSM at each successive drying cycle was determined at SMTs of 15 and 65 cb. As shown in Figures 5 and 6, the degree of over-estimation of VSM by the neutron probe increased as tuber growth increased. At a SMT of 15 cb, by 80 days after planting, the neutron probe was over-estimating the VSM at 20 cm depth by approximately 5 mm in both years. At a SMT of 65 cb, at 80 days after planting, the over-estimation of VSM was between 8.7 and 9.2 mm.
Over-estimation of VSM by between 5 and 9 mm would have a significant effect on irrigation scheduling in potatoes grown in the Manjimup-Pemberton area. Previous studies in this area have shown that the maximum allowable soil moisture depletion level, above which crop yield or quality is reduced, is typically between 20 and 35 mm. Over-estimating
HO
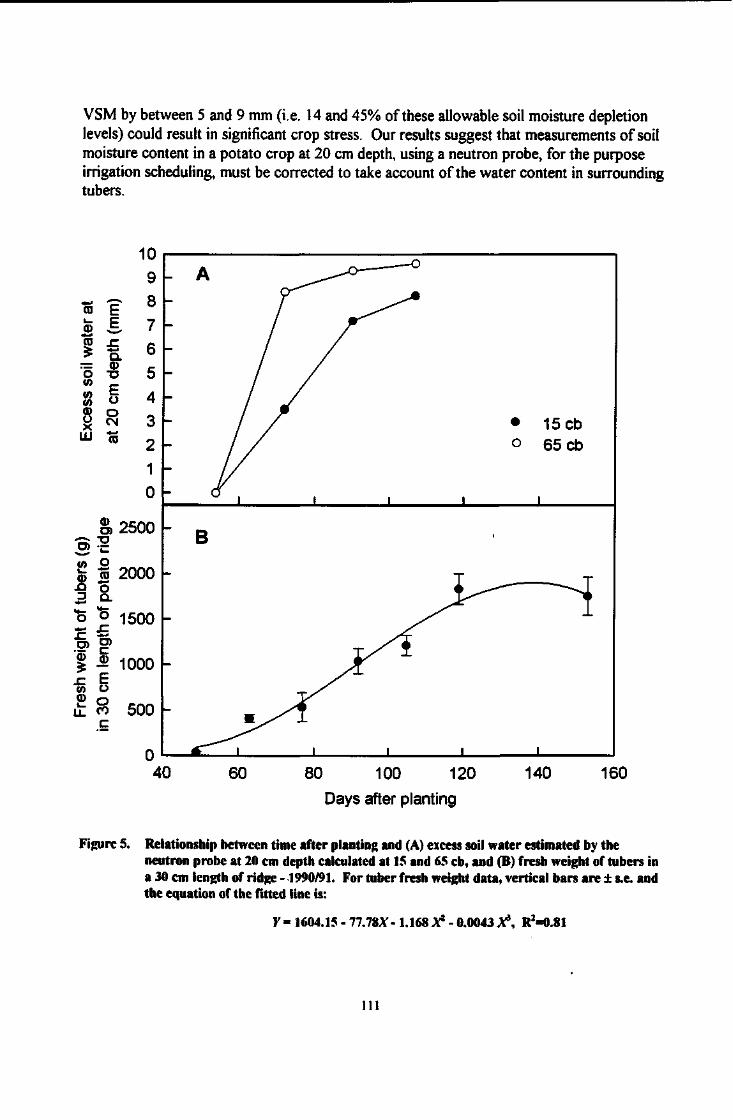
VSM by between 5 and 9 mm (i.e. 14 and 45% of these allowable soil moisture depletion levels) could result in significant crop stress. Our results suggest that measurements of soil moisture content in a potato crop at 20 cm depth, using a neutron probe, for the purpose irrigation scheduling, must be corrected to take account of the water content in surrounding tubers.
CD E © E, CO r £ Q.
"ZZT CD o • D
sss E o
CD o u X
CM UJ CO
S)2500
CO O
fc "to 2000
o o 1500 CD °>
i -2 1000 sz E w o 2 o
U_ CO
c
500 -
0 40 60 80 100 120
Days after planting 140 160
Figure S. Relationship between time after planting and (A) excess soil water estimated by the neutron probe at 20 cm depth calculated at 15 and 65 cb, and (B) fresh weight of tubers in a 30 cm length of ridge - 1990/91. For tuber fresh weight data, vertical bars are ± s.e. and the equation of the fitted line is:
Y = 1604.15 - 77.78X - 1.168 A* - 0.0043 A6, R2=0.81
111

10 9
ro i f 8 7
jo x: * D. fi
= CD O TJ 5
4 w E CO °
5 4
JD O O tN X 1-UJ To
3
2 1 0
8)2500 —» T3 D) C
CO 2
is 3 2000 JQ O 3 Q. * «•— o o 1500 ~ J= O) | >
$ -2 1000 OT O <D O
l i - « 500 C
0 20 40 60 80 100
Days after planting 120 140 160
Figure 6. Relationship between time after planting and (A) excess soil water estimated by the neutron probe at 20 cm depth calculated at IS and 65 cb, and (B) fresh weight of tubers in a 30 cm length of ridge -1991/92. For tuber fresh weight data, vertical bars are ± s.e. and the equation of the fitted line is:
Y = 1436.99 - 93.052AT - 1.760 A* - 0.00771 A*, R2=0.99
Given the apparent relationship between the degree of over-estimation of VSM and the fresh weight of tubers, it may be possible to correct VSM estimates made using a neutron probe by taking account of the weight of tubers present. By extrapolation of the data in
112
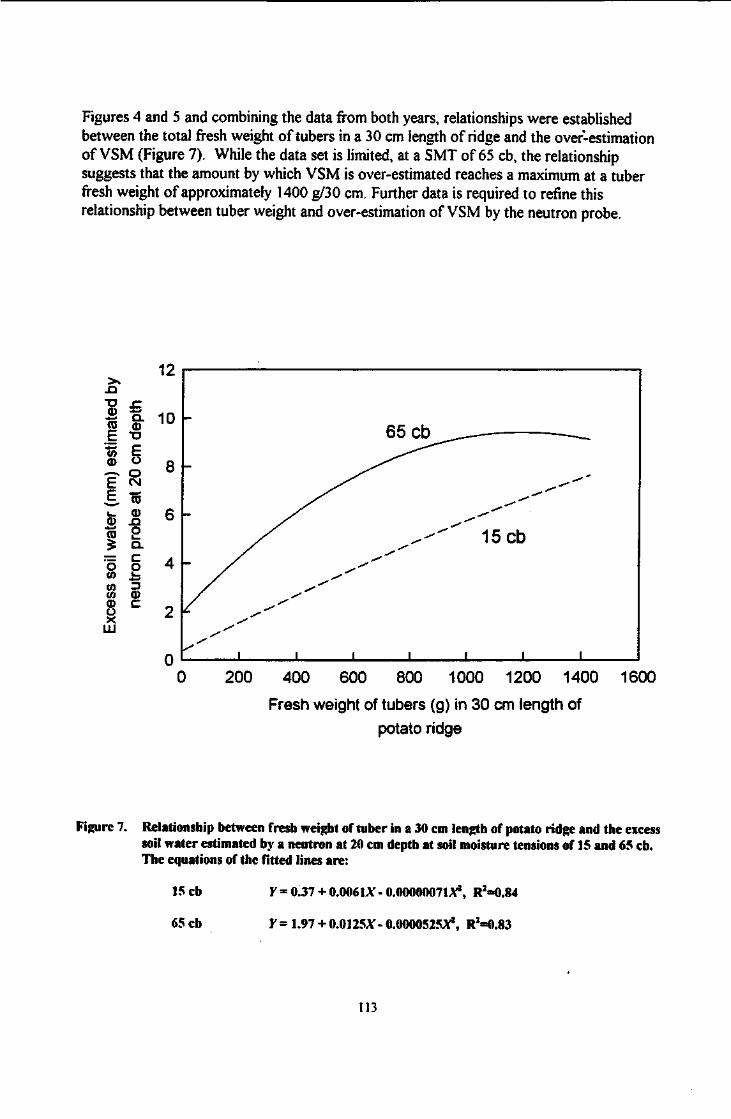
Figures 4 and 5 and combining the data from both years, relationships were established between the total fresh weight of tubers in a 30 cm length of ridge and the over-estimation of VSM (Figure 7). While the data set is limited, at a SMT of 65 cb, the relationship suggests that the amount by which VSM is over-estimated reaches a maximum at a tuber fresh weight of approximately 1400 g/30 cm. Further data is required to refine this relationship between tuber weight and over-estimation of VSM by the neutron probe.
12 > s
x> TJ r
ate
ept
10 h T3 ! - f—
to c a> " R *•—* O b CM E CD i _ CD 6 CD X> 6 CO O
£ Q. — C 4 o o 4 CO l _
(ft 13 CO CD d) C O V X
LU
200 400 600 800 1000 1200 1400
Fresh weight of tubers (g) in 30 cm length of
potato ridge
1600
Figure 7. Relationship between fresh weight of tuber in a 30 cm length of potato ridge and the excess soil water estimated by a neutron at 20 cm depth at soil moisture tensions of 15 and 65 cb. The equations of the fitted lines are:
15 cb
65 cb
Y = 0.37 + 0.0061AT - 0.00000071A*, R2=0.84
Y = 1.97 + 0.0125.Y- 0.0000525A*, R2=0.83
113

References
Foroud, N., Lynch, D.R. and Entz, T. (1993). Potato water content impact on soil moisture measurement by neutron probe. Plant and Soil 148, 101-106.
MacKerron, D.K.L. and JefFeries, R.A. (1985). Observations on the effects of relief of late water stress in potato. Potato Research 28, 349-359.
MacKerron, D.K.L. and Jefferies, R.A. (1987). Access tube location within a simulated potato crop and the measurement of soil moisture with a neutron probe. Plant and Soil 102, 253-255.
Marshall, D.J. and Gowers, A.F. (1987). Development of an irrigation scheduling service for potatoes. Technical Report Series No. 144, Department of Agriculture and Rural Affairs, Victoria.
Rab, Md Abdur and Willatt, ST. (1987). Water use by irrigated potatoes on a duplex soil. Australian Journal of Experimental Agriculture 27, 165-172.
Shalhevet, J., Shimshi, D. and Meir, T. (1983). Potato irrigation requirements ina hot climate using sprinkler and drip methods. Agronomy Journal 75, 16-17.
Wolfe, D.W., Fereres, E. and Voss, R.E. (1983). Growth and yield response of two potato cultivars to various levels of applied water. Irrigation Science 3,211-222.
114