psychometric qualities of the ucla loneliness scale ... · the social provision scale (sps) was...
TRANSCRIPT

PSYCHOMETRIC QUALITIES OF THE UCLA LONELINESSSCALE-VERSION 3 AS APPLIED IN A TURKISH CULTURE
Mithat DurakEmre Senol-Durak
Department of Psychology, Abant Izzet Baysal University, Bolu, Turkey
The University of California, Los Angeles, Loneliness Scale-Version 3(UCLA LS3) is the most frequently used loneliness assessment tool. Thisstudy aimed to examine the psychometric properties of the UCLA LS3 byutilizing two separate and independent samples: Turkish universitystudents (n¼ 481) and elderly (n¼ 284). The results demonstrate thatthe 3-factor model reveals significant results in both samples in termsof goodness of fit indices in confirmatory factor analysis. In addition tosatisfactory reliability, the concurrent and discriminant validity of thescale were supported in both samples by revealing the association of theUCLA LS3 with conceptually related measures (i.e., social support, socialprovision, depression, positive affect, negative affect, and self esteem inthe sample of university students; geriatric depression, self esteem andlife satisfaction in the sample of elderly) and the unrelated measure(i.e., social desirability). In addition to examining the psychometricproperties of the UCLA LS3, the present study adds to the present litera-ture about loneliness, shedding light on a non-western culture.
Loneliness is described as a state of emotional distress due toincongruity between actual and desired levels of social interaction(Peplau & Perlman, 1982). Moreover, it is explained as a lack ofmeaningful social relationships (Fees, Martin, & Poon, 1999). Ithas been associated with family communication, social activities(Morahan-Martin & Schumacher, 2003), life satisfaction (Civitci &Civitci, 2009), self esteem (Cacioppo, Hawkley et al., 2006; Civitci& Civitci, 2009), social support, social skills, and positive mood
Address correspondence to Mithat Durak, Department of Psychology, Abant Izzet Baysal
University, Golkoy, 14280, Bolu, Turkey. E-mail: [email protected]
Educational Gerontology, 36: 988–1007, 2010
Copyright # Taylor & Francis Group, LLC
ISSN: 0360-1277 print=1521-0472 online
DOI: 10.1080/03601271003756628
988

(Cacioppo, Hawkley et al., 2006) in low degrees, but on the otherhand, negative mood, anxiety, anger (Cacioppo, Hawkley et al.,2006) and depression (Cacioppo, Hughes, Waite, Hawkley, &Thisted, 2006) in high degrees. Moreover, loneliness has been foundto be related to health outcomes such as increment in hypertension(Cacioppo et al., 2002), inefficiency in sleep (Cacioppo & Hawkley,2003) and poor perceived health (Theeke, 2009).
On the basis of demographic variables, individuals who are married(Allen & Oshagan, 1995), women (Allen & Oshagan, 1995), in lowerincome (Allen & Oshagan, 1995; Hector-Taylor & Adams, 1996) andless educated (Allen & Oshagan, 1995; Hector-Taylor & Adams, 1996)had higher scores of loneliness than their counterparts. However, whilemarital status predicted the loneliness scores of the elderly individuals inanother study, age and gender did not predict the loneliness scores(Theeke, 2009). In the Turkish samples, there are controversial findingsdepending on the sample characteristics. For instance, while male uni-versity students reported higher levels of loneliness, females stated theybuilt relations with friends with ease (Durmusoglu Saltalu, Ozturk, &Samur, 2009). In contrast, while female prisoners had high lonelinessscores, male prisoners had low loneliness scores (Ozkurkcugil, 1998).
Loneliness has been investigated in the current literature on thebasis of such studies as the above mentioned ones, and several newscales have been devised to evaluate it. The NYU Loneliness Scale(Rubenstein & Shaver, 1982); Social and Emotional Loneliness Scalefor Adults (DiTommaso & Spinner, 1993); Loneliness RatingScale (Scalise, Ginter, & Gerstein, 1984); and Differential LonelinessScale (Schmidt & Sermat, 1983) are some of the measures assessingloneliness. Among these measures, the University of California, LosAngeles, Loneliness Scale (UCLA LS) (Russell, Peplau, & Cutrona,1980; Russell, Peplau, & Ferguson, 1978) is the most frequentlyused scale in countries that range from Denmark (Lasgaard, 2007);Argentina (Sacchi & Richaud de Minzi, 1997); South Africa(Pretoirus, 1993); Taiwan (Wu & Yao, 2008) to Turkey (Demir,1989). When the psychometric properties of the scale were tested withTurkish depressive and healthy individuals, the internal consistency(.96) and test-retest reliability (.94 for one-month interval) findingsreveal significant results (Demir, 1989). The scale is used to evaluateloneliness of different healthy samples such as adolescents (Civitci &Civitci, 2009; Lasgaard, 2007; Mahon, Yarcheski, & Yarcheski,2004); undergraduate students (Durmusoglu Saltalu et al., 2009;Morahan-Martin & Schumacher, 2003;Wu&Yao, 2008); older adults(Fees et al., 1999; Theeke, 2009) as well as unhealthy individuals withopiate dependency (Britton & Conner, 2007) and elderly individuals
Loneliness Scale 989

with cerebral palsy (Balandin, Berg, & Waller, 2006). The scale hassatisfactory internal consistency and unidimensional factor structure(Russell et al., 1980).
The original version is criticized in that wording all items negativelycauses systematic bias in responding to the items (Russell, 1996).Moreover, high correlations between depression, self esteem, and lone-liness endanger the discriminant validity (Russell, 1996). In addition tothese criticisms, debates related to multidimensionality of loneliness(Goossens et al., 2009) decrease the popularity of the original versionof the scale. Due to these problems associated with the UCLA LS, thedevelopers revised the scale. The revised UCLA LS consists of 10negatively and 10 positively worded items (Russell et al., 1980). Thisversion had satisfactory discriminant validity with the measures ofpersonality, social desirability, and depression (Russell et al., 1980).Additionally, the scale’s 1-factorial (Pretoirus, 1993); 2-factorial (posi-tive and negative items, Mahon, Yarcheski, & Yarcheski, 1995); and3-factorial structure (intimate others, social others, and afilliativeenvironment, McWhirter, 1990; isolation, relational connectedness,collective connectedness, Dussault, Fernet, Austin, & Leroux, 2009)were tested in a wide variety of studies. Hartshorne (1993) comparedthe 1-factorial, 2-factorial, and 3-factorial structure of the revisedUCLA LS. He found that the 2-factorial solution revealed betterresults than the other factorials structures on the basis of confirmatoryfactorial analysis. Conversely, Dussault et al. (2009) found that the3-factorial solution had better goodness of fit indices rather than the1-factorial and the 2-factorial solution.
However, the double negative items in this revised version of UCLALS are also criticized for having lower clarity (Russell, 1996). This clar-ity problem affects the responses of the elderly individuals (Russell,1996). In addition to the clarity problem, some wordings (i.e., my socialrelationships are ‘‘superficial’’) of the items are not understood by thecollege students (Russell, 1996). While considering all problems in theoriginal as well as the revised version of the scale, Russell (1996)developed the UCLA Loneliness Scale-Version 3 (UCLA LS3) con-sisting of 9 positively and 11 negatively worded items. He changedthe response format of the items by adding ‘‘how often do you feel’’at the beginning of the each item. The internal consistency andtest-retest reliability results were satisfactory (Britton & Conner,2007; Russell, 1996). Moreover, the internal consistency of the scalewas invariant across gender, race, ethnicity, and education with theindividuals suffering from opiate dependency (Britton & Conner,2007). In addition to reliability, the factorial structure of the scalewas tested in a wide variety of studies. For instance, Russell (1996)
990 M. Durak and E. Senol-Durak

compared a 2-factor model, a 1-factor model (that were found in theearlier versions of the scale), and a 3-factor model (global factor, nega-tive items, and positive items). He found the 3-factor model as the mostrelevant one on the basis of goodness of fit indexes of the confirmatoryfactor analysis. However, in the Danish culture, a unidimensionalstructure was found in a sample of adolescents (Lasgaard, 2007) dueto the characteristics of the sample. In addition to factorial structure,the scale had a satisfactory concurrent validity with the other measuresevaluating loneliness (NYU Loneliness Scale and the DifferentialLoneliness Scale) and discriminant validity with the other measuresevaluating social support and social desirability in the sample of collegestudents (Russell, 1996). In the Danish version, the correlation betweenloneliness and depression or between loneliness and self esteemwas sat-isfactory as evidence for convergent validity (Lasgaard, 2007).
Psychometric properties of the previous version of UCLA LS weretested by Demir (1989). However, other versions of the scale have notbeen examined psychometrically in Turkish samples. Adaptation ofthe scale to Turkish culture can provide a deeper understanding. Thepurpose of the present study is to investigate the psychometric proper-ties of the UCLA LS3 in the Turkish culture using two different sam-ples: university students aged between 18 and 28 and elderly membersof the society aged between 60 and 79. (Throughout the manuscript,these samples are referred to university students and elderly for clarity.)This study includes two phases in which the factor structure of the scaleis examined along with its internal consistency and a range of item-totalcorrelation coefficients. Moreover, the concurrent validity is studied byexamining the correlation between the UCLA LS3 and social support,social provision, depression, positive affect, negative affect, and selfesteem in the sample of university students; by examining the corre-lation between the UCLA LS3 and geriatric depression, self-esteemand life satisfaction in the sample of elderly. Futhermore, the discrimi-nant validity of the scale is studied by examining the correlationbetween the UCLA LS3 and social desirability. The reliability and val-idity coefficients of the UCLA LS3 are examined in a sample of univer-sity students in the first study and in a sample of elderly in the second.
STUDY I
Participants
The sample of the study was composed of 478 students, 291 females(60.9%) and 187 males (39.1%). Their ages ranged between 18 and
Loneliness Scale 991

28 (M¼ 21.57, SD¼ 1.92). Approximately, 14.4% of the subjects werepreparatory (n¼ 69), 11.1% were freshmen (n¼ 53), 16.7% weresophomores (n¼ 80), 28.5% were juniors (n¼ 136), 29.1% were seniors(n¼ 89) and 0.2% were master degree students (n¼ 1). (Turkish under-graduate students undergo a study cycle of four years.) The mean ofmonthly family income was 1746.16 Turkish Liras (TL) (1164.11USD) (SD¼ 4610.76 TL or 3073.84 USD), ranging from 400 TL to100000 TL (266.67 USD to 6666.6 USD). (Their education is fundedby their families. The majority of students work neither full-time norpart-time.) On the basis of residence, 41.2% of the subjects were livingin a flat with their friends (n¼ 197), 27% were living in a universitydormitory (n¼ 129), 21.5% were living in a private dormitory(n¼ 103), 7.9% were living with their families (n¼ 38), 2.1% were liv-ing in a flat alone, and 0.2% were living with their relatives (n¼ 1). Themean of the perceived health status of the participants was 3.87(SD¼ 0.91), ranging from 1(very bad) to 5 (very good).
Measures
In addition to the Demographic Information Form, seven measureswere employed in the sample of university students.
The UCLA Loneliness Scale (Version 3) was developed by Russell(1996) to evaluate loneliness. The scale consists of 20 items (9 posi-tively worded and 11 negatively worded) rated on a four-point Likertscale. Their internal consistencies ranged between .89 and .94 in thesample of college students, nurses, teachers, and the elderly.Test-retest reliability over a one-year period was .73 in the sampleof the elderly. The 3-factor model was found relevant on the basisof goodness of fit indexes of the confirmatory factor analysis. Theconcurrent validity of the scale was proved when the correlationbetween the scale and other loneliness measures (NYU LonelinessScale and the Differential Loneliness Scale) was examined. The scalehad satisfactory concurrent validity when correlation between thescale and other loneliness measures (NYU Loneliness Scale and theDifferential Loneliness Scale). On the other hand, the discriminantvalidity of the scale was shown to be unrelated with social support(Social Provisions Scale) and social desirability in the sample ofcollege students. Additionally, the scale was significantly correlatedwith the measures of well-being (life satisfaction and depression) inthe sample of the elderly.
The Social Provision Scale (SPS) was developed by Cutrona andRussell (1987) in order to evaluate the perceived availability of socialsupport. The scale consists of 24 items rated on a four-point Likert
992 M. Durak and E. Senol-Durak

scale and comprises of six dimensions including attachment, socialintegration, reassurance of worth, reliable alliance, guidance, andopportunity for nurturance. The internal consistency was .84, andtest-retest reliability coefficients ranged between .37 and .66. Duruand Balkıs (2007) adapted the scale into Turkish. They found theinternal consistency to be .90, and the test-retest reliability to be.75 over a one-month period.
The Multidimensional Scale of Perceived Social Support (MSPSS)was developed by Zimet, Dahlem, Zimet, and Farley (1988) tomeasure a person’s perception of the adequacy of social support fromfriends, family and significant others. It is a 12-item self-reportinstrument rated on a seven-point Likert type scale. The Turkishadaptation of the scale revealed a 3-factor structure and highreliability (Eker & Arkar, 1995).
The Beck Depression Inventory (BDI) was developed by Beck,Ward, Mendelson, Mock, and Erbaugh in 1961 in order to evaluateemotional, motivational and cognitive symptoms of depression with21 items rated on a four-point Likert-type scale (0¼ having nodepressive symptoms; 3¼ having severe depressive symptoms;minimum score¼ 0, maximum score¼ 63). The scale was adapted toTurkish by Hisli (1988), who found the split-half reliability was .74,and the correlation between BDI and Minnesota Multiphasic Person-ality Inventory’s Depression subscale was .63 for convergent validity.
The Positive and Negative Affect Scale (PANAS) was developed byWatson, Clark, and Tellegen (1988) in order to evaluate positive andnegative affect with 20 items rated on a five-point Likert-type scale. InPANAS, the scale includes 10 items evaluating positive affect (PA)and 10 other items evaluating negative affect (NA). The internalconsistency estimates for the PANAS measuring mood across sevendifferent time periods (a day to a year) ranged between .84 and .87for the NA scale. Gencoz (2000) examined the psychometric proper-ties of the Turkish version of the scale. She found the internal consist-ency reliability was .83 and .86 and the test-retest reliability was .40and .54, for PA and NA, respectively.
The Rosenberg Self-Esteem Scale (RSES) was developed byRosenberg in 1965 in order to assess the degree of self esteem with10 items rated on a four-point Likert-type scale. The internal consist-ency of the scale was found as .88 and the test-retest reliability of thescale over a one-week interval was found to be .82 in another research(Fleming & Courtney, 1984). The scale was adapted into Turkish byCuhadaroglu (1986), who used a five-point Likert-type scale. Shefound the internal consistency was .76. Also, the RSES correlationbetween the subscales of Symptom Check List-90 was satisfactory
Loneliness Scale 993

(depression subscale¼ .66, psychosomatic symptoms subscale¼ .70,and interpersonal threat subscale¼ .45).
The Social Desirability Scale-17 (SDS-17) was developed by Stober(2001) in order to evaluate socially desirable responses with 17 items(e.g., ‘‘I never hesitate to help someone in case of emergency’’ or ‘‘Intraffic I am always polite and considerate of others’’). Higher scoresobtained by the scale demonstrate the ability to portray oneself in apositive manner. The scale was translated into Turkish by Durak andCoskun (2010). Unlike the original scale of Stober (2001), they pre-ferred a five-point Likert type scale instead of a yes-no format. Theyalso excluded two items which had lower item total correlations;therefore, they turn it into a scale that has 15 items. In the presentstudy, the internal consistency of the scale was found to be .77, andthe corrected item-total correlations ranged between .24 and .54. Thisscale was used in the present study because social desirability isconceptually distinct from the constructs of the UCLA LS.
Procedure
Before collecting the data, the items of the UCLA LS3 were trans-lated into Turkish by three independent native English-speakingtranslators fluent in Turkish. The items were then reviewed with threenative, Turkish-speaking psychologists fluent in English to check foraccuracy. Any discrepancies were discussed carefully by the threetranslators and three psychologists and then resolved by jointagreement.
The scales were distributed to the university students in a class-room setting. All subjects were informed about the aim of the presentstudy, and their consent was obtained. All participants took partvoluntarily and were not remunerated for participation.
RESULTS
Confirmatory Factor Analysis
In order to examine the adequacy of the1-factor, 2-factor model, and3-factor model of the UCLA LS3 as mentioned by Russell (1996),confirmatory factor analysis was conducted. Russell (1996) testedthe 1-factor, 2-factor (positively worded items=nonloneliness andnegatively worded items=loneliness) and 3-factor (loneliness, nonlo-neliness and global loneliness) multidimensionality of the scale. Inthe present study, these factor structures were tested to evaluate
994 M. Durak and E. Senol-Durak
factorial structure of the scale with Turkish individuals. In order toexamine the model fit, the incremental fit index (IFI), comparativefit index (CFI), Tucker–Lewis index (TLI), and relative fit index(RFI) were handled. These indexes range from .00 to 1.00, and largervalues indicate better model fit. As evidence of good model fit, valuesof .90 or greater are desired (Bentler & Bonett, 1980). In addition tothese indexes, smaller root-mean-square error of approximation(RMSEA) is used. Furthermore, the ratio of v2 to degrees of freedom(df) should be less than three (Kline, 2005).
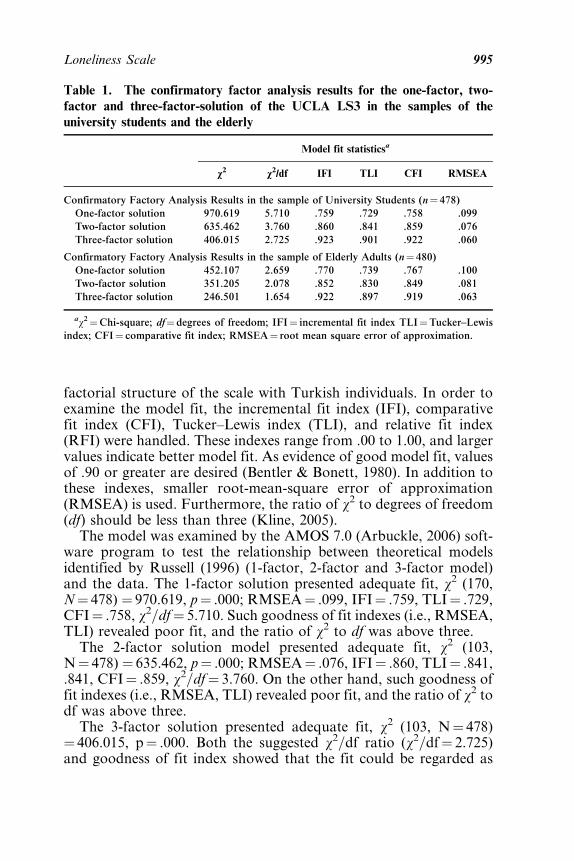
The model was examined by the AMOS 7.0 (Arbuckle, 2006) soft-ware program to test the relationship between theoretical modelsidentified by Russell (1996) (1-factor, 2-factor and 3-factor model)and the data. The 1-factor solution presented adequate fit, v2 (170,N¼ 478) ¼ 970.619, p¼ .000; RMSEA¼ .099, IFI¼ .759, TLI¼ .729,CFI¼ .758, v2=df¼ 5.710. Such goodness of fit indexes (i.e., RMSEA,TLI) revealed poor fit, and the ratio of v2 to df was above three.
The 2-factor solution model presented adequate fit, v2 (103,N¼ 478) ¼ 635.462, p¼ .000; RMSEA¼ .076, IFI¼ .860, TLI¼ .841,.841, CFI¼ .859, v2=df¼ 3.760. On the other hand, such goodness offit indexes (i.e., RMSEA, TLI) revealed poor fit, and the ratio of v2 todf was above three.
The 3-factor solution presented adequate fit, v2 (103, N¼ 478)¼ 406.015, p¼ .000. Both the suggested v2=df ratio (v2=df¼ 2.725)and goodness of fit index showed that the fit could be regarded as
Table 1. The confirmatory factor analysis results for the one-factor, two-
factor and three-factor-solution of the UCLA LS3 in the samples of the
university students and the elderly
Model fit statisticsa
v2 v2/df IFI TLI CFI RMSEA
Confirmatory Factory Analysis Results in the sample of University Students (n¼ 478)
One-factor solution 970.619 5.710 .759 .729 .758 .099
Two-factor solution 635.462 3.760 .860 .841 .859 .076
Three-factor solution 406.015 2.725 .923 .901 .922 .060
Confirmatory Factory Analysis Results in the sample of Elderly Adults (n¼ 480)
One-factor solution 452.107 2.659 .770 .739 .767 .100
Two-factor solution 351.205 2.078 .852 .830 .849 .081
Three-factor solution 246.501 1.654 .922 .897 .919 .063
av2¼Chi-square; df¼degrees of freedom; IFI¼ incremental fit index TLI¼Tucker–Lewis
index; CFI¼ comparative fit index; RMSEA¼ root mean square error of approximation.
Loneliness Scale 995

adequate; RMSEA¼ .060, IFI¼ .923, TLI¼ .901, CFI¼ .922.RMSEA and other indexes indicated a good fit over the firstmodel. Table 1 demonstrates detailed fit indices for the models ofthe UCLA LS3.
The Internal Consistency Results
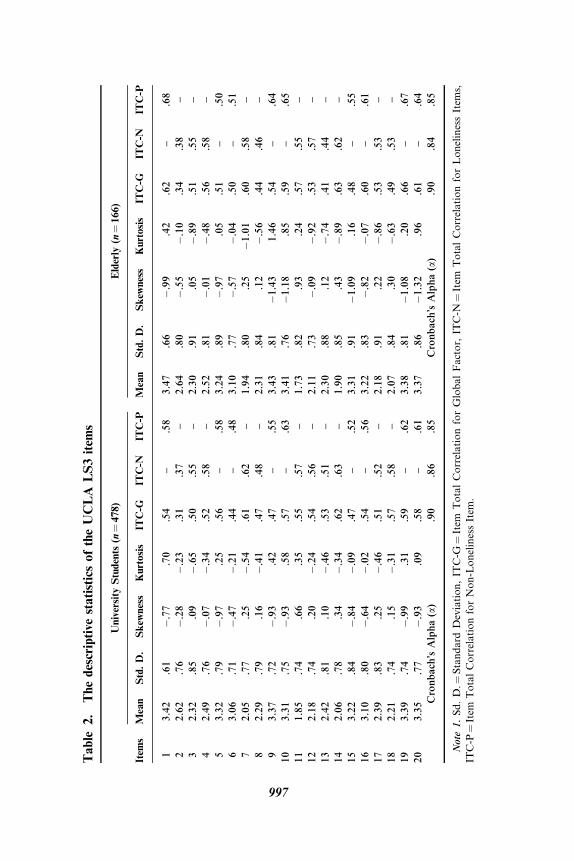
Descriptive statistics of the UCLA LS3 items are indicated inTable 2. Reliability was computed through the internal consistencyindexes. All sub-scale scores had discrete the internal consistencyand adequate item total correlations. For the university studentsample, the internal consistency coefficient was .90 for global lone-liness, .86 for loneliness, .85 for the non-loneliness scale and thecorrected-item total correlations ranged between .31 and .62 forglobal loneliness, .37 and .86 for loneliness and .48 and .63 forthe non-loneliness scale.
Concurrent, Criterion and Discriminant Validity
In order to examine concurrent validity, participants’ scores on theUCLA LS3 subscales were compared with conceptually related con-structs (the subscales of perceived social support and social provision,depression, positive affect, negative affect, and self esteem). TheUCLA LS3 was positively correlated with depression (r¼ .48,p¼ .000) and negative affect (r¼ .45, p¼ .000). On the other hand,the UCLA LS3 was negatively correlated with perceived social sup-port from family (r¼�.40, p¼ .000), perceived social support fromfriend (r¼�.50, p¼ .000), perceived social support from significantothers (r¼�.34, p¼ .000), attachment (r¼�.60, p¼ .000), socialintegration (r¼�.61, p¼ .000), reassurance of worth (r¼�.54,p¼ .000), reliable alliance (r¼�.60, p¼ .000), guidance (r¼�.65,p¼ .000), opportunity nurturance (r¼�.44, p¼ .000), positive affect(r¼�.40, p¼ .000), self esteem (r¼�.58, p¼ .000) and perceivedhealth (r¼�.26, p¼ .000) (see Table 3).
Regarding the criterion validity, UCLA LS3 was expected todifferentiate university students on the basis of residence.
To examine discriminant validity, participants’ scores on theUCLA LS3 subscales were compared with conceptually unrelatedconcept, social desirability. On the other hand, the UCLA LS3was significantly correlated with social desirability (r¼�.17,p¼ .000) despite the magnitude of the correlation was low (seeTable 3).
996 M. Durak and E. Senol-Durak
Table
2.
Thedescriptive
statisticsoftheUCLA
LS3item
s
University
Students
(n¼478)
Elderly
(n¼166)
Item
sMean
Std.D.
Skew
ness
Kurtosis
ITC-G
ITC-N
ITC-P
Mean
Std.D.
Skew
ness
Kurtosis
ITC-G
ITC-N
ITC-P
13.42
.61
�.77
.70
.54
–.58
3.47
.66
�.99
.42
.62
–.68
22.62
.76
�.28
�.23
.31
.37
–2.64
.80
�.55
�.10
.34
.38
–
32.32
.85
.09
�.65
.50
.55
–2.30
.91
.05
�.89
.51
.55
–
42.49
.76
�.07
�.34
.52
.58
–2.52
.81
�.01
�.48
.56
.58
–
53.32
.79
�.97
.25
.56
–.58
3.24
.89
�.97
.05
.51
–.50
63.06
.71
�.47
�.21
.44
–.48
3.10
.77
�.57
�.04
.50
–.51
72.05
.77
.25
�.54
.61
.62
–1.94
.80
.25
�1.01
.60
.58
–
82.29
.79
.16
�.41
.47
.48
–2.31
.84
.12
�.56
.44
.46
–
93.37
.72
�.93
.42
.47
–.55
3.43
.81
�1.43
1.46
.54
–.64
10
3.31
.75
�.93
.58
.57
–.63
3.41
.76
�1.18
.85
.59
–.65
11
1.85
.74
.66
.35
.55
.57
–1.73
.82
.93
.24
.57
.55
–
12
2.18
.74
.20
�.24
.54
.56
–2.11
.73
�.09
�.92
.53
.57
–
13
2.42
.81
.10
�.46
.53
.51
–2.30
.88
.12
�.74
.41
.44
–
14
2.06
.78
.34
�.34
.62
.63
–1.90
.85
.43
�.89
.63
.62
–
15
3.22
.84
�.84
�.09
.47
–.52
3.31
.91
�1.09
.16
.48
–.55
16
3.10
.80
�.64
�.02
.54
–.56
3.22
.83
�.82
�.07
.60
–.61
17
2.39
.83
.25
�.46
.51
.52
–2.18
.91
.22
�.86
.53
.53
–
18
2.21
.74
.15
�.31
.57
.58
–2.07
.84
.30
�.63
.49
.53
–
19
3.39
.74
�.99
.31
.59
–.62
3.38
.81
�1.08
.20
.66
–.67
20
3.35
.77
�.93
.09
.58
–.61
3.37
.86
�1.32
.96
.61
–.64
Cronbach
’sAlpha(a)
.90
.86
.85
Cronbach
’sAlpha(a)
.90
.84
.85
Note
1.Sd.D.¼
StandardDeviation,IT
C-G
¼Item
TotalCorrelationforGlobalFactor,
ITC-N
¼Item
TotalCorrelationforLonelinessItem
s,
ITC-P
¼Item
TotalCorrelationforNon-LonelinessItem
.
997

Table
3.
Thecorrelationsamongthevariables
PS
XSd
12
34
56
78
910
11
12
13
14
15
16
STUDENTS
1.Loneliness
20–80
40.34
8.95
�.40��
��.50��
��.34��
��.60��
��.61��
��.54��
��.60��
��.65��
��.44��
�.48��
��.40��
�.45��
��.58��
��.17��
��.26��
�
2.Familysupport
4–28
24.09
4.63
.42��
�.27��
�.32��
�.30��
�.31��
�.35��
�.41��
�.23��
��.39��
�.32��
��.30��
�.35��
�.19��
�.24��
�
3.Frien
dsupport
4–28
23.07
5.82
.31��
�.47��
�.45��
�.42��
�.53��
�.57��
�.27��
��.43��
�.31��
��.30��
�.38��
�.11�
.17��
�
4.Signif.others
support
4–28
19.71
8.88
.50��
�.26��
�.27��
�.30��
�.36��
�.21��
��.28��
�.23��
��.19��
�.35��
�.13��
.10�
5.Attach
men
t4–16
12.70
2.57
.59��
�.53��
�.66��
�.70��
�.42��
��.41��
�.36��
��.37��
�.56��
�.12�
.16��
�
6.Socialintegration
4–16
12.84
2.21
.63��
�.67��
�.67��
�.54��
��.39��
�.36��
��.31��
�.54��
�.15��
�.18��
�
7.Reassuranceof
worth
4–16
12.22
2.66
.61��
�.60��
�.50��
��.41��
�.39��
��.30��
�.55��
�.20��
�.18��
�
8.Reliable
alliance
4–16
13.66
2.36
.82��
�.48��
��.43��
�.35��
��.36��
�.55��
�.08
.21��
�
9.Guidance
4–16
13.36
2.66
.47��
��.44��
�.37��
��.33��
�.55��
�.13��
.22��
�
10.Opportunity
nurturance
4–16
12.24
1.94
�.31��
�.29��
��.19��
�.43��
�.16��
�.11�
11.Dep
ression
0–63
10.07
8.71
�.39��
�.59��
��.55��
��.15��
��.30��
�
12.Positiveaffect
10–50
32.80
7.46
�.33��
�.45��
�.19��
�.25��
�
13.Negative
affect
10–50
22.58
7.10
�.42��
��.07
�.30��
�
14.Selfesteem
10–50
39.30
7.50
.25��
�.23��
�
15.Socialdesirability
15–75
56.76
10.02
.09�
16.Perceivedhealth
1–5
3.88
0.80
ELDERLY
1.Loneliness
20–80
39.08
9.80
.59��
�-.46��
�-.25��
�-.34��
�
2.Geriatric
dep
ression
0–30
9.07
5.87
-.68��
�-.44��
�-.53��
�
3.Selfesteem
10–50
40.75
5.85
.41��
�.41��
�
4.Lifesatisfaction
5–35
24.35
6.69
.23��
5.Perceivedhealth
1–5
3.48
0.87
Note
1.Thelower
diago
nal(inwhichthenumbersgofrom
theupper
leftcorner
tolower
right)dem
onstratesthecorrelationsamongthevariab
lesin
the
university
studentsample.Ontheother
hand,theupper
diagonaldem
onstratesthecorrelationsamongthevariab
lesin
theadultsample.
Note
2.� p
<.05.��p<.01.��
� p<.001.
998
STUDY 2
Loneliness is prevalent during later adulthood (Theeke, 2009). Thus,psychometric properties of the UCLA LS3 were examined amongelderly individuals as well.
METHOD
Participants
The sample included 74 males (44.6%) and 92 females (55.4%) whoseages ranged between 60 and 79 (M¼ 63.70, SD¼ 5.31). The majority(n¼ 125; 75.3%) of the participants were married with the remainingparticipants reporting losing his=her spouse (n¼ 22; 13.3%), beingdivorced (n¼ 8; 4.8%), single (n¼ 4; 2.4%) and widowed (n¼ 7;4.2%). Among the married participants, the age of their spousesranged between 45 and 79 (M¼ 61.60, SD¼ 7.35). Among the parti-cipants losing their spouses, time passed since death of spouse rangedbetween 1 month and 300 months (M¼ 56.14, SD¼ 84.37). In termsof education level, 41% of them (n¼ 68) were primary-school graduates,9.6% of them (n¼ 16) were secondary-school graduates, 25.3% of them(n¼ 42) were high-school graduates and 24.1% of them (N¼ 40) wereuniversity graduates. In terms of living place, 47.6% of the subjects wereliving in a flat with only their spouse (n¼ 79), 24.7% were living in a flatwith their spouse and their children (n¼ 41), 12% were living in a flatalone (n¼ 20), 7.2% were living in a flat with their children (n¼ 12),6% were living children’s’ home (n¼ 10) and 2.4% were living in a flatwith others (i.e., caregivers) (n¼ 4). Participants’ number of childrenranged between 1 and 6 (1 child: n¼ 22, 13.3%; 2 children: n¼ 87,52.4%; 3 children: n¼ 28, 16.9%; 4 children: n¼ 15, 9%; 5 children:n¼ 4, 2.4%; 6 children: n¼ 6, 3.6%).Themonthly income of participantsranged between 400 TL and 15000 TL (266.67 USD to 10000 USD)(M¼ 1335.31 TL or 890.21 USD, SD¼ 1654.40 TL or 1102.93 USD).Few participants (n¼ 4) did not report their income level. The meanof the perceived health status of the participants was 3.48 (SD¼ 0.87),ranging between 1(very bad) and 5 (very good). All of the participantshad at least one social security entitlement.
Measures
In addition to the UCLA LS3 and RSES that were used in Study 1,the Geriatric Depression Scale, Satisfaction with Life Scale andDemographic Information was employed in the third study.
Loneliness Scale 999
The Geriatric Depression Scale (GDS) was developed by Yesavageet al. (1983) to evaluate depression levels among elderly adults with30 items. Participants are asked to answer ‘‘yes’’ or ‘‘no’’ in referenceto how they felt on the day of administration. The developers foundtest-retest reliability as .85 and the internal consistency as .94. Theinstrument was adapted into Turkish by Ertan, Eker and Sar withsufficient reliability (1997). They found test-retest reliability as .72and the internal consistency as .92.
The Satisfaction with Life Scale (SWLS) was developed by Diener,Emmons, Larsen, & Griffin (1985) to assess global life satisfactionusing five statements with regard to quality of life. Participants areasked to indicate their level of agreement with the statements on a7-point Likert-type scale. In terms of its reliability and validity,Diener et al. (1985) reported that the internal consistency of theinstrument was .87, and the test-retest correlation was .82. Also, theyfound a one-factor structure that explained 66% of the variance.Psychometric properties of the SWLS with Turkish samples (univer-sity students, correctional officers, and elderly adults) were examinedby Durak, Senol-Durak and Gencoz (in press). The internal consist-ency and item-total correlation coefficients was found as .81, .82 and.89 respectively. They found a single-factor solution model as relevantin all three different samples.
Procedure
The measures were distributed to elderly Turkish adults by usingsnowball sampling due to the difficulties associated with recruitingelderly individuals for psychological studies. After they wereinformed about the purpose of the study, all participants indicatedtheir informed consent by signing a consent form. Participation inthe study was voluntary. Completion of the questionnaires tookapproximately 0.5 to 1.5 hours. When needed, the participants werepermitted to take a 5 to 10 minute break during the interview.
RESULTS
Confirmatory Factor Analysis
To test the adequacy of the one-factor, two-factor and three-factormodel of the UCLA LS3 as mentioned by Russell (1996), confirma-tory factor analysis was conducted. Likewise in the sample of univer-sity students, three models were tested by the AMOS 7.0 (Arbuckle,2006) in the elderly.
1000 M. Durak and E. Senol-Durak

The 1-factor solution presented adequate fit, v2 (170, N¼ 166) ¼452.107, p¼ .000; RMSEA¼ .100, IFI¼ .770, TLI¼ .739, CFI¼.767, v2=df¼ 2.659. Such goodness of fit indexes (i.e., RMSEA,TLI) revealed poor fit despite the ratio of v2 to df was below 3.
The 2-factor solution model presented adequate fit, v2 (103,N¼ 166) ¼ 351.205, p¼ .000; RMSEA¼ .081, IFI¼ .852, TLI¼ .830,CFI¼ .849, v2=df¼ 2.078. On the other hand, such goodness of fitindexes (i.e., RMSEA, TLI) revealed poor fit even though the ratioof v2 to df was below 3.
The 3-factor solution presented adequate fit, v2 (103, N¼ 166) ¼246.501, p¼ .000. Both the suggested v2=df ratio (v2=df¼ 1.654) andgoodness of fit index showed that the fit could be regarded asadequate; RMSEA¼ .063, IFI¼ .922, TLI¼ .897, CFI¼ .919.RMSEA and other indexes indicated a good fit over the firstmodel. Table 1 demonstrates detailed fit indices for the models ofthe UCLA LS3.
The Internal Consistency Results
Descriptive statistics of the UCLA LS3 items are indicated in Table 2.Reliability was computed through the internal consistency indexes.All sub-scale scores had discrete the internal consistency andadequate item total correlations. In the sample of the elderly, theinternal consistency coefficient was .90 for global loneliness, .84 forloneliness, .85 for the non-loneliness scale and the corrected-itemtotal correlations ranged between .34 and .66 for global loneliness,.38 and .62 for loneliness and .50 and .68 for the non-loneliness scale.
Concurrent Validity
To examine concurrent validity, participants’ scores on the UCLALS3 subscales were compared with conceptually related constructs(geriatric depression, life satisfaction, and self esteem). The UCLALS3 was positively correlated with geriatric depression (r¼ .59,p¼ .000). On the other hand, the UCLA LS3 was negatively corre-lated with life satisfaction (r¼�.25, p¼ .000), self esteem (r¼�.46,p¼ .000) and perceived health (r¼�.34, p¼ .000) (see Table 3).
DISCUSSION
The UCLA LS3 is accepted as an available measurement to evaluateloneliness in diverse settings for elderly individuals (Russell, 2009),
Loneliness Scale 1001
undergraduate university students (Warwick, Nettelbeck, & Ward,2010), and members in the community (Stepanikova, Nie, & He,2010). To evaluate whether Turkish version of the UCLA LS3 is avalid measurement instrument to evaluate loneliness, psychometricproperties of the scale were examined with the samples of universitystudents and elderly adults. The current results provide a deeperunderstanding of the multidimensionality of the UCLA LS3 structur-al validity since there has been a debate in the literature whether thescale has unidimensional or multidimensional structure. In the pre-vious version of the UCLA, 1-factorial (Pretoirus, 1993), 2-factorial(Mahon et al, 1995), 3-factorial (McWhirter, 1990) solutions weretested. By the same token, UCLA LS3’s factorial structure wastested by comparing 1-factorial, 2-factorial, 3-factorial solutions(Russell, 1996).
On the basis of the current literature, 1-factorial, 2-factorial,3-factorial solutions were compared in Study 1 and Study 2.Confirmatory factor analysis results indicated that the UCLA LS3had multidimensional structure. Multidimensionality of the previousversions of the UCLA has been supported by several researchers(Dussault et al., 2009; Mahon et al., 1995, McWhirter, 1990,Hartshorne, 1993) ‘‘to clarify client’s need and appropriate inter-ventions’’ (McWhirter, 1990, p. 56). Consistently, the multidimension-ality of the UCLA LS3 is supported by Russell (1996). Whencomparing the 1-factorial, 2-factorial (loneliness and non-loneliness)and 3-factorial solutions (loneliness, non-loneliness, global loneliness)in the present study, both 2-factorial and 3-factorial solutions revealedbetter results than 1-factorial solution in both samples. However, theresults may differ in different cultural context. For example, in Danishversion, 1-factorial structure was significant (Lasgaard, 2007). Thisdifference may be explained by the characteristics of the sample.Whileadolescents are selected in the Danish version, adults were selected asparticipants in the present study.
When comparing 2-factorial and 3-factorial solutions, the funda-mental factor structure of the UCLA LS3 was 3-dimensional in thesampling of both university students and elderly adults on the basisof model fit indices (i.e., RMSEA, IFI, and CFI) and ratio of v2 todf. This finding is consistent with Russell’s (1996) findings whoevaluated the factorial structure of UCLA LS3 and Dussault et al(2009) who evaluated the factorial structure of the UCLA RevisedVersion.
Investigating the factorial stability and the validity of the UCLALS3 by means of using different sampling is certainly desirable toaffirm the latent structure. However, the same factor structure may
1002 M. Durak and E. Senol-Durak

not be obtained when a scale is administered to different samples.Consistent with Russell’s (1996) study, three-factor solution in thesample of university students could be replicated in the sample ofthe elderly. Therefore, it can be said that factorial invariance acrossthe university students and the elderly was confirmed by obtainingconsistency of the factor analyses of the UCLA LS3 administeredto two different samples.
Similar to the findings in the sample of Danish adolescents(Lasgaard, 2007) and American opiate dependent individuals(Britton, & Conner, 2007), the sub-scales of the UCLA LS3 wereinternally consistent in terms of reliability. Moreover, the item-totalcorrelations for the subscales of the UCLA LS3 were within accept-able ranges. The results of the internal consistency analysis clearlydemonstrated the UCLA LS3 to be highly acceptable for 3-factorsolution in the sample of university students and elderly adults.
In addition to factorial structure and the internal consistency, thescale had satisfactory concurrent validity that is provided by theassociation between the subscales of the UCLA LS3 and severalscales. In the sample of university students, the association betweenthe subscales of the UCLA LS3, social support, social provision,depression, positive affect, negative affect, and self esteem werecompared. As expected, all subscales of perceived social support(perceived social support from family, perceived social support fromfriend and perceived social support from significant others) and socialprovision (attachment, social integration, reassurance of worth,reliable alliance, guidance, opportunity nurturance) were negativelycorrelated with UCLA LS3. The results between UCLA LS andSocial Provision were consistent with Russell’s (1996) findings. More-over, negative association between UCLA and other scales assessingsocial support were mentioned before (Wu & Yao, 2008). Further-more, UCLA LS was negatively correlated with positive affect andpositively correlated with negative affect. In addition to socialsupport, UCLA LS was negatively correlated with self esteem andpositively correlated with depression as found in Russell’s (1996)study. The relationship between UCLA LS3 and depression was alsonegative in Lasgaard’s study (2007).
In the sample of elderly adults, the association between UCLALS3, geriatric depression, self esteem and life satisfaction wascompared to evaluate concurrent validity. UCLA LS was negativelycorrelated with life satisfaction and positively correlated with geria-tric depression. Consistent findings between UCLA LS, depressionand life satisfaction were found by Russell (1996) in the sample ofelderly adults. Furthermore, UCLA LS3 was negatively correlated
Loneliness Scale 1003

with self esteem as found in the sample of college students (Russell,1996).
In addition to concurrent validity, the discriminant validity of theUCLA LS3 was examined with the sample of university students. Asan evidence of discriminant study, consistent with Russell (1996), thecorrelation between UCLA LS3 and social desirability was low.Therefore, UCLA LS3 was distinct from social desirability.
The results of the present study should be evaluated by takingsome methodological limitations into account. Gathering data fromdifferent samples is necessary to improve the generalizability of theresults. Research with other age groups or with other participantsis recommended for future similar studies. In addition to the elderly,when Lasgaard’s study (2007) is considered, especially adolescentsmay be selected as participants since the factorial structure maydiffer. For instance, adolescents may conceptualize loneliness as lesscomplicated. In addition to different samples, the replication of theresults related with the reliability and validity of UCLA LS3 in differ-ent cultures is valuable to generalizability as culture has an effect onloneliness (Theeke, 2009).
The results demonstrated that in addition to satisfactory reliabilityand the validity results, UCLA LS3 has multidimensional factorstructure in different Turkish samples. The scale can be used as anassessment tool to assess loneliness of the adults and the elderly.Further research involving demographically diverse samples in differ-ent cultures would support the psychometric results of UCLA LS3.
REFERENCES
Allen, R. L., & Oshagan, H. (1995). The UCLA loneliness scale: Invariance of social
structural characteristics. Personality and Individual Differences, 19(2), 185–195.
Arbuckle, J. L. (2006). Amos (Version 7.0) [Computer Program]. Chicago, IL: SPSS.
Balandin, S., Berg, N., & Waller, A. (2006). Assessing the loneliness of older people
with cerebral palsy. Disability & Rehabilitation, 28(8), 469–479.
Beck, A. T., Ward, C. H., Mendelson, M., Mock, J., & Erbaugh, J. (1961). An inven-
tory for measuring depression. Archives of General Psychiatry, 4, 561–571.
Bentler, P. M., & Bonett, D. G. (1980). Significance tests and goodness of fit in the
analysis of covariance structures. Psychological Bulletin, 88, 588–606.
Britton, P. C., & Conner, K. R. (2007). Reliability of the UCLA Loneliness Scale
in opiate dependent individuals. Journal of Personality Assessment, 88(3),
368–371.
Cacioppo, J. T., Hawkley, L. C., Crawford, L. E., Ernst, J. M., Burleson, M. H.,
Kowalewski, R. B., . . .Berntson, G. G. (2002). Loneliness and health: Potential
mechanisms. Psychosomatic Medicine, 64, 407–417.
1004 M. Durak and E. Senol-Durak
Cacioppo, J. T., Hawkley, L. C., Ernst, J. M., Burleson, M., Berntson, G. G.,
Nouriani, B., & Spiegel, D. (2006). Loneliness with a nomological net: An evol-
utionary perspective. Journal of Research in Personality, 40, 1054–1085.
Cacioppo, J. T., Hawkley, L. C. (2003). Social isolation and health, with an emphasis
on underlying mechanisms. Perspectives in Biological Medicine, 46(3), 539–552.
Cacioppo, J. T., Hughes, M. E., Waite, L. J., Hawkley, L. C., & Thisted, R. A.
(2006). Loneliness as a specific risk factor for depressive symptoms: Cross-
sectional and longitudinal analyses. Psychology and Aging, 21(1), 140–151.
Civitci, N., & Civitci, A. (2009). Self-esteem as mediator and moderator of the
relationship between loneliness and life satisfaction in adolescents. Personality
and Individual Differences, 47, 954–958.
Cuhadaroglu, F. (1986). Self esteem among adolescents (Unpublished doctoral disser-
tation). Hacettepe University, Ankara, Turkey.
Cutrona, C. E., & Russell, D. (1987). The provisions of social relationships and
adaptation to stress. In W. H. Jones & D. Perlman (Eds.), Advances in personal
relationships (vol. 1, pp. 37–67). Greenwich, CT: JAI.
Demir, A. (1989). Validity and reliability of the UCLA Loneliness Scale. Journal of
Psychology, 7(23), 14–18.
Diener, E., Emmons, R. A., Larsen, R. J., & Griffin, S. (1985). The Satisfaction with
Life Scale. Journal of Personality Assessment, 49, 71–75.
Di Tommaso, E., & Spinner, B. (1993). The development and initial validation of
the Social and Emotional Loneliness Scale for Adults (SELSA). Personality and
Individual Differences, 14(1), 127–134.
Durak, M., & Coskun, H. (2010). Psychometric properties of The Social
Desirability Scale-17 (SDS-17). Unpublished Manuscript.
Durak, M., Senol-Durak, E., & Gencoz, T. (in press). Psychometric properties of the
Satisfaction with Life Scale among Turkish university students, correctional
officers, and elderly adults. Social Indicators Research, doi: 10.1007=s11205-010-9589-4.
Durmusoglu Saltalu, N., Ozturk, A., & Samur, E. (2009). A study on loneliness level
of students in faculty of vocational education in terms of some variables. Procedia
Social and Behavioral Sciences, 1, 1272–1277.
Duru, E., & Balkıs, M. (2007). Psychometric characteristics of Social Provision
Scale: Validity and reliability study. Turkish Psychological Counseling and Guid-
ance Journal, 27, 79–90.
Dussault, M., Fernet, C., Austin, S., & Leroux, M. (2009). Revisiting the factorial
validity of the Revised UCLA Loneliness Scale: A test of competing models in
a sample of teachers. Psychological Reports, 105, 849–856.
Eker, D., & Arkar, H. (1995). Factor analysis, validity and the reliability of the
multidimensional perceived social support scale. Turkish Journal of Psychology,
10(34), 45–55.
Ertan, T., Eker, E., & Sar, V. (1997). The reliability and validity of Geriatric
Depression Scale in the samples of Turkish elderly. Noropsikiyatri Arsivi, 34(2),
62–71.
Fees, B., Martin, P., & Poon, L. W. (1999). A model of loneliness in older adults.
The Journals of Gerontology, 54B, 231–239.
Loneliness Scale 1005

Fleming, J. S., & Courtney, B. E. (1984). The dimensionality of self-esteem II:
Hierarchical facet model for revised measurement scales. Journal of Personality
and Social Psychology, 46, 404–421.
Gencoz, T. (2000). Positive and negative affect schedule: A study of validity and
reliability. Turkish Journal of Psychology, 15(46), 27–28.
Goossens, L., Lasgaard, M., Luyckx, K., Vanhalst, J., Mathias, S., & Masy, E.
(2009). Loneliness and solitude in adolescence: A confirmatory factor analysis
of alternative models. Personality and Individual Differences, 47, 890–894.
Hartshorne, T. S. (1993). Psychometric properties and confirmatory factor analysis
of the UCLA Loneliness Scale. Journal of Personality Assessment, 63, 182–195.
Hector-Taylor, L., & Adams, P. (1996). State versus trait loneliness in elderly New
Zealanders. Psychology Reports, 78, 1329–1330.
Hisli, N. (1988). A study on the validity of Beck Depression Inventory. Turkish
Journal of Psychology, 6(22), 118–123.
Kline, R. B. (2005). Principles and practice of structural equation modeling (2nd ed.).New York, NY: Guilford.
Lasgaard, M. (2007). Reliability and validity of the Danish version of the UCLA
Loneliness Scale. Personality and Individual Differences, 42, 1359–1366.
Mahon, N. E., Yarcheski, A., & Yarcheski, T. J. (2004). Social support and positive
health practices in early adolescents: A test of mediating variables. Clinical
Nursing Research, 13(3), 216–236.
Mahon, N. E., Yarcheski, T. J., &Yarcheski, A. (1995). Validation of the RevisedUCLA
Loneliness Scale for adolescents. Research in Nursing and Health, 18(3), 263–270.
McWhirter, B. T. (1990). Factor analysis of the Revised UCLA Loneliness Scale.
Current Psychology, 9(1), 56–69.
Morahan-Martin, J., & Schumacher, P. (2003). Loneliness and social uses of the
Internet. Computers in Human Behavior, 19, 659–671.
Ozkurkcugil, A. C. (1998). Loneliness in prison and relationship between loneliness
and depression. Journal of Crises, 6(1), 21–31.
Peplau, L. A., & Perlman, D. (1982). Loneliness: A sourcebook of current theory,
research, and therapy. New York, NY: Wiley.
Pretoirus, T. B. (1993). The metric equivalence of the UCLA Loneliness Scale for a
sample of South African students. Educational and Psychosocial Measurement,
53(1), 233–239.
Rosenberg, M. (1965). Society and adolescent self-image. Princeton, NJ: Princeton
University Press.
Rubenstein, C. M., & Shaver, P. (1982). The experience of loneliness. In L. A.
Peplau & D. Perlman (Eds.), Loneliness: A sourcebook of current theory, research
and therapy (pp. 206–123). New York, NY: John Wiley & Sons.
Russell, D, Peplau, L. A., & Ferguson, M. L. (1978). Developing a measure of
loneliness. Journal of Personality Assessment, 42, 290–294.
Russell, D. W. (1996). UCLA Loneliness Scale (version 3): Reliability, validity, and
factor structure. Journal of Personality Assessment, 66(1), 20–40.
Russell, D. W. (2009). Living arrangements, social ıntegration, and loneliness in
later life: The case of physical disability. Journal of Health and Social Behavior,
50, 460–475.
1006 M. Durak and E. Senol-Durak
Russell, D., Peplau, L. A., & Cutrona, C. E. (1980). The Revised UCLA Loneliness
Scale. Concurrent and discriminant validity evidence. Journal of Personality and
Social Psychology, 39, 472–480.
Sacchi, C., & Richaud de Minzi, M. C. (1997). UCLA’s Revised Scale of Loneliness:
An Argentinean adaptation. Revista Argentina de Clinica Psicologica, 6(1), 43–53.
Scalise, J. J., Ginter, E. J., & Gerstein, L. H. (1984). A multidimensional loneliness
measure. The Loneliness Rating Scale (LRS). Journal of Personality Assessment,
48, 515–530.
Schmidt, N., & Sermat, V. (1983). Measuring loneliness in different relationships.
Journal of Personality and Social Psychology, 44, 1038–1047.
Stepanikova, I., Nie, N. H., & He, X. (2010). Time on the Internet at home, loneli-
ness, and life satisfaction: Evidence from panel time-diary data. Computers in
Human Behavior, 26(3), 329–338.
Stober, J. (2001). The Social Desirability Scale-17 (SDS-17): Convergent validity,
discriminate validity, and relationship with age. European Journal of Psychological
Assessment, 17, 222–232.
Theeke, L. A. (2009). Predictors of loneliness in U.S. adults over age sixty-five.
Archives of Psychiatric Nursing, 23(5), 387–396. (Chinese)
Warwick, J., Nettelbeck, T., Ward, L. (2010). AEIM: A new measure and method
of scoring abilities-based emotional intelligence. Personality and Individual
Differences, 48, 66–71.
Watson, D., Clark, L. A., & Tellegen, A. (1988). Development and validation of brief
measures of positive and negative affect: The PANAS scales. Journal of Person-
ality and Social Psychology, 54, 1063–1070.
Wu, C., & Yao, G. (2008). Psychometric analysis of the short-form UCLA
Loneliness Scale (ULS-8) in Taiwanese undergraduate students. Personality
and Individual Differences, 44, 1762–1771.
Yesavage, J. A., Brink, T. L., Rose, T. L., Lum, O., Huang, V., Adey, M. B., & Leirer,
V. O. (1983). Development and validation of a Geriatric Depression Screening
Scale: A preliminary report. Journal of Psychiatric Research, 17, 37–49.
Zimet, G. D., Dahlem, N. W., Zimet, S. G., & Farley, G. K. (1988). The Multi-
dimensional Scale of Perceived Social Support. Journal of Personality Assessment,
52, 30–41.
Loneliness Scale 1007

Copyright of Educational Gerontology is the property of Routledge and its content may not be copied or
emailed to multiple sites or posted to a listserv without the copyright holder's express written permission.
However, users may print, download, or email articles for individual use.