psinsar displacements related to soil creep and...
TRANSCRIPT

Geomorphology xxx (2012) xxx–xxx
GEOMOR-04053; No of Pages 8
Contents lists available at SciVerse ScienceDirect
Geomorphology
j ourna l homepage: www.e lsev ie r .com/ locate /geomorph
PSInSAR displacements related to soil creep and rainfall intensities in the Alpineforeland of western Slovenia
Gorazd Žibret ⁎, Marko Komac, Mateja JemecGeological Survey of Slovenia, Dimičeva ulica 14, SI-1001 Ljubljana, Slovenia
⁎ Corresponding author. Tel.: +386 1 2809 757; fax:E-mail address: [email protected] (G. Žibret).
0169-555X/$ – see front matter © 2012 Elsevier B.V. Aldoi:10.1016/j.geomorph.2012.07.002
Please cite this article as: Žibret, G., et al., PSSlovenia, Geomorphology (2012), doi:10.10
a b s t r a c t
a r t i c l e i n f oArticle history:Received 17 January 2011Received in revised form 30 April 2012Accepted 4 July 2012Available online xxxx
Keywords:Permanent scattererSoil creepPSInSARRainfallSlovenia
An assessment of the relationship between displacement rates of objects located in areas of active soil creepand rainfall intensities was performed using a permanent-scatterer technique of synthetic aperture radar in-terferometry. The study focussed on two areas in central Slovenia during the period between April 1992 andDecember 2000. Based on field assessments, six permanent scatterers for one area and 11 scatterers for theother were selected for analysis from >4300 available permanent scatterers. Displacement rates related tocreeping processes were compared with the different durations and intensities of rain in order to assessthe threshold values that initiate the creeping process and to assess the relationship between the speed ofthe movement and the precipitation events. Although the permanent scatterer displacement data containmuch noise, our results indicate that soil creep is induced by 20 mm of rain in 1 day or 50 mm of rain in3 days, causing an average elevation decrease of 0.5 and 1 mm, respectively. The elevation decreases dueto soil creep were observed as instantaneous events, since no increased correlations were observed when atime lag between precipitation and displacement was taken into account. Models developed in this researchindicated very similar rates of tectonic uplift for the two research areas in the event of no rain, and these rateswere found to be faster than the regional tectonic uplift. This suggests that areas with high rates of tectonicuplift and areas of active soil creep may be related.
© 2012 Elsevier B.V. All rights reserved.
1. Introduction
Gravitational slopemassmovements in Slovenia constantly pose newchallenges to experts whomonitor and assess the dynamics and trigger-ing mechanisms of such phenomena (Komac, 2006; Komac and Ribičič,2006; Jemec andKomac, 2011). Among all possible forms of gravitationalslope mass movements, soil creep poses several challenges to expertsand civil engineers because such processes have spatially and temporallyvarying complex dynamics and can be very hard to detect. Experts arefaced with the challenge of how to examine and study processes thatare not only very slow and occur infrequently but are also monitoredusing processes other than the classical geotechnical methods. Anotherproblem is that continuous monitoring over a wide area is difficult dueto the lack of resources. This is why an approach that combines GIS, re-mote sensing, and data mining techniques must be applied in order tostudy soil creep processes.
Radarmonitoring of the Earth's surface has improved dramatically inthe past decade (Rott and Nagler, 2006; Bovenga et al., 2012). Numerousexisting and planned satellites enable the continuous monitoring of al-most every corner of our planet. Synthetic aperture radar (SAR) interfer-ometry allows for the monitoring of surface displacements over widerareas (Fruneau et al., 1996; Berardino et al., 2002). The main advantages
+386 1 2809 753.
l rights reserved.
InSAR displacements related16/j.geomorph.2012.07.002
of SARmonitoring systems include their independence of solar illumina-tion and cloud conditions as well as their relatively accurate measure-ments in the vertical (or subvertical) direction that range from severalmetres to less than a millimetre. Although more details of this methodcan be found in papers by Ferretti et al. (2001, 2005), Colesanti et al.(2003), and Oštir (2006), this approach is not ideal. The main problemswith this method are related to the coherence, hidden sources of errorin the radar signal (mainly due to atmospheric influence), and the tem-poral and spatial resolutions of the technique. Some of these obstaclescan be overcome with the permanent scatterer interferometric tech-nique (PSInSAR) (Oštir, 2000; Colesanti et al., 2003; Colesanti andWasowski, 2006; Oštir and Komac, 2007). A permanent scatterer (PS;PSs is used for the plural form) is a natural outcrop or artificial object,such as a building, electrical power line, a metal structure with angularedges, or an artificial reflector. All PS displacements are relative to thereference point on the radar image that is considered stable in relationto the wider environs. The main constraints of the PSInSAR techniqueare the inability to detect displacements that occur (1) in vegetatedareas, (2) in the North–south (N–S) direction, and (3) those larger than28.3 mm (half of the wavelength of the radar signal; λ=56.6 mm) be-tween two image acquisitions, normally a period of 35 days. Further con-straints include (4) the limited resolution of radar images (approximately25 m), (5) rough terrain that causes shadowing effects and image distor-tion, and (6) the need for sufficient PS density, at least 4 km−2 (Colesantiet al., 2003). The quality of each PS is defined by a coherence value (γ),
to soil creep and rainfall intensities in the Alpine foreland of western

2 G. Žibret et al. / Geomorphology xxx (2012) xxx–xxx
where a larger γ valuemeans a better quality PS displacement time series(Colesanti andWasowski, 2006; Oštir, 2006). Despite the aforementionedlimitations, the PSInSAR technique can be successfully applied to themonitoring of slow processes (e.g. Carnec and Delacourt, 2000; Hilley etal., 2004; Salvi et al., 2004; Declerq et al., 2005; Bovenga et al., 2006;Farina et al., 2006). Therefore, the PSInSAR technique appears to be themost suitable for monitoring soil creeping processes.
Rainfall is recognised as an important factor that triggers the soilcreep process in unstable or pseudo-stable slopes with thick layers ofsoil and weathered rocks, particularly in semi-humid and humid areas(Hinkelmann et al., 2011). However, there have not been many studiesthat relate gravitational mass movements to rainfall intensities. Studiesfocused on faster mass movement processes, mainly due to extremeweather events, use for visual correlations (event-response), while thePSInSAR techniquehasmostly beenused for analysing slow-moving pro-cesses. Hilley et al. (2004) have detected the dependency of slowly-moving slope processes on rainfall and estimated that the lag of intensivemovements could be up to 90 days. Ambrosi and Crosta (2006) detecteda rise in PS displacement rates as a consequence of intensive rainfall in aperiod of over 1 year. Using PSInSAR measurements, Calabro et al.(2007) showed that this lag time varied from 14 to 42 days. Meisina etal. (2006) and Hu et al. (2009) found good visual correlation estimatesof PS displacement rateswith rainfall intensities. Iverson (2000) estimat-ed that the lag time between the peak rainfall and landslide triggeringmoment varies from 5 to 8 days. On the other hand, Lollino et al.(2006) defined the lag time to be 8–9 days, while other studies(Guzzetti et al., 2004; Yu et al., 2006) reported shorter lag times thatranged up to 9 h during extreme weather events. According to Rotaru
Fig. 1. Landslide susceptibility map (Komac and Ribičič, 2006) with the study areas (the BŽelezniki for the SKL area), locations of rain gauge stations (Kobarid and Cerkno), and locaticampaign are outlined in a black line.
Please cite this article as: Žibret, G., et al., PSInSAR displacements relatedSlovenia, Geomorphology (2012), doi:10.1016/j.geomorph.2012.07.002
et al. (2007), creeping can also be related to either the pre-failure in(re)activation or the sliding retardation phase.
The main goal of this study is to assess the long- and short-term rela-tionships between slow PS displacements, soil creep, and rainfall intensi-ties in two areas in Slovenia where landslides and soil creep occur often.We also assessed the rainfall threshold amount that is needed to startthe creeping process and the potential time lag between the rainfallevent and the beginning of the creeping process. Satellite (PSInSAR),in-situ (visual estimation of the occurrence of soil creep), and precipita-tion data for the areas were combined through GIS to achieve the afore-mentioned goals.
2. Study area
Because rainfall is the main cause of gravitational slope mass move-ments, the northwestern part of Slovenia (Fig. 1) was chosen for thisstudy due to its high annual precipitation rate (Zupančič, 1995). Com-bined with diverse lithostratigraphic and complex tectonic characteris-tics, this area is subjected to constant relief changes (Komac and Ribičič,2006). These changes can be attributed to active tectonics (Poljak et al.,2000; Placer, 2008), the ongoing response to the ice retreat at the endof the Pleistocene (Bavec et al., 2004), and most significantly to the highannual average precipitation rates along with the related gravitationalslope mass movements.
In general, the study area is exposed to moderate tectonic uplift, esti-mated to be between 1 mm year−1 (Komac and Bavec, 2007) and5 mm year−1 (Rižnar et al., 2007). The study area extends from StariVrh (46°10′22.87″ N, 14°11′18.65″ E), which lies in the Alpine foreland
OV and the SKL areas), reference permanent scatterers (Tolmin for the BOV area andons of the permanent scatterers used (with names). The borders of the data acquisition
to soil creep and rainfall intensities in the Alpine foreland of western

3G. Žibret et al. / Geomorphology xxx (2012) xxx–xxx
in the east, to Kobarid (46°14′48.36″ N, 13°35′5.47″ E), which lies in theJulian Alps in the west. The altitude ranges from 140 to 2660 m abovesea level, and the mean slope angle is 24.1° with a standard deviation of12.7°. Based onhistorical data, the area receives an annual average rainfallranging from 1600 mm in the eastern section (Škofja Loka hills: the SKLarea) to 3000 mm in the western section (Bovec: the BOV area)(Zupančič, 1995). The population of the area is approximately 80,000,with the majority of inhabitants concentrated in major towns such asŠkofja Loka, Tolmin, Železniki, Cerkno, and Žiri. The geology of the studyarea is summarised in Buser (2010). The SKL area consists mainly of Me-sozoic carbonates (limestones and dolomites), Mesozoic clastites (shales,siltstones, marlstones, grauwackes, sandstones, conglomerates, breccias,and tuffs), and Permian and Carboniferous clastites (claystones, sand-stones, and shales). The valleys are mainly filled with alluvial depositsand the foot of slopes are typically covered by scree deposits, both of Qua-ternary age. The BOV area lies in the eastern flank of the Alpine chain andpredominantly contains Mesozoic carbonates (limestones and dolo-mites), which, in some areas, change to less stable clastites such asmarls, marlstones, and flysch. There are also numerous Quaternaryscree deposits, i.e., rubble and remnants of past glacial activity such astills and moraines. Based on GIS modelling, a landslide susceptibilitymapwasmade for this area (Komac and Ribičič, 2006)with three indices,from 1 (no possibility of landslides) to 3 (high risk of landslides) (Fig. 1).
3. Materials and methods
3.1. Raw data acquisition
For the interpretation of soil creep in relation to rainfall intensity, twodatasets were acquired. The first dataset is the time-dependent PSInSARmeasurement, which consists of two subsets, one for thewestern section(Alps) and the other for the eastern section (Alpine foreland) of thestudy area. All processed PSInSAR series were purchased from the Tele-Rilevemento Europa Company. Temporal availability was conditionedwith the availability of the radar satellite data, although temporal separa-tion between PS displacementmeasurementswas inmost cases 35 days.Despite the different intervals, all available measurements have beenused in our research.
According to the Tele-Rilevemento Europa Company's report onInSAR data processing (TRE, 2008), the approach of averaging a numberof imageswas used tominimise the random amplitude variability, leav-ing the uniform amplitude level unchanged. This technique is known asmulti image reflectivity and is the means by which speckle reduction isaccomplished. Atmospheric effects are eliminated or minimised withthe first interferogram calculation, from which the atmospheric impactis estimated and removed based on the comparison to neighbouringpixels that are experiencing the same atmospheric conditions. Havingremoved the atmospheric artefacts, the data that remain are pixels(also referred to as PS candidates) that display stable amplitude and co-herent phase throughout every image of the dataset. This correction isperformed for each of the InSAR images. When these errors are re-moved, a history of radar signal phase values for each PS can be calculat-ed and the shifts between the phases of different images can be derived.The phase shifts represent the displacements in the line-of-sight of theradar signal. The process is based on statistics and is accurate due to thelarge number of available images for the analysis.
Thefirst PSInSARdataset (the BOV area) covers 700 km2 and consistsof 1646 PSs with coherence values greater than 0.75. At each PS, the ele-vation change was measured 57 times (i.e., 57 InSAR images) in the pe-riod between 21 April 1992 and 29 December 2000 using the ERS-1 andERS-2 data from the descending orbit. The time period between two con-secutive measurements ranged from 35 to 583 days; this upper limitstems from the inactive period of the ERS satellites in 1994. On theother hand, some measurements were repeated in just 1 day (sixcases); in such cases, the average value between the twomeasurementswas used. The total number of measurements for the BOV dataset was
Please cite this article as: Žibret, G., et al., PSInSAR displacements relatedSlovenia, Geomorphology (2012), doi:10.1016/j.geomorph.2012.07.002
thus 51 elevation change measurements for 1646 PSs. The image from26 September 1997 was used as the master image (measurement). Thetotal number of PSs was over 16,400, but only the best 10%met the tem-poral requirements and were used as input for the analysis. The averagePS density for this subset was 23 PSs km−2. The PS that is located in thetown of Tolmin (46°11′3.44″ N, 13°44′45.12″ E) was defined as a refer-ence point that acts as a stable object from which all PS displacementsare calculated. The detected surface deformation in the study area rangedfrom −6.7 to 3.3 mm year−1. In this paper, negative deformations ordisplacement rates denote elevation decreases or movement of the PSaway from the satellite, whereas positive displacement rates denote ele-vation gains (uplift) or movement towards the satellite.
The second PS dataset (the SKL area) covers 643 km2 and consistsof 2786 PS measurements with coherence values greater than 0.58.Here, elevation change was measured during the period between 11June 1992 and 10 December 2000. During this period, a total of 67measurements (i.e., 67 InSAR images) from the descending orbitwere acquired, with the time interval betweenmeasurements rangingfrom 35 to 548 days. When twomeasurements were made only 1 dayapart, the same procedure as used for the BOV area was applied (i.e.,the average value of twomeasurements). An image from21December1997 was used as the master image. In this case, temporal displace-ment data were available for all 2786 PSs, and the average PS densityfor the subset was 4.33 PS km−2. The PS located in the town ofŽelezniki (46°13′32.05″ N, 14°10′31.77″ E) was defined as the refer-ence point. Finally, the detected surface deformation in the studyarea ranged from −18.75 to 7.26 mm year−1.
The precipitation dataset, acquired from the Environmental Agency ofSlovenia, consists of daily rainfall measurements (in mmwith a precisionof 0.1 mm) between 1 January 1992 and 29 December 2000. This datasetcovers the entire study area and includes 27 rain gauge stations. Fig. 2shows an example of the raw precipitation data used in this study. Thedrawback of this data, which may slightly influence the results, is theunavailability of correctional information regarding snowmelt effects.
3.2. Field inspection of the PSs
Field inspectionwas carried out in order to determine the reasons forthe PS elevation change, as well as to define the suitability of PSs for theanalysis of precipitation influence on soil creep. This was necessary be-cause there are factors other than soil creep and tectonics that governPS elevation change. For instance, old abandonedwooden buildings, pre-viously used for storing hay or crops, often have visible deterioration;when the roofs of these buildings act as PSs, the main reason for an ele-vation decrease is due to the decay of the wooden construction, not thetectonics or soil creep. One such example is presented in Fig. 3A. Intotal, 160 localities, containing approximately 500 PSs, were inspected,photographed, geologically evaluated, and described. Special attentionwas paid to visible signs of soil creep, such as tilted trees, characteristicland features, and cracks on buildings, among others. Further data pro-cessing was carried out for PSs that lay on solid foundations (Fig. 3B),such as roofs on concrete foundations, boulders, and roads on unstableterrain, where geologic conditions are favourable for slow gravitationalslope processes (soil creep) and signs of such processes could be ob-served (e.g. tilted trees).
3.3. Data processing
Two main factors, excluding noise in the data and other non-geologically conditioned events, drive the elevation changes of the select-ed PSs: the first factor is tectonic activity that is potentially coupled withthe uplift due to isostatic response from the latest ice retreat, and the sec-ond involves gravitational slope mass movements. In order to directlycompare the PS vertical displacement rates with the aforementioned fac-tors, which are expressed as a velocity (mm year−1 or mm day−1), thePS dataset was converted from absolute elevation values to elevation
to soil creep and rainfall intensities in the Alpine foreland of western

Fig. 2. Example of the raw datasets (07ZDO PSInSAR point and precipitation time series): time-dependent measurements of the terrain elevation and daily measurements of therainfall nearby.
4 G. Žibret et al. / Geomorphology xxx (2012) xxx–xxx
change rates (mm day−1). The rates were calculated by dividing the ob-served differences in elevation between each pair of measurements bythe number of days separating them.
The daily rainfall dataset was partitioned into precipitation parame-ters. These parameterswere calculated by analogy of the PS displacementrates; rather than absolute values, they express occurrence rate or averageprecipitation for different time periods. This was necessary in order to di-rectly determine the time-dependence of the elevation change on the in-tensity of the rainfall. All of thederivedparameterswere calculated for thetime periods that exactly matched those of the PS displacement data ac-quisition. Thismeans that the parameterswere obtainedbyusing the pre-cipitation value (i.e., number of specific events or quantity of rain) anddividing this value by the time span of the observation in days. These pa-rameters thus express the occurrence rate of a specific rainfall event (pa-rameterswith prefix “OR”) or the average daily rainfall in a specific period(parameters with prefix “ADR”). The parameter name also has a secondpart that indicates the rain events of equal or greater intensity (in mm)that are taken into account. Thus, for example, the parameter ADR20 indi-cates the average daily rainfall (mm day−1) where only rain events≥20 mm are taken into account for a time period that exactly matchestwo consecutive PSInSAR data acquisitions. Descriptions of the nine de-rived parameters are given in Table 1.
Two sets of the derived rainfall parameters were used, where the firstset was calculated using the rawdata of themeasured daily rainfall. How-ever, such an approach is not sufficient enough formulti-dayprecipitationevents. For example, theparameterADR100 fails to detect a severe rainfallevent where 90 mm of rain fell per day for three consecutive days(270 mm total). Thus, additional alterations to the dataset were requiredin order to include eventswhere a large amount of rainfall occurred over along time span. Intense precipitation in the study area normally lasts fromseveral hours to several days (Vrhovec et al., 2004), and themonthly rain-fall record for Sloveniawas 1494 mm inNovember, 2000 (ARSO, 2010) at
Fig. 3. Two examples of permanent scatterers. A) Example where the elevation change of −was not used in our study, despite the fact that it is in an area of active soil creep. B) Solid costones. Such PSs were used for further data processing.
Please cite this article as: Žibret, G., et al., PSInSAR displacements relatedSlovenia, Geomorphology (2012), doi:10.1016/j.geomorph.2012.07.002
the weather station Soča (near a rain gauge that was used in our study).However, the dataset we used shows that high intensity rain events usu-ally end after 2 days, as was the case with the November 2000 event. Be-cause of this, we chose to base the rainfall data transformation on athree-day time period. The 20 mm precipitation threshold was used be-cause the 20 mm daily rain events yielded the best correlations withthe PS vertical displacement measurements (as shown in Section 4).The transformation was thus based on three conditions, where the sumof the rainfall during the three preceding days of the measurement wasconsidered as one single rain event: 1) the amount of rainfall on the 3rdday must be the maximum in the 3 days, 2) on the day after (i.e.,4th day), theremust be a decrease in rainfall, and 3) the sumof the cumu-lative rainfall over the 3 days must exceed 20 mm. If these conditionswere not satisfied, we assumed therewas no rain. Following such a trans-formation, the derived rainfall parameters were then calculated using thesame procedure as above with the raw rainfall dataset, but are markedwith asterisks (*) in order to distinguish them. Their names are as follows(6 parameters): OR20*, OR50*, OR100*, ADR20*, ADR50*, and ADR100*.Table 2 shows an example of the raw and transformeddatasets, accordingto the described procedure, and Table 3 displays an example of the calcu-lation used to obtain the parameters, utilising the dataset in Table 2. Thenext step involved calculating the correlation coefficients between thedisplacement rates and all 15 of the derived parameters, in order to seehow well the PS displacement rates corresponded to the rainfall events.The Statistica application was used for this procedure. Regardless of thecorrelation value, each scatter plot was visually evaluated to avoid themisinterpretation of the obtained correlations.
Taking into account that rain generally requires some time to infiltratethe ground and initiate soil creep, we also tested the dataset for any pos-sible lagged correlations between rainfall and the PS displacement ratesusing different time lags for rainfall (similar to a variogram, but a tempo-ral one, not spatial). With this procedure, the potential temporal
1.52 mm year−1 is most likely associated with the decay of the shed. Because of this, itncrete foundations in a soil creep area on Carboniferous and Permian shales and sand-
to soil creep and rainfall intensities in the Alpine foreland of western

Table 1Description of the derived rainfall parameters. pi: a sequence of daily precipitation measurements expressed as mm day−1. t→t+Δt: time periods between two consecutive mea-surements of permanent scatterer vertical displacement; t is a natural number and denotes days with 1.1.1992 to be a day 1; t∈N; 1≤ t≤ tmax; tmax=3267. |{A}|: cardinality of theset A (the number of the elements in the set A). ∧: logical “and”.
Parametername
Parameter definition Description
OR5 =|{pi: pi>5 mm ∧ i=t, t+1,…, t+Δt}|Δt−1 Occurrence rate of >5 mm rain eventsOR20 =|{pi: pi>20 mm ∧ i=t, t+1,…, t+Δt}|Δt−1 Occurrence rate of >20 mm rain eventsOR50 =|{pi: pi>50 mm ∧ i=t, t+1,…, t+Δt}|Δt−1 Occurrence rate of >50 mm rain eventsOR100 =|{pi: pi>100 mm ∧ i=t, t+1,…, t+Δt}|Δt−1 Occurrence rate of >100 mm rain eventsADR =Σ(pi: i=t, t+1,…, t+Δt)Δt−1 Average daily rainfallADR5 =Σ(pi: pi>5 mm ∧ i=t, t+1,…, t+Δt)Δt−1 Average daily rainfall, only >5 mm eventsADR20 =Σ(pi : pi>20 mm ∧ i=t, t+1,…, t+Δt)Δt−1 Average daily rainfall, only >20 mm eventsADR50 =Σ(pi: pi>50 mm ∧ i= t, t+1,…, t+Δt)Δt−1 Average daily rainfall, only >50 mm eventsADR100 =Σ(pi: pi>100 mm ∧ i=t, t+1,…, t+Δt)Δt−1 Average daily rainfall, only >100 mm events
5G. Žibret et al. / Geomorphology xxx (2012) xxx–xxx
difference between the rainfall event and the actual gravitational slopemass movement was assessed. The time lags used were 0, 3, 7, 14, 30,60, and 90 days.
The correlation coefficients between soil creep (expressed as PS dis-placements rates) and rainfall were calculated separately for each areadue to the different reference points for the two study areas. Moreover,the correlations and other types of data processing used separate rainfalldata for each area. For the BOV area, rainfall data from the rain gauge sta-tion Kobaridwere used, and for the SKL area, the data from the rain gaugestation Cerkno were used. Therefore, the datasets were not comparablewith each other and had to be treated separately.
4. Results and discussion
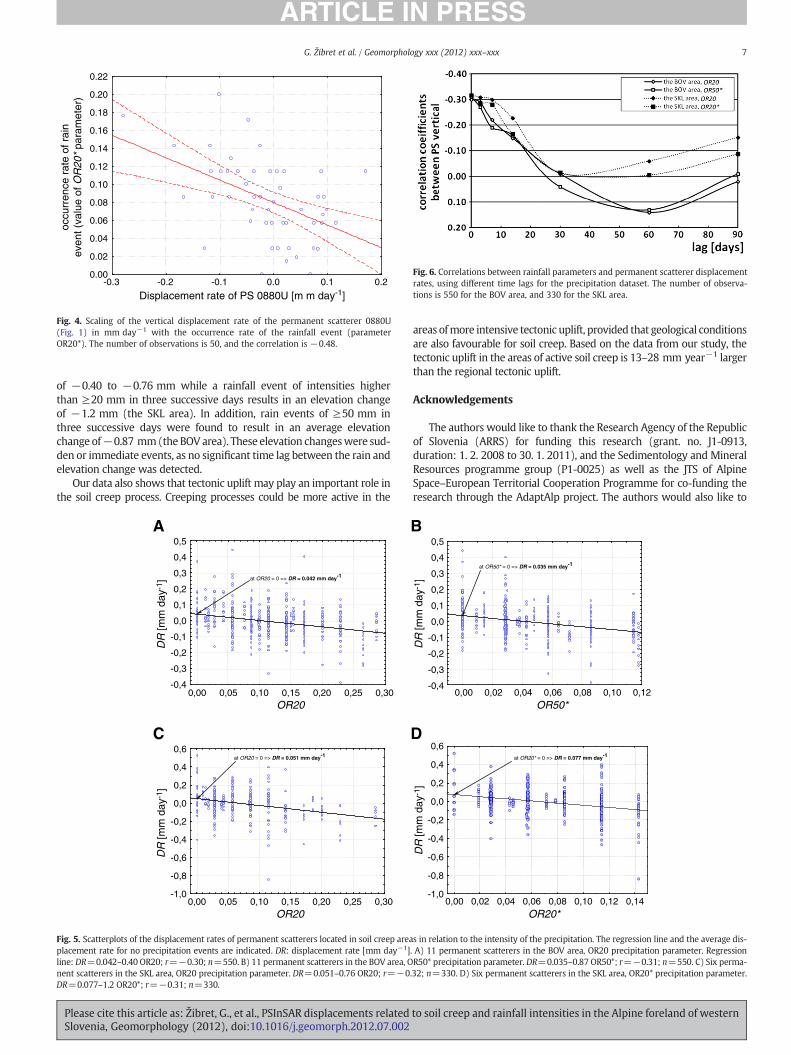
After the in-situ inspection, 11 PSs in the BOV area and 6 PSs in theSKL area were selected for further analysis. This large reduction of thedataset, from a total of 4432 PSs to the final 17, had to be done in orderto ensure that only the most suitable PSs were used for further analysis.The criteria that defined the final selection of PSswere a high enough co-herence value (>0.58), a solid construction (Fig. 3), and a placement onan area of active soil creep. Table 4 shows the correlation coefficients be-tween the displacement rates and the derived precipitation parameters.Fig. 4 shows an example of the scaling of the displacement rates of the PS0880U (shown in Fig. 1) with the occurrence rate of the rainfall event(parameter OR20*).
For the evaluation ofwhich rainfall parameter (and the precipitationlevel that is derived from it) best corresponds to the soil creep process,the average correlation coefficients of the suitable PSs for the BOV andSKL areas were calculated (Table 4). A higher absolute correlation coef-ficient suggests a stronger dependency. The results suggest that lowerintensity precipitation events (between 5 and 50 mm in 1 day) alsocontribute to soil creep; this was surprising as it was primarily expectedthat only strong rain events would have this effect. This also applied tosituations where the same small rate of precipitation occurred over alonger period (3 days in our case; parameters with *).
Furthermore, linear models of soil creep rate in relation to the proba-bility of rain events were made. Only the parameters that deal with thenumber of rain events can be used for this purpose. To derive suchmodels, the PS displacements rates and precipitation parameters thatexpressed the highest average correlation and the highest number of sig-nificant correlations (Table 4)were used for both 1-day and 3-day events.The parameters that meet these conditions are OR20 (Fig. 5A) and OR50*(Fig. 5B) for the BOV area, and OR20 (Fig. 5C) and OR20* (Fig. 5D) for the
Table 2Example of the transformation for the rain events.
Day t t+1 t+2 t+3 t+4 t+5 t+6 t+7 t+8 t+9
Raw [mm] 3.5 26.1 44.7 13.9 26.9 10.6 18.4 13.0 72.1 14.3Transformed 0.0 0.0 74.3 0.0 0.0 0.0 0.0 0.0 103.5 0.0
Please cite this article as: Žibret, G., et al., PSInSAR displacements relatedSlovenia, Geomorphology (2012), doi:10.1016/j.geomorph.2012.07.002
SKL area. Two points on the obtained regression line are important andrequire further discussion. The first point is the value of vertical displace-mentwhen there is a zero occurrence rate for rain events; this value indi-cates the average tectonic uplift for the PSs (and their environs). Thesecond point is obtained when the occurrence rate of the rain event isequal to 1. If one subtracts the tectonic uplift from this second value, theresulting number is equivalent to the average vertical change due to soilcreep, as a consequence of a precipitation event.
In the BOV area, the tectonic uplift is estimated to be between 0.035(Fig. 5A) and 0.042 (Fig. 5B) mm day−1. This corresponds to an annualtectonic uplift of 13–15 mm year−1. For the SKL area, these values areslightly greater, between 0.051 (Fig. 5C) and 0.077 (Fig. 5D) mm day−1,or 19–28 mm year−1. The regional tectonic uplift for the region is esti-mated to be 14 mm year−1 (Komac and Bavec, 2007; Rižnar et al.,2007), but this value is subject to different local deviations due to thecomplex tectonic and geological structure of the area (Kastelic et al.,2008; Lajmiš et al., 2011). It must also be taken into account that thevalues obtained in this study do not show absolute displacements, butrather displacements relative to a reference point, which is also subjectto regional tectonic activity. This means that the tectonic upliftin areas of active soil creep is larger than the regional tectonic uplift by13–28 mm year−1. Such a result might indicate that soil creep isassociated with areas of higher tectonic uplift than the regional average,if geological and other conditions are favourable for soil creep. This is like-ly to be the case as both areas are dissected by faults, making the regionhighly tectonically heterogenic.
As mentioned before, the second significant point on the regressionlines indicates the magnitude of the vertical displacement due to soilcreep, which is a consequence of a rain event. In the case of an average≥20 mm precipitation event (in 1 day), the surface is displaced awayfrom the satellite by −0.4 mm in the BOV area and by −0.76 mm inthe SKL area. The obtained vertical displacement of the terrain awayfrom the satellite for an average three-day ≥50 mm precipitationevent is −0.87 mm for the BOV area. The displacement for an averagethree-day ≥20 mm rain event is −1.2 mm for the SKL area. The differ-ences in the average vertical displacements with regard to the precipita-tion events for both areas can be attributed to the different geologicalsettings where the PSs are situated. In general, the terrain in the SKLarea is more susceptible to landslide occurrence (average landslide sus-ceptibility of 2.7 out of 3) than the terrain in the BOV area (susceptibilityof 1.9) (Table 4). Thus, it is expected that displacements of the PSs in theSKL area can be triggered by lower precipitation intensities than theBOV area.
t+10 t+11 t+12 t+13 t+14 t+15 t+16 t+17 t+18 t+19
0.0 0.0 0.0 0.0 0.0 3.6 32.7 104.9 27.4 0.70.0 0.0 0.0 0.0 0.0 0.0 0.0 141.2 0.0 0.0
to soil creep and rainfall intensities in the Alpine foreland of western

Table 3Calculation of the precipitation variables using data from Table 2.
Parameter OR5 0R20 OR50 OR100 ADR ADR5 ADR20 ADR50 ADR100
Value [mm day−1] 0.632 0.368 0.105 0.0526 21.7 21.3 17.6 9.32 5.52
Parameter – 0R20* OR50* OR100* – ADR5* ADR20* ADR50* ADR100*
Value [mm day−1] – 0.158 0.158 0.105 – 16.8 16.8 16.8 12.9
6 G. Žibret et al. / Geomorphology xxx (2012) xxx–xxx
The results of the temporal dependence test of the gravitationalslope mass movements on rainfall intensities are presented in Fig. 6.This test was made only with the occurrence rate precipitation param-eters that had the highest correlations with the negative displacementrates. These parameters are OR20 and OR50* for the BOV area andOR20 and OR20* for the SKL area. As the time lag between the actualprecipitation event and the mass movement measurement increases,the correlations drop significantly. No significant correlations arerecorded for a lag of 30 days ormore. This result implies that rainfall in-duces instantmassmovements. The trend of increased correlation coef-ficient values at a lag of 90 days, especially for the SKL area, should beregarded as an artefact, because coincidently, some heavy precipitationevents occur approximately 90 days apart, such as the events on 12 Julyand 7 October 1993 (88 days), 23 June and 20 September 1995(90 days), and 3 July and 3 October 1996 (93 days).
The average correlation values for both areas (Table 4) indicate theprecipitation events that trigger themost soil creep. The highest correla-tions for the BOV area are found for the parameters OR20, ADR, ADR5,OR20*, OR50*, and ADR20*. Heavy precipitation parameters, such asOR100 and ADR100, show significantly lower correlations. Similar re-sults are also detected for the SKL area, where the highest correlationsare found for the precipitation parameters OR20, ADR20, OR20*, andADR20*. This means that soil creep is caused not only by heavy rainevents but also by lower intensity events. Our results indicate that thenegative elevation change of PSs are best correlated to the rain eventsof ≥20 mm, and it does not matter significantly whether such eventsoccur over 1 or 3 days.
Overall, it should be considered that there are disadvantages and lim-itations of using PSInSAR data for this type of research, which results inpoor correlations (the largest correlation is −0.48 for the vertical dis-placement rate of PS 0880U with the OR20* precipitation parameter).This suggests that individual rainfall events have a greater influence orthe response window or lag time is very short, something which is not
Table 4Correlation coefficients between the displacement rates and rainfall parameters. Bold numlandslide susceptibility model value (Komac and Ribičič, 2006). C: coherence. Vel: average
Code LS C Vel OR5 OR20 OR50 OR100 ADR ADR5 AD
The BOV area06AB1 1 0.75 2.07 −0.37 −0.25 −0.18 −0.12 −0.31 −0.30 −006Z85 0 0.77 −1.20 −0.29 −0.27 −0.28 −0.18 −0.30 −0.30 −006Z8C 0 0.79 −0.26 −0.40 −0.32 −0.35 −0.36 −0.38 −0.38 −006Z8D 0 0.85 −0.87 −0.39 −0.45 −0.31 −0.22 −0.36 −0.36 −0073TZ 3 0.85 −1.23 −0.22 −0.35 −0.27 −0.23 −0.35 −0.35 −007AYE 3 0.76 −1.02 −0.11 −0.21 −0.34 −0.28 −0.24 −0.24 −007RT1 3 0.75 −1.34 −0.30 −0.34 −0.02 0.01 −0.23 −0.23 −0087SX 3 0.74 −0.96 −0.13 −0.34 −0.16 −0.22 −0.28 −0.29 −00880U 2 0.75 −1.09 −0.37 −0.37 −0.16 −0.26 −0.37 −0.36 −008ADN 3 0.74 −2.06 −0.36 −0.24 −0.25 −0.28 −0.33 −0.33 −008AJB 3 0.75 −0.99 −0.44 −0.37 −0.36 −0.26 −0.37 −0.38 −0AVG 1.9 −0.31 −0.32 −0.24 −0.22 −0.32 −0.32 −0
The SKL areaA1LYO 2 0.83 −4.37 −0.33 −0.22 −0.16 −0.14 −0.32 −0.32 −0A1I9G 2 0.85 0.03 −0.28 −0.31 −0.13 −0.10 −0.28 −0.28 −0A1J0R 3 0.61 −0.72 −0.33 −0.38 −0.32 −0.06 −0.36 −0.36 −0A1LCC 3 0.71 1.52 −0.26 −0.32 −0.30 −0.12 −0.28 −0.28 −0A1LIU 3 0.63 1.01 −0.14 −0.35 −0.21 −0.11 −0.26 −0.26 −0A1LJL 3 0.58 −0.12 −0.18 −0.32 −0.22 −0.08 −0.23 −0.24 −0AVG 2.7 −0.25 −0.32 −0.22 −0.10 −0.29 −0.29 −0
Please cite this article as: Žibret, G., et al., PSInSAR displacements relatedSlovenia, Geomorphology (2012), doi:10.1016/j.geomorph.2012.07.002
detected with the PSInSAR methodology since PS vertical displacementmeasurements take place every 35 days or more. The methodologyused in our researchwas also not able to detect soil creep during very in-tense rain events. The poor correlation between PS displacement ratesand extreme rainfall events (≥100 mm day−1) can be attributed firstlyto the small andunrepresentative number of such events. In the SKL area,there were only three events with precipitation over 100 mm day−1,while in the BOV area, there were eight such events. The second reasonfor the poor correlation could be the fact that heavy rainfall triggersother, faster types of slope mass movements resulting in displacementsof a higher order ofmagnitude,which cannot be detected by the PSInSARtechnique. As previously mentioned, the displacement detection limit ofthe PSInSAR technique is 0.8 mm day−1 or 28 mm in 35 days. In addi-tion, snow cover can induce soil creep in both research areas but wasnot taken into account in this study. The data regarding the height ofthe snow cower was missing, thus the contribution of snowmelt to thequantity of ground water was not considered. This effect certainly addssome additional noise in the dataset, but we think it not enough tochange our main results.
5. Conclusions
The relationship between daily rainfall and displacement rates of ob-jects located on areas of active soil creep, as measured by the PSInSARtechnique, was addressed in this study. Data of displacement rates for11 PSs in the BOV area and 6 PSs in the SKL area as well as daily rainfalldata throughout an eight-year period was used for this purpose. Our re-sults indicate that soil creep can be triggered by low-intensity rainfall.The greatest influence on PS displacement rates was detected with rain-fall intensities of≥20 mm in 1 day or an accumulation of≥20 mmover3 days. Rain events of lower intensities were not found to be an impor-tant factor for triggering soil creep process. Developed models showedthat a rainfall event of ≥20 mm day−1 results in an elevation change
bers represent statistically significant correlations for the significance level of 95%. LS:10-year displacement rate [mm year−1]. AVG: average values.
R20 ADR50 ADR100 OR20* OR50* OR100* ADR20* ADR50* ADR100*
.25 −0.19 −0.16 −0.30 −0.28 −0.15 −0.27 −0.25 −0.16
.28 −0.27 −0.20 −0.37 −0.37 −0.27 −0.34 −0.32 −0.26
.34 −0.33 −0.32 −0.30 −0.36 −0.28 −0.35 −0.33 −0.27
.34 −0.26 −0.16 −0.46 −0.33 −0.28 −0.38 −0.30 −0.24
.37 −0.32 −0.28 −0.24 −0.41 −0.27 −0.33 −0.36 −0.27
.28 −0.34 −0.25 −0.28 −0.28 −0.25 −0.34 −0.32 −0.27
.20 −0.07 −0.06 −0.33 −0.38 −0.05 −0.25 −0.24 −0.06
.33 −0.26 −0.26 −0.26 −0.34 −0.27 −0.34 −0.34 −0.27
.34 −0.22 −0.30 −0.48 −0.21 −0.25 −0.36 −0.25 −0.24
.29 −0.28 −0.30 −0.23 −0.26 −0.31 −0.34 −0.33 −0.34
.33 −0.30 −0.21 −0.30 −0.34 −0.25 −0.35 −0.33 −0.25
.30 −0.26 −0.23 −0.32 −0.32 −0.24 −0.33 −0.31 −0.24
.29 −0.19 −0.14 −0.16 −0.32 −0.42 −0.28 −0.34 −0.40
.27 −0.13 −0.10 −0.38 −0.25 −0.12 −0.33 −0.24 −0.12
.36 −0.30 −0.06 −0.36 −0.32 −0.11 −0.34 −0.30 −0.09
.28 −0.28 −0.12 −0.37 −0.12 0.12 −0.28 −0.13 0.11
.32 −0.22 −0.11 −0.35 −0.13 0.00 −0.30 −0.14 0.00
.29 −0.22 −0.08 −0.27 −0.27 −0.16 −0.28 −0.27 −0.15
.30 −0.22 −0.10 −0.32 −0.23 −0.11 −0.30 −0.24 −0.11
to soil creep and rainfall intensities in the Alpine foreland of western
-0.3 -0.2 -0.1 0.0 0.1 0.2
Displacement rate of PS 0880U [m m day-1]
0.00
0.02
0.04
0.06
0.08
0.10
0.12
0.14
0.16
0.18
0.20
0.22oc
curr
ence
rat
e of
rai
n ev
ent (
valu
e of
OR
20*
para
met
er)
Fig. 4. Scaling of the vertical displacement rate of the permanent scatterer 0880U(Fig. 1) in mm day−1 with the occurrence rate of the rainfall event (parameterOR20*). The number of observations is 50, and the correlation is −0.48.
Fig. 6. Correlations between rainfall parameters and permanent scatterer displacementrates, using different time lags for the precipitation dataset. The number of observa-tions is 550 for the BOV area, and 330 for the SKL area.
7G. Žibret et al. / Geomorphology xxx (2012) xxx–xxx
of −0.40 to −0.76 mm while a rainfall event of intensities higherthan ≥20 mm in three successive days results in an elevation changeof −1.2 mm (the SKL area). In addition, rain events of ≥50 mm inthree successive days were found to result in an average elevationchange of−0.87 mm(the BOV area). These elevation changeswere sud-den or immediate events, as no significant time lag between the rain andelevation change was detected.
Our data also shows that tectonic uplift may play an important role inthe soil creep process. Creeping processes could be more active in the
A
0,00 0,05 0,10 0,15 0,20 0,25 0,30OR20
-0,4
-0,3
-0,2
-0,1
0,0
0,1
0,2
0,3
0,4
0,5
DR
[mm
day
-1] at OR20 = 0 => DR = 0.042 mm day-1
C
0,00 0,05 0,10 0,15 0,20 0,25 0,30OR20
-1,0
-0,8
-0,6
-0,4
-0,2
0,0
0,2
0,4
0,6
DR
[mm
day
-1]
at OR20 = 0 => DR = 0.051 mm day-1
Fig. 5. Scatterplots of the displacement rates of permanent scatterers located in soil creep areaplacement rate for no precipitation events are indicated. DR: displacement rate [mm day−1]line: DR=0.042–0.40 OR20; r=−0.30; n=550. B) 11 permanent scatterers in the BOV area, Onent scatterers in the SKL area, OR20 precipitation parameter. DR=0.051–0.76 OR20; r=−0DR=0.077–1.2 OR20*; r=−0.31; n=330.
Please cite this article as: Žibret, G., et al., PSInSAR displacements relatedSlovenia, Geomorphology (2012), doi:10.1016/j.geomorph.2012.07.002
areas ofmore intensive tectonic uplift, provided that geological conditionsare also favourable for soil creep. Based on the data from our study, thetectonic uplift in the areas of active soil creep is 13–28 mm year−1 largerthan the regional tectonic uplift.
Acknowledgements
The authors would like to thank the Research Agency of the Republicof Slovenia (ARRS) for funding this research (grant. no. J1-0913,duration: 1. 2. 2008 to 30. 1. 2011), and the Sedimentology and MineralResources programme group (P1-0025) as well as the JTS of AlpineSpace–European Territorial Cooperation Programme for co-funding theresearch through the AdaptAlp project. The authors would also like to
B
0,00 0,02 0,04 0,06 0,08 0,10 0,12OR50*
-0,4
-0,3
-0,2
-0,1
0,0
0,1
0,2
0,3
0,4
0,5
DR
[mm
day
-1]
at OR50* = 0 => DR = 0.035 mm day-1
D
0,00 0,02 0,04 0,06 0,08 0,10 0,12 0,14OR20*
-1,0
-0,8
-0,6
-0,4
-0,2
0,0
0,2
0,4
0,6
DR
[mm
day
-1]
at OR20* = 0 => DR = 0.077 mm day-1
s in relation to the intensity of the precipitation. The regression line and the average dis-. A) 11 permanent scatterers in the BOV area, OR20 precipitation parameter. RegressionR50* precipitation parameter. DR=0.035–0.87 OR50*; r=−0.31; n=550. C) Six perma-.32; n=330. D) Six permanent scatterers in the SKL area, OR20* precipitation parameter.
to soil creep and rainfall intensities in the Alpine foreland of western

8 G. Žibret et al. / Geomorphology xxx (2012) xxx–xxx
thank the reviewers and the editor Takashi Oguchi, for their valuablesuggestions and corrections.
References
Ambrosi, C., Crosta, G.B., 2006. Large sackung along major tectonic features in theCentral Italian Alps. Engineering Geology 88, 183–200.
ARSO, 2010. Slovenski vremenski rekordi (Slovenian weather records. Last updated on26 October 2010 Environmental Agency of the Republic of Slovenia, Ljubljana.
Bavec, M., Tulaczyk, S.M., Mahan, S.A., Stock, G.M., 2004. Late Quaternary glaciation ofthe upper Soča river region (Southern Julian Alps, NW Slovenia). SedimentaryGeology 165, 265–283.
Berardino, P., Fornaro, G., Lanari, R., Sansosti, E., 2002. A new algorithm for surface de-formation monitoring based on small baseline differential SAR interferograms.IEEE Transactions on Geoscience and Remote Sensing 40, 2375–2383.
Bovenga, F., Nutricato, R., Refice, A., Wasowski, J., 2006. Application of multi-temporaldifferential interferometry to slope instability detection in urban/peri-urban areas.Engineering Geology 88, 218–239.
Bovenga, F., Wasowski, J., Nitti, D.O., Nutricato, R., Chiaradia, M.T., 2012. Using COSMO/SkyMed X-band and ENVISAT C-band SAR interferometry for landslides analysis.Remote Sensing of Environment 119, 272–285.
Buser, S., 2010. Geološka karta Slovenije (Geological map of Slovenia. Digital mapGeološki zavod Slovenije, Ljubljana.
Calabro, M., Schmidt, D., Roering, J., Douglas, R., 2007. Spatial and temporal character-ization of the Portuguese Bend landslide, California, using InSAR. EOS TransactionsAGU 88 (52) (Fall Meet. Suppl., Abstract: G53A-07).
Carnec, C., Delacourt, C., 2000. Three years of mining subsidence monitored by SARinterferometry, near Gradane. Journal of Applied Geophysics 43, 43–54.
Colesanti, C., Wasowski, J., 2006. Investigating landslides with space-borne syntheticaperture radar (SAR) interferometry. Engineering Geology 88, 173–199.
Colesanti, C., Ferretti, A., Prati, C., Rocca, F., 2003. Monitoring landslides and tectonicmotions with the permanent scatterers technique. Engineering Geology 68, 3–14.
Declerq, P.Y., Devleeschouwer, X., Pouriel, F., 2005. Subsidence revealed by PSInSARtechnique in the Ottignies–Wavre area (Belgium) related to water pumping inurban area. In: Lacoste, H., Ouwehand, L. (Eds.), Proceedings of Fringe 2005 Work-shop, 28 November–2 December 2005, Frascati, Italy, (ESA SP-610, February 2006).European Space Agency, Noordwijk, Netherlands, pp. 66.1–66.6.
Farina, P., Colombo, D., Fumagalli, A., Marks, F., Moretti, S., 2006. Permanent scatterersfor landslide investigations: outcomes from the ESA—SLAM project. EngineeringGeology 88, 200–217.
Ferretti, A., Prati, C., Rocca, F., 2001. Permanent scatterers in SAR interferometry. IEEETransactions on Geoscience and Remote Sensing 39, 8–20.
Ferretti, A., Bianchi, M., Prati, C., Rocca, F., 2005. Higher-order permanent scatterersanalysis. EURASIP Journal on Applied Signal Processing 20, 3231–3242.
Fruneau, B., Achace, C., Delacourt, C., 1996. Observation and modelling of the Saint-Etienne-de-Tinee landslide using SAR interferometry. Tectonophysics 265, 181–190.
Guzzetti, F., Cardinali, M., Reichenbach, P., Cipolla, F., Sebastiani, C., Galli, M., Salvati, P.,2004. Landslides triggered by the 23 November 2000 rainfall event in the ImperiaProvince, Western Liguria, Italy. Engineering Geology 73, 229–245.
Hilley, G.E., Bürgmann, R., Ferretti, A., Novali, F., Rocca, F., 2004. Dynamics of slow-moving landslides from permanent scatterer analysis. Science 304, 1952–1955.
Hinkelmann, R., Zeheb, E., Ehlersc, W., Joswigd, M., 2011. Special section on landslides:setting the scene and outline of contributing studies. Vadose Zone Journal 10,473–476.
Hu, J.C., Huang, M.H., Tung, H., Ching, K.E., Rau, R.J., Lin, C.W., 2009. Monitoring of activefaults in Taiwan by geodetic measurements. In: Koizumi, N., Matsumoto, N., Shieh,C.L. (Eds.), Proceedings of the 7th Japan–Taiwan International Workshop on Hy-drological and Geochemical Research for Earthquake Prediction. Geological Surveyof Japan. Openfile Report, no. 493.
Please cite this article as: Žibret, G., et al., PSInSAR displacements relatedSlovenia, Geomorphology (2012), doi:10.1016/j.geomorph.2012.07.002
Iverson, R.M., 2000. Landslide triggering by rain infiltration. Water Resources Research36, 1897–1910.
Jemec, M., Komac, M., 2011. Rainfall patterns for shallow landsliding in perialpine Slovenia.Natural Hazards 13, http://dx.doi.org/10.1007/s11069-011-9882-9.
Kastelic, V., Vrabec, M., Cunningham, D., Gosar, A., 2008. Neo-Alpine structural evolu-tion and present-day tectonic activity of the eastern Southern Alps: the case ofthe Ravne Fault, NW Slovenia. Journal of Structural Geology 30, 963–975.
Komac, M., 2006. A landslide susceptibility model using the analytical hierarchy pro-cess method and multivariate statistics in perialpine Slovenia. Geomorphology74, 17–28.
Komac, M., Bavec, M., 2007. Application of PSInSAR for observing the vertical compo-nent of the recent surface displacement in Julian Alps. Geologija 50, 97–110.
Komac, M., Ribičič, M., 2006. Landslide susceptibility map of Slovenia at scale 1:250.000.Geologija 49, 295–309.
Lajmiš, L., Žalohar, J., Gregorič, A., Vrabec, M., 2011. Kinematic and paleostress evolutionof NW–SE trending “Dinaric” faults in Slovenia — a case for Neogene orogen-perpendicular extension in the External Dinaries. Geophysical Research Abstracts13 (EGU2011), 12443.
Lollino, G., Arattano, M., Allasia, P., Giordan, D., 2006. Time response of a landslide tometeorological events. Natural Hazards and Earth System Sciences 6, 179–184.
Meisina, C., Zucca, F., Fossati, D., Ceriani, M., Allievi, J., 2006. Ground deformation mon-itoring by using the permanent scatterers technique: the example of the OltrepoPavese (Lombardia, Italy). Engineering Geology 88, 240–259.
Oštir, K., 2000. Analiza vpliva združevanja radarskih interferogramov na natančnostmodelov višin in premikov zemeljskega površja (Analysis of joining the interfero-grams to the precision of elevation models and displacements of earth surface).Ph.D. Thesis, Univ. of Ljubljana, Slovenia.
Oštir, K., 2006. Daljinsko zaznavanje (Remote Sensing). Založba ZRC, Ljubljana.Oštir, K., Komac, M., 2007. PSInSAR and DInSAR methodology comparison and their ap-
plicability in the field of surface deformations — a case of NW Slovenia. Geologija50, 77–96.
Placer, L., 2008. Osnove tektonske razčlenitve Slovenije (Principles of the tectonic sub-division of Slovenia). Geologija 51, 205–217.
Poljak, M., Živčić, M., Zupančič, P., 2000. The seismotectonic characteristics of Slovenia.Pure and Applied Geophysics 157, 37–55.
Rižnar, I., Koler, B., Bavec, M., 2007. Recentna aktivnost regionalnih geoloških struktur vzahodni Sloveniji (Recent activity of the regional geologic structures in westernSlovenia). Geologija 50, 111–120.
Rotaru, A., Oajdea, D., Răileanu, P., 2007. Analysis of the landslide movements. Interna-tional Journal of Geology 1, 70–79.
Rott, H., Nagler, T., 2006. The contribution of radar interferometry to the assessment oflandslide hazards. Advances in Space Research 37, 710–719.
Salvi, S., Atzori, S., Tolomei, C., Allievi, J., Ferretti, A., Rocca, F., Prati, C., Stramondo, S.,Feuillet, N., 2004. Inflation rate of the Colli Albani volcanic complex retrieved bythe permanent scatterers SAR interferometry technique. Geophysical Research Let-ters 31, 12606–12610.
TRE, 2008. Analysis of the western Slovenia area with the PS technique™. Tele-Rilevemento Europa, Processing Report Ref: 08.044C (05/06/2008).
Vrhovec, T., Rakovec, J., Gregorič, G., 2004. Mesoscale diagnostics of prefrontal andfrontal precipitation in the southeast Alps during MAP IOP 5. Meteorology and At-mospheric Physics 86, 15–29.
Yu, F.C., Chen, T.C., Lin, M.L., Chen, C.Y., Yu, W.H., 2006. Landslides and rainfall charac-teristics analysis in Taipei City during the Typhoon Nari event. Natural Hazards 37,153–167.
Zupančič, B., 1995. Klimatografija Slovenije. Količina padavin: obdobje 1961–1990(Climatic Conditions in Slovenia. Quantity of Rainfall: Between 1961–1990). En-vironmental Agency of the Republic of Slovenia, Ljubljana.
to soil creep and rainfall intensities in the Alpine foreland of western