psc corporation ltd - hanwell corporation ltd psc corporation ltd company registration no:...
TRANSCRIPT

PS
C C
OR
PO
RA
TIO
N LT
D
PSC CORPORATION LTDCompany Registration No: 197400888M
Incorporated in the Republic of Singapore
348 Jalan Boon Lay Singapore 619529Tel: +65 6268 4822 Fax: +65 6266 2607
www.psc.com.sg
AN
NU
AL R
EPO
RT 2
01
1 A N N U A L R E P O R T
F I R S T I N F A M I LY E S S E N T I A L S
2011

CONTENTS01 Vision and Mission
02 Executive Chairman’s Message
08 Board of Directors
12 Group Financial Summary
15 Operational Review
32 Corporate Information
33 Corporate Governance Statement53 Statutory Accounts141 Supplementary Information145 Shareholding Statistics147 Notice of Annual General Meeting
Designed and produced by
(65) 6578 6522

PSC CORPORATION LTDANNUAL REPORT 2011 01
VISION
To be a multi-faceted consumer essentials company with strategic investments in the region
MISSION
Building strong partnerships, growing new markets
Fostering an open and creative culture, attracting and nurturing talents
Providing innovative products, portfolio building, meeting stakeholders’ needs
Achieving operational excellence
Building strong fi nancial capabilities
EXECUTIVE CHAIRMAN’S MESSAGE
PSC CORPORATION LTDANNUAL REPORT 201102
Dear Shareholders,
PSC Group faced signifi cant challenges in FY2011. Against a steadily improving local economy which has been plagued by the global fi nancial turmoil, the Group has maintained its prudent approach in managing its business. With continuous improvements in its operations and deployment of its investments, the Group has a healthy balance sheet with a reasonable leverage.
By having diverse consumer businesses within the fast moving consumer goods (“FMCG”) segment and by focusing on brand management as an important driver for the Group’s future growth, we have established extensive business networks which have enabled us to gain leverage for our different business lines. Over the years, riding on our comprehensive distribution network, excellent brand reputation and strategic marketing initiatives, we have built signifi cant market shares for popular proprietary brands such as Royal Umbrella, Beautex, Fortune and Sobe. Our continuous efforts in research and development have also enabled us to launch many successful consumer products. Customers have witnessed our results all these years and have grown to associate PSC with quality and innovation – the two hallmarks of the Group.
The year in review
PSC’s revenue for FY2011 saw an increase to $392.84 million which represented a 5.1% increase from FY2010. However, impacted by high raw material costs, PSC’s gross profi t for FY2011 was reduced to $76.16 million which was a decrease of 6.6% from FY2010, while gross profi t margin declined from 21.8% in FY2010 to 19.4% in FY2011.
In line with the Group’s tight control measures, distribution expenses remained relatively stable at $38.86 million, while administrative expenses decreased 6.1% to $29.34 million due in part to a lower level of operating activities. Coupled with net fi nance costs of $4.44 million (as compared to an income of $4.86 million in FY2010), as well as share of losses amounting to $2.07 million incurred by our associates in Singapore and Cambodia (as compared to share of profi ts of $4.81 million in FY2010), the Group’s FY2011 net profi t declined 74.1% to $4.49 million.
Notwithstanding the lower profi tability, PSC’s Consumer Business, which generated 57.0% of our total revenue, was further strengthened in FY2011. We were able to achieve this through an enhanced product mix in Singapore and Malaysia, by adopting fl exible operational strategies and strategic marketing initiatives covering both general and modern retail channels. In addition, we also leveraged on our comprehensive distribution network which enabled us to develop mutually benefi cial relationships with customers. Profi t before interest and tax for Consumer Business improved 44.8% to $8.68 million.
The two key projects under Health Solutions continued to progress well in FY2011. The Cheras Rehabilitation Hospital in Malaysia is expected to be operational by the second half of 2012, while the Likas Nuclear and Radiotherapy Medical Center in Kota Kinabalu is scheduled to commence operations by 2013. As the bulk of work for these two projects had been completed and billed, revenue for Health Solutions stood at $2.06 million – 68.1% lower than FY2010. Though we believe that our Health Solutions business will remain positive with the support of the rigid demand for healthcare in the region, we will adopt a cautious approach and review our business plans and strategies accordingly before making any further investments.
Our packaging business under the Group’s Strategic Investments, which generated 42.5% of our total revenue, witnessed an 8.8% increase in revenue to $166.80 million in FY2011, but profi t before interest and tax dipped 25.7% to $6.21 million due primarily to high raw material costs. The business successfully commenced its fourth plant in China in February 2011, this time in the Tongzhou district of Nantong City. The plant not only generated new business for the Group in FY2011, but more signifi cantly, managed to generate profi ts 11 months after commencement. We view this as a feat considering the intense competition faced by the packaging industry in China.
Our packaging business will focus on improving effi ciency to produce higher quality corrugated paper packaging products, and at the same time, keeping production costs lean. We look forward to the completion of the Nantong
In line with the Group’s tight
control measures, distribution
expenses remained relatively stable
at $38.86 million, while administrative expenses decreased
6.1% to $29.34 million due in part to a lower level of
operating activities.
In addition, we also leveraged on our
comprehensive distribution network
which enabled us to develop
mutually benefi cial relationships with customers. Profi t
before interest andtax for Consumer
Business improved 44.8% to $8.68 million.

PSC CORPORATION LTDANNUAL REPORT 2011 03
Rugao’s plant upgrading exercise to improve the quality and effi ciency of its production line and ancillary equipment. We believe this will ultimately enhance the plant’s competitiveness in the Nantong Rugao Area.
Dividend
To reward loyal shareholders, who continue to believe in the Group’s growth strategies, the Board of Directors has decided to declare a dividend of 1.0 Singapore cents per share, a payout that is similar to last year, notwithstanding the Group’s lower profi tability in FY2011.
Realising investments
Part of our strategy to add value to the Group is to identify investment opportunities, and to acquire a stake in enterprises where we believe have potential and subsequently divest them at the right time to realise the investment. During the year in review, we divested our entire stake (17.63%) in Malaysia-listed Pulai Springs Berhad (“PSB”) for a total cash consideration of approximately $8.89 million in September 2011. The proceeds from the share sale represented 8.2% of PSC’s market capitalisation at that point in time.
During the year in review, we also spotted favourable demand for our property interests and investment properties in China and Malaysia and decided on a divestment to realise gains. This resulted in an 86.8% surge in other income to $6.71 million. The Group is cautiously optimistic about the China property market. We will continue to seek further development opportunities by monitoring the market situation in various Asian markets where we will build our foothold. At the same time, we also hold a prudent approach in developing our China interest by appropriately adjusting our plan according to market and policy variations.
For the years ahead, we will simultaneously focus our efforts on identifying investment gems that we believe will strengthen the Group’s fi nancial position, as well as to adopt a cautious approach in evaluating any further investment opportunities.
Rising to meet challenges
Looking ahead, in light of the uncertainties of the overall operating environment as well as the infl ationary pressures faced by the global economies, focus will be placed on strengthening our cost management, fi nancial and risk control in order to meet challenges arising from these external factors. In addition, priority will be given to optimising management processes in order to improve our ability to respond to contingencies and to enhance the overall effi ciency of the Group.
We will also keep up with our prudent capital management, ensuring healthy cash fl ows as we believe a strong cash position will equip the Group with suffi cient resources to fund growth plans when opportunities arise. We have improved our cash position in FY2011. As at 31 December 2011, our cash and cash equivalents stood at $49.37 million – a 27.4% increase as compared with that of 31 December 2010. This robust liquidity is able to effectively support our existing operations as well as to fund new development plans.
As a Group, we will leverage on our leadership position in the FMCG segment to further strengthen our foothold in the industry. Specifi cally, we will continue with our three-pronged growth strategy in FY2012 to augment our Consumer Business – a key driver of PSC. All efforts will be channelled into expansion of our current portfolio of products, adding new agencies to expand our range of third party products, as well as widening our distribution network in Singapore and Malaysia to expand our market coverage.
We have witnessed success with this strategy in FY2011. Socma, our marketing and distribution arm in Malaysia, expanded its snacks category with fi ve new products. In Singapore, our Retail Chilled Division under the Fortune Food Group expanded its nutritious offerings by launching three Omega 3-related soy based products and two new UHT organic soymilk, while Tipex launched a new type of baby wipes under the renowned Beautex brand, as well as introduced BabyLove GrowPants, a type of training pants for babies, into the market. We will continue to enhance our brand portfolio in order to provide additional range of high quality and value products to our customers, thereby encouraging customer loyalty and acting as growth drivers for future profi ts.

EXECUTIVE CHAIRMAN’S MESSAGE
PSC CORPORATION LTDANNUAL REPORT 201104
Our various subsidiaries will continue to build foundations for future growth by expanding their agency portfolio through addition of new brands and products. Topseller entered into partnership agreements with three new principals, Vance Chemical, Ligo and Liu Shen, to distribute and market their products in Singapore. The Food Services division of the Fortune Food Group secured distributorship for short grain rice and basmati rice from the USA, India and Pakistan, effectively expanding its pool of rice suppliers beyond Thailand and Vietnam.
Under our Lifestyle business arm, D&P’s success in expanding its distribution network for Rockport in FY2011 is extremely noteworthy. It opened two concept stores and secured retail space in all departmental stores in Singapore. In Malaysia and Brunei, it started seven concept stores and penetrated into two departmental stores respectively. Moving forward, the Group will closely monitor market conditions and implement appropriate business plans and strategies accordingly.
As a consumer business, apart from the introduction of new products and agencies, strategic marketing initiatives continue to be of considerable signifi cance to the Group’s growth potential. In addition to our focus on exclusive brands, we will continue to optimise results from our current product portfolio through various measures including enhanced marketing initiatives. Many of these marketing initiatives had experienced resounding success and market response which became the talk of the town in FY2011. The Group is cautiously optimistic about the development of the local retail industry. We are confi dent that our determined efforts to continually expand and diversify our product portfolio, improve operational performance, business process effi ciency and management controls will allow us to sharpen our competitive advantage in the intensely competitive market for consumer business.
Let me assure you that by building on the platform that we have already established, the Group is confi dent of sustaining its growth momentum in the extremely competitive FMCG market.
The Group will keep monitoring the risks affecting our operations and adjust our plans and executions for your best interests. We will continue to build on the strategic momentum to reach our full growth potential in both existing markets and in new ones.
Corporate citizenship
We believe in the importance of corporate social responsibility and actively focus on social investments in order to make contributions to the society. Through Tipex, our tie up with “The Straits Times School Pocket Money Fund” for the annual Beautex “Life’s Beautiful” Art Competition, we aim to nurture and provide young talents with opportunities through their participation in art creation. Such an event also allows us to raise funds for needy, school-going children; the future leaders of society.
Words of appreciation
I would like to offer my utmost appreciation to every member of the staff for their loyalty and diligence. The Group relies on the dedicated efforts, effi ciency and responsiveness from uncompromising management and staff in order to achieve our successes. We will strengthen and reinforce the overall quality of our management team by recruiting individuals of high calibre to improve operational management and to enhance the potential for progress of the Group’s business.
I am sure that the Group will march forward to the future secured in the belief that we will continue to reward the confi dence of both our employees and shareholders with increased shareholder value in the coming years. I look forward to working closely with each and every valued member of the PSC family, including our suppliers, to achieve better results in FY2012.
I would also like to take this opportunity to thank you, our valued shareholder, for your ongoing and relentless support and for sharing in our future mission and strategic vision. To our customers, thank you for trusting the PSC brand. We will keep monitoring risks and adjust our plans for the best interests of our shareholders.
Dr Allan YapExecutive Chairman
PSC CORPORATION LTDANNUAL REPORT 2011 05
执行董事主席致辞
“ ”
PSC CORPORATION LTDANNUAL REPORT 201106
执行董事主席致辞
“ ”

PSC CORPORATION LTDANNUAL REPORT 2011 07
“ ”
“ ’ ”
Allan Yap

BOARD OF DIRECTORS
PSC CORPORATION LTDANNUAL REPORT 201108
Dr Allan Yap joined PSC Corporation Ltd in September 2002 and was appointed as Executive Chairman in February 2003. His portfolio includes 29 years of experience in finance, investment and banking. Dr Allan Yap is the Executive Chairman of Intraco Limited and Tat Seng Packaging Group Ltd. He is the Chairman of Hanny Holdings Limited and an Alternate Director of Television Broadcasts Limited, both of which are Hong Kong-listed companies. He is also the Chairman of China Enterprises Limited, the shares of which are traded on the OTC Securities Market in the United States of America. Dr Allan Yap is the Chairman and Chief Executive Officer of Burcon NutraScience Corporation, a public listed company listed on the Toronto Stock Exchange in Canada, NASDAQ Stock Exchange in the United States of America, and the Frankfurt Stock Exchange in Germany. He received an Honorary Degree of Doctor of Laws from the University of Victoria, Canada.
Dr John Chen sits on the Board of a number of public listed companies. He was a Member of Parliament from 1988 to 2006. He served as the Assistant Secretary General of the National Trades Union Congress from 1991 to 1997. He was a Minister of State from 1997 to 2001. He is presently the Managing Director of JCL Business Development Pte Ltd, and the Chairman of SAC Capital Private Limited. Dr John Chen has been a Board member of the Economic Development Board, the Housing & Development Board, the Port of Singapore Authority and Singapore Power Ltd.
Mr Foo has been holding the position of Managing Director and Chief Executive Officer of PSC Corporation Ltd for the past 9 years. He is presently the Executive Director of Intraco Limited and Tat Seng Packaging Group Ltd, both Singapore-listed companies.
Mr Foo graduated with a Bachelor of Commerce degree from Nanyang University. He has a wealth of experience and knowledge in business development, corporate restructuring, investment strategies and operations management in FMCG, services and manufacturing.
DR ALLAN YAPEXECUTIVE CHAIRMAN
DR JOHN CHEN SEOW PHUNDEPUTY CHAIRMAN/
NON-EXECUTIVE DIRECTOR
MR FOO DER RONGMANAGING DIRECTOR AND
CHIEF EXECUTIVE OFFICER

PSC CORPORATION LTDANNUAL REPORT 2011 09
Mr Chee, PBM, was appointed as an Independent Director on 1 August 1990. Mr Chee holds a Bachelor of Laws (Hons) Degree from the University of Singapore. Mr Chee is admitted as a Solicitor of the Senior Courts of England and Wales. Since 1980 he has been an advocate and solicitor of the Supreme Court of the Republic of Singapore. He is now practicing as a Senior Legal Consultant with KhattarWong.
Mr Chee is a Notary Public and a Commissioner for Oaths. He is a member of Singapore Institute of Arbitrators and Singapore Institute of Directors. He also sits on the Board of other public listed companies.
Mr Chee is active in community service and is the Vice Chairman of Teck Ghee Community Club and the Organising Chairman of National Street Soccer League. Mr Chee is the recipient of the National Day Awards 2003 – The Public Service Medal (Pingat Bakti Masyarakat) from the President of Republic of Singapore.
Mr Tao has a strong background in human resource management and has over 20 years of experience in the print and broadcast media and also in the high-end manufacturing sector. He currently sits on the board of several companies listed on the Singapore Exchange Securities Trading Limited.
MR CHEE TECK KWONG PATRICKNON-EXECUTIVE DIRECTOR/INDEPENDENT DIRECTOR
MR TAO YEOH CHI NON-EXECUTIVE DIRECTOR/
INDEPENDENT DIRECTOR
Madam Tang was appointed as an Executive Director of the Board on 1 August 2011. Madam Tang has a wealth of management experience and is well versed in marketing, business development and investments in property and securities. She is presently the Executive Director of Intraco Limited and Tat Seng Packaging Group Ltd, both Singapore-listed companies. Madam Tang also sits on the Boards of Richstream Pte Ltd and SingExpress Travel Pte Ltd and is the Marketing Director of Ette Bright International. Madam Tang holds a degree in Business Management from Zhongshan University, Guangzhou, one of the top Universities in the People’s Republic of China.
MADAM TANG CHEUK CHEEEXECUTIVE DIRECTOR
BOARD OF DIRECTOR
PSC CORPORATION LTDANNUAL REPORT 201110
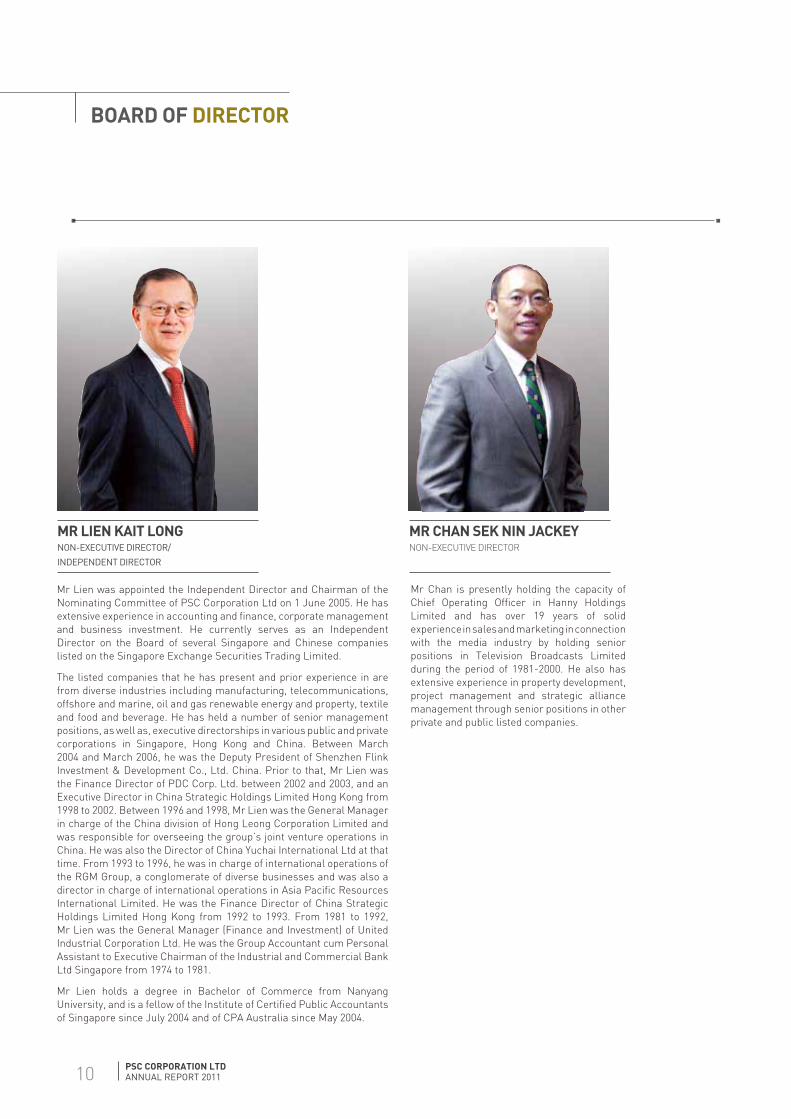
Mr Chan is presently holding the capacity of Chief Operating Officer in Hanny Holdings Limited and has over 19 years of solid experience in sales and marketing in connection with the media industry by holding senior positions in Television Broadcasts Limited during the period of 1981-2000. He also has extensive experience in property development, project management and strategic alliance management through senior positions in other private and public listed companies.
Mr Lien was appointed the Independent Director and Chairman of the Nominating Committee of PSC Corporation Ltd on 1 June 2005. He has extensive experience in accounting and finance, corporate management and business investment. He currently serves as an Independent Director on the Board of several Singapore and Chinese companies listed on the Singapore Exchange Securities Trading Limited.
The listed companies that he has present and prior experience in are from diverse industries including manufacturing, telecommunications, offshore and marine, oil and gas renewable energy and property, textile and food and beverage. He has held a number of senior management positions, as well as, executive directorships in various public and private corporations in Singapore, Hong Kong and China. Between March 2004 and March 2006, he was the Deputy President of Shenzhen Flink Investment & Development Co., Ltd. China. Prior to that, Mr Lien was the Finance Director of PDC Corp. Ltd. between 2002 and 2003, and an Executive Director in China Strategic Holdings Limited Hong Kong from 1998 to 2002. Between 1996 and 1998, Mr Lien was the General Manager in charge of the China division of Hong Leong Corporation Limited and was responsible for overseeing the group’s joint venture operations in China. He was also the Director of China Yuchai International Ltd at that time. From 1993 to 1996, he was in charge of international operations of the RGM Group, a conglomerate of diverse businesses and was also a director in charge of international operations in Asia Pacific Resources International Limited. He was the Finance Director of China Strategic Holdings Limited Hong Kong from 1992 to 1993. From 1981 to 1992, Mr Lien was the General Manager (Finance and Investment) of United Industrial Corporation Ltd. He was the Group Accountant cum Personal Assistant to Executive Chairman of the Industrial and Commercial Bank Ltd Singapore from 1974 to 1981.
Mr Lien holds a degree in Bachelor of Commerce from Nanyang University, and is a fellow of the Institute of Certified Public Accountants of Singapore since July 2004 and of CPA Australia since May 2004.
MR LIEN KAIT LONGNON-EXECUTIVE DIRECTOR/
INDEPENDENT DIRECTOR
MR CHAN SEK NIN JACKEYNON-EXECUTIVE DIRECTOR

PSC CORPORATION LTDANNUAL REPORT 201111

GROUP FINANCIAL SUMMARY
PSC CORPORATION LTDANNUAL REPORT 201112
TURNOVER BY GEOGRAPHICAL SEGMENTS ($ MILLION)
TURNOVER BY BUSINESS SEGMENTS ($ MILLION)
FY2011 FY2010
Singapore $192.9 49.1% $187.8 50.2%
Malaysia $73.4 18.7% $74.3 19.9%
China $126.5 32.2% $111.6 29.9%
FY2011 FY2010
Consumer Business $224.0 57.0% $214.0 57.3%
Health Solutions $2.0 0.5% $6.4 1.7%
Packaging $166.8 42.5% $153.3 41.0%
FY2011 FY2010
Singapore Malaysia China
FY2011 FY2010
Consumer Business Health Solutions Packaging

PSC CORPORATION LTDANNUAL REPORT 2011 13
TURNOVER ($ MILLION)
$373.72010
$331.22009
$303.22008
$261.92007
$392.82011
2.572010
2.842009
0.622008
1.742007
0.422011
50.892010
50.442009
46.472008
46.652007
50.692011
BASIC EARNINGS PER SHARE (CENTS)
NAV PER SHARE (CENTS)

OPERATIONAL REVIEW
PSC CORPORATION LTDANNUAL REPORT 201114 PSC CORPORATION LTD
ANNUAL REPORT 201114

OPERATIONAL REVIEW
PSC CORPORATION LTDANNUAL REPORT 2011 15
CONSUMER ESSENTIALS CLUSTER
iEcon
Founded in 1982, iEcon is the largest franchised minimart chain in Singapore. This franchise retail concept is engineered to meet the demands of modern lifestyle and changing consumer preferences. Strategically located in neighbourhoods island-wide, iEcon provides not just shopping conveniences for household and grocery items, but also essential services such as bill payments via AXS, Nets, Cash Card top-up, EZ-Link services, EPINS, iCash and prepaid SIM card registration.
With its strong brand name, operational expertise, well-established supply chain and information management systems, iEcon continually attracts franchisees that recognise the Management’s relentless efforts to make iEcon the preferred shopping choice amongst heartlanders.
In FY2011, iEcon widened its product offerings with an enlarged pool of suppliers. To boost sales, it also held several successful island-wide promotions, including the well-received Chinese New Year Scratch & Win and the Seventh-month shopping promotions.
PSC Corporation Ltd (“PSC” or the “Group”) is a multi-faceted consumer essentials company with strategic investments in the region. Its two clusters, Consumer Essentials and Strategic Investments, form the pillars of PSC’s business.
The Consumer Essentials cluster, which focuses on providing living essential products and services to consumers, houses two regional business segments:
• Consumer Business has major subsidiaries involved in fast moving consumer goods (“FMCG”) manufacturing, marketing and brand management, as well as lifestyle businesses. It also has a franchise and marketing business.
• Health Solutions provides healthcare consultancy services on a turnkey basis.
The Strategic Investments cluster focuses on generating value and fi nancial asset capabilities by investing in promising enterprises in high growth sectors. To date, the Group has investments in a regional trading business, and a packaging company based in China.
Here is an overview of the Group’s business structure:
HOLDING COMPANY
Key business clusters
ConsumerEssentials
FortuneFoodGroup
Socma Trading (M)
Sdn BhdTopseller Pte LtdiEcon Tat Seng
GroupHealth
Solutions Group
D & PLifestylePte Ltd
TipexGroup
Intraco Limited
StrategicInvestments
PSC
Consumer Business Health Solutions

OPERATIONAL REVIEW
PSC CORPORATION LTDANNUAL REPORT 201116
Moving forward, iEcon will continue to look at ways to sharpen its business model and enhance competitiveness.
Topseller Pte Ltd
Established in 1977, Topseller Pte Ltd (“Topseller”) – a wholly-owned subsidiary of PSC – is an established distributor as well as a developer of popular brands for household and grocery products. It carries renowned brands such as Royal Umbrella, Golden Peony, Gitangkim and Harmuni for rice products, Promax, Sunnyfresh and Singpo for detergent products, as well as the Golden Circle, Harmuni and Soyalite brand of cooking oil. In addition, Topseller has forged strong partnerships with international brands such as 3M, Lion, Kao, Pauls and Unico, amongst others.
To fend off the keen competition and alleviate the impact of rising costs, Topseller successfully expanded its distribution coverage and added more agency lines to widen its product offerings in 2011. It gained signifi cant market share and penetration for the Royal Umbrella brand when the rice products were supplied to some petrol kiosks in Singapore. Various promotional activities like road shows were also rolled out to establish presence in different market segments. At the same time, Topseller expanded its agency portfolio with four new brands – Vance Chemical, Ligo, Liu Shen and Isklar.
While Topseller always strives to keep its selling prices at the lowest possible, it was forced to raise the prices for products under the rice category between December 2011 and February 2012 as a result of escalating costs, mainly due to the prolonged fl oods that hit Thailand in late 2011.
While rising costs will continue to pose challenges in FY2012, Topseller is determined to meet these challenges head on. It will continue with its tight cost management programme, introduce new products under its proprietary brands, source for new agencies to increase its product offerings and expand its distribution coverage.
It also plans to further develop established proprietary brands like Royal Umbrella and introduce new products by implementing holistic promotion plans with key accounts to drive growth. It will continue to work closely with these key accounts, conduct more promotional activities to boost sales and enhance branding. E-Initiatives are also being explored to reach out to different target markets.
Socma Trading (M) Sdn Bhd
Socma Trading (M) Sdn Bhd (“Socma”) is PSC’s marketing and distribution arm in Malaysia. A sole distributor of many popular brands within the FMCG sector, its products are categorised into four main sectors: Confectionery (Mentos, Chupa Chups, Smint, Fruit-tella and Happydent); Snacks (Tao Kae Noi, Tai Sun and Supernut); Grocery (Mazola, Carbonell, Soyalite, Golden Circle and Harmuni Coconut Milk); and Beverages (Wong Lo Kat Herbal Drink).
Several sales and promotional campaigns were held in FY2011 to generate buzz amongst consumers for Socma’s Confectionery products.

PSC CORPORATION LTDANNUAL REPORT 2011 17
Mentos Be Momentos was a highly successful campaign which gained active participation from consumers nationwide. The campaign, which encouraged consumers to share their special moments with Mentos, was supported with TV commercials, consumer contest and displays in supermarkets and hypermarkets.
To further drive its Mentos Gum range, Socma conducted a Fresh Breath awareness campaign through Facebook. The two-month campaign was well received, reaching out to over 6,000 consumers in Malaysia.
In conjunction with talk-of-town movies – ‘Rio’ and ‘Alvin & Chipmunks 3’, major campaigns and road shows were held to promote Chupa Chups. Consumers were able to enjoy their favourite lollipop as they participated in fun activities arising from the movie tie-ups. In addition, attractive promotions and creative Christmas displays were used to further drive sales during the year-end festive period.
To stimulate brand awareness and convince consumers to switch to the brand, product trials and sampling for Smint Tin were conducted at recreational outlets, LRT stations, corporate buildings, hypermarkets and supermarkets.
Snacks category recorded signifi cant sales growth in FY2011, driven by aggressive in-store promotions for Tao Kae Noi, Tai Sun and Supernut during festive seasons such as Chinese New Year and Mooncake festival. In early 2011, through TV commercials and print advertisements, Tao Kae Noi successfully launched fi ve new products – Super Crisp Classic 24g, Big Bang Value Pack Classic, Big Bang Value Pack Grilled Squid, Super Crisp Jumbo Sheet Classic and Super Crisp Jumbo Sheet Hot Chilli Squid – all of which received positive response from consumers. Tao Kae Noi also conducted sampling activities in hypermarkets.
Beverage category also delivered positive growth in FY2011. Aggressive Chinese New Year in-store displays and promotions, sampling at major mosques during the Ramadan month, and road shows at top university campuses were conducted to drive sales for Wong Lo Kat.
Under the Groceries category, Mazola and Harmuni continued to be well-received by consumers, evident from consumers’ overwhelming response during the Ramadan in-store promotions.
Moving forward, Socma will continue to leverage on opportunities to increase its market share in Malaysia’s FMCG sector. In particular, Socma expects to witness further growth in the Snacks category Year 2012, as well as launch new products under the Confectionery category.
Fortune Food Group
Fortune Food Group (“Fortune Food”) is a leading and innovative food manufacturer and distributor in Singapore. It has two business divisions, i) Retail Chilled – which specialises in manufacturing and distributing soy based products under its proprietary brands, and ii) Food Services – which distributes branded commodity and agency food products to channels such as hawkers and food court operators, restaurants, food and airline caterers and ship chandlers.

OPERATIONAL REVIEW
PSC CORPORATION LTDANNUAL REPORT 201118
CONSUMER ESSENTIALS

OPERATIONAL REVIEW
PSC CORPORATION LTDANNUAL REPORT 2011 19
Retail Chilled Division
The Division leverages on its strong distribution network covering hypermarkets, supermarkets, minimarts, provision stores and wet markets island-wide to drive sales of its products, including Sobe – the fi rst fresh, pasteurised soy milk brought to the Singapore market by Fortune Food in 1995, as well as Fortune Tofu and noodle products, amongst others.
In FY2011, through continual research and development, the Division expanded its offerings to include a wider range of healthier and more nutritious products, targeted at the more health conscious and affl uent consumers. It launched three Omega 3-related products, namely the Fortune Chinese Tofu with Omega 3; Fortune Tau Kwa with Omega 3; and Fortune Egg Tofu with Omega 3. In November 2011, two types of UHT organic soy milk were also launched: Sobe Organic Regular Soymilk, and Sobe Organic Unsweetened Soymilk.
Boosted by the stream of new product launches and heightened sales and marketing activities, the Retail Chilled Division delivered growth of 5.2%, in terms of sales volume and value. Selective advertising, public relations and other activities have also strengthened the top-of-mind recall of the proprietary Fortune and Sobe brands.
In FY2012, the Company will continue to develop healthier functional products targeted at specifi c consumer groups. It will also focus on boosting sales of Sobe Organic products and explore distribution of new dairy products.
Food Services Division
The Food Services Division started FY2012 on a good note by securing the distributorship for short grain rice and basmati rice from the USA, India and Pakistan. This feat effectively expanded the Division’s pool of rice suppliers beyond Thailand and Vietnam. For the rest of FY2012, the Division expects to introduce more rice types to the market to complement its existing range.
To cement its position as a leading distributor of food products, it will continue to look at ways to excite customers with new products. In particular, it will focus on developing its house brands and acquiring new distributorships.
Tipex Group
Tipex Group (“Tipex”) is one of the major distributors of tissue paper products in Singapore. Its Beautex brand of tissue products are manufactured by its subsidiary in Malaysia – Tips Industry (M) Sdn Bhd. Beautex was added to the Singapore Book of Records in 2007 as the fi rst to launch a complete range of premium and economical three-ply tissue products. Besides Beautex, Tipex also owns other tissue paper brands such as Mood, Hibis, Comfy and Parity. In addition, Tipex is the exclusive distributor of high quality diaper brands such as PetPet, Fitti and BabyLove, as well as the adult diaper brand, Certainty in Singapore.
In line with its goal of improving the lifestyle of modern consumers via reliable and value-for-money products, Tipex launched Beautex Baby Wipes in FY2011. The baby wipes, which are alcohol and soap free, unscented and with a pH value of 5.5, had been microbiologically tested for superior hygiene and quality. Tipex also introduced BabyLove GrowPants, a type of training pants for babies, to the Singapore market.

OPERATIONAL REVIEW
PSC CORPORATION LTDANNUAL REPORT 201120
Last year, Tipex revamped the packaging of the Beautex 2-ply series to enable customers to identify the wide Beautex range of products with ease. Additionally, to usher in the year of the water dragon in 2012, Tipex unveiled its dragon themed series Chinese New Year box tissues. The limited edition Beautex and Mood box tissues were well-received in the market.
To build the Beautex brand, Tipex consistently teams up with its partners to initiate innovative marketing campaigns. One such collaboration was with Celestial Resort in Pulau Ubin last year, where it held a lucky draw for Beautex customers.
Not forgetting to give back to the society, Tipex continued with the 3rd Beautex “Life’s Beautiful” Art Competition in 2011. The scale of the event was bigger as Tipex roped in The Straits Times’ Little Red Dot, an English publication for primary school children, to co-organise the competition. The annual event, which was well-received by the media and students, aimed to nurture budding young talents and instill the spirit of charity in them. Winning artworks were printed on special edition Beautex box tissues and were sold to the public. For every 5-box pack sold, Tipex donated $0.20 to The Straits Times School Pocket Money Fund (“Fund”). Through this competition, Tipex successfully sold a total of over 12,000 packs of box tissue to aid the Fund.
Moving ahead, Tipex will continue to engage its customers, listen to their changing needs, and actively maintain a range of product offerings that suit their demands. It will continue to invest in research and development, as well as rigorous checks to uphold its commitment to produce high quality products. It will work hand in hand with its principals to strengthen their brand positioning in the market.
D & P Lifestyle Pte Ltd
Focusing on the lifestyle business, D & P Lifestyle Pte Ltd (“D & P”) is a regional distributor of footwear and apparel, representing coveted brands around the world, including Rockport. It provides brand management, marketing, distribution and logistics support to its principals.
In FY2011, D & P successfully expanded the distribution network for Rockport in Singapore, Malaysia and Brunei. It opened two concept stores in Harbourfront Centre and Suntec City, as well as secured retail space in all departmental stores in Singapore. In Malaysia and Brunei, it started seven concept stores and penetrated into two departmental stores respectively.
Of special mention is the fact that D & P, through its sound business strategy, had raised the combined Rockport sales in Singapore and Malaysia by tenfold in FY2011, as compared to when the brand was under its previous distributor’s care.
D & P will continue to work hard at growing the sales of Rockport, open more concept stores and cement Rockport as the top three shoe brands in Singapore and Malaysia.

PSC CORPORATION LTDANNUAL REPORT 2011 21
Health Solutions Group
PSC’s healthcare division, Health Solutions Group (“Health Solutions”), is designed as a one-stop resource centre to provide holistic healthcare consultancy services. Headquartered in Singapore with its technical support based in Kuala Lumpur, Health Solutions offers in-house expertise in medical facilities architecture and design, project engineering and management, medical and non-medical equipment planning, information and communication technology, as well as its own brand of operational management.
Health Solutions’ focus in FY2011 was to oversee the completion of two hospitals in Malaysia, namely the Likas Nuclear and Radiotherapy Medical Center in Kota Kinabalu and the Cheras Rehabilitation Hospital.
Progress is on track for the Likas Nuclear and Radiotherapy Medical Center, which is scheduled to commence operations by 2013. Health Solutions is the turnkey contractor for this hospital project. The main hospital building as well as the mechanical and electrical works have been completed. Most of the medical equipment has been delivered and fi nal building fi xture and fi ttings are in progress.
The Cheras Rehabilitation Hospital is expected to be operational by the second half of 2012. Health Solutions, which is the medical equipment planning and procurement consultant for this hospital project, has successfully completed the handover of the medical and non-medical equipment package and is going through the post-handover works with the government of Malaysia.
Recognising that healthcare is a growing business due to an aging population, Health Solutions is constantly assessing the region’s healthcare development opportunities, both in the public and private sectors. In addition to actively working to secure more government projects in Malaysia, Health Solutions has plans to diversify its business into medical devices and healthcare products sectors.
STRATEGIC INVESTMENTS CLUSTER
Tat Seng Packaging Group Ltd
PSC owns a 64.0% stake in Singapore-listed Tat Seng Packaging Group Ltd (“Tat Seng”), a leading manufacturer of corrugated paper packaging products with two plants in Singapore and four in China. Its customers include multi-national corporations and manufacturers in the electronics, metal stamping, pharmaceutical and chemical industries, as well as the printing and publishing industry.
OPERATIONAL REVIEW
PSC CORPORATION LTDANNUAL REPORT 201122
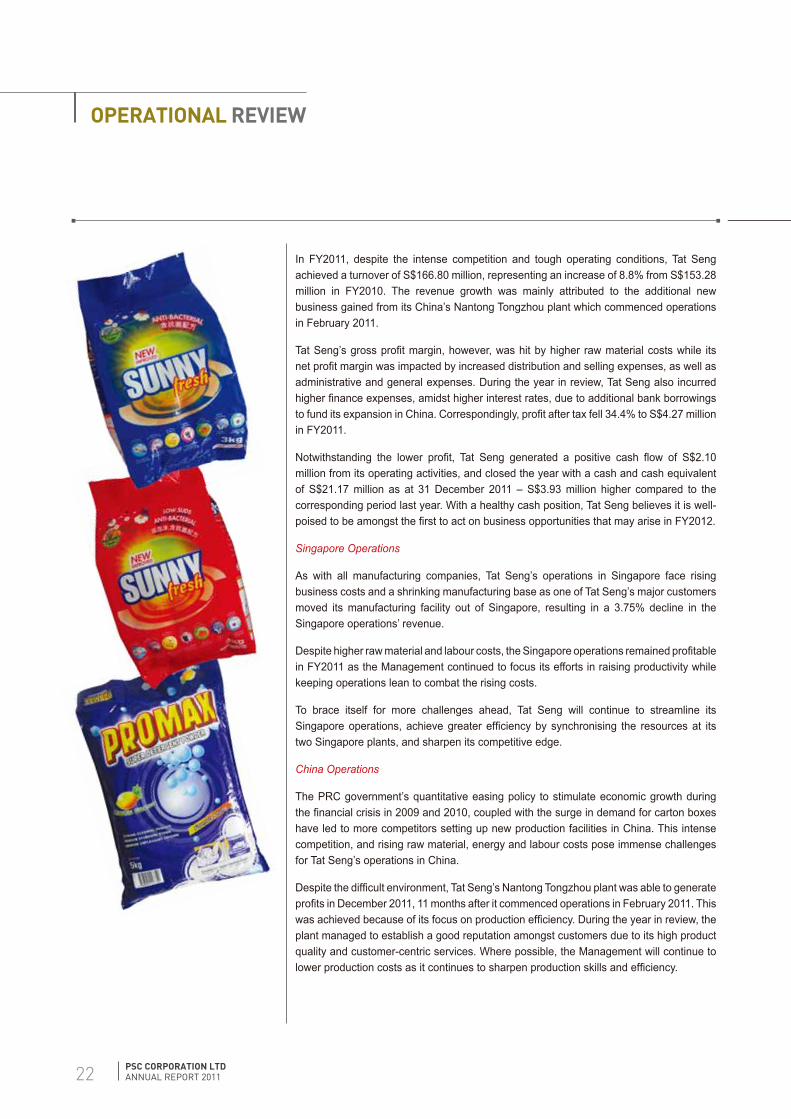
In FY2011, despite the intense competition and tough operating conditions, Tat Seng achieved a turnover of S$166.80 million, representing an increase of 8.8% from S$153.28 million in FY2010. The revenue growth was mainly attributed to the additional new business gained from its China’s Nantong Tongzhou plant which commenced operations in February 2011.
Tat Seng’s gross profi t margin, however, was hit by higher raw material costs while its net profi t margin was impacted by increased distribution and selling expenses, as well as administrative and general expenses. During the year in review, Tat Seng also incurred higher fi nance expenses, amidst higher interest rates, due to additional bank borrowings to fund its expansion in China. Correspondingly, profi t after tax fell 34.4% to S$4.27 million in FY2011.
Notwithstanding the lower profi t, Tat Seng generated a positive cash fl ow of S$2.10 million from its operating activities, and closed the year with a cash and cash equivalent of S$21.17 million as at 31 December 2011 – S$3.93 million higher compared to the corresponding period last year. With a healthy cash position, Tat Seng believes it is well-poised to be amongst the fi rst to act on business opportunities that may arise in FY2012.
Singapore Operations
As with all manufacturing companies, Tat Seng’s operations in Singapore face rising business costs and a shrinking manufacturing base as one of Tat Seng’s major customers moved its manufacturing facility out of Singapore, resulting in a 3.75% decline in the Singapore operations’ revenue.
Despite higher raw material and labour costs, the Singapore operations remained profi table in FY2011 as the Management continued to focus its efforts in raising productivity while keeping operations lean to combat the rising costs.
To brace itself for more challenges ahead, Tat Seng will continue to streamline its Singapore operations, achieve greater effi ciency by synchronising the resources at its two Singapore plants, and sharpen its competitive edge.
China Operations
The PRC government’s quantitative easing policy to stimulate economic growth during the fi nancial crisis in 2009 and 2010, coupled with the surge in demand for carton boxes have led to more competitors setting up new production facilities in China. This intense competition, and rising raw material, energy and labour costs pose immense challenges for Tat Seng’s operations in China.
Despite the diffi cult environment, Tat Seng’s Nantong Tongzhou plant was able to generate profi ts in December 2011, 11 months after it commenced operations in February 2011. This was achieved because of its focus on production effi ciency. During the year in review, the plant managed to establish a good reputation amongst customers due to its high product quality and customer-centric services. Where possible, the Management will continue to lower production costs as it continues to sharpen production skills and effi ciency.
PSC CORPORATION LTDANNUAL REPORT 2011 23
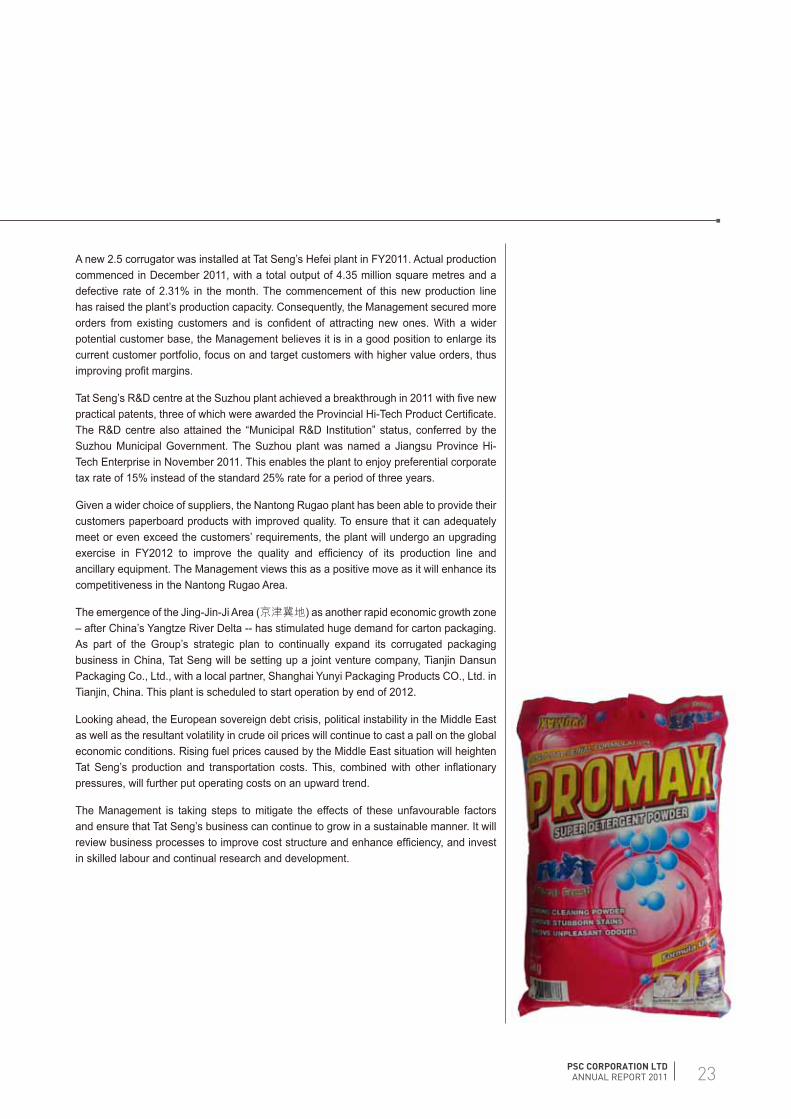
A new 2.5 corrugator was installed at Tat Seng’s Hefei plant in FY2011. Actual production commenced in December 2011, with a total output of 4.35 million square metres and a defective rate of 2.31% in the month. The commencement of this new production line has raised the plant’s production capacity. Consequently, the Management secured more orders from existing customers and is confi dent of attracting new ones. With a wider potential customer base, the Management believes it is in a good position to enlarge its current customer portfolio, focus on and target customers with higher value orders, thus improving profi t margins.
Tat Seng’s R&D centre at the Suzhou plant achieved a breakthrough in 2011 with fi ve new practical patents, three of which were awarded the Provincial Hi-Tech Product Certifi cate. The R&D centre also attained the “Municipal R&D Institution” status, conferred by the Suzhou Municipal Government. The Suzhou plant was named a Jiangsu Province Hi-Tech Enterprise in November 2011. This enables the plant to enjoy preferential corporate tax rate of 15% instead of the standard 25% rate for a period of three years.
Given a wider choice of suppliers, the Nantong Rugao plant has been able to provide their customers paperboard products with improved quality. To ensure that it can adequately meet or even exceed the customers’ requirements, the plant will undergo an upgrading exercise in FY2012 to improve the quality and effi ciency of its production line and ancillary equipment. The Management views this as a positive move as it will enhance its competitiveness in the Nantong Rugao Area.
The emergence of the Jing-Jin-Ji Area ( ) as another rapid economic growth zone – after China’s Yangtze River Delta -- has stimulated huge demand for carton packaging. As part of the Group’s strategic plan to continually expand its corrugated packaging business in China, Tat Seng will be setting up a joint venture company, Tianjin Dansun Packaging Co., Ltd., with a local partner, Shanghai Yunyi Packaging Products CO., Ltd. in Tianjin, China. This plant is scheduled to start operation by end of 2012.
Looking ahead, the European sovereign debt crisis, political instability in the Middle East as well as the resultant volatility in crude oil prices will continue to cast a pall on the global economic conditions. Rising fuel prices caused by the Middle East situation will heighten Tat Seng’s production and transportation costs. This, combined with other infl ationary pressures, will further put operating costs on an upward trend.
The Management is taking steps to mitigate the effects of these unfavourable factors and ensure that Tat Seng’s business can continue to grow in a sustainable manner. It will review business processes to improve cost structure and enhance effi ciency, and invest in skilled labour and continual research and development.

OPERATIONAL REVIEW
PSC CORPORATION LTDANNUAL REPORT 201124
Intraco Group
Intraco Limited (“Intraco”) is an integrated solutions trading company with markets across the ASEAN (Association of Southeast Asian Nations) region, China, India, GCC (Gulf Cooperation Council), Taiwan, South Korea, Japan, the USA and South Africa.
Intraco operates mainly in four key business units, namely the Lighting Division, Plastic Division, Seafood Division and Wireless Telecommunications Division. Intraco’s revenue in FY2011 remained relatively stable at S$174.68 million.
During the year in review, the Lighting Division recorded a turnover of S$6.34 million with a gross profi t of S$1.04 million. Although the slew of cooling measures to curb speculation in Singapore’s property market along with the anticipated slow down in the local economy may impact the Division’s business in FY2012, the strong demand for public housing and construction services is expected to drive the LED lighting industry. To protect its margins, the Lighting Division will be selective in taking sales orders, ensuring they yield reasonable margins. Concurrently, it will explore new LED lighting products of higher value and offer to its customers working on Build-to-Order HDB projects or those under the Design, Build and Sell Scheme.
Despite the heightened competition, turnover from the Plastic Division rose 56.1% while gross profi t margin improved 4.9%, driven by increased sales in Vietnam and Myanmar which continue to hold immense potential. Moving forward, the Division expects to source more new plastic supplies from the Middle East, India and Iran. It will also place more marketing efforts in Southeast Asia as China’s economy starts to slow down. The Division expects more volatility in FY2012 amidst the ongoing European debt crisis and the uncertain global economic outlook. Resin prices may be impacted due to the volatility in US dollar and rising oil prices. To protect its fi nancial position, the Division will continue with its tight cost control program and strengthen its sales and marketing programme.
Intraco’s Seafood Division provides top quality processed fi sh to the United States of America (“USA”) and counts a number of multinational companies as its customers. In the last quarter of FY2011, the business was further strengthened when it became a one-stop supply chain that sourced for fresh catches in Norway and Russia, to send to China for processing. This processed fi sh will then be transported for onward sales to the USA market. In FY2012, the Group will expand its sales and marketing network to cover more states in the USA and widen its product offerings beyond the current haddock and cod.
The Wireless Telecommunications Division is in the business of leasing telecommunications infrastructure in Singapore’s North East Line (“NEL”), providing for SingTel Mobile, Starhub Mobile and Mobile One. Its NEL telecommunications infrastructure exceeds the expected Quality-of-Service standards set by the Info-Communications Development Authority of Singapore. Additionally, the Division provides professional services in the management, operation and maintenance of the NEL telecommunications infrastructure. With a lean manpower, the Division continues to be profi table and to further drive growth, it will explore opportunities in new telecommunications infrastructure projects such as 4G in NEL and Thomson MRT lines.
Looking ahead, Intraco will continue to diversify by building new business models that leverage on the latest trends, and provide new value-added products and services in its various areas of expertise.

经营回顾
PSC CORPORATION LTDANNUAL REPORT 2011 25
(「 」 「 」) ,
。 -民生必須品 策略性投資,
。
民生必須品 ,
:
, (「 」) 、
、 。
。
。
策略性投資 ,
。 ,
。
:
保健业务消費业务
普威
策略性投資
iEcon TopsellerPte Ltd
HealthSolutions
Group
達成包裝集團有限公司
新加坡國際貿易有限公司
Socma Trading (M)
Sdn Bhd
D & PLifestylePte Ltd
TipexGroup
鴻運食品集團
民生必需品
民生必需品組別
, 。
, ,
。 , ,
, ,
、 、 、 、 、
。
、 、 ,
。
。
, , 。
, , “
” “ ” 。
, , , 。
经营回顾
PSC CORPORATION LTDANNUAL REPORT 201126 PSC CORPORATION LTDANNUAL REPORT 201126
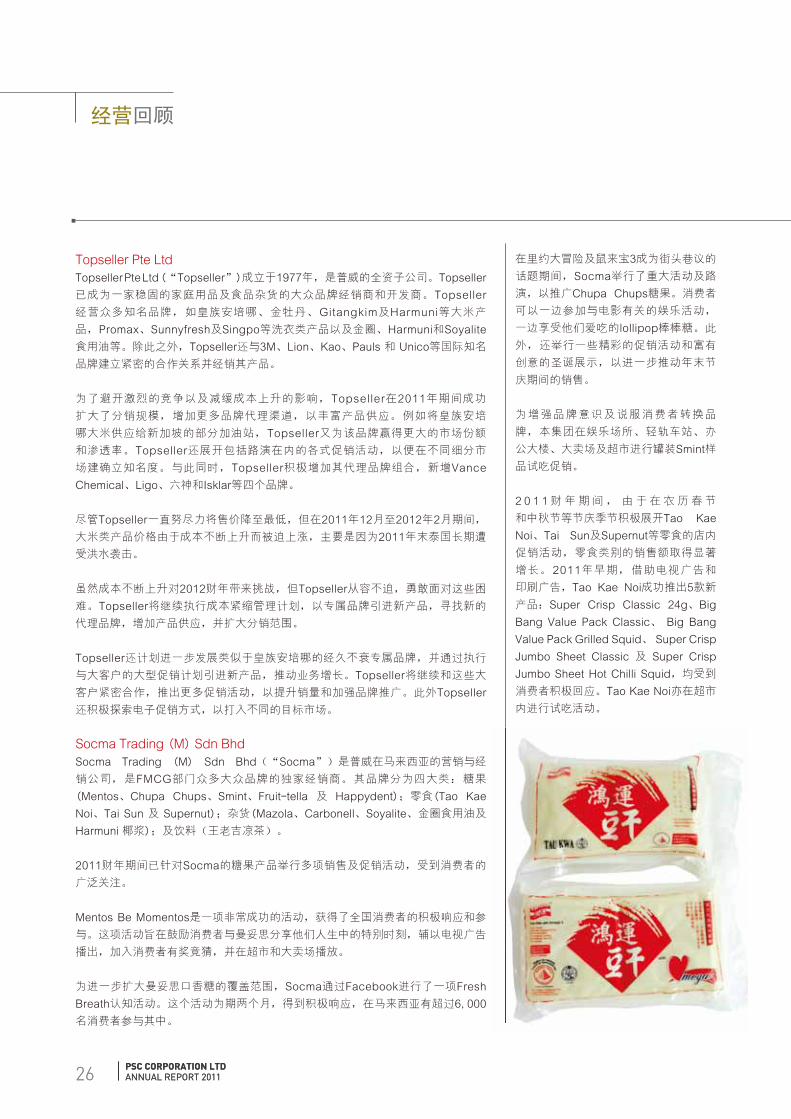
(“ ”) , 。
。
, 、 、
, 、 、
。 , 、 、 、
。
,
, , 。
,
。 ,
。 , ,
、 、 。
, ,
,
。
, ,
。 , ,
, , 。
,
, 。
, , 。
, 。
( )
( ) (“ ”)
, 。 :
( 、 、 、 - ); (
、 ); ( 、 、 、
); ( )。
,
。
,
。 ,
, , 。
,
。 , , ,
。
,
, 。
,
。
,
,
。
, 、 、
、
。
,
、
,
。 ,
,
: 、
、
、
,
。
。

PSC CORPORATION LTDANNUAL REPORT 2011 27
。 ,
,
。
, ,
。
, , 。
, ,
。
(“ ”) 。
: ) -
; ) - ,
、 、 、 。
、 、 、
, —
, 。
, , , 、
, 。
, 、
。 , ( )
: 。
、 , ,
% 。 、 「 」
。
, 。
。
、 ( )
, 。
。 ,
, 。
, 。
。

经营回顾
PSC CORPORATION LTDANNUAL REPORT 201128 PSC CORPORATION LTDANNUAL REPORT 201128
(“ ”) 。
( ) 。
, , 《
》。 , , 、 、
。 , 、
。
, 。
, , . , , 。
—— ,
。
, ,
。 , ,
。 。
, 。
,
。
, 「 ( ’ )」
。 ’
, 。 , ,
。 ,
。 ,
(“ ”) 。 ,
, 。
, , ,
。 ,
。 ,
。
&
& (“ & ”) ,
, , , 、
、 。
, & 、 。
,
。 , & ,
。
,
,
,
。
& ,
,
。
(“ ”),
,
。
,
, :
、 、
、
。

PSC CORPORATION LTDANNUAL REPORT 2011 29
, , ( )
( ) ( )。
( ) , 。
。 , ,
。 。
( ) 。
, 。
, 。
, 。
, 。 , ,
, 。
策略性投資
(“ ”) . % 。
, , 。 , 、 、
。
, , ,
. %。 。
, , 。
, , , 。 ,
, . %。
, , ,
, 。 , 。
, 。
, . %。
, , , 。
, , , 。

经营回顾
PSC CORPORATION LTDANNUAL REPORT 201130 PSC CORPORATION LTDANNUAL REPORT 201130
, ,
。 、 , 。
, , 。
。 , , 。
, 。
, . 。 , ,
. %。 。 , , 。
, , ,
。
, , 。
“ ” 。 ,
%( %)。
, 。 , ,
, 。 ,
。
, 。
, ( ) ,
, 2012 。
, , , , 。
, 。 , 。
, 。 ,
, 。
(“ ”), , 、 、 、
、 、 、 、 。
, 、 、 。
。
, , 。 ,
, , ,
。 , , 。 ,
, 、 。

PSC CORPORATION LTDANNUAL REPORT 2011 31
, %, %, ,
。 , 、 。 , ,
。 , ,
。 。 , ,
。
(“ ”) , 。 ,
, , , 。 。
, , , 。
( )(“ ”) , 、
。 ( - )
。 , 、 。 ,
, , ( ) 。
, , 。

CORPORATE INFORMATION
PSC CORPORATION LTDANNUAL REPORT 201132
BOARD OF DIRECTORSAllan YapExecutive Chairman
Tang Cheuk CheeExecutive Director
Foo Der RongManaging Director & CEO
John Chen Seow PhunDeputy Chairman / Non-Executive Director
Chee Teck Kwong PatrickNon-Executive Director /Independent Director
Tao Yeoh ChiNon-Executive Director /Independent Director
Lien Kait LongNon-Executive Director /Independent Director
Chan Sek Nin JackeyNon-Executive Director
COMPANY SECRETARIESGo Kim Chuan MarkChong Eng Wee
REGISTERED OFFICE348 Jalan Boon LaySingapore 619529Tel: 6268 4822
SHARE REGISTRARM&C Services Private Limited138 Robinson Road#17-00 The Corporate Offi ceSingapore 068906
AUDITORSKPMG LLPCertifi ed Public Accountants(Partner in charge– Lo Mun Wai, since FY2009)16 Raffl es Quay #22-00Hong Leong BuildingSingapore 048581
BANKERSUnited Overseas Bank LimitedDevelopment Bank of Singapore LimitedStandard Chartered Bank
PSC CORPORATION LTDANNUAL REPORT 2011 33
CORPORATE GOVERNANCE STATEMENT
The Company is committed to complying with the Code of Corporate Governance 2005 (“Code”) so as to ensure greater transparency and to safeguard the interests of shareholders. This statement highlights the main corporate governance practices that were in place during the financial year. For easy reference, sections of the Code under discussion are specifically identified.
1 BOARD MATTERS
Principle 1: Every company should be headed by an effective Board to lead and control the company. The Board is collectively responsible for the success of the company. The Board works with Management to achieve this and the Management remains accountable to the Board.
1.1 Role of the Board
The Board of Directors (the “Board”) comprises 3 Executive Directors and 5 Non-Executive Directors. 3 of the 5 Non-Executive Directors are Independent Directors. The Board’s primary role is to protect and enhance long-term shareholder value. To fulfil this, apart from its statutory responsibilities, the Board performs the following roles:
• provides entrepreneurial leadership and sets the overall strategy and direction for the Group;
• approve major funding proposals, investment and divestment proposals of the Company;• reviews the performance of management by establishing management’s goals and monitoring
the achievement of those goals;• reviews and endorses the framework of remuneration for the Board and key executives as
may be recommended by the Remuneration Committee;• supervises executive management, ensures that the Company has the necessary resources
to meet its goals and establish a framework of prudent and effective controls to assess and manage risks;
• oversees the processes of risk management, financial reporting and compliance and evaluates the adequacy of internal controls; and
• assumes the responsibilities for corporate governance.
1.2 Board Processes
To assist the Board in the discharge of its oversight function, various Board Committees, namely, the Audit Committee (“AC”), Nominating Committee (“NC”) and the Remuneration Committee (“RC”) have been constituted with clearly defined terms of reference. The terms of reference set out the duties, authority and operating procedures which are reviewed and monitored regularly. The minutes of the meetings of these committees are circulated within the Board.
The schedule of all Board and Board Committee meetings for a calendar year is usually given to all Directors well in advance. Besides the scheduled quarterly Board meetings, the Board meets on an ad-hoc basis as warranted by particular circumstances. Board meetings will be convened when they are deemed necessary, to review the Group’s operations, conduct strategic review of the business affairs and address other specific significant matters that arise. The Company’s Articles of Association provide for meetings of directors by way of telephone and video conferencing. The Board also approves transactions through circular resolutions which are circulated to the Board together with all relevant information relating to the proposed transaction.
The agenda for meetings is prepared in consultation with the Chairman and Chief Executive Officer. The Agenda and submissions are circulated in advance of the scheduled meetings.

PSC CORPORATION LTDANNUAL REPORT 201134
CORPORATE GOVERNANCE STATEMENT
1.3 Directors’ Meetings Held in Financial Year 2011
The Board held 4 meetings during the financial year. The number of meetings attended by each member of the Board during the financial year is as follows:
Name of Director Board meetings attendedDr Allan Yap 3Mdm Tang Cheuk Chee (appointed on 1 August 2011) 2Mr Foo Der Rong 4Dr John Chen Seow Phun 4Mr Chee Teck Kwong Patrick 4Mr Tao Yeoh Chi 4Mr Lien Kait Long 4Mr Chan Sek Nin Jackey 4Mr Teo Kee Bock (resigned on 15 June 2011) 2
The Directors were appointed based on their experience, stature and potential to contribute to the proper guidance of the Group and its businesses. As such, we believe that each individual Director’s contributions can be reflected in ways other than the reporting of attendances at Board meetings and/or Board Committee meetings.
1.4 Matters Requiring Board Approval
The Directors have identified a few areas for which the Board has direct responsibility for decision making (which are embodied in its internal guidelines) such as the following:
• approval of the quarterly results announcements;• approval of the annual report and accounts;• declaration of interim dividends and proposal of final dividends;• convening of shareholders’ meetings;• approval of corporate strategy;• authorisation of major transactions;• approval of Board changes and appointments to Board Committees;• increase in investment in businesses and subsidiaries;• divestment in any of the Group companies; and• commitments to term loans and lines of credit from banks and financial institutions by the
Company.
While matters relating in particular to the Company’s objectives, strategies and policies require the Board’s direction and approval, the Management is responsible for the day to day operation and administration of the Company in accordance with the objectives, strategies and policies set by the Board.
1.5 Training of Directors
Our Directors are provided with extensive background information about our Group’s history, mission, values and business operations. Changes to regulations and accounting standards are monitored closely by the Management. To keep pace with such regulatory changes, the Company provides opportunities for ongoing education on Board processes and best practices as well as updates on relevant new laws and regulations. Directors also have the opportunity to visit the Group’s operational facilities and meet with the Management to gain a better understanding of the business operations. The Company has set up a more formal procedure for the issue of appointment letters setting out directors’ duties and obligations. Newly appointed Directors are also briefed on the business and organisational structure of the Group and its strategic directions.

PSC CORPORATION LTDANNUAL REPORT 2011 35
CORPORATE GOVERNANCE STATEMENT
1.6 Board Composition and Balance
Principle 2: There should be a strong and independent element on the Board, which is able to exercise objective judgement on corporate affairs independently, in particular, from Management. No individual or small group of individuals should be allowed to dominate the Board’s decision making.
All Directors exercise independent judgement and make decisions objectively in the best interest of the Company. The assessment criteria in the Chairman’s assessment of Directors include intensity of participation at meetings, quality of interventions and special contribution.
The Board comprises members with diverse expertise and experience in business and management, accounting, finance, human resources and law.
As at the date of this report, the Board comprises 8 suitably qualified members:
Name of Director
Date of appointment/Date of last re-election
Functions Directorships in other listed companies and other major appointments
Past directorships in other listed companies and other major appointments over the preceding three years
Dr Allan Yap 10 May 2002/24 April 2009
Executive Chairman
Executive Chairman of Intraco Limited
Executive Chairman of Tat Seng Packaging Group Ltd
Chairman, Executive Director of Hanny Holdings Limited
Chairman, CEO and Director of China Enterprises Limited
Chairman, CEO and Director of Burcon NutraScience Corporation
Alternate Director of Television Broadcast Limited
Executive Director of Neo Telemedia Limited (formerly known as BIG Media Group Limited)
Director of MRI Holdings Limited (In members’ voluntary liquidation)
Executive Director of Rosedale Hotel Holdings Limited (formerly known as Wing On Travel (Holdings) Limited)
Executive Director of See Corporation Limited
Mdm Tang Cheuk Chee
Date of appointment as Director: 1 August 2011
Executive Director
Executive Director of Tat Seng Packaging Group Ltd and Intraco Limited

PSC CORPORATION LTDANNUAL REPORT 201136
CORPORATE GOVERNANCE STATEMENT
1.6 Board Composition and Balance (cont’d)
Name of Director
Date of appointment/Date of last re-election
Functions Directorships in other listed companies and other major appointments
Past directorships in other listed companies and other major appointments over the preceding three years
Mr Foo Der Rong
Date of appointment as Director: 1 August 1990Date of appointment as Managing Director: 1 September 2002
Managing Director & Chief Executive Officer
Executive Director of Intraco Limited
Executive Director of Tat Seng Packaging Group Ltd
Independent Director of Sino Techfibre Limited and China Farm Equipment Limited
Dr John Chen Seow Phun
9 June 2003/23 April 2010
Deputy Chairman/Non-Executive Director
Member of Audit, Nominating and Remuneration Committees
Chairman of Matex International Limited
Independent Director of Fu Yu Corporation Limited
Non-Executive Deputy Chairman of Tat Seng Packaging Group Ltd
Independent Director of Thai Village Holdings Ltd, OKP Holdings Limited, Hiap Seng Engineering Ltd, HLH Group Limited and HLYNX Pte Ltd
Independent Director of Hongguo International Holdings Limited (Delisted)

PSC CORPORATION LTDANNUAL REPORT 2011 37
CORPORATE GOVERNANCE STATEMENT
1.6 Board Composition and Balance (cont’d)
Name of Director
Date of appointment/Date of last re-election
Functions Directorships in other listed companies and other major appointments
Past directorships in other listed companies and other major appointments over the preceding three years
Mr Chee Teck Kwong Patrick
1 August 1990/23 April 2010
Non-Executive Director/Independent Director
Chairman of Audit Committee, Member of Nominating and Remuneration Committees
Director of CSC Holdings Limited
Independent Director of Ramba Energy Limited, Tat Seng Packaging Group Ltd, Singapore Windsor Holdings Ltd, Hengxin Technology Ltd, China International Holdings Limited and Hai Leck Holdings Limited
Independent Director of King’s Safetywear Limited (Delisted)
Mr Tao Yeoh Chi
13 November 1997/29 April 2011
Non-Executive Director/Independent Director
Chairman of Remuneration Committee and Member of Audit Committee
Non-Executive Independent Director of Next-Generation Satellite Communications Limited and Eratat Lifestyle Limited
Independent Director of China Titanium Ltd

PSC CORPORATION LTDANNUAL REPORT 201138
CORPORATE GOVERNANCE STATEMENT
1.6 Board Composition and Balance (cont’d)
Name of Director
Date of appointment/Date of last re-election
Functions Directorships in other listed companies and other major appointments
Past directorships in other listed companies and other major appointments over the preceding three years
Mr Lien Kait Long
1 June 2005/24 April 2009
Non-Executive Director/Independent Director
Chairman of Nominating Committee and Member of Audit Committee
Director of China Enterprises Limited
Independent Director of Tat Seng Packaging Group Ltd, 8Telecom International Holdings Co., Ltd, China Jishan Holdings Limited, Falcon Energy Group Limited, Youcan Foods International Limited, CMZ Holdings Ltd and Renewable Energy Asia Group Limited and Viking Offshore and Marine Ltd (formerly known as Novena Holdings Limited)
Independent Director of Memstar Technology Ltd, MRI Holdings Limited, Ocean International Holdings Limited and Kian Ho Bearings Ltd
Mr Chan Sek Nin Jackey
5 July 2007/29 April 2011
Non-Executive Director
Chief Operating Officer of Hanny Holdings Limited
Independent Non-Executive Director of SMI Corporation Limited
Director of Eastern Spark Development Limited
Director of Onland Development Limited
Please also refer to the “Board of Directors” section of the annual report for information relating to the Directors.

PSC CORPORATION LTDANNUAL REPORT 2011 39
CORPORATE GOVERNANCE STATEMENT
1.6 Board Composition and Balance (cont’d)
The composition of the Board is determined in accordance with the following principles:
• the Board should comprise 8 to 10 Directors. This number may be increased where it is felt that additional expertise is required in specific areas, or when an outstanding candidate is identified;
• to form a strong independent element on the Board, it should comprise at least one-third of non-executive independent Directors;
• the Board should have enough Directors to serve on various committees of the Board without over-burdening the Directors or making it difficult for them to fully discharge their responsibilities;
• the Board should comprise Directors with a broad range of competencies and expertise both nationally and internationally; and
• Directors appointed by the Board are subject to election by shareholders at the following Annual General Meeting (“AGM”) and thereafter, Directors are subject to re-election according to the provisions in the Articles of Association. Article 87 of the Articles of Association of the Company states that one-third of the directors shall retire from office by rotation with the exception of the Director holding office as Managing Director.
The Board regularly examines its size and, with a view to determining the impact of its number upon effectiveness, decides on what it considers an appropriate size for itself taking into account the scope and nature of the Company’s operations. The composition of the Board is reviewed on an annual basis by the NC to ensure that the Board has the appropriate mix of expertise and experience to enable Management to benefit from a diverse perspective of issues that are brought before the Board. The NC is of the view that the Board comprises Directors capable of exercising objective judgment on the corporate affairs of the Company independently of Management and that no individual or small group of individuals dominate the Board’s decision-making process.
When a vacancy exists, through whatever cause, or where it is considered that the Board would benefit from the services of a new Director with particular skills and knowledge, the NC, in consultation with the Board, determines the selection criteria for the position based on the skills and knowledge deemed necessary for the Board to best carry out its responsibilities. Candidates may be suggested by Directors or Management or sourced from external sources. The NC will interview the candidates and assess them based on objective criteria approved by the Board such as integrity, independent mindedness, possession of the relevant skills required or skills needed to complement the existing Board members, ability to commit the time and effort to carry out his responsibilities, good decision making track record, relevant experience and financial literacy. The NC will make a recommendation to the Board on the appointment. The Board then appoints the most suitable candidate who must stand for election at the next AGM of shareholders.
Particulars of interests of Directors who held office at the end of the financial year in shares and share options in the Company and in related corporations (other than wholly-owned subsidiaries) are set out in the Directors’ Report.

PSC CORPORATION LTDANNUAL REPORT 201140
CORPORATE GOVERNANCE STATEMENT
1.7 Independent Members of the Board of Directors
The Board has 3 Independent Directors, representing at least one-third of the Board: Mr. Chee Teck Kwong Patrick, Mr Tao Yeoh Chi and Mr Lien Kait Long. The criteria for independence are based on the definition given in the Code, which considers an Independent Director as one who has no relationship with the Company, its related companies or its officers that could interfere, or be reasonably perceived to interfere, with the exercise of the Director’s independent business judgement with a view of the best interest of the Company. The independence of each Director is reviewed annually by the NC.
1.8 Chairman and Chief Executive Officer
Principle 3: There should be a clear division of responsibilities at the top of the company – the working of the Board and the executive responsibility of the company’s business – which will ensure a balance of power and authority, such that no one individual represents a considerable concentration of power.
There is a distinct separation of responsibilities between the Executive Chairman and the Chief Executive Officer (“CEO”), which ensures that there is a balance of power and authority, increased accountability and greater capacity of the Board for independent decision-making at the top of the Company. These posts are held by Dr Allan Yap and Mr Foo Der Rong respectively.
The Chairman leads the Board and is responsible for the effective working of the Board including:
• scheduling of meetings (with the assistance of the Company Secretary) to enable the Board to perform its duties while not interfering with the flow of the Group’s operations;
• preparing the meeting agenda (in consultation with the CEO);
• ensuring that Board meetings are held when necessary;
• facilitating contributions from the Non-Executive Directors and encouraging constructive relationships between the Directors;
• exercising control over the quality, quantity and timeliness of information flow to the Board, ensuring effective communication with the Company’s shareholders;
• ensuring, fostering constructive and effective communication with shareholders; and
• encouraging high standards of corporate governance.

PSC CORPORATION LTDANNUAL REPORT 2011 41
CORPORATE GOVERNANCE STATEMENT
1.9 Board Membership
Principle 4: There should be a formal and transparent process for the appointment of new Directors to the Board.
In appointing Directors, the Board considers the range of skills and experience required in the light of:
• geographical spread and diversity of the Group’s businesses;• the strategic direction and progress of the Group;• the current composition of the Board; and• the need for independence.
The Board has delegated to the NC the functions of developing and maintaining a transparent and formal process for the appointment of new Directors, making recommendations for Directors who are due for retirement by rotation to seek re-election at a general meeting and determining the independent status of each Director.
The NC comprises 3 members, the majority of whom (including the Chairman) are independent – Mr Lien Kait Long (Chairman, and Independent Director), Mr Chee Teck Kwong Patrick (Independent Director) and Dr John Chen Seow Phun (Non-Executive Director). The NC Chairman is also a Director who is not a substantial shareholder and is not directly associated(1) with a substantial shareholder.
The NC is regulated by its terms of reference and its key functions include:–
• reviewing the Board structure, size and composition;
• assessing nominees or candidates for appointment and election to the Board and the various Board Committees overseeing the induction process for Directors;
• assessing the effectiveness and contributions of the Board as a whole;
• assessing the contribution of each individual Director to the effectiveness of the Board, in particular when a Director has multiple board representations and having regard to the Director’s contribution and performance;
• reviewing the independence of the directors on an annual basis; and
• deciding a Director is able to and has been adequately carrying out his duties as Director of the Company based on internal guidelines such as attendance, contractibility and responsiveness.
The Company’s Articles of Association provide that, at each AGM, one-third of the Directors for the time being (or, if their number is not a multiple of three, the number nearest to but not greater than one-third) shall retire from office by rotation. A retiring Director is eligible for re-election by the shareholders of the Company at the AGM, and prior to nominating a retiring Director for re-election, the NC will evaluate the Director’s contribution and performance taking into consideration factors such as attendance, preparedness, participation and candour.

PSC CORPORATION LTDANNUAL REPORT 201142
CORPORATE GOVERNANCE STATEMENT
1.9 Board Membership (cont’d)
The NC held 1 meeting. The number of meetings attended by each member of the NC during the financial year is as follows:
Name of director AppointmentNumber of meetings
attendedMr Lien Kait Long (Chairman) Non-Executive/Independent 1Mr Chee Teck Kwong Patrick Non-Executive/Independent 1Dr John Chen Seow Phun Non-Executive 1
Note:
(1) Under the Code, a Director would be considered to be “directly associated” to a substantial shareholder when the Director is accustomed or under an obligation, whether formal or informal, to act in accordance with the directions, instructions or wishes of the substantial shareholder.
1.10 Board Performance
Principle 5: There should be a formal assessment of the effectiveness of the Board as a whole and the contribution by each Director to the effectiveness of the Board.
We believe that Board performance is ultimately reflected in the performance of the Group and the Company. The Board should ensure compliance with applicable laws and Board members should act in good faith, with due diligence and care in the best interest of the Group and the shareholders. In addition to these fiduciary duties, the Board is charged with two key responsibilities of setting strategic direction and ensuring that the Group is ably led. The Board, through the delegation of its authority to the NC, will review the Board’s composition annually to ensure that the Board has the appropriate mix of expertise and experience to lead the Group.
The NC uses an objective performance criteria to conduct Board assessments via the circulation of assessment forms to the Directors for their evaluation of various Board issues and processes such as the Board structure, conduct of Board meetings, review of the Company’s corporate strategy and planning, ensuring and reviewing the Company’s risk management and internal control processes, review of the Company’s performance, review of the Board’s compensation evaluations and communication with the Company’s shareholders. The results of the Board assessment are discussed by the NC and suggestions arising from the assessment are circulated to the Board for consideration of the appropriate measures to be taken.
The individual Directors’ assessments implemented by the NC are based on the Director’s self assessment, the parameters of which include contribution and performance based on factors such as attendance, preparedness and participation. The evaluations are discussed by the NC and any appropriate action taken.
Selected performance criteria will not change from year to year unless they are deemed necessary and the Board is able to justify the changes.
The financial indicators set out in the Code for the evaluation of Directors are in our opinion more of a measure of Management’s performance and hence, less applicable to Directors. Moreover, the financial indicators provide snapshots of the Group’s performance and do not reflect a complete measure of long-term creation of shareholders’ wealth.

PSC CORPORATION LTDANNUAL REPORT 2011 43
CORPORATE GOVERNANCE STATEMENT
1.11 Access to Information
Principle 6: In order to fulfil their responsibilities, Board members should be provided with complete, adequate and timely information prior to Board meetings and on an on-going basis.
Directors receive a regular supply of information from Management about the Group so that they are equipped to play as full a part as possible in Board meetings. Detailed Board papers are circulated to all Directors prior to the scheduled meetings so that members may better understand the issues beforehand, allowing for more time at such meetings for questions that members may have. The Board papers provided include background or explanatory information relating to matters to be brought before the Board. A presentation is made to the Directors at the Board meeting on budgets, forecasts and variances from the budget disclosed.
All Directors have separate and independent access to the advice and services of the Company Secretary. At least one of the Company Secretaries attends the Board and Board Committee meetings and assists the Chairman of the Board and Board Committee meetings in ensuring that the relevant procedures are followed and that applicable rules and regulations are complied with as well as ensuring good information flow within the Board and its committees, between senior Management and the Non-Executive Directors, facilitating orientation and assisting with professional development as required. The appointment and removal of the Company Secretary is a matter which is approved by the Board.
The Board also has separate and independent access to the Company’s senior Management.
Each Director has the right, at the Company’s expense, to seek independent legal and other professional advice concerning any aspect of the Group’s operations or undertakings in order to fulfil their duties and responsibilities as Directors.
2 REMUNERATION MATTERS
2.1 Procedure for Developing Remuneration Policies
Principle 7: There should be a formal and transparent procedure for developing policy on executive remuneration and for fixing the remuneration packages of individual Directors. No Director should be involved in deciding his own remuneration.
The Group’s remuneration policy is to provide compensation packages at market rates which reward successful performance and attract, retain and motivate Directors and key management executives.
The RC comprises solely of Non-Executive Directors, the majority of whom, including the Chairman, are independent. The RC comprises 3 members – Mr Tao Yeoh Chi (Chairman, and Independent Director), Mr Chee Teck Kwong Patrick (Independent Director) and Dr John Chen Seow Phun (Non-Executive Director).
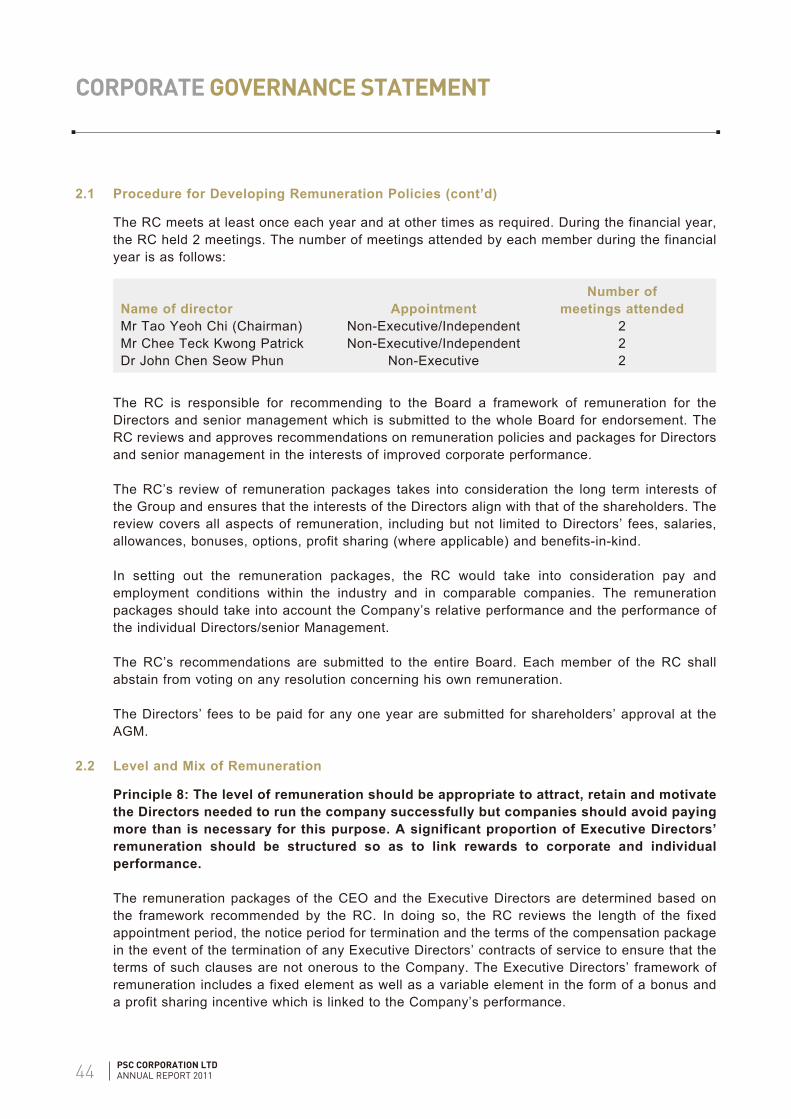
PSC CORPORATION LTDANNUAL REPORT 201144
CORPORATE GOVERNANCE STATEMENT
2.1 Procedure for Developing Remuneration Policies (cont’d)
The RC meets at least once each year and at other times as required. During the financial year, the RC held 2 meetings. The number of meetings attended by each member during the financial year is as follows:
Name of director AppointmentNumber of
meetings attendedMr Tao Yeoh Chi (Chairman) Non-Executive/Independent 2Mr Chee Teck Kwong Patrick Non-Executive/Independent 2Dr John Chen Seow Phun Non-Executive 2
The RC is responsible for recommending to the Board a framework of remuneration for the Directors and senior management which is submitted to the whole Board for endorsement. The RC reviews and approves recommendations on remuneration policies and packages for Directors and senior management in the interests of improved corporate performance.
The RC’s review of remuneration packages takes into consideration the long term interests of the Group and ensures that the interests of the Directors align with that of the shareholders. The review covers all aspects of remuneration, including but not limited to Directors’ fees, salaries, allowances, bonuses, options, profit sharing (where applicable) and benefits-in-kind.
In setting out the remuneration packages, the RC would take into consideration pay and employment conditions within the industry and in comparable companies. The remuneration packages should take into account the Company’s relative performance and the performance of the individual Directors/senior Management.
The RC’s recommendations are submitted to the entire Board. Each member of the RC shall abstain from voting on any resolution concerning his own remuneration.
The Directors’ fees to be paid for any one year are submitted for shareholders’ approval at the AGM.
2.2 Level and Mix of Remuneration
Principle 8: The level of remuneration should be appropriate to attract, retain and motivate the Directors needed to run the company successfully but companies should avoid paying more than is necessary for this purpose. A significant proportion of Executive Directors’ remuneration should be structured so as to link rewards to corporate and individual performance.
The remuneration packages of the CEO and the Executive Directors are determined based on the framework recommended by the RC. In doing so, the RC reviews the length of the fixed appointment period, the notice period for termination and the terms of the compensation package in the event of the termination of any Executive Directors’ contracts of service to ensure that the terms of such clauses are not onerous to the Company. The Executive Directors’ framework of remuneration includes a fixed element as well as a variable element in the form of a bonus and a profit sharing incentive which is linked to the Company’s performance.
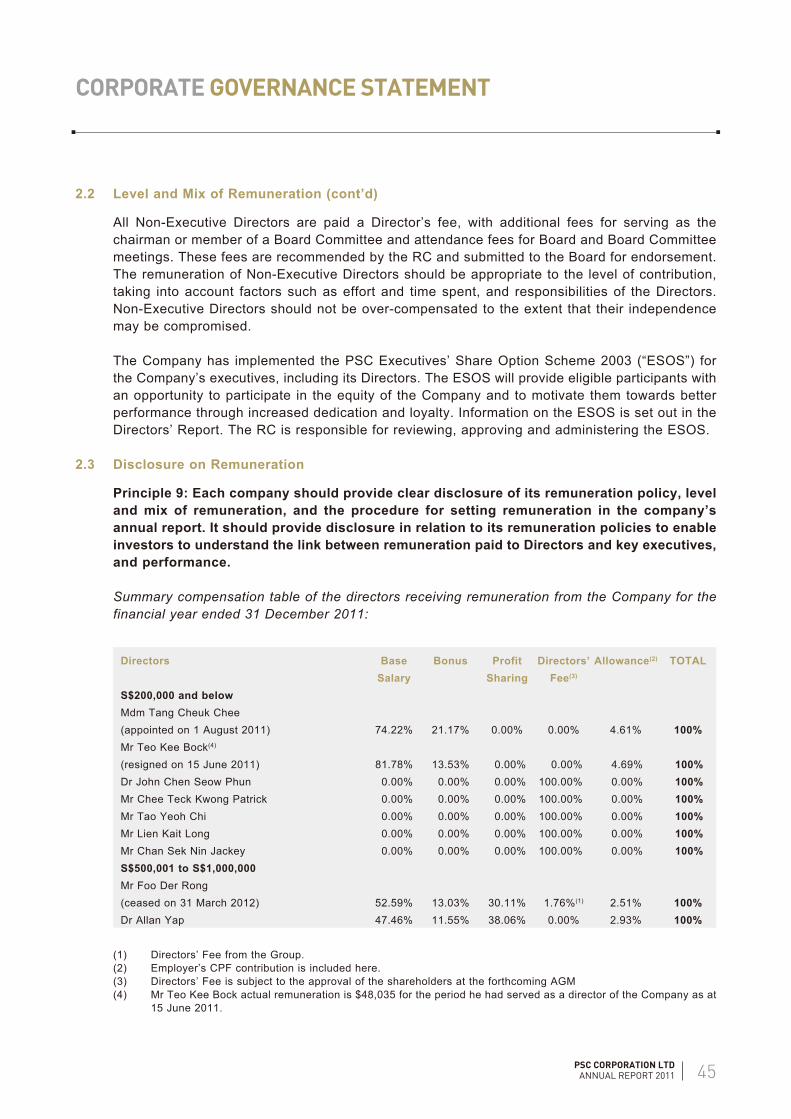
PSC CORPORATION LTDANNUAL REPORT 2011 45
CORPORATE GOVERNANCE STATEMENT
2.2 Level and Mix of Remuneration (cont’d)
All Non-Executive Directors are paid a Director’s fee, with additional fees for serving as the chairman or member of a Board Committee and attendance fees for Board and Board Committee meetings. These fees are recommended by the RC and submitted to the Board for endorsement. The remuneration of Non-Executive Directors should be appropriate to the level of contribution, taking into account factors such as effort and time spent, and responsibilities of the Directors. Non-Executive Directors should not be over-compensated to the extent that their independence may be compromised.
The Company has implemented the PSC Executives’ Share Option Scheme 2003 (“ESOS”) for the Company’s executives, including its Directors. The ESOS will provide eligible participants with an opportunity to participate in the equity of the Company and to motivate them towards better performance through increased dedication and loyalty. Information on the ESOS is set out in the Directors’ Report. The RC is responsible for reviewing, approving and administering the ESOS.
2.3 Disclosure on Remuneration
Principle 9: Each company should provide clear disclosure of its remuneration policy, level and mix of remuneration, and the procedure for setting remuneration in the company’s annual report. It should provide disclosure in relation to its remuneration policies to enable investors to understand the link between remuneration paid to Directors and key executives, and performance.
Summary compensation table of the directors receiving remuneration from the Company for the financial year ended 31 December 2011:
Directors Base Salary
Bonus Profit Sharing
Directors’ Fee(3)
Allowance(2) TOTAL
S$200,000 and belowMdm Tang Cheuk Chee (appointed on 1 August 2011) 74.22% 21.17% 0.00% 0.00% 4.61% 100%Mr Teo Kee Bock(4) (resigned on 15 June 2011) 81.78% 13.53% 0.00% 0.00% 4.69% 100%Dr John Chen Seow Phun 0.00% 0.00% 0.00% 100.00% 0.00% 100%Mr Chee Teck Kwong Patrick 0.00% 0.00% 0.00% 100.00% 0.00% 100%Mr Tao Yeoh Chi 0.00% 0.00% 0.00% 100.00% 0.00% 100%Mr Lien Kait Long 0.00% 0.00% 0.00% 100.00% 0.00% 100%Mr Chan Sek Nin Jackey 0.00% 0.00% 0.00% 100.00% 0.00% 100%S$500,001 to S$1,000,000Mr Foo Der Rong (ceased on 31 March 2012) 52.59% 13.03% 30.11% 1.76%(1) 2.51% 100%Dr Allan Yap 47.46% 11.55% 38.06% 0.00% 2.93% 100%
(1) Directors’ Fee from the Group.(2) Employer’s CPF contribution is included here.(3) Directors’ Fee is subject to the approval of the shareholders at the forthcoming AGM(4) Mr Teo Kee Bock actual remuneration is $48,035 for the period he had served as a director of the Company as at
15 June 2011.

PSC CORPORATION LTDANNUAL REPORT 201146
CORPORATE GOVERNANCE STATEMENT
2.4 Remuneration of Employees Related to Directors
As at 31 December 2011, we have one employee (“Employee A”), who is related to Mdm Tang Cheuk Chee, an Executive Director of the Company and one employee (“Employee B”), who is related to Mr Foo Der Rong, the CEO of the Company.
Employee A has been the Head of MIS overseeing the whole MIS department since 2008. The remuneration of this employee is determined by the CEO and the Senior Vice President-Group HR. On 1 March 2012, he was transferred and assumed the position of Assistant General Manager of a subsidiary of the Company. Mdm Tang Cheuk Chee abstains from all matters relating to the remuneration of this employee.
Employee B has been the Executive Director of a subsidiary since 1996. The remuneration of this employee is determined by the Executive Chairman and an Executive Director. The CEO abstains from all matters relating to the remuneration of this employee.
The basis of determining the remuneration of these related employees are the same as the basis of determining the remuneration of other unrelated employees.
Summary compensation table of the executives who are related to the Directors for the financial year ended 31 December 2011:
Remuneration Band Salary Bonus Profit Sharing
Directors’ Fee
Allowances and other benefits(1)
TOTAL
Range $250,001 – $500,000Employee B 84.10% 7.00% 0.00% 0.00% 8.90% 100%Range $250,000 and belowEmployee A 73.23% 10.68% 5.91% 0.00% 10.18% 100%
(1) Employer’s CPF contribution is included here.
2.5 Remuneration of the Key Management Executives
Disclosure of the key management executives’ remuneration (who are not Directors) which falls within bands of S$500,000 and below (based on gross remuneration received) is set out below:
Key Management Executives Base Salary
Bonus Profit Sharing
Directors’ Fee(1)
Allowance(2) TOTAL
Range S$250,001-S$500,000Foo Der Chyang Desmond(last day of service on 19 March 2012) 84.10%(3) 7.00% 0.00% 0.00% 8.90% 100%Tang Yick Chong (resigned on 13 March 2012) 77.14% 12.86% 0.00% 6.05% 3.95% 100%Wong Juan Meng 77.44% 12.91% 6.45% 0.00% 3.20% 100%Range $250,000 and belowWee Jee Kin(resigned on 3 February 2012) 77.98% 11.40% 0.00% 0.00% 10.62% 100%Teo Wai Leng Lena(resigned on 08 September 2011) 78.55% 12.99% 0.00% 0.00% 8.46% 100%

PSC CORPORATION LTDANNUAL REPORT 2011 47
CORPORATE GOVERNANCE STATEMENT
2.5 Remuneration of the Key Management Executives (cont’d)
(1) Directors’ Fee from the Group.(2) Employers CPF contribution is included here.(3) Remuneration from a subsidiary.
The Company adopts a remuneration policy for staff comprising both a fixed and variable component. The fixed component is in the form of a base salary and allowances. The variable component is in the form of a variable bonus that is linked to the Company and each individual’s performance.
3 ACCOUNTABILITY AND AUDIT
Principle 10: The Board should present a balanced and understandable assessment of the company’s performance, position and prospects.
In presenting the annual financial statements and quarterly announcements to shareholders as well as any price sensitive reports to the public, the Board aims to provide the shareholders with a balanced and understandable assessment of the Company’s and the Group’s performance, position and prospects.
The Board is provided with an analysis of the management accounts at the quarterly Board meetings which presents a balanced and understandable assessment of the Company’s performance, position and prospects.
3.1 Audit Committee
Principle 11: The Board should establish an Audit Committee with written terms of reference which clearly set out its authority and duties.
The AC comprises 4 members, all of whom are Non-Executive Directors and the majority of whom, including the Chairman, are independent. The AC’s members are Mr Chee Teck Kwong Patrick (Chairman, and Independent Director), Mr Tao Yeoh Chi (Independent Director), Dr John Chen Seow Phun (Non-Executive Director) and Mr Lien Kait Long (Independent Director). At least 2 members have accounting or related financial management expertise or experience.
The AC’s main objective is to assist the Board in fulfilling its fiduciary responsibilities relating to internal controls, overseeing the external audit process, reviewing the financial information to be disclosed to the public and ensuring that arrangements are in place for the independent investigation and follow up of reports by staff of improprieties in financial reporting and other matters. To achieve this, the AC ensures that its members have the appropriate qualifications to provide independent, objective and effective oversight.
Specifically, the AC meets periodically to perform the following functions:
(a) review the audit plans of the external and internal auditors;(b) review the external and internal auditors’ reports;(c) review the co-operation given by the Company’s officers to the external and internal
auditors;(d) review the adequacy of the internal audit function;

PSC CORPORATION LTDANNUAL REPORT 201148
CORPORATE GOVERNANCE STATEMENT
3.1 Audit Committee (cont’d)
(e) evaluate the effectiveness of the Group’s system of internal controls, including financial, operational and compliance controls, and risk management, by reviewing written reports from internal and external auditors, and Management responses and actions to correct any deficiencies;
(f) review the financial statements of the Company and the Group before their submission to the Board;
(g) review non-audit services provided by the external auditors to satisfy itself that the nature and extent of such services will not prejudice the independence and objectivity of the external auditors;
(h) nominate external auditors for appointment or re-appointment and approve the remuneration and terms of engagement of the external auditor;
(i) review the Group’s compliance with such functions and duties as may be required under the relevant statutes or the Listing Manual issued by SGX-ST, and by such amendments made thereto from time to time; and
(j) review interested person transactions (as defined in Chapter 9 of the Listing Manual issued by SGX-ST) to ensure that they are on normal commercial terms and arms’ length basis and not prejudicial to the interests of the Company or its shareholders in any way.
Apart from the duties listed above, the AC may commission and review the findings of internal investigations into matters where there is suspected fraud or irregularity, or failure of internal controls or infringement of any Singapore or other applicable law, rule or regulation which has or is likely to have material impact on the Company’s or Group’s operating results and/or financial position.
The AC meets from time to time with the Group’s external and internal auditors and the executive Management to review accounting, auditing and financial reporting matters so as to provide the necessary checks and balances to ensure that an effective control environment is maintained in the Group. The AC also studies proposed changes in accounting policies, examines the internal audit functions and discusses the accounting implications of major transactions. Furthermore, the AC advises the Board regarding the adequacy of the Group’s internal controls and the contents and presentation of its interim and annual reports. Based on the information provided to the AC, nothing has come to the AC’s attention indicating that the system of internal controls and risk management is inadequate.
The AC is also authorised to investigate any matter within its terms of reference and has full access to and co-operation of Management and full discretion to invite any Director or executive officer to attend its meetings, and reasonable resources to enable it to discharge its functions properly. The AC meets annually with the internal auditors and the external auditors, without the presence of the Company’s Management to review the adequacy of audit arrangements, with particular emphasis on the scope and quality of their audits, and the independence and objectivity of the internal and external auditors. The AC has recommended the re-appointment of KPMG LLP as external auditors at the forthcoming AGM of the Company.
The AC, having reviewed all non-audit services provided by the external auditors to the Group, is satisfied that the nature and extent of such services would not affect the independence of the external auditors.

PSC CORPORATION LTDANNUAL REPORT 2011 49
CORPORATE GOVERNANCE STATEMENT
3.1 Audit Committee (cont’d)
In appointing the audit firms for the Company, its subsidiaries and significant associates, the Audit Committee is satisfied that the Company has complied with the Rules 712 and 715 of the Listing Manual of the SGX-ST.
In October 2008, the Audit Committee Guidance Committee issued the Guidebook for Audit Committees in Singapore. SGX-ST has distributed the Guidebook to all members of the Board. Where appropriate, the AC will adopt relevant best practices set out in the Guidebook, which will be used as references to assist the AC in performing its functions.
During the financial year, the AC held 4 meetings. The number of meeting attended by each member during the financial year is as follows:
Name of director AppointmentNumber of
meetings attendedMr Chee Teck Kwong Patrick (Chairman) Non-executive/Independent 4Mr Tao Yeoh Chi Non-executive/Independent 4Dr John Chen Seow Phun Non-executive 4Mr Lien Kait Long Non-executive/Independent 4
3.2 Internal Controls
Principle 12: The Board should ensure that the Management maintains a sound system of internal controls to safeguard the shareholders’ investments and the company’s assets.
The Board recognises that it is responsible for the overall internal control framework, but accepts that no cost effective internal control system will preclude all errors and irregularities, as the system is designed to manage rather than eliminate the risk of failure to achieve business objectives, and can only provide reasonable and not absolute assurance against material misstatement or loss. The AC will:
• satisfy itself that adequate measures are in place to identify and mitigate any material business risks associated with the Group;
• ensure that a review of the effectiveness of the Group’s material internal controls, including financial, operating and compliance controls and risk management, is conducted at least annually. Such reviews can be carried out by internal auditors/external auditors;
• ensure that the internal control recommendations made by internal and external auditors have been implemented by the Management; and
• ensure the Board is in a position to comment on the adequacy of the internal controls of the Group.
Relying on the reports from the internal and external auditors and management representation letters, the AC carries out assessments of the effectiveness of key internal controls during the year. Any material non-compliance or weaknesses in internal controls or recommendations from the internal and external auditors to further improve the internal controls were reported to the AC. The AC will also follow up on the actions taken by the Management on the recommendations made by the internal and external auditors.

PSC CORPORATION LTDANNUAL REPORT 201150
CORPORATE GOVERNANCE STATEMENT
3.2 Internal Controls (cont’d)
The Directors have received and considered the confirmations in accordance with Rule 705(5) of the Listing Manual of the SGX-ST from the Chief Executive Officer, the Executive Director, the Group Financial Controller and senior management of the subsidiaries in relation to the financial information for the year.
Material associates and joint ventures which the Company does not control are not dealt with for the purposes of this statement.
Based on the various management controls put in place and the reports from the internal and external auditors, reviews and confirmations by the Management; and in the absence of any evidence to the contrary, the Board with the concurrence of the AC is of the opinion that the system of internal controls addressing financial, operational and compliance risks during the year are adequate to safeguard the assets and ensure the integrity of financial statements. The Management continues to focus on improving the standard of internal controls and corporate governance.
3.3 Whistle-Blowing Policy
The Group has adopted a constructive whistle-blowing policy and guideline in order to detect and deter any fraud or deliberate error in the preparation, evaluation, review or audit of any financial statements, financial reports and records of the Company.
Demonstrating its pledge to good corporate governance, the Group provides an avenue for employees to bring their complaints responsibly to report any possible improprieties in matters of financial reporting or other matters that they may encounter to the AC or any other committees established by the AC for such purpose without fear of reprisal. The establishment of the whistle-blowing structure also augments the Group’s ability to detect potential fraud, providing another level of comfort and assurance to investors.
3.4 Internal Audit
Principle 13: The Company should establish an internal audit function that is independent of the activities it audits.
The Group has an in-house internal audit function that is independent of the activities it audits. The aim of the internal audit function is to promote internal control in the Group and to monitor the performance and the effective application of internal audit procedures. It supports the directors in assessing key internal controls through a structured review programmed. The internal audit function is expected to meet or exceed the standard set by internationally recognised professional bodies including the Standards for the Professional Practice of Internal Auditing set by The Institute of Internal Auditors.
The internal audit function reports functionally to the Chairman of the AC and administratively to the CEO. The AC ensures that the internal audit function has adequate resources and has appropriate standing within the Group. The AC, on an annual basis, assesses the effectiveness of the internal auditors by examining:
• the scope of the internal auditors’ work;• the quality of the reports;• the relationship with the external auditors; and• the independence of the areas reviewed.
PSC CORPORATION LTDANNUAL REPORT 2011 51
CORPORATE GOVERNANCE STATEMENT
3.4 Internal Audit (cont’d)
The AC has reviewed the annual internal audit plan FY2011 and is satisfied that the internal audit functions have been adequately carried out.
4 COMMUNICATION WITH OUR SHAREHOLDERS
Principle 14: Companies should engage in regular, effective and fair communication with shareholders.
Principle 15: Companies should encourage greater shareholder participation at AGMs, and allow shareholders the opportunity to communicate their views on various matters affecting the company.
The Company firmly believes in high standards of transparent corporate disclosure, pursuant to the SGX-ST’s Listing Rules and the Singapore Companies Act, whereby shareholders are informed of all major developments that affect the Group. Information is communicated to our shareholders on a timely basis. Where there is inadvertent disclosure made to a selected group, the Company will make the same disclosure publicly to all others as soon as practicable. Communication is made through:
• annual reports that are prepared and sent to all shareholders. The Board ensures that the annual report includes all relevant information about the Company and the Group, including future developments and other disclosures required by the Singapore Companies Act and Singapore Financial Reporting Standards;
• quarterly announcements containing a summary of the financial information and affairs of the Group for that period;
• notices of and explanatory memoranda for AGMs and Extraordinary General Meetings;• press releases on major developments of the Company and the Group;• disclosure to the SGX-ST; and• the Company’s website at http://www.psc.com.sg at which our shareholders can access
information on the Group.
Moreover, our shareholders are encouraged to attend the AGM to ensure a high level of accountability and to be updated on the Company’s strategies and goals. The Company’s Articles allow a shareholder to appoint up to 2 proxies to attend a shareholder’s meeting on his behalf. The notice of the AGM is sent to our shareholders, together with explanatory notes, appendices or a circular on items of special business, at least 14 days before the meeting. The Chairmen of the AC, NC and RC are normally present and available to address questions relating to the work of their respective committees at general meetings. Furthermore, the external auditors are present to assist our Board in addressing any relevant queries by our shareholders.
Each item of special business included in the notice of the meeting is accompanied, where appropriate, by an explanation for the proposed resolution. Separate resolutions are proposed for substantially separate issues at the meeting.
The Board also notes that there should be separate resolutions on each substantially separate issue that is to be tabled at the general meeting.
PSC CORPORATION LTDANNUAL REPORT 201152
CORPORATE GOVERNANCE STATEMENT
5 DEALINGS IN SECURITIES
The Company has adopted its own internal Code of Conduct to provide guidance to all officers of the Company and its subsidiaries with regard to dealings in the Company’s securities in compliance with Rule 1207(19) of the Listing Manual of the SGX-ST.
The Company notifies all employees that they are prohibited from trading in the Company’s shares one month prior to the announcement of the Company’s full year results and two weeks before the announcement of the first three quarters of the Company’s financial results.
The Company has also issued a policy on Insider Trading to all employees which sets out the principles of relevant laws relating to insider trading which are applicable at all times.
6 INTERESTED PERSON TRANSACTIONS
The Company is required to comply with the requisite rules under Chapter 9 of the Listing Manual issued by SGX-ST for interested person transactions. To ensure compliance with Chapter 9, the AC meets quarterly to review if the Company will be entering into an interested person transaction in order to ensure that the interested person transactions are carried out on normal commercial terms and will not be prejudicial to the interests of the shareholders. Save as disclosed in the audited financial statements of this Annual Report, there are no interested person transactions for the financial year ended 31 December 2011.
7 MATERIAL CONTRACTS
Save as disclosed in the audited financial statements of this Annual Report, there are no material contracts of the Company or its subsidiaries involving the interests of the CEO, directors or controlling shareholders subsisting at the end of the financial year ended 31 December 2011 or have been entered into since the end of the previous financial year.
8 RISK MANAGEMENT
Management regularly reviews the Group’s business and operational activities to identify areas of significant business risks as well as deliberate on appropriate measures to control and mitigate these risks. Management is accountable to the Board for ensuring the effectiveness of risk management and adherence to risk appetite limits.
On a day-to-day basis, business units have primary responsibility for risk management. The various business units provide the senior Management with a timely assessment of key risk exposures and the associated Management responses. These units also recommend risk appetite and control limits.
The significant risk management policies are as disclosed in the audited financial statements of this Annual Report.

53
DIRECTORS’ REPORT
PSC CORPORATION LTDANNUAL REPORT 2011
We are pleased to submit this annual report to the members of the Company together with the audited financial statements for the financial year ended 31 December 2011.
Directors
The directors in office at the date of this report are as follows:
Allan YapTang Cheuk Chee (Appointed on 1 August 2011)Foo Der RongChee Teck Kwong PatrickTao Yeoh ChiJohn Chen Seow PhunLien Kait LongChan Sek Nin Jackey
Directors’ Interests
According to the register kept by the Company for the purposes of Section 164 of the Singapore Companies Act, Chapter 50 (the Act), particulars of interests of directors who held office at the end of the financial year (including those held by their spouses and infant children) in shares and share options in the Company and in related corporations (other than wholly-owned subsidiaries) are as follows:
Holdings at beginning of the year
Holdings at end
of the yearName of director and corporation in which interests are held
Allan YapPSC Corporation Ltd– ordinary shares – 96,555,500*– options to subscribe for ordinary shares between 20/08/2004 and
19/08/2013 1,000,000 1,000,000– options to subscribe for ordinary shares between 22/01/2010 and
21/01/2019 10,000,000 10,000,000
Tang Cheuk CheePSC Corporation Ltd– ordinary shares – 96,555,500*
Foo Der RongPSC Corporation Ltd– ordinary shares 876,750 876,750– options to subscribe for ordinary shares between 20/08/2004 and
19/08/2013 800,000 800,000– options to subscribe for ordinary shares between 22/01/2010 and
21/01/2019 5,000,000 5,000,000
* Allan Yap is deemed to be interested in 96,555,500 shares held by his wife, Tang Cheuk Chee in the capital of the Company.

54
DIRECTORS’ REPORT
PSC CORPORATION LTDANNUAL REPORT 2011
Directors’ Interests (cont’d)
Holdings at beginning of the year
Holdings at end
of the yearName of director and corporation in which interests are held
Chee Teck Kwong PatrickPSC Corporation Ltd– ordinary shares 800,000 800,000
Tao Yeoh ChiPSC Corporation Ltd– options to subscribe for ordinary shares between 22/01/2010 and
21/01/2014 600,000 600,000
John Chen Seow PhunPSC Corporation Ltd– ordinary shares 1,000,000 1,000,000
Lien Kait LongPSC Corporation Ltd– ordinary shares 5,530 5,530– options to subscribe for ordinary shares between 22/01/2010 and
21/01/2014 500,000 500,000
Chan Sek Nin JackeyPSC Corporation Ltd– options to subscribe for ordinary shares between 22/01/2010 and
21/01/2014 500,000 500,000
* Tang Cheuk Chee has a direct and deemed interested of 49,449,500 and 47,106,000 shares in the capital of the Company respectively.
Except as disclosed in this report, no director who held office at the end of the financial year had interests in shares or share options of the Company, or of related corporations, either at the beginning of the financial year, or date of appointment, if later, or at the end of the financial year.
There were no changes in any of the above mentioned interests in the Company between the end of the financial year and 21 January 2012.
Except as disclosed under the “Share options” section of this report, neither at the end of, nor at any time during the financial year, was the Company a party to any arrangement whose objects are, or one of whose objects is, to enable the directors of the Company to acquire benefits by means of the acquisition of shares in the Company or any other body corporate.

55
DIRECTORS’ REPORT
PSC CORPORATION LTDANNUAL REPORT 2011
Directors’ Interests (cont’d)
Except for salaries, bonuses and fees and those benefits that are disclosed in this report and in notes 25 and 35 to the financial statements, since the end of the last financial year, no director has received or become entitled to receive, a benefit by reason of a contract made by the Company or a related corporation with the director, or with a firm of which he is a member, or with a company in which he has a substantial financial interest.
Share options
The PSC Executives’ Share Option Scheme (the Scheme) of the Company was approved and adopted by its members at an Extraordinary General Meeting held on 8 July 2003. The Scheme is administered by the Company’s Remuneration Committee, comprising three directors, Tao Yeoh Chi (Chairman), Chee Teck Kwong Patrick and John Chen Seow Phun.
Other information regarding the Scheme is set out below:
▪ The maximum number of shares issued or to be issued for options under the Scheme is 10% of the issued share capital of the Company when the Scheme was first adopted on 8 July 2003. Pursuant to the EGM of the Company held on 28 September 2007, the maximum number of shares issued or to be issued for options under the Scheme had been changed to 15% of the issued share capital of the Company.
▪ Options may be granted at the average of the closing price of the Company’s shares on the Singapore Exchange Securities Trading Limited (SGX-ST) for the 5 business days immediately preceding the date of grant (“Market Price”) or at a price of up to 20% discount of the Market Price.
▪ Under the Scheme, a non-discounted option vests 1 year after the date of grant and a discounted option vests 2 years after the date of grant.
▪ Unless they are cancelled or lapsed prior to the expiry date, options granted will expire 120 months after the date of grant, except for options granted to non-executive directors which will expire 60 months after the date of grant.
At the end of the financial year, details of the options granted under the Scheme on the unissued ordinary shares of the Company, are as follows:
Date of grant of options
Exercise price of
the options
Options outstanding
at 01/01/2011
Options exercised
Options cancelled
Options outstanding
at 31/12/2011
Number of option
holders at 31/12/2011
Exercise period
20/08/2003 $0.220 2,060,000 – – 2,060,000 4 20/08/2004 – 19/08/2013
22/01/2009 $0.160 15,820,000 – – 15,820,000 7 22/01/2010 – 21/01/2019
22/01/2009 $0.160 1,600,000 – – 1,600,000 3 22/01/2010 – 21/01/2014
19,480,000 – – 19,480,000

56
DIRECTORS’ REPORT
PSC CORPORATION LTDANNUAL REPORT 2011
Share options (cont’d)
Except as disclosed above, there were no unissued shares of the Company or its subsidiaries under options granted by the Company or its subsidiaries as at the end of the financial year.
Details of options granted to directors of the Company under the Scheme are as follows:
AggregateAggregate options Aggregate
Options options exercised options Aggregategranted granted since since expired since options
for financial commencement commencement commencement outstandingyear ended of Scheme to of Scheme to of Scheme to as at
31 December 31 December 31 December 31 December 31 DecemberName of director 2011 2011 2011 2011 2011
Allan Yap – 11,000,000 – – 11,000,000Foo Der Rong – 5,800,000 – – 5,800,000Chee Teck Kwong Patrick – 1,000,000 (800,000) (200,000) –Tao Yeoh Chi – 800,000 – (200,000) 600,000John Chen Seow Phun – 1,400,000 (1,000,000) (400,000) –Lien Kait Long – 500,000 – – 500,000Chan Sek Nin Jackey – 500,000 – – 500,000
Total – 21,000,000 (1,800,000) (800,000) 18,400,000
Since the commencement of the Scheme, no options have been granted to the controlling shareholders of the Company or their associates and no participant under the Scheme has been granted 5% or more of the total options available under the Scheme.
The options granted by the Company do not entitle the holders of the options, by virtue of such holding, to any rights to participate in any share issue of any other company.
Audit Committee
The members of the Audit Committee during the year and at the date of this report are:
• Chee Teck Kwong Patrick (Chairman), non-executive independent director• Tao Yeoh Chi, non-executive independent director• Lien Kait Long, non-executive independent director• John Chen Seow Phun, non-executive director
The Audit Committee performs the functions specified in Section 201B of the Act, the SGX Listing Manual and the Code of Corporate Governance.
The Audit Committee has held four meetings since the last directors’ report. In performing its functions, the Audit Committee met with the Company’s external and internal auditors to discuss the scope of their work, the results of their examination and evaluation of the Company’s internal accounting control system.

57
DIRECTORS’ REPORT
PSC CORPORATION LTDANNUAL REPORT 2011
Audit Committee (cont’d)
The Audit Committee also reviewed the following:
• assistance provided by the Company’s officers to the internal and external auditors;• quarterly financial information and annual financial statements of the Group and the Company
prior to their submission to the directors of the Company for adoption; and• interested person transactions (as defined in Chapter 9 of the SGX Listing Manual).
The Audit Committee has full access to management and is given the resources required for it to discharge its functions. It has full authority and the discretion to invite any director or executive officer to attend its meetings. The Audit Committee also recommends the appointment of the external auditors and reviews the level of audit and non-audit fees.
The Audit Committee is satisfied with the independence and objectivity of the external auditors and has recommended to the Board of Directors that the auditors, KPMG LLP, be nominated for re-appointment as auditors at the forthcoming Annual General Meeting of the Company.
In appointing our auditors for the Company, subsidiaries and significant associates, we have complied with Rules 712 and 715 of the SGX Listing Manual of the SGX-ST.
Auditors
The auditors, KPMG LLP, have indicated their willingness to accept re-appointment.
On behalf of the Board of Directors
Allan YapDirector
Tang Cheuk CheeDirector
16 March 2012

58
STATEMENT BY DIRECTORS
PSC CORPORATION LTDANNUAL REPORT 2011
In our opinion:
(a) the financial statements set out on pages 61 to 140 are drawn up so as to give a true and fair view of the state of affairs of the Group and of the Company as at 31 December 2011 and the results, changes in equity and cash flows of the Group for the year ended on that date in accordance with the provisions of the Singapore Companies Act, Chapter 50 and Singapore Financial Reporting Standards; and
(b) at the date of this statement, there are reasonable grounds to believe that the Company will be able to pay its debts as and when they fall due.
The Board of Directors has, on the date of this statement, authorised these financial statements for issue.
On behalf of the Board of Directors
Allan YapDirector
Tang Cheuk CheeDirector
16 March 2012

59
INDEPENDENT AUDITORS’ REPORT
PSC CORPORATION LTDANNUAL REPORT 2011
Members of the CompanyPSC Corporation Ltd
Report on the financial statements
We have audited the accompanying financial statements of PSC Corporation Ltd (the Company) and its subsidiaries (the Group), which comprise the statements of financial position of the Group and the Company as at 31 December 2011, the income statement, statement of comprehensive income, statement of changes in equity and statement of cash flows of the Group for the year then ended, and a summary of significant accounting policies and other explanatory information, as set out on pages 61 to 140.
Management’s responsibility for the financial statements
Management is responsible for the preparation of financial statements that give a true and fair view in accordance with the provisions of the Singapore Companies Act, Chapter 50 (the Act) and Singapore Financial Reporting Standards, and for devising and maintaining a system of internal accounting controls sufficient to provide a reasonable assurance that assets are safeguarded against loss from unauthorised use or disposition; and transactions are properly authorised and that they are recorded as necessary to permit the preparation of true and fair profit and loss accounts and balance sheets and to maintain accountability of assets.
Auditors’ responsibility
Our responsibility is to express an opinion on these financial statements based on our audit. We conducted our audit in accordance with Singapore Standards on Auditing. Those standards require that we comply with ethical requirements and plan and perform the audit to obtain reasonable assurance about whether the financial statements are free from material misstatement.
An audit involves performing procedures to obtain audit evidence about the amounts and disclosures in the financial statements. The procedures selected depend on the auditor’s judgement, including the assessment of the risks of material misstatement of the financial statements, whether due to fraud or error. In making those risk assessments, the auditor considers internal control relevant to the entity’s preparation of financial statements that give a true and fair view in order to design audit procedures that are appropriate in the circumstances, but not for the purpose of expressing an opinion on the effectiveness of the entity’s internal control. An audit also includes evaluating the appropriateness of accounting policies used and the reasonableness of accounting estimates made by management, as well as evaluating the overall presentation of the financial statements.
We believe that the audit evidence we have obtained is sufficient and appropriate to provide a basis for our audit opinion.
Opinion
In our opinion, the consolidated financial statements of the Group and the statement of financial position of the Company are drawn up in accordance with the provisions of the Act and Singapore Financial Reporting Standards to give a true and fair view of the state of affairs of the Group and the Company as at 31 December 2011 and the results, changes in equity and cash flows of the Group for the year ended on that date.

60
INDEPENDENT AUDITORS’ REPORT
PSC CORPORATION LTDANNUAL REPORT 2011
Members of the CompanyPSC Corporation Ltd
Report on other legal and regulatory requirements
In our opinion, the accounting and other records required by the Act to be kept by the Company and by those subsidiaries incorporated in Singapore of which we are the auditors have been properly kept in accordance with the provisions of the Act.
KPMG LLPPublic Accountants andCertified Public Accountants
Singapore
16 March 2012

61
STATEMENTS OF FINANCIAL POSITIONAS AT 31 DECEMBER 2011
PSC CORPORATION LTDANNUAL REPORT 2011
Group CompanyNote 2011 2010 2011 2010
$ $ $ $
AssetsProperty, plant and equipment 4 68,454,930 66,260,994 16,435,909 17,655,747Intangible assets 5 1,122,045 1,064,455 – –Investment properties 6 1,220,164 1,272,264 – –Subsidiaries 7 – – 45,024,123 45,024,123Loan to a subsidiary 7 – – 9,500,000 6,000,000Associates 8 48,039,832 49,597,432 20,265,039 20,983,641Other financial assets 9 1,239,740 14,097,575 865,340 1,462,158Deferred tax assets 10 838,597 496,847 – –Non-current assets 120,915,308 132,789,567 92,090,411 91,125,669
Inventories 11 62,634,581 57,048,381 7,589,604 6,780,725Trade and other receivables 13 176,754,458 174,582,437 113,040,548 119,592,151Other financial assets 9 21,056,618 20,838,240 4,533,227 3,615,840Cash and cash equivalents 16 56,923,041 47,221,977 17,339,098 12,054,937Assets held for sale 17 – 564,110 – –Current assets 317,368,698 300,255,145 142,502,477 142,043,653
Total assets 438,284,006 433,044,712 234,592,888 233,169,322
EquityShare capital 18 201,161,582 201,161,582 201,161,582 201,161,582Reserves 18 80,683,339 81,795,303 11,701,013 9,517,200Equity attributable to owners of the Company 281,844,921 282,956,885 212,862,595 210,678,782Non-controlling interests 31,637,509 29,156,110 – –Total equity 313,482,430 312,112,995 212,862,595 210,678,782
LiabilitiesLoans and borrowings 19 808,066 – – –Deferred income 22 92,963 97,525 – –Deferred tax liabilities 10 3,584,814 3,683,395 461,601 317,125Non-current liabilities 4,485,843 3,780,920 461,601 317,125
Trade and other payables 23 90,184,688 75,874,304 21,268,692 22,173,415Loans and borrowings 19 28,283,201 39,475,598 – –Deferred income 22 9,876 10,935 – –Current tax liabilities 1,837,968 1,789,960 – –Current liabilities 120,315,733 117,150,797 21,268,692 22,173,415
Total liabilities 124,801,576 120,931,717 21,730,293 22,490,540
Total equity and liabilities 438,284,006 433,044,712 234,592,888 233,169,322
The accompanying notes form an integral part of these financial statements.
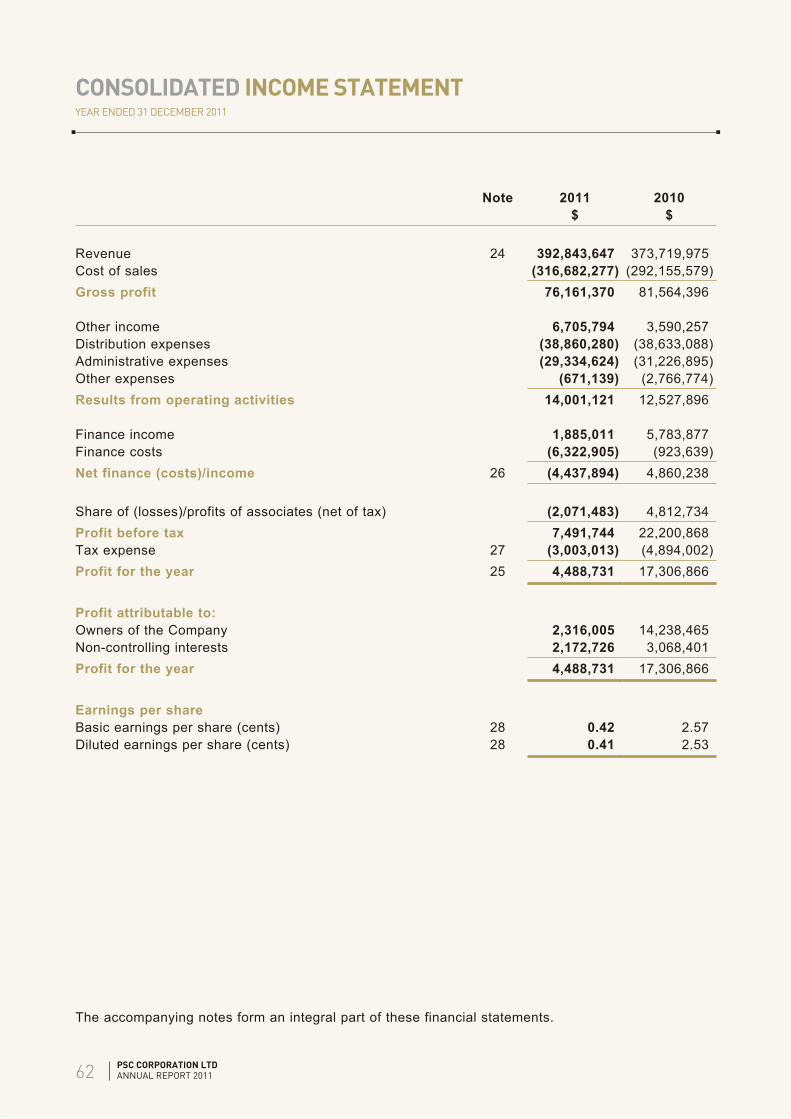
62
CONSOLIDATED INCOME STATEMENTYEAR ENDED 31 DECEMBER 2011
PSC CORPORATION LTDANNUAL REPORT 2011
Note 2011 2010$ $
Revenue 24 392,843,647 373,719,975Cost of sales (316,682,277) (292,155,579)Gross profit 76,161,370 81,564,396
Other income 6,705,794 3,590,257Distribution expenses (38,860,280) (38,633,088)Administrative expenses (29,334,624) (31,226,895)Other expenses (671,139) (2,766,774)Results from operating activities 14,001,121 12,527,896
Finance income 1,885,011 5,783,877Finance costs (6,322,905) (923,639)Net finance (costs)/income 26 (4,437,894) 4,860,238
Share of (losses)/profits of associates (net of tax) (2,071,483) 4,812,734Profit before tax 7,491,744 22,200,868Tax expense 27 (3,003,013) (4,894,002)Profit for the year 25 4,488,731 17,306,866
Profit attributable to:Owners of the Company 2,316,005 14,238,465Non-controlling interests 2,172,726 3,068,401Profit for the year 4,488,731 17,306,866
Earnings per shareBasic earnings per share (cents) 28 0.42 2.57Diluted earnings per share (cents) 28 0.41 2.53
The accompanying notes form an integral part of these financial statements.

63
CONSOLIDATED STATEMENT OF COMPREHENSIVE INCOMEYEAR ENDED 31 DECEMBER 2011
PSC CORPORATION LTDANNUAL REPORT 2011
2011 2010$ $
Profit for the year 4,488,731 17,306,866
Other comprehensive incomeForeign currency translation differences – foreign operations 4,275,939 (1,948,889)Share of foreign currency translation differences of associates 876,534 (553,834)Impairment loss on available-for-sale financial assets reclassified to profit or loss 520,900 –Net change in fair value of available-for-sale financial assets (1,334,803) 460,787Net change in fair value of available-for-sale financial assets reclassified to profit or loss on disposal (1,325,575) –Share of other reserve movement of an associate 33,212 310,728Other comprehensive income for the year, net of tax 3,046,207 (1,731,208)
Total comprehensive income for the year 7,534,938 15,575,658
Total comprehensive income attributable to:Owners of the Company 4,448,453 13,205,403Non-controlling interests 3,086,485 2,370,255Total comprehensive income for the year 7,534,938 15,575,658
The accompanying notes form an integral part of these financial statements.

64
CONSOLIDATED STATEMENT OF CHANGES IN EQUITYYEAR ENDED 31 DECEMBER 2011
PSC CORPORATION LTDANNUAL REPORT 2011
Attributable to Share Treasury Othercapital shares reserves
Group $ $ $
At 1 January 2010 202,363,853 (2,579,522) 2,979,089
Total comprehensive income for the yearProfit for the year – – –
Other comprehensive incomeForeign currency translation differences – foreign operations – – –Share of foreign currency translation differences of associates – – –Net change in fair value of available-for-sale financial assets – – –Share of other reserve movement of associates – – 310,728Total other comprehensive income – – 310,728Total comprehensive income for the year – – 310,728
Transactions with owners, recognised directly in equityContributions by and distributions to ownersDividends paid (note 18) – – –Share-based payment transactions 1,377,251 – (261,452)Total contributions by and distributions to owners 1,377,251 – (261,452)
Transfer between reservesAppropriation of retained earnings to other reserves – – 520,388
Changes in ownership interests in subsidiariesAcquisition of non-controlling interests (note 30) – – (115,000)Disposal of subsidiaries (note 30) – – –Total changes in ownership interests in subsidiaries – – (115,000)
Total transactions with owners 1,377,251 – 143,936
At 31 December 2010 203,741,104 (2,579,522) 3,433,753
The accompanying notes form an integral part of these financial statements.
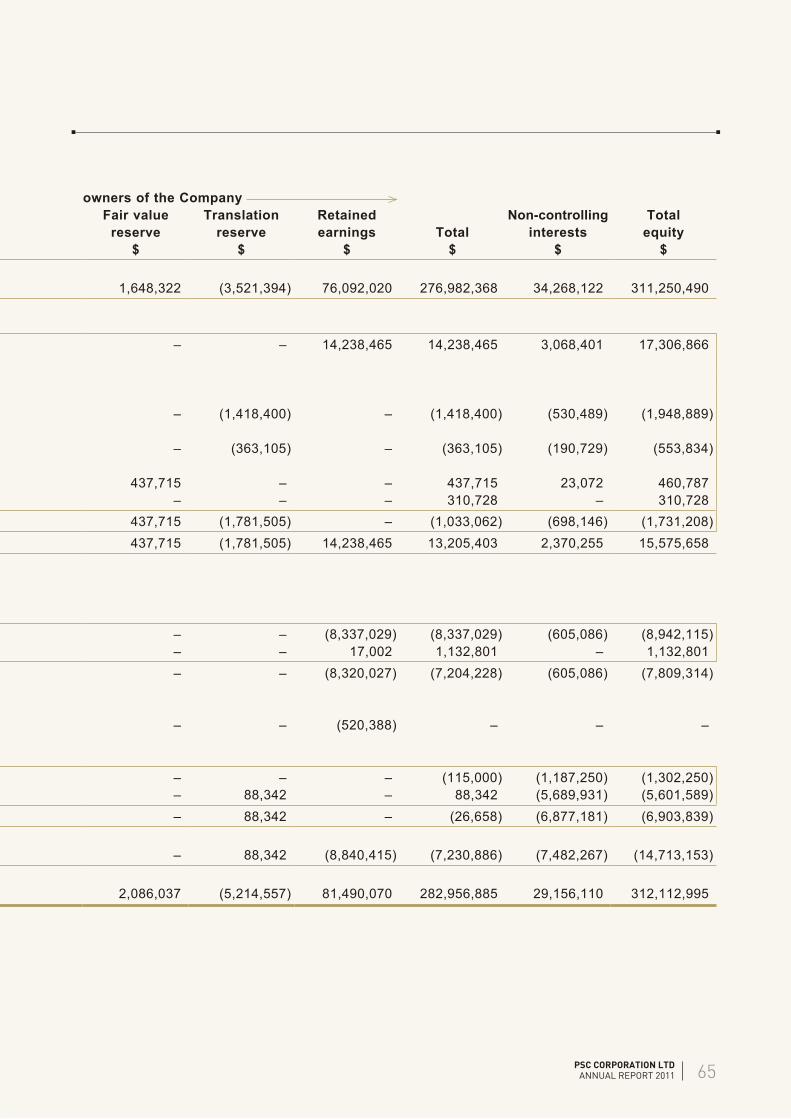
65PSC CORPORATION LTDANNUAL REPORT 2011
owners of the Company Fair value Translation Retained Non-controlling Total
reserve reserve earnings Total interests equity$ $ $ $ $ $
1,648,322 (3,521,394) 76,092,020 276,982,368 34,268,122 311,250,490
– – 14,238,465 14,238,465 3,068,401 17,306,866
– (1,418,400) – (1,418,400) (530,489) (1,948,889)
– (363,105) – (363,105) (190,729) (553,834)
437,715 – – 437,715 23,072 460,787– – – 310,728 – 310,728
437,715 (1,781,505) – (1,033,062) (698,146) (1,731,208)437,715 (1,781,505) 14,238,465 13,205,403 2,370,255 15,575,658
– – (8,337,029) (8,337,029) (605,086) (8,942,115)– – 17,002 1,132,801 – 1,132,801– – (8,320,027) (7,204,228) (605,086) (7,809,314)
– – (520,388) – – –
– – – (115,000) (1,187,250) (1,302,250)– 88,342 – 88,342 (5,689,931) (5,601,589)– 88,342 – (26,658) (6,877,181) (6,903,839)
– 88,342 (8,840,415) (7,230,886) (7,482,267) (14,713,153)
2,086,037 (5,214,557) 81,490,070 282,956,885 29,156,110 312,112,995

66
CONSOLIDATED STATEMENT OF CHANGES IN EQUITYYEAR ENDED 31 DECEMBER 2011
PSC CORPORATION LTDANNUAL REPORT 2011
Attributable to Share Treasury Othercapital shares reserves
Group $ $ $
At 1 January 2011 203,741,104 (2,579,522) 3,433,753
Total comprehensive income for the yearProfit for the year – – –
Other comprehensive incomeForeign currency translation differences – foreign operations – – –Share of foreign currency translation differences of associates – – –Impairment loss on available-for-sale financial assets reclassified to profit or loss – – –Net change in fair value of available-for-sale financial assets – – –Net change in fair value of available-for-sale financial assets transferred to profit or loss on disposal – – –Share of other reserve movement of an associate – – 894Total other comprehensive income – – 894Total comprehensive income for the year – – 894
Transactions with owners, recognised directly in equityContributions by and distributions to ownersDividends paid (note 18) – – –Total contributions by and distributions to owners – – –
Transfer between reservesAppropriation of retained earnings to other reserve – – 528,715
Total transactions with owners – – 528,715
At 31 December 2011 203,741,104 (2,579,522) 3,963,362
The accompanying notes form an integral part of these financial statements.
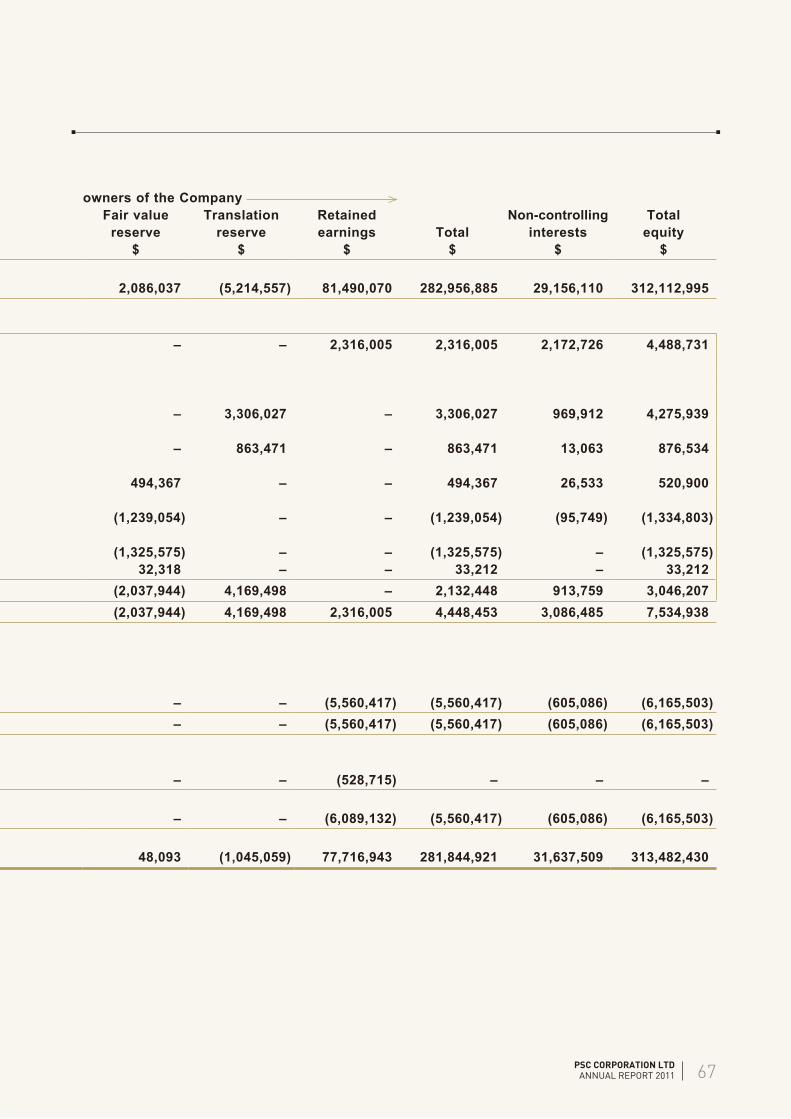
67PSC CORPORATION LTDANNUAL REPORT 2011
owners of the Company Fair value Translation Retained Non-controlling Total
reserve reserve earnings Total interests equity$ $ $ $ $ $
2,086,037 (5,214,557) 81,490,070 282,956,885 29,156,110 312,112,995
– – 2,316,005 2,316,005 2,172,726 4,488,731
– 3,306,027 – 3,306,027 969,912 4,275,939
– 863,471 – 863,471 13,063 876,534
494,367 – – 494,367 26,533 520,900
(1,239,054) – – (1,239,054) (95,749) (1,334,803)
(1,325,575) – – (1,325,575) – (1,325,575)32,318 – – 33,212 – 33,212
(2,037,944) 4,169,498 – 2,132,448 913,759 3,046,207(2,037,944) 4,169,498 2,316,005 4,448,453 3,086,485 7,534,938
– – (5,560,417) (5,560,417) (605,086) (6,165,503)– – (5,560,417) (5,560,417) (605,086) (6,165,503)
– – (528,715) – – –
– – (6,089,132) (5,560,417) (605,086) (6,165,503)
48,093 (1,045,059) 77,716,943 281,844,921 31,637,509 313,482,430

68
CONSOLIDATED STATEMENT OF CASH FLOWSYEAR ENDED 31 DECEMBER 2011
PSC CORPORATION LTDANNUAL REPORT 2011
Note 2011 2010$ $
Cash flows from operating activitiesProfit for the year 4,488,731 17,306,866Adjustments for:Amortisation of deferred income – (14,488)Depreciation of investment properties 27,157 27,979Depreciation of property, plant and equipment 7,432,356 6,917,107Gain/(Loss) on disposal of:– investment properties (277,489) –– property interests (1,940,666) –– property, plant and equipment (170,290) 63,898Impairment loss on amount due from an associate – 41,413Impairment loss on assets held for sale – 1,863,466Net finance costs/(income) 4,437,895 (4,860,238)Property, plant and equipment impaired/written off 173,562 80,501Share of losses/(profits) of associates (net of tax) 2,071,483 (4,812,734)Tax expense 3,003,013 4,894,002Unrealised exchange (gain)/loss on financial assets (158,118) 1,909,640
19,087,634 23,417,412Changes in working capital:Inventories (5,248,343) (15,436,196)Trade and other receivables (2,744,191) (27,852,653)Trade and other payables 9,919,759 26,628,183Cash generated from operating activities 21,014,859 6,756,746Tax paid (3,436,113) (4,397,940)Net cash from operating activities 17,578,746 2,358,806
The accompanying notes form an integral part of these financial statements.

69
CONSOLIDATED STATEMENT OF CASH FLOWSYEAR ENDED 31 DECEMBER 2011
PSC CORPORATION LTDANNUAL REPORT 2011
Note 2011 2010$ $
Cash flows from investing activitiesAcquisition of non-controlling interests 30 – (1,302,250)Deposit paid for property interests (43,224,107) –Dividends received 88,596 418,461Interest received 2,022,388 2,910,706Investment in an associate (250,000) (6,270,275)Loan to an associate (64,960) (64,440)Proceeds from redemption of held-to-maturity financial assets 3,209,442 2,882,670Proceeds from disposal of:– an associate – 12,536,780– financial assets 62,530,235 –– investment properties 832,466 –– property, plant and equipment 617,129 397,317– subsidiaries 30 – 5,159,185Purchase of property, plant and equipment (6,743,245) (10,139,565)Purchase of financial assets (8,883,329) (51,327,394)Net cash from/(used in) investing activities 10,134,615 (44,798,805)
Cash flows from financing activitiesDecrease/(Increase) in pledged deposits 1,164,868 (3,874,468)Dividends paid (6,165,503) (8,942,115)Interest paid (1,353,296) (909,038)Payment of finance lease liabilities (439,992) (277,524)Proceeds from borrowings 77,161,137 71,382,243Proceeds from issuance of shares under share option scheme – 1,132,801Repayment of borrowings (88,064,582) (60,562,265)Net cash used in financing activities (17,697,368) (2,050,366)
Net increase/(decrease) in cash and cash equivalents 10,015,993 (44,490,365)Cash and cash equivalents at 1 January 38,758,843 83,646,516Effect of exchange rate fluctuations on cash held 597,325 (397,308)Cash and cash equivalents at 31 December 16 49,372,161 38,758,843
The accompanying notes form an integral part of these financial statements.

70
NOTES TO THE FINANCIAL STATEMENTS
PSC CORPORATION LTDANNUAL REPORT 2011
These notes form an integral part of the financial statements.
The financial statements were authorised for issue by the Board of Directors on 16 March 2012.
1. Domicile and activities
PSC Corporation Ltd (the Company) is incorporated in the Republic of Singapore. The address of the Company’s registered office is 348 Jalan Boon Lay, Singapore 619529.
The financial statements of the Company as at and for the year ended 31 December 2011 comprise the Company and its subsidiaries (together referred to as the “Group” and individually as “Group entities”) and the Group’s interest in associates.
The Company is primarily involved in the supply of provisions and household consumer products. The Company also provides management services to its subsidiaries. The principal activities of the subsidiaries are set out in note 7 to the financial statements.
2. Basis of preparation
(a) Statement of compliance
The financial statements have been prepared in accordance with Singapore Financial Reporting Standards (FRS).
(b) Basis of measurement
The financial statements have been prepared on the historical cost basis except as otherwise described below.
(c) Functional and presentation currency
These financial statements are presented in Singapore dollars, which is the Company’s functional currency.
(d) Use of estimates and judgements
The preparation of the financial statements in conformity with FRSs requires management to make judgements, estimates and assumptions that affect the application of accounting policies and the reported amounts of assets, liabilities, income and expenses. Actual results may differ from these estimates.
Estimates and underlying assumptions are reviewed on an ongoing basis. Revisions to accounting estimates are recognised in the period in which the estimates are revised and in any future periods affected.
Information about critical judgements in applying accounting policies that have the most significant effect on the amounts recognised in the financial statements is included in the following notes:
• Note 3(g) – classification of leases• Notes 3(i) and 9 – impairment of available-for-sale financial assets

71
NOTES TO THE FINANCIAL STATEMENTS
PSC CORPORATION LTDANNUAL REPORT 2011
2. Basis of preparation (cont’d)
(d) Use of estimates and judgements (cont’d)
Information about assumptions and estimation uncertainties that have a significant risk of resulting in a material adjustment within the next financial year are included in the following notes:
• Note 3(q) – tax liabilities• Note 5 – key assumptions on recoverable amounts relating to goodwill• Note 10 – utilisation of tax losses• Notes 20 and 31 – valuation of financial instruments
(e) Changes in accounting policies
(i) Measurement of non-controlling interests in business combinations
From 1 January 2011, the Group has applied the amendments to FRS 103 Business Combinations resulting from the Improvements to FRSs 2010 in measuring at the acquisition date, non-controlling interests that are not present ownership interests and do not entitle their holders to a proportionate share of the acquiree’s net assets in the event of liquidation. Such non-controlling interests are now measured at fair value (see note 3(a)(i)).
Previously, the Group has elected on a transaction-by-transaction basis whether to measure non-controlling interests that are not present ownership interests and do not entitle holders to proportionate share of the acquiree’s net assets on liquidation at fair value, or at the non-controlling interests’ proportionate share of the recognised amounts of the acquiree’s identifiable net assets, at the acquisition date.
This change in accounting policy has been applied prospectively to new business combinations occurring on or after 1 January 2010 and has no material impact on earnings per share.
(ii) Identification of related party relationships and related party disclosures
From 1 January 2011, the Group has applied the revised FRS 24 Related Party Disclosures (2010) to identify parties that are related to the Group and to determine the disclosures to be made on transactions and outstanding balances, including commitments, between the Group and its related parties. FRS 24 (2010) improved the definition of a related party in order to eliminate inconsistencies and ensure symmetrical identification of relationships between two parties.
The adoption of FRS 24 (2010) has resulted in additional parties being identified as related to the Group. Transactions and outstanding balances, including commitments, with these related parties for the current and comparative years have been disclosed accordingly in note 35 to the financial statements.
The adoption of FRS 24 (2010) affects only the disclosures made in the financial statements. There is no financial effect on the results and financial position of the Group for the current and previous financial years. Accordingly, the adoption of FRS 24 (2010) has no impact on earnings per share.

72
NOTES TO THE FINANCIAL STATEMENTS
PSC CORPORATION LTDANNUAL REPORT 2011
3. Significant accounting policies
The accounting policies set out below have been applied consistently to all periods presented in these financial statements, and have been applied consistently by Group entities, except as explained in note 2(e), which addresses changes in accounting policies.
(a) Basis of consolidation
(i) Business combinations
Business combinations are accounted for using the acquisition method as at the acquisition date, which is the date on which control is transferred to the Group. Control is the power to govern the financial and operating policies of an entity so as to obtain benefits from its activities. In assessing control, the Group takes into consideration potential voting rights that are currently exercisable.
The consideration transferred does not include amounts related to the settlement of pre-existing relationships. Such amounts are generally recognised in profit or loss.
Costs related to the acquisition, other than those associated with the issue of debt or equity securities, that the Group incurs in connection with a business combination are expensed as incurred.
Any contingent consideration payable is recognised at fair value at the acquisition date. If the contingent consideration is classified as equity, it is not remeasured and settlement is accounted for within equity. Otherwise, subsequent changes to the fair value of the contingent consideration are recognised in profit or loss.
For non-controlling interests that are present ownership interests and entitle their holders to a proportionate share of the acquiree’s net assets in the event of liquidation, the Group elects on a transaction-by-transaction basis whether to measure them at fair value, or at the non-controlling interests’ proportionate share of the recognised amounts of the acquiree’s identifiable net assets, at the acquisition date. All other non-controlling interests are measured at acquisition-date fair value or, when applicable, on the basis specified in another standard.
(ii) Subsidiaries
Subsidiaries are entities controlled by the Group. The financial statements of subsidiaries are included in the consolidated financial statements from the date that control commences until the date that control ceases.
The accounting policies of subsidiaries have been changed when necessary to align them with the policies adopted by the Group. Losses applicable to the non-controlling interests in a subsidiary are allocated to the non-controlling interests even if doing so causes the non-controlling interests to have a deficit balance.
73
NOTES TO THE FINANCIAL STATEMENTS
PSC CORPORATION LTDANNUAL REPORT 2011
3. Significant accounting policies (cont’d)
(a) Basis of consolidation (cont’d)
(iii) Loss of control
Upon the loss of control, the Group derecognises the assets and liabilities of the subsidiary, any non-controlling interests and the other components of equity related to the subsidiary. Any surplus or deficit arising on the loss of control is recognised in profit or loss. If the Group retains any interest in the previous subsidiary, then such interest is measured at fair value at the date that control is lost. Subsequently, it is accounted for as an equity-accounted investee or as an available-for-sale financial asset depending on the level of influence retained.
(iv) Investments in associates
Associates are those entities in which the Group has significant influence, but not control, over their financial and operating policies of these entities. Significant influence is presumed to exist when the Group holds between 20% and 50% of the voting power of another entity.
Investment in associates are accounted for using the equity method (equity-accounted investees) and are recognised initially at cost. The cost of the investments includes transaction costs.
The consolidated financial statements include the Group’s share of the profit or loss and other comprehensive income of the equity-accounted investees, after adjustments to align the accounting policies of the equity-accounted investees with those of the Group, from the date that significant influence commences until the date that significant influence ceases.
When the Group’s share of losses exceeds its interest in an equity-accounted investee, the carrying amount of that interest, including any long-term investments, is reduced to zero, and the recognition of further losses is discontinued except to the extent that the Group has an obligation or has made payments on behalf of the investee.
(v) Acquisition of non-controlling interests
Acquisition of non-controlling interests are accounted for as transaction with owners in their capacity as owners and therefore the carrying amounts of assets and liabilities are not changed and goodwill is not recognised as a result of such transactions. The adjustments to non-controlling interests are based on a proportionate amount of the net assets of the subsidiary. Any difference between the adjustment to non-controlling interests and the fair value of consideration paid is recognised directly in equity and presented as part of equity attributable to owners of the Company.

74
NOTES TO THE FINANCIAL STATEMENTS
PSC CORPORATION LTDANNUAL REPORT 2011
3. Significant accounting policies (cont’d)
(a) Basis of consolidation (cont’d)
(vi) Transactions eliminated on consolidation
Intra-group balances and transactions, and any unrealised income or expenses arising from intra-group transactions, are eliminated in preparing the consolidated financial statements. Unrealised gains arising from transactions with equity-accounted investees are eliminated against the investment to the extent of the Group’s interest in the investee. Unrealised losses are eliminated in the same way as unrealised gains, but only to the extent that there is no evidence of impairment.
(vii) Accounting for subsidiaries and associates
Investments in subsidiaries and associates are stated in the Company’s statement of financial position at cost less accumulated impairment losses.
(b) Foreign currency
(i) Foreign currency transactions
Transactions in foreign currencies are translated to the respective functional currencies of Group entities at the exchange rates at the dates of the transactions. Monetary assets and liabilities denominated in foreign currencies at the end of reporting period are retranslated to the functional currency at the exchange rate at that date. The foreign currency gain or loss on monetary items is the difference between amortised cost in the functional currency at the beginning of the year, adjusted for effective interest and payments during the year, and the amortised cost in foreign currency translated at the exchange rate at the end of the year.
Non-monetary assets and liabilities denominated in foreign currencies that are measured at fair value are retranslated to the functional currency at the exchange rate at the date that the fair value was determined. Non-monetary items in a foreign currency that are measured in terms of historical cost are translated using the exchange rate at the date of the transaction. Foreign currency differences arising on retranslation are recognised in profit or loss, except for differences arising on the retranslation of available-for-sale equity instruments, which are recognised in other comprehensive income.
(ii) Foreign operations
The assets and liabilities of foreign operations are translated to Singapore dollars at exchange rates at the reporting date. The income and expenses of foreign operations are translated to Singapore dollars at exchange rates at the dates of the transactions. Goodwill and fair value adjustments arising on the acquisition of a foreign operation are treated as assets and liabilities of the foreign operation and translated at the closing rate.
75
NOTES TO THE FINANCIAL STATEMENTS
PSC CORPORATION LTDANNUAL REPORT 2011
3. Significant accounting policies (cont’d)
(b) Foreign currency (cont’d)
(i) Foreign operations (cont’d)
Foreign currency differences are recognised in other comprehensive income, and presented in the foreign currency translation reserve (translation reserve) in equity. However, if the foreign operation is a non-wholly-owned subsidiary, then the relevant proportionate share of the translation difference is allocated to the non-controlling interests. When a foreign operation is disposed of such that control or significant influence is lost, the cumulative amount in the translation reserve related to that foreign operation is reclassified to profit or loss as part of the gain or loss on disposal. When the Group disposes of only part of its interest in a subsidiary that includes a foreign operation while retaining control, the relevant proportion of the cumulative amount is reattributed to non-controlling interests. When the Group disposes of only part of its investment in an associate that includes a foreign operation while retaining significant influence, the relevant proportion of the cumulative amount is reclassified to profit or loss.
When the settlement of a monetary item receivable from or payable to a foreign operation is neither planned nor likely in the foreseeable future, foreign exchange gains and losses arising from such a monetary item are considered to form part of a net investment in a foreign operation. These are recognised in other comprehensive income, and are presented in the translation reserve in equity.
(c) Financial instruments
(i) Non-derivative financial assets
The Group initially recognises loans and receivables and deposits on the date that they are originated. All other financial assets (including assets designated at fair value through profit or loss) are recognised initially on the trade date, which is the date that the Group becomes a party to the contractual provisions of the instrument.
The Group derecognises a financial asset when the contractual rights to the cash flows from the asset expire, or it transfers the rights to receive the contractual cash flows on the financial asset in a transaction in which substantially all the risks and rewards of ownership of the financial asset are transferred. Any interest in transferred financial assets that is created or retained by the Group is recognised as a separate asset or liability.
Financial assets and liabilities are offset and the net amount presented in the statement of financial position when, and only when, the Group has a legal right to offset the amounts and intends either to settle on a net basis or to realise the asset and settle the liability simultaneously.
The Group classifies non-derivative financial assets into the following categories: financial assets at fair value through profit or loss, held-to-maturity financial assets, loans and receivables and available-for-sale financial assets.
76
NOTES TO THE FINANCIAL STATEMENTS
PSC CORPORATION LTDANNUAL REPORT 2011
3. Significant accounting policies (cont’d)
(c) Financial instruments (cont’d)
(i) Non-derivative financial assets (cont’d)
Financial assets at fair value through profit or loss
A financial asset is classified at fair value through profit or loss if it is classified as held for trading or is designated as such upon initial recognition. Financial assets are designated at fair value through profit or loss if the Group manages such investments and makes purchase and sale decisions based on their fair value in accordance with the Group’s documented risk management or investment strategy. Attributable transaction costs are recognised in profit or loss as incurred. Financial assets at fair value through profit or loss are measured at fair value, and changes therein are recognised in profit or loss.
Financial assets designated at fair value through profit or loss comprise equity securities that otherwise would have been classified as available for sale.
Held-to-maturity financial assets
If the Group has the positive intent and ability to hold debt securities to maturity, then such financial assets are classified as held-to-maturity. Held-to-maturity financial assets are recognised initially at fair value plus any directly attributable transaction costs. Subsequent to initial recognition, held-to-maturity financial assets are measured at amortised cost using the effective interest method, less any impairment losses. Any sale or reclassification of a more than insignificant amount of held-to-maturity investments not close to their maturity would result in the reclassification of all held-to-maturity investments as available for sale. It would also prevent the Group from classifying investment securities as held-to-maturity for the current and the following two financial years.
Held-to-maturity financial assets comprise debt securities.
Loans and receivables
Loans and receivables are financial assets with fixed or determinable payments that are not quoted in an active market. Such assets are recognised initially at fair value plus any directly attributable transaction costs. Subsequent to initial recognition, loans and receivables are measured at amortised cost using the effective interest method, less any impairment losses.
Loans and receivables comprise cash and cash equivalents and trade and other receivables.

77
NOTES TO THE FINANCIAL STATEMENTS
PSC CORPORATION LTDANNUAL REPORT 2011
3. Significant accounting policies (cont’d)
(c) Financial instruments (cont’d)
(i) Non-derivative financial assets (cont’d)
Cash and cash equivalents
Cash and cash equivalents comprise cash balances and bank deposits. For the purpose of the statement of cash flows, pledged deposits are excluded whilst bank overdrafts that are repayable on demand and that form an integral part of the Group’s cash management are included in cash and cash equivalents.
Available-for-sale financial assets
Available-for-sale financial assets are non-derivative financial assets that are designated as available for sale and are not classified in any of the above categories of financial assets. Available-for-sale financial assets are recognised initially at fair value plus any directly attributable transaction costs. Subsequent to initial recognition, they are measured at fair value and changes therein, other than for impairment losses (see note 3(i)(i)) and foreign currency differences on available-for-sale monetary items (see note 3(b)(i)), are recognised in other comprehensive income and presented in the fair value reserve in equity. When an investment is derecognised, the gain or loss accumulated in equity is reclassified to profit or loss.
Available-for-sale financial assets comprise equity securities.
Repurchase agreements
Investments purchased subject to commitments to resell them at future dates at a fixed price are not recognised. The receivables are shown as collateralised by the underlying security. Investments sold under repurchase agreements continue to be recognised in the balance sheet and are measured in accordance with the accounting policy for either assets held for trading or investment as appropriate.
Repurchase and resell agreements not classified as at fair value through profit or loss are classified as liabilities held at cost and loans and receivables respectively. The difference between the sale and repurchase (purchase and resell) considerations is recognised on an accrual basis using the effective interest rate method over the period of the transaction and is included in the profit or loss as interest.
(ii) Non-derivative financial liabilities
The Group initially recognises financial liabilities on the trade date, which is the date that the Group becomes a party to the contractual provisions of the instrument.
The Group derecognises a financial liability when its contractual obligations are discharged, cancelled or expire.
78
NOTES TO THE FINANCIAL STATEMENTS
PSC CORPORATION LTDANNUAL REPORT 2011
3. Significant accounting policies (cont’d)
(c) Financial instruments (cont’d)
(ii) Non-derivative financial liabilities (cont’d)
Financial assets and liabilities are offset and the net amount presented in the statement of financial position when, and only when, the Group has a legal right to offset the amounts and intends either to settle on a net basis or to realise the asset and settle the liability simultaneously.
The Group classifies non-derivative financial liabilities into the other financial liabilities category. Such financial liabilities are recognised initially at fair value plus any directly attributable transaction costs. Subsequent to initial recognition, these financial liabilities are measured at amortised cost using the effective interest method.
Other financial liabilities comprise loans and borrowings, bank overdrafts and trade and other payables.
Bank overdrafts that are repayable on demand and form an integral part of the Group’s cash management are included as a component of cash and cash equivalents for the purpose of the statement of cash flows.
(iii) Share capital
Ordinary shares
Ordinary shares are classified as equity. Incremental costs directly attributable to the issue of ordinary shares and share options are recognised as a deduction from equity, net of any tax effects.
Repurchase of share capital (treasury shares)
Where share capital recognised as equity is repurchased, the amount of the consideration paid, which includes directly attributable costs, net of any tax effects, is recognised as a deduction from equity. Repurchased shares are classified as treasury shares and are presented in the reserve for own share account. Where treasury shares are sold or reissued subsequently, the amount received is recognised as an increase in equity, and the resulting surplus or deficit on the transaction is presented in non-distributable capital reserve.
(iv) Intra-group financial guarantees
Financial guarantees are financial instruments issued by the Group that require the issuer to make specified payments to reimburse the holder for the loss it incurs because a specified debtor fails to meet payment when due in accordance with the original or modified terms of a debt instrument.
Financial guarantees are accounted for as insurance contracts. A provision is recognised based on the Company’s estimate of the ultimate cost of settling all claims incurred but unpaid at the reporting date. The provision is assessed by reviewing individual claims and tested for adequacy by comparing the amount recognised and the amount that would be required to settle the guarantee contract.
79
NOTES TO THE FINANCIAL STATEMENTS
PSC CORPORATION LTDANNUAL REPORT 2011
3. Significant accounting policies (cont’d)
(d) Property, plant and equipment
(i) Recognition and measurement
Items of property, plant and equipment are measured at cost less accumulated depreciation and accumulated impairment losses.
Cost includes expenditure that is directly attributable to the acquisition of the asset. The cost of self-constructed assets includes:
• the cost of materials and direct labour;• any other costs directly attributable to bringing the asset to a working condition for
their intended use;• when the Group has an obligation to remove the asset or restore the site, an
estimate of the cost of dismantling and removing the items and restoring the site on which they are located; and
• capitalised borrowing costs.
When parts of an item of property, plant and equipment have different useful lives, they are accounted for as separate items (major components) of property, plant and equipment.
The gain and loss on disposal of an item of property, plant and equipment is determined by comparing the proceeds from disposal with the carrying amount of property, plant and equipment, and is recognised net within other income/other expenses in profit or loss.
(ii) Subsequent costs
The cost of replacing a component of an item of property, plant and equipment is recognised in the carrying amount of the item if it is probable that the future economic benefits embodied within the component will flow to the Group, and its cost can be measured reliably. The carrying amount of the replaced component is derecognised. The costs of the day-to-day servicing of property, plant and equipment are recognised in profit or loss as incurred.
(iii) Depreciation
Depreciation is based on the cost of an asset less its residual value. Significant components of individual assets are assessed and if a component has a useful life that is different from the remainder of that asset, that component is depreciated separately.
Depreciation is recognised in profit or loss on a straight-line basis over the estimated useful lives of each component of an item of property, plant and equipment. Leased assets are depreciated over the shorter of the lease term and their useful lives unless it is reasonably certain that the Group will obtain ownership by the end of the lease term. Freehold land is not depreciated.

80
NOTES TO THE FINANCIAL STATEMENTS
PSC CORPORATION LTDANNUAL REPORT 2011
3. Significant accounting policies (cont’d)
(d) Property, plant and equipment (cont’d)
(iii) Depreciation (cont’d)
The estimated useful lives for the current and comparative periods are as follows:
• freehold buildings 50 years• leasehold buildings Remaining lease periods of 34 to 48 years• leasehold improvements Remaining lease periods of 37 to 44 years• renovations 3 to 10 years
•furniture, fittings and office equipment 3 to 13 1/3 years
• warehouse equipment 6 to 10 years• motor vehicles 4 to 10 years• plant and machinery 6 to 10 years• computers 3 to 5 years
Depreciation methods, useful lives and residual values are reviewed at the end of each reporting period and adjusted if appropriate.
(e) Intangible assets
(i) Goodwill
Goodwill that arises upon the acquisition of subsidiaries is included in intangible assets and represents the excess of:
• the fair value of the consideration transferred; plus• the recognised amount of any non-controlling interests in the acquiree; plus• if the business combination is achieved in stages, the fair value of the existing
equity interest in the acquiree,
over the net recognised amount (generally fair value) of the identifiable assets acquired and liabilities assumed.
When the excess is negative, a bargain purchase gain is recognised immediately in profit or loss.
Subsequent measurement
Goodwill is measured at cost less accumulated impairment losses. In respect of equity-accounted investees, the carrying amount of goodwill is included in the carrying amount of the investment, and an impairment loss on such an investment is not allocated to any asset, including goodwill, that forms part of the carrying amount of the equity-accounted investee.

81
NOTES TO THE FINANCIAL STATEMENTS
PSC CORPORATION LTDANNUAL REPORT 2011
3. Significant accounting policies (cont’d)
(e) Intangible assets (cont’d)
(ii) Trademarks
Trademarks are amortised and recognised in profit or loss as an expense on a straight-line basis over their useful lives of 3 to 10 years. Amortisation commences from the date the trademarks are available for use.
(iii) Amortisation
Amortisation method, useful life and residual value of trademarks are reviewed at the end of each reporting period and adjusted if appropriate.
(iv) Subsequent expenditure
Subsequent expenditure is capitalised only when it increases the future economic benefits embodied in the specific asset to which it relates. All other expenditure is recognised in profit or loss as incurred.
(f) Investment properties
Investment properties are properties held either to earn rental income or for capital appreciation or for both, but not for sale in the ordinary course of business, used in the production or supply of goods or services, or for administrative purposes. Investment properties are stated at cost less accumulated depreciation. The freehold land component of the investment properties is not depreciated. The freehold building component is depreciated on a straight-line basis over 50 years.
(g) Leased assets
Leases in terms of which the Group assumes substantially all the risks and rewards of ownership are classified as finance leases. Upon initial recognition, the leased asset is measured at an amount equal to the lower of its fair value and the present value of the minimum lease payments. Subsequent to initial recognition, the asset is accounted for in accordance with the accounting policy applicable to that asset.
Other leases are operating leases and, except for investment properties, the leased assets are not recognised in the Group’s statement of financial position. Where the Group has the use of assets under operating leases, payments made under the leases are recognised in profit or loss on a straight-line basis over the term of the lease. Lease incentives received are recognised in profit or loss as an integral part of the total lease payments made.

82
NOTES TO THE FINANCIAL STATEMENTS
PSC CORPORATION LTDANNUAL REPORT 2011
3. Significant accounting policies (cont’d)
(h) Inventories
Trading goods
Inventories are measured at the lower of cost and net realisable value. Cost is calculated using the weighted average cost formula and comprises all costs of purchase, costs of conversion and other costs incurred in bringing the inventories to their present location and condition. In the case of manufactured inventories and work-in-progress, cost includes an appropriate share of production overheads based on normal operating capacity. Net realisable value is the estimated selling price in the ordinary course of business less the estimated costs of completion and selling expenses.
Manufactured corrugated paper products
Inventories are valued at the lower of cost and net realisable value. Cost of raw materials is determined on a specific identification basis. In the case of work-in-progress and finished goods, cost includes raw materials, direct expenditure and an attributable portion of manufacturing overheads.
Net realisable value is the estimated selling price in the ordinary course of business, less selling expenses.
Contract work-in-progress
Contract work-in-progress represents the gross unbilled amount expected to be collected from customers for contract work performed to date. It is measured at cost plus profit recognised to date (see note 3(m)(ii)) less progress billings and recognised losses. Cost includes all expenditure related directly to specific projects and an allocation of fixed and variable overheads incurred in the Group’s contract activities based on normal operating capacity.
Contract work-in-progress is presented as part of inventories in the statement of financial position for all contracts in which costs incurred plus recognised profits exceed progress billings. If progress billings exceed costs incurred plus recognised profits, then the difference is presented as deferred income in the statement of financial position.
(i) Impairment
(i) Non-derivative financial assets
A financial asset not carried at fair value through profit or loss is assessed at the end of each reporting period to determine whether there is objective evidence that it is impaired. A financial asset is impaired if objective evidence indicates that a loss event has occurred after the initial recognition of the asset, and that the loss event had a negative effect on the estimated future cash flows of that asset that can be estimated reliably.
83
NOTES TO THE FINANCIAL STATEMENTS
PSC CORPORATION LTDANNUAL REPORT 2011
3. Significant accounting policies (cont’d)
(i) Impairment (cont’d)
(i) Non-derivative financial assets (cont’d)
Objective evidence that financial assets (including equity securities) are impaired can include default or delinquency by a debtor, restructuring of an amount due to the Group on terms that the Group would not consider otherwise, indications that a debtor or issuer will enter bankruptcy, adverse changes in the payment status of borrowers or issuers in the Group, economic conditions that correlate with defaults or the disappearance of an active market for a security. In addition, for an investment in an equity security, a significant or prolonged decline in its fair value below its cost is objective evidence of impairment.
Loans and receivables and held-to-maturity investment securities
The Group considers evidence of impairment for loans and receivables and held-to-maturity investment securities at both a specific asset and collective level. All individually significant loans and receivables and held-to-maturity investment securities are assessed for specific impairment. All individually significant receivables and held-to-maturity investment securities found not to be specifically impaired are then collectively assessed for any impairment that has been incurred but not yet identified. Loans and receivables and held-to-maturity investment securities that are not individually significant are collectively assessed for impairment by grouping together receivables and held-to-maturity investment securities with similar risk characteristics.
In assessing collective impairment, the Group uses historical trends of the probability of default, timing of recoveries and the amount of loss incurred, adjusted for management’s judgement as to whether current economic and credit conditions are such that the actual losses are likely to be greater or less than suggested by historical trends.
An impairment loss in respect of a financial asset measured at amortised cost is calculated as the difference between its carrying amount and the present value of the estimated future cash flows, discounted at the asset’s original effective interest rate. Losses are recognised in profit or loss and reflected in an allowance account against loans and receivables or held-to-maturity investment securities. Interest on the impaired asset continues to be recognised. When a subsequent event causes the amount of impairment loss to decrease, the decrease in impairment loss is reversed through profit or loss.
Available-for-sale financial assets
Impairment losses on available-for-sale financial assets are recognised by reclassifying the losses accumulated in the fair value reserve in equity to profit or loss. The cumulative loss that is reclassified from equity to profit or loss is the difference between the acquisition cost, net of any principal repayment and amortisation, and the current fair value, less any impairment loss previously recognised in profit or loss. Changes in impairment provisions attributable to application of the effective interest method are reflected as a component of interest income.
However, any subsequent recovery in the fair value of an impaired available-for-sale equity security is recognised in other comprehensive income.

84
NOTES TO THE FINANCIAL STATEMENTS
PSC CORPORATION LTDANNUAL REPORT 2011
3. Significant accounting policies (cont’d)
(i) Impairment (cont’d)
(ii) Non-financial assets
The carrying amounts of the Group’s non-financial assets, other than inventories and deferred tax assets, are reviewed at each reporting date to determine whether there is any indication of impairment. If any such indication exists, then the asset’s recoverable amount is estimated. For goodwill, the recoverable amount is estimated each year at the same time. An impairment loss is recognised if the carrying amount of an asset or its related cash-generating unit (CGU) exceeds its estimated recoverable amount.
The recoverable amount of an asset or CGU is the greater of its value in use and its fair value less costs to sell. In assessing value in use, the estimated future cash flows are discounted to their present value using a pre-tax discount rate that reflects current market assessments of the time value of money and the risks specific to the asset or CGU. For the purpose of impairment testing, assets that cannot be tested individually are grouped together into the smallest group of assets that generates cash inflows from continuing use that are largely independent of the cash inflows of other assets or CGU. Subject to an operating segment ceiling test, for the purposes of goodwill impairment testing, CGUs to which goodwill has been allocated are aggregated so that the level at which impairment testing is performed reflects the lowest level at which goodwill is monitored for internal reporting purposes. Goodwill acquired in a business combination is allocated to groups of CGUs that are expected to benefit from the synergies of the combination.
The Group’s corporate assets do not generate separate cash inflows and are utilised by more than one CGU. Corporate assets are allocated to CGUs on a reasonable and consistent basis and tested for impairment as part of the testing of the CGU to which the corporate asset is allocated.
Impairment losses are recognised in profit or loss. Impairment losses recognised in respect of CGUs are allocated first to reduce the carrying amount of any goodwill allocated to the CGU (group of CGUs), and then to reduce the carrying amounts of the other assets in the CGU (group of CGUs) on a pro rata basis.
An impairment loss in respect of goodwill is not reversed. In respect of other assets, impairment losses recognised in prior periods are assessed at each reporting date for any indications that the loss has decreased or no longer exists. An impairment loss is reversed if there has been a change in the estimates used to determine the recoverable amount. An impairment loss is reversed only to the extent that the asset’s carrying amount does not exceed the carrying amount that would have been determined, net of depreciation or amortisation, if no impairment loss had been recognised.
Goodwill that forms part of the carrying amount of an investment in an associate is not recognised separately, and therefore is not tested for impairment separately. Instead, the entire amount of the investment in an associate is tested for impairment as a single asset when there is objective evidence that the investment in an associate may be impaired.

85
NOTES TO THE FINANCIAL STATEMENTS
PSC CORPORATION LTDANNUAL REPORT 2011
3. Significant accounting policies (cont’d)
(j) Non-current assets held for sale
Non-current assets, or disposal groups comprising assets and liabilities, that are expected to be recovered primarily through sale rather than through continuing use, are classified as held for sale. Immediately before classification as held for sale, the assets, or components of a disposal group, are remeasured in accordance with the Group’s accounting policies. Thereafter, the assets, or disposal group, are measured at the lower of their carrying amount and fair value less costs to sell. Any impairment loss on a disposal group is first allocated to goodwill, and then to remaining assets and liabilities on pro rata basis, except that no loss is allocated to inventories, financial assets, deferred tax assets and employee benefit assets, which continue to be measured in accordance with the Group’s accounting policies. Impairment losses on initial classification as held for sale and subsequent gains or losses on remeasurement are recognised in profit or loss. Gains are not recognised in excess of any cumulative impairment loss.
(k) Employee benefits
(i) Defined contribution plans
A defined contribution plan is a post-employment benefit plan under which an entity pays fixed contributions into a separate entity and will have no legal or constructive obligation to pay further amounts. Obligations for contributions to defined contribution pension plans are recognised as an employee benefit expense in profit or loss in the periods during which services are rendered by employees.
(ii) Short-term employee benefits
Short-term employee benefit obligations are measured on an undiscounted basis and are expensed as the related service is provided. A liability is recognised for the amount expected to be paid under short-term cash bonus or profit-sharing plans if the Group has a present legal or constructive obligation to pay this amount as a result of past service provided by the employee and the obligation can be estimated reliably.
(iii) Share-based payment transactions
The grant date fair value of share-based payment awards granted to employees is recognised as an employee expense, with a corresponding increase in equity, over the period that the employees unconditionally become entitled to the awards. The amount recognised as an expense is adjusted to reflect the number of awards for which the related service and non-market vesting conditions are expected to be met, such that the amount ultimately recognised as an expense is based on the number of awards that meet the related service and non-market performance conditions at the vesting date. For share-based payment awards with non-vesting conditions, the grant date fair value of the share-based payment is measured to reflect such conditions and there is no true-up for differences between expected and actual outcomes.

86
NOTES TO THE FINANCIAL STATEMENTS
PSC CORPORATION LTDANNUAL REPORT 2011
3. Significant accounting policies (cont’d)
(l) Provisions
A provision is recognised if, as a result of a past event, the Group has a present legal or constructive obligation that can be estimated reliably, and it is probable that an outflow of economic benefits will be required to settle the obligation. Provisions are determined by discounting the expected future cash flows at a pre-tax rate that reflects current market assessments of the time value of money and risks specific to the liability. The unwinding of the discount is recognised as finance cost.
(m) Revenue
(i) Goods sold
Revenue from the sale of goods in the course of ordinary activities is measured at the fair value of the consideration received or receivable, net of returns, trade discounts and volume rebates. Revenue is recognised when persuasive evidence exists, usually in the form of an executed sales agreement, that the significant risks and rewards of ownership have been transferred to the customer, recovery of the consideration is probable, the associated costs and possible return of goods can be estimated reliably, and there is no continuing management involvement with the goods, and the amount of revenue can be measured reliably. If it is probable that discounts will be granted and the amount can be measured reliably, then the discount is recognised as a reduction of revenue as the sales are recognised.
(ii) Construction contracts
Contract revenue includes the initial amount agreed in the contract plus any variations in contract work, claims and incentive payments, to the extent that it is probable that they will result in revenue and can be measured reliably. As soon as the outcome of a construction contract can be estimated reliably, contract revenue is recognised in profit or loss in proportion to the stage of completion of the contract. Contract expenses are recognised as incurred unless they create an asset related to future contract activity.
The stage of completion is assessed by reference to surveys of work performed. When the outcome of a construction contract cannot be estimated reliably, contract revenue is recognised only to the extent of contract costs incurred that are likely to be recoverable. An expected loss on a contract is recognised immediately in profit or loss.
(iii) Healthcare consultancy
Revenue arising from healthcare consultancy is recognised in profit or loss when the relevant services are rendered.

87
NOTES TO THE FINANCIAL STATEMENTS
PSC CORPORATION LTDANNUAL REPORT 2011
3. Significant accounting policies (cont’d)
(n) Government grants
Government grants are recognised initially as deferred income at fair value when there is reasonable assurance that they will be received and the Group will comply with the conditions associated with the grant. These grants are then recognised in profit or loss as other income on a systematic basis over the useful life of the asset.
(o) Lease payments
Payments made under operating leases are recognised in profit or loss on a straight-line basis over the term of the lease. Lease incentives received are recognised as an integral part of the total lease expense, over the term of the lease.
Minimum lease payments made under finance leases are apportioned between the finance expense and the reduction of the outstanding liability. The finance expense is allocated to each period during the lease term so as to produce a constant periodic rate of interest on the remaining balance of the liability.
(p) Finance income and finance costs
Finance income comprises interest income on funds invested (including held-to-maturity investments, repurchase agreements and fixed deposits), dividend income, fair value gains on financial assets at fair value through profit or loss, and gains on the disposal of available-for-sale financial assets. Interest income is recognised as it accrues in profit or loss, using the effective interest method. Dividend income is recognised in profit or loss on the date that the Group’s right to receive payment is established, which in the case of quoted securities is normally the ex-dividend date.
Finance costs comprises interest expense on borrowings, impairment losses recognised on available-for-sale financial assets, losses on disposal of available-for-sale financial assets and fair value losses on financial assets at fair value through profit or loss that are recognised in profit or loss.
Borrowing costs that are not directly attributable to the acquisition, construction or production of a qualifying asset are recognised in profit or loss using the effective interest method.
(q) Tax
Tax expense comprises current and deferred tax. Current tax and deferred tax are recognised in profit or loss except to the extent that it relates to a business combination, or items recognised directly in equity or in other comprehensive income.
Current tax is the expected tax payable or receivable on the taxable income or loss for the year, using tax rates enacted or substantively enacted at the reporting date, and any adjustment to tax payable in respect of previous years.
88
NOTES TO THE FINANCIAL STATEMENTS
PSC CORPORATION LTDANNUAL REPORT 2011
3. Significant accounting policies (cont’d)
(q) Tax (cont’d)
Deferred tax is recognised in respect of temporary differences between the carrying amounts of assets and liabilities for financial reporting purposes and the amounts used for taxation purposes. Deferred tax is not recognised for:
• temporary differences on the initial recognition of assets or liabilities in a transaction that is not a business combination and that affects neither accounting nor taxable profit or loss;
• temporary differences related to investments in subsidiaries to the extent that it is probable that they will not reverse in the foreseeable future; and
• taxable temporary differences arising on the initial recognition of goodwill.
Deferred tax is measured at the tax rates that are expected to be applied to temporary differences when they reverse, based on the laws that have been enacted or substantively enacted by the reporting date.
Deferred tax assets and liabilities are offset if there is a legally enforceable right to offset current tax liabilities and assets, and they relate to taxes levied by the same tax authority on the same taxable entity, or on different tax entities, but they intend to settle current tax liabilities and assets on a net basis or their tax assets and liabilities will be realised simultaneously.
A deferred tax asset is recognised for unused tax losses, tax credits and deductible temporary differences, to the extent that it is probable that future taxable profits will be available against which they can be utilised. Deferred tax assets are reviewed at each reporting date and are reduced to the extent that it is no longer probable that the related tax benefit will be realised.
In the ordinary course of business, there are many transactions and calculations for which the ultimate tax treatment is uncertain. Therefore, the Group recognises tax liabilities, including those of the group’s associates, based on estimates of whether additional taxes and interest will be due. These tax liabilities are recognised when the Group believes that certain positions may not be fully sustained upon review by tax authorities, despite the Group’s belief that its tax return positions are supportable. The Group believes that its accruals for tax liabilities are adequate for all open tax years based on its assessment of many factors including interpretations of tax law and prior experience. This assessment relies on estimates and assumptions and may involve a series of multifaceted judgements about future events. New information may become available that causes the Group to change its judgement regarding the adequacy of existing tax liabilities, such changes to tax liabilities will impact tax expense in the period that such a determination is made.
89
NOTES TO THE FINANCIAL STATEMENTS
PSC CORPORATION LTDANNUAL REPORT 2011
3. Significant accounting policies (cont’d)
(r) Earnings per share
The Group presents basic and diluted earnings per share data for its ordinary shares. Basic earnings per share is calculated by dividing the profit or loss attributable to ordinary shareholders of the Company by the weighted average number of ordinary shares outstanding during the year, adjusted for own shares held. Diluted earnings per share is determined by adjusting the profit or loss attributable to ordinary shareholders and the weighted average number of ordinary shares outstanding, adjusted for own shares held, for the effect of all dilutive potential ordinary shares, which comprise share options granted to employees.
(s) Segment reporting
An operating segment is a component of the Group that engages in business activities from which it may earn revenues and incur expenses, including revenues and expenses that relate to transactions with any of the Group’s other components. All operating segments’ operating results are reviewed regularly by the Group’s Board of Directors to make decisions about resources to be allocated to the segment and to assess its performance, and for which discrete financial information is available.
Segment results that are reported to the Group’s Board of Directors include items directly attributable to a segment as well as those that can be allocated on a reasonable basis.
Segment capital expenditure is the total cost incurred during the year to acquire property, plant and equipment.
(t) New standards and interpretations not adopted
A number of new standards, amendments to standards and interpretations are effective for annual periods beginning after 1 January 2011, and have not been applied in preparing these financial statements. None of these are expected to have a significant effect on the financial statements of the Group and the Company.

90
NOTES TO THE FINANCIAL STATEMENTS
PSC CORPORATION LTDANNUAL REPORT 2011
4. Property, plant and equipment
Freehold land
Freehold buildings
Leasehold buildings
Leasehold improvements
Group $ $ $ $
CostAt 1 January 2010 3,010,162 3,794,422 30,042,717 9,714,020Additions 2,045 – 1,355,621 –Disposals – – – –Reclassification – – 76,094 –Write-offs – – – –Effect of movements in exchange rates 62,619 22,124 (1,122,783) –
At 31 December 2010 3,074,826 3,816,546 30,351,649 9,714,020
At 1 January 2011 3,074,826 3,816,546 30,351,649 9,714,020Additions – – 1,660,825 –Disposals – – – –Reclassification – – 5,785,021 –Write-offs – – – –Effect of movements in exchange rates (66,310) (23,404) 1,447,404 –
At 31 December 2011 3,008,516 3,793,142 39,244,899 9,714,020
Accumulated depreciation and impairment lossesAt 1 January 2010 532,082 2,917,281 7,330,777 2,433,776Depreciation for the year – 20,789 1,175,300 267,573Disposals – – – –Write-offs – – – –Effect of movements in exchange rates 10,087 5,217 (186,174) –
At 31 December 2010 542,169 2,943,287 8,319,903 2,701,349
At 1 January 2011 542,169 2,943,287 8,319,903 2,701,349Depreciation for the year – 20,178 1,287,620 267,573Disposals – – – –Impairment loss – – – –Reclassification – – (1,748) –Write-offs – – – –Effect of movements in exchange rates (10,670) (6,290) 264,096 –
At 31 December 2011 531,499 2,957,175 9,869,871 2,968,922
Carrying amountsAt 1 January 2010 2,478,080 877,141 22,711,940 7,280,244
At 31 December 2010 2,532,657 873,259 22,031,746 7,012,671
At 31 December 2011 2,477,017 835,967 29,375,028 6,745,098

91
NOTES TO THE FINANCIAL STATEMENTS
PSC CORPORATION LTDANNUAL REPORT 2011
Renovations
Furniture, fittings
and office equipment
Warehouse equipment
Motor vehicles
Plant and machinery Computers Total
$ $ $ $ $ $ $
7,854,393 5,980,300 916,805 6,727,056 56,856,155 1,994,907 126,890,937481,408 396,984 312,888 857,981 7,469,703 479,948 11,356,578
– (38,545) (15,360) (602,471) (436,910) (4,667) (1,097,953)– – – – (76,094) – –
(39,850) (72,719) – (121,809) (247,284) (283,960) (765,622)5,658 2,945 – (17,398) (1,409,677) 8,572 (2,447,940)
8,301,609 6,268,965 1,214,333 6,843,359 62,155,893 2,194,800 133,936,000
8,301,609 6,268,965 1,214,333 6,843,359 62,155,893 2,194,800 133,936,000261,591 554,447 61,225 388,913 4,841,710 460,638 8,229,349
– (15,050) (1,920) (548,478) (900,928) (14,641) (1,481,017)– (80,929) – – (5,704,092) – –
(113,192) (408,920) – (30,032) (301,926) (184,007) (1,038,077)(8,439) 6,130 – 23,158 1,685,884 (9,057) 3,055,366
8,441,569 6,324,643 1,273,638 6,676,920 61,776,541 2,447,733 142,701,621
3,260,313 3,828,322 472,777 3,096,391 37,615,795 1,396,217 62,883,731782,692 428,743 117,113 822,789 3,148,750 153,358 6,917,107
– (32,409) (9,402) (253,106) (338,881) (2,940) (636,738)(21,915) (63,446) – (121,809) (194,076) (283,875) (685,121)
2,967 (385) – (3,912) (639,288) 7,515 (803,973)
4,024,057 4,160,825 580,488 3,540,353 39,592,300 1,270,275 67,675,006
4,024,057 4,160,825 580,488 3,540,353 39,592,300 1,270,275 67,675,006822,730 477,965 137,770 710,420 3,441,852 266,248 7,432,356
– (9,237) (267) (362,716) (651,245) (10,713) (1,034,178)– 19,318 – – 7,524 – 26,842– (20,198) – – 21,946 – –
(64,931) (386,623) – (6,757) (249,070) (183,976) (891,357)(4,362) (1,179) – 10,133 794,463 (8,169) 1,038,022
4,777,494 4,240,871 717,991 3,891,433 42,957,770 1,333,665 74,246,691
4,594,080 2,151,978 444,028 3,630,665 19,240,360 598,690 64,007,206
4,277,552 2,108,140 633,845 3,303,006 22,563,593 924,525 66,260,994
3,664,075 2,083,772 555,647 2,785,487 18,818,771 1,114,068 68,454,930

92
NOTES TO THE FINANCIAL STATEMENTS
PSC CORPORATION LTDANNUAL REPORT 2011
4. Property, plant and equipment (cont’d)
Leasehold building
Leasehold improvements Renovations
Company $ $ $CostAt 1 January 2010 8,517,028 9,714,020 6,958,896Additions – – 246,383Disposals – – –Write-offs – – –At 31 December 2010 8,517,028 9,714,020 7,205,279
At 1 January 2011 8,517,028 9,714,020 7,205,279Additions – – 212,888Disposals – – –Write-offs – – (3,000)At 31 December 2011 8,517,028 9,714,020 7,415,167
Accumulated depreciationAt 1 January 2010 4,477,188 2,433,776 2,594,790Depreciation for the year 224,435 267,573 698,985Disposals – – –Write-offs – – –At 31 December 2010 4,701,623 2,701,349 3,293,775
Accumulated depreciationAt 1 January 2011 4,701,623 2,701,349 3,293,775Depreciation for the year 224,435 267,573 727,757Disposals – – –Write-offs – – (1,725)At 31 December 2011 4,926,058 2,968,922 4,019,807
Carrying amountsAt 1 January 2010 4,039,840 7,280,244 4,364,106
At 31 December 2010 3,815,405 7,012,671 3,911,504
At 31 December 2011 3,590,970 6,745,098 3,395,360

93
NOTES TO THE FINANCIAL STATEMENTS
PSC CORPORATION LTDANNUAL REPORT 2011
Furniture, fittings
and office equipment
Warehouse equipment
Motor vehicles
Plant and machinery Computers Total
$ $ $ $ $ $
1,074,542 564,826 2,178,847 338,229 1,283,040 30,629,4288,587 230,193 365,888 143,000 346,966 1,341,017
(15,009) (15,000) (433,892) (33,000) (1,713) (498,614)– – – – (244,907) (244,907)
1,068,120 780,019 2,110,843 448,229 1,383,386 31,226,924
1,068,120 780,019 2,110,843 448,229 1,383,386 31,226,92424,683 30,560 69,845 – 426,997 764,973
– – (258,601) – (1,383) (259,984)(750) – – – (15,416) (19,166)
1,092,053 810,579 1,922,087 448,229 1,793,584 31,712,747
628,591 245,839 930,054 195,710 781,008 12,286,95691,077 92,430 218,202 43,414 94,610 1,730,726(9,474) (9,375) (159,094) (22,018) (1,713) (201,674)
– – – – (244,831) (244,831)710,194 328,894 989,162 217,106 629,074 13,571,177
710,194 328,894 989,162 217,106 629,074 13,571,17793,155 110,739 204,964 41,013 200,235 1,869,871
– – (146,410) – (230) (146,640)(431) – – – (15,414) (17,570)
802,918 439,633 1,047,716 258,119 813,665 15,276,838
445,951 318,987 1,248,793 142,519 502,032 18,342,472
357,926 451,125 1,121,681 231,123 754,312 17,655,747
289,135 370,946 874,371 190,110 979,919 16,435,909
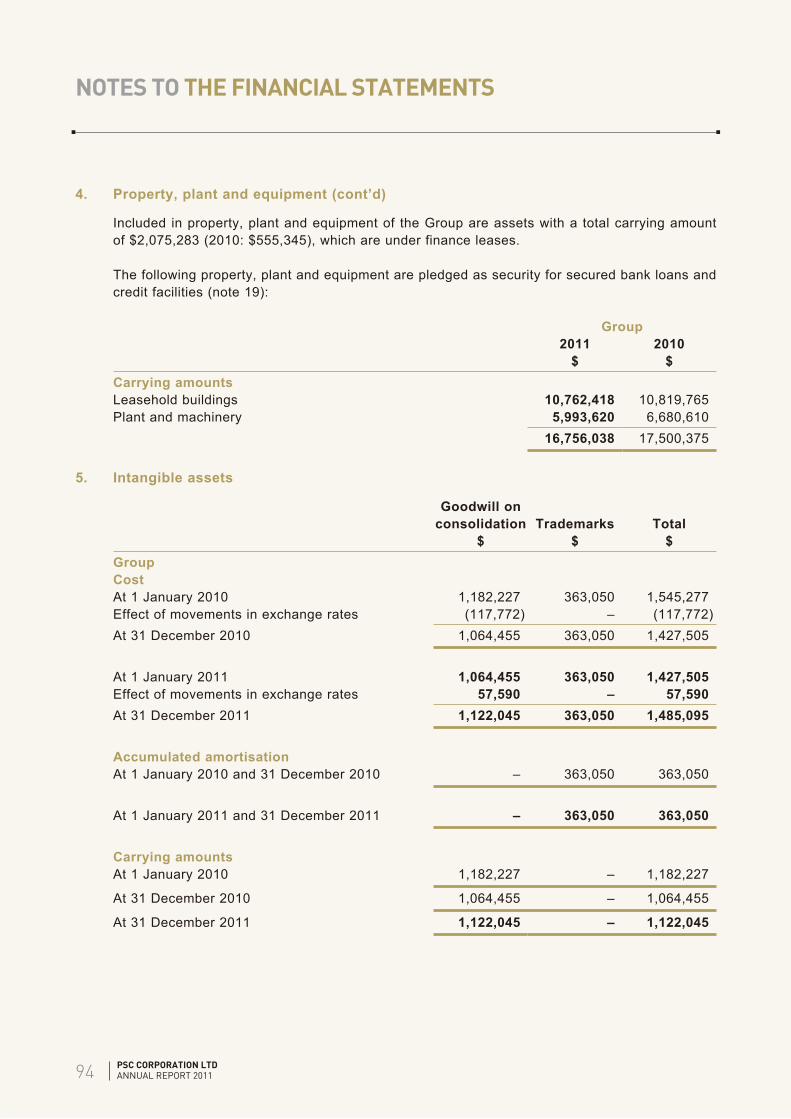
94
NOTES TO THE FINANCIAL STATEMENTS
PSC CORPORATION LTDANNUAL REPORT 2011
4. Property, plant and equipment (cont’d)
Included in property, plant and equipment of the Group are assets with a total carrying amount of $2,075,283 (2010: $555,345), which are under finance leases.
The following property, plant and equipment are pledged as security for secured bank loans and credit facilities (note 19):
Group2011 2010
$ $Carrying amountsLeasehold buildings 10,762,418 10,819,765Plant and machinery 5,993,620 6,680,610
16,756,038 17,500,375
5. Intangible assets
Goodwill on consolidation Trademarks Total
$ $ $GroupCostAt 1 January 2010 1,182,227 363,050 1,545,277Effect of movements in exchange rates (117,772) – (117,772)At 31 December 2010 1,064,455 363,050 1,427,505
At 1 January 2011 1,064,455 363,050 1,427,505Effect of movements in exchange rates 57,590 – 57,590At 31 December 2011 1,122,045 363,050 1,485,095
Accumulated amortisationAt 1 January 2010 and 31 December 2010 – 363,050 363,050
At 1 January 2011 and 31 December 2011 – 363,050 363,050
Carrying amountsAt 1 January 2010 1,182,227 – 1,182,227
At 31 December 2010 1,064,455 – 1,064,455
At 31 December 2011 1,122,045 – 1,122,045
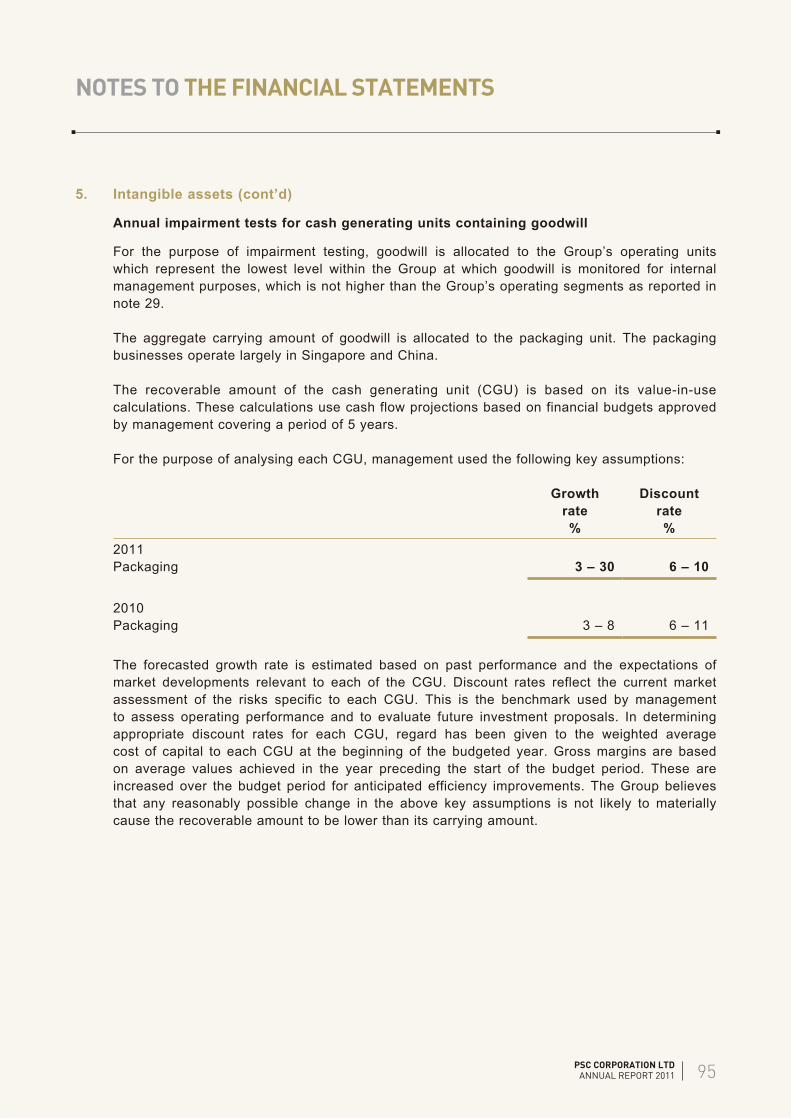
95
NOTES TO THE FINANCIAL STATEMENTS
PSC CORPORATION LTDANNUAL REPORT 2011
5. Intangible assets (cont’d)
Annual impairment tests for cash generating units containing goodwill
For the purpose of impairment testing, goodwill is allocated to the Group’s operating units which represent the lowest level within the Group at which goodwill is monitored for internal management purposes, which is not higher than the Group’s operating segments as reported in note 29.
The aggregate carrying amount of goodwill is allocated to the packaging unit. The packaging businesses operate largely in Singapore and China.
The recoverable amount of the cash generating unit (CGU) is based on its value-in-use calculations. These calculations use cash flow projections based on financial budgets approved by management covering a period of 5 years.
For the purpose of analysing each CGU, management used the following key assumptions:
Growth rate
Discount rate
% %2011Packaging 3 – 30 6 – 10
2010Packaging 3 – 8 6 – 11
The forecasted growth rate is estimated based on past performance and the expectations of market developments relevant to each of the CGU. Discount rates reflect the current market assessment of the risks specific to each CGU. This is the benchmark used by management to assess operating performance and to evaluate future investment proposals. In determining appropriate discount rates for each CGU, regard has been given to the weighted average cost of capital to each CGU at the beginning of the budgeted year. Gross margins are based on average values achieved in the year preceding the start of the budget period. These are increased over the budget period for anticipated efficiency improvements. The Group believes that any reasonably possible change in the above key assumptions is not likely to materially cause the recoverable amount to be lower than its carrying amount.

96
NOTES TO THE FINANCIAL STATEMENTS
PSC CORPORATION LTDANNUAL REPORT 2011
6. Investment properties
GroupNote 2011 2010
$ $CostAt 1 January 1,380,381 1,908,313Effect of movements in exchange rates (27,167) 36,178Transfer to assets held for sale 17 – (564,110)At 31 December 1,353,214 1,380,381
Accumulated depreciationAt 1 January 108,117 79,014Depreciation charge for the year 27,157 27,979Effect of movements in exchange rates (2,224) 1,124At 31 December 133,050 108,117
Carrying amountsAt 1 January 1,272,264 1,829,299
At 31 December 1,220,164 1,272,264
Fair valueAt 31 December 1,639,760 1,843,080
Included in investment properties are a number of resort apartments that are leased to the developer for a guaranteed rental period of 3 years with an option to renew for an additional 3 years.
The fair values of the investment properties are based on valuations performed by independent professional valuers. The fair values are based on market values, being the estimated amount for which a property could be exchanged on the date of the valuation between a willing buyer and a willing seller in an arm’s length transaction after proper marketing wherein the parties had each acted knowledgeably, prudently and without compulsion. The valuations of the investment properties as at 31 December 2011 were based on the comparison and investment methods, where appropriate. In relying on the valuation reports, the directors have exercised their judgement and are satisfied that the valuation methods and estimates used are reflective of the current market conditions.
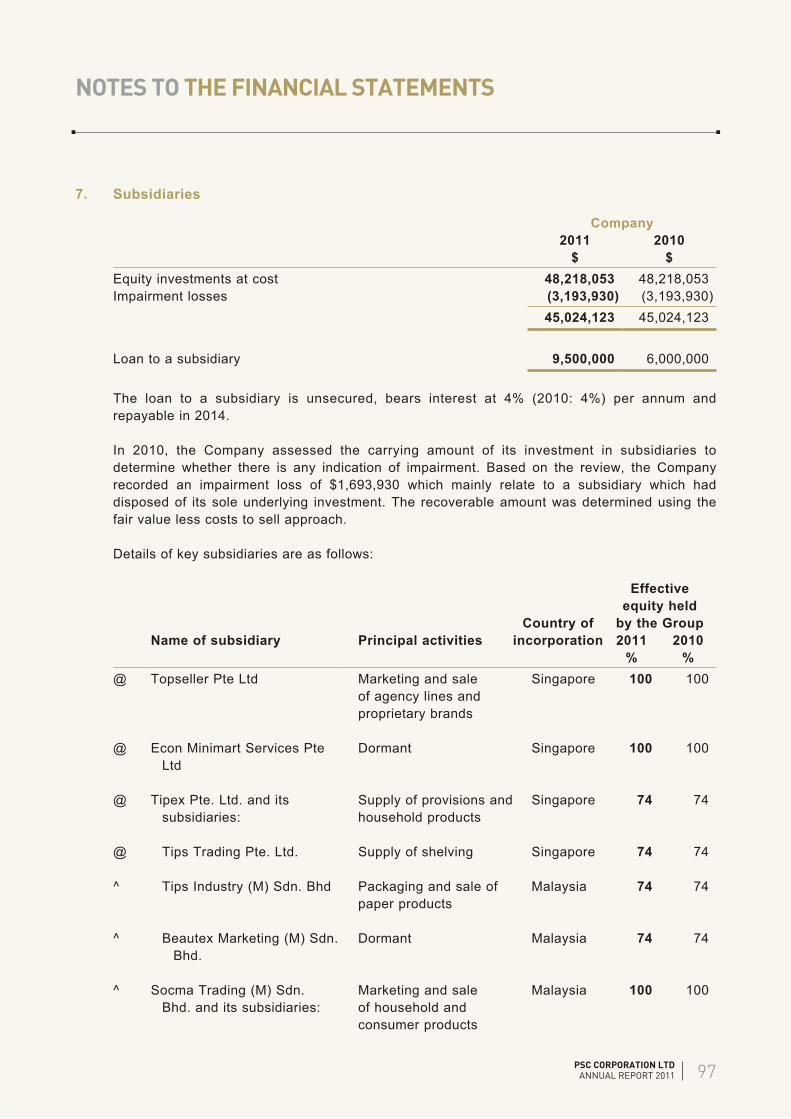
97
NOTES TO THE FINANCIAL STATEMENTS
PSC CORPORATION LTDANNUAL REPORT 2011
7. Subsidiaries
Company2011 2010
$ $Equity investments at cost 48,218,053 48,218,053Impairment losses (3,193,930) (3,193,930)
45,024,123 45,024,123
Loan to a subsidiary 9,500,000 6,000,000
The loan to a subsidiary is unsecured, bears interest at 4% (2010: 4%) per annum and repayable in 2014.
In 2010, the Company assessed the carrying amount of its investment in subsidiaries to determine whether there is any indication of impairment. Based on the review, the Company recorded an impairment loss of $1,693,930 which mainly relate to a subsidiary which had disposed of its sole underlying investment. The recoverable amount was determined using the fair value less costs to sell approach.
Details of key subsidiaries are as follows:
Name of subsidiary Principal activitiesCountry of
incorporation
Effective equity held
by the Group2011 2010
% %@ Topseller Pte Ltd Marketing and sale
of agency lines and proprietary brands
Singapore 100 100
@ Econ Minimart Services Pte Ltd
Dormant Singapore 100 100
@ Tipex Pte. Ltd. and its subsidiaries:
Supply of provisions and household products
Singapore 74 74
@ Tips Trading Pte. Ltd. Supply of shelving Singapore 74 74
^ Tips Industry (M) Sdn. Bhd Packaging and sale of paper products
Malaysia 74 74
^ Beautex Marketing (M) Sdn. Bhd.
Dormant Malaysia 74 74
^ Socma Trading (M) Sdn. Bhd. and its subsidiaries:
Marketing and sale of household and consumer products
Malaysia 100 100

98
NOTES TO THE FINANCIAL STATEMENTS
PSC CORPORATION LTDANNUAL REPORT 2011
7. Subsidiaries (cont’d)
Name of subsidiary Principal activitiesCountry of
incorporation
Effective equity held
by the Group2011 2010
% %^ Econfood Manufacturing (M)
Sdn. Bhd.Dormant Malaysia 100 100
^ Fresh Fruit Juice Manufacturing (M) Sdn. Bhd.
Manufacture of grass jelly products
Malaysia 100 100
@ PSC Investment Pte Ltd and its subsidiaries:
Investment holding Singapore 100 100
∞ PSC (China) Property Co., Limited
Property development, property holdings and property related activities
Hong Kong 100(1) –
∞ Guangzhou PSC Properties Co., Ltd
Property development, property holdings and property related activities
People’s Republic of China
100 100
@ Fortune Food Manufacturing Pte Ltd and its subsidiary:
Manufacture of soya bean products and noodles
Singapore 100 100
@ Fortune Food Marketing Pte Ltd
Sale of soya bean products, yoghurt, noodles, and dry grocery products
Singapore 100 100
@ PSC Resort Pte Ltd and its subsidiary:
Investment holding Singapore 100 100
Ψ Palm Meadow Sdn. Bhd. Property investment Malaysia 100 100
(1) PSC (China) Property Co., Limited is a wholly-owned subsidiary of the Group with 90% of the equity interest held by PSC Investment Pte Ltd and 10% held by Guangzhou PSC Properties Co., Ltd.

99
NOTES TO THE FINANCIAL STATEMENTS
PSC CORPORATION LTDANNUAL REPORT 2011
7. Subsidiaries (cont’d)
Name of subsidiary Principal activitiesCountry of
incorporation
Effective equity held
by the Group2011 2010
% %@ Tat Seng Packaging Group
Ltd and its subsidiaries:Manufacture and sale of corrugated boards, corrugated cartons and other packaging products
Singapore 64 64
^ Tat Seng Packaging (Suzhou) Co., Ltd and its subsidiaries:
Manufacture and sale of corrugated boards, corrugated cartons and other packaging products
People’s Republic of China
64 64
^ Nantong Hengcheng Paper Industry Co., Ltd and its subsidiary:
Manufacture and sale of corrugated boards
People’s Republic of China
44.8 44.8
^ Nantong Tat Seng Packaging Co., Ltd
Manufacture and sale of corrugated boards
People’s Republic of China
44.8 44.8
^ Hefei Dansun Packaging Co., Ltd
Manufacture and sale of corrugated boards, corrugated cartons and other packaging products
People’s Republic of China
60.4 60.4
@ United Packaging Industries Pte. Ltd.
Manufacture and sale of corrugated boards, corrugated cartons and other packaging products
Singapore 64 64
@ Topseller Development Pte Ltd and its subsidiary:
Investment holding Singapore 100 100
^ Flobina Sdn. Bhd. Property investment Malaysia 100 100

100
NOTES TO THE FINANCIAL STATEMENTS
PSC CORPORATION LTDANNUAL REPORT 2011
7. Subsidiaries (cont’d)
Name of subsidiary Principal activitiesCountry of
incorporation
Effective equity held
by the Group2011 2010
% %@ PSC International Pte Ltd and
its subsidiaries:Investment holding Singapore 100 100
@ Health Solutions International Pte. Ltd. and its subsidiaries:
Investment holding Singapore 95 95
@ Health Solutions Holdings Pte. Ltd. and its subsidiaries:
Investment holding Singapore 95 95
^ Halyway Holding Ltd and its subsidiary:
Investment holding Cyprus 95 95
& HS Hellas S.A Dormant Greece 95 95
Ω Health Solutions (Malaysia) Sdn. Bhd. and its subsidiaries:
Construction of hospital turnkey projects and provision of healthcare consultancy and hospital management services
Malaysia 95 95
Ω Health Solutions Services Sdn. Bhd.
Provision of healthcare consultancy and project management
Malaysia 95 95
Ω HS Medeq Consult Sdn. Bhd.
Dormant Malaysia 95 –
* Health Solutions Medical Services (Vietnam) Co., Ltd.
Provision of healthcare consultancy and medical services
Vietnam 95 95
PT Health Solutions Indonesia
Provision of healthcare consultancy services
Indonesia 95 95
@ Education Solutions International Pte. Ltd.
Investment holding Singapore 100 100

101
NOTES TO THE FINANCIAL STATEMENTS
PSC CORPORATION LTDANNUAL REPORT 2011
7. Subsidiaries (cont’d)
Name of subsidiary Principal activitiesCountry of
incorporation
Effective equity held
by the Group2011 2010
% %@ I-Econ Management Services
Pte. Ltd.Franchise ownership Singapore 100 100
@ D & P Lifestyle Pte. Ltd. General wholesale trading (including general importers and exporters) and wholesale on a fee or contract basis
Singapore 100 100
@ Audited by KPMG LLP, Singapore.
^ Audited by other member firms of KPMG International.
Ψ Audited by Goh Joon Hai & Co., Malaysia.
Ω Audited by Moore Stephens AC, Malaysia.
* Audited by Grant Thornton, Vietnam.
Audited by Grant Thornton, Indonesia.
∞ Audited by Deloitte Touche Tohmatsu, Hong Kong.
& Not required to be audited by law of country of incorporation.
8. Associates
Group Company2011 2010 2011 2010
$ $ $ $Investment in associates 53,262,514 49,683,123 26,866,726 27,107,612Impairment losses (5,222,682) (85,691) (6,601,687) (6,123,971)
48,039,832 49,597,432 20,265,039 20,983,641
Investment in associates at 31 December 2011 includes goodwill of $419,290 (2010: $5,425,538).
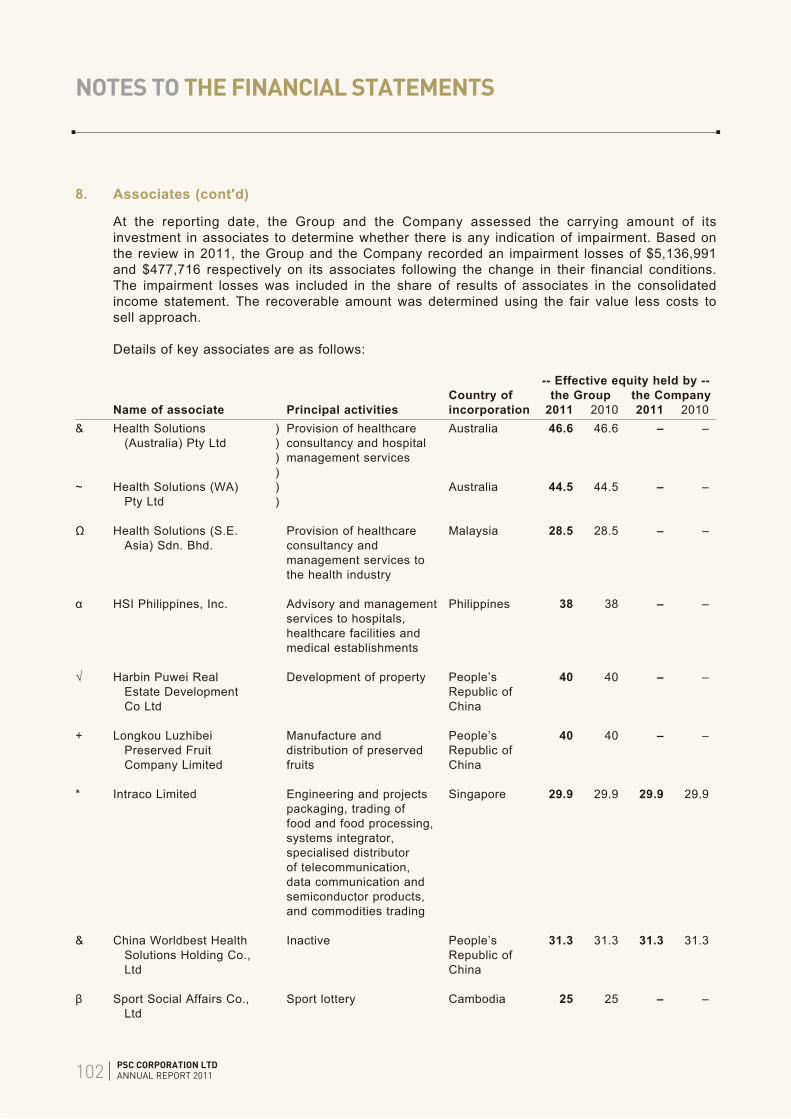
102
NOTES TO THE FINANCIAL STATEMENTS
PSC CORPORATION LTDANNUAL REPORT 2011
8. Associates (cont'd)
At the reporting date, the Group and the Company assessed the carrying amount of its investment in associates to determine whether there is any indication of impairment. Based on the review in 2011, the Group and the Company recorded an impairment losses of $5,136,991 and $477,716 respectively on its associates following the change in their financial conditions. The impairment losses was included in the share of results of associates in the consolidated income statement. The recoverable amount was determined using the fair value less costs to sell approach.
Details of key associates are as follows:
-- Effective equity held by --Country of the Group the Company
Name of associate Principal activities incorporation 2011 2010 2011 2010& Health Solutions
(Australia) Pty Ltd)))
Provision of healthcare consultancy and hospital management services
Australia 46.6 46.6 – –
)~ Health Solutions (WA)
Pty Ltd))
Australia 44.5 44.5 – –
Ω Health Solutions (S.E. Asia) Sdn. Bhd.
Provision of healthcare consultancy and management services to the health industry
Malaysia 28.5 28.5 – –
α HSI Philippines, Inc. Advisory and management services to hospitals, healthcare facilities and medical establishments
Philippines 38 38 – –
√ Harbin Puwei Real Estate Development Co Ltd
Development of property People’s Republic of China
40 40 – –
+ Longkou Luzhibei Preserved Fruit Company Limited
Manufacture and distribution of preserved fruits
People’s Republic of China
40 40 – –
* Intraco Limited Engineering and projects packaging, trading of food and food processing, systems integrator, specialised distributor of telecommunication, data communication and semiconductor products, and commodities trading
Singapore 29.9 29.9 29.9 29.9
& China Worldbest Health Solutions Holding Co., Ltd
Inactive People’s Republic of China
31.3 31.3 31.3 31.3
β Sport Social Affairs Co., Ltd
Sport lottery Cambodia 25 25 – –
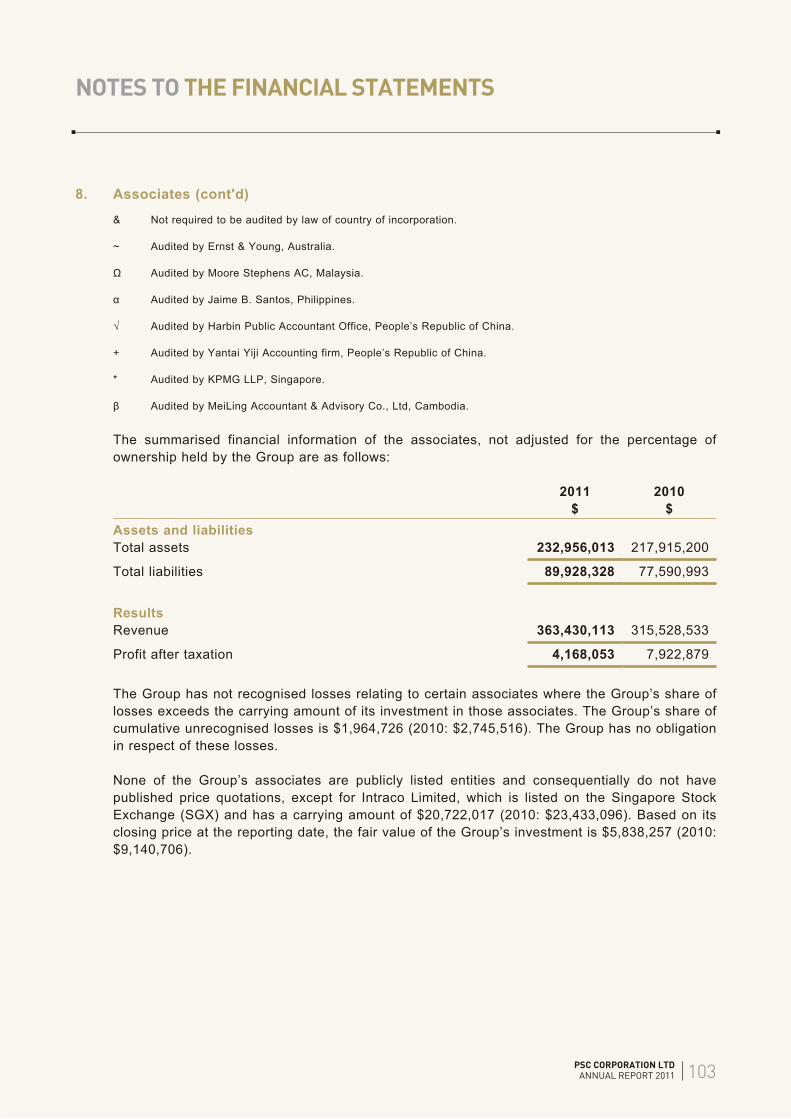
103
NOTES TO THE FINANCIAL STATEMENTS
PSC CORPORATION LTDANNUAL REPORT 2011
8. Associates (cont'd)
& Not required to be audited by law of country of incorporation.
~ Audited by Ernst & Young, Australia.
Ω Audited by Moore Stephens AC, Malaysia.
α Audited by Jaime B. Santos, Philippines.
√ Audited by Harbin Public Accountant Office, People’s Republic of China.
+ Audited by Yantai Yiji Accounting firm, People’s Republic of China.
* Audited by KPMG LLP, Singapore.
β Audited by MeiLing Accountant & Advisory Co., Ltd, Cambodia.
The summarised financial information of the associates, not adjusted for the percentage of ownership held by the Group are as follows:
2011 2010$ $
Assets and liabilitiesTotal assets 232,956,013 217,915,200
Total liabilities 89,928,328 77,590,993
ResultsRevenue 363,430,113 315,528,533
Profit after taxation 4,168,053 7,922,879
The Group has not recognised losses relating to certain associates where the Group’s share of losses exceeds the carrying amount of its investment in those associates. The Group’s share of cumulative unrecognised losses is $1,964,726 (2010: $2,745,516). The Group has no obligation in respect of these losses.
None of the Group’s associates are publicly listed entities and consequentially do not have published price quotations, except for Intraco Limited, which is listed on the Singapore Stock Exchange (SGX) and has a carrying amount of $20,722,017 (2010: $23,433,096). Based on its closing price at the reporting date, the fair value of the Group’s investment is $5,838,257 (2010: $9,140,706).

104
NOTES TO THE FINANCIAL STATEMENTS
PSC CORPORATION LTDANNUAL REPORT 2011
9. Other financial assets
Group Company2011 2010 2011 2010
$ $ $ $Non-current investmentsAvailable-for-sale financial assets 1,239,740 14,097,575 865,340 1,462,158
Current investmentsHeld-to-maturity investments 16,523,391 20,838,240 – 3,615,840Financial assets designated at fair value through profit or loss 4,533,227 – 4,533,227 –
21,056,618 20,838,240 4,533,227 3,615,840
Available-for-sale financial assets relate to investments in equity securities.
Held-to-maturity investments are debt securities that have stated interest rates of 10% (2010: 2% to 6%) per annum and mature within the next three months. The maximum exposure to credit risk of the debt securities at the reporting date is the carrying amount. All debt securities are denominated in Hong Kong dollars.
The financial assets designated at fair value through profit or loss are equity securities that otherwise would have been classified as available-for-sale. The performance of those equity securities designated at fair value through profit or loss upon initial recognition is actively monitored and they are managed on a fair value basis.
As at 31 December 2011, held-to-maturity investments of the Group relate to investments in the debt securities of one (2010: two) investee companies.
As at 31 December 2011, the Group’s and the Company’s available-for-sale financial assets were assessed for impairment. An impairment loss of $520,900 (2010: Nil) was recognised on an investment on the basis of a prolonged decline in the fair value below cost.
The Group’s exposure to credit, currency and interest rate risks and fair value information related to other financial assets is disclosed in note 20.
Sensitivity analysis – equity price risk
The available-for-sale financial assets and financial assets designated at fair value through profit or loss of the Group and the Company relate to investments in quoted equity securities.

105
NOTES TO THE FINANCIAL STATEMENTS
PSC CORPORATION LTDANNUAL REPORT 2011
9. Other financial assets (cont'd)
A 10% increase/(decrease) in the underlying equity prices at the reporting date would increase/(decrease) profit before tax and equity by the amounts shown below. This analysis assumes that all other variables remain constant. The analysis is performed on the same basis for 2010.
Group Company10%
increase10%
decrease10%
increase10%
decrease$ $ $ $
2011Profit before tax 453,323 (573,833) 453,323 (536,393)Equity 123,974 (3,464) 86,534 (3,464)
2010Profit before tax – (206,000) – (142,000)Equity 210,216 (4,216) 146,216 (4,216)
The 2010 analysis for the Group excluded an available-for-sale quoted equity security with a carrying value of $11,995,417 as the market in which the security was traded was not considered active during the year (see note 20).
10. Deferred tax assets and liabilities
Movements in deferred tax assets and liabilities (prior to offsetting of balances) during the year are as follows:
At1 January
2010
Recognisedin profitor loss
Effect of movementsin exchange
rates
At31 December
2010
Recognisedin profitor loss
Effect of movementsin exchange
rates
At31 December
2011Group $ $ $ $ $ $ $
Deferred tax assetsProperty, plant and equipment 67,317 (38,298) – 29,019 (29,019) – –Trade and other receivables – – – – 103,600 – 103,600Tax value of loss carry forward 618,732 (49,111) – 569,621 139,138 14,080 722,839Trade and other payables 405,531 (57,675) – 347,856 260,995 16,166 625,017Other items 159,101 97,415 1,154 257,670 (206,690) (3,261) 47,719
Total 1,250,681 (47,669) 1,154 1,204,166 268,024 26,985 1,499,175
Deferred tax liabilitiesProperty, plant and equipment (3,256,539) 81,935 (6,887) (3,181,491) (80,725) 2,159 (3,260,057)Other financial assets (553,981) (661,896) 6,654 (1,209,223) 223,842 46 (985,335)
Total (3,810,520) (579,961) (233) (4,390,714) 143,117 2,205 (4,245,392)

106
NOTES TO THE FINANCIAL STATEMENTS
PSC CORPORATION LTDANNUAL REPORT 2011
10. Deferred tax assets and liabilities (cont'd)
At 1 Recognised At 31 Recognised At 31January in profit December in profit December
2010 or loss 2010 or loss 2011Company $ $ $ $ $Deferred tax assetsTax value of loss carry forward 596,859 (27,239) 569,620 (163,676) 405,944Other items 46,937 3,698 50,635 (2,320) 48,315Total 643,796 (23,541) 620,255 (165,996) 454,259
Deferred tax liabilitiesProperty, plant and equipment (745,411) 24,819 (720,592) (136,060) (856,652)Other financial assets (163,355) (53,433) (216,788) 157,580 (59,208)Total (908,766) (28,614) (937,380) 21,520 (915,860)
Deferred tax liabilities and assets are offset when there is a legally enforceable right to set off current tax assets against current tax liabilities and when the deferred taxes relate to the same taxation authority. The amounts determined after appropriate offsetting are included in the statements of financial position as follows:
Group Company2011 2010 2011 2010
$ $ $ $Deferred tax liabilities 3,584,814 3,683,395 461,601 317,125Deferred tax assets 838,597 496,847 – –
Unrecognised deferred tax assets
Deferred tax assets have not been recognised in respect of the following items:
Group2011 2010
$ $Tax losses 3,047,052 2,573,187Deductible temporary differences 2,724,379 1,647,339
5,771,431 4,220,526
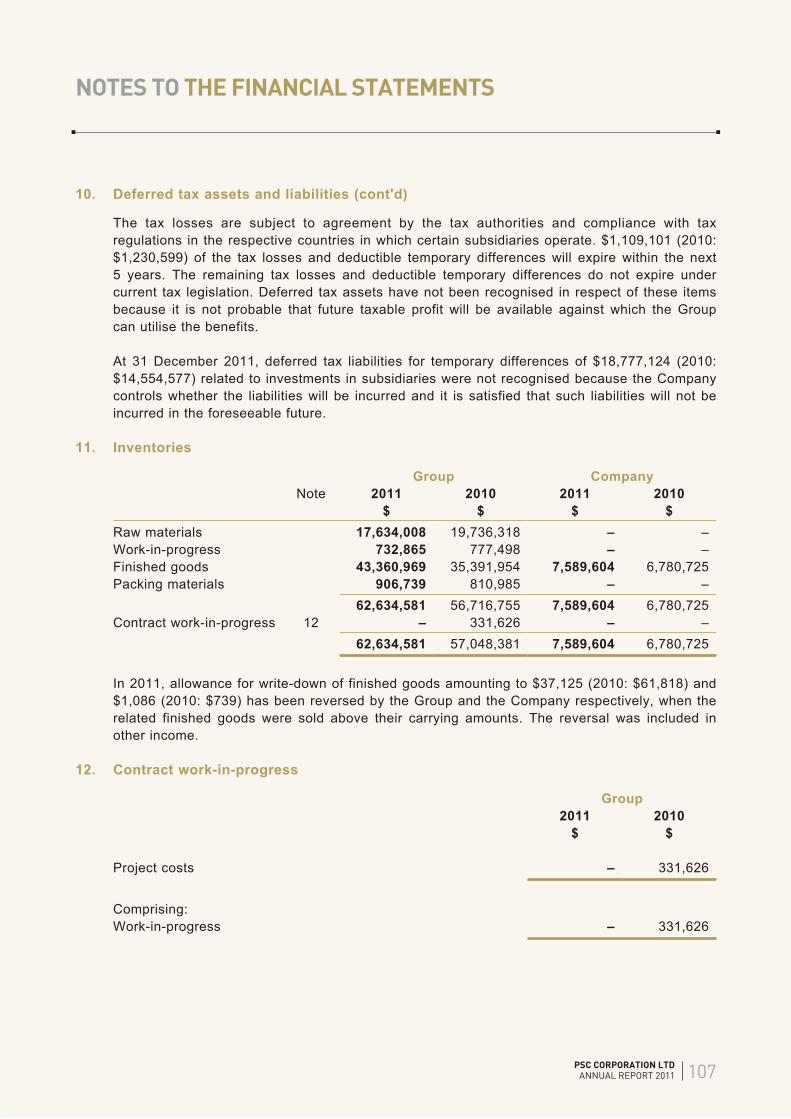
107
NOTES TO THE FINANCIAL STATEMENTS
PSC CORPORATION LTDANNUAL REPORT 2011
10. Deferred tax assets and liabilities (cont'd)
The tax losses are subject to agreement by the tax authorities and compliance with tax regulations in the respective countries in which certain subsidiaries operate. $1,109,101 (2010: $1,230,599) of the tax losses and deductible temporary differences will expire within the next 5 years. The remaining tax losses and deductible temporary differences do not expire under current tax legislation. Deferred tax assets have not been recognised in respect of these items because it is not probable that future taxable profit will be available against which the Group can utilise the benefits.
At 31 December 2011, deferred tax liabilities for temporary differences of $18,777,124 (2010: $14,554,577) related to investments in subsidiaries were not recognised because the Company controls whether the liabilities will be incurred and it is satisfied that such liabilities will not be incurred in the foreseeable future.
11. Inventories
Group CompanyNote 2011 2010 2011 2010
$ $ $ $Raw materials 17,634,008 19,736,318 – –Work-in-progress 732,865 777,498 – –Finished goods 43,360,969 35,391,954 7,589,604 6,780,725Packing materials 906,739 810,985 – –
62,634,581 56,716,755 7,589,604 6,780,725Contract work-in-progress 12 – 331,626 – –
62,634,581 57,048,381 7,589,604 6,780,725
In 2011, allowance for write-down of finished goods amounting to $37,125 (2010: $61,818) and $1,086 (2010: $739) has been reversed by the Group and the Company respectively, when the related finished goods were sold above their carrying amounts. The reversal was included in other income.
12. Contract work-in-progress
Group2011 2010
$ $
Project costs – 331,626
Comprising:Work-in-progress – 331,626

108
NOTES TO THE FINANCIAL STATEMENTS
PSC CORPORATION LTDANNUAL REPORT 2011
13. Trade and other receivables
Group CompanyNote 2011 2010 2011 2010
$ $ $ $Trade receivables 120,469,932 101,561,355 6,511,973 5,992,175Impairment losses (5,861,868) (4,572,655) (517,283) (517,283)Net trade receivables 114,608,064 96,988,700 5,994,690 5,474,892Deposits 832,238 897,972 160,191 152,902Non-trade receivables 45,292,716 55,326,119 313,672 11,891,251Tax recoverable 622,882 543,580 481,736 481,736Interest receivable 1,362,837 213,769 1,433 39,989Amounts due from:– subsidiaries 14 – – 105,943,950 101,501,873– associates 15 10,068,739 9,049,924 – 11,174Loans and receivables 172,787,476 163,020,064 112,895,672 119,553,817Advance to suppliers 2,991,743 10,815,279 – –Prepayments 975,239 747,094 144,876 38,334
176,754,458 174,582,437 113,040,548 119,592,151
Included in non-trade receivables of the Group as at 31 December 2011 was an amount recoverable of $43,224,107 relating to proceeds receivable from the sale of property interests. This receivable constitute approximately 24% of the Group’s trade and other receivables as at 31 December 2011 and is due from one party. This receivable was settled subsequent to the reporting date.
Included in the non-trade receivables of the Group and the Company as at 31 December 2010 were amounts receivable of $53,284,033 and $11,442,960 respectively, relating to proceeds receivable under repurchase transactions whereby the Group entered into purchases of investments and agreements to sell them at a certain date in the future at a fixed price. These receivables constitute approximately 30% and 10% of the Group’s and Company’s trade and other receivables respectively as at 31 December 2010, and are due from three parties and one party respectively. These receivables were settled subsequent to the year end.
The Group’s and the Company’s exposure to credit and currency risks, and impairment losses related to trade and other receivables is disclosed in note 20.
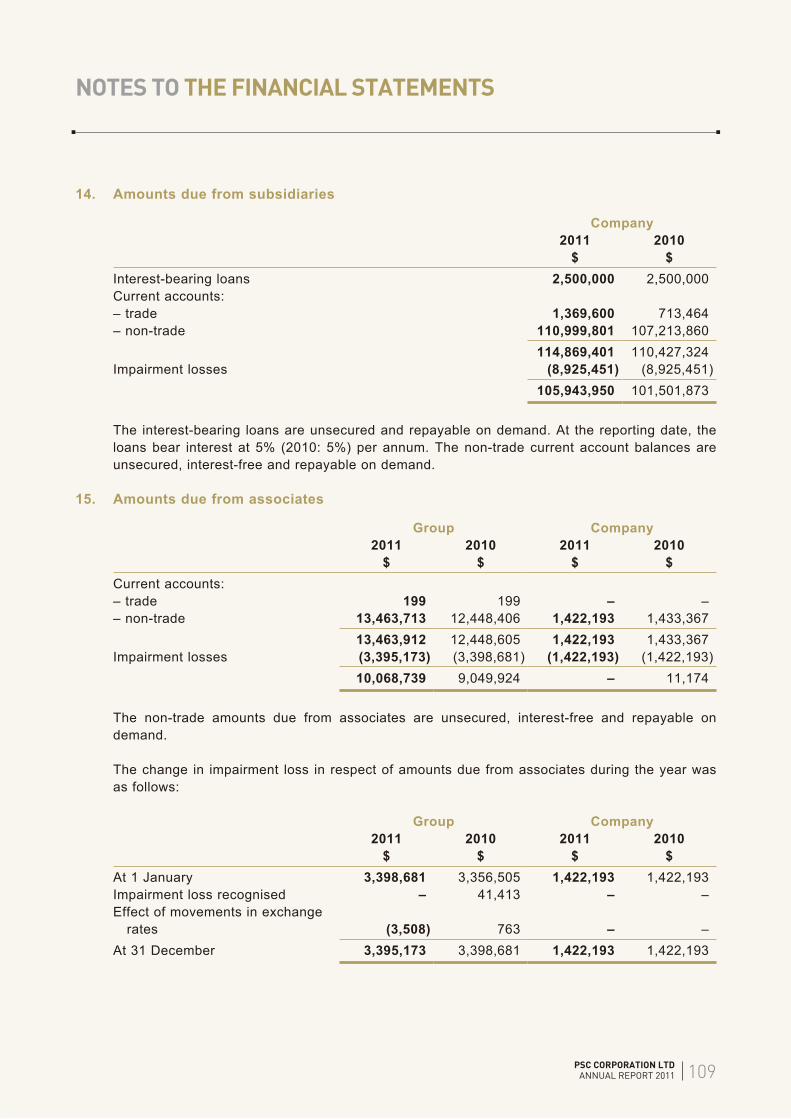
109
NOTES TO THE FINANCIAL STATEMENTS
PSC CORPORATION LTDANNUAL REPORT 2011
14. Amounts due from subsidiaries
Company2011 2010
$ $Interest-bearing loans 2,500,000 2,500,000Current accounts:– trade 1,369,600 713,464– non-trade 110,999,801 107,213,860
114,869,401 110,427,324Impairment losses (8,925,451) (8,925,451)
105,943,950 101,501,873
The interest-bearing loans are unsecured and repayable on demand. At the reporting date, the loans bear interest at 5% (2010: 5%) per annum. The non-trade current account balances are unsecured, interest-free and repayable on demand.
15. Amounts due from associates
Group Company2011 2010 2011 2010
$ $ $ $Current accounts:– trade 199 199 – –– non-trade 13,463,713 12,448,406 1,422,193 1,433,367
13,463,912 12,448,605 1,422,193 1,433,367Impairment losses (3,395,173) (3,398,681) (1,422,193) (1,422,193)
10,068,739 9,049,924 – 11,174
The non-trade amounts due from associates are unsecured, interest-free and repayable on demand.
The change in impairment loss in respect of amounts due from associates during the year was as follows:
Group Company2011 2010 2011 2010
$ $ $ $At 1 January 3,398,681 3,356,505 1,422,193 1,422,193Impairment loss recognised – 41,413 – –Effect of movements in exchange rates (3,508) 763 – –At 31 December 3,395,173 3,398,681 1,422,193 1,422,193

110
NOTES TO THE FINANCIAL STATEMENTS
PSC CORPORATION LTDANNUAL REPORT 2011
16. Cash and cash equivalents
Group CompanyNote 2011 2010 2011 2010
$ $ $ $Cash at bank and in hand 25,019,099 24,308,742 1,201,253 1,296,555Fixed deposits with banks 31,903,942 22,913,235 16,137,845 10,758,382Cash and cash equivalents 56,923,041 47,221,977 17,339,098 12,054,937Bank overdrafts 19 (2,469,250) (2,216,636) – –Deposits pledged (5,081,630) (6,246,498) – –Cash and cash equivalents in the cash flow statement 49,372,161 38,758,843 17,339,098 12,054,937
Bank deposits pledged represents amounts pledged as security by certain subsidiaries to obtain credit facilities (note 19).
The Group’s and the Company’s exposure to interest rate risk and a sensitivity analysis for financial assets and liabilities are disclosed in note 20.
17. Assets held for sale
In 2011, the Group has disposed certain investment properties for a consideration of $832,466.
18. Capital and reserves
Share capital
2011 2010No. of shares
No. of shares
Group and CompanyOn issue at 1 January 568,156,746 561,226,746Exercise of share options – 6,930,000On issue at 31 December 568,156,746 568,156,746
At 31 December 2011, the Company held 12,115,000 (2010: 12,115,000) of its own uncancelled shares.
The total number of issued shares excluding treasury shares as at the end of the year ended 31 December 2011 was 556,041,746 (2010: 556,041,746).
In 2010, 6,930,000 shares were issued as a result of the exercise of vested options arising from the PSC Executives’ Share Options Scheme granted to key management personnel, senior employees and non-executive directors.
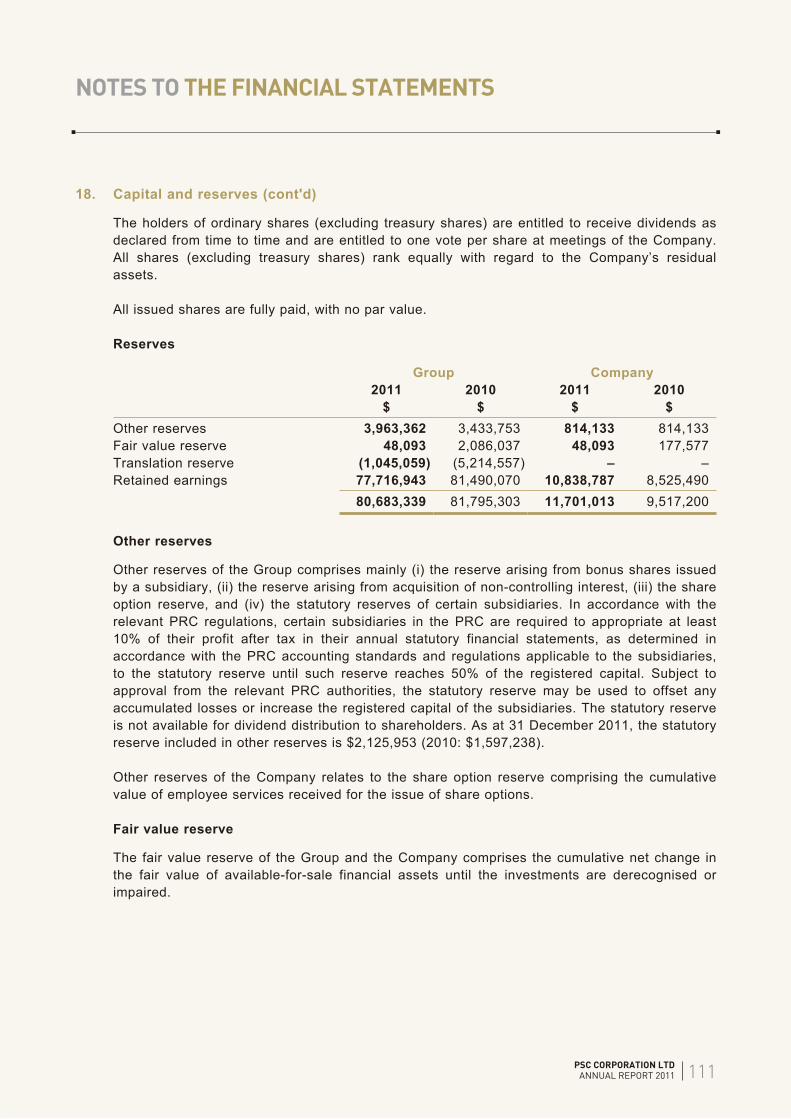
111
NOTES TO THE FINANCIAL STATEMENTS
PSC CORPORATION LTDANNUAL REPORT 2011
18. Capital and reserves (cont'd)
The holders of ordinary shares (excluding treasury shares) are entitled to receive dividends as declared from time to time and are entitled to one vote per share at meetings of the Company. All shares (excluding treasury shares) rank equally with regard to the Company’s residual assets.
All issued shares are fully paid, with no par value.
Reserves
Group Company2011 2010 2011 2010
$ $ $ $Other reserves 3,963,362 3,433,753 814,133 814,133Fair value reserve 48,093 2,086,037 48,093 177,577Translation reserve (1,045,059) (5,214,557) – –Retained earnings 77,716,943 81,490,070 10,838,787 8,525,490
80,683,339 81,795,303 11,701,013 9,517,200
Other reserves
Other reserves of the Group comprises mainly (i) the reserve arising from bonus shares issued by a subsidiary, (ii) the reserve arising from acquisition of non-controlling interest, (iii) the share option reserve, and (iv) the statutory reserves of certain subsidiaries. In accordance with the relevant PRC regulations, certain subsidiaries in the PRC are required to appropriate at least 10% of their profit after tax in their annual statutory financial statements, as determined in accordance with the PRC accounting standards and regulations applicable to the subsidiaries, to the statutory reserve until such reserve reaches 50% of the registered capital. Subject to approval from the relevant PRC authorities, the statutory reserve may be used to offset any accumulated losses or increase the registered capital of the subsidiaries. The statutory reserve is not available for dividend distribution to shareholders. As at 31 December 2011, the statutory reserve included in other reserves is $2,125,953 (2010: $1,597,238).
Other reserves of the Company relates to the share option reserve comprising the cumulative value of employee services received for the issue of share options.
Fair value reserve
The fair value reserve of the Group and the Company comprises the cumulative net change in the fair value of available-for-sale financial assets until the investments are derecognised or impaired.
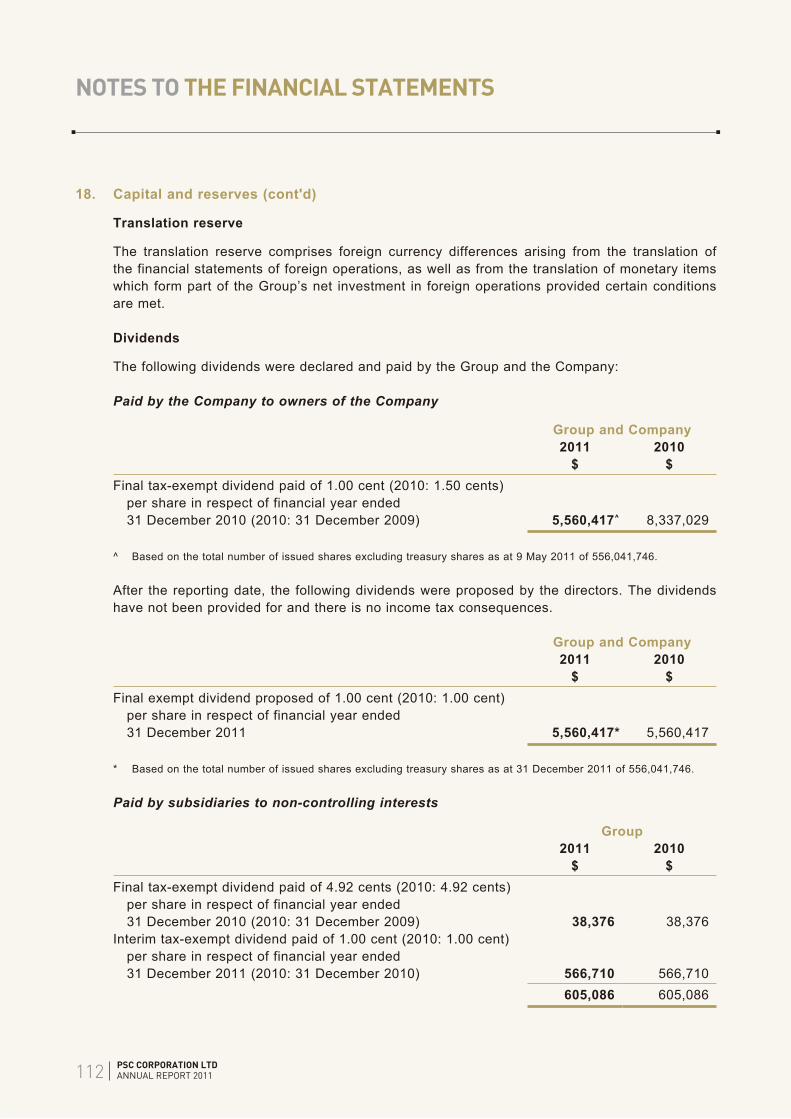
112
NOTES TO THE FINANCIAL STATEMENTS
PSC CORPORATION LTDANNUAL REPORT 2011
18. Capital and reserves (cont'd)
Translation reserve
The translation reserve comprises foreign currency differences arising from the translation of the financial statements of foreign operations, as well as from the translation of monetary items which form part of the Group’s net investment in foreign operations provided certain conditions are met.
Dividends
The following dividends were declared and paid by the Group and the Company:
Paid by the Company to owners of the Company
Group and Company2011 2010
$ $Final tax-exempt dividend paid of 1.00 cent (2010: 1.50 cents) per share in respect of financial year ended 31 December 2010 (2010: 31 December 2009) 5,560,417^ 8,337,029
^ Based on the total number of issued shares excluding treasury shares as at 9 May 2011 of 556,041,746.
After the reporting date, the following dividends were proposed by the directors. The dividends have not been provided for and there is no income tax consequences.
Group and Company2011 2010
$ $Final exempt dividend proposed of 1.00 cent (2010: 1.00 cent) per share in respect of financial year ended 31 December 2011 5,560,417* 5,560,417
* Based on the total number of issued shares excluding treasury shares as at 31 December 2011 of 556,041,746.
Paid by subsidiaries to non-controlling interests
Group2011 2010
$ $Final tax-exempt dividend paid of 4.92 cents (2010: 4.92 cents) per share in respect of financial year ended 31 December 2010 (2010: 31 December 2009) 38,376 38,376Interim tax-exempt dividend paid of 1.00 cent (2010: 1.00 cent) per share in respect of financial year ended 31 December 2011 (2010: 31 December 2010) 566,710 566,710
605,086 605,086

113
NOTES TO THE FINANCIAL STATEMENTS
PSC CORPORATION LTDANNUAL REPORT 2011
19. Loans and borrowings
This note provides information about the contractual terms of the Group’s interest-bearing loans and borrowings, which are measured at amortised cost. For more information about the Group’s exposure to interest rate, foreign currency and liquidity risk, see note 20.
Group2011 2010
$ $Non-current liabilitiesFinance lease liabilities 808,066 –
Current liabilitiesBank overdrafts 2,469,250 2,216,636Secured bank loans 4,116,582 3,708,693Unsecured bank loans 8,233,163 6,202,063Bankers’ acceptance – 597,983Bills payable 12,872,300 26,658,707Finance lease liabilities 591,906 91,516
28,283,201 39,475,598
Total loans and borrowings 29,091,267 39,475,598
Terms and debt repayment schedule
Terms and conditions of outstanding loans and borrowings are as follows:
CurrencyNominal
interest rateYear of maturity
Carrying amount2011 2010
% $ $GroupBankers’ acceptance RM 3.57 – 3.58 2011 – 597,983Bank loans:– variable rate loans RMB 5.90 – 7.87 2012 10,085,626 5,855,829
USD 3.60 2011 – 346,234– fixed rate loans RMB 5.81 – 7.22 2012 2,264,119 3,708,693Bank overdrafts RM/SGD 5.50 – 7.10 2012 2,469,250 2,216,636Bills payable RMB – 2012 12,763,171 26,459,185
SGD – 2012 109,129 199,522Finance lease liabilities RMB 7.85 2014 1,399,972 91,516Total loans and borrowings 29,091,267 39,475,598
(i) The bank overdrafts of the Group are secured on bank deposits of $2,750,000 (2010: $2,750,000) (note 16).
(ii) The secured bank loans comprise term loans amounting to $2,264,119 (2010: $3,708,693), secured on certain leasehold buildings held by a subsidiary with carrying amounts of $10,762,418 (2010: $10,819,765), which form part of the securities in (iii) below.
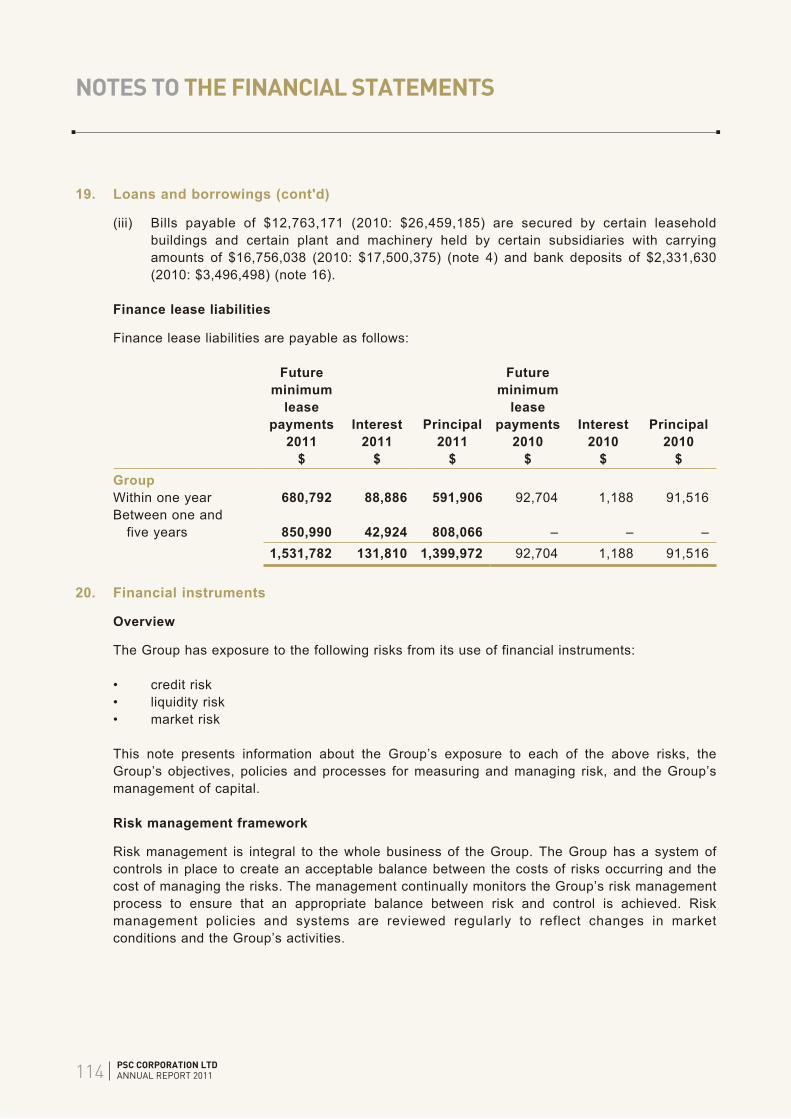
114
NOTES TO THE FINANCIAL STATEMENTS
PSC CORPORATION LTDANNUAL REPORT 2011
19. Loans and borrowings (cont'd)
(iii) Bills payable of $12,763,171 (2010: $26,459,185) are secured by certain leasehold buildings and certain plant and machinery held by certain subsidiaries with carrying amounts of $16,756,038 (2010: $17,500,375) (note 4) and bank deposits of $2,331,630 (2010: $3,496,498) (note 16).
Finance lease liabilities
Finance lease liabilities are payable as follows:
Future minimum
lease payments Interest Principal
Future minimum
lease payments Interest Principal
2011 2011 2011 2010 2010 2010$ $ $ $ $ $
GroupWithin one year 680,792 88,886 591,906 92,704 1,188 91,516Between one and five years 850,990 42,924 808,066 – – –
1,531,782 131,810 1,399,972 92,704 1,188 91,516
20. Financial instruments
Overview
The Group has exposure to the following risks from its use of financial instruments:
• credit risk• liquidity risk• market risk
This note presents information about the Group’s exposure to each of the above risks, the Group’s objectives, policies and processes for measuring and managing risk, and the Group’s management of capital.
Risk management framework
Risk management is integral to the whole business of the Group. The Group has a system of controls in place to create an acceptable balance between the costs of risks occurring and the cost of managing the risks. The management continually monitors the Group’s risk management process to ensure that an appropriate balance between risk and control is achieved. Risk management policies and systems are reviewed regularly to reflect changes in market conditions and the Group’s activities.

115
NOTES TO THE FINANCIAL STATEMENTS
PSC CORPORATION LTDANNUAL REPORT 2011
20. Financial instruments (cont'd)
The Group has an investment policy which sets out the types of strategic investments and investments in financial assets that may be undertaken and relevant evaluation criteria. Excess funds generated from operations, diversification of investments, proceeds from private placement of shares or rights issue may be invested in financial assets pending identification and evaluation of long term investments. Approvals are required from executive management or the Board of Directors depending on the size of each investment.
Credit risk
Credit risk is the risk of financial loss to the Group if a customer or counterparty to a financial instrument fails to meet its contractual obligations, and arises principally from the Group’s receivables from customers and investment securities.
The carrying amount of financial assets in the statement of financial position represents the Group and the Company’s respective maximum exposure to credit risk, before taking into account any collateral held. The Group and the Company does not hold any collateral in respect of its financial assets.
Risk management policy
The Group has a credit policy in place which establishes credit limits for customers and monitors their balances on an ongoing basis. Credit evaluations are performed on all customers requiring credit over a certain amount.
The Group establishes an allowance for impairment that represents its estimate of incurred losses in respect of trade and other receivables and investments. The main components of this allowance are a specific loss component that relates to individually significant exposures.
At the reporting date, credit risk is concentrated mainly in cash and fixed deposits with banks, held-to-maturity investments and trade and other receivables. Cash and fixed deposits are placed with banks which are regulated.
As described above, the Group may undertake investments in financial assets in accordance with its investment policy. The concentration of credit risk of the Group’s and the Company’s held-to-maturity investments and non-trade receivables are described in notes 9 and 13 respectively. The Group manages its credit risk on its held-to-maturity investments and non-trade receivables by obtaining sufficient financial guarantee from credit worthy counterparties or collateral where appropriate, as means of mitigating the risk of financial loss from defaults.
Except for the intra-group financial guarantees given by the Company as set out herein, the Group and the Company does not provide guarantees that would expose the Group or the Company to credit risk. The maximum exposure of the Company in respect of the intra-group financial guarantees at the end of the reporting period if the facility is drawn down by the subsidiary is in the amount of $4,664,610 (2010: $5,618,950).
Credit risk relating to trade receivables is limited due to the Group’s many varied customers. These customers are internationally dispersed, are engaged in a wide spectrum of activities, and sell in a variety of end markets.

116
NOTES TO THE FINANCIAL STATEMENTS
PSC CORPORATION LTDANNUAL REPORT 2011
20. Financial instruments (cont'd)
Exposure to credit risk
The maximum exposure to credit risk for trade receivables (including trade amounts due from subsidiaries and associates) at the reporting date (by type of customer) was:
Group Company2011 2010 2011 2010
$ $ $ $Consumer business 44,371,040 41,123,175 6,897,983 5,722,049Health solutions 2,034,445 5,307,922 – –Packaging 68,202,778 50,557,802 – –
114,608,263 96,988,899 6,897,983 5,722,049
Impairment losses
The ageing of trade receivables (including trade amounts due from subsidiaries and associates) at reporting date was as follows:
Gross Impairment Gross Impairment2011 2011 2010 2010
$ $ $ $GroupNot past due 94,249,503 58,436 77,934,059 207,936Past due 0 – 90 days 17,347,589 201,311 15,942,097 265,081Past due 91 – 180 days 1,172,167 98,063 832,354 225,929Past due 181 – 365 days 523,244 359,410 268,030 226,617More than one year 7,177,628 5,144,648 6,585,014 3,647,092
120,470,131 5,861,868 101,561,554 4,572,655
CompanyNot past due 6,836,811 466,307 5,996,755 506,249Past due 0 – 90 days 580,844 53,365 245,769 14,226Past due 91 – 180 days 803 803 – –Past due 181 – 365 days – – – –More than one year 463,115 463,115 463,115 463,115
7,881,573 983,590 6,705,639 983,590

117
NOTES TO THE FINANCIAL STATEMENTS
PSC CORPORATION LTDANNUAL REPORT 2011
20. Financial instruments (cont'd)
The movement in the allowance for impairment in respect of trade receivables (including trade amounts due from subsidiaries and associates) during the year was as follows:
Group Company2011 2010 2011 2010
$ $ $ $At 1 January 4,572,655 3,640,131 983,590 978,299Impairment loss recognised 1,289,213 932,524 – 5,291At 31 December 5,861,868 4,572,655 983,590 983,590
The allowance account in respect of trade receivables is used to record impairment losses unless the Group is satisfied that no recovery of amount owing is possible, at which point the amounts are considered irrecoverable and are written off against financial assets directly. At 31 December 2011, the Group and the Company do not have any collective impairments on their trade receivables. The analysis is performed on the same basis for 2010.
Certain trade receivables of the Group and the Company are collaterised on the items below. Claims against such collateral are limited to the outstanding obligations.
Group Company2011 2010 2011 2010
$ $ $ $Bankers’ Guarantee 1,901,805 1,633,700 650,000 700,000Fixed deposits 2,635,000 2,755,000 2,635,000 2,755,000
4,536,805 4,388,700 3,285,000 3,455,000
Liquidity risk
Risk management policy
Liquidity risk is the risk that the Group will encounter difficulty in meeting the obligations associated with its financial liabilities that are settled by delivering cash or another financial asset.
The Group monitors its liquidity risk by regularly monitoring current and expected liquidity requirements and ensuring sufficient liquid cash and readily realisable marketable securities and adequate lines of funding from major financial institutions to meet the Group’s liquidity requirements in the short and long term.

118
NOTES TO THE FINANCIAL STATEMENTS
PSC CORPORATION LTDANNUAL REPORT 2011
20. Financial instruments (cont'd)
The following are contractual maturities of financial liabilities, including estimated interest payments and excluding the impact of netting agreements:
Carrying amount
Contractual cash flows
Within 1 year
Within 1 to 5 years
$ $ $ $Group2011Non-derivative financial liabilitiesBank overdrafts 2,469,250 (2,618,167) (2,618,167) –Variable rate loans 10,085,626 (10,538,906) (10,538,906) –Fixed rate loans 2,264,119 (2,318,088) (2,318,088) –Bills payable 12,872,300 (12,872,300) (12,872,300) –Finance lease liabilities 1,399,972 (1,531,782) (680,792) (850,990)Trade and other payables 90,184,688 (90,184,688) (90,184,688) –
119,275,955 (120,063,931) (119,212,941) (850,990)
2010Non-derivative financial liabilitiesBank overdrafts 2,216,636 (2,367,367) (2,367,367) –Variable rate loans 6,202,063 (6,318,285) (6,318,285) –Fixed rate loans 3,708,693 (3,804,701) (3,804,701) –Bankers’ acceptance 597,983 (597,983) (597,983) –Finance lease liabilities 91,516 (92,704) (92,704) –Bills payable 26,658,707 (26,658,707) (26,658,707) –Trade and other payables 75,874,304 (75,874,304) (75,874,304) –
115,349,902 (115,714,051) (115,714,051) –

119
NOTES TO THE FINANCIAL STATEMENTS
PSC CORPORATION LTDANNUAL REPORT 2011
20. Financial instruments (cont'd)
Carrying amount
Contractual cash flows
Within 1 year
$ $ $Company2011Trade and other payables 21,268,692 (21,268,692) (21,268,692)Recognised financial liabilities 21,268,692 (21,268,692) (21,268,692)Intra-group financial guarantee – (4,664,610) (4,664,610)
21,268,692 (25,933,302) (25,933,302)
2010Trade and other payables 22,173,415 (22,173,415) (22,173,415)Recognised financial liabilities 22,173,415 (22,173,415) (22,173,415)Intra-group financial guarantee – (5,618,950) (5,618,950)
22,173,415 (27,792,365) (27,792,365)
Except for cash flow arising from the intra-group financial guarantee, it is not expected that the cash flows included in the maturity analysis could occur significantly earlier, or at significantly different amounts.
At the reporting date, the Company does not consider it probable that a claim will be made against the Company under the intra-group financial guarantee.
Market risk
Market risk is the risk that changes in market prices, such as interest rates, foreign exchange rates and equity prices will affect the Group’s income or the value of its holdings of financial instruments. The objective of market risk management is to manage and control market risk exposures within acceptable parameters, while optimising the return on risk. Market risk is managed through established investment policies and guidelines. These policies and guidelines are reviewed regularly taking into consideration changes in the overall market environment.
Currency risk
Risk management policy
The Group is exposed to currency risk on sales, purchases and borrowings that are denominated in a currency other than the respective functional currencies of Group entities. The currencies in which these transactions primarily are denominated are the Malaysian Ringgit (MYR), Hong Kong dollar (HKD) and Singapore dollar (SGD). The Group does not have a policy to hedge its currency exposure but aims to minimise its exposure at any one time.
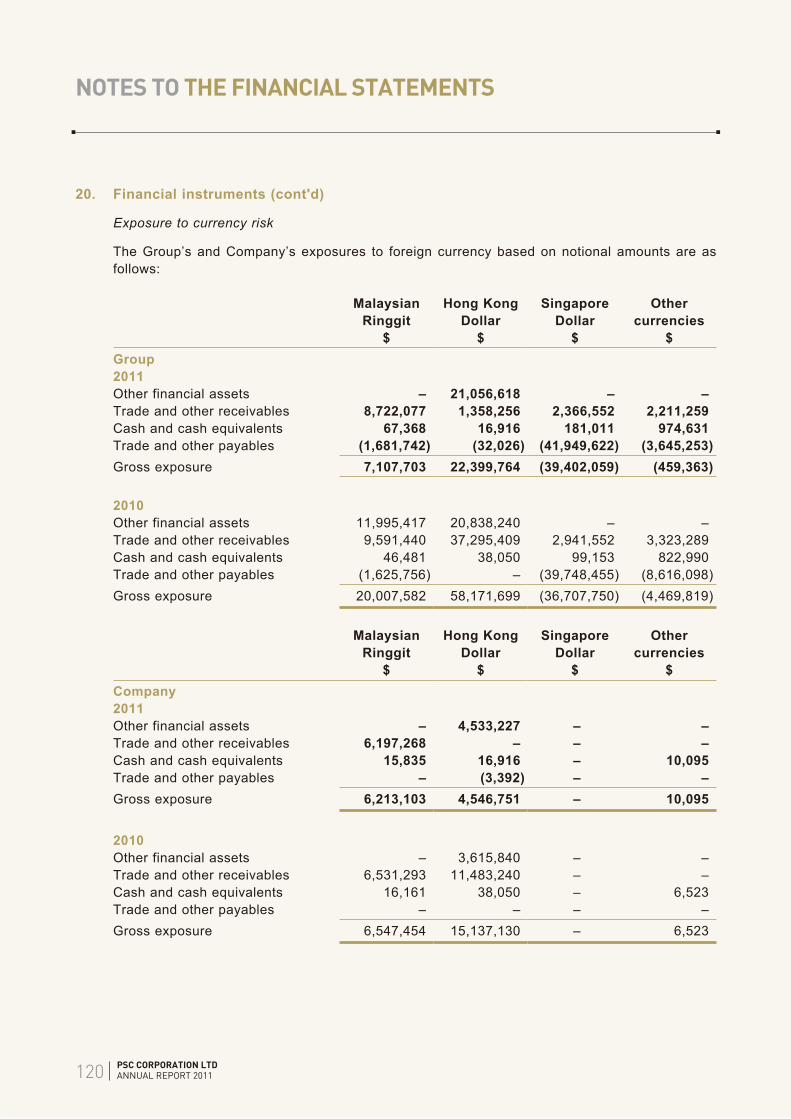
120
NOTES TO THE FINANCIAL STATEMENTS
PSC CORPORATION LTDANNUAL REPORT 2011
20. Financial instruments (cont'd)
Exposure to currency risk
The Group’s and Company’s exposures to foreign currency based on notional amounts are as follows:
Malaysian Ringgit
Hong Kong Dollar
Singapore Dollar
Other currencies
$ $ $ $Group2011Other financial assets – 21,056,618 – –Trade and other receivables 8,722,077 1,358,256 2,366,552 2,211,259Cash and cash equivalents 67,368 16,916 181,011 974,631Trade and other payables (1,681,742) (32,026) (41,949,622) (3,645,253)Gross exposure 7,107,703 22,399,764 (39,402,059) (459,363)
2010Other financial assets 11,995,417 20,838,240 – –Trade and other receivables 9,591,440 37,295,409 2,941,552 3,323,289Cash and cash equivalents 46,481 38,050 99,153 822,990Trade and other payables (1,625,756) – (39,748,455) (8,616,098)Gross exposure 20,007,582 58,171,699 (36,707,750) (4,469,819)
Malaysian Ringgit
Hong Kong Dollar
Singapore Dollar
Other currencies
$ $ $ $Company2011Other financial assets – 4,533,227 – –Trade and other receivables 6,197,268 – – –Cash and cash equivalents 15,835 16,916 – 10,095Trade and other payables – (3,392) – –Gross exposure 6,213,103 4,546,751 – 10,095
2010Other financial assets – 3,615,840 – –Trade and other receivables 6,531,293 11,483,240 – –Cash and cash equivalents 16,161 38,050 – 6,523Trade and other payables – – – –Gross exposure 6,547,454 15,137,130 – 6,523

121
NOTES TO THE FINANCIAL STATEMENTS
PSC CORPORATION LTDANNUAL REPORT 2011
20. Financial instruments (cont'd)
Sensitivity analysis
A weakening of 10% in the following major currencies against the functional currency of each of the Group entities at 31 December would have increased/(decreased) equity and profit or loss (before any tax effects) by the amounts shown below. This analysis is based on foreign currency exchange rate variances that the Group considered to be reasonably possible at the end of the reporting period. The analysis assumes that all other variables, in particular interest rates, remain constant.
Group Company
EquityProfit
or loss EquityProfit
or loss$ $ $ $
2011Malaysian Ringgit – (710,770) – (621,310)Hong Kong Dollar – (2,239,976) – (454,675)Singapore Dollar – 3,940,206 – –Other currencies – 45,936 – (1,010)
2010Malaysian Ringgit (1,199,542) (801,216) – (654,745)Hong Kong Dollar – (5,817,170) – (1,513,713)Singapore Dollar – 3,670,775 – –Other currencies – 446,982 – (652)
A strengthening of the above currencies against the functional currency of each of the Group entities at 31 December would have had the equal but opposite effect to the amounts shown above, on the basis that all other variables remain constant.
Interest rate risk
Risk management policy
Interest rate risk is the risk that the fair value or future cash flows of the Group’s financial instruments will fluctuate because of changes in market interest rates. The Group’s exposure to interest rate risks arise primarily from their loans and borrowings. The Group’s policy is to maintain the bank borrowings to the minimum, and to obtain the most favourable interest rates available without increasing its foreign exchange exposure.
Surplus funds in the Group are placed in deposits with banks and are subject to interest rate risk.
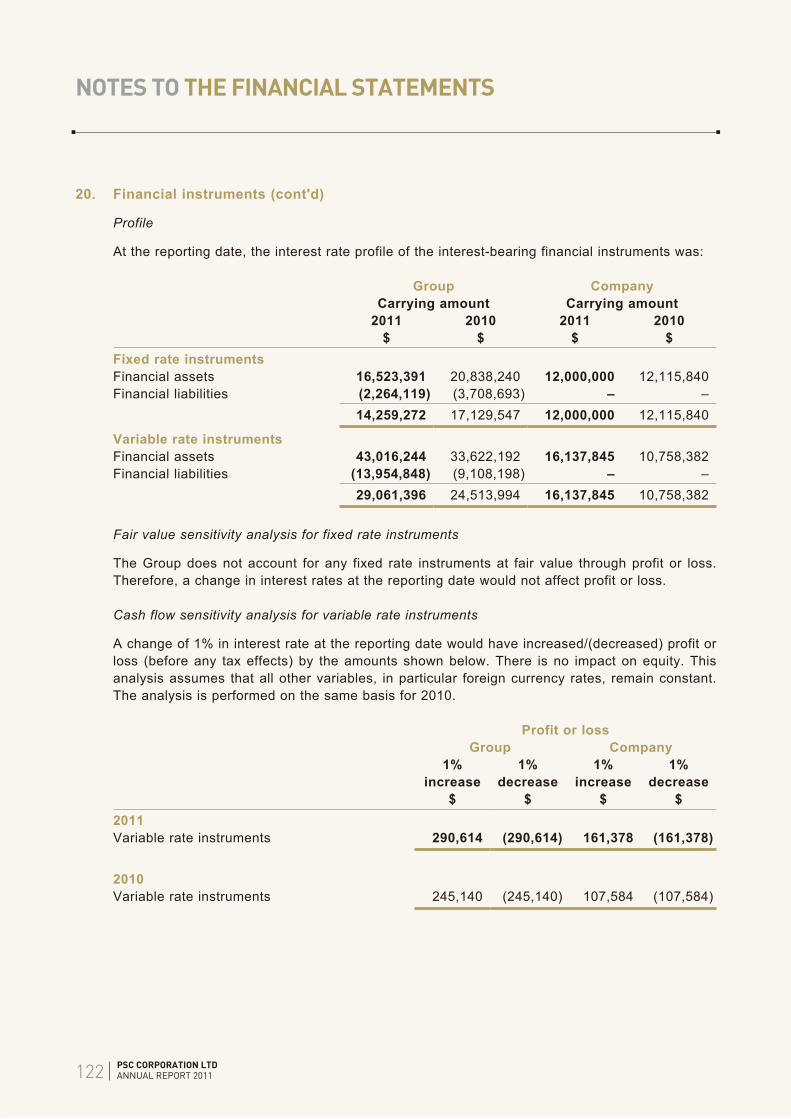
122
NOTES TO THE FINANCIAL STATEMENTS
PSC CORPORATION LTDANNUAL REPORT 2011
20. Financial instruments (cont'd)
Profile
At the reporting date, the interest rate profile of the interest-bearing financial instruments was:
Group CompanyCarrying amount Carrying amount
2011 2010 2011 2010$ $ $ $
Fixed rate instrumentsFinancial assets 16,523,391 20,838,240 12,000,000 12,115,840Financial liabilities (2,264,119) (3,708,693) – –
14,259,272 17,129,547 12,000,000 12,115,840
Variable rate instrumentsFinancial assets 43,016,244 33,622,192 16,137,845 10,758,382Financial liabilities (13,954,848) (9,108,198) – –
29,061,396 24,513,994 16,137,845 10,758,382
Fair value sensitivity analysis for fixed rate instruments
The Group does not account for any fixed rate instruments at fair value through profit or loss. Therefore, a change in interest rates at the reporting date would not affect profit or loss.
Cash flow sensitivity analysis for variable rate instruments
A change of 1% in interest rate at the reporting date would have increased/(decreased) profit or loss (before any tax effects) by the amounts shown below. There is no impact on equity. This analysis assumes that all other variables, in particular foreign currency rates, remain constant. The analysis is performed on the same basis for 2010.
Profit or lossGroup Company
1% increase
1% decrease
1% increase
1% decrease
$ $ $ $2011Variable rate instruments 290,614 (290,614) 161,378 (161,378)
2010Variable rate instruments 245,140 (245,140) 107,584 (107,584)

123
NOTES TO THE FINANCIAL STATEMENTS
PSC CORPORATION LTDANNUAL REPORT 2011
20. Financial instruments (cont'd)
Capital management
The primary objective of the Group’s capital management is to ensure that it maintains healthy capital ratios in order to support its business and maximise shareholders value. Capital consists of total equity and excluding non-controlling interests of the Group.
The Group manages its capital structure and makes alignment to it, in light of changes in economic conditions. To maintain or adjust the capital structure, the Group may align the dividend payment to shareholders, return capital to shareholders or issue new shares.
There were no changes in the Group’s approach to capital management during the year.
As disclosed in note 18, a subsidiary of the Group is required by the Foreign Enterprise Law of the People’s Republic of China (the “PRC”) to contribute to and maintain a non-distributable statutory reserve fund whose utilisation is subject to approval by the relevant PRC authorities. This externally imposed capital requirement has been complied with by the above-mentioned subsidiary for the financial years ended 31 December 2011 and 2010.
Accounting classifications and fair values
Fair values versus carrying amounts
The fair values of financial assets and liabilities, together with the carrying amounts shown in the statements of financial position, are as follows:
Designated at fair value
Held-to-maturity
Loans and receivables
Available-for-sale
Other financial liabilities
Total carrying amount Fair value
$ $ $ $ $ $ $
Group2011Cash and cash equivalents – – 56,923,041 – – 56,923,041 56,923,041Loans and receivables – – 172,787,476 – – 172,787,476 172,787,476Available-for-sale financial assets – – – 1,239,740 – 1,239,740 1,239,740Financial assets designated at fair value through profit or loss 4,533,227 – – – – 4,533,227 4,533,227Held-to-maturity investments – 16,523,391 – – – 16,523,391 16,523,391
4,533,227 16,523,391 229,710,517 1,239,740 – 252,006,875 252,006,875
Bank overdrafts – – – – 2,469,250 2,469,250 2,469,250Secured bank loans – – – – 4,116,580 4,116,580 4,116,580Unsecured bank loans – – – – 8,233,165 8,233,165 8,233,165Bills payable – – – – 12,872,300 12,872,300 12,872,300Finance lease liabilities – – – – 1,399,972 1,399,972 1,399,972Trade and other payables – – – – 90,184,688 90,184,688 90,184,688
– – – – 119,275,955 119,275,955 119,275,955

124
NOTES TO THE FINANCIAL STATEMENTS
PSC CORPORATION LTDANNUAL REPORT 2011
20. Financial instruments (cont'd)
Held-to-maturity
Loans and receivables
Available-for-sale
Other financial liabilities
Total carrying amount Fair value
$ $ $ $ $ $
Group2010Cash and cash equivalents – 47,221,977 – – 47,221,977 47,221,977Loans and receivables – 163,020,064 – – 163,020,064 163,020,064Available-for-sale financial assets – – 14,097,575 – 14,097,575 14,097,575Held-to-maturity investments 20,838,240 – – – 20,838,240 20,838,240
20,838,240 210,242,041 14,097,575 – 245,177,856 245,177,856
Bank overdrafts – – – 2,216,636 2,216,636 2,216,636Secured bank loans – – – 3,708,693 3,708,693 3,708,693Unsecured bank loans – – – 6,202,063 6,202,063 6,202,063Bankers’ acceptance – – – 597,983 597,983 597,983Bills payable – – – 26,658,707 26,658,707 26,658,707Finance lease liabilities – – – 91,516 91,516 91,516Trade and other payables – – – 75,874,304 75,874,304 75,874,304
– – – 115,349,902 115,349,902 115,349,902
Designated at fair value
Held-to-maturity
Loans and receivables
Available-for-sale
Other financial liabilities
Total carrying amount Fair value
$ $ $ $ $ $ $
Company2011Cash and cash equivalents – – 17,339,098 – – 17,339,098 17,339,098Loan to a subsidiary – – 9,500,000 – – 9,500,000 9,500,000Loans and receivables – – 112,895,672 – – 112,895,672 112,895,672Available-for-sale financial assets – – – 865,340 – 865,340 865,340Financial assets designated at fair value through profit or loss 4,533,227 – – – – 4,533,227 4,533,227
4,533,227 – 139,734,770 865,340 – 145,133,337 145,133,337
Trade and other payables – – – – 21,268,692 21,268,692 21,268,692

125
NOTES TO THE FINANCIAL STATEMENTS
PSC CORPORATION LTDANNUAL REPORT 2011
20. Financial instruments (cont'd)
Held-to-maturity
Loans and receivables
Available-for-sale
Other financial liabilities
Total carrying amount Fair value
$ $ $ $ $ $
Company2010Cash and cash equivalents – 12,054,937 – – 12,054,937 12,054,937Loan to a subsidiary – 6,000,000 – – 6,000,000 6,000,000Loans and receivables – 119,553,817 – – 119,553,817 119,553,817Available-for-sale financial assets – – 1,462,158 – 1,462,158 1,462,158Held-to-maturity investments 3,615,840 – – – 3,615,840 3,615,840
3,615,840 137,608,754 1,462,158 – 142,686,752 142,686,752
Trade and other payables – – – 22,173,415 22,173,415 22,173,415
Fair value hierarchy
The table below analyses financial instruments carried at fair value, by valuation method. The different levels have been defined as follows:
• Level 1: quoted prices (unadjusted) in active markets for identical assets or liabilities
• Level 2: inputs other than quoted prices included within Level 1 that are observable for the asset or liability, either directly (i.e., as prices) or indirectly (i.e., derived from prices)
• Level 3: inputs for the asset or liability that are not based on observable market data (unobservable inputs).
Level 1 Level 2 Level 3 Total$ $ $ $
Group2011Equity securities: – Available-for-sale 1,239,740 – – 1,239,740 – Designated at fair value
through profit or loss 4,533,227 – – 4,533,2275,772,967 – – 5,772,967
2010Equity securities, available-for-sale financial assets 2,102,158 – 11,995,417 14,097,575

126
NOTES TO THE FINANCIAL STATEMENTS
PSC CORPORATION LTDANNUAL REPORT 2011
20. Financial instruments (cont'd)
Level 1 Level 2 Level 3 Total$ $ $ $
Company2011Equity securities:– Available-for-sale 865,340 – – 865,340– Designated at fair value through
profit or loss 4,533,227 – – 4,533,2275,398,567 – – 5,398,567
2010Equity securities, available-for-sale financial assets 1,462,158 – – 1,462,158
During the financial year ended 31 December 2010, there were no transfers between Level 1 and Level 2.
The following table shows a reconciliation from the beginning balances to the ending balances for fair value measurements in Level 3 of the fair value hierarchy:
GroupAvailable-for-sale financial assets $At 1 January 2011 11,995,417Change in fair value (375,780)Disposal (11,619,637)At 31 December 2011 –
In 2011, the available-for-sale financial assets recorded in the Level 3 category was disposed.
The fair value of the equity security as at 31 December 2010 was determined using a valuation technique, based on an independent professional valuation as of that date. The fair value of the security was determined using the realisable net asset value approach, which takes into consideration the fair value of the underlying assets and liabilities of the entity to which the security relates. The assets held by the relevant entity comprise mainly properties whose fair values were determined by an independent licensed appraiser. The fair values of the properties were based on market values determined using the comparison method, residual method and depreciated replacement cost method, where appropriate.
An analysis of the effect of changing one or more inputs to reasonably possible alternative assumptions has not been presented as such an effect would not have resulted in a significant change to the fair value measurement of the Group’s total equity.
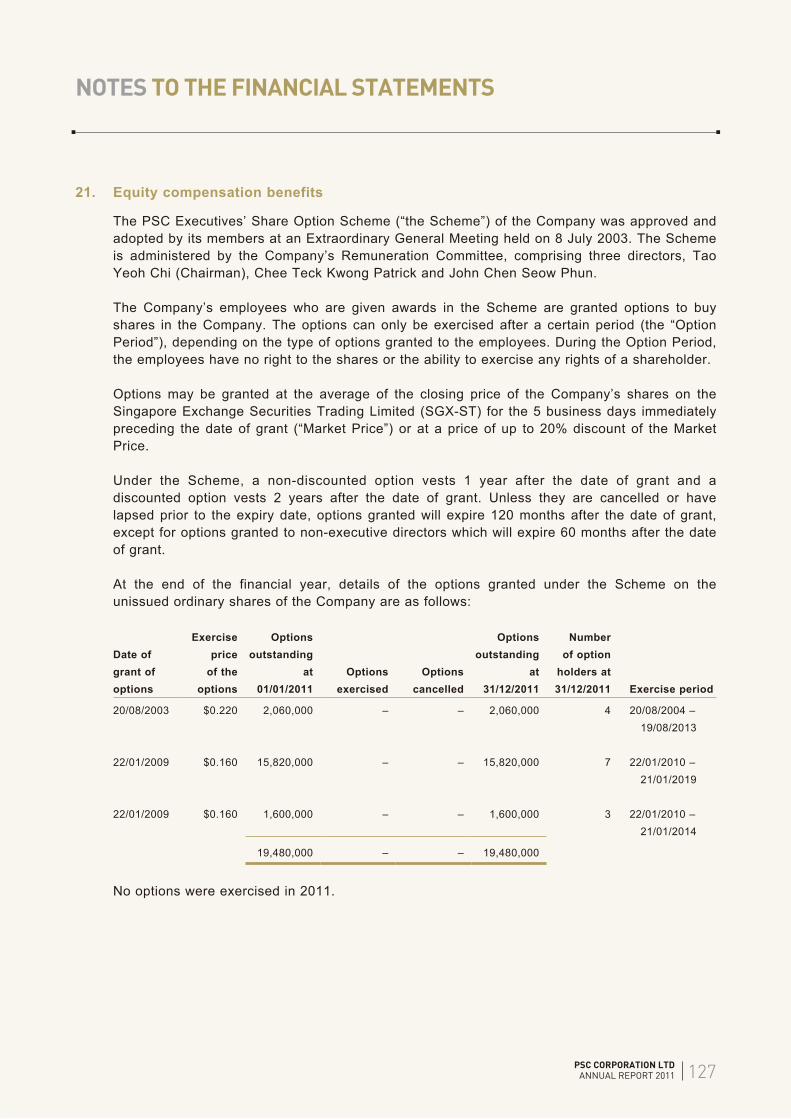
127
NOTES TO THE FINANCIAL STATEMENTS
PSC CORPORATION LTDANNUAL REPORT 2011
21. Equity compensation benefits
The PSC Executives’ Share Option Scheme (“the Scheme”) of the Company was approved and adopted by its members at an Extraordinary General Meeting held on 8 July 2003. The Scheme is administered by the Company’s Remuneration Committee, comprising three directors, Tao Yeoh Chi (Chairman), Chee Teck Kwong Patrick and John Chen Seow Phun.
The Company’s employees who are given awards in the Scheme are granted options to buy shares in the Company. The options can only be exercised after a certain period (the “Option Period”), depending on the type of options granted to the employees. During the Option Period, the employees have no right to the shares or the ability to exercise any rights of a shareholder.
Options may be granted at the average of the closing price of the Company’s shares on the Singapore Exchange Securities Trading Limited (SGX-ST) for the 5 business days immediately preceding the date of grant (“Market Price”) or at a price of up to 20% discount of the Market Price.
Under the Scheme, a non-discounted option vests 1 year after the date of grant and a discounted option vests 2 years after the date of grant. Unless they are cancelled or have lapsed prior to the expiry date, options granted will expire 120 months after the date of grant, except for options granted to non-executive directors which will expire 60 months after the date of grant.
At the end of the financial year, details of the options granted under the Scheme on the unissued ordinary shares of the Company are as follows:
Date ofgrant ofoptions
Exerciseprice
of theoptions
Optionsoutstanding
at01/01/2011
Optionsexercised
Optionscancelled
Optionsoutstanding
at31/12/2011
Numberof option
holders at31/12/2011 Exercise period
20/08/2003 $0.220 2,060,000 – – 2,060,000 4 20/08/2004 – 19/08/2013
22/01/2009 $0.160 15,820,000 – – 15,820,000 7 22/01/2010 – 21/01/2019
22/01/2009 $0.160 1,600,000 – – 1,600,000 3 22/01/2010 – 21/01/2014
19,480,000 – – 19,480,000
No options were exercised in 2011.
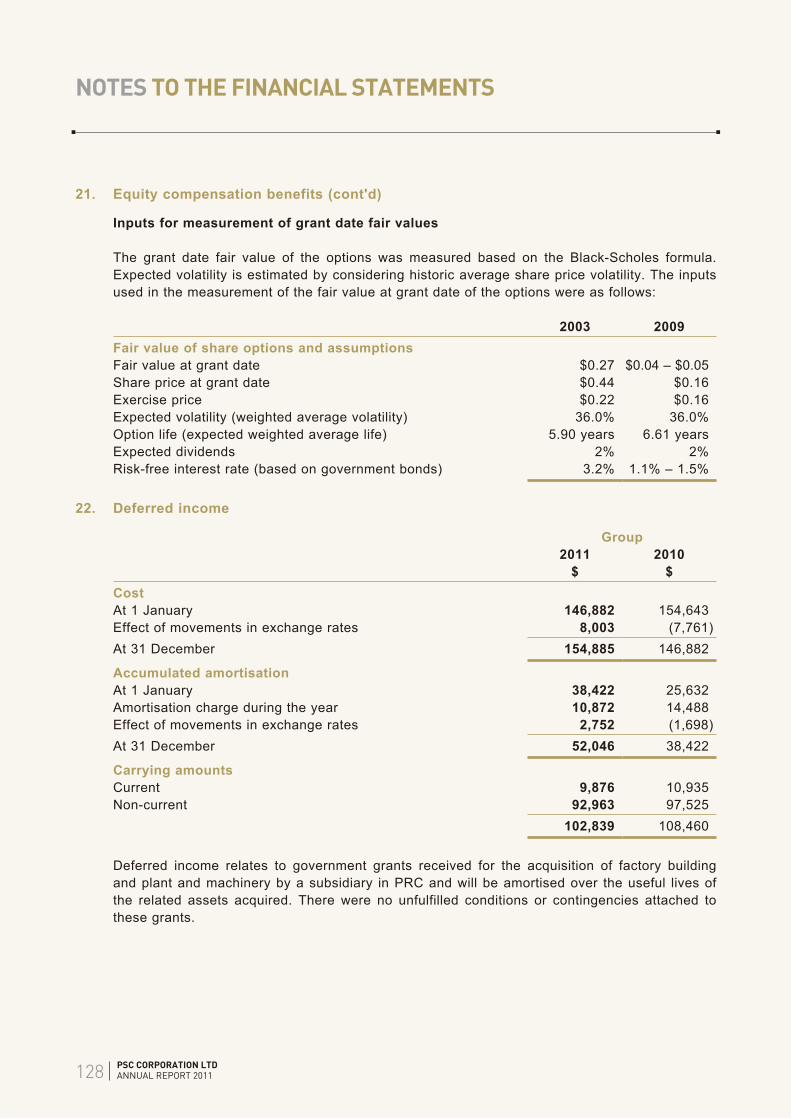
128
NOTES TO THE FINANCIAL STATEMENTS
PSC CORPORATION LTDANNUAL REPORT 2011
21. Equity compensation benefits (cont'd)
Inputs for measurement of grant date fair values
The grant date fair value of the options was measured based on the Black-Scholes formula. Expected volatility is estimated by considering historic average share price volatility. The inputs used in the measurement of the fair value at grant date of the options were as follows:
2003 2009Fair value of share options and assumptionsFair value at grant date $0.27 $0.04 – $0.05Share price at grant date $0.44 $0.16Exercise price $0.22 $0.16Expected volatility (weighted average volatility) 36.0% 36.0%Option life (expected weighted average life) 5.90 years 6.61 yearsExpected dividends 2% 2%Risk-free interest rate (based on government bonds) 3.2% 1.1% – 1.5%
22. Deferred income
Group2011
$2010
$CostAt 1 January 146,882 154,643Effect of movements in exchange rates 8,003 (7,761)At 31 December 154,885 146,882
Accumulated amortisationAt 1 January 38,422 25,632Amortisation charge during the year 10,872 14,488Effect of movements in exchange rates 2,752 (1,698)At 31 December 52,046 38,422
Carrying amountsCurrent 9,876 10,935Non-current 92,963 97,525
102,839 108,460
Deferred income relates to government grants received for the acquisition of factory building and plant and machinery by a subsidiary in PRC and will be amortised over the useful lives of the related assets acquired. There were no unfulfilled conditions or contingencies attached to these grants.

129
NOTES TO THE FINANCIAL STATEMENTS
PSC CORPORATION LTDANNUAL REPORT 2011
23. Trade and other payables
Group Company2011 2010 2011 2010
$ $ $ $Trade payables 64,607,869 47,142,361 5,984,274 5,581,711Retention monies payable – 17,046 – –Amounts due to:– subsidiaries (trade) – – 1,196 26,778– subsidiaries (non-trade) – – 8,956,028 8,127,593– a director of the Company
(non-trade) – 2,268,353 – –Other payables 10,446,680 9,860,331 3,343,102 3,438,340Accruals 15,130,139 16,586,213 2,984,092 4,998,993
90,184,688 75,874,304 21,268,692 22,173,415
The non-trade amounts due to subsidiaries and a director are unsecured, interest-free and repayable on demand.
The Group’s and the Company’s exposure to currency and liquidity risk related to trade and other payables are disclosed in note 20.
24. Revenue
Group2011 2010
$ $Sale of goods 390,786,020 367,276,260Revenue from construction contracts and healthcare consultancy 2,057,627 6,443,715
392,843,647 373,719,975
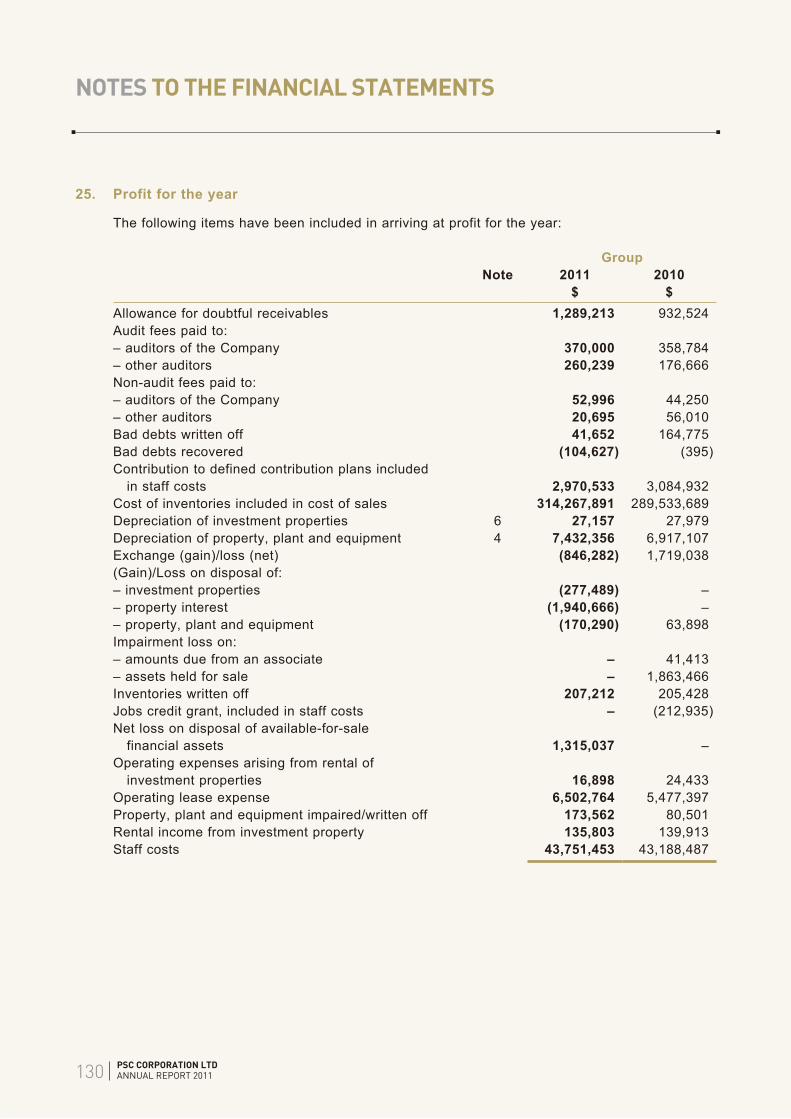
130
NOTES TO THE FINANCIAL STATEMENTS
PSC CORPORATION LTDANNUAL REPORT 2011
25. Profit for the year
The following items have been included in arriving at profit for the year:
GroupNote 2011 2010
$ $Allowance for doubtful receivables 1,289,213 932,524Audit fees paid to:– auditors of the Company 370,000 358,784– other auditors 260,239 176,666Non-audit fees paid to:– auditors of the Company 52,996 44,250– other auditors 20,695 56,010Bad debts written off 41,652 164,775Bad debts recovered (104,627) (395)Contribution to defined contribution plans included in staff costs 2,970,533 3,084,932Cost of inventories included in cost of sales 314,267,891 289,533,689Depreciation of investment properties 6 27,157 27,979Depreciation of property, plant and equipment 4 7,432,356 6,917,107Exchange (gain)/loss (net) (846,282) 1,719,038(Gain)/Loss on disposal of:– investment properties (277,489) –– property interest (1,940,666) –– property, plant and equipment (170,290) 63,898Impairment loss on:– amounts due from an associate – 41,413– assets held for sale – 1,863,466Inventories written off 207,212 205,428Jobs credit grant, included in staff costs – (212,935)Net loss on disposal of available-for-sale financial assets 1,315,037 –Operating expenses arising from rental of investment properties 16,898 24,433Operating lease expense 6,502,764 5,477,397Property, plant and equipment impaired/written off 173,562 80,501Rental income from investment property 135,803 139,913Staff costs 43,751,453 43,188,487

131
NOTES TO THE FINANCIAL STATEMENTS
PSC CORPORATION LTDANNUAL REPORT 2011
26. Finance income and finance costs
Group2011
$2010
$Recognised in profit or lossInterest income:– repurchase transactions – 1,956,639– held-to-maturity investments 1,651,419 3,453,039– fixed deposits 232,162 249,394Dividend income on available-for-sale financial assets 1,430 124,805Finance income 1,885,011 5,783,877
Interest expense:– bank borrowings (1,161,973) (892,325)– finance lease liabilities (83,044) (31,314)Change in fair value of financial assets designated at fair value through profit or loss (3,241,951) –Impairment loss on available-for-sale financial assets (520,900) –Loss on disposal of available-for-sale financial assets (1,315,037) –Finance costs (6,322,905) (923,639)Net finance (costs)/income recognised in profit or loss (4,437,894) 4,860,238
The above finance income and finance expense included the following interest income and expense in respect of assets (liabilities) not at fair value through profit or loss:
– Total interest income on financial assets 1,883,581 5,659,072
– Total interest expense on financial liabilities 1,245,017 923,639
27. Tax expense
Group2011 2010
$ $Tax recognised in profit or lossCurrent tax expenseCurrent year 3,849,579 4,817,882Adjustment for prior years (435,425) (551,510)
3,414,154 4,266,372Deferred tax (credit)/expenseOrigination and reversal of temporary differences (182,391) 51,706Adjustment for prior years (224,834) 575,924Others (3,916) –
(411,141) 627,630
Total tax expense 3,003,013 4,894,002

132
NOTES TO THE FINANCIAL STATEMENTS
PSC CORPORATION LTDANNUAL REPORT 2011
27. Tax expense (cont'd)
Group2011 2010
$ $Reconciliation of effective tax rate
Profit for the year 4,488,731 17,306,866Total tax expense 3,003,013 4,894,002Profit excluding tax 7,491,744 22,200,868
Tax calculated using Singapore tax rate of 17% (2010: 17%) 1,273,596 3,774,148Effect of different tax rates in other countries 601,308 1,289,090Income not subject to tax (367,771) (464,326)Tax effect on share of profit of associates (521,136) (818,165)Expenses not deductible for tax purposes 2,175,348 958,420Tax rebate/incentives (151,126) (187,461)Tax losses not recognised 706,699 244,899Utilisation of previously unrecognised tax losses – (4,148)Adjustment for prior years (660,259) 24,414Others (53,646) 77,131
3,003,013 4,894,002
28. Earnings per share
Basic earnings per share
The calculation of basic earnings per share at 31 December 2011 was based on the profit attributable to ordinary shareholders of $2,316,005 (2010: $14,238,465), and a weighted average number of ordinary shares outstanding of 556,041,746 (2010: 554,096,458), calculated as follows:
Weighted average number of ordinary shares (basic)
GroupNote 2011 2010
Issued ordinary shares at 1 January 18 556,041,746 561,226,746Effect of treasury shares purchased – (11,215,614)Effect of share options exercised – 4,085,326Weighted average number of ordinary shares during the year 556,041,746 554,096,458
Diluted earnings per share
The calculation of diluted earnings per share at 31 December 2011 was based on profit attributable to ordinary shareholders of $2,316,005 (2010: $14,238,465) and a weighted average number of ordinary shares outstanding after adjustment for the effects of all dilutive potential ordinary shares of 561,430,354 (2010: 562,384,653), calculated as follows:
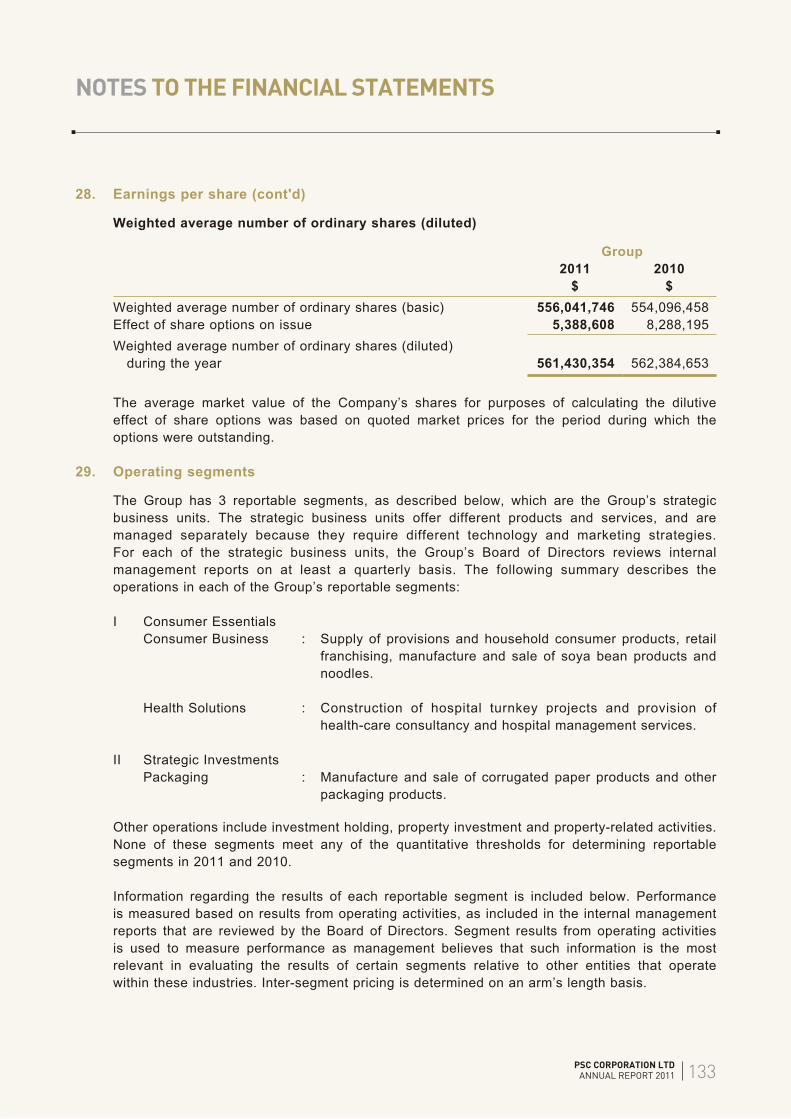
133
NOTES TO THE FINANCIAL STATEMENTS
PSC CORPORATION LTDANNUAL REPORT 2011
28. Earnings per share (cont'd)
Weighted average number of ordinary shares (diluted)
Group2011 2010
$ $Weighted average number of ordinary shares (basic) 556,041,746 554,096,458Effect of share options on issue 5,388,608 8,288,195Weighted average number of ordinary shares (diluted) during the year 561,430,354 562,384,653
The average market value of the Company’s shares for purposes of calculating the dilutive effect of share options was based on quoted market prices for the period during which the options were outstanding.
29. Operating segments
The Group has 3 reportable segments, as described below, which are the Group’s strategic business units. The strategic business units offer different products and services, and are managed separately because they require different technology and marketing strategies. For each of the strategic business units, the Group’s Board of Directors reviews internal management reports on at least a quarterly basis. The following summary describes the operations in each of the Group’s reportable segments:
I Consumer EssentialsConsumer Business : Supply of provisions and household consumer products, retail
franchising, manufacture and sale of soya bean products and noodles.
Health Solutions : Construction of hospital turnkey projects and provision of health-care consultancy and hospital management services.
II Strategic InvestmentsPackaging : Manufacture and sale of corrugated paper products and other
packaging products.
Other operations include investment holding, property investment and property-related activities. None of these segments meet any of the quantitative thresholds for determining reportable segments in 2011 and 2010.
Information regarding the results of each reportable segment is included below. Performance is measured based on results from operating activities, as included in the internal management reports that are reviewed by the Board of Directors. Segment results from operating activities is used to measure performance as management believes that such information is the most relevant in evaluating the results of certain segments relative to other entities that operate within these industries. Inter-segment pricing is determined on an arm’s length basis.

134
NOTES TO THE FINANCIAL STATEMENTS
PSC CORPORATION LTDANNUAL REPORT 2011
29. Operating segments (cont'd)
← Consumer Essentials →Strategic
Investments OthersTotal
operationsConsumer Business
Health Solutions Packaging
$ $ $ $ $
Group2011External revenues 223,982,269 2,057,627 166,803,751 – 392,843,647
Results from operating activities 8,684,840 (2,612,452) 6,212,990 1,715,743 14,001,121
Net finance costs (4,437,894)Share of losses of associates (net of tax) (2,071,483)
Profit before tax 7,491,744Tax expense (3,003,013)
Profit for the year 4,488,731
Other segment information
Depreciation of:– property, plant and equipment 2,843,081 48,285 4,540,990 – 7,432,356– investment properties – – – 27,157 27,157
Capital expenditure 1,247,095 11,228 6,971,026 – 8,229,349
Other non-cash expenses/(income) 4,752,568 441,512 (201,042) 4,436,191 9,429,229
2010External revenues 214,000,349 6,443,714 153,275,912 – 373,719,975
Results from operating activities 5,996,704 282,393 8,363,248 (2,114,449) 12,527,896
Net finance income 4,860,238Share of profit of associates (net of tax) 4,812,734
Profit before tax 22,200,868Tax expense (4,894,002)
Profit for the year 17,306,866
Other segment information
Depreciation of:– property, plant and equipment 2,766,395 55,649 4,095,060 – 6,917,104– investment properties – – – 27,979 27,979
Capital expenditure 2,604,823 13,206 8,738,555 – 11,356,584
Other non-cash expenses 1,597,565 702,961 223,209 1,696,436 4,220,171

135
NOTES TO THE FINANCIAL STATEMENTS
PSC CORPORATION LTDANNUAL REPORT 2011
29. Operating segments (cont'd)
Geographical segments
In presenting information on the basis of geographical segments, segment revenue is based on the geographical location of customers or investments, where appropriate. Segment non-current assets are based on geographical location of the assets.
Singapore Malaysia China Australia Others Total$ $ $ $ $ $
2011External revenue 192,971,767 73,389,090 126,482,790 – – 392,843,647
Non-current assets 47,900,781 6,466,264 40,040,233 23,481,546 948,147 118,836,971
2010External revenue 187,851,526 74,307,733 111,560,716 – – 373,719,975
Non-current assets 53,115,728 6,962,466 34,545,622 17,811,712 5,759,617 118,195,145
30. Acquisitions and disposals of subsidiaries and non-controlling interests
Year ended 31 December 2010
Disposals of subsidiaries
In March 2010, the Group disposed of its subsidiary, Innoform Media Pte Ltd and its subsidiaries, for a total consideration of $6,630,000. The disposal costs incurred amounted to $180,000.
The disposed subsidiaries contributed a net profit of $2,113,515 for the year ended 31 December 2009 and a net profit of $46,035 from 1 January 2010 to the date of disposal.
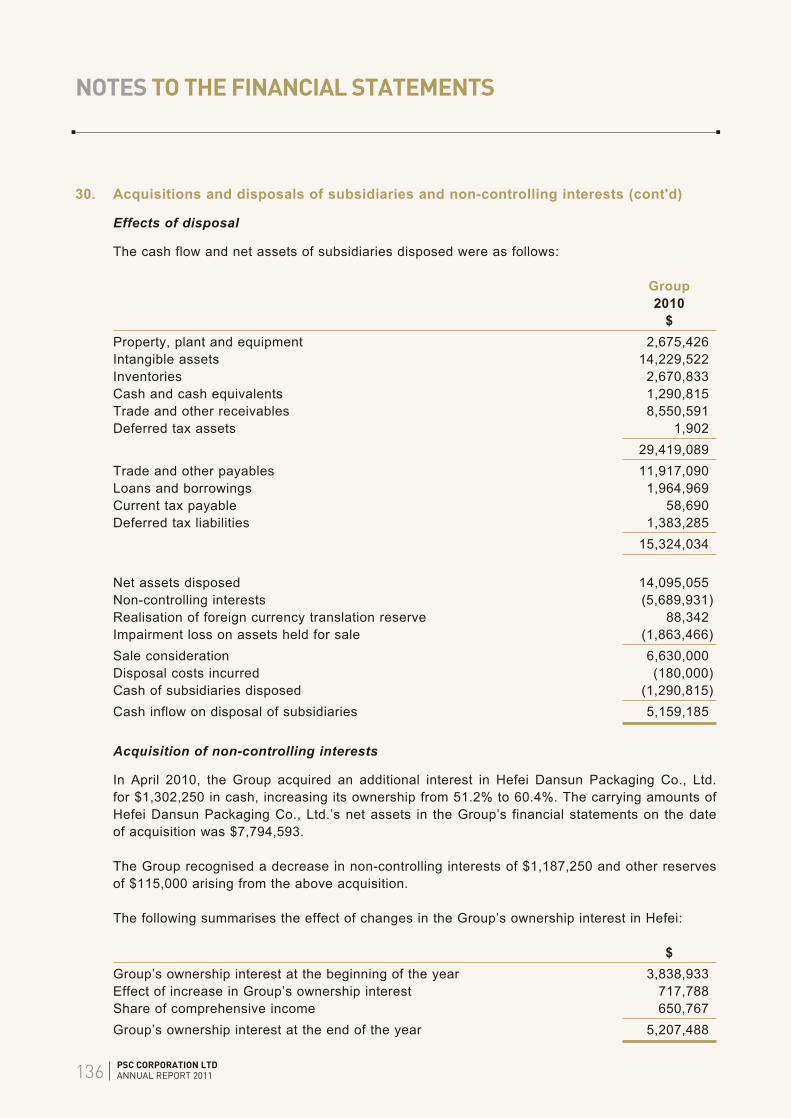
136
NOTES TO THE FINANCIAL STATEMENTS
PSC CORPORATION LTDANNUAL REPORT 2011
30. Acquisitions and disposals of subsidiaries and non-controlling interests (cont'd)
Effects of disposal
The cash flow and net assets of subsidiaries disposed were as follows:
Group2010
$Property, plant and equipment 2,675,426Intangible assets 14,229,522Inventories 2,670,833Cash and cash equivalents 1,290,815Trade and other receivables 8,550,591Deferred tax assets 1,902
29,419,089Trade and other payables 11,917,090Loans and borrowings 1,964,969Current tax payable 58,690Deferred tax liabilities 1,383,285
15,324,034
Net assets disposed 14,095,055Non-controlling interests (5,689,931)Realisation of foreign currency translation reserve 88,342Impairment loss on assets held for sale (1,863,466)Sale consideration 6,630,000Disposal costs incurred (180,000)Cash of subsidiaries disposed (1,290,815)Cash inflow on disposal of subsidiaries 5,159,185
Acquisition of non-controlling interests
In April 2010, the Group acquired an additional interest in Hefei Dansun Packaging Co., Ltd. for $1,302,250 in cash, increasing its ownership from 51.2% to 60.4%. The carrying amounts of Hefei Dansun Packaging Co., Ltd.’s net assets in the Group’s financial statements on the date of acquisition was $7,794,593.
The Group recognised a decrease in non-controlling interests of $1,187,250 and other reserves of $115,000 arising from the above acquisition.
The following summarises the effect of changes in the Group’s ownership interest in Hefei:
$Group’s ownership interest at the beginning of the year 3,838,933Effect of increase in Group’s ownership interest 717,788Share of comprehensive income 650,767Group’s ownership interest at the end of the year 5,207,488

137
NOTES TO THE FINANCIAL STATEMENTS
PSC CORPORATION LTDANNUAL REPORT 2011
31. Determination of fair values
A number of the Group’s accounting policies and disclosures require the determination of fair value, for both financial and non-financial assets and liabilities. Fair values have been determined for measurement and/or disclosure purposes based on the following methods. When applicable, further information about the assumptions made in determining fair values is disclosed in the notes specific to that asset or liability.
(i) Equity and debt securities
The fair value of available-for-sale financial assets and financial assets designated at fair value through profit or loss are based on their quoted closing bid price at the reporting date, with the exception of those equity securities which are not traded in an active market for the year ended 31 December 2010. For equity securities that are not traded in an active market, the fair value is determined by using a valuation technique (see note 20). It is not practicable to calculate the fair value of non-current held-to-maturity investments in unquoted debt securities because of the lack of quoted market prices in an active market, significant range of reasonable fair value estimates, and the inability to reasonably assess the probabilities of the various estimates (note 20).
(ii) Loans and borrowings
The carrying amounts of loans and borrowings where interest rates reprice within 6 months are assumed to approximate their fair values because of the short period to repricing.
(iii) Other financial assets and liabilities
The carrying amounts of financial assets and liabilities with a maturity of less than one year (including trade and other receivables, cash and cash equivalents, held-to-maturity investments in debt securities, trade and other payables and loans and borrowings) approximate their fair values. All other financial assets and liabilities are discounted to determine their fair values.
(iv) Share-based payment transactions
The fair value of the employee share options is measured using the Black-Scholes formula. Measurement inputs include share price on the measurement date, the exercise price of the instrument, expected volatility (based on weighted average historic volatility adjusted for changes expected due to publicly available information), weighted average expected life of the instruments (based on historical experience and general option holder behaviour), expected dividends, and the risk-free interest rate (based on government bonds).

138
NOTES TO THE FINANCIAL STATEMENTS
PSC CORPORATION LTDANNUAL REPORT 2011
32. Operating leases
Leases as lessee
Non-cancellable operating lease rentals are payable as follows:
(a) Future minimum lease payments under non-cancellable operating leases are as follows:
Group Company2011 2010 2011 2010
$ $ $ $Within one year 5,400,715 5,727,485 1,703,384 1,317,464Between one and five years 12,858,662 14,083,071 3,266,903 3,511,743More than five years 18,770,265 20,119,597 7,342,844 8,053,441
37,029,642 39,930,153 12,313,131 12,882,648
Included in the commitments for future minimum lease payments is annual land rent relating to the leasehold building owned by the Company built on land subject to a 60-year lease commencing from 1 May 1967. The annual land rent currently payable under the lease agreement is $710,598 (2010: $710,598).
Leases as lessor
(b) The Group and the Company lease out certain of their property, plant and equipment and investment properties (see notes 4 and 6). The future minimum lease payments under non-cancellable leases are as follows:
Group Company2011 2010 2011 2010
$ $ $ $Within one year 592,418 611,642 745,278 1,059,111Between one and five years 334,934 189,799 348,677 254,149
927,352 801,441 1,093,955 1,313,260

139
NOTES TO THE FINANCIAL STATEMENTS
PSC CORPORATION LTDANNUAL REPORT 2011
33. Capital commitments
At 31 December, the Group and the Company have the following commitments:
Capital commitments in respect of leasehold improvement contracts, Enterprise Resource Planning system and purchase of property, plant and equipment:
Group Company2011 2010 2011 2010
$ $ $ $Contracted but not provided for 743,483 5,532,338 406,253 594,800
34. Contingent liabilities
As at 31 December 2011, Health Solutions (Malaysia) Sdn Bhd (“HSM”), a subsidiary, has filed a legal claim against a customer in Thailand on grounds of breach of contract. The total sum claimed was US$39.2 million (approximately $50.9 million).
The customer filed a counter claim against HSM amounting to Baht 350.6 million (approximately $14.4 million) for the breach of the same contract. Based on available information as at 31 December 2011 and taking into consideration the legal opinion obtained, the directors have assessed that no provision is required to be made in the financial statements in respect of this counter claim.
35. Related parties
Key management personnel compensation
Compensation paid/payable to key management personnel comprise:
Group2011 2010
$ $Director fees 594,580 589,124Short-term employee benefits 5,235,940 7,930,463Post-employment benefits 96,533 81,357
5,927,053 8,600,944
The key management personnel comprise the executive and non-executive directors, senior vice presidents, group financial controller of the Company and the directors of certain major subsidiaries.

140
NOTES TO THE FINANCIAL STATEMENTS
PSC CORPORATION LTDANNUAL REPORT 2011
35. Related parties (cont'd)
Other than as disclosed elsewhere in the financial statements, the transactions with related parties are as follows:
Group2011 2010
$ $Transactions with companies that have a common director with the CompanyInterest income – 93,370Purchase of beverages and cereals 198,833 258,415Advisory and consultancy fees paid/payable 60,000 60,000Travelling expenses 65,723 –
AssociatesSales (2,051,611) (2,558,890)Rental income received/receivable (206,550) (211,470)Hire of motor vehicles paid/payable 13,581 13,992
In 2010, investments in debt securities in companies that have a common director with the Company amounted to $3,615,840.
36. Subsequent event
On August 2011, Tat Seng Packaging Group Ltd, a subsidiary, announced its intention to incorporate a new subsidiary with Shanghai Yunyi Packaging Products Co., Ltd. The Group will have a 67% equity interest in the subsidiary Tianjin Dansun Packaging Co., Ltd. (“Tianjin Dansun”) whose principal activities relate to paper boxes production and packaging. Phase 1 of capital injection amounting to RMB8.0 million as registered capital was effected on 18 January 2012.

141
SUPPLEMENTARY INFORMATION (SGX LISTING MANUAL DISCLOSURE REQUIREMENTS)
PSC CORPORATION LTDANNUAL REPORT 2011
1 Directors remuneration
Company’s directors receiving remuneration from the Group:
Number of directors2011 2010
Remuneration of:
$2,500,001 to $3,000,000 – 1$1,500,001 to $2,000,000 – 1$500,001 to $1,000,000 2 –$200,000 and below 7* 6
9 8
* One director from the remuneration band resigned during the financial year 2011.
2 Group properties
Description of properties held by the Group is as follows:
Location Description Tenure
348 Jalan Boon Lay,Singapore 619529
Two-storey warehouse with annexedoffice block used by the Group bothfor its operations and for rental income
60-year lease from 1 May 1967 and an option to renew for 22 years, 3 months and 30 days
348 Jalan Boon Lay,Singapore 619529
Single-storey factory used by asubsidiary for its operations
60-year lease from 1 May 1967 and an option to renew for 22 years, 3 months and 30 days
Lot MLO 1101, Kampong Bukit Kulai, Johor, Malaysia
Factory used by a subsidiary forits operations
Freehold
Lot MLO 1102 and 1103, Mukim of Sedenak, Kulai, Johor, Malaysia
Vacant land Freehold
Lot 249, GPP 4841 Town AreaXXI District of Melaka Tengah, Melaka, Malaysia
Vacant land Freehold
Wilayah PengembanganSekupang Patam, Batam,Indonesia
Vacant land 30-year lease from11 March 1986
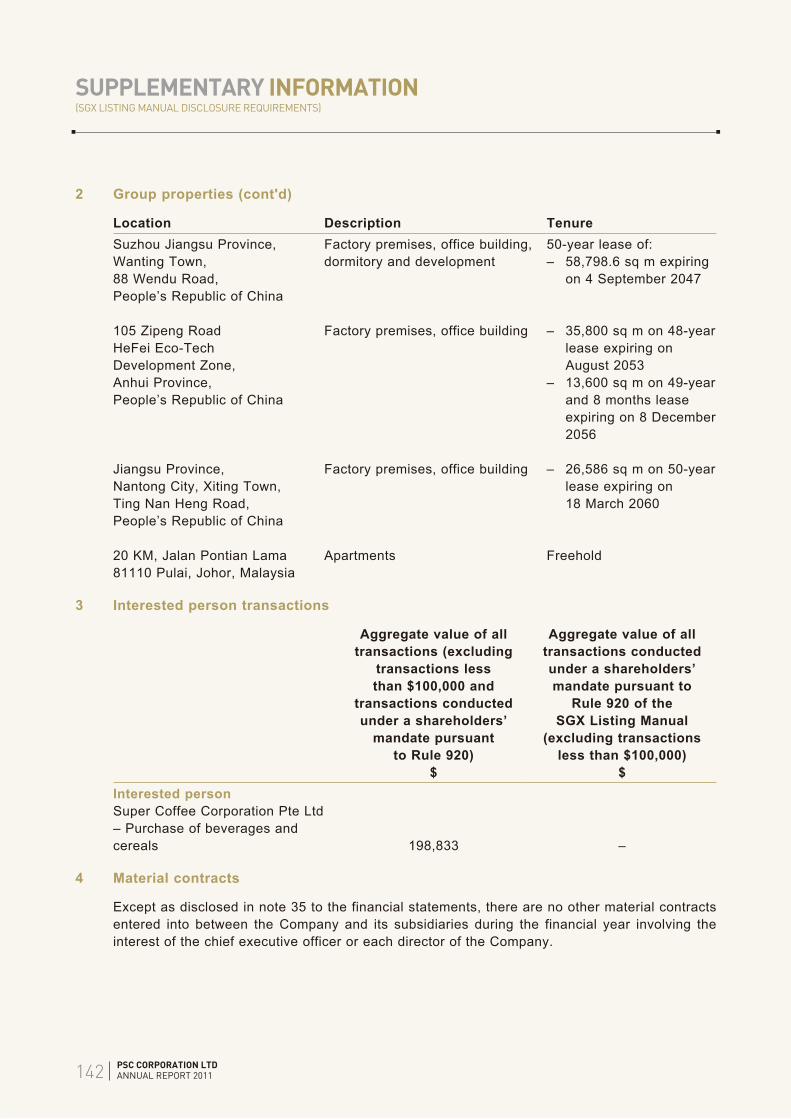
142
SUPPLEMENTARY INFORMATION (SGX LISTING MANUAL DISCLOSURE REQUIREMENTS)
PSC CORPORATION LTDANNUAL REPORT 2011
2 Group properties (cont'd)
Location Description Tenure
Suzhou Jiangsu Province, Wanting Town, 88 Wendu Road,People’s Republic of China
Factory premises, office building, dormitory and development
50-year lease of:– 58,798.6 sq m expiring
on 4 September 2047
105 Zipeng RoadHeFei Eco-Tech Development Zone, Anhui Province, People’s Republic of China
Factory premises, office building – 35,800 sq m on 48-year lease expiring on August 2053
– 13,600 sq m on 49-year and 8 months lease expiring on 8 December 2056
Jiangsu Province,Nantong City, Xiting Town, Ting Nan Heng Road,People’s Republic of China
Factory premises, office building – 26,586 sq m on 50-year lease expiring on 18 March 2060
20 KM, Jalan Pontian Lama81110 Pulai, Johor, Malaysia
Apartments Freehold
3 Interested person transactions
Aggregate value of all transactions (excluding
transactions less than $100,000 and
transactions conducted under a shareholders’
mandate pursuant to Rule 920)
Aggregate value of all transactions conducted under a shareholders’ mandate pursuant to
Rule 920 of the SGX Listing Manual
(excluding transactions less than $100,000)
$ $Interested personSuper Coffee Corporation Pte Ltd– Purchase of beverages and cereals 198,833 –
4 Material contracts
Except as disclosed in note 35 to the financial statements, there are no other material contracts entered into between the Company and its subsidiaries during the financial year involving the interest of the chief executive officer or each director of the Company.

143
資產負債表
PSC CORPORATION LTDANNUAL REPORT 2011
集團 公司附註 2011 2010 2011 2010
$ $ $ $
資產
非流動資產合計
流動資產合計
資產合計
股東權益
股東權益合計
負債
非流動負債合計
流動負債合計
負債合計
負債及股東權益合計

144
綜合損益表
PSC CORPORATION LTDANNUAL REPORT 2011
附註 2011 2010$ $
毛利
營業活動之盈利
淨金融 (損失)/收入
稅前盈利
本期盈利
可歸屬:
本期盈利
每股盈利

145
SHAREHOLDING STATISTICS 16 MARCH 2012
PSC CORPORATION LTDANNUAL REPORT 2011
Number of Issued and Fully Paid Shares : 556,041,746excluding Treasury SharesClass of Shares : Ordinary Shares with equal voting rightsIssued and Fully Paid Share Capital : S$203,944,151.15
SUBSTANTIAL SHAREHOLDERSas at 16 March 2012
NUMBER OF SHARES HELDSHAREHOLDING
PERCENTAGE
SUBSTANTIAL SHAREHOLDERSDIRECT
INTERESTDEEMED
INTEREST %
Violet Profit Holdings Limited 134,112,551 – 24.12Ku Yun-Sen(1) – 134,112,551 24.12Tang Cheuk Chee 49,449,500(2) 47,106,000(3) 17.36Allan Yap(4) – 96,555,500 17.36Goi Seng Hui 68,109,404 – 12.25
Notes:(1) Ku Yun-Sen is deemed to have an interest through Violet Profit Holdings Limited.
(2) On 28 February 2011, Tang Cheuk Chee, the spouse of Allan Yap (Executive Chairman of the Company) entered into a Sale and Purchase Agreement with Super Group Ltd, for the acquisition of 49,449,500 ordinary shares in the capital of the Company. The acquisition was completed on 7 June 2011.
(3) Tang Cheuk Chee is deemed to have an interest in shares of the Company upon acquisition of the controlling interest in Sino Diamond International Co., Ltd and Widelead International Limited.
(4) Allan Yap is deemed to be interested in 96,555,500 shares held by his spouse Tang Cheuk Chee in the capital of the Company, by virtue of Section 7 of the Companies Act, Cap.50.
DIRECTORS’ SHAREHOLDINGas at 21 January 2012
DIRECTORS
HOLDINGS IN THE NAME OF DIRECTOR OR IN WHICH
DIRECTOR HAS A DIRECT INTEREST
HOLDINGS IN WHICH THE DIRECTOR IS DEEMED
TO HAVE AN INTEREST
Allan Yap – 96,555,500Tang Cheuk Chee 49,449,500 47,106,000Foo Der Rong 876,750 –John Chen Seow Phun 1,000,000 –Lien Kait Long 5,530 –Chee Teck Kwong Patrick 800,000 –
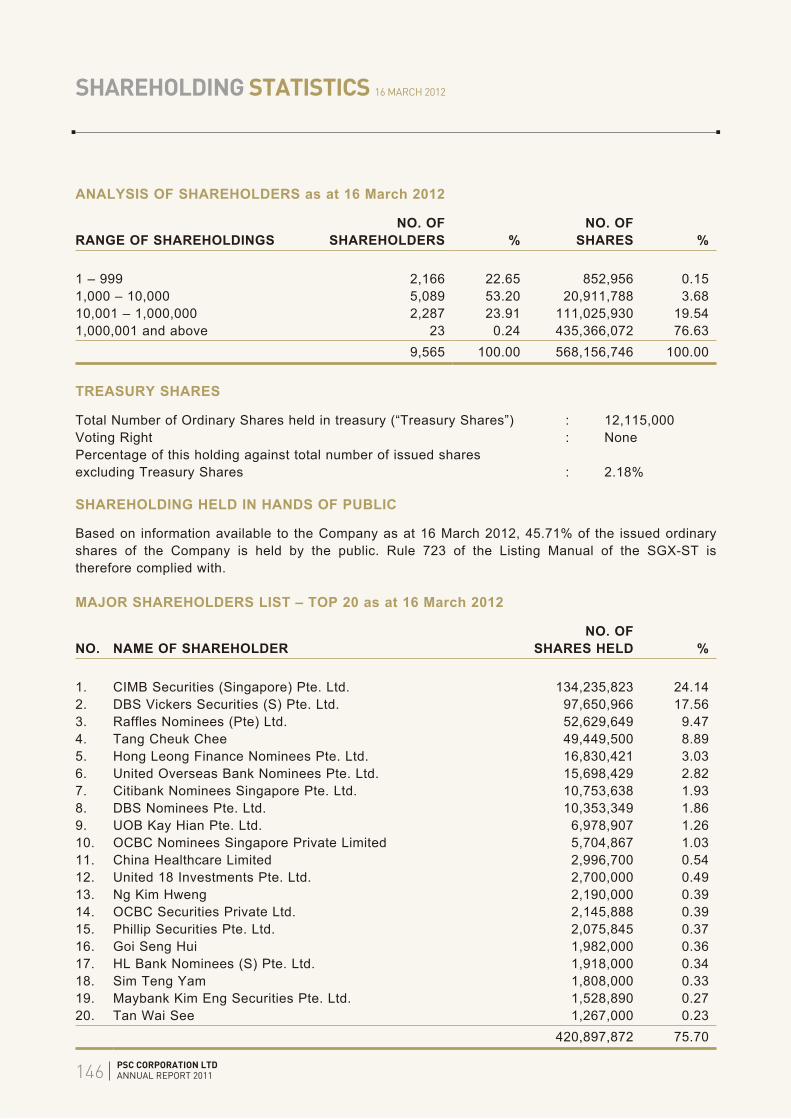
146
SHAREHOLDING STATISTICS 16 MARCH 2012
PSC CORPORATION LTDANNUAL REPORT 2011
ANALYSIS OF SHAREHOLDERS as at 16 March 2012
RANGE OF SHAREHOLDINGSNO. OF
SHAREHOLDERS %NO. OF
SHARES %
1 – 999 2,166 22.65 852,956 0.151,000 – 10,000 5,089 53.20 20,911,788 3.6810,001 – 1,000,000 2,287 23.91 111,025,930 19.541,000,001 and above 23 0.24 435,366,072 76.63
9,565 100.00 568,156,746 100.00
TREASURY SHARES
Total Number of Ordinary Shares held in treasury (“Treasury Shares”) : 12,115,000Voting Right : NonePercentage of this holding against total number of issued shares excluding Treasury Shares : 2.18%
SHAREHOLDING HELD IN HANDS OF PUBLIC
Based on information available to the Company as at 16 March 2012, 45.71% of the issued ordinary shares of the Company is held by the public. Rule 723 of the Listing Manual of the SGX-ST is therefore complied with.
MAJOR SHAREHOLDERS LIST – TOP 20 as at 16 March 2012
NO. NAME OF SHAREHOLDERNO. OF
SHARES HELD %
1. CIMB Securities (Singapore) Pte. Ltd. 134,235,823 24.142. DBS Vickers Securities (S) Pte. Ltd. 97,650,966 17.563. Raffles Nominees (Pte) Ltd. 52,629,649 9.474. Tang Cheuk Chee 49,449,500 8.895. Hong Leong Finance Nominees Pte. Ltd. 16,830,421 3.036. United Overseas Bank Nominees Pte. Ltd. 15,698,429 2.827. Citibank Nominees Singapore Pte. Ltd. 10,753,638 1.938. DBS Nominees Pte. Ltd. 10,353,349 1.869. UOB Kay Hian Pte. Ltd. 6,978,907 1.2610. OCBC Nominees Singapore Private Limited 5,704,867 1.0311. China Healthcare Limited 2,996,700 0.5412. United 18 Investments Pte. Ltd. 2,700,000 0.4913. Ng Kim Hweng 2,190,000 0.3914. OCBC Securities Private Ltd. 2,145,888 0.3915. Phillip Securities Pte. Ltd. 2,075,845 0.3716. Goi Seng Hui 1,982,000 0.3617. HL Bank Nominees (S) Pte. Ltd. 1,918,000 0.3418. Sim Teng Yam 1,808,000 0.3319. Maybank Kim Eng Securities Pte. Ltd. 1,528,890 0.2720. Tan Wai See 1,267,000 0.23
420,897,872 75.70
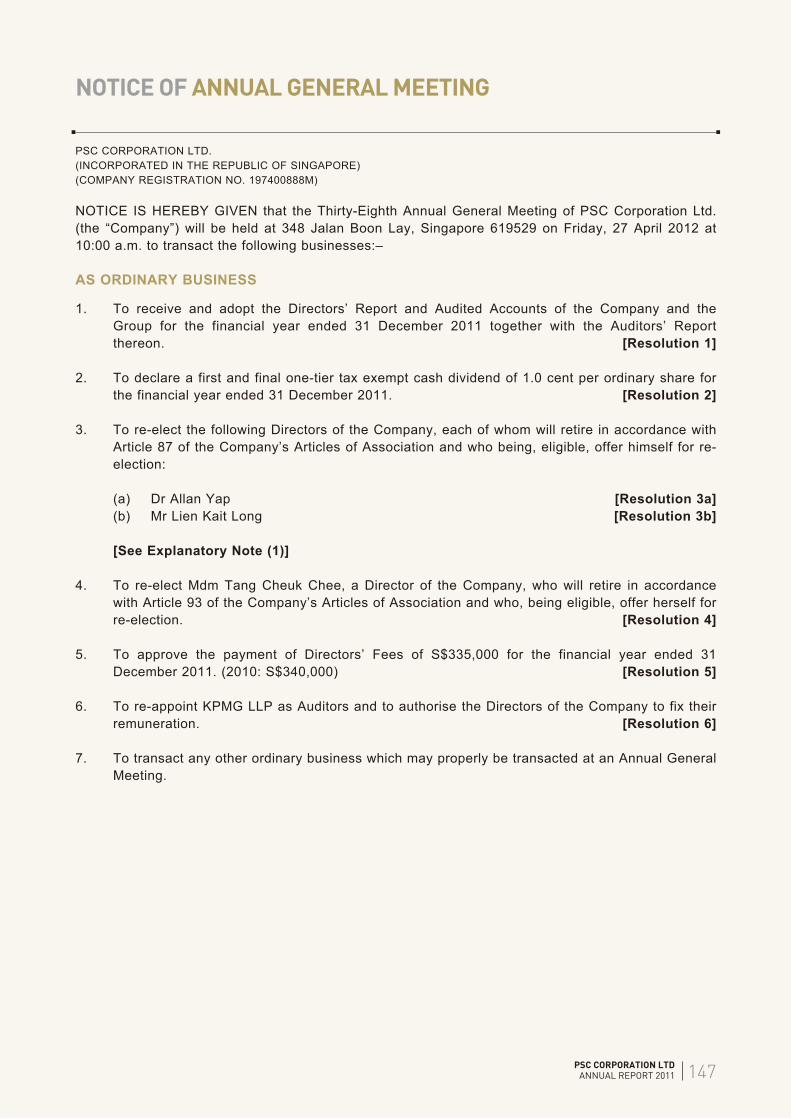
147
NOTICE OF ANNUAL GENERAL MEETING
PSC CORPORATION LTDANNUAL REPORT 2011
PSC CORPORATION LTD.(INCORPORATED IN THE REPUBLIC OF SINGAPORE)(COMPANY REGISTRATION NO. 197400888M)
NOTICE IS HEREBY GIVEN that the Thirty-Eighth Annual General Meeting of PSC Corporation Ltd. (the “Company”) will be held at 348 Jalan Boon Lay, Singapore 619529 on Friday, 27 April 2012 at 10:00 a.m. to transact the following businesses:–
AS ORDINARY BUSINESS
1. To receive and adopt the Directors’ Report and Audited Accounts of the Company and the Group for the financial year ended 31 December 2011 together with the Auditors’ Report thereon. [Resolution 1]
2. To declare a first and final one-tier tax exempt cash dividend of 1.0 cent per ordinary share for the financial year ended 31 December 2011. [Resolution 2]
3. To re-elect the following Directors of the Company, each of whom will retire in accordance with Article 87 of the Company’s Articles of Association and who being, eligible, offer himself for re-election:
(a) Dr Allan Yap [Resolution 3a](b) Mr Lien Kait Long [Resolution 3b]
[See Explanatory Note (1)]
4. To re-elect Mdm Tang Cheuk Chee, a Director of the Company, who will retire in accordance with Article 93 of the Company’s Articles of Association and who, being eligible, offer herself for re-election. [Resolution 4]
5. To approve the payment of Directors’ Fees of S$335,000 for the financial year ended 31 December 2011. (2010: S$340,000) [Resolution 5]
6. To re-appoint KPMG LLP as Auditors and to authorise the Directors of the Company to fix their remuneration. [Resolution 6]
7. To transact any other ordinary business which may properly be transacted at an Annual General Meeting.

148
NOTICE OF ANNUAL GENERAL MEETING
PSC CORPORATION LTDANNUAL REPORT 2011
PSC CORPORATION LTD.(INCORPORATED IN THE REPUBLIC OF SINGAPORE)(COMPANY REGISTRATION NO. 197400888M)
AS SPECIAL BUSINESS
To consider and, if thought fit, to pass the following Resolutions 7 to 9 with or without amendments as ordinary resolutions:
8. Authority to issue shares in the capital of the Company pursuant to Section 161 of the Companies Act, Cap. 50 and Rule 806 of the Listing Manual of the Singapore Exchange Securities Trading Limited.
That pursuant to Section 161 of the Companies Act, Cap. 50 (the “Companies Act”) and Rule 806 of the Listing Manual of the Singapore Exchange Securities Trading Limited (“SGX-ST”), authority be and is hereby given to the Directors of the Company to:
(a) (i) issue shares in the Company (“Shares”) whether by way of rights, bonus or otherwise; and/or
(ii) make or grant offers, agreements or options (collectively, “Instruments”) that might or would require shares to be issued, including but not limited to the creation and issue (as well as adjustments to) options, warrants, debentures or other instruments convertible into shares,
at any time and upon terms and conditions and for such purposes and to such persons as the Directors of the Company may in their absolute discretion deem fit; and
(b) (notwithstanding the authority conferred by this Resolution may have ceased to be in force) issue shares in pursuance of any Instrument made or granted by the Directors of the Company while this Resolution was in force,
(the “Share Issue Mandate”)
Provided that:
(1) the aggregate number of shares (including shares to be issued in pursuance of the instruments, made or granted pursuant to this Resolution) and Instruments to be issued pursuant to this Resolution shall not exceed 50% of the total number of issued shares (excluding treasury shares) in the capital of the Company (as calculated in accordance with sub-paragraph (2) below), of which the aggregate number of shares and Instruments to be issued other than on a pro rata basis to existing shareholders of the Company shall not exceed 20% of the total number of issued shares (excluding treasury shares) in the capital of the Company (as calculated in accordance with sub-paragraph (2) below);

149
NOTICE OF ANNUAL GENERAL MEETING
PSC CORPORATION LTDANNUAL REPORT 2011
PSC CORPORATION LTD.(INCORPORATED IN THE REPUBLIC OF SINGAPORE)(COMPANY REGISTRATION NO. 197400888M)
(2) (subject to such calculation as may be prescribed by the SGX-ST), for the purpose of determining the aggregate number of shares and Instruments that may be issued under sub-paragraph (1) above, the percentage of issued shares and Instruments shall be based on the total number of issued shares (excluding treasury shares) in the capital of the Company at the time of the passing of this Resolution, after adjusting for:
(i) new shares arising from the conversion or exercise of the Instruments or any convertible securities;
(ii) new shares arising from exercising share options or vesting of share awards outstanding and subsisting at the time of the passing of the Resolution;
(iii) any subsequent bonus issue, consolidation or subdivision of shares;
(3) in exercising the Share Issue Mandate conferred by this Resolution, the Company shall comply with the provisions of the Listing Manual of the SGX-ST for the time being in force (unless such compliance has been waived by the SGX-ST) and the Articles of Association of the Company; and
(4) unless revoked or varied by the Company in general meeting, the Share Issue Mandate shall continue in force (i) until the conclusion of the next Annual General Meeting of the Company or the date by which the next Annual General Meeting of the Company is required by law to be held, whichever is the earlier or (ii) in the case of shares to be issued in pursuance of the Instruments, made or granted pursuant to this Resolution, until the issuance of such shares in accordance with the terms of the Instruments.
[Resolution 7][See Explanatory Note (2)]
9. Authority to issue shares under the PSC Executives’ Share Option Scheme
That pursuant to Section 161 of the Companies Act, the Directors be and are hereby authorised and empowered to offer and grant options under the PSC Executives’ Share Option Scheme (the “Scheme”) and to allot and issue from time to time such number of shares in the capital of the Company as may be required to be issued pursuant to the exercise of the options granted by the Company under the Scheme, whether granted during the subsistence of this authority or otherwise, provided always that the aggregate number of additional ordinary shares to be issued pursuant to the Scheme shall not exceed 15% of the total number of issued shares (excluding treasury shares) in the capital of the Company from time to time and that such authority shall, unless revoked or varied by the Company in a general meeting, continue in force until the conclusion of the next Annual General Meeting of the Company or the date by which the next Annual General Meeting of the Company is required to be held, whichever is earlier.
[Resolution 8][See Explanatory Note (3)]

150
NOTICE OF ANNUAL GENERAL MEETING
PSC CORPORATION LTDANNUAL REPORT 2011
PSC CORPORATION LTD.(INCORPORATED IN THE REPUBLIC OF SINGAPORE)(COMPANY REGISTRATION NO. 197400888M)
10. Renewal of Share Buyback Mandate
That for the purposes of Sections 76C and 76E of the Companies Act, the Directors of the Company be and are hereby authorised to make purchases or otherwise acquire issued ordinary shares fully paid in the capital of the Company from time to time (whether by way of market purchases or off-market purchases on an equal access scheme) of up to 8% of the total number of issued shares (excluding treasury shares) in the capital of the Company (as ascertained as at the date of Annual General Meeting of the Company) at the price of up to but not exceeding the Maximum Price as defined in the Company’s letter to the shareholders dated 12 April 2012 (the “Letter”) in accordance with the terms of the Share Buyback Mandate set out in the Letter, and this mandate shall, unless revoked or varied by the Company in general meeting, continue in force until the conclusion of the next Annual General Meeting of the Company or the date by which the next Annual General Meeting of the Company is required by law to be held, whichever is earlier. [Resolution 9]
[See Explanatory Note (4)]
NOTICE OF BOOKS CLOSURE
NOTICE IS HEREBY GIVEN that the Share Transfer Books and Register of Members of PSC Corporation Ltd (the “Company”) will be closed on 29 May 2012 for the purpose of determining the entitlements to the dividend to be proposed at the Annual General Meeting of the Company to be held on 27 April 2012.
Duly completed registrable transfers received by the Company’s Share Registrar, M&C Services Private Limited, of 138 Robinson Road, #17-00 The Corporate Office, Singapore 068906 up to 5.00 p.m. on 28 May 2012 will be registered to determine members’ entitlements to the said dividend.
Payment of the dividend, if approved by the members at the Annual General Meeting to be held on 27 April 2012 will be made on 12 June 2012.
BY ORDER OF THE BOARD
Chong Eng WeeGo Kim Chuan MarkJoint Company SecretariesSingapore
12 April 2012

151
NOTICE OF ANNUAL GENERAL MEETING
PSC CORPORATION LTDANNUAL REPORT 2011
PSC CORPORATION LTD.(INCORPORATED IN THE REPUBLIC OF SINGAPORE)(COMPANY REGISTRATION NO. 197400888M)
NOTES:–
1) A member entitled to attend and vote at the Meeting is entitled to appoint a proxy to attend and vote in his stead.
2) A proxy need not be a member of the Company.
3) The instrument appointing a proxy shall, in the case of an individual, be signed by the appointor or his attorney, and in case of a corporation shall be either under its common seal or signed by its attorney or a duly authorised officer on behalf of the corporation.
4) The instrument appointing a proxy must be deposited at the registered office of the Company at 348 Jalan Boon Lay, Singapore 619529 not less than forty-eight (48) hours before the time appointed for holding the Annual General Meeting.
EXPLANATORY NOTES ON THE ORDINARY AND SPECIAL BUSINESS TO BE TRANSACTED:–
1) Dr Allan Yap is the Executive Director and Executive Chairman of the Company. Mr Lien Kait Long, upon re-election as Director of the Company, remains as Chairman of the Nominating Committee and member of the Audit Committee and will be considered independent for the purpose of Rule 704(8) of the Listing Manual of the SGX-ST.
2) The proposed Ordinary Resolution 7, if passed, will empower the Directors of the Company, from the date of this Annual General Meeting until the date of the next Annual General Meeting of the Company, or the date by which the next Annual General Meeting of the Company is required by law to be held or such authority is varied or revoked by the Company in general meeting, whichever is the earlier, to issue shares, make or grant instruments convertible into shares and to issue shares pursuant to such instruments, up to a number not exceeding, in total 50% of the total number of issued shares (excluding treasury shares) in the capital of the Company, of which up to 20% may be issued other than on a pro-rata basis to existing shareholders of the Company.
For determining the aggregate number of shares that may be issued, the percentage of issued shares in the capital of the Company will be calculated based on the total number of issued shares (excluding treasury shares) in the capital of the Company at the time this Ordinary Resolution is passed after adjusting for new shares arising from the conversion or exercise of the Instruments or any convertible securities, the exercise of share options or the vesting of share awards outstanding or subsisting at the time when this Ordinary Resolution is passed and any subsequent consolidation or subdivision of shares.
3) The proposed Ordinary Resolution 8, if passed, will empower the Directors to issue shares pursuant to the exercise of Options granted under the PSC Executives’ Share Option Scheme 2003 (the “Scheme”) which was approved at the Extraordinary General Meeting of the Company held on 8 July 2003. Pursuant to the Extraordinary General Meeting of the Company held on 28 September 2007, the maximum number of shares issued or to be issued for Options under the Scheme had been changed to 15% of the total number of issued shares (excluding treasury shares) in the capital of the Company.
4) The proposed Ordinary Resolution 9, if passed, will empower the Directors to purchase or acquire, from the date of the above meeting to the date of the next Annual General Meeting, an aggregate amount not exceeding eight per cent (8%) of the issued share capital of the Company (excluding any ordinary shares held as treasury shares by the Company from time to time) as at the date of Resolution 9. More details of the Share Buyback Mandate to be renewed are set out in the Letter to shareholders enclosed with this Notice.

152
常年股東大會通告
PSC CORPORATION LTDANNUAL REPORT 2011
普威集團有限公司(於新加坡共和國註冊成立)(公司註冊號碼197400888M)
,
, 。 :-
普通事項
。 [決議案1]
。 [決議案2]
, :
[決議案3a][決議案3b]
[見附註(1)]
,
。 [決議案4]
。 : [決議案5]
, 。 [決議案6]
。
特殊事項
, :-
根據公司法第50章第161節以及《新加坡證券交易所上市指南》第806條所規定授權發行公司股本中的股份。
,
:-
, ;
,
,
, ;

153
常年股東大會通告
PSC CORPORATION LTDANNUAL REPORT 2011
普威集團有限公司(於新加坡共和國註冊成立)(公司註冊號碼197400888M)
,
,
:
, ,
;
, ,
, ,
:
;
;
;
,
;
, ,
, , ;
, 。
[決議案7][見附註(2)]
9. 授權按普威執行人員認股權計劃發行股份
,
。 , ,
,
, ,
, 。
[決議案8][見附註(3)]

154
常年股東大會通告
PSC CORPORATION LTDANNUAL REPORT 2011
普威集團有限公司(於新加坡共和國註冊成立)(公司註冊號碼197400888M)
10. 股票回購授權更新
,
, ,
,
。
, ,
, 。
[決議案9]
[見附註(4)]
登記截止日期通告
,
。
, , ,
, , ,
。
, 。

155
常年股東大會通告
PSC CORPORATION LTDANNUAL REPORT 2011
普威集團有限公司(於新加坡共和國註冊成立)(公司註冊號碼197400888M)
附註:
, 。
。
, ; ,
。
,
, 。
普通及特別事項附註:
。 ,
, ,
。
, ;
,
, ,
,
。
, ,
,
。
,
’。 ,
,
。
, ,
, , 。

This page has been intentionally left blank
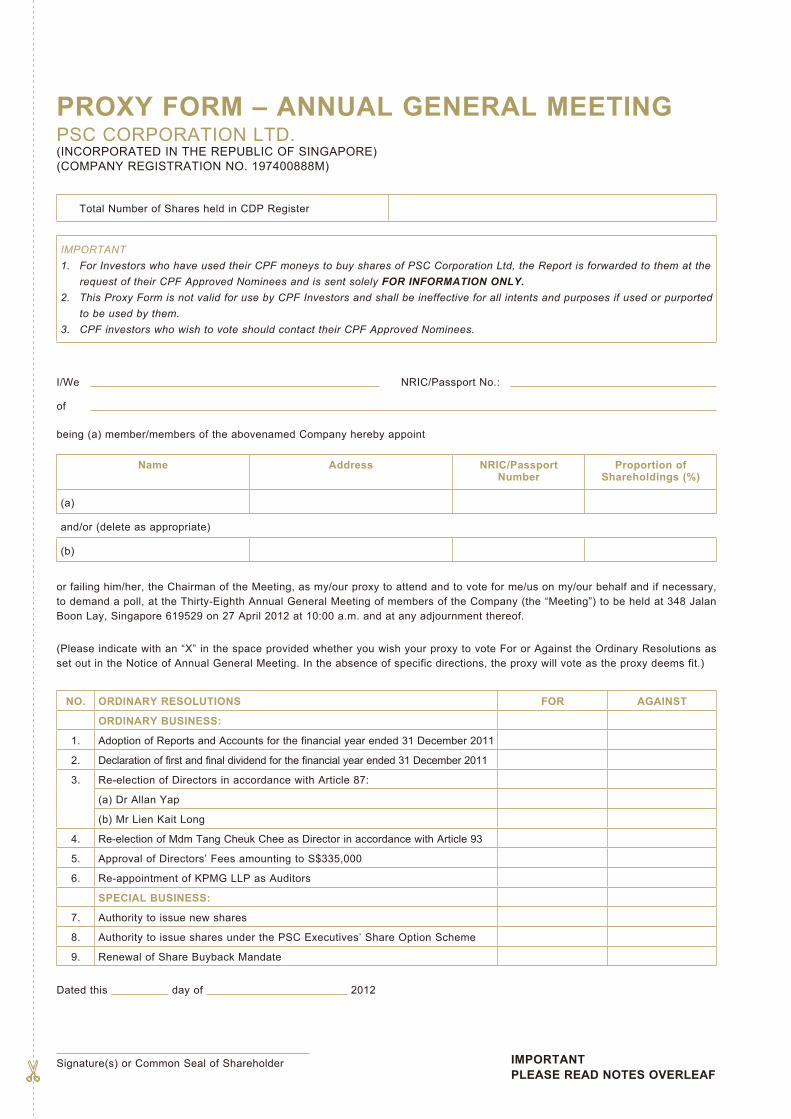
PROXY FORM – ANNUAL GENERAL MEETINGPSC CORPORATION LTD.(INCORPORATED IN THE REPUBLIC OF SINGAPORE)(COMPANY REGISTRATION NO. 197400888M)
Total Number of Shares held in CDP Register
IMPORTANT1. For Investors who have used their CPF moneys to buy shares of PSC Corporation Ltd, the Report is forwarded to them at the
request of their CPF Approved Nominees and is sent solely FOR INFORMATION ONLY.2. This Proxy Form is not valid for use by CPF Investors and shall be ineffective for all intents and purposes if used or purported
to be used by them.3. CPF investors who wish to vote should contact their CPF Approved Nominees.
I/We NRIC/Passport No.:
of
being (a) member/members of the abovenamed Company hereby appoint
Name Address NRIC/Passport Number
Proportion of Shareholdings (%)
(a)
and/or (delete as appropriate)
(b)
or failing him/her, the Chairman of the Meeting, as my/our proxy to attend and to vote for me/us on my/our behalf and if necessary, to demand a poll, at the Thirty-Eighth Annual General Meeting of members of the Company (the “Meeting”) to be held at 348 Jalan Boon Lay, Singapore 619529 on 27 April 2012 at 10:00 a.m. and at any adjournment thereof.
(Please indicate with an “X” in the space provided whether you wish your proxy to vote For or Against the Ordinary Resolutions as set out in the Notice of Annual General Meeting. In the absence of specific directions, the proxy will vote as the proxy deems fit.)
NO. ORDINARY RESOLUTIONS FOR AGAINST
ORDINARY BUSINESS:
1. Adoption of Reports and Accounts for the financial year ended 31 December 2011
2. Declaration of first and final dividend for the financial year ended 31 December 2011
3. Re-election of Directors in accordance with Article 87:
(a) Dr Allan Yap
(b) Mr Lien Kait Long
4. Re-election of Mdm Tang Cheuk Chee as Director in accordance with Article 93
5. Approval of Directors’ Fees amounting to S$335,000
6. Re-appointment of KPMG LLP as Auditors
SPECIAL BUSINESS:
7. Authority to issue new shares
8. Authority to issue shares under the PSC Executives’ Share Option Scheme
9. Renewal of Share Buyback Mandate
Dated this day of 2012
Signature(s) or Common Seal of Shareholder IMPORTANTPLEASE READ NOTES OVERLEAF

Notes:
1) Please insert the total number of shares in the Company held by you, either in the Depository Register (as defined in Section 130A of the Companies Act) or in the Register of Members, or both. If no number is inserted, the proxy form will be deemed to relate to all the shares in the Company held by you.
2) A member entitled to attend and vote at the Meeting is entitled to appoint a proxy to attend and vote on his behalf. A proxy need not be a member of the Company. Where a member appoints more than one proxy, the appointments shall be deemed invalid unless he specifies the proportion of his holding (expressed as a percentage of the whole) to be represented by each proxy.
3) If any other proxy other than the Chairman of the Meeting is to be appointed, please delete the words “The Chairman of the Meeting” and insert the name(s) and particulars of the proxy/proxies to be appointed in the box provided. If the box is left blank or is incomplete, the Chairman of the Meeting shall be deemed to be appointed as your proxy. If the Chairman of the Meeting is appointed as a proxy, this instrument shall be deemed to confer on him the right to nominate a person to vote on his behalf on a show of hands.
4) The instrument appointing a proxy shall, in the case of an individual, be signed by the appointor or his attorney duly authorised in writing. In the case of a corporation, it must be executed either under its common seal or signed by its attorney or a duly authorised officer on behalf of the corporation. A corporation who is a member may authorise by a resolution of its directors or other governing body such person as it thinks fit to act as its representative at the Meeting in accordance with Section 179 of the Companies Act.
5) The instrument appointing a proxy must be deposited at the registered office of the Company at 348 Jalan Boon Lay, Singapore 619529 not less than forty-eight (48) hours before the time appointed for holding the Meeting.
6) The Company shall be entitled to reject an instrument appointing a proxy/proxies if it is incomplete, improperly completed, illegible, or where the true intentions of the appointor is not ascertainable from the instructions contained in the instrument. The Company may also reject any instrument appointing a proxy/proxies where the appointor is not shown to have shares in the Company entered against his name in the Depository Register as at 48 hours before the time appointed for holding the Meeting, as certified by The Central Depository (Pte) Limited to the Company.

This page has been intentionally left blank

This page has been intentionally left blank

CONTENTS01 Vision and Mission
02 Executive Chairman’s Message
08 Board of Directors
12 Group Financial Summary
15 Operational Review
32 Corporate Information
33 Corporate Governance Statement53 Statutory Accounts141 Supplementary Information145 Shareholding Statistics147 Notice of Annual General Meeting
Designed and produced by
(65) 6578 6522

PS
C C
OR
PO
RA
TIO
N LT
D
PSC CORPORATION LTDCompany Registration No: 197400888M
Incorporated in the Republic of Singapore
348 Jalan Boon Lay Singapore 619529Tel: +65 6268 4822 Fax: +65 6266 2607
www.psc.com.sg
AN
NU
AL R
EPO
RT 2
01
1 A N N U A L R E P O R T
F I R S T I N F A M I LY E S S E N T I A L S
2011