prudential bank limited annual report, 2012
TRANSCRIPT

Your Trusted and Dependable Partner
Annual Report, 2012
1
PRUDENTIAL BANK LIMITED
The Head of Marketing & Corporate Affairs Department, Mrs. Akosua Boahen, receiving one of four awards won by the Bank at the 2012 Ghana Banking Awards dinner held at the Conference Center in Accra. Looking on are, from left: Mr. Frank Ankamah, Head of e-Banking Department, Mrs. Mary Brown, Deputy Managing Director (Banking Operations), Mr. Samual Larbi, Head of Internal Audit Department, Mrs. Lydia Bredu-Appiah, Odorkor Branch Manager and Mr. Emmanuel Nteh, Tema Community-One Branch Manager.
The four awards were Best Bank, Long-term loan financing; Best Bank, Medium-Term Loan financing; 2nd runner-up, Best Bank – Competitive pricing; 2nd runner up, Best Bank – Retail Banking.

Your Trusted and Dependable Partner 2
Annual Report, 2012PRUDENTIAL BANK LIMITED

Your Trusted and Dependable Partner
Annual Report, 2012
3
PRUDENTIAL BANK LIMITED
PAGE
v Corporate Information ..... ..... ..... ..... 5-17
v Performance at a Glance ..... ..... ..... ..... 19-23
Five (5) Years’ Summary ..... ..... ..... ..... 23
v Chairman’s Statement ..... ..... ..... ..... 25-32
v Report of the Directors ..... ..... ..... ..... 33-36
v Statement of Directors’ Responsibilities ..... ..... ..... ..... 37
v Report of the Auditors ..... ..... ..... ..... 39-42
v Consolidated Financial Statements and Notes ..... ..... ..... ..... 43-96
Consolidated Statement of Comprehensive Income ..... ..... ..... ..... 45
Consolidated Statement of Financial Position ..... ..... ..... ..... 46
Consolidated Statement of Cash Flows ..... ..... ..... ..... 47
Consolidated Statement of Changes in Equity ..... ..... ..... ..... 48-49
Notes to the Consolidated Financial Statements ..... ..... ..... ..... 50-96
Risk Management ..... ..... ..... ..... 82-96
v Branch Network ..... ..... ..... ..... 97-102
v Correspondent Banks ..... ..... ..... ..... 103
v Notice of Annual General Meeting ..... ..... ..... ..... 104
CONTENTS

Your Trusted and Dependable Partner 4
Annual Report, 2012PRUDENTIAL BANK LIMITED

Your Trusted and Dependable Partner
Annual Report, 2012
5
PRUDENTIAL BANK LIMITED
Corporate Information

Your Trusted and Dependable Partner 6
Annual Report, 2012PRUDENTIAL BANK LIMITED
Your Trusted and Dependable Partner
Annual Report, 2012
7
PRUDENTIAL BANK LIMITED
Prudential Bank Limited (PBL) is a private limited liability company
incorporated in Ghana under the Companies Code, 1963 (Act 179). The
company is domiciled in Ghana with its registered office at No. 8 Nima
Avenue, Kanda, Ring Road Central, Accra.
The Bank is licensed to carry on the business of banking and to provide
ancillary services.
The Bank has two wholly owned subsidiary companies, both incorporated
in Ghana - PBL Properties Limited and Prudential Securities Limited.
PBL Properties Limited was established to acquire and develop banking
premises for the Bank and also manage the auxiliary staff and facilities.
Prudential Securities Limited on the other hand, is engaged in stockbrokerage, fund management, corporate finance and business advisory services as well as equity and economic research.

Your Trusted and Dependable Partner 8
Annual Report, 2012PRUDENTIAL BANK LIMITED

Your Trusted and Dependable Partner
Annual Report, 2012
9
PRUDENTIAL BANK LIMITED
Vision, Mission& Core Values

Your Trusted and Dependable Partner 10
Annual Report, 2012PRUDENTIAL BANK LIMITED

Your Trusted and Dependable Partner
Annual Report, 2012
11
PRUDENTIAL BANK LIMITED
Vision
To be a successful indigenous and the preferred Bank in Ghana offering the most remunerative banking services to the public.
Mission
To provide domestic and international banking services with a strategic focus on project financing, trade financing, export development and SME financing. PBL is committed to playing a positive and innovative role in the financial intermediation process and, most importantly, to offer the best banking services to the business community.
Values
We continue to build a corporate culture that respects and values the unique strengths, weaknesses and cultural differences of the entities that we deal with.
Quality, Creativity and Innovation are the hallmarks of Prudential Bank:
• Customers first – our customers’ interests are our utmost concern; we build strong relationships with our customers and provide quality services;
• Integrity – this is our trademark; we demonstrate fairness and honesty in all we do and observe confidentiality at all times;
• Innovation and creativity – we provide unique business solutions for our customers;
• Commitment to human capital development – the welfare of our employees is paramount; we are committed to training, developing careers based on merit and rewarding achievement;
• Social responsibility – we invest in our communities and build relations.

Your Trusted and Dependable Partner 12
Annual Report, 2012PRUDENTIAL BANK LIMITED

Your Trusted and Dependable Partner
Annual Report, 2012
13
PRUDENTIAL BANK LIMITED
Board of Directors, Officials & Registered Office

Your Trusted and Dependable Partner 14
Annual Report, 2012PRUDENTIAL BANK LIMITED

Your Trusted and Dependable Partner
Annual Report, 2012
15
PRUDENTIAL BANK LIMITED
John S. AddoChairman
S. Sekyere-AbankwaM. D.
Joana F. DicksonMember
Aretha DukuMember
Nortey K. OmaboeMember
S. Nkansa-BoadiMember
K. Agyei-GyamfiMember
K. Kwakye-MintahMember
Stephen A. AsareMember

Your Trusted and Dependable Partner 16
Annual Report, 2012PRUDENTIAL BANK LIMITED

Your Trusted and Dependable Partner
Annual Report, 2012
17
PRUDENTIAL BANK LIMITED
AUDITORS:Asamoa Bonsu & Co,Chartered Accountants,C257/9, Asylum DownP.O. Box AN-7751,Accra
POSTAL ADDRESS:Private Mail Bag General Post OfficeAccra.
REGISTERED OFFICE:8 Nima Avenue Ring Road CentralAccra, Ghana
Tel: 233-302-781200-6Fax: 233-302-781210TLX: 233-302-2954 PBL GH 233-302-2087 PBL GHCable: PrubankSwiftcode: PUBKGHACE-mail: [email protected]
Website: www.prudentialbank.com.gh
PRUDENTIAL BANK LTD.

Your Trusted and Dependable Partner 18
Annual Report, 2012PRUDENTIAL BANK LIMITED

Your Trusted and Dependable Partner
Annual Report, 2012
19
PRUDENTIAL BANK LIMITED
Performance at a Glance

Your Trusted and Dependable Partner 20
Annual Report, 2012PRUDENTIAL BANK LIMITED
Your Trusted and Dependable Partner
Annual Report, 2012
21
PRUDENTIAL BANK LIMITED
195 251
339
459 555
- 100 200 300 400 500 600
2008 2009 2010 2011 2012
GH¢'m
GROWTH IN DEPOSITS
157 186 222 293
425
-
100
200
300
400
500
2008 2009 2010 2011 2012
GH¢'m
GROWTH IN LOANS
281 340 406
550 677
-
200
400
600
800
2008 2009 2010 2011 2012
GH¢'m
GROWTH IN TOTAL ASSETS
16 25
39 47
85
- 20 40 60 80
2008 2009 2010 2011 2012
GH¢'m
GROWTH IN NETWORTH
7 4
5
12 13
-
5
10
15
2008 2009 2010 2011 2012
GH¢'m
GROWTH IN PRE-TAX PROFIT
44 60 67
82 107
- 20 40 60 80
100
2008 2009 2010 2011 2012
GH¢'m
GROWTH IN GROSS INCOME
60%
27%
13%
2012 INCOME SOURCESNET INTEREST INCOMECOMM & FEES
OTHER INCOME74%
8%18%
2012 INCOME DISTRIBUTION
OPERATING EXP.
LOAN LOSSES
PRE-TAX PROFIT

Your Trusted and Dependable Partner 22
Annual Report, 2012PRUDENTIAL BANK LIMITED

Your Trusted and Dependable Partner
Annual Report, 2012
23
PRUDENTIAL BANK LIMITED
SUMMARY OF PERFORMANCE FROM 2008 – 2012
PRUDENTIAL BANK FIVE YEARS SUMMARY OF PERFORMANCE FROM 2008 - 20122012 2011 2010 2009 2008
GH¢'000 GH¢'000 GH¢'000 GH¢'000 GH¢'000STATEMENT OF COMPREHENSIVE INCOMEInterest Income 78,263 58,598 56,097 49,137 34,568Interest Expense (35,466) (26,564) (29,872) (30,032) (17,239)NET INTEREST INCOME 42,797 32,034 26,225 19,105 17,329Commissions and Fees 19,464 15,126 9,022 8,102 5,576Other Operating Income 8,919 8,147 1,735 2,761 3,989TOTAL INCOME 71,180 55,307 36,982 29,968 26,893Operating Expenses (52,775) (40,036) (29,797) (24,439) (19,685)Charge for bad & doubtful debts (5,457) (3,528) (1,688) (1,499) (597)PROFIT BEFORE TAX 12,948 11,743 5,497 4,030 6,611Taxation (3,332) (3,506) (1,490) (594) (2,217)NET PROFIT AFTER TAX 9,616 8,237 4,008 3,436 4,394Other Comprehensive Income 0 0 0 5,500 0TOTAL COMPREHENSIVE INCOME 9,616 8,237 4,008 8,936 4,394
INCOME SURPLUS ACCOUNTBalance at 1st January 5,095 1,684 6,460 2,278 672Retained Profit 9,616 8,237 4,008 3,436 4,394
14,711 9,921 10,467 5,713 5,066Transfer to Statutory Reserve Fund (4,808) (4,119) (1,002) (859) (2,197)Proposed Dividend 0 0 0 0 0Regulatory Loan Impairment Reserve (231) (708) 219 1,605 (591)Transfer to Stated Capital (9,000) 0 (8,000) 0 0Balance at 31st December 671 5,095 1,684 6,460 2,278
STATEMENT OF FINANCIAL POSITIONASSETSCash and Balances with Bank of Ghana 79,645 52,931 39,970 30,377 18,974Government Securities 50,371 65,718 36,843 33,932 26,865Due from other Banks and Financial Inst. 80,143 99,627 70,231 59,493 57,502Loans and Advances to Customers 425,207 293,261 221,600 185,561 156,896Investments in Subsidiaries 6,366 6,366 6,031 6,031 531Other Assets 5,016 4,388 5,039 9,324 9,249Taxation 2,846 1,043 409 274 0
649,594 523,334 380,122 324,992 270,017Property, Plant and Equipment 27,012 26,445 26,370 14,864 10,963TOTAL ASSETS 676,607 549,779 406,492 339,857 280,980
LIABILITIES AND SHAREHOLDERS' FUNDDeposits and Current Accounts 555,195 459,460 339,303 251,276 195,287Interest payable and Other liabilities 21,848 27,822 8,676 17,545 37,521Taxation 1,450 1,383 1,266 1,053 1,780
578,493 488,665 349,245 269,875 234,588Borrowings 13,019 13,988 18,357 45,100 30,447TOTAL LIABILITIES 591,512 502,653 367,602 314,975 265,034
SHAREHOLDERS’ FUNDSStated Capital 62,453 25,100 25,100 7,100 7,100Income Surplus Account 671 5,094 1,684 6,460 2,278Statutory Reserve Fund 15,385 10,577 6,459 5,457 4,598Regulatory Loan Impairment Reserve 1,086 855 147 365 1,970Capital Reserves 5,500 5,500 5,500 5,500 0
85,095 47,127 38,890 24,881 15,946TOTAL LIABILITIES AND SHAREHOLDERS'FUNDS 676,607 549,779 406,492 339,857 280,980Managed Funds on behalf of Governtment of Ghana and Danida 6,126 6,126 5,754 5,349 4,842
Liabilities on Guarantees and Indeminities 44,244 44,244 15,569 14,988 13,390

Your Trusted and Dependable Partner 24
Annual Report, 2012PRUDENTIAL BANK LIMITED

Your Trusted and Dependable Partner
Annual Report, 2012
25
PRUDENTIAL BANK LIMITED
Chairman’s Statement

Your Trusted and Dependable Partner 26
Annual Report, 2012PRUDENTIAL BANK LIMITED

Your Trusted and Dependable Partner
Annual Report, 2012
27
PRUDENTIAL BANK LIMITED
1.0 INTRODUCTION
Distinguished Shareholders and Directors, it is my pleasure once again to welcome you to the 16th Annual General Meeting of Prudential Bank Limited and to report on the performance of your Bank for the year ended 31st December 2012.
2.0 THE GLOBAL ECONOMIC ENVIRONMENT
The world economy continues to struggle four years after the onset of the global financial crisis. According to the World Bank Global Economic Prospects Report for January 2013, developing economies are still the main drivers of global growth.
The report however stated that there are indications that the cumulative effect of measures taken by various governments to improve fiscal
sustainability in the advanced economies in the last four years has started to result in some improvements in global financial markets.
Consequently, international capital flows to developing countries are beginning to show signs of improvement and developing country stock markets are also starting to show increased levels of activity.
In the United States, investment and industrial activity show unusual weakness mainly due to uncertainty over the stance of fiscal policy and the economic issues surrounding the fiscal cliff. On the other hand, activity in Europe ceased to contract at previously alarming rates from the second half of 2012.
Overall, the global economic environment remains fragile and prone to further disappointment, although the balance of risks is now less skewed to the downside than it has been in recent years.
The January 2013 World Bank report projected global growth to improve slightly from 2.3% in Year 2012 to 2.4% in Year 2013 and gradually strengthen to 3.1% and 3.3% in Years 2014 and 2015 respectively.
3.0 OVERVIEW OF THE GHANAIAN ECONOMY IN YEAR 2012 The Ghanaian economy expanded at a modest pace during the Year 2012. According
to the Government’s 2013 budget, GDP grew at a provisional 7.1% in Year 2012, down from 14.4% in Year 2011. The rate of inflation increased marginally from 8.6% at the end of Year 2011 to 8.8% at the end of December 2012.
The first half of Year 2012 witnessed increased exchange rate volatility. The cedi depreciated by 17.5% against the US dollar by the end of October 2012 compared to a depreciation of 3.9% in the same period in Year 2011. The rate of depreciation, however, slowed in the last two quarters of Year 2012 as a result of various policy measures introduced by Bank of Ghana in April 2012 to stem the rapid fall.

Your Trusted and Dependable Partner 28
Annual Report, 2012PRUDENTIAL BANK LIMITED
According to the Bank of Ghana Monetary and Financial Developments Report for November 2012, the cedi exchange rate remains stable and the general economic outlook is positive with strong continuing investor interest in domestic assets.
Interest Rates
Interest rates rose significantly throughout the year 2012. On the money market, the 91-day and 182-day Treasury bill rates increased from 10.67% and 11.25% respectively at the end of December 2011 to 23.12% and 22.99% at the end of December 2012.
The average three-month time deposit rates of commercial banks increased to 12.5% at the end of December 2012 from 7.8% at the end of December 2011 while average lending rates decreased marginally to 25.7% from 25.9% at the end of December 2011 thus giving rise to a narrowing of the lending deposit rate spread to 13.2% at the end of December 2012 from 18.1% at the end of December 2011.
4.0 PERFORMANCE OF PBL IN YEAR 2012
4.1 Branch Development and New Products
Distinguished Shareholders and Directors, in line with its plan to make banking easier and convenient for customers, your bank added one branch located at Mataheko to the branch network to bring the total number to 29 branches and 2 Agencies.
The expansion of the Bank’s electronic banking delivery channels continued with the introduction of the Internet Banking service in November 2012.
The implementation of Visa debit card services is currently ongoing and the full roll-out is expected to take place by the end of Year 2013.
4.2 Mobilization of Resources
4.2.1 Deposits
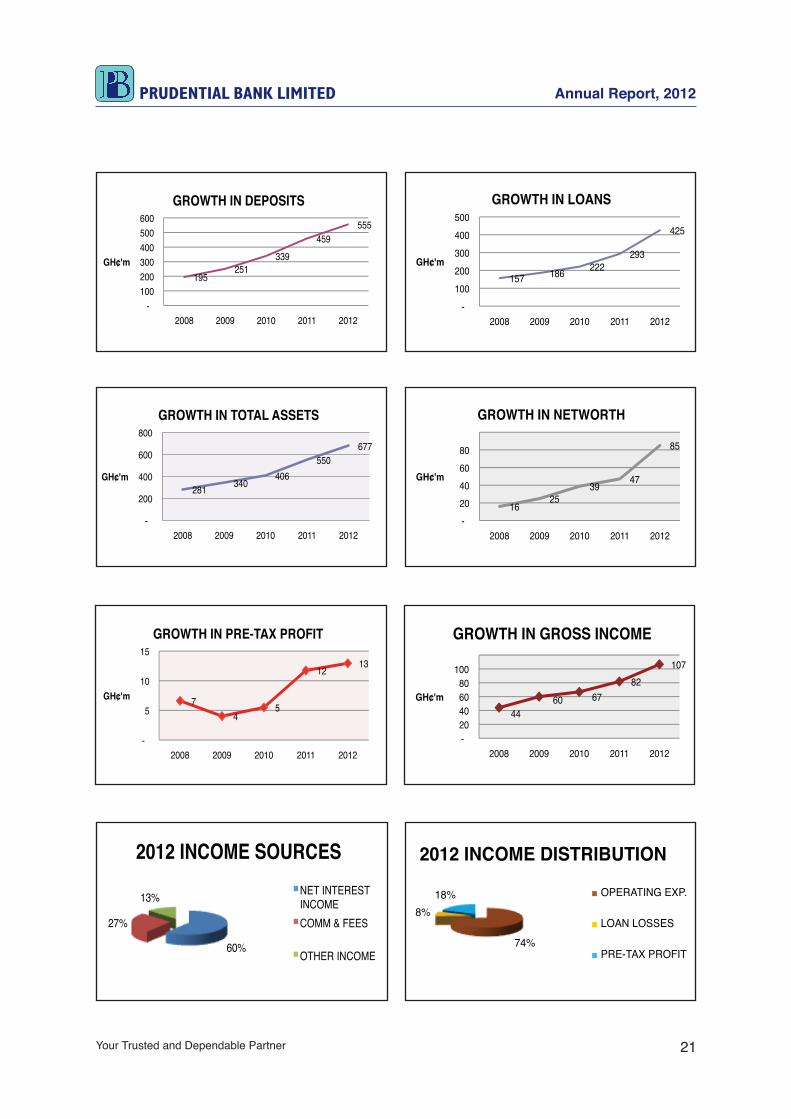
During the year under review, the Bank grew its deposits by 21% from GH¢459.4million at the end of Year 2011 to GH¢555.1million at the end of Year 2012. Time and Savings deposits which together accounted for about 58% of total deposits were the main source of the growth.
4.2.2 Shareholders’ Funds
Shareholders’ funds increased from GH¢47.1million at the end of Year 2011 to GH¢85million at the end of Year 2012 representing a growth rate of 80%. The significant growth was due to the injection of fresh capital amounting to GH¢28.3million and an increase in retained earnings.
Your Trusted and Dependable Partner
Annual Report, 2012
29
PRUDENTIAL BANK LIMITED
4.3 Allocation of Resources
As in previous years, the Bank continued to make prudent use of its resources during the year by ensuring that the risks and returns associated with its asset allocation decisions were well managed to minimize losses and maximize profits whilst ensuring that daily operational and regulatory liquidity requirements were met.
The total assets of the Bank grew by 23% from GH¢549.7 million at the end of Year 2011 to GH¢676.6 million at the end of Year 2012. This growth was funded by deposits, borrowings and shareholders’ funds.
4.3.1 Investments
The Bank invested an average of GH¢50million in government securities during Year 2012. This was necessary for liquidity management purposes in line with the growth in the deposits and loan portfolio.
4.3.2 Lending Operations
The loans and advances portfolio registered an increase of 45% over the previous year; from GH¢293.2million at the end of Year 2011 to GH¢425.2 million at the end of Year 2012.
4.4 Results of Operations
Distinguished Shareholders and Directors, notwithstanding the intense competition in the Industry, your Bank was able to register an improved level of profit in Year 2012. Your Bank’s pre-tax profit increased by 10% to GH¢12.95m for the Year 2012 from GH¢11.74m in Year 2011.
The profit after tax for the year was GH¢9.6m which translates into a return on assets (ROA) of 1.57% and return on equity (ROE) of 14.5%. These are lower when compared to the 2011 ROA of 1.7% and ROE of 18.95% as a result of the increase in the Bank’s Stated Capital in December 2012 to meet the Bank of Ghana minimum capital requirement.
The additional equity injection is expected to impact positively on the Bank’s operational results in subsequent years.
4.5 Dividend and Capital
Distinguished ladies and gentlemen, even though your Bank was able to register an improved level of profit in Year 2012, the Directors were constrained by the Bank of Ghana requirement to increase the Bank’s capital to GH¢60m by the end of 2012. The Board of Directors is therefore unable to recommend the payment of dividend to Ordinary Shareholders. However Preference Shareholders will be paid dividends.
Your Trusted and Dependable Partner 30
Annual Report, 2012PRUDENTIAL BANK LIMITED
4.6 Corporate Social Responsibility
Building relations and investing in our communities are key aspects of your bank’s core values and consequently, your bank increased its funding support for education and other social needs from GH¢109,683 in 2011 to GH¢251,972 in 2012.
Some of the beneficiaries were:
v Kwame Nkrumah University of Science & Technology; v National Cardiothoracic Centre; v University of Cape Coast; v Methodist Church of Ghana; v China Europe International Business School; v Dr Robert Mitchell Memorial Foundation for Childhood Cancer Programme; v Presbyterian Church of Ghana; v 37 Military Hospital for the refurbishment of Neonatal Intensive Care Unit;
4.7 Changes in Directors and Shareholders
The Bank’s board of directors currently consists of nine directors representing the interests of the Bank’s Shareholders.
As part of the process of increasing the Bank’s stated capital to GH¢60million to comply with the Bank of Ghana minimum capital requirement at the end of December 2012, two new shareholders were invited to acquire shares in the Bank. This resulted in an increase in the total number of shareholders to eleven.
The two new shareholders, namely Messrs Kofi Otu Esson and Frank Owusu acquired a total of 13% of the Bank’s Share Capital. The combined holding of 13% entitles the new shareholders to a seat on the board in accordance with the Bank’s Governance Framework which specifies that a shareholding of 10% or more entitles the holder to one seat on the board.
In accordance with paragraph 60 of the Bank’s regulations, shareholders will be invited to approve an increase in the number of directors from nine to ten by ordinary resolution at the AGM.
4.8 Corporate Governance Distinguished Ladies and Gentlemen, sound and effective corporate governance is an
important element in creating and sustaining shareholder value. I am therefore pleased to report that the Board and its Audit & Risk Management Sub-Committee, during the year under review, performed their supervisory obligations effectively. The two bodies held regular scheduled meetings to deliberate on key operational issues, including quarterly management reports, internal control and Bank of Ghana reports which promoted effective control and direction of the Bank. In addition, the Board regularly reviewed the Bank’s risk exposure to inform its risk related decisions.

Your Trusted and Dependable Partner
Annual Report, 2012
31
PRUDENTIAL BANK LIMITED
5.0 OUTLOOK FOR THE FUTURE
5.1 The Ghanaian Economy
The Ghana Shared Growth and Development Agenda (GSGDA) 2010-2013, is in its last year of operation. According to the Government’s 2013 budget, a successor plan will be ready by July 2013. The theme of the Government’s 2013 budget is “Sustaining confidence in the future of the Ghanaian economy”.
According to the budget, the specific macroeconomic targets to be pursued in the medium-term (2013-2015), include an average GDP growth rate of at least 8% per annum, a single-digit rate of inflation, an overall average budget deficit of 5% of GDP and Gross International Reserves that will cover not less than 4 months import of goods and services.
5.2 The Banking Industry
Distinguished Shareholders and Directors, the Ghanaian Banking industry continues to record steady growth in assets, deposits, profitability and net worth.
In line with the programme of financial sector reforms, the Central Bank’s requirement for Ghanaian owned banks to attain a minimum capitalization of GH¢60million was met by all locally owned banks by the end of Year 2012.
The industry is still highly competitive with a total of 26 banks in operation, sixteen of which are foreign controlled and the remaining ten being Ghanaian controlled.
The industry continues to post steady growth statistics. At the end of December 2012, total assets reached GH¢27.2 billion, an increase of 20% on the December 2011 position of GH¢22.6 billion. The growth in assets was funded mainly by deposits which increased by 23.7% to GH¢19.8 billion from GH¢16 billion at the end of December 2011.
The Industry Capital Adequacy Ratio was 18.6% at the end of December 2012 compared to 17.4% a year earlier. Similarly, there was some improvement in the Non-performing Loans ratio which moved down to 13.2% at the end of 2012 from 14.2 % in December 2011.
A key development in the industry during the year was the requirement for banks to comply with Anti-money Laundering and the combating of the Financing of Terrorism (AML/CFT) laws and regulations. In this regard, Bank of Ghana and the Financial Intelligence Centre (FIC) jointly issued AML/CFT Guideline for banks and non-bank financial institutions in January 2012 in line with the AML Act to assist the financial institutions to design and implement their respective AML/CFT compliance programs.
The Central Bank continues to maintain strict control in the exercise of its regulatory and supervisory role to ensure that the industry leverages on the past positive developments whilst maintaining stability and efficiency.

Your Trusted and Dependable Partner 32
Annual Report, 2012PRUDENTIAL BANK LIMITED
5.3 Prudential Bank Limited
Distinguished Ladies and Gentlemen, the improved performance of your Bank in the Year 2012 was made possible by a significant growth in the volume of business, particularly in lending operations, trade finance and treasury operations whilst maintaining prudent control over expenditure.
Your Bank is currently in the second year of its fourth strategic plan which involves a number of initiatives for expanding the electronic banking delivery channels of the Bank, some of which have been implemented. These initiatives are expected to enhance the Bank’s overall services to make the Bank more attractive to prospective customers.
Other plans include further branch expansion into commercially viable areas of the country.
Your Bank will remain focused on its strategic objectives and will continue to build on its achievements so far to deliver better results for all stakeholders.
The Bank projects a Profit before tax of GH¢26million for the Year 2013 and this is expected to be achieved through strict management of the Net Interest Margin as the Bank reduces its reliance on high cost funds such as corporate fixed deposits.
6.0 ACKNOWLEDGEMENT
On behalf of the Board, I would like to take this opportunity to express my heartfelt thanks to all our customers whose continued patronage and loyalty has contributed to the success of the Bank.
I am also grateful to the Management and Staff of the Bank for their dedicated service and professionalism in the midst of the intense competition in our industry.
Finally, I wish to thank you Shareholders and colleague members of the Board of Directors for your cooperation and invaluable contributions that have sustained the Bank in its endeavours over the past 17 years. Based on your mutual support and cooperation, we continue to look to the future with confidence.
Thank you.
JOHN SACKAH ADDO CHAIRMAN

Your Trusted and Dependable Partner
Annual Report, 2012
33
PRUDENTIAL BANK LIMITED
Report of the Directors

Your Trusted and Dependable Partner 34
Annual Report, 2012PRUDENTIAL BANK LIMITED
Your Trusted and Dependable Partner
Annual Report, 2012
35
PRUDENTIAL BANK LIMITED
The Directors have pleasure in submitting to the members their seventeenth annual report together with the audited consolidated financial statements of the Bank and its subsidiaries for the year ended 31st December, 2012 as follows:
a. Subsidiary companies
The subsidiary companies of the Bank are both incorporated in Ghana and wholly owned by the Bank:
i. PBL Properties Limited is engaged in acquiring and developing Banking premises for the Bank and also managing the auxiliary staff and facilities.
ii. PBL Securities Limited is engaged in stockbrokerage, funds management, corporate finance, business advisory services and equity and economic research.
b. Principal Activities
The principal activities carried out by the Bank during the year under review are within the limits permitted by its regulations and also consistent with its strategic focus. There were no changes in the principal activities of the Bank during the year.
c. Results and Dividend
The results of operations for the year ended 31st December, 2012 are set out in the Consolidated Statement of Comprehensive Income, Consolidated Statement of Financial Position, Consolidated Statement of Cash Flows, Consolidated Statement of Changes in Equity and the Notes to the Consolidated Financial Statements from page 43 to 96.
d. The Consolidated Statement of Financial position and this report have been signed by two directors indicating the Board’s approval of the Consolidated Statement of Financial position, Annexed Financial Statements and the Notes.

Your Trusted and Dependable Partner 36
Annual Report, 2012PRUDENTIAL BANK LIMITED
A summary of the results is as follows:
THE GROUP THE BANK 2012 2011 Restated 2012 2011 Restated GH¢’000 GH¢’000 GH¢’000 GH¢’000
Net Profit for the year 10,210 9,032 9,616 8,237
Add Balance brought forward 7,607 3,401 5,094 1,683
17,817 12,433 14,710 9,920
Transfer to Stated Capital (9,000) _ (9,000) _
Transfer to Credit Risk Reserve (231) (708) (231) (708)
Transfer to Statutory Reserve (4,808) (4,119) (4,808) (4,119)
14,039 4,826 14,039 4,826 Income Surplus Account At the end of the year 3,778 7,607 671 5 ,094
Total Assets 679,676 552,447 676,607 549,778
The Directors do not recommend the payment of any dividend to ordinary shareholders for the year.
The Directors consider the Bank’s state of affairs to be satisfactory. They have a reasonable expectation that the Bank will continue in operational existence for the foreseeable future and have therefore used the going concern basis for preparing these financial statements.
BY ORDER OF THE BOARD
…………………….............……. …………………….............……. DIRECTOR DIRECTOR
ACCRA
……………………………………. 20137TH MARCH

Your Trusted and Dependable Partner
Annual Report, 2012
37
PRUDENTIAL BANK LIMITED
STATEMENT OF DIRECTORS’ RESPONSIBILITIES IN RELATION TO THE DIRECTORS’ REPORT AND THE CONSOLIDATED FINANCIAL STATEMENTS
The Companies Code, 1963 (Act 179) requires the Directors to prepare financial statements for each financial year, which give a true and fair view of the state of affairs of the Bank and its subsidiaries and of their profit or loss for the year.
The Banking Act, 2004 (Act 673) as amended by the Banking (Amendment) Act 2007 (Act 738) requires every bank to prepare annually as at 31st December of each year financial statements and returns prepared in accordance with that Act.
In preparing the financial statements, the Directors are required to:
• Select accounting policies, which comply with the Companies Code 1963, (Act 179) and the Banking Act 2004, (Act 673) as amended and in accordance with International Financial Reporting Standards and to apply them consistently
• Make judgments and estimates that are reasonable and prudent
• Ensure applicable accounting standards have been followed and any material departures, disclosed and explained in the financial statements
• Ensure the financial statements are prepared on a going concern basis unless it is inappropriate to presume that the Bank will continue in business.
The Directors are responsible for the preparation of the financial statements in accordance with the International Financial Reporting Standards and ensuring that the Bank and its subsidiaries keep accounting records which disclose with reasonable accuracy the financial position of the Bank and its subsidiaries and which enable them to ensure that the financial statements comply with the Companies Code 1963 (Act 179) and the Banking Act 2004 (Act 673) as amended. They are also responsible for safeguarding the assets of the Bank and its subsidiaries hence for taking steps for the prevention and detection of fraud and other irregularities, as well as designing, implementing and maintaining internal controls relevant to the preparation and fair presentation of financial statements that are free from material misstatements.
The above statement, which should be read in conjunction with the report of the Auditors, is made with the view to distinguishing for shareholders the respective responsibilities of the Directors and the auditors in relation to these financial statements.

Your Trusted and Dependable Partner 38
Annual Report, 2012PRUDENTIAL BANK LIMITED
Your Trusted and Dependable Partner
Annual Report, 2012
39
PRUDENTIAL BANK LIMITED
Report of the Auditors to the Members of
Prudential Bank Limited

Your Trusted and Dependable Partner 40
Annual Report, 2012PRUDENTIAL BANK LIMITED

Your Trusted and Dependable Partner
Annual Report, 2012
41
PRUDENTIAL BANK LIMITED
Report on the Financial Statements
We have audited the accompanying consolidated financial statements of Prudential Bank Limited, which comprise the Consolidated Statement of Financial position as at 31st December, 2012, Consolidated Statement of Comprehensive Income, Consolidated Statement of Cash Flows and Consolidated Statement of Changes in Equity for the year then ended, and a summary of significant accounting policies and explanatory notes.
Directors’ Responsibility for the Financial Statements
As described on page 37, the Bank’s Directors are responsible for the preparation and fair presentation of these consolidated financial statements in accordance with International Financial Reporting Standards (IFRS) and the Banking Act, 2004 (Act 673) as amended and the Companies Code, 1963 (Act 179). This responsibility includes: designing, implementing and maintaining internal controls relevant to the preparation and fair presentation of the consolidated financial statements that are free from material misstatement, whether due to fraud or error; selecting and applying appropriate accounting policies; and making accounting estimates that are reasonable in the circumstances.
Auditors’ Responsibility
It is our responsibility to form an independent opinion based on our audit of these statements and to report same to you.
Basis of Opinion
We conducted our audit in accordance with internationally accepted standards on auditing. Those standards require that we comply with ethical standards and plan to perform our audit to obtain reasonable assurance as to whether the consolidated financial statements are free of material misstatements.
An audit involves performing procedures to obtain audit evidence about the amounts and disclosures in the financial statements. The procedures selected depend on the auditors’ judgment, including the assessment of the risks of material misstatement of the financial statements, whether due to fraud or error. In making those risk assessments, the auditor considers internal controls relevant to the entity’s preparation and fair presentation of the financial statements in order to design audit procedures that are appropriate in the circumstances but not for the purpose of expressing an opinion on the effectiveness of the entity’s internal controls. An audit also includes evaluating the appropriateness of accounting policies used and the reasonableness of accounting estimates made by the Directors, as well as evaluating the overall presentation of the financial statements.
We believe that the audit evidence we have obtained is sufficient and appropriate to provide a basis for our audit opinion.

Your Trusted and Dependable Partner 42
Annual Report, 2012PRUDENTIAL BANK LIMITED
Opinion
In our opinion, the consolidated financial statements show a true and fair view of the consolidated financial position of Prudential Bank Limited and its subsidiaries as at 31st December, 2012, and of their financial performance and cash flows for the year then ended in accordance with International Financial Reporting Standards and the Companies Code, 1963 (Act 179) and the Banking Act 2004 (Act 673) as amended.
Report on other Legal and Regulatory Requirements
The Companies Code, 1963 (Act 179) requires that in carrying out our audit we report on the following matters. We confirm that:
i. We have obtained all the information and explanations which to the best of our knowledge and belief were necessary for the purposes of our audit;
ii. In our opinion proper books of account have been kept by the Bank, so far as appears from our examination of those books;
iii. The Consolidated Statement of Financial Position, the Consolidated Statement of Comprehensive Income, the Consolidated Statement of Cash Flows and the Consolidated Statement of Changes in Equity of the Bank and its subsidiaries are in agreement with the books of account.
The Banking Act, 2004 (Act 673) as amended by the Banking (Amendment) Act, 2007 (Act 738), requires that we state certain matters in our report. We hereby certify that:
i. The financial statements give a true and fair view of the state of affairs as at 31st December, 2012 of the Bank and its subsidiaries and the results for the year ended on that date;
ii. We obtained all the information and explanations required for the efficient performance of our audit;
iii. The Bank and its subsidiaries transactions are within their powers; andiv. The Bank has generally complied with the provisions of the Banking Act, 2004 (Act 673)
as amended.
…………………………….……….…..Signed by Osei Yaw Asamoa (ICAG/P/1192)For and on behalf of Asamoa Bonsu & Co. (ICAG/F/0086)Chartered AccountantsAccra, Ghana
……………………………………. 20137TH MARCH

Your Trusted and Dependable Partner
Annual Report, 2012
43
PRUDENTIAL BANK LIMITED
Consolidated Financial Statements & Notes

Your Trusted and Dependable Partner 44
Annual Report, 2012PRUDENTIAL BANK LIMITED
Your Trusted and Dependable Partner
Annual Report, 2012
45
PRUDENTIAL BANK LIMITED
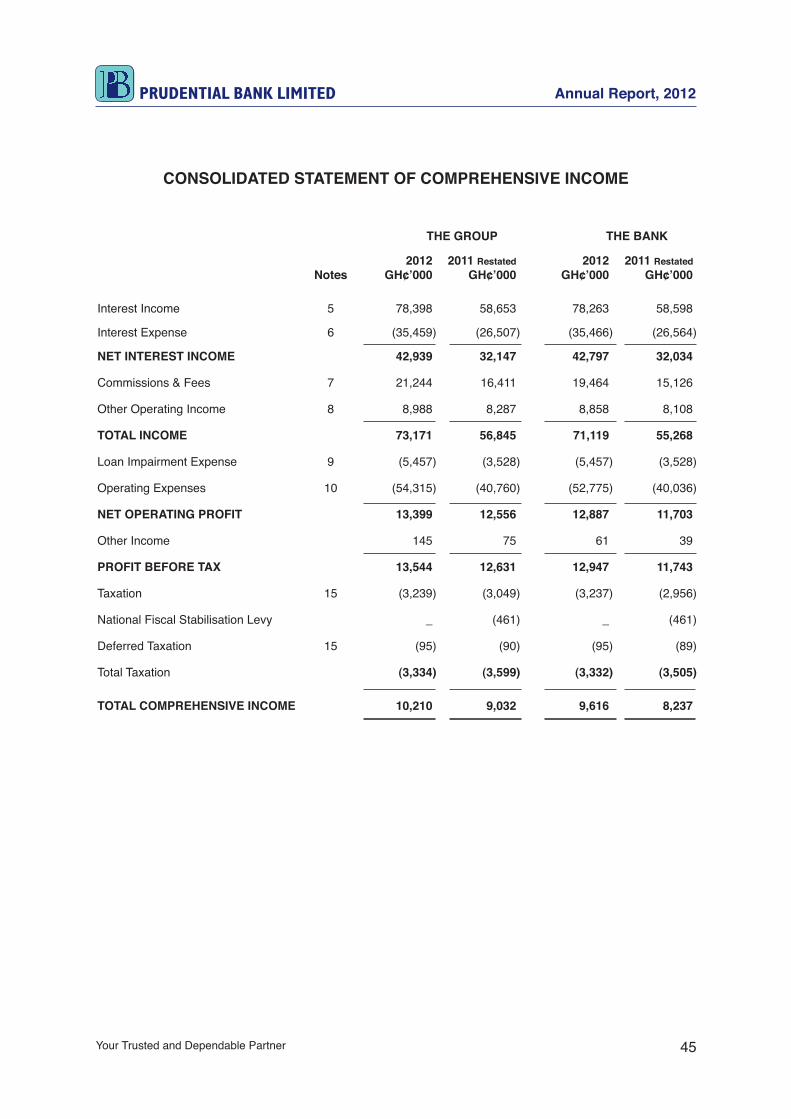
CONSOLIDATED STATEMENT OF COMPREHENSIVE INCOME
THE GROUP THE BANK
2012 2011 Restated 2012 2011 Restated Notes GH¢’000 GH¢’000 GH¢’000 GH¢’000
Interest Income 5 78,398 58,653 78,263 58,598
Interest Expense 6 (35,459) (26,507) (35,466) (26,564)
NET INTEREST INCOME 42,939 32,147 42,797 32,034
Commissions & Fees 7 21,244 16,411 19,464 15,126
Other Operating Income 8 8,988 8,287 8,858 8,108
TOTAL INCOME 73,171 56,845 71,119 55,268
Loan Impairment Expense 9 (5,457) (3,528) (5,457) (3,528)
Operating Expenses 10 (54,315) (40,760) (52,775) (40,036)
NET OPERATING PROFIT 13,399 12,556 12,887 11,703
Other Income 145 75 61 39
PROFIT BEFORE TAX 13,544 12,631 12,947 11,743
Taxation 15 (3,239) (3,049) (3,237) (2,956)
National Fiscal Stabilisation Levy _ (461) _ (461)
Deferred Taxation 15 (95) (90) (95) (89)
Total Taxation (3,334) (3,599) (3,332) (3,505)
TOTAL COMPREHENSIVE INCOME 10,210 9,032 9,616 8,237

Your Trusted and Dependable Partner 46
Annual Report, 2012PRUDENTIAL BANK LIMITED
CONSOLIDATED STATEMENT OF FINANCIAL POSITION
THE GROUP THE BANK
2012 2011 Restated 2012 2011 Restated Notes GH¢’000 GH¢’000 GH¢’000 GH¢’000
ASSETSCash and Balances with Bank of Ghana 12 79,645 52,931 79,645 52,931Government Securities 13 50,371 65,718 50,371 65,718Due from Other Banks & Financial Institution 14 80,143 99,627 80,143 99,627Taxation 15 2,895 988 2,846 1,043Equity Investment 18 188 188 6,366 6,366Loans and Advances 16 424,964 293,261 425,207 293,261Other Assets 19 5,182 4,438 5,016 4,388 643,388 517,151 649,595 523,334
Property, Plant & Equipment 21 34,169 32,972 24,899 24,121Intangible Assets 22 2,119 2,324 2,113 2,324
TOTAL ASSETS 679,676 552,447 676,607 549,778
LIABILITIES Customer Deposits 20 554,020 458,465 555,195 459,460 Other liabilities 24 22,980 28,993 21,848 27,821Deferred Tax 15 1,455 1,360 1,450 1,355Borrowings 23 13,018 13,987 13,019 13,988
TOTAL LIABILITIES 591,473 502,807 591,512 502,652
EQUITY AND RESERVES Stated Capital 27 62,453 25,100 62,453 25,100Income Surplus Account 3,778 7,607 671 5,094Statutory Reserve Fund 15,386 10,578 15,385 10,577Capital Surplus 5,500 5,500 5,500 5,500Credit Risk Reserve 1,086 855 1,086 855
TOTAL EQUITY AND RESERVES 88,203 49,640 85,095 47,126
TOTAL LIABILITIES AND EQUITY 679,676 552,447 676,607 549,778
BY ORDER OF THE BOARD
………………………………………….....) ) ) ) ) DIRECTORS ) …………………………………………..... ) ACCRA
……………………………….........… 20137TH MARCH

Your Trusted and Dependable Partner
Annual Report, 2012
47
PRUDENTIAL BANK LIMITED
CONSOLIDATED STATEMENT OF CASH FLOWS
THE GROUP THE BANK 2012 2011 Restated 2012 2011 Restated Note GH¢’000 GH¢’000 GH¢’000 GH¢’000
OPERATING PROFIT 13,544 12,631 12,947 11,743 Add Back: Charge for Depreciation 4,542 4,073 4,531 4,062 Charge for Amortisation 1,074 1,035 1,072 1,033 Charge for Loan Impairments 9,622 3,528 9,622 3,528 Provision in Contingency Liabilities 107 132 107 132 (Profit)/Loss on Sale of Property, Plant & Equipment 4 (23) (2) (23)
CASH INFLOW FROM TRADING ACTIVITIES 28,893 21,376 28,277 20,474
(INCREASE/(DECREASE) IN OPERATING ASSETS (Increase)/Decrease in Government Securities (40,732) 33,945 (40,732) 33,945(Increase)/Decrease in Loans/Advances (141,432) (75,190) (141,676) (75,189)Increase/(Decrease) in Other Assets (745) 1,114 (629) 1,014
INCREASE/(DECREASE) IN OPERATING LIABILITIES Increase/(Decrease) in Customers’ Deposits 95,554 119,541 95,735 120,157 Increase/(Decrease) in Other Liabilities (6,014) 18,089 (5,973) 19,013 Increase/(Decrease) in Borrowings (970) (4,369) (970) (4,739)TAX PAID (5,146) (4,099) (5,068) (4,023)NET CASH FLOWS FROM OPERATING ACTIVITIES (70,591) 110,408 (71,035) 110,652
INVESTING ACTIVITIES (Increase)/Decrease in Equity Investments _ 148 _ (336)Proceeds from Sale of Property, Plant & Equipment 32 28 2 28 Purchase of Property, Plant & Equipment (5,365) (5,330) (5,310) (5,330)Additions to Investment Properties (410) (51) 0 0 Purchase of Intangible Assets (869) (207) (861) (207) (6,611) (5,412) (6,168) (5,846) FINANCING ACTIVITIES Proceeds from Issue of Shares 28,353 _ 28,353 _ Proceeds From Convertible Debentures _ _ _ 371 28,353 _ 28,353 371NET INCREASE/(DECREASE) IN CASH AND CASH EQUIVALENTS (48,849) 104,996 (48,851) 105,177
ANALYSIS OF CASH AND CASH EQUIVALENTS Balance as at 1st January 2012 215,378 110,382 215,379 110,201 Add Net Cash Flow (48,849) 104,996 (48,850) 105,177 Balance as at 31st December, 2012 166,529 215,378 166,528 215,379
COMPOSITION Cash on Hand 26,584 15,077 26,584 15,077 Balance with Bank of Ghana 53,061 37,854 53,061 37,854 Balances with other Banks 16,425 21,816 16,425 73,883 Government Securities 6,741 62,821 6,741 62,821 Overnight Lending _ 15,233 _ 15,233 Foreign Time Deposits 54,433 52,067 54,433 _ Foreign Cheques _ 2 _ 2 Items in Course of Collection 9,285 10,508 9,285 10,508 166,529 215,378 166,528 215,379
Your Trusted and Dependable Partner 48
Annual Report, 2012PRUDENTIAL BANK LIMITED
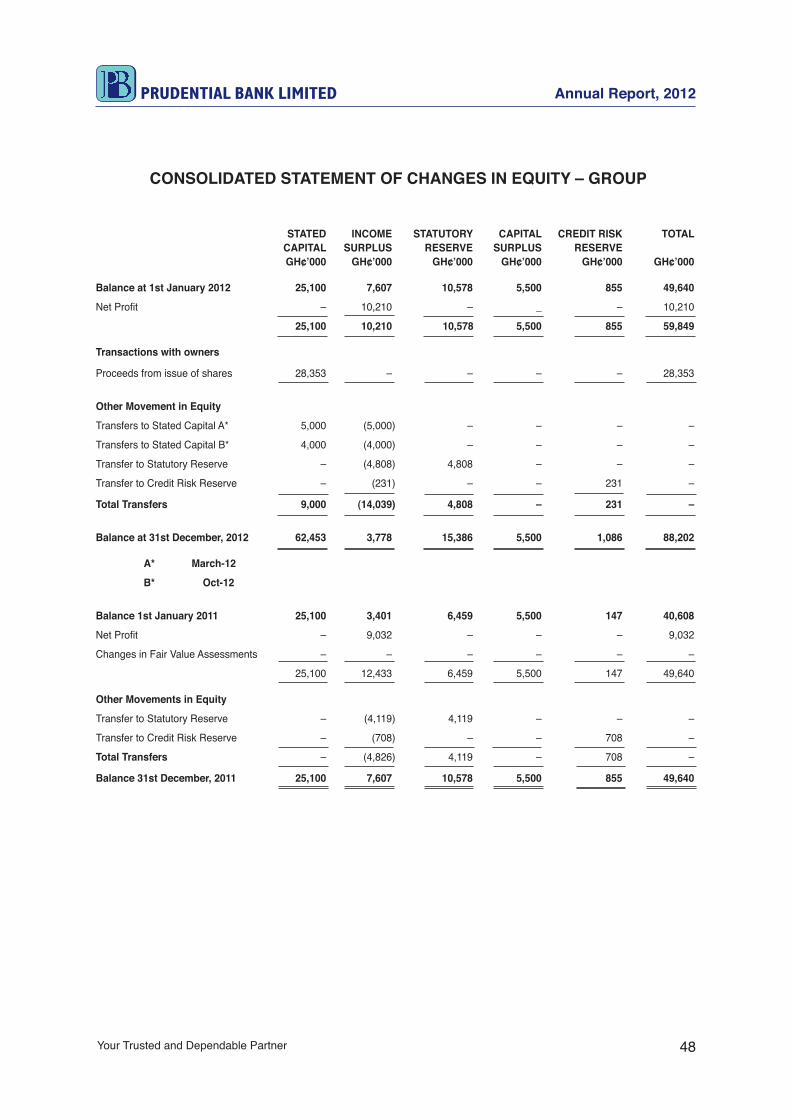
CONSOLIDATED STATEMENT OF CHANGES IN EQUITY – GROUP
STATED INCOME STATUTORY CAPITAL CREDIT RISK TOTAL CAPITAL SURPLUS RESERVE SURPLUS RESERVE GH¢’000 GH¢’000 GH¢’000 GH¢’000 GH¢’000 GH¢’000
Balance at 1st January 2012 25,100 7,607 10,578 5,500 855 49,640
Net Profit – 10,210 – _ – 10,210
25,100 10,210 10,578 5,500 855 59,849
Transactions with owners
Proceeds from issue of shares 28,353 – – – – 28,353
Other Movement in Equity
Transfers to Stated Capital A* 5,000 (5,000) – – – –
Transfers to Stated Capital B* 4,000 (4,000) – – – –
Transfer to Statutory Reserve – (4,808) 4,808 – – –
Transfer to Credit Risk Reserve – (231) – – 231 –
Total Transfers 9,000 (14,039) 4,808 – 231 –
Balance at 31st December, 2012 62,453 3,778 15,386 5,500 1,086 88,202
A* March-12
B* Oct-12
Balance 1st January 2011 25,100 3,401 6,459 5,500 147 40,608
Net Profit – 9,032 – – – 9,032
Changes in Fair Value Assessments – – – – – –
25,100 12,433 6,459 5,500 147 49,640
Other Movements in Equity
Transfer to Statutory Reserve – (4,119) 4,119 – – –
Transfer to Credit Risk Reserve – (708) – – 708 –
Total Transfers – (4,826) 4,119 – 708 –
Balance 31st December, 2011 25,100 7,607 10,578 5,500 855 49,640

Your Trusted and Dependable Partner
Annual Report, 2012
49
PRUDENTIAL BANK LIMITED
CONSOLIDATED STATEMENT OF CHANGES IN EQUITY – BANK
STATED INCOME STATUTORY CAPITAL CREDIT RISK TOTAL CAPITAL SURPLUS RESERVE SURPLUS RESERVE GH¢’000 GH¢’000 GH¢’000 GH¢’000 GH¢’000 GH¢’000
Balance at 1st January 2012 25,100 5,094 10,577 5,500 855 47,126
Net Profit – 9,616 – – – 9,615
25,100 14,710 10,577 5,500 855 56,742
Transactions with owners
Proceeds from issue of shares 28,353 – – – – 28,353
Other Movement in Equity
Transfers to Stated Capital A* 5,000 (5,000) – – – –
Transfers to Stated Capital B* 4,000 (4,000) – – – –
Transfer to Statutory Reserve (4,808) 4,808 – – –
Transfer to Credit Risk Reserve – (231) – – 231 –
Total Transfers 9,000 (14,039) 4,808 – 231 –
Balance at 31st December, 2012 62,453 671 15,385 5,500 1,086 85,095
A* March-12
B* Oct-12
Balance 1st January 2011 25,100 1,685 6,459 5,500 147 38,889
Net Profit – 8,237 – – – 8,237
Changes in Fair Value Assessments – – – – – –
25,100 9,921 6,459 5,500 147 47,126
Other Movements in Equity
Transfer to Statutory Reserve – (4,119) 4,119 – – –
Transfer to Credit Risk Reserve – (708) – – 708 –
Total Transfers – (4,826) 4,119 – 708 –
Balance 31st December, 2011 25,100 5,094 10,577 5,500 855 47,126

Your Trusted and Dependable Partner 50
Annual Report, 2012PRUDENTIAL BANK LIMITED
NOTES TO THE CONSOLIDATED FINANCIAL STATEMENTSFOR THE YEAR ENDED 31ST DECEMBER, 2012
1.0 STATEMENT OF COMPLIANCE
1.1 International Financial Reporting Standards (IFRSs)
The financial statements of the Bank for the year ended 31st December 2012 have been prepared in accordance with International Financial Reporting Standards (IFRSs).
1.2 References
References to “The financial statements” comprise the Consolidated Statements of:
a. Comprehensive Income;
b. Financial Position;
c. Cash Flows and
d. Changes in Equity.
References to the Group comprise the Bank and its subsidiaries.
2.0 ACCOUNTING POLICIES
The significant accounting policies adopted by the Bank and which have been applied in preparing these financial statements are stated below:
2.1 Restatementofcomparativefigures
The comparative figures were restated:
a. In the case of the Bank, the disaggregation of taxation into assets and liabilities as against the net position shown in the previous signed accounts.
b. In the case of the Group, the change in the total assets and liabilities arose from the first time consolidation of PBL Properties Limited’s financial statements with that of the Bank.
2.2 Basis of Measurement
The financial statements have been prepared under the historical cost convention as modified by the adoption of fair value measurement basis, in compliance with IFRS requirements, for investments and financial assets and financial liabilities measured at fair value.
Your Trusted and Dependable Partner
Annual Report, 2012
51
PRUDENTIAL BANK LIMITED
2.3 Functional and Presentation Currency
The financial statements are presented in Ghana Cedi (GH¢) which is the functional and presentation currency of the Group.
2.4 Revenue Recognition
Revenue is recognised to the extent that the economic benefits will flow to the Group and the revenue can be reliably measured. The following specific recognition criteria apply to revenue recognition.
2.4.1 Interest Income and Expense
Interest income and expense are recognised in the income statement for all interest bearing financial instruments including loans and advances as interest accrues using the effective interest rate method.
The effective interest rate method is a method of calculating the amortised cost of a financial asset or liability and of allocating the interest income or interest expense. The effective interest rate is the rate that exactly discounts the estimated future cash payments, or receipts over the expected life of the instrument to the net carrying amount of the financial asset or liability.
2.4.2 Non-Interest Income
The Bank earns commission and fees from a wide range of services provided to its customers. Fee income is accounted for as follows:
– income earned on performance of discrete services (such as funds transfers, special clearing, transaction negotiation with third parties etc) is recognized as revenue upon completion of the act or service;
– income arising from service fees (such as special statement requests, safe custody, commission on turnover, etc) are recognized as the services are provided;
Loan origination fees and similar fees form an integral part of the effective interest rate of a financial instrument and are not shown as part of non-interest income.
2.4.3 Income Tax
Income Tax in the Statement of Comprehensive Income comprises current tax and deferred tax.
Current tax is the tax expected to be payable, under the Internal Revenue Act 2000 (Act 592), on the taxable profit for the year.
Deferred income tax is provided on all temporary differences at the financial position date between the tax bases of assets and liabilities and their carrying amounts. Deferred tax liabilities are generally recognized for all taxable temporary differences while deferred tax assets are recognised to the extent that it is probable that future taxable profit will
Your Trusted and Dependable Partner 52
Annual Report, 2012PRUDENTIAL BANK LIMITED
be available against which deductible temporary differences can be utilized. Deferred tax is calculated using the rate expected to be applicable in the period during which the asset will be realized or the liabilities settled.
Deferred tax assets and liabilities are offset when they arise in the same tax reporting entities and relate to income taxes of the same taxation authority, and when a legal right to set off exists.
The carrying amount of deferred tax assets is reviewed at each balance sheet date and adjusted to the extent that it is no longer probable that sufficient taxable profit will be available for full or partial utilization of the deferred tax asset.
2.5 Financial Instruments Categorisation, Initial Recognition and subsequent Measurement
2.5.1 Categorisation
The Group classifies its financial assets in the following categories: Financial assets at fair value through profit or loss; financial assets measured at amortised cost; and financial assets measured at fair value through other comprehensive income.
2.5.2 Date of Recognition
Purchases and sale of financial assets are recognized on the transaction date.
2.5.3 Initial Recognition of Financial Instruments
Financial instruments are initially recognized at their fair value plus, in the case of financial assets or financial liabilities not at fair value through profit and loss, transaction costs that are directly attributable to the acquisition or issue of the financial asset or financial liability.
2.5.4 Subsequent Measurement of Financial Instruments
a. FinancialAssetsatFairValueThroughProfitorLoss
A financial asset at fair value through profit or loss is a financial asset that meets either of the following conditions
• HeldforTrading
A financial asset is classified as held for trading if it is: acquired principally for the purpose of selling in the near future, or is part of a portfolio of identified financial instruments that are managed together and for which there is evidence of a recent actual pattern of short-term profit-taking.
• Designatedatfairvaluethroughprofitorloss
Upon initial recognition as financial asset, it is designated as at fair value through profit or loss. Financial assets at fair value through profit or loss are measured at fair value subsequent to initial recognition. Gains or losses upon subsequent measurement are treated in profit or loss.

Your Trusted and Dependable Partner
Annual Report, 2012
53
PRUDENTIAL BANK LIMITED
b. Financial Assets Measured at Amortised Cost
A financial asset is measured at amortised cost if both the following conditions are met:
i. The asset is held within a business model whose objective is to hold assets in order to collect contractual cash flows.
ii. The contractual terms of the financial asset give rise on specified dates to cash flows that are solely payments of principal and interest on the principal amount outstanding.
Term loans to customers come under this category. They are initially recognized when cash is advanced to the borrowers at fair value, inclusive of transaction costs. Subsequent to initial recognition, term loans are measured at amortised cost less impairment losses.
c. Financial Assets Measured at Fair Value Through Other Comprehensive Income
Securities including investments in money market and equity shares, other than those classified as trading securities, or at fair value through profit or loss, are classified and recognised in the statement of financial position at their fair value. Other financial assets that are neither cash nor categorized under any other category also come under this classification.
Financial assets measured at fair value through other comprehensive income are measured at fair value with gains and losses arising from changes in fair value recognised directly in other comprehensive income until the financial asset is either sold, becomes impaired, or matures, at which time the cumulative gain or loss previously recognised in equity is recognised in profit or loss.
Interest calculated using the effective interest method is recognised in the statement of comprehensive income. Dividends on equity instruments are recognised in the income statement when the Bank’s right to receive payment is established.
d. Financial liabilities
Financial liabilities are classified as non-trading, held for trading or designated as at fair value through profit and loss. Non-trading liabilities are measured subsequent to initial recognition at amortised cost applying the effective interest method. Held for trading liabilities or liabilities designated at fair value through profit or loss, are measured at fair value. All financial liabilities shown in the statement of financial position are non-trading liabilities.

Your Trusted and Dependable Partner 54
Annual Report, 2012PRUDENTIAL BANK LIMITED
2.5.5 Determination of Fair Value of Financial Instruments
i. Availability of active market
The fair value of a financial instrument traded in active markets such as the Ghana Stock Exchange (GSE) at the reporting date is based on its quoted market price without any deduction of transaction costs.
ii. Non-availability of active market
Equity investments that do not have a quoted market price in an active market and whose fair value cannot be reliably measured are measured at cost. Investments whose fair value can be reliably measured are measured professionally through the use of valuation techniques.
iii. Short term receivables
The fair value of short term receivables approximate book value and are measured as such.
2.5.6 Derecognition of financial assets and liabilities
A financial asset or a portion thereof, is derecognized when the Bank’s rights to cash flows has expired or when the Bank has transferred its rights to cash flows relating to the financial assets, including the transfer of substantially all the risk and rewards associated with the financial assets or when control over the financial assets has passed.
A financial liability is derecognized when the obligation is discharged, cancelled or has expired.
2.5.7 Impairment of financial assets
a. Frameworkformeasuringimpairmentoffinancialassets
At each reporting date the Bank assesses whether, as a result of one or more events occurring after initial recognition, there is objective evidence that a financial asset or group of financial assets has become impaired.
Evidence of impairment may include indications that the borrower or a group of borrowers is experiencing significant financial difficulty, default or delinquency in interest or principal payments, or the fact that the debt is being restructured to reduce the burden on the borrower.
b. Loans andAdvances and amountsdue frombanks&other financialinstitutions
For loans and advances to customers and amounts due from banks and other financial institutions carried at amortised cost, the Bank first assesses individually whether objective evidence of impairment exists individually for financial assets that are individually significant, or collectively for financial assets that are not individually significant. If the Bank determines that no objective evidence of impairment exists for an individually assessed financial asset, whether significant
Your Trusted and Dependable Partner
Annual Report, 2012
55
PRUDENTIAL BANK LIMITED
or not, it includes the asset in a group of financial assets with similar credit risk characteristics and collectively assesses them for impairment. Assets that are individually assessed for impairment and for which an impairment loss is, or continues to be recognized, are not included in a collective assessment of impairment.
If there is objective evidence that an impairment loss has been incurred, the amount of the loss is measured as the difference between the asset’s carrying amount and the present value of the estimated future cash flows (excluding future expected credit losses that have not yet been incurred). The carrying amount of the asset is reduced through the use of an Allowance Account and the amount of the loss is recognized in the income statement.
Loans together with the associated allowances are written off when there is no realistic prospect of future recovery and all collaterals have been utilized or have been transferred to the Bank and all the necessary procedures have been completed.
If, in a subsequent year, the amount of the estimated impairment loss increases or decreases because of an event occurring after the impairment was recognized, the previously recognized impairment loss is increased or reduced by adjusting the allowance account. If a future write-off is later recovered, the recovery is credited to the ‘Credit loss expense’.
The present value of the estimated future cash flows is determined using the financial asset’s original effective interest rate. If a loan has a variable interest rate, the discount rate for measuring any impairment loss is the current effective interest rate.
For the purposes of collective evaluation of impairment, financial assets are grouped on the basis of the Bank’s internal credit grading system that considers credit risk characteristics, such as asset type, industry, geographical location, collateral type, past-due status and other relevant factors.
c. Other Financial Assets
The Bank assesses at each reporting date whether there is objective evidence that an investment or group of investments is impaired.
In the case of equity investments, objective evidence would include significant or prolonged decline in the fair value of the investment below its cost.
In the case of other debt instruments, impairment is assessed based on the same criteria as financial assets carried at amortised cost. If, in a subsequent year, the fair value of a debt instrument increases and the increase can be objectively related to an event occurring after the impairment loss was recognised in the income statement, the impairment loss is reversed through the income statement.

Your Trusted and Dependable Partner 56
Annual Report, 2012PRUDENTIAL BANK LIMITED
2.6 Regulatory Credit Risk Reserve
To cater for any shortfall between the Bank of Ghana’s credit loss provision requirements and loans and advances impairments based on IFRS principles, a charge or credit is made to Income Surplus in respect of the difference required to bring up the cumulative provision to the level required under the Bank of Ghana regulations. Under current regulations the credit risk reserve does not qualify as Tier 1 capital for the computation of capital adequacy.
2.7 Property, plant and equipment
The Group recognizes an item of property, plant and equipment as an asset when it is probable that future economic benefits will flow to it and the amount meets the materiality threshold set by the Group.
Property, plant and equipment are stated at cost less accumulated depreciation and any impairment in value. Depreciation is provided on the depreciable amount of each component on a straight-line basis over the anticipated useful life of the asset. No depreciation is provided on land.
The current annual depreciation rates for each class of property, plant and equipment are as follows:
• Computer Hardware – 25%
• Furniture and Fittings – 20%
• Motor Vehicle – 20%
• Branch Development – 121/2%
• Plant & Machinery – 121/2%
• Office Equipment – 121/2%
• Land and buildings – 3%
Costs associated with routine servicing and maintenance of assets are expensed as incurred. Subsequent expenditure is only capitalized if it is probable that future economic benefits associated with the item will flow to the Group.
The carrying values of property, plant and equipment are reviewed for indications of impairment when events or changes in circumstances indicate the carrying value may not be recoverable. If any such indication exists and where the carrying values exceed the estimated recoverable amount, the assets or cash-generating units are written down to their recoverable amount.
The recoverable amount of property, plant and equipment is the greater of net selling price and value in use. In assessing value in use, the estimated future cash flows are discounted to their present value using a pre-tax discount rate that reflects current market assessments of the time value of money and the risks specific to the asset.
Your Trusted and Dependable Partner
Annual Report, 2012
57
PRUDENTIAL BANK LIMITED
An item of property, plant and equipment is derecognized upon disposal or when no future economic benefits are expected to arise from the continued use of the asset. Any gain or loss arising on de-recognition of the asset (calculated as the difference between the net disposal proceeds and the carrying amount of the item) is included in the income statement in the year the item is derecognized.
Residual values, useful lives and methods of depreciation for property and equipment are reviewed and adjusted if appropriate, at each financial year end.
2.7.1 Investment Property
Investment Property is recognized as an asset when:
a. It is probable that the future economic benefits that are associated with the Investment Property will flow to the entity; and
b. The cost of the Investment Property can be measured reliably.
Investment Property is held to earn rentals or for capital appreciation or both.
The Group uses the fair value model in measuring its Investment Property. Under this model, Investment Property is initially measured at cost which includes transaction costs.
After recognition, Investment Property is subsequently measured at fair value which reflects market conditions at the end of the reporting period or by a valuation by a knowledgeable professional valuer.
A gain or loss arising from a change in the fair value is recognized in profit or loss for the period in which it arises.
An Investment Property is derecognized (eliminated from the Statement of Financial Position) on disposal, transfer, when it is permanently withdrawn from use, becomes owner occupied or when no future economic benefits are expected from its disposal.
2.8 Intangible Assets- Computer Software
Costs incurred to acquire and bring to use specific computer software licenses are capitalized and amortised on the basis of the expected useful lives using the straight-line method. Maximum useful life ranges between 4 and 5 years.
2.9 Provisions
The Group recognizes provisions when it has a present obligation (legal or constructive) as a result of past events and it is probable that an outflow of resources embodying economic benefits will be required to settle the obligation and a reliable estimate can be made of the amount of the obligation. Where the Group expects some or all of a provision to be reimbursed, the reimbursement is recognized as a separate asset but only when the reimbursement is virtually certain. The expense relating to any provision is presented in the income statement net of any reimbursement.

Your Trusted and Dependable Partner 58
Annual Report, 2012PRUDENTIAL BANK LIMITED
If the effect of the time value of money is material, provisions are determined by discounting the expected future cash flows at a pre-tax rate that reflects current market assessments of the time value of money, and where appropriate, the risks specific to the liability. Where discounting is used, the increase in the provision due to the passage of time is recognised as a borrowing cost.
2.10 Foreign Currency
Transactions denominated in foreign currency are translated into cedis at the rates of exchange ruling on the dates of the transactions.
Assets and liabilities denominated in foreign currencies are translated into cedis at exchange rates ruling at the statement of financial position date.
Any gains or losses resulting from foreign currency translation or exchange are dealt with through the statement of comprehensive income for the year.
2.11 Cash & Cash Equivalents
For the purposes of the statement of cash flows, cash and cash equivalents include cash, balances with Bank of Ghana, amounts due from other banks and financial institutions and short term government securities.
2.12 Borrowings
Borrowings are recognised initially at fair value, net of transaction costs incurred. Borrowings are subsequently stated at amortised cost. Any difference between the amount initially recognised (net of transaction costs) and the redemption value is recognised in the income statement over the period of the borrowings using the effective interest rate method.
2.13 ImpairmentofNon-financialAssets
The carrying amount of the Group’s non-financial assets other than deferred tax assets, are reviewed at each reporting date to determine whether there is any indication of impairment. If any such indication exists then the assets recoverable amount is estimated.
An impairment loss is recognised if the carrying amount of an asset exceeds its recoverable amount. The recoverable amount of an asset is the greater of its value in use and its fair value less costs to sell. Impairment losses are recognised in the income statement.
Impairment losses recognised in prior periods are assessed at each reporting date for any indication that the loss has decreased or no longer exists. An impairment loss is reversed if there has been a change in the estimates used to determine the recoverable amount. An impairment loss is reversed only to the extent that the assets carrying amount does not exceed the carrying amount that would have been determined, net of depreciation or amortisation, if no impairment loss had been recognised.
Your Trusted and Dependable Partner
Annual Report, 2012
59
PRUDENTIAL BANK LIMITED
2.14 EmployeeBenefits
• Short-TermBenefits
Short-term employee benefits are amounts payable to employees that fall due wholly within twelve months after the end of the period in which the employee renders the related service.
The cost of short-term employee benefits is recognised as an expense in the period when the economic benefit is given as an employment cost. Unpaid short-term employee benefits as at the end of the accounting period are recognised as accrued expenses and any short-term benefit paid in advance are recognised as prepayments to the extent that they will lead to future cash refunds or a reduction in future cash payments.
Wages and salaries payable to employees are recognised as an expense in the income statement at gross amount. The Group’s contributions to the social security fund are also charged as expenses.
• DefinedBenefitPensionScheme
Under a National Defined Benefit Pension Scheme, the Group contributes 13% of employees’ basic salary to SSNIT for employee pensions. The Group’s obligation is limited to the relevant contributions, which are settled on due dates. The pension liabilities and obligations, however, rest with SSNIT.
• ProvidentFund
The Bank has a Provident Fund Scheme for all permanent employees. Employees contribute 5% of their basic salary to the Fund whilst the Bank contributes 5%. The Bank’s obligation under the plan is limited to the relevant contribution which is invested at interest rates agreed by the trustees of the scheme and the Bank.
2.15 Events after the Reporting Date
Events subsequent to the reporting date are reflected only to the extent that they relate directly to the financial statements and the effect is material.
2.16 New Standards and Interpretations
2.16.1 Standards and Interpretations effective, relevant, and adopted in the current year
i. IFRS 7 Revised
In the January 2011 edition of International Financial Reporting Standards (IFRSs) the categories of financial assets and liabilities required to be shown in the financial statements or in notes thereto under IFRS 7 are as follows:
a. financial assets at fair value through profit or loss;
b. financial liabilities at fair value through profit or loss;

Your Trusted and Dependable Partner 60
Annual Report, 2012PRUDENTIAL BANK LIMITED
c. financial assets measured at amortised cost
d. financial liabilities measured at amortised cost
e. financial assets measured at fair value through other comprehensive income
The categories as per the earlier editions of IFRS 7 were
a. financial assets at fair value through profit or loss;
b. held to maturity investments;
c. loans and receivables
d. available-for-sale financial assets;
e. financial liabilities at fair value through profit or loss, and
f. financial liabilities measured at amortised cost
The new categorization is in accordance with IFRS 9 which becomes effective for annual periods beginning on or after 1st January 2013. The new categorization has been adopted in these financial statements in accordance with the January 2011 edition of IFRS’s in what may amount to a partial early adoption of IFRS 9.
Furthermore, arising from the 2010 annual impairments project, amendments have been made to IFRS 7, financial instruments; “Disclosures”.
In the amendments, additional clarification is provided on the requirements for risk disclosures. The effective date of the amendments is for years beginning on or after 1st January 2011. The Bank has adopted these amendments. The amendments have no material impact on the Bank’s financial statements.
ii. IAS 24 Related party disclosures (revised)
The revision to IAS 24 includes a clarification of the definition of a related party and the provision of a partial exemption for related party disclosures for government – related entities and between government related entities.
In terms of definition, the revision clarifies that joint ventures or associates of the same third party are related parties of each other. To this end, an associate includes its subsidiaries and a joint venture includes its subsidiaries.
The partial exemption applies to related party transactions and outstanding balances with a government which controls, jointly controls or significantly influences the reporting entity as well as to transactions or outstanding balances with another entity which is controlled, jointly controlled or significantly influenced by the same government. In such circumstance, the entity is exempt from the disclosure requirements of paragraph 18 of IAS 24 and is required only to disclose:

Your Trusted and Dependable Partner
Annual Report, 2012
61
PRUDENTIAL BANK LIMITED
• The name of the government and nature of the relationship;
• Information about the nature and amount of each individually significant transaction and a quantitative or qualitative indication of the extent of collectively significant transactions, in sufficient detail to enable users of the entity’s financial statements to understand the effect.
It is unlikely that the amendments will have any material impact on the Group’s financial statements.
2.16.2 Standards and Interpretations not yet effective
The following standard and interpretation which is relevant to the financial statements has been published but is not yet effective. Consequently the Bank has not adopted it fully.
IFRS 9: Financial instruments
The standard is the first phase of a three phase project to replace IAS 39 – Financial Instruments: Recognition and Measurement. The first phase of the project (IFRS 9) addresses the classification and measurement of financial instruments. IFRS 9 applies to all financial instruments within the scope of IAS 39. The key features of IFRS 9 are as follows:
Financial Assets
All financial assets are measured at fair value at initial recognition.
Debt instruments may, if the fair value option (FVO) is not invoked, be subsequently measured at amortized cost if:
a. The asset is held within a business model whose objective is to hold the asset to collect the contractual cash flows and
b. The contractual terms of the financial asset give rise, on specified dates, to cash flows that are solely payments of principal and interest on the principal outstanding.
All other debt instruments are subsequently measured at fair value. All equity investment financial assets are measured at fair value either through other comprehensive income (OCI) or profit or loss. Entities must make an irrevocable choice for each instrument unless they are held for trading, in which case, they must be measured at fair value through profit or loss.
Financial Liabilities
For FVO liabilities, the amount of change in the fair value of a liability that is attributable to changes in credit risk must be presented in other comprehensive income (OCI). The remainder of the change in fair value is presented in profit or loss, unless presentation of the fair value change in respect of the liability’s credit risk in (OCI) would create or enlarge an accounting mismatch in profit or loss.

Your Trusted and Dependable Partner 62
Annual Report, 2012PRUDENTIAL BANK LIMITED
All other IAS 39 classification and measurement requirements for financial liabilities have been carried forward into IFRS 9 including the embedded derivative separation rules and the criteria for using the FVO.
Effective date:
IFRS 9 is effective for annual periods beginning on or after 1st January 2013.
IAS 12 Income Taxes (Amendment) – Deferred Taxes: Recovery of Underlying Assets
Key Requirement
IAS 12 introduces a rebuttable presumption that deferred tax on investment properties measured at fair value will be recognised on a sale basis, unless an entity has a business model that would indicate that the investment property will be consumed in the business. If consumed, a use basis should be adopted.
Effective Date
The amendment is effective for annual periods beginning on or after 1st January 2012.
3.0 SignificantAccountingEstimates,Assumptions&Judgments
In preparation of the financial statements, the Group makes estimations and applies judgment that could affect the reported amount of assets and liabilities. Key areas in which judgment is applied include:
3.1 Fair value of Unquoted Equity Investments
The unquoted equity instruments have been valued based on the expected cash flows and discounted current rates applicable for items with similar terms and risk characteristics. This valuation requires the Bank to make estimates about expected future cash flows and discount rates, and hence they are subject to uncertainty.
3.2 Deferred Tax Assets
Deferred tax assets are recognised for all unused tax losses to the extent that it is probable that taxable profit will be available against which the losses can be utilised. Significant management judgment is required to determine the amount of deferred tax assets that can be recognised based upon the likely timing and level of future taxable profits together with future tax planning strategies.
3.3 Impairment of Financial Assets
The Group makes an allowance for unrecoverable financial assets when there is objective evidence that the carrying amount may not be recoverable. Significant management judgment is required to determine when objective evidence of impairment exists, and also in estimating future cash flows from the assets.
Your Trusted and Dependable Partner
Annual Report, 2012
63
PRUDENTIAL BANK LIMITED
3.4 Impairment of Non Financial Assets (Including Property Plant & Equipment (PPE)
The Group assesses at least at each financial year end whether there is any evidence that non financial assets (including PPE) may be impaired. Where indicators of impairment exist, an impairment test is performed. This requires an estimation of the ‘value in use’ of the asset or the cash-generating units to which the asset belongs. Estimating the value in use amount requires management to make an estimate of the expected future cash flows from the asset or the cash generating unit and also to select a suitable discount rate in order to calculate the present value of those cash flows.
Your Trusted and Dependable Partner 64
Annual Report, 2012PRUDENTIAL BANK LIMITED
THE GROUP THE BANK 2012 2011 Restated 2012 2011 Restated GH¢’000 GH¢’000 GH¢’000 GH¢’000
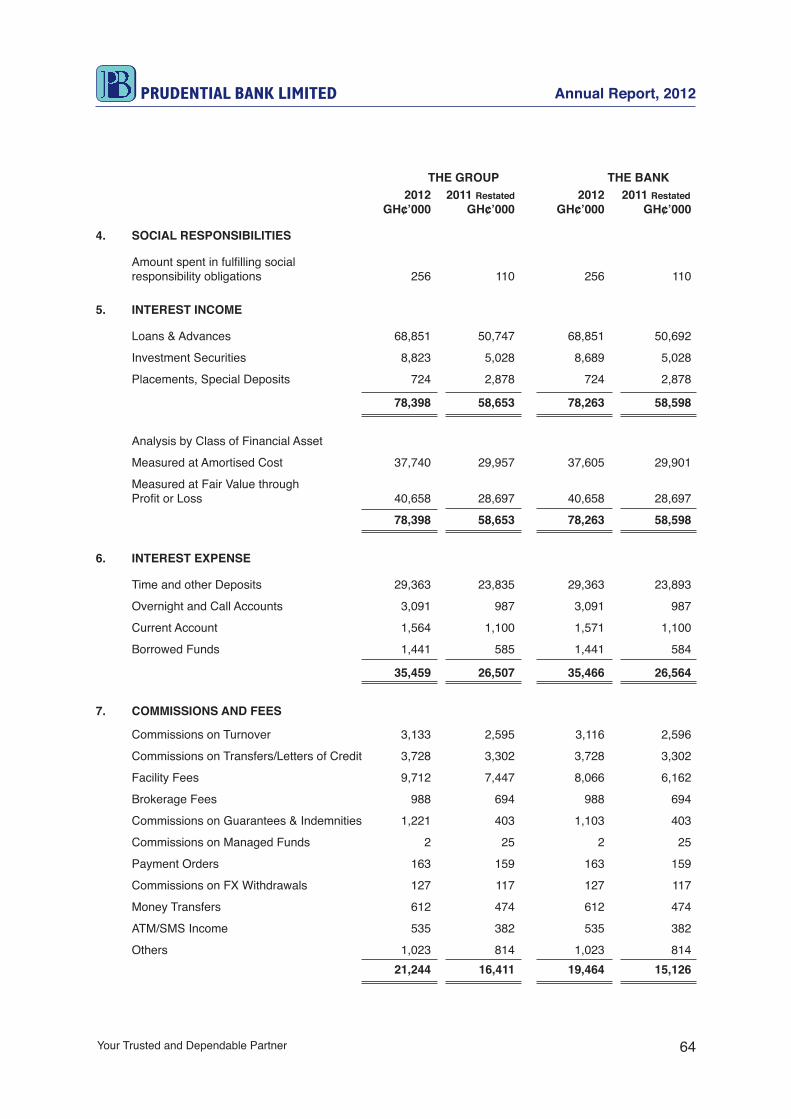
4. SOCIAL RESPONSIBILITIES
Amount spent in fulfilling social responsibility obligations 256 110 256 110
5. INTEREST INCOME
Loans & Advances 68,851 50,747 68,851 50,692
Investment Securities 8,823 5,028 8,689 5,028
Placements, Special Deposits 724 2,878 724 2,878
78,398 58,653 78,263 58,598
Analysis by Class of Financial Asset
Measured at Amortised Cost 37,740 29,957 37,605 29,901
Measured at Fair Value through Profit or Loss 40,658 28,697 40,658 28,697
78,398 58,653 78,263 58,598
6. INTEREST EXPENSE
Time and other Deposits 29,363 23,835 29,363 23,893
Overnight and Call Accounts 3,091 987 3,091 987
Current Account 1,564 1,100 1,571 1,100
Borrowed Funds 1,441 585 1,441 584
35,459 26,507 35,466 26,564
7. COMMISSIONS AND FEES
Commissions on Turnover 3,133 2,595 3,116 2,596
Commissions on Transfers/Letters of Credit 3,728 3,302 3,728 3,302
Facility Fees 9,712 7,447 8,066 6,162
Brokerage Fees 988 694 988 694
Commissions on Guarantees & Indemnities 1,221 403 1,103 403
Commissions on Managed Funds 2 25 2 25
Payment Orders 163 159 163 159
Commissions on FX Withdrawals 127 117 127 117
Money Transfers 612 474 612 474
ATM/SMS Income 535 382 535 382
Others 1,023 814 1,023 814 21,244 16,411 19,464 15,126

Your Trusted and Dependable Partner
Annual Report, 2012
65
PRUDENTIAL BANK LIMITED
THE GROUP THE BANK 2012 2011 Restated 2012 2011 Restated GH¢’000 GH¢’000 GH¢’000 GH¢’000
8. OTHER OPERATING INCOME
Gain on Exchange 8,664 8,087 8,684 8,056
Rent Income 150 148 – –
Exchange Revaluation Surplus 174 52 174 52
8,988 8,287 8,858 8,108
9. LOAN IMPAIRMENT EXPENSE
Specific (Individually assessed) 3,675 2,384 3,675 2,384
General (collectively assessed) 1,437 583 1,437 583
Write-Offs 238 132 238 132
Provisions against Contingent Liabilities 107 430 107 430
5,457 3,528 5,457 3,528
10. OPERATING EXPENSES
Licence & Fees – 12 – –
Staff Costs 23,899 15,258 21,899 15,224
Advertising & Marketing 1,886 1,319 1,871 1,319
Administrative Expenses 6,135 7,144 6,135 5,572
Training 619 557 617 556
Depreciation & Amortisation 5,616 5,108 5,603 5,095
Directors’ Emoluments 631 401 599 401
Auditors’ Remuneration 133 128 132 120
Motor Vehicle Running 2,269 1,695 2,301 1,692
Occupancy Cost 6,018 4,685 6,582 5,631
Maintenance of Systems 1,585 1,292 1,522 1,292
Other Operating Expenses 5,524 3,160 5,515 3,135
54,315 40,760 52,775 40,036
11(a). STAFF COSTS
Salaries & Wages 21,394 13,665 19,398 13,633
Social Security 940 666 933 664
Provident Fund - Employers’ Contribution 354 253 356 252
Retirement Benefits 336 – 336 –
Medical Expenses 876 674 876 674
23,899 15,258 21,899 15,224
The average number of persons employed by the bank during the year was 683 (2011– 639).

Your Trusted and Dependable Partner 66
Annual Report, 2012PRUDENTIAL BANK LIMITED
THE GROUP THE BANK 2012 2011 Restated 2012 2011 Restated GH¢’000 GH¢’000 GH¢’000 GH¢’000
11(b). Included in Staff Costs and Directors’ Emoluments are amounts incurred in respect of key management personnel Gross Salary 1,102 774 1,102 774 Social Security Fund 83 65 83 65 Provident Fund 32 26 32 26 1,217 864 1,217 864
12. CASH AND BALANCES WITH BANK OF GHANA Cash on Hand 26,584 15,077 26,584 15,077 Cash with Bank of Ghana 53,061 37,854 53,061 37,854 79,645 52,931 79,645 52,931
13. GOVERNMENT SECURITIES Short Term – Treasury Bills 6,741 62,821 6,741 62,821 Long Term Sinking Fund 3,962 2,580 3,962 2,580 Floating Rate Investment 34,132 – 34,132 – I-Year Treasury Bills 5,536 317 5,536 317 43,630 2,897 43,630 2,897
50,371 65,718 50,371 65,718
14. DUE FROM OTHER BANKS AND FINANCIAL INSTITUTIONS A. Nostro Account Balances 16,425 21,816 16,425 21,816 Items in Course of Collection 9,285 10,508 9,285 10,508 Overnight Lending – 15,233 – 15,233 Foreign Cheques Purchased – 2 – 2 Foreign Time Deposits 54,433 52,067 54,433 52,067
80,143 99,627 80,143 99,627
B. BHF Bank 8,564 10,954 8,564 10,954 Citi Bank 2,181 3,888 2,181 3,888 Ghana International Bank 5,652 6,884 5,652 6,884 Bank of Beirut 27 90 27 90 Items in Course of Collection 9,285 10,508 9,285 10,508 Overnight Lending – 15,233 – 15,233 Foreign Cheques Purchased – 2 – 2 Foreign Time Deposits 54,433 52,067 54,433 52,067 80,143 99,627 80,143 99,627

Your Trusted and Dependable Partner
Annual Report, 2012
67
PRUDENTIAL BANK LIMITED
15(A). TAXATION – GROUP
Tax Years Balance Charges Payments Balance Charge Balance 1-Jan-11 for Year for year Payments 31st Dec-12 GH¢’000 GH¢’000 GH¢’000 GH¢’000 GH¢’000 GH¢’000 GH¢’000
2007 69 – – 69 – – 69
2008 198 – – 198 – – 198
2009 (743) – – (743) – – (743)
2010 (112) – (339) (452) – – (452)
2011 – 3,049 (3,121) (72) – (294) (366)
(588) 3,049 (3,460) (999) – (294) (1,293)
2012 3,239 (4,815) (1,576)
(588) 3,049 (3,460) (999) 3,239 (5,109) (2,869)
Fiscal Stab. Levy 189 461 (639) 11 – (37) (26)
Deferred Tax 1,270 90 – 1,360 95 – 1,455
Total Tax 871 3,599 (4,099) 372 3,334 (5,146) (1,440)
B. TAXATION – BANK
2007 69 – – 69 – – 69
2008 198 – – 198 – – 198
2009 (739) – – (739) – – (739)
2010 (127) – 302 (429) – – (429)
2011 – 2,956 3,099 (143) – 246 (389)
(598) 2,956 3,400 (1,043) – 246 (1,289)
2012 - 3,237 4,794 (1,557)
(598) 2,956 3,400 (1,043) 3,237 5,040 (2,846)
Fiscal Stab. Levy 189 461 622 28 – 28 –
Deferred Tax 1,266 89 – 1,355 95 – 1,450
Total Tax 857 3,506 4,023 340 3,332 5,068 (1,396)
The amount provided for Income Tax is subject to agreement with the Ghana Revenue Authority.
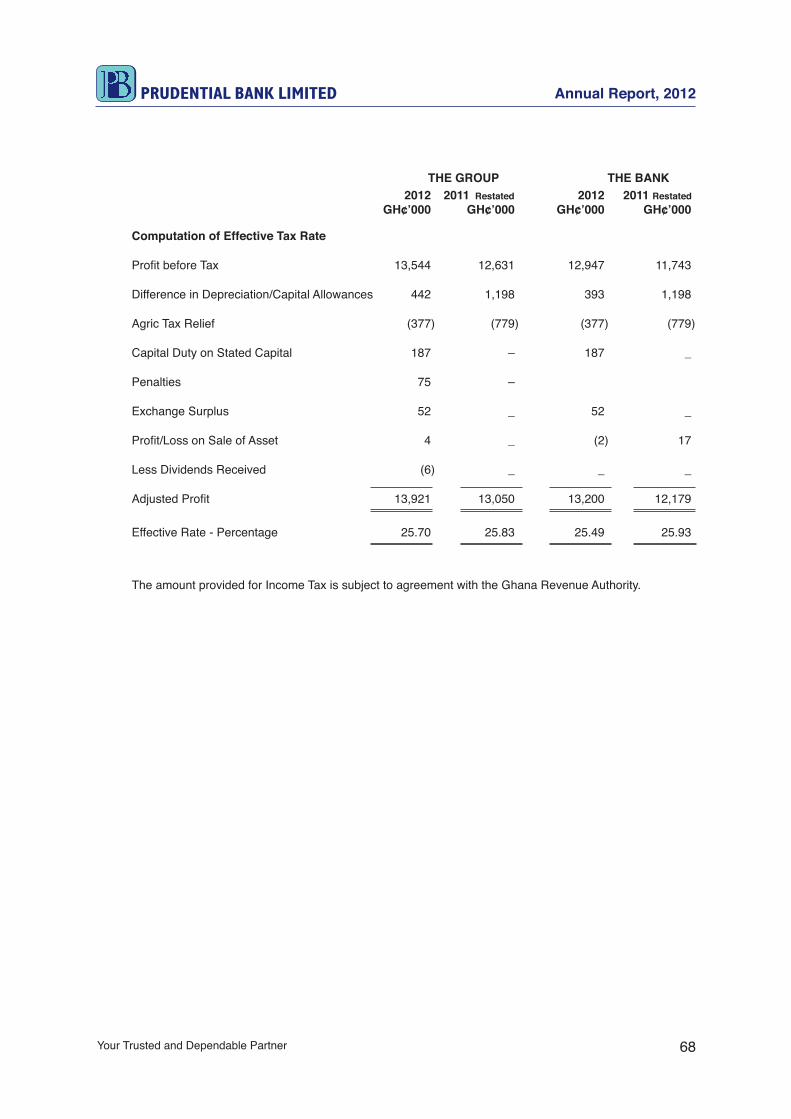
Your Trusted and Dependable Partner 68
Annual Report, 2012PRUDENTIAL BANK LIMITED
THE GROUP THE BANK 2012 2011 Restated 2012 2011 Restated GH¢’000 GH¢’000 GH¢’000 GH¢’000
Computation of Effective Tax Rate
Profit before Tax 13,544 12,631 12,947 11,743
Difference in Depreciation/Capital Allowances 442 1,198 393 1,198
Agric Tax Relief (377) (779) (377) (779)
Capital Duty on Stated Capital 187 – 187 _
Penalties 75 –
Exchange Surplus 52 _ 52 _
Profit/Loss on Sale of Asset 4 _ (2) 17
Less Dividends Received (6) _ _ _
Adjusted Profit 13,921 13,050 13,200 12,179
Effective Rate - Percentage 25.70 25.83 25.49 25.93
The amount provided for Income Tax is subject to agreement with the Ghana Revenue Authority.

Your Trusted and Dependable Partner
Annual Report, 2012
69
PRUDENTIAL BANK LIMITED
THE GROUP THE BANK 2012 2011 Restated 2012 2011 Restated GH¢’000 GH¢’000 GH¢’000 GH¢’000
16. LOANS AND ADVANCES TO CUSTOMERS Overdrafts 248,074 148,540 248,074 148,540
Term Loans 209,240 167,449 209,483 167,449
Gross Loans & Advances 457,314 315,989 457,558 315,989
Less: Impairment Allowance (14,955) (11,050) (14,955) (11,050)
Interest in Suspense (17,395) (11,679) (17,395) (11,679)
Total Impairment (32,350) (22,729) (32,350) (22,729)
Net Loans & Advances 424,964 293,261 425,207 293,261
a. Loans and Advances (including bills negotiable) to staff and customers 457,314 315,989 457,558 315,989
b. Loan Impairment Allowance ratio (Accumulated for impairment and Interest Suspense to Gross Loans and Advances) 7.07% 7.19% 7.07% 7.19%
c. Gross Non-Performing Loans ratio (Aggregate of Sub-standard to Loss loans to total loans) of Sub-standard to Loss loans to total loans) 8.64% 6.11% 8.64% 6.11%
d. Ratio of 50 Largest exposures (funded & non-funded) to total exposures 47.06% 47.12% 47.06% 47.12%
ANALYSIS BY TYPE AND CUSTOMER
Individuals 9,587 5,670 9,587 5,670
Other Private Companies 423,975 289,960 424,219 289,960
Joint Private & State Enterprises – – – –
Government Department & Agencies 5,711 4,082 5,711 4,082
Public Enterprise 4,030 3,695 4,030 3,695
Staff 14,011 12,583 14,011 12,583
457,315 315,989 457,558 315,989
Less: Impairment Allowance & Interest Suspense (32,350) (22,729) (32,350) (22,729)
424,964 293,261 425,207 293,261
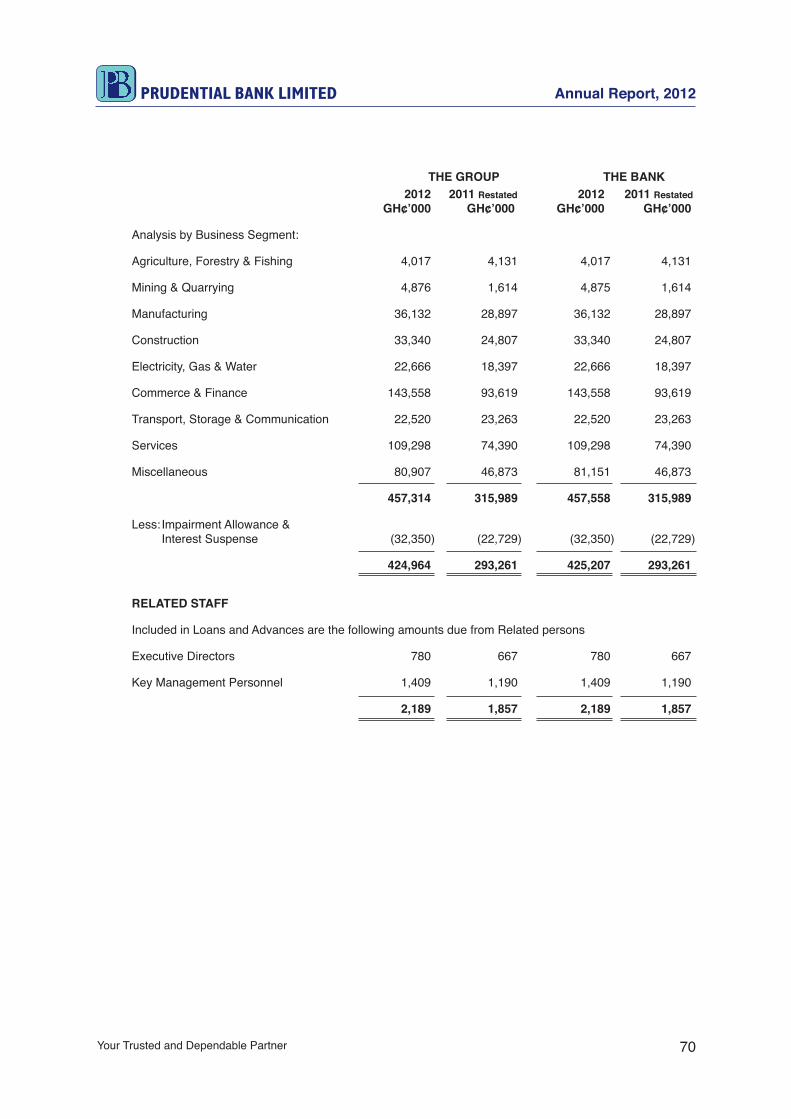
Your Trusted and Dependable Partner 70
Annual Report, 2012PRUDENTIAL BANK LIMITED
THE GROUP THE BANK 2012 2011 Restated 2012 2011 Restated GH¢’000 GH¢’000 GH¢’000 GH¢’000
Analysis by Business Segment:
Agriculture, Forestry & Fishing 4,017 4,131 4,017 4,131
Mining & Quarrying 4,876 1,614 4,875 1,614
Manufacturing 36,132 28,897 36,132 28,897
Construction 33,340 24,807 33,340 24,807
Electricity, Gas & Water 22,666 18,397 22,666 18,397
Commerce & Finance 143,558 93,619 143,558 93,619
Transport, Storage & Communication 22,520 23,263 22,520 23,263
Services 109,298 74,390 109,298 74,390
Miscellaneous 80,907 46,873 81,151 46,873
457,314 315,989 457,558 315,989
Less: Impairment Allowance & Interest Suspense (32,350) (22,729) (32,350) (22,729)
424,964 293,261 425,207 293,261
RELATED STAFF
Included in Loans and Advances are the following amounts due from Related persons
Executive Directors 780 667 780 667
Key Management Personnel 1,409 1,190 1,409 1,190
2,189 1,857 2,189 1,857

Your Trusted and Dependable Partner
Annual Report, 2012
71
PRUDENTIAL BANK LIMITED
2012 Interest 2011 Interest Provision Suspense Total Provision Suspense Total GH¢’000 GH¢’000 GH¢’000 GH¢’000 GH¢’000 GH¢’000
17. MOVEMENTS IN GROUP’S ALLOWANCE FOR IMPAIRMENTS Balance 1st January 11,050 11,679 22,729 8,083 7,075 15,158 Write-Offs/Recoveries (1,206) (5,536) (6,742) – (413) (413) Decrease in Impairments (242) – (242) (109) – (109) Increase in Impairments 5,353 11,252 16,606 3,076 5,018 8,093 Balance 31st December 14,955 17,395 32,350 11,050 11,679 22,729
18. EQUITY INVESTMENTS THE GROUP THE BANK 2012 2011 Restated 2012 2011 Restated
GH¢’000 GH¢’000 GH¢’000 GH¢’000
Subsidiaries Percentage No. of Shares Holding PBL Properties Limited 100 5,600,000 – – 5,600 5,600 Prudential Securities Limited 100 5,782,705 – – 578 578 Total Associated Companies – – 6,178 6,178
Other Investments Other Equity Investments Metro Mass Transit Limited 1.81 10,000 98 98 98 98 Airport West Hosp. Limited 5.80 900,000 90 90 90 90 188 188 188 188 Total Equity Investments 188 188 6,366 6,366
19. OTHER ASSETS Accounts Receivables & Prepayments 4,304 3,776 4,261 3,363 Tradeable Asset 124 – – 363 Stationery 754 661 754 661 5,182 4,438 5,016 4,388
20. CUSTOMERS DEPOSITS Current Accounts 229,918 163,543 230,392 163,849 Time Deposits 202,035 208,998 202,736 209,688 Savings Accounts 122,067 85,924 122,067 85,924
554,020 458,465 555,195 459,460 Analysis by Type of Depositor Financial Institutions 2,192 2,904 2,192 2,904 Individuals and other Private Enterprises 542,087 447,784 543,262 448,779 Government Departments & Agencies 5,711 4,082 5,711 4,082 Public Enterprises 4,030 3,695 4,030 3,695 554,020 458,465 555,195 459,460
Twenty Largest Depositors 117,974 25,652 117,974 25,652
Ratio of Twenty Largest Depositors to Total Deposits 21.25% 22.19%

Your Trusted and Dependable Partner 72
Annual Report, 2012PRUDENTIAL BANK LIMITED21.(a)
PRO
PERTY, PLA
NT A
ND
EQU
IPMEN
T – GR
OU
P
Plant&
Branch
Motor
Furniture&
Office
Com
puterCapitalW
orkLand&
Machinery
Developm
ent Vehicles
Fittings Equipm
ent H
ardware
In Progress B
uilding TO
TAL
GH
¢’000 G
H¢’000
GH
¢’000 G
H¢’000
GH
¢’000 G
H¢’000
GH
¢’000 G
H¢’000
GH
¢’000
C
OST
At 1st January, 2012
1,307 9,133
5,631 2,645
7,170 4,464
2,051 13,422
45,823
Additions during the year
113 211
1,330 731
1,342 220
489 1,340
5,775
D
isposal _
_ (148)
_ _
_ (36)
_ (184)
At 31st D
ecember, 2012
1,420 9,344
6,813 3,376
8,512 4,684
2,504 14,764
51,414
D
EPREC
IATION
At 1st january, 2012
507 1,756
2,964 1,604
2,742 2,974
_ 305
12,851
C
harges for the Year 155
1,161 1,035
475 904
677 _
135 4,542
R
eleased on Disposal
_ _
(148) _
_ _
_ _
(148)
At 31st D
ecember, 2012
662 2,916
3,851 2,078
3,646 3,651
_ 440
17,245
N
ET BO
OK
VALU
E
At 31st D
ecember, 2012
759 6,427
2,961 1,297
4,865 1,033
2,504 14,324
34,169
At 31st D
ecember, 2011
800 7,377
2,667 1,041
4,428 1,490
2,051 13,117
32,972
PR
OFIT O
N D
ISPOSA
L OF PR
OPER
TY, PLAN
T AN
D EQ
UIPM
ENT
2012 2011
GH
¢’000 G
H¢’000
G
ross Book Value
184
302
Accum
ulated Depreciation
(148) (297)
N
et Book Value
36
5
Sales Proceeds
32 28
(Loss)/G
ain on Disposal
(4) 23

Your Trusted and Dependable Partner
Annual Report, 2012
73
PRUDENTIAL BANK LIMITED21.(b) PR
OPER
TY, PLAN
T AN
D EQ
UIPM
ENT – G
RO
UP 2011 R
ESTATED
Plant&
Branch
Motor
Furniture&
Office
Com
puterCapitalW
orkLand&
Machinery
Developm
ent Vehicles
Fittings Equipm
ent H
ardware
In Progress B
uilding TO
TAL
GH
¢’000 G
H¢’000
GH
¢’000 G
H¢’000
GH
¢’000 G
H¢’000
GH
¢’000 G
H¢’000
GH
¢’000
C
OST
At 1st January, 2011
1,266 9,041
4,761 2,355
6,331 3,697
1,509 12,443
41,403
Additions during the year
16 76
1,080 205
432 517
2,078 977
5,381
D
isposal _
_ (302)
_ _
_ _
_ (302)
Transfers
25 16
92 85
407 250
(1,536) 2
(659)
At 31st D
ecember, 2011
1,307 9,133
5,631 2,645
7,170 4,464
2,051 13,422
45,823
D
EPREC
IATION
At 1st january, 2011
360 621
1,934 1,227
1,966 2,330
_ 416
8,853
C
harges for the Year 147
1,135 882
377 776
644 _
(111) 3,850
R
eleased on Disposal
_ _
(148) 0
0 _
_ _
(148)
At 31st D
ecember, 2011
507 1,756
2,964 1,604
2,742 2,974
_ 305
12,851
N
ET BO
OK
VALU
E
At 31st D
ecember, 2011
800 7,377
2,667 1,041
4,428 1,490
2,051 13,117
32,972
At 31st D
ecember, 2010
906 8,420
2,827 1,128
4,365 1,367
1,509 12,207
32,550
PR
OFIT O
N D
ISPOSA
L OF PR
OPER
TY, PLAN
T AN
D EQ
UIPM
ENT
2011 2010
GH
¢’000 G
H¢’000
G
ross Book Value
302
126
Accum
ulated Depreciation
(298) (123)
N
et Book Value
4
3
Sales Proceeds
28 23
G
ain on Disposal
24 20

Your Trusted and Dependable Partner 74
Annual Report, 2012PRUDENTIAL BANK LIMITED21.(c)
PRO
PERTY, PLA
NT A
ND
EQU
IPMEN
T – BA
NK
Plant&
Branch
Motor
Furniture&
Office
Com
puterCapitalW
orkLand&
Machinery
Developm
ent Vehicles
Fittings Equipm
ent H
ardware
In Progress B
uilding TO
TAL
GH
¢’000 G
H¢’000
GH
¢’000 G
H¢’000
GH
¢’000 G
H¢’000
GH
¢’000 G
H¢’000
GH
¢’000
C
OST
At 1st January, 2012
1,307 9,133
5,570 2,631
7,045 4,437
2,051 4,597
36,772
Additions during the year
113 211
1,330 731
1,342 220
434 930
5,310
Transfer
_ _
(148) _
_ _
_ _
(148)
D
isposal and Transfers _
_ _
_ _
_ _
_ _
At 31st D
ecember, 2012
1,421 9,344
6,752 3,361
8,387 4,657
2,484 5,527
41,933
D
EPREC
IATION
At 1st january, 2012
507 1,756
2,923 1,592
2,621 2,948
_ 305
12,651
C
harges for the Year 155
1,161 1,027
475 902
676 _
135 4,531
R
eleased on Disposal
_ _
(148) _
_ _
_ _
(148)
At 31st D
ecember, 2012
662 2,916
3,802 2,066
3,523 3,624
_ 440
17,034
N
ET BO
OK
VALU
E
At 31st D
ecember, 2012
759 6,428
2,950 1,295
4,863 1,033
2,484 5,088
24,899
At 31st D
ecember, 2011
801 7,378
2,647 1,039
4,424 1,489
2,051 4,292
24,121
PR
OFIT O
N D
ISPOSA
L OF PR
OPER
TY, PLAN
T AN
D EQ
UIPM
ENT
2012 2011
GH
¢’000 G
H¢’000
G
ross Book Value
148
302
Accum
ulated Depreciation
(148) (297)
N
et Book Value
_
5
Sales Proceeds
2 28
(loss)/G
ain on Disposal
2 23

Your Trusted and Dependable Partner
Annual Report, 2012
75
PRUDENTIAL BANK LIMITED21.(d) PR
OPER
TY, PLAN
T AN
D EQ
UIPM
ENT – B
AN
K 2011 R
ESTATED
Plant&
Branch
Motor
Furniture&
Office
Com
puterCapitalW
orkLand&
Machinery
Developm
ent Vehicles
Fittings Equipm
ent H
ardware
In Progress B
uilding TO
TAL
GH
¢’000 G
H¢’000
GH
¢’000 G
H¢’000
GH
¢’000 G
H¢’000
GH
¢’000 G
H¢’000
GH
¢’000
C
OST
At 1st January, 2011
1,266 9,041
4,699 2,341
6,206 3,670
1,509 3,671
32,404
Additions during the year
16 76
1,081 205
432 517
2,078 926
5,330
Transfer
25 16
92 85
407 250
(1,537) –
(660)
D
isposal and Transfers _
_ (302)
_ _
_ _
_ (302)
At 31st D
ecember, 2011
1,307 9,133
5,570 2,631
7,045 4,437
2,051 4,597
36,772
D
EPREC
IATION
At 1st january, 2011
359 620
2,347 1,216
1,846 2,305
_ 194
8,886
C
harges for the Year 147
1,135 874
376 775
643 _
111 4,062
R
eleased on Disposal
_ _
(297) _
_ _
_ _
(297)
At 31st D
ecember, 2011
507 1,756
2,923 1,592
2,621 2,948
_ 305
12,651
N
ET BO
OK
VALU
E
At 31st D
ecember, 2011
801 7,378
2,647 1,039
4,424 1,489
2,051 4,292
24,121
At 31st D
ecember, 2010
907 8,421
2,353 1,125
4,360 1,365
1,509 3,477
23,517
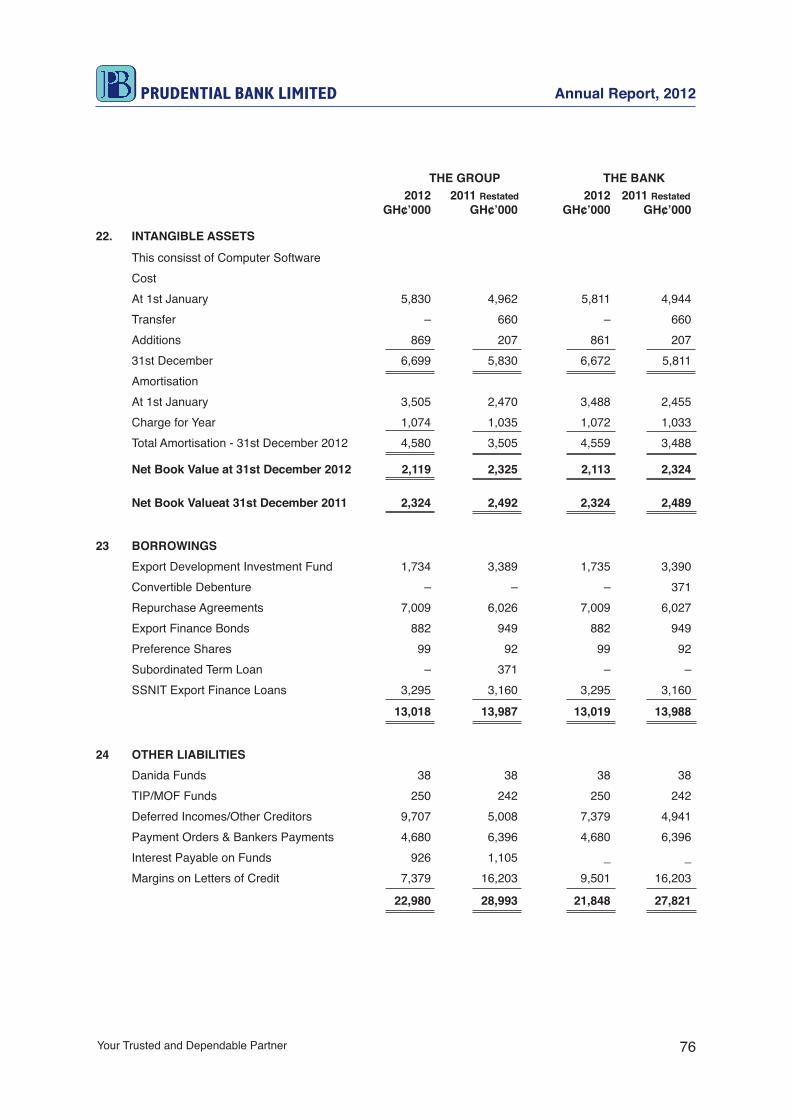
Your Trusted and Dependable Partner 76
Annual Report, 2012PRUDENTIAL BANK LIMITED
THE GROUP THE BANK 2012 2011 Restated 2012 2011 Restated GH¢’000 GH¢’000 GH¢’000 GH¢’000
22. INTANGIBLE ASSETS This consisst of Computer Software Cost At 1st January 5,830 4,962 5,811 4,944 Transfer – 660 – 660 Additions 869 207 861 207 31st December 6,699 5,830 6,672 5,811 Amortisation At 1st January 3,505 2,470 3,488 2,455 Charge for Year 1,074 1,035 1,072 1,033 Total Amortisation - 31st December 2012 4,580 3,505 4,559 3,488
Net Book Value at 31st December 2012 2,119 2,325 2,113 2,324
Net Book Valueat 31st December 2011 2,324 2,492 2,324 2,489
23 BORROWINGS Export Development Investment Fund 1,734 3,389 1,735 3,390 Convertible Debenture – – – 371 Repurchase Agreements 7,009 6,026 7,009 6,027 Export Finance Bonds 882 949 882 949 Preference Shares 99 92 99 92 Subordinated Term Loan – 371 – – SSNIT Export Finance Loans 3,295 3,160 3,295 3,160
13,018 13,987 13,019 13,988
24 OTHER LIABILITIES Danida Funds 38 38 38 38 TIP/MOF Funds 250 242 250 242 Deferred Incomes/Other Creditors 9,707 5,008 7,379 4,941 Payment Orders & Bankers Payments 4,680 6,396 4,680 6,396 Interest Payable on Funds 926 1,105 _ _ Margins on Letters of Credit 7,379 16,203 9,501 16,203
22,980 28,993 21,848 27,821

Your Trusted and Dependable Partner
Annual Report, 2012
77
PRUDENTIAL BANK LIMITED
25. FINANCIAL ASSETS BY CATEGORY Measured at Measured at Amortised Faire Value 2012 – GROUP Cost TPL* TOCI* Total GH¢’000 GH¢’000 GH¢’000 GH¢’000
Government Securities 50,371 _ _ 50,371
Due from Other Banks & Fin. Institutions 54,433 25,710 _ 80,143
Loans & Advances to Customers 195,697 229,267 _ 424,964
Equity Investment _ 188 _ 188
300,501 255,165 _ 555,666
2011 – GROUP
Government Securities 65,718 _ _ 65,718
Due from Other Banks & Fin. Institutions 67,300 32,327 _ 99,627
Loans & Advances to Customers 155,413 137,848 _ 293,261
Equity Investment _ 188 _ 188
288,431 170,363 _ 458,794
2012 – BANK
Government Securities 50,371 _ _ 50,371
Due from Other Banks & Fin. Institutions 54,433 25,710 _ 80,143
Loans & Advances to Customers 195,941 229,267 _ 425,208
Equity Investment _ _ 6,366 6,366
300,745 254,977 6,366 562,088
2011 – BANK
Government Securities 65,718 _ _ 65,718
Due from Other Banks & Fin. Institutions 67,300 32,327 _ 99,627
Loans & Advances to Customers 155,413 137,848 _ 293,261
Equity Investment _ _ 6,366 6,366
288,432 170,174 6,366 464,972
*NOTE: TPL means Through Profit or Loss TOCI means Through Other Comprehensive Income
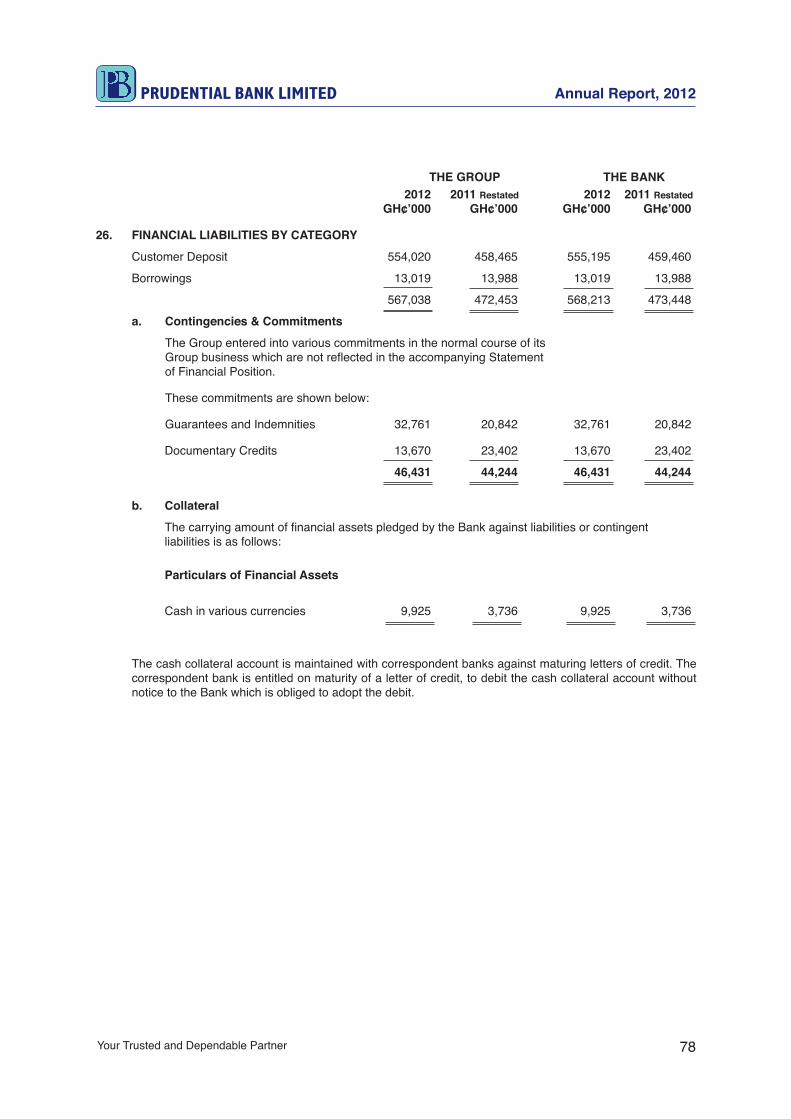
Your Trusted and Dependable Partner 78
Annual Report, 2012PRUDENTIAL BANK LIMITED
THE GROUP THE BANK 2012 2011 Restated 2012 2011 Restated GH¢’000 GH¢’000 GH¢’000 GH¢’000
26. FINANCIAL LIABILITIES BY CATEGORY
Customer Deposit 554,020 458,465 555,195 459,460
Borrowings 13,019 13,988 13,019 13,988
567,038 472,453 568,213 473,448
a. Contingencies & Commitments The Group entered into various commitments in the normal course of its Group business which are not reflected in the accompanying Statement of Financial Position.
These commitments are shown below:
Guarantees and Indemnities 32,761 20,842 32,761 20,842
Documentary Credits 13,670 23,402 13,670 23,402
46,431 44,244 46,431 44,244
b. Collateral
The carrying amount of financial assets pledged by the Bank against liabilities or contingent liabilities is as follows:
Particulars of Financial Assets 2012 2011 2012 2011 GH¢’000 GH¢’000 GH¢’000 GH¢’000
Cash in various currencies 9,925 3,736 9,925 3,736
The cash collateral account is maintained with correspondent banks against maturing letters of credit. The correspondent bank is entitled on maturity of a letter of credit, to debit the cash collateral account without notice to the Bank which is obliged to adopt the debit.
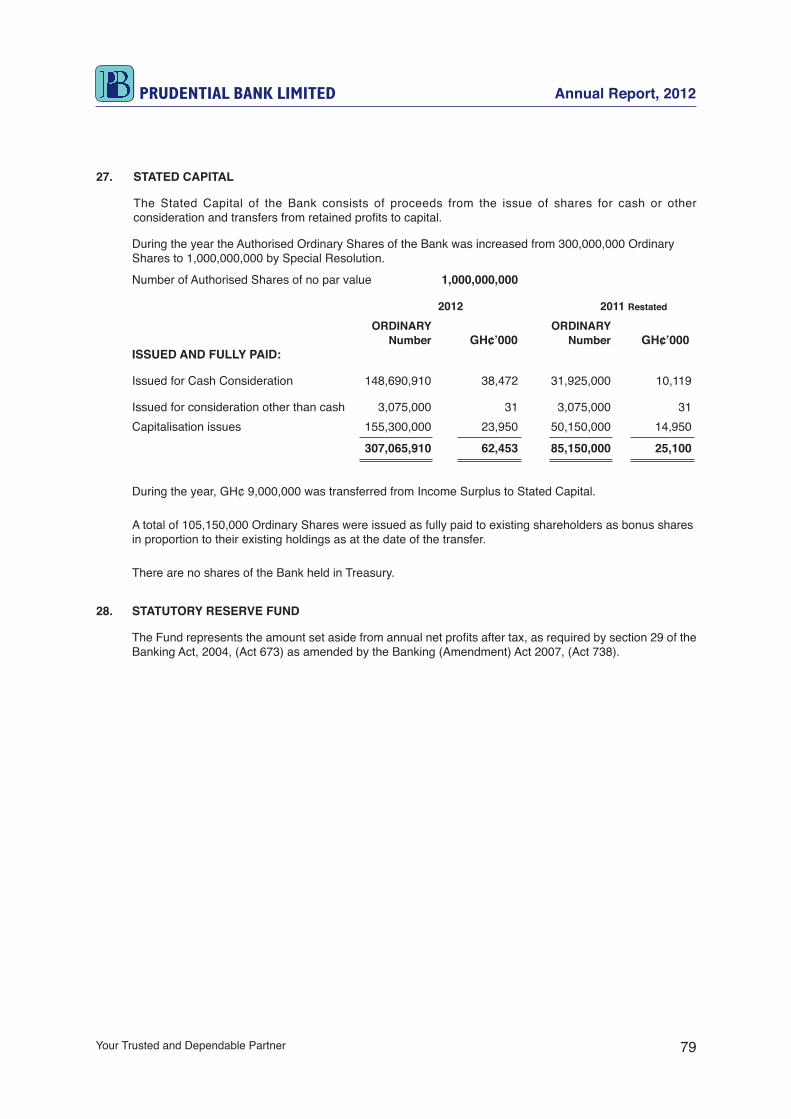
Your Trusted and Dependable Partner
Annual Report, 2012
79
PRUDENTIAL BANK LIMITED
27. STATED CAPITAL
The Stated Capital of the Bank consists of proceeds from the issue of shares for cash or other consideration and transfers from retained profits to capital.
During the year the Authorised Ordinary Shares of the Bank was increased from 300,000,000 Ordinary Shares to 1,000,000,000 by Special Resolution.
Number of Authorised Shares of no par value 1,000,000,000
2012 2011 Restated ORDINARY ORDINARY Number GH¢’000 Number GH¢’000 ISSUED AND FULLY PAID:
Issued for Cash Consideration 148,690,910 38,472 31,925,000 10,119
Issued for consideration other than cash 3,075,000 31 3,075,000 31 Capitalisation issues 155,300,000 23,950 50,150,000 14,950
307,065,910 62,453 85,150,000 25,100
During the year, GH¢ 9,000,000 was transferred from Income Surplus to Stated Capital.
A total of 105,150,000 Ordinary Shares were issued as fully paid to existing shareholders as bonus shares in proportion to their existing holdings as at the date of the transfer.
There are no shares of the Bank held in Treasury.
28. STATUTORY RESERVE FUND
The Fund represents the amount set aside from annual net profits after tax, as required by section 29 of the Banking Act, 2004, (Act 673) as amended by the Banking (Amendment) Act 2007, (Act 738).

Your Trusted and Dependable Partner 80
Annual Report, 2012PRUDENTIAL BANK LIMITED
29. SUMMARY OF CURRENCY EXPOSURES AT YEAR END IN CEDI EQUIVALENTS OF THE FOLLOWING MAJOR FOREIGN CURRENCIES
USD GBP Euro Others 2012 2011 Total Total ASSETS GH¢’000 GH¢’000 GH¢’000 GH¢’000 GH¢’000 GH¢’000
Cash and balances with BOG 10,525 2,087 2,194 _ 14,806 10,190
Due from Other Banks 23,937 8,465 38,456 _ 70,858 73,746
Loans & Advances 124,840 315 788 _ 125,943 63,557
Other Assets _ _ _ _ _ 219
159,302 10,867 41,438 - 211,607 147,712
LIABILITIES
Due to Customers 150,680 10,470 37,145 _ 198,295 134,484
Other Liabilities 7,200 225 2,431 _ 9,856 14,775
157,880 10,695 39,576 _ 208,151 149,260 NET ON BALANCE SHEET POSITION 1,422 172 1,862 _ 3,456 (1,547)
Off Balance Sheet Credit Items
Letters of Credits 3,688 _ 438 _ 4,126 3,190
Bonds and Guarantees 13,261 _ _ 2,361 15,622 4,669
16,949 _ 438 2,361 19,748 7,859

Your Trusted and Dependable Partner
Annual Report, 2012
81
PRUDENTIAL BANK LIMITED
30. MATURITY ANALYSIS OF ASSETS AND LIABILITIES – BANK
Liquidity Gap
This measures the ability of the Bank to meet demands of Depositors and other suppliers on its liquid assets and is measured as the difference between the assets of the bank and its liabilities or financial obligations.
This gap as measured at the close of business on 31st December 2012 was as follows:
TOTAL 0-3 Months 3-6 Months 6-12 Months Over 1 Year GH¢’000 GH¢’000 GH¢’000 GH¢’000 GH¢’000
Cash and Bank Balances 79,645 79,645 _ _ _ Government Securities 50,371 6,779 142 5,013 38,437 Due from Banks/Financial institution 80,143 65,092 12,064 2,987 _ Taxation 2,846 2,846 _ _ _ Equity Investment 6,366 _ _ _ 6,366 Loans and Advances 425,207 163,530 74,287 87,179 100,211 Other Assets 5,016 2,513 160 320 2,022 Property, Plant & Equipment 24,899 1,176 3,735 6,225 13,763 Intangible Assets 2,113 _ _ _ 2,113
TOTAL ASSETS 676,607 321,581 90,389 101,724 162,913
Customer Deposits 555,195 107,440 72,449 63,694 311,612 Other Liabilities 21,848 8,099 8,021 1,932 3,797 Deferred Tax 1,450 _ _ 1,450 _ Borrowings 13,019 19 _ 7,009 5,991
TOTAL LIABILITIES 591,512 115,557 80,469 74,085 321,400
Liquidity Gap 78,960 206,073 9,919 27,634 (164,666)
Proportion of Assets to Liabilities 1.14 2.78 1.12 1.37 0.51
31st December 2011 Total Assets 549,778 259,134 93,152 89,665 107,827 Total Liabilities 502,652 106,358 73,519 54,873 267,902 Liquidity Gap 47,125 152,776 19,633 34,792 (160,075)
Proportion of Assets to Liabilities 1.09 2.44 1.27 1.63 0.40
BY ORDER OF THE BOARD
………………………………………….....) ) ) ) DIRECTOR ) …………………………………………..... ) ACCRA
……………………………….........… 2013
7TH MARCH

Your Trusted and Dependable Partner 82
Annual Report, 2012PRUDENTIAL BANK LIMITED
31.0 RISK MANAGEMENT
31.1 Overview
Risk is inherent in every material business activity of the Bank. The nature of the Bank’s operations exposes it to, credit, market, liquidity, operational, compliance, strategic and reputational risks. To ensure that the Bank takes only measured risks, PBL has integrated risk management in its daily business activities, processes and procedures.
The Bank has established a comprehensive risk management framework for managing the risks inherent in its operations at all times and levels throughout the Bank. The risk management framework ensures the identification, measurement and control of credit, market, liquidity and operational risks at all levels in the Bank with a view to safeguarding its integrity, reputation and financial strength. The risk management framework also contains details of the Bank’s risk governance structure.
PBL maintains a risk governance structure geared towards strengthening risk identification, measurement, management and control whilst positioning the Bank to manage the changing regulatory environment in an efficient and effective manner. The risk governance structure ensures oversight of and accountability for, the effective management of risks inherent in the Bank’s operations.
The Bank uses the ‘three lines of defence model for managing risks. The model ensures that risk management is performed at all levels of the Bank’s operations. This approach provides a clear allocation of responsibilities for the ownership and management of risks as follows:
i. In the first line of defence, heads of divisions, departments and branch managers are primarily responsible for managing risks inherent in their business units. These departments and branches continuously assess and evaluate risks associated with their day-to-day operations. The process ensures strict adherence to the Bank’s operational policies, procedures and controls.
ii. The second line of defence consists of dedicated risk management committees carefully created to assist the first line of defence in the implementation of risk management procedures approved by the Board.
iii. The third line of defence consists of the Internal Control Division comprising Branch Inspection, Systems Audit and Internal Audit as well as the Compliance and Risk Management Departments. These departments provide an independent assessment and validation of the adequacy and effectiveness of the overall risk management function and governance structures of the Bank and report independently to the Board. External Auditors also have a statutory duty to provide an independent opinion on the Bank’s financial statements and the adequacy of the Bank’s accounting systems to the Board of Directors, Shareholders and Bank of Ghana.

Your Trusted and Dependable Partner
Annual Report, 2012
83
PRUDENTIAL BANK LIMITED
The risk governance system of the Bank is multi-faceted, involving the Board of Directors and management level committees. At the highest level, the Board of Directors, supported through the Audit and Risk Management sub-committee of the Board determines the risk strategy, policy, limits and appetite for the Bank. The board regularly reviews the Bank’s risk exposure to enable them take appropriate risk related decisions.
The risk management department assists management in the formulation of the overall policies, including various risk management strategies and control. The Department also provides a review of the overall risk profile from time to time. The Head of the Risk Management department is responsible for coordinating the risk management activities of the various committees, divisions and departments of the Bank and is primarily responsible for ensuring that the Bank’s risk profile is consistent with its financial resources and the risk appetite defined by the Board.
31.2 Categories of Risks
The major types of risks confronting the Bank include the following:
Liquidity Risk: This is the risk that the Bank will be unable to meet customers’ withdrawals, committed loans and advances disbursements and other payment obligations as they fall due.
Credit Risk: This risk arises from the possibility that the bank will incur losses from the failure of customers or counter parties to repay credit facilities granted them and/or to discharge their obligations under contingent liabilities.
Market Risk: This is the possible negative impact on the operations of the Bank resulting from movements in interest and foreign exchange rates as well as movements in general market prices.
Operational Risk: This is the risk of losses resulting from inadequate or failed internal processes, people, systems and external events.
Compliance Risk: This is the risk of legal or regulatory sanctions, material financial loss or loss of reputation PBL may suffer as a result of its failure to comply with banking laws, regulations, rules, internal management directives and other codes of conduct applicable to the banking industry.
Strategic Risk: This is the risk that results from adverse business decisions, ineffective or inappropriate business plans and strategy execution or failure to respond to changes in the competitive environment, business cycles, customer preferences, product obsolescence or other risks inherent in the operations of the Bank including reputational risk.
Reputation Risk: This is the risk that any negative publicity involving the Bank could damage its public image.

Your Trusted and Dependable Partner 84
Annual Report, 2012PRUDENTIAL BANK LIMITED
The risk management framework of the Bank is therefore designed to enable the Bank identify, measure, manage and control the risks mentioned above.
31.3 Liquidity Risk
Liquidity risk is the potential loss to the Bank arising from either its inability to meet its maturing short term obligations as they fall due or to fund increases in assets without incurring unacceptable costs. The management of this risk enables the Bank to minimise the mismatch in the timing of cash flows relating to its assets and liabilities and also ensures that it regularly maintains the primary reserve requirement of Bank of Ghana.
Liquidity risk could occur if customers suddenly withdraw more funds than expected which cannot be met from the Bank’s available cash resources, from selling or pledging assets, or by borrowing funds from third parties. Liquidity risk could also occur if the Bank is unable to meet the primary reserve required by Bank of Ghana or meet committed loan disbursements.
The main objective of the Bank’s liquidity risk management is to maintain sufficient liquidity to ensure safe and sound operations and also minimise the mismatch in the timing of cash flows relating to its assets and liabilities. For this reason, the Bank considers liquidity risk from three different perspectives namely structural, tactical and contingency liquidity risks.
Structural liquidity risk arises from the Bank’s inability to finance the long term balance sheet on time or at a reasonable cost. Structural liquidity risk is controlled by managing the structure of assets and liabilities in the balance sheet on a going concern basis. This is aimed at achieving a sound liquidity profile through the following:
i. Maintenance of a well diversified funding mix of customer deposits and borrowings (both secured and unsecured) through a Bank-wide coordinated funding strategy. The Bank funds a substantial portion of its lending activities through customer deposits, which stood at GH¢555.1 million and GH¢459.5 million at December 31, 2012 and 2011 respectively.
ii. Holding a broad portfolio of high grade securities in a form of defensive investments that can be used to obtain secured funding from the Repo market. These investments are mainly held in Government of Ghana Securities with structured maturities. The Bank had unencumbered defensive investments of GH¢50.3 million at the end of December 2012;
iii. Maintaining a structural liquidity gap, taking into consideration the asset mix and funding possibilities of the Bank.

Your Trusted and Dependable Partner
Annual Report, 2012
85
PRUDENTIAL BANK LIMITED
The Bank’s exposure to liquidity risk as measured by the gap analysis in note 30 is summarized in Table 1 below.
This measures the ability of the Bank to meet demands of depositors and other obligations from its liquid assets.
Table 1: Summary of Liquidity Risk exposure
TOTAL 0-3 Months 3-6 Months 6-12 Months Over 1 Year GH¢’000 GH¢’000 GH¢’000 GH¢’000 GH¢’000
31st December 2012
Total Assets 676,607 321,581 90,389 101,724 162,913 Total Liabilities 591,512 115,557 80,469 74,085 321,400 Liquidity Gap 78,960 206,073 9,919 27,634 (164,666)
Proportion of Assets to Liabilities 1.14 2.78 1.12 1.37 0.51
31st December 2011 Total Assets 549,778 259,134 93,152 89,665 107,827 Total Liabilities 502,652 106,358 73,519 54,873 267,902 Liquidity Gap 47,125 152,776 19,633 34,792 (160,075)
Proportion of Assets to Liabilities 1.09 2.44 1.27 1.63 0.40
The gap analysis above matches the qualified liquid assets and liabilities in the various time bands based on the remaining number of days to the contractual maturity dates. The unmatched position (gap) indicates the Bank’s exposure to liquidity risk. The analysis shows that the Bank is well positioned to meet its short term liquidity needs as shown by the positive gaps for the 12 month period.
Tactical liquidity risk is the risk arising from the shortage of short-term cash to meet customers’ withdrawals or maturing obligations. It gives rise to the need for day to day liquidity management. The Treasury department is responsible for managing the day-to-day liquidity needs of the Bank while branch managers are responsible for managing daily liquidity at their respective branches by ensuring that customer withdrawals are met without problems.
The Treasury department measures and monitors the daily liquidity position by generating daily liquidity reports which summarises the daily cash inflows and outflows and reserve requirements and reports same to senior management.
Contingency liquidity risk relates to planning for liquidity management under stress conditions. It is the Bank’s policy to have adequate and up to date contingency funding plans to enable the Bank to respond effectively to liquidity stress events at various levels of severity. These policies are based on stress scenarios and include potential funding strategies. Executive Management, with the assistance of the Treasurer is responsible for the activation of the Bank’s liquidity risk contingency plan.
Your Trusted and Dependable Partner 86
Annual Report, 2012PRUDENTIAL BANK LIMITED
The Treasury Committee met regularly to review the liquidity position of the Bank in line with the treasury and investment policy of the Bank. The Bank maintained a healthy liquidity position throughout 2012.
31.4 Credit Risk
Credit Risk arises where a borrower defaults in repaying a credit facility or a counter-party is unwilling to perform an obligation or its ability to perform such obligation is impaired thereby resulting in financial loss to the Bank.
The principal sources of credit risk inherent in the Bank’s operations arise from loans and advances to customers as well as off Statement of Financial Position transactions such as guarantees, undertakings and Letters of credit.
The Bank manages credit risk through well structured systems and controls which ensure that relevant committees meet to take appropriate actions on credit reports with the view to controlling credit risk at various stages of the credit delivery process. The Bank pursues a prudent policy for granting credit facilities to customers.
The Bank also applies the Know Your Customer (KYC) principle when granting credit facilities to customers. In other words, credit facilities are granted to businesses whose management, integrity and expertise are known and considered acceptable by the Bank. In addition, the Bank adequately assesses the financial performance of borrowers’ businesses before granting credit facilities to such businesses.
Credit facilities granted to customers, both corporate and retail, are closely monitored on a continual basis to uncover early warning signals of non-performance. The objective of this early warning system is to address potential problems while adequate alternatives for action are still available.
The early risk detection is a tenet of the Bank’s credit culture and is intended to ensure that greater attention is paid to credit exposures in order to effectively manage such exposures and maximize loan recovery.
The Bank requires first class collateral to secure credit facilities granted to borrowers. Collateral is security in the form of an asset or third-party obligation that serves to mitigate the inherent risk of credit loss in an exposure, by either substituting the borrower default risk or improving recoveries in the event of a default. While collateral can be an alternative source of repayment, it does not mitigate or compensate for a borrowers questionable reputation.
The maximum amount of credit risk of the Bank at the end of Years 2012 and 2011 emanating from the above mentioned risk sources is depicted in Pie Charts 1 and 2 below:

Your Trusted and Dependable Partner
Annual Report, 2012
87
PRUDENTIAL BANK LIMITED
Collateral held as security against these risks consist mainly of mortgage of landed property, cash and Government securities.
GH¢457.5m
GH¢32.7m GH¢13.6m
Pie Chart 1: Analysis of Total Credit Risk in Year 2012 (GH¢503.9m)
Loans and Advances to customers Bonds, Guarantees & UndertakingsLetter of Credit
GH¢457.5m
GH¢32.7m GH¢13.6m
Pie Chart 1: Analysis of Total Credit Risk in Year 2012 (GH¢503.9m)
Loans and Advances to customers Bonds, Guarantees & UndertakingsLetter of Credit
GH¢315.9m
GH¢20.8m
GH¢23.4m
Pie Chart 2: Analysis of Total Credit Risk in Year 2011 (GH¢360.2m)
Loans and Advances to customers Bonds, Guarantees & UndertakingsLetter of Credit

Your Trusted and Dependable Partner 88
Annual Report, 2012PRUDENTIAL BANK LIMITED
The loans and advances portfolio for Years 2012 and 2011 is further analyzed in terms of quality as shown in Pie Charts 3 and 4:
The fair value of collateral security held on “Past due but not imparied” and “Impaired” at the end of Year 2012 is GH¢33.3m.
GH¢405.9m
GH¢7.77m
GH¢43.8m
Pie Chart 3: Further Analysis of Loans and Advances portfolio for 2012 GH¢457.5m
Neither past due nor impaired
Past due but notimpairedImpaired
GH¢277.8m
GH¢18.7mGH¢19.3m
Pie Chart 4: Further analysis of Loans and Advances portfolio for 2011 GH¢315.9m
Neither past due nor impairedPast due but not impairedImpaired
The fair value of collateral security held on “Past due but not impaired” and “Impaired” at the end of Year 2011 is GH¢31.7m.

Your Trusted and Dependable Partner
Annual Report, 2012
89
PRUDENTIAL BANK LIMITED
Credit Concentration Risk
The Bank monitors credit concentration risks by business segment and by type of customer.
Credit Concentration Risk by Business Segment
An analysis of credit concentration risks by business segment as at the end of Years 2012 and 2011 is shown in the Bar Chart below:
Credit Concentration Risk by type of customer
An analysis of credit concentration risk by type of customer is shown in Table 2 below:
TABLE 2: ANALYSIS OF LOANS AND ADVANCES BY TYPE OF CUSTOMER
2012 2011 GH¢’m GH¢’mIndividuals 9.6 5.7Other Private Enterprises 423.9 289.9Government departments and agencies 5.7 4.0Public Enterprises 4.0 3.7Staff 14.0 12.6
457.2 315.9
0
20
40
60
80
100
120
140
160
Agr
icul
ture
Min
ing
&
Qua
rryi
ng
Man
ufac
turin
g
Con
stru
ctio
n
Util
ities
Com
mer
ce a
nd
Fin
ance
Tran
spor
t &
Com
mun
icat
ion
Ser
vice
s
Mis
cella
neou
s
4.0 4.9
36.1 33.3
22.7
143.6
22.5
109.3
80.9
4.1 1.6
28.924.8
18.4
93.7
23.2
74.4
46.82012
2011
Analysis of Loans and Advances by Business Segment (GH¢’m)

Your Trusted and Dependable Partner 90
Annual Report, 2012PRUDENTIAL BANK LIMITED
31.5 Market Risk
Market risk is the potential for losses arising from movements in interest rates, exchange rates, equity prices and commodity prices. PBL is currently exposed to interest rate and foreign exchange rate risks with no exposure to equity or commodity price risks.
The interest rate and exchange rate risks are inherent in the Bank’s financial assets and liabilities such as loans, customer deposits, borrowings, securities and foreign exchange trading activities.
Interest rate risk arises when there is a mismatch between positions which are subject to interest rate adjustment within a specified period. The Bank’s lending, investment and funding activities gives rise to interest rate risk because it carries a mix of both fixed and floating rate assets and liabilities on its books that are subject to re-pricing periodically.
Potential mismatches in interest rate sensitive assets and liabilities are caused by the following:
a. Movement in market interest rate;
b. Generation of new interest rate sensitive assets and liabilities;
c. Movement of interest rate sensitive assets and liabilities from one time band to another.
The Bank employs an interest rate sensitivity model (Gap analysis) to measure and monitor interest rate sensitive assets and liabilities. The model is based on the classification of interest rate sensitive assets and liabilities into particular time bands with regards to maturity.
The Bank’s interest rate risk management strategy is based on a variable (floating) interest rate pricing policy in pricing its assets and to a large extent its liabilities. This allows the Bank to re-price its assets and liabilities in tandem with changes in market rates to ensure that changes in interest rates always result in an increase in net interest income. The Bank ensures that the re-pricing structure of the balance sheet generates maximum benefits from interest rate movements.
The Bank also applies the matched-funding principle which requires that the amount of interest rate sensitive assets must at least be equal to the amount of interest rate sensitive liabilities in a particular time band. The Bank’s strategy is to maintain an overall position of interest sensitive assets greater than interest sensitive liabilities.
Exchange rate risk is the potential loss of income and capital arising from movements in exchange rates of currencies in which the Bank has positions or commitments.
PBL measures its exposure to foreign exchange rate risk by using the Net Open Foreign Exchange position. The Bank, on a daily basis computes the net open position for each foreign currency for which the Bank has a position. The net open position is then stress tested against variations in the exchange rate of each of the currencies to determine
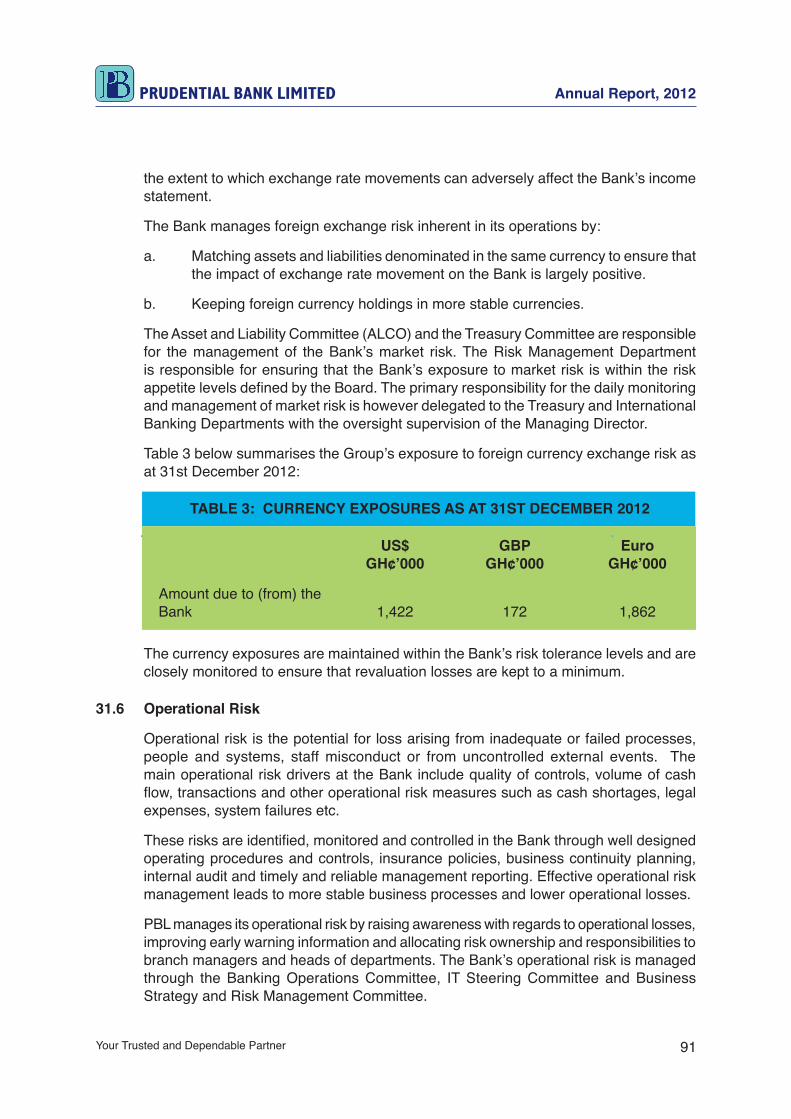
Your Trusted and Dependable Partner
Annual Report, 2012
91
PRUDENTIAL BANK LIMITED
the extent to which exchange rate movements can adversely affect the Bank’s income statement.
The Bank manages foreign exchange risk inherent in its operations by:
a. Matching assets and liabilities denominated in the same currency to ensure that the impact of exchange rate movement on the Bank is largely positive.
b. Keeping foreign currency holdings in more stable currencies.
The Asset and Liability Committee (ALCO) and the Treasury Committee are responsible for the management of the Bank’s market risk. The Risk Management Department is responsible for ensuring that the Bank’s exposure to market risk is within the risk appetite levels defined by the Board. The primary responsibility for the daily monitoring and management of market risk is however delegated to the Treasury and International Banking Departments with the oversight supervision of the Managing Director.
Table 3 below summarises the Group’s exposure to foreign currency exchange risk as at 31st December 2012:
TABLE 3: CURRENCY EXPOSURES AS AT 31ST DECEMBER 2012
US$ GBP Euro GH¢’000 GH¢’000 GH¢’000
Amount due to (from) the Bank 1,422 172 1,862
The currency exposures are maintained within the Bank’s risk tolerance levels and are closely monitored to ensure that revaluation losses are kept to a minimum.
31.6 Operational Risk
Operational risk is the potential for loss arising from inadequate or failed processes, people and systems, staff misconduct or from uncontrolled external events. The main operational risk drivers at the Bank include quality of controls, volume of cash flow, transactions and other operational risk measures such as cash shortages, legal expenses, system failures etc.
These risks are identified, monitored and controlled in the Bank through well designed operating procedures and controls, insurance policies, business continuity planning, internal audit and timely and reliable management reporting. Effective operational risk management leads to more stable business processes and lower operational losses.
PBL manages its operational risk by raising awareness with regards to operational losses, improving early warning information and allocating risk ownership and responsibilities to branch managers and heads of departments. The Bank’s operational risk is managed through the Banking Operations Committee, IT Steering Committee and Business Strategy and Risk Management Committee.
Your Trusted and Dependable Partner 92
Annual Report, 2012PRUDENTIAL BANK LIMITED
31.7 Compliance Risk
This is the risk of legal or regulatory sanctions, material financial loss or damage to the Bank’s reputation as a result of failure to comply with banking laws, regulations, rules, internal management directives and other codes of conduct and practices applicable to the banking industry. Thus, compliance risk exposes the Bank not only to reputational damage, payment of fines, court orders, and civil money penalties but can also lead to loss of business opportunities and diminished ability to expand key operations. Compliance failures can therefore have an adverse impact on the Bank’s customers, staff as well as shareholders.
Managing compliance risk is thus fundamental to driving shareholder value. That is, the pursuit of a sustainable long term profits objective requires the Bank to conduct its operations in accordance with high ethical standards to reflect compliance with the relevant laws, regulatory directives and its core values of integrity, professionalism, honesty, and fairness.
The Bank’s approach to managing compliance risk is proactive. The Bank has clear and accessible policies and procedures embedded in its operations to forestall possible compliance failures. These policies and procedures include a comprehensive system of internal controls aimed at ensuring continuous improvement in compliance risk management.
The Bank has a Compliance Department which focuses on managing compliance risks specific to the operations of the Bank. The responsibility of the department is to proactively identify, assess and monitor compliance risks faced by the Bank and also assist management in fulfilling its compliance responsibilities. The Compliance Department supports divisions and departments of the Bank to comply with current and emerging compliance developments such as Anti-Money Laundering and Counter Financing of Terrorism (AML/CFT) and also works closely with all relevant divisions and departments, especially Legal, Internal Control and Finance to minimise compliance failures.
The AML Act, 2008 (Act 749) and the AML Regulations, 2011 (L. I. 1987) as well as the AML Guidelines issued jointly by the Financial Intelligence Centre (FIC) and Bank of Ghana (BoG) impose significant requirements on the Bank in terms of customer identification, record keeping, training as well as the obligations to identify, prevent and report money laundering and terrorist financing issues to the FIC. The Bank is committed to continually improving its AML control measures in order to prevent economic and financial criminals from using its products and services to further their illegal activities.
Employees of the Bank are made aware of their responsibilities under the compliance risk management framework of the Bank through induction and ongoing training and awareness programmes. The topics covered in these programmes include AML/CFT, regulatory expectations and developments in the compliance environment, among others.
The Head of Compliance reports independently to the Audit & Risk Management Sub-Committee of the Board.

Your Trusted and Dependable Partner
Annual Report, 2012
93
PRUDENTIAL BANK LIMITED
31.8 Reputational Risk
Reputational risk refers to the potential reputational damage that a company or an institution could suffer from any adverse or negative publicity about the company or the institution concerned. Prudential Bank, like any other institution is confronted with reputational risk. That is, any negative publicity about the Bank could impair public confidence in the Bank and thereby cause a decline in its customer base or reduction in the volume of business transacted by customers.
Reputational risk may result from any operational issue that causes disaffection to customers and other stakeholders as the Bank could be perceived as not being efficient, customer friendly or not being reliable. The major sources of reputational risk include system failures, unnecessary litigation, dealing with customers who engage in illegal business activities etc.
Internal operational issues such as system breakdown, employee errors, employee fraud etc may expose PBL to serious reputational risk. In managing reputational risk emanating from these sources, the Bank has put in place appropriate measures and controls that ensure that system breakdowns and bookkeeping errors are checked at every level of operation in order to minimise their impact on customers and other stakeholders. These controls form part of the daily operational procedures of the Bank.
Unnecessary litigation is also another source of reputational risk to the Bank. The Bank manages reputational risk resulting from avoidable litigation by ensuring that any misunderstanding between the Bank and its customers is resolved in a cordial way.
The Bank’s reputation depends not only on the way it conducts its business but also the way its customers conduct themselves. Thus, dealing with customers whose activities border on illegality, such as money laundering, is a source of reputational risk to the Bank. To manage this type of risk and to avoid becoming associated with economic and financial criminals or being used as a conduit for channelling illegal monies into the country, PBL uses Know Your Customer (KYC) procedures to screen potential customers and also monitors customers account operations to ensure that customers who open accounts with the Bank are engaged in legitimate businesses. PBL also monitors customers’ account operations to ensure that deposits into accounts are consistent with the type of business customers are engaged in. The Bank conducts due diligence on companies and their directors before bank accounts are opened.
Management has made it the responsibility of every member of staff to safeguard the reputation of the Bank. The Bank’s reputational risk management also revolves around effective communication between the Bank and its customers. This is achieved through daily monitoring of customer complaints and media reportage about the Bank for prompt resolution of the concerns raised or any adverse publicity.

Your Trusted and Dependable Partner 94
Annual Report, 2012PRUDENTIAL BANK LIMITED
31.9 Strategic Risk Management
Strategic risk is inherent in every business and is one of the major risk categories in the banking industry along with credit, market, liquidity, compliance, operational and reputational risks. It is the risk that results from adverse business decisions, ineffective or inappropriate business plans and strategy execution, or failure to respond to changes in the competitive environment, business cycles, customer preferences, product obsolescence or other risks inherent in the operations of the Bank including reputational risk. In the banking industry, strategic risk is elevated due to changing customer preferences and competitive pressures. The Bank’s appetite for strategic risk is assessed within the context of its strategic plan. Strategic risk is managed in the context of PBL’s overall financial condition and assessed, and acted on by the Managing Director and Executive Management team. Significant strategic actions, such as capital actions and branch expansion, require review and approval of the Board.
The Board approves a strategic plan and annually reviews and approves a financial operating plan developed by Executive Management to implement the strategic goals for that year. With oversight by the Board, Executive Management ensures that the annual plans are consistent with the Bank’s strategic plan, core operating tenets and risk appetite. The Board assesses the following areas as part of their annual review:
• Forecast earnings and returns on capital,
• Current risk profile,
• Current capital and liquidity requirements,
• Staffing levels and changes required to support the plan,
• Stress testing results and other qualitative factors such as industry growth and peer analysis.
The Executive Management Team also monitors the performance of new products introduced against product expectation.

Your Trusted and Dependable Partner
Annual Report, 2012
95
PRUDENTIAL BANK LIMITED
32. CAPITAL
The Objectives of Capital Management
The primary objective of capital management in the Bank is to ensure that:-
• it complies with the minimum stated capital requirement of Bank of Ghana;
• it complies with the regulatory capital requirement that enables it to meet the minimum Capital Adequacy Ratio requirements of Bank of Ghana at all times;
• its operations would increase the level of profitability and maximise shareholder value;
The achievement of the above objectives is monitored through regular reports on the performance of the Bank and prudential returns submitted to Bank of Ghana.
Capital Description
The Bank’s Regulatory Capital consists of both Tier 1 and Tier 2 capital. Tier 1 capital consists of stated capital, statutory reserves and income surplus, which includes current and previous year’s retained earnings. Tier 2 capital consists of subordinated term debts, convertible debentures and revaluation surpluses.
The current level of the Bank’s capital which complies with the existing minimum capital requirement of Bank of Ghana is summarised below.
The Level of Capital Adequacy
2012 2011 GH¢’000 GH¢’000
Paid Capital 62,453 25,100 Disclosed Reserves 16,056 15,672
Tier 1 Capital 78,509 40,772 Tier 2 Capital 5,500 9,980 Regulatory Capital 84,009 50,752 Required Regulatory Capital (55,318) (38,637)
Surplus Capital 28,691 12,115
Capital Adequacy Ratio 14.95% 11.65%
The Bank’s regulatory capital was above the required minimum throughout the year.

Your Trusted and Dependable Partner 96
Annual Report, 2012PRUDENTIAL BANK LIMITED
33. SHAREHOLDERS The shareholders of the Bank are:
Percentage Name No. of Shares Holding
1. J. S. Addo Consultants Limited 76,208,525 24.82
2. Mr. Kwesi Atuah 38,254,761 12.46
3. Trustees of PBL Staff Provident Fund 34,325,146 11.18
4. Ghana Union Assurance 33,831,478 11.02
5. Mr. N.K. Omaboe 32,030,000 10.43
6. Mr. Frank Owusu 24,615,385 8.02
7. Mr. Stephen Sekyere-Abankwa 16,015,000 5.21
8. Mr. Kofi O. Esson 15,384,615 5.01
9. National Trust Holding Company Limited 14,560,000 4.74
10. Social Security & National Insurance Trust 14,560,000 4.74
11. Mr. John K. Addo 7,281,000 2.37
TOTAL 307,065,910 100.00

Your Trusted and Dependable Partner
Annual Report, 2012
97
PRUDENTIAL BANK LIMITED
Branch Network

Your Trusted and Dependable Partner 98
Annual Report, 2012PRUDENTIAL BANK LIMITED

Your Trusted and Dependable Partner
Annual Report, 2012
99
PRUDENTIAL BANK LIMITED
Staff of the new Mataheko Branch pose with Mrs. Mary Brown, Deputy Managing Director (Banking Operations), third from left and Mr. Joseph Okine-Afrane, Deputy Managing Director (Finance, Administration & Credit Administration), fifth from right at the branch opening. Other senior officials include Reverend Mrs. Akosua Otoo, Branch Inspection Department, first from left and Mrs. Adwoa Abankwa, Branch Manager, seventh from right.

Your Trusted and Dependable Partner 100
Annual Report, 2012PRUDENTIAL BANK LIMITED
Your Trusted and Dependable Partner
Annual Report, 2012
101
PRUDENTIAL BANK LIMITED
GREATER ACCRA REGIONHEAD OFFICE8 Nima AvenueRing Road Central, AccraTel.: 233-302-781200-6Fax: 233-302-781210
RING ROAD CENTRAL BRANCH8 Nima AvenueRing Road Central, AccraTel.: 233-302-781179/78127Fax: 233-302-768421
ACCRA BRANCHSwanzy Shopping Arcade (Former Kingsway Building)Tel.: 233-302-671943, 678982Fax: 233-302-678942
MAKOLA BRANCH31st December Market, Makola, AccraTel.: 233-302-686638, 676639Fax: 233-302-676640
ABOSSEY OKAI BRANCHCap and May House, Ring Road West, AccraTel.: 233-302-669107, 669944, 664108/9Fax: 233-302-668126
TESANO BRANCHNsawam Road, TesanoNear Tesano Police StationTel Nos. 233-302-258170-2, 258174Fax No. 233-302-258173
ABEKA BRANCHApugu Towers, Abeka LapazAbeka,Tel : 233-302-220927, 220919, 220920Fax: 233-302-220929
SPINTEX ROAD BRANCH(Adjacent CCTC, Next to Coca-Cola Roundabout)Spintex Road,AccraTel.: 233-302-814409, 814399Fax: 233-302-812934
WEIJA BRANCH(Opposite Phastor Contrete Works)Accra-Winneba RoadAccraTel.: 233-302-853494/5Fax: 233-302-853496
ODORKOR BRANCHOff Accra-Winneba RoadOdorkor Traffic LightTel Nos. 233-302-311710, 311712Fax No. 233-302-311716
GICEL BRANCHGicel Estates,Weija, AccraTel.: 233-302-850174, 859175, 850176Fax: 233-302-850173
ZONGO JUNCTION BRANCHOblogo Road, Opposite the TotalFilling Station, Link RoadTel Nos. 233-302-678819/24Fax No. 233-302-678830
MADINA BRANCHAlbert HouseZongo JunctionMadina,AccraTel.: 233-302-511111, 511112Fax: 233-302-511485
VALLEY VIEW AGENCYValley View University CampusOyibiTel No. 233-27-7759333Fax No. 233-27-7900090
METHODIST UNIVERSITY COLLEGE AGENCYMethodist University College CampusDansomanTel: 233-302-302484,302485Fax: 233-302-302486
NORTH INDUSTRIAL AREA BRANCHMelcom PlusNo 3 Otublohum StreetNorth Industrial AreaTel: 233-302-221856, 221857, 221862Fax: 233-302-221875
ADENTAN BRANCH4A Lami Dwaahe StreetHousing Estate RoadAdentan Housing EstateTel: 233-302-501346, 501347Fax: 233-302-501345

Your Trusted and Dependable Partner 102
Annual Report, 2012PRUDENTIAL BANK LIMITED
KWAME NKRUMAH CIRCLE BRANCHOksart PlaceAdjacent Ernest Chemist Ring Road CentralKwame Nkrumah CircleTel: 233-302-246521, 246531,246513Fax: 233-302-246522MATAHEKO BRANCHNo. B439/15The Ground FloorIRS BuildingMatahekoTel: 233-289557928/9Fax: 233-577900081TEMA FISHING HARBOUR BRANCHTema Fishing HarbourHillpok YardTel. Nos. 233-303-207352/3Fax No. 233-303 207357TEMA COMMUNITY ONE BRANCHPrudential House,Off Krakrue RoadCommercial Area, TemaTel.: 233-303- 217160-2, 217140Fax: 233-303 217137INTERNATIONAL BANKING DEPT. 8 Nima AvenueRing Road Central, AccraTel.: 233-302-781184Fax: 233-302-781194CENTRAL REGIONCAPE COAST BRANCHPalm House,101/3 Commercial StreetCape CoastTel.: 233-3321-31575Fax: 233-3321-31576UNIVERSITY OF CAPE COAST BRANCHOye Inn, Behind The Science BlockUniversity of Cape CoastTel : 233-3321-35653, 35654Fax: 233-3321-35643WESTERN REGIONTAKORADI HARBOUR BRANCHTakoradi HarbourHarbour AreaTel Nos. 233-3120-21300, 21909, 21616, 31317Fax No. 233-3120-31371
TAKORADI MARKET CIRCLE62 Liberation RoadMarket CircleTel: 233-3120-27415, 27452, 27479Fax: 233-3120 27504
ASHANTI REGION
KUMASI BRANCHCocobod Jubilee HouseAdum, KumasiTel.: 233-3220-25667, 26210, 45426,45427 Fax: 233-3220-25917
ADUM BRANCHPrudential Plaza,(Formerly Unicorn House)Adum, KumasiTel.: 233-3220-83814,83811/2, 83816Fax: 233-3220-83815
AFFUL NKWANTA BRANCHNear Kumasi Children’s ParkTel No. 233-3220-49450/1/2Fax No. 233-3220-49455
ABOABO BRANCHNear The Traffic LightAboabo-Airport Dual Carriageway,Kumasi,Tel: 233-3220-47350/1/2Fax: 233-3220-47357
ATONSU BRANCH91 Block “A”Within Unity Oil Commercial ComplexAtonsuTel: 233-3220-80575, 83750, 83751Fax: 233-3220-80635
SUAME MAAKRO BRANCHTarkwa Maakro, New RoadKumasi,Tel: 233-3220 46717, 46720Fax: 233-3220-46897
NORTHERN REGION
TAMALE BRANCHQuality First Building (1st Floor)Opposite Main Taxi RankTamaleTel: 233-3720 27741, 27742Fax: 233-3720-27740
All our Branches are networked and customers can withdraw or pay in at any of them.
Your Trusted and Dependable Partner
Annual Report, 2012
103
PRUDENTIAL BANK LIMITED
CORRESPONDENT BANKS
CITIBANK N.A. 111 WALL STREET 19TH FLOOR NEW YORK, N.Y. 10043 U.S.A.
CITIBANK N.A. CITIBANK HOUSE P.O. BOX 78 336 THE STRAND LONDON WC2R 1HB UNITED KINGDOM
CITIBANK A.G. NEUE MAINZER STRASSE 75 60311 FRANKFURT MAIN GERMANY
BHF BANK AKTIENGESELLSCHAFT BOCKENHEIMER LANDSTRASSE 10 60323 FRANKFURT AM MAIN GERMANY
GHANA INTERNATIONAL BANK PLC 67 CHEAPSIDE 1ST FLOOR LONDON EC2V 6AZ UNITED KINGDOM
BANK OF BEIRUT (UK) LIMITED 17A CURZON STREET LONDON W1J 5HS UNITED KINGDOM

Your Trusted and Dependable Partner 104
Annual Report, 2012PRUDENTIAL BANK LIMITED
NOTICE OF ANNUAL GENERAL MEETING
We are pleased to give you notice of, and invite you to the Sixteenth (16th) Annual General Meeting of Prudential Bank Limited to be held at the Boardroom of the Head Office, No. 8 Nima Avenue, Ring Road Central, Accra, on Wednesday, 27th March, 2013, at 11am to transact the following business:
Agenda
1. To receive and consider the Reports of the Directors, Auditors and the Financial Statements of the Company for the year ended 31st December, 2012.
2. To re-elect the Auditors.
3. To authorize the Directors to determine the remuneration of the Auditors.
4. To approve non-executive Directors’ Fees.
5. To approve an increase in the number of Directors.
Dated this 7th day of March, 2013.
By Order of the Board
OSEI YAW OSAFOBOARD SECRETARY
Your Trusted and Dependable Partner
Annual Report, 2012
105
PRUDENTIAL BANK LIMITED
NOTES
1. A Member entitled to attend and vote at the meeting is entitled to appoint a proxy to attend and vote in place of that Member. A Proxy need not be a Member. A Proxy Form is attached.
2. The Proxy Form must be delivered by hand or post to The Secretary, Prudential Bank Limited, PMB, G.P.O No. 8 Nima Avenue, Ring Road Central, Kanda, Accra at least 24 hours before the appointed time for the Meeting.
3. A copy of the Audited Financial Statement is attached.

Your Trusted and Dependable Partner 106
Annual Report, 2012PRUDENTIAL BANK LIMITED