présentation powerpoint 2018...♦ currency impact of -2.9% (9m at -5.7%): appreciation of the euro...
TRANSCRIPT

Q3 revenue
October 25, 2018
2018
Q3 2018 revenue – October 25, 2018
DISCLAIMER
This presentation contains statements related to our future business and financial performance and futureevents or developments involving Bureau Veritas that may constitute forward-looking statements. Thesestatements are based on current plans and forecasts of Bureau Veritas’ management and may be identifiedby words such as “expect”, “forecast”, “look forward to”, “anticipate”, “intend”, “plan”, “believe”, “seek”,“estimate”, “will”, “project” or words of similar meaning.
Such forward-looking statements are by their nature subject to a number of risks, uncertainties and factors,including without limitation those described in the Document de référence filed with the French Autorité desmarchés financiers (“AMF”), that could cause actual results to differ from the plans, objectives andexpectations expressed in such forward-looking statements.
These forward-looking statements speak only as of the date on which they are made, and Bureau Veritasundertakes no obligation, except to the extent required by law, to update or revise any of them, whether as aresult of new information, future events or otherwise.
© Copyright Bureau Veritas

Q3 2018 revenue agenda
► Highlights
► Financial Review
► Business Review
► Outlook
► Q&A
► Appendix

Highlights
Q3 2018 revenue – October 25, 2018
Q3 2018 highlights
5
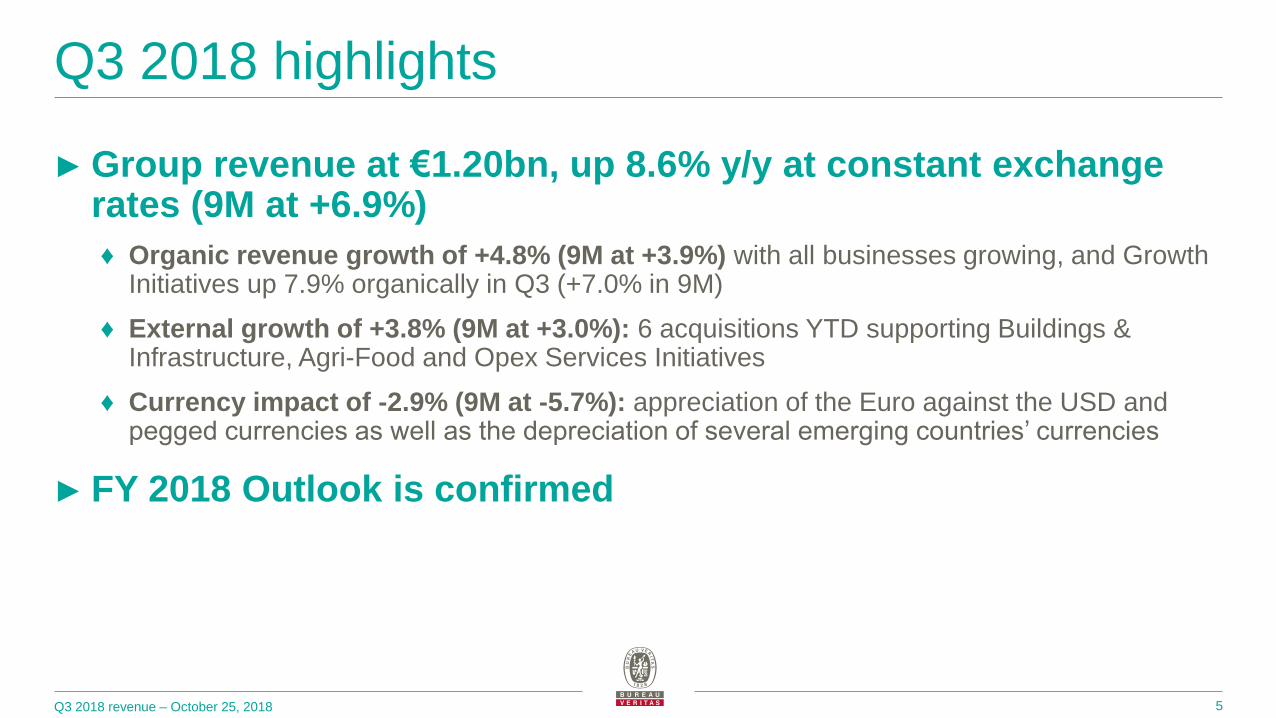
► Group revenue at €1.20bn, up 8.6% y/y at constant exchange rates (9M at +6.9%)
♦ Organic revenue growth of +4.8% (9M at +3.9%) with all businesses growing, and Growth Initiatives up 7.9% organically in Q3 (+7.0% in 9M)
♦ External growth of +3.8% (9M at +3.0%): 6 acquisitions YTD supporting Buildings & Infrastructure, Agri-Food and Opex Services Initiatives
♦ Currency impact of -2.9% (9M at -5.7%): appreciation of the Euro against the USD and pegged currencies as well as the depreciation of several emerging countries’ currencies
► FY 2018 Outlook is confirmed

Financial Review

Q3 2018 revenue – October 25, 2018
9M 2018 revenue growth
7
9M 2017 Organic Acquisitions Currencies 9M 2018
(1) Organic growth is the increase in revenue versus last year, at constant currency and scope
(i.e. acquisitions excluded)
+3.9% +3.0% (5.7)%3,535.03,492.8
(in € millions)
1
+6.9% at constant currency

Q3 2018 revenue – October 25, 2018
Q3 2018 revenue growth
8
Q3 2017 Organic Acquisitions Currencies Q3 2018
(1) Organic growth is the increase in revenue versus last year, at constant currency and scope
(i.e. acquisitions excluded)
+4.8% +3.8% (2.9)% 1,196.71,132.7
(in € millions)
1
+8.6% at constant currency
Q3 2018 revenue – October 25, 2018
15% Consumer Products
4.6%
14.9%
5.3%
3.5%
3.2%
1.0%
4.8%
13.1%
1.0%
1.3%
0.8%
0.2%
3.8% Organic Acquisitions
+4.8%
+4.0%
+17.7%
+14.9%
+6.3%
+1.2%
26%
% revenue
7%
22%
23%
7%
@ constant currency
+8.6%100%
Agri-Food & Commodities
Certification
Buildings & Infrastructure
Total Group
Industry
Marine & Offshore
Q3 2018 revenue growth by business
9
Q3 2018 revenue – October 25, 2018
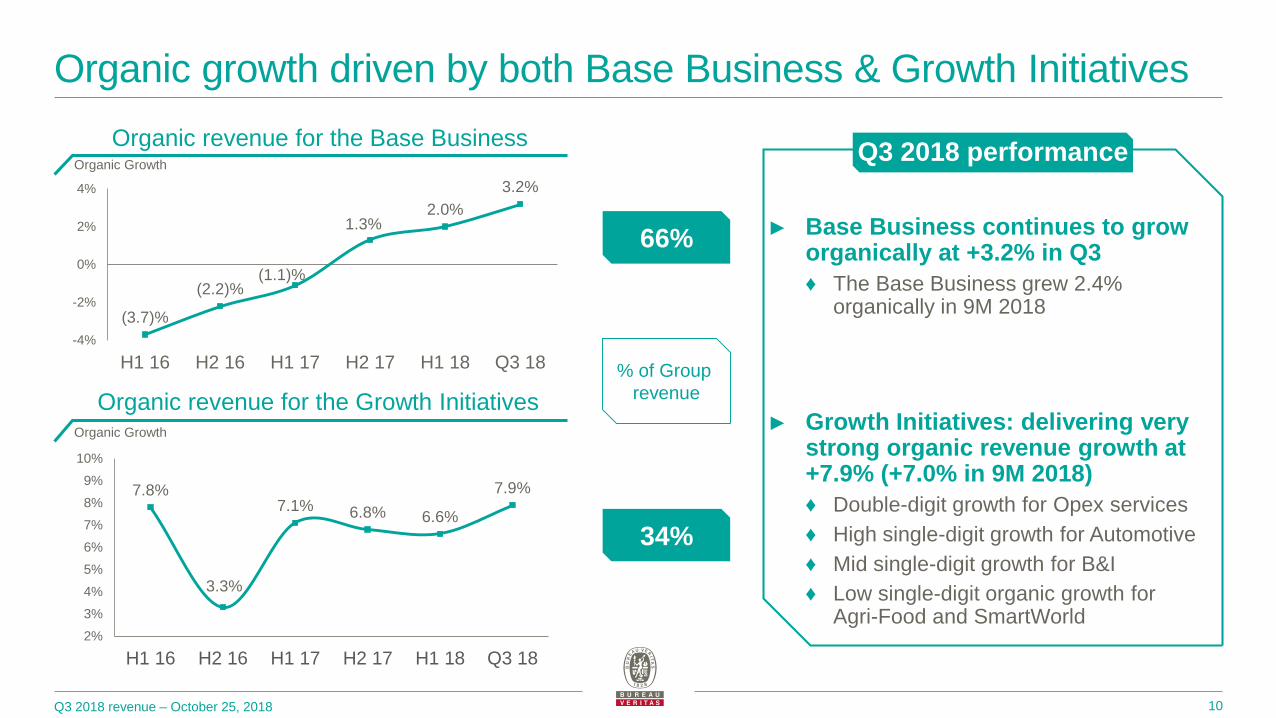
Organic growth driven by both Base Business & Growth Initiatives
10
Organic revenue for the Base Business
Organic revenue for the Growth Initiatives
(3.7)%
(2.2)%(1.1)%
1.3%2.0%
3.2%
-4%
-2%
0%
2%
4%
H1 16 H2 16 H1 17 H2 17 H1 18 Q3 18
7.8%
3.3%
7.1% 6.8% 6.6%
7.9%
2%
3%
4%
5%
6%
7%
8%
9%
10%
H1 16 H2 16 H1 17 H2 17 H1 18 Q3 18
► Base Business continues to grow organically at +3.2% in Q3
♦ The Base Business grew 2.4% organically in 9M 2018
► Growth Initiatives: delivering very strong organic revenue growth at +7.9% (+7.0% in 9M 2018)
♦ Double-digit growth for Opex services
♦ High single-digit growth for Automotive
♦ Mid single-digit growth for B&I
♦ Low single-digit organic growth for Agri-Food and SmartWorld
66%
34%
% of Group
revenue
Q3 2018 performanceOrganic Growth
Organic Growth
Q3 2018 revenue – October 25, 2018
0 200
SmartWorld
Automotive
Agri-Food
Opex services
Buildings & Infrastructure
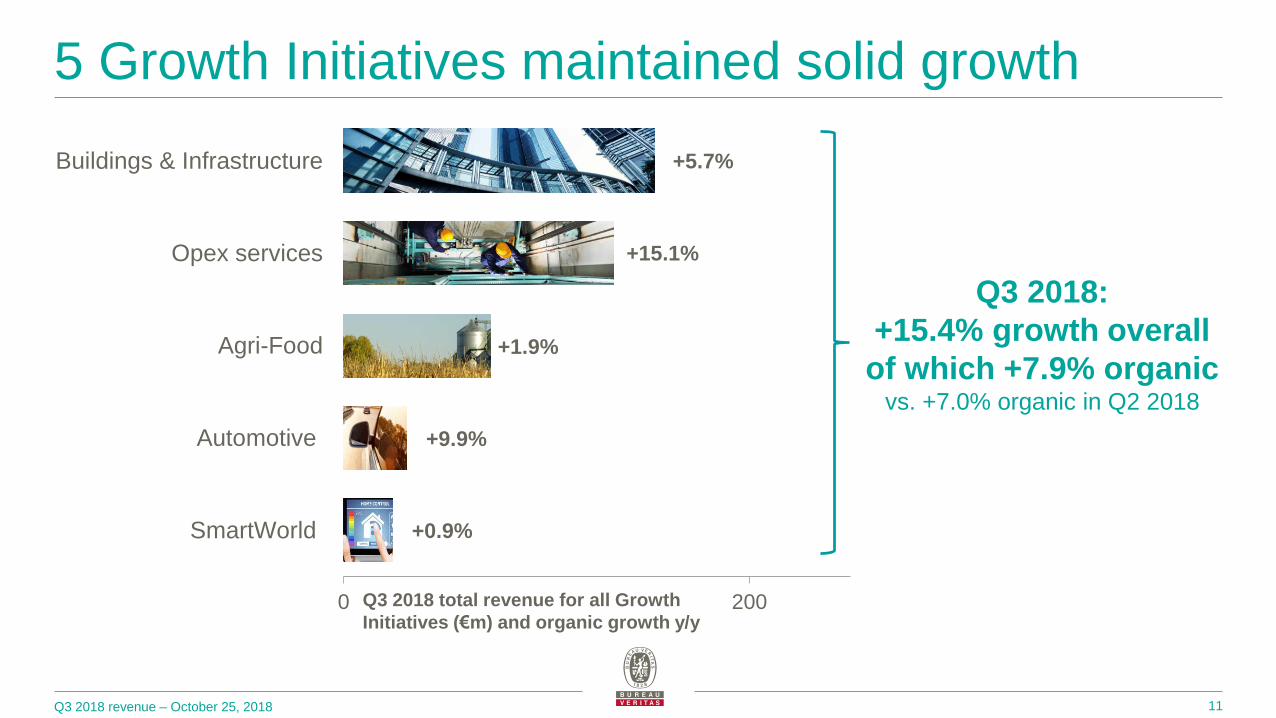
5 Growth Initiatives maintained solid growth
11
+5.7%
+15.1%
+1.9%
+9.9%
+0.9%
Q3 2018:
+15.4% growth overall
of which +7.9% organic vs. +7.0% organic in Q2 2018
Q3 2018 total revenue for all Growth
Initiatives (€m) and organic growth y/y

Business Review

KEY FINANCIALS Q3 2018 HIGHLIGHTS
2018 OUTLOOK
2020 AMBITION / KEY FIGURES
Q3 2018 revenue – October 25, 2018
Marine & Offshore (7% of revenue)
► New construction: mid single-digit growth benefiting from improvement in the new equipment certification services
► Core In-Service: low single-digit decline (tough comps, timing of inspections, price pressure)
► Services (incl. Offshore): mid single-digit growth led by risk assessment and loss adjusting services
► New orders up to 4.8m (GRTm) from 4.1m last year; backlog at 14.0m at the end of Sept., up versus last year
► Slightly negative organic revenue growth
♦ New construction: H2 positive
♦ In-service to remain resilient
♦ Services (incl. Offshore): offering extension / gradually recovering
► Focus on margin protection (restructuring)
13
4.1 4.8
13.0 14.0
118.1 118.7
50
60
70
80
90
100
110
120
0
5
10
15
20
25
30
Sept. 2017 Sept. 2018
New orders Order book In-Service fleet
(in € millions) Q3 2018 Q3 2017 Var.
Revenue
Organic84.8 85.8
(1.2)%
+1.0%
Acquisitions +0.2%
Currency (2.4)%
Million gross tons (GRTm)
► Commercial wins:
♦ LNG carriers and oil tankers (South Korea)
♦ Bulk carriers (China)
♦ Containerships (Taiwan)
♦ Passenger ships (France)
♦ Specialized ships (Europe, Taiwan)
39%
44%
17%
New
Construction
Core In-Service
Services
(incl. Offshore)

KEY FINANCIALS Q3 2018 HIGHLIGHTS
2018 OUTLOOK
2020 AMBITION / KEY FIGURES
Q3 2018 revenue – October 25, 2018
Agri-Food & Commodities (23% of revenue)
► Commercial wins:
♦ Minera Caserones (M&M) in Chile
♦ Royal Canin (Food) in South Korea
♦ Laboratory Outsourcing Contract with OMV PETROM (O&P) in Romania
► O&P (+2.4%): mid single-digit growth in Europe (market share gains, new services), stable in North America (price pressure)
► M&M (+8.8%): Upstream continuing to record strong growth (+14.2%) led notably by Africa and the Americas / Trade: low single-digit growth
► Agri-Food (+0.5%) led by strong Food / Agri weak (Europe: -; Latam +)
► GS (+12.6%): Q3 rebound due to ramp-up of VOC and single window contracts
► Improving organic revenue growth vs. 2017
♦ M&M recovery to carry on
♦ O&P market share gains, new services, against challenging competitive environment
♦ Agri-Food sustained growth (new labs, acquisitions benefit)
♦ GS: confirmed stabilization
► Margin improvement (mix, volume)
14
Agri-FoodGrowth Initiative
+1.9%*
* Q3 2018 organic revenue growth
(in € millions) Q3 2018 Q3 2017 Var.
Revenue
Organic272.8 265.7
+2.7%
+5.3%
Acquisitions +1.0%
Currency (3.6)%
37%
28%
19%
16% Oil &
Petrochemicals
Metals & Minerals
Government Services
Agri-Food
KEY FINANCIALS Q3 2018 HIGHLIGHTS
2018 OUTLOOK
2020 AMBITION / KEY FIGURES
Q3 2018 revenue – October 25, 2018
Industry (22% of revenue)
► Oil & Gas Capex turning positive in Q3 2018 at +1.7% (-10.0% in 9M 2018) benefitting from easier comps
♦ US & S.Korea (+) ; Australia (=); China (-)
► O&G Opex: double-digit growth with strong volume increase in Q3, across all geographies, largely offsetting price pressure
► Non Oil & Gas: high growth for Power & Utilities – ramp-up of large contract wins in Latam
► Positive organic revenue growth:
♦ Oil & Gas Capex: improving
♦ Oil & Gas Opex: volume (+), Price (-)
♦ Power: (+) / strong wins – ramp-up
♦ Nuclear: (+) positive in Europe
+15.9% OPEX O&G
+16.9% OPEX P&Uorganic growth in Q3 2018
15
► Commercial wins:
♦ LaGuardia Airport (transport/ capex) in the USA
♦ YPF (Opex O&G) in Argentina
♦ Pluspetrol (Opex O&G) in Chile
♦ ENEL (Opex P&U) in Brazil
(in € millions) Q3 2018 Q3 2017 Var.
Revenue
Organic265.7 265.9
(0.1)%
+3.5%
Acquisitions +1.3%
Currency (4.9)%
21%
16%
13%9%
10%
4%3%
24%
Oil & Gas
Opex
Oil & Gas
CapexChemicals
Other
Power & Utilities
Transport
Construction
Manufacturing
Q3 2018 revenue – October 25, 2018
57%
43%
47%
53%
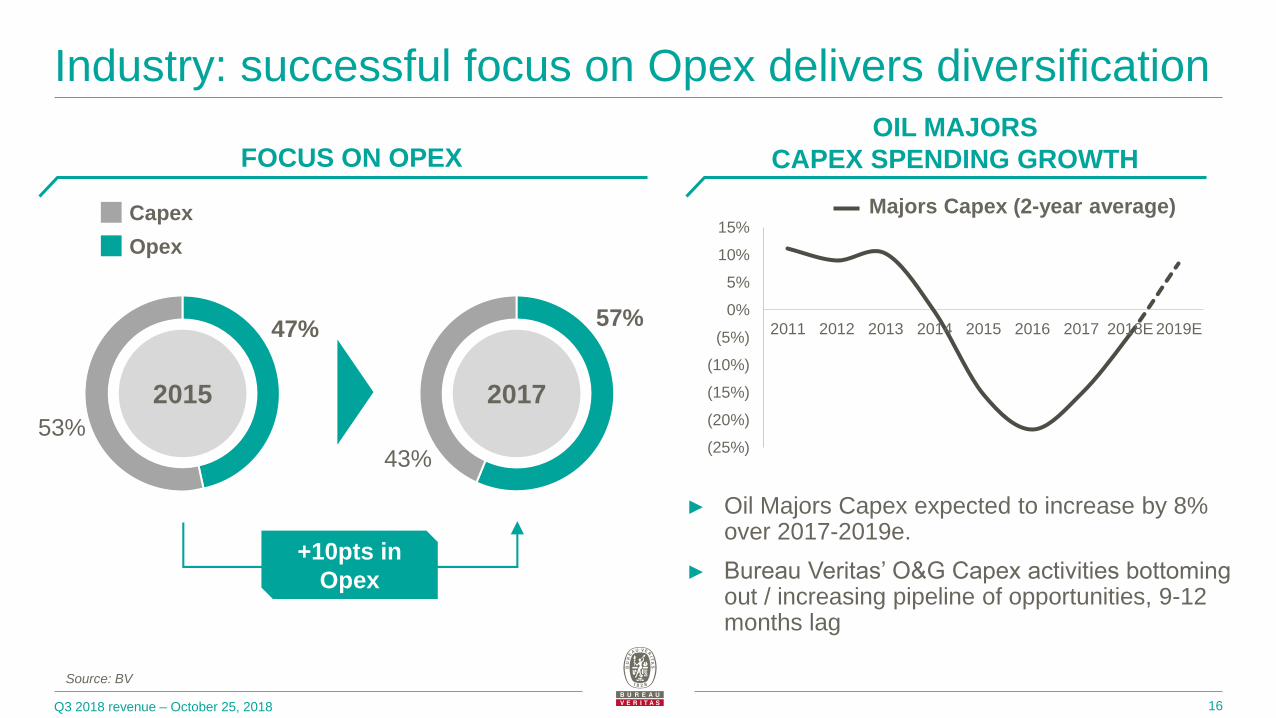
Industry: successful focus on Opex delivers diversification
16
► Oil Majors Capex expected to increase by 8% over 2017-2019e.
► Bureau Veritas’ O&G Capex activities bottoming out / increasing pipeline of opportunities, 9-12 months lag
Source: BV
OIL MAJORS
CAPEX SPENDING GROWTHFOCUS ON OPEX
(25%)
(20%)
(15%)
(10%)
(5%)
0%
5%
10%
15%
2011 2012 2013 2014 2015 2016 2017 2018E 2019E
Opex
Capex
2015
Majors Capex (2-year average)
2017
+10pts in
Opex

KEY FINANCIALS Q3 2018 HIGHLIGHTS
2018 OUTLOOK
2020 AMBITION / KEY FIGURES
Q3 2018 revenue – October 25, 2018
Buildings & Infrastructure (26% of revenue)
► Construction-related activities (65% of divisional revenue) mid single-digit growth:
♦ Spread across all geographies, particularly strong in Europe and North America
► Building In-service (35% of divisional revenue): mid single-digit growth
♦ Mainly driven by France benefiting from a favourable calendar effect
► Sustained solid growth on both Capex and Opex related services
♦ Strong dynamics in China, infrastructure led
♦ France recovery: led by both Capex (good backlog) and Opex (market share gains)
17
► Commercial wins:
♦ EDF (shop inspection) in France
♦ CNES (Quality control and risk assessment) in France
(in € millions) Q3 2018 Q3 2017 Var.
Revenue
Organic311.4 266.8
+16.7%
+4.6%
Acquisitions +13.1%
Currency (1.0)%
17%
52%
3%
23%
5%
North
America
Europe
o/w 39%
France
Africa,
Middle East
Asia Pacific
Latam
B&IGrowth Initiative
+5.7%*
with good momentum in the activities related
to the construction of infrastructures in China
* Q3 2018 organic revenue growth
KEY FINANCIALS Q3 2018 HIGHLIGHTS
2018 OUTLOOK
2020 AMBITION / KEY FIGURES
Q3 2018 revenue – October 25, 2018
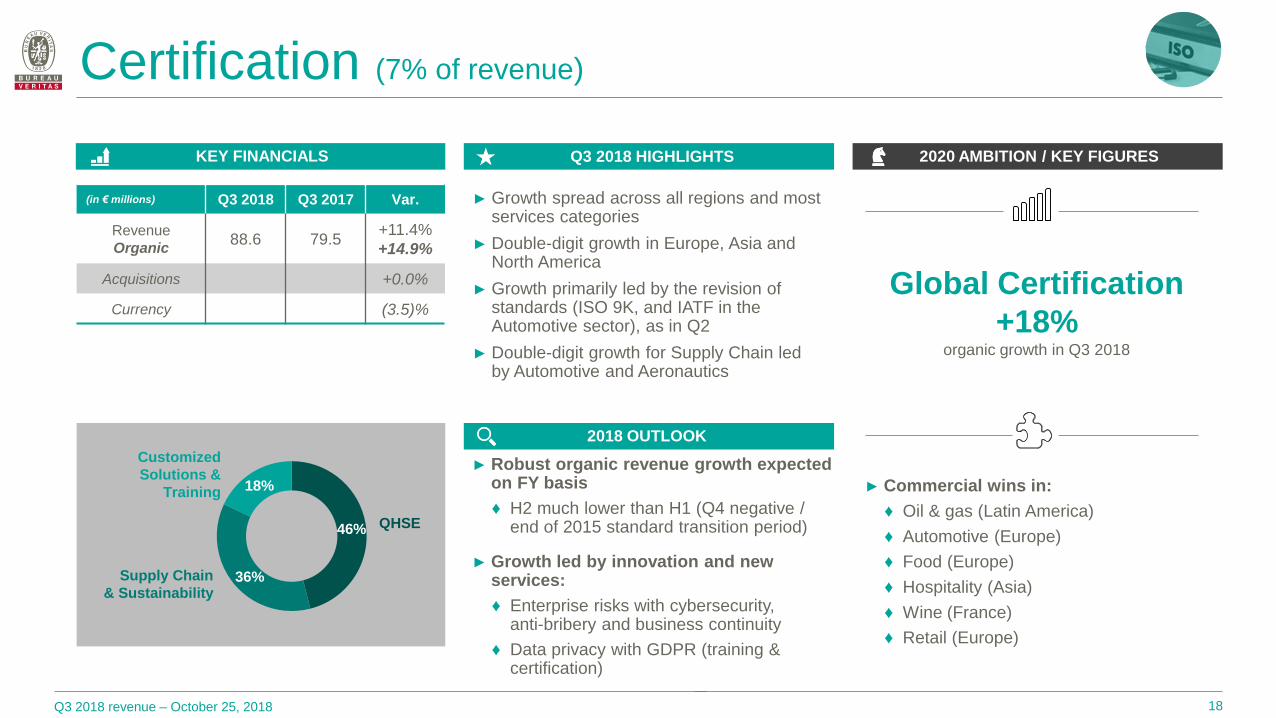
Global Certification
+18%organic growth in Q3 2018
► Growth spread across all regions and most services categories
► Double-digit growth in Europe, Asia and North America
► Growth primarily led by the revision of standards (ISO 9K, and IATF in the Automotive sector), as in Q2
► Double-digit growth for Supply Chain led by Automotive and Aeronautics
► Robust organic revenue growth expected on FY basis
♦ H2 much lower than H1 (Q4 negative / end of 2015 standard transition period)
► Growth led by innovation and new services:
♦ Enterprise risks with cybersecurity, anti-bribery and business continuity
♦ Data privacy with GDPR (training & certification)
18
► Commercial wins in:
♦ Oil & gas (Latin America)
♦ Automotive (Europe)
♦ Food (Europe)
♦ Hospitality (Asia)
♦ Wine (France)
♦ Retail (Europe)
Certification (7% of revenue)
(in € millions) Q3 2018 Q3 2017 Var.
Revenue
Organic88.6 79.5
+11.4%
+14.9%
Acquisitions +0.0%
Currency (3.5)%
46%
36%
18%
QHSE
Supply Chain
& Sustainability
Customized
Solutions &
Training
Q3 2018 revenue – October 25, 2018
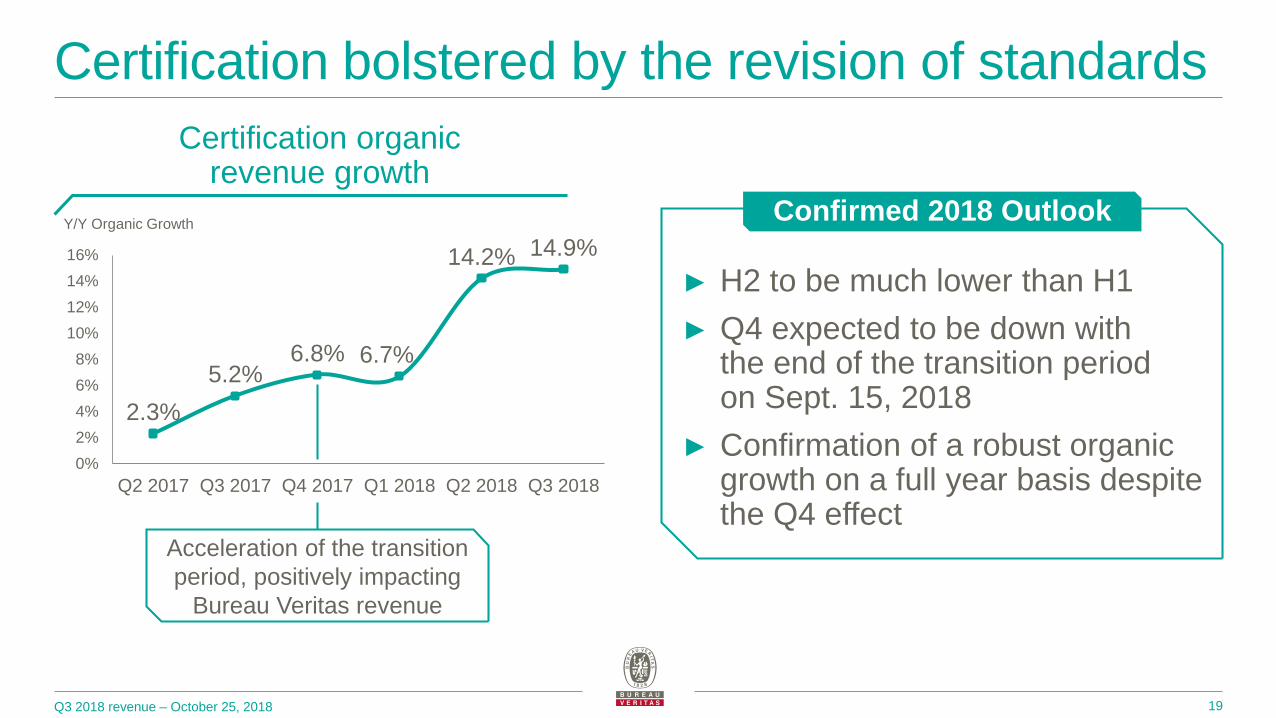
Certification bolstered by the revision of standards
19
Certification organic revenue growth
2.3%
5.2%6.8% 6.7%
14.2% 14.9%
0%
2%
4%
6%
8%
10%
12%
14%
16%
Q2 2017 Q3 2017 Q4 2017 Q1 2018 Q2 2018 Q3 2018
► H2 to be much lower than H1
► Q4 expected to be down with the end of the transition period on Sept. 15, 2018
► Confirmation of a robust organic growth on a full year basis despite the Q4 effect
Confirmed 2018 OutlookY/Y Organic Growth
Acceleration of the transition
period, positively impacting
Bureau Veritas revenue
KEY FINANCIALS Q3 2018 HIGHLIGHTS
2018 OUTLOOK
2020 AMBITION / KEY FIGURES
Q3 2018 revenue – October 25, 2018
Consumer Products (15% of revenue)
► E&E: low single-digit growth primarily driven by Automotive, South Asia, South-East Asia and Europe; slowdown in China and the US in electrical products
► Hardlines: growth below divisional average vs. a particularly strong Q3 2017
► Softlines: mid single-digit growth led by the ramp-up of new contract wins in Europe
► Mid single-digit organic revenue growth expected
♦ Strong momentum in South-East Asia and Europe while deteriorated situation in the US and China
20
► Commercial wins:
♦ Avon Cosmetics (Testing services) in the USA
♦ Lacoste (Audit) in the EMEA region
+9.9%* AutomotiveGrowth Initiative
+0.9%* SmartWorldGrowth Initiative
*Q3 2018 organic revenue growth
(in € millions) Q3 2018 Q3 2017 Var.
Revenue
Organic173.4 169.0
+2.6%
+3.2%
Acquisitions +0.8%
Currency (1.4)%
34%
32%
34%Softlines
Hardlines, Toys, Audits
Electrical &
Electronics

Q3 2018 revenue – October 25, 2018
Tariffs increase: limited impact expected
21
Consumer Products
14%
9M 2018
Group revenue by business
Outsidescope of
US tariffs
c.95%
<
► Monitoring closely, proactive engagement with customers
► Ideally positioned to follow manufacturing relocations
► Further accelerating the development in the Chinese domestic market and outside of the US (South-East Asia and Europe)
Assuming current
market conditions,
c.5% of Consumer
Products business
within the scope of
tariffs increases

Outlook

Q3 2018 revenue – October 25, 2018
Confirmed 2018 outlook
23
Full-year adjusted
operating margin to
slightly improve at
constant currency
vs. full-year 2017
Full-year organic
revenue growth to
accelerate
vs. full-year 2017
Full-year cash flow
generation
to improve at
constant currency
vs. full-year 2017

Q&A

Q3 2018 revenue – October 25, 2018
2019 Financial Calendar and Contacts
25
Investor Relations InformationBureau Veritas Head Office – 40/52 Boulevard du Parc
92200 Neuilly-sur-Seine, France
Laurent Brunelle
Head of Investor Relations
+33 (0)1 55 24 76 [email protected]
► Full-Year 2018 results – February 28, 2019 ► H1 2019 results – July 25, 2019
► Q1 2019 revenue – April 25, 2019 ► Q3 2019 revenue – October 24, 2019
Florent Chaix
Investor Relations Manager
+33 (0)1 55 24 77 [email protected]

Appendix

Q3 2018 revenue – October 25, 2018
Revenue by business
27
Q3 2018
€m Organic Scope FX
Marine & Offshore 84.8 +1.0% +0.2% (2.4)%
Agri-Food & Commodities 272.8 +5.3% +1.0% (3.6)%
Industry 265.7 +3.5% +1.3% (4.9)%
Buildings & Infrastructure 311.4 +4.6% +13.1% (1.0)%
Certification 88.6 +14.9% 0.0% (3.0)%
Consumer products 173.4 +3.2% +0.8% (1.4)%
Total Group 1,196.7 +4.8% +3.8% (2.9)%
Q3 2017
€m Organic Scope FX
85.8 (1.8)% 0.0% (4.9)%
265.7 +3.1% +3.4% (3.3)%
265.9 (0.7)% (2.6)% (4.5)%
266.8 +4.0% +5.5% (2.8)%
79.5 +5.2% 0.0% (6.4)%
169.0 +3.7% +1.7% (4.8)%
1,132.7 +2.2% +1.6% (4.1)%
(in € millions)

Q3 2018 revenue – October 25, 2018
Revenue by business
28
9M 2018
€m Organic Scope FX
Marine & Offshore 255.2 (3.4)% +0.1% (4.4)%
Agri-Food & Commodities 796.5 +4.4% +1.0% (6.7)%
Industry 785.2 +2.6% 0.0% (7.5)%
Buildings & Infrastructure 921.0 +4.3% +11.4% (2.6)%
Certification 279.5 +12.0% 0.0% (7.8)%
Consumer products 497.6 +4.4% +0.7% (5.9)%
Total Group 3,535.0 +3.9% +3.0% (5.7)%
9M 2017
€m Organic Scope FX
276.6 (5.7)% +0.8% (1.5)%
806.6 +1.6% +6.9% +0.1%
825.5 (0.9)% (0.8)% 0.0%
814.3 +4.0% +4.7% (0.7)%
268.2 +5.8% +0.1% +0.1%
501.4 +4.7% +1.9% (0.4)%
3,492.8 +1.6% +2.7% (0.3)%
(in € millions)

Q3 2018 revenue – October 25, 2018
22% Industry
4.3%
12.0%
4.4%
4.4%
2.6%
(3.4)%
3.9%
11.4%
1.0%
0.7%
0.1%
3.0% Organic Acquisitions
+5.1%
+2.6%
+15.7%
+12.0%
+5.4%
(3.3)%
26%
% revenue
8%
14%
23%
7%
@ constant currency
+6.9%100%
Agri-Food & Commodities
Certification
Buildings & Infrastructure
Total Group
Consumer Products
Marine & Offshore
9M 2018 revenue growth by business
29

Q3 2018 revenue – October 25, 2018
0 600
SmartWorld
Automotive
Agri-Food
Opex services
Buildings & Infrastructure
5 Growth Initiatives maintained solid growth
30
+8.3%
+7.7%
+2.8%
+8.0%
+7.4%
9M 2018:
+9.0% growth overall
of which +7.0% organic vs. +6.6% organic in H1 2018
9M 2018 total revenue for all Growth
Initiatives (€m) and organic growth y/y

Q3 2018 revenue – October 25, 2018
Portfolio of businesses
31
7%
23%
22%
26%
8%
14% Marine & Offshore
Agri-Food & Commodities
Industry
Buildings & Infrastructure
Certification
Consumer products
Revenue by business
9M 2018
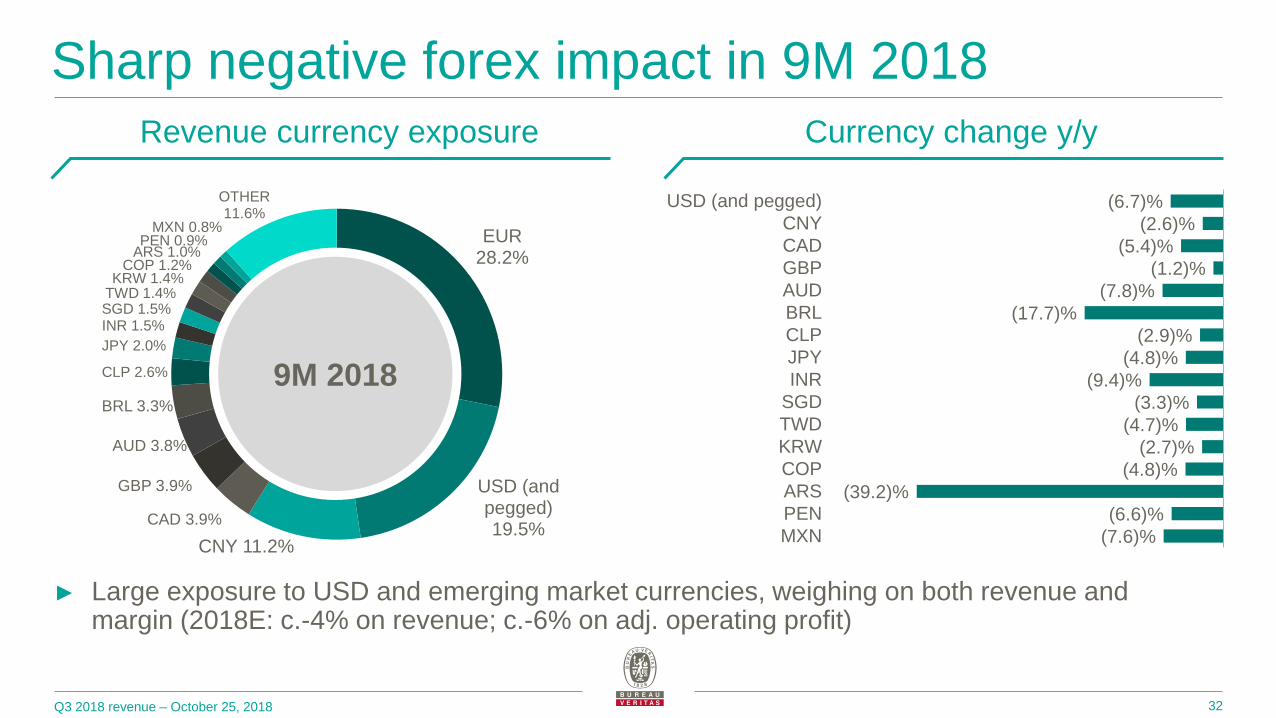
Q3 2018 revenue – October 25, 2018 32
EUR28.2%
USD (and pegged)19.5%
CNY 11.2%
CAD 3.9%
GBP 3.9%
AUD 3.8%
BRL 3.3%
CLP 2.6%
JPY 2.0%
INR 1.5%SGD 1.5%TWD 1.4%KRW 1.4%
COP 1.2%ARS 1.0%PEN 0.9%
MXN 0.8%
OTHER11.6%
(6.7)%
(2.6)%
(5.4)%
(1.2)%
(7.8)%
(17.7)%
(2.9)%
(4.8)%
(9.4)%
(3.3)%
(4.7)%
(2.7)%
(4.8)%
(39.2)%
(6.6)%
(7.6)%
USD (and pegged)
CNY
CAD
GBP
AUD
BRL
CLP
JPY
INR
SGD
TWD
KRW
COP
ARS
PEN
MXN
Sharp negative forex impact in 9M 2018
► Large exposure to USD and emerging market currencies, weighing on both revenue and margin (2018E: c.-4% on revenue; c.-6% on adj. operating profit)
Revenue currency exposure Currency change y/y
9M 2018
Q3 2018 revenue – October 25, 2018
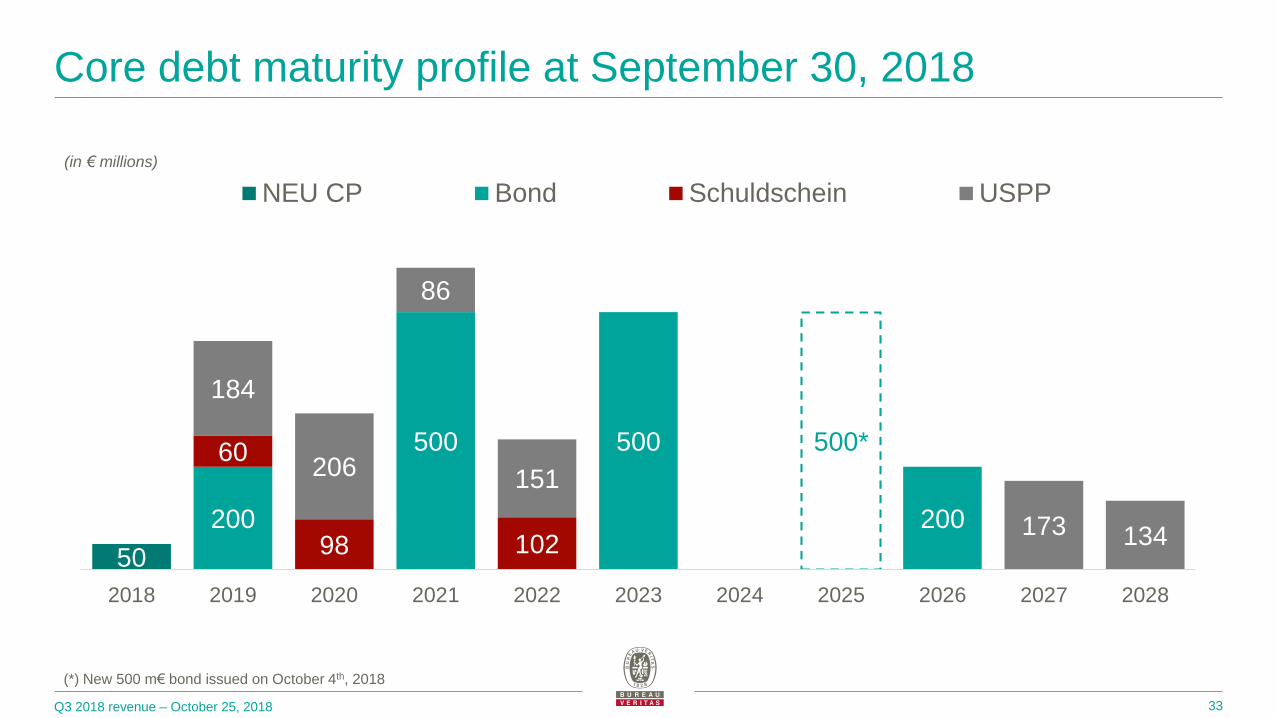
Core debt maturity profile at September 30, 2018
33
50
200
500 500 500*
200
60
98 102
184
206
86
151
173 134
2018 2019 2020 2021 2022 2023 2024 2025 2026 2027 2028
NEU CP Bond Schuldschein USPP
(*) New 500 m€ bond issued on October 4th, 2018
(in € millions)

Q3 2018 revenue – October 25, 2018
1
2
3
►
►
►
IMO 2020: limiting sulphur oxides emissions
34
► IMO1 has set a limit for sulphur in fuel oil used on board ships of 0.50% m/m2 from January 1, 2020 (vs. 3.5% since 2012). This will significantly reduce the amount of sulphur oxide emanating from ships
► IMO has also set other objectives to limit emissions with other measures entering into force from 2020 onwards
(1) IMO: International Maritime Organization
(2) m/m: mass by mass
(3) Illustrative
What is IMO 2020? What are the options for ship owners?
Keep Heavy Fuel Oil
and invest in scrubbers
Switch to low-sulphur fuel
Switch to gas, investing
in new LNG equipment
Capex Opex
Capex Opex
Capex Opex
Type of spending intensity3
► IMO 2020 introduces profound changes in the industry which will support Bureau Veritas’ Marine & Offshore and part of its Oil & Petrochemicals activities, notably in 2019

Q3 2018 revenue – October 25, 2018
2020 ambition
35
(1) At 2015 plan initial exchange rates (as presented during October 2015 Investor Days)
Continuous
high
Free Cash Flow
generation
Add €1.5bn
of incremental
revenue1
Half organic
Half acquisition
5-7% organic
growth by 2020
Above 17%
adjusted
operating
margin1

Q3 2018 revenue – October 25, 2018
Glossary
36
Adjusted Operating Profit (AOP) excludes amortization of acquisition intangibles, goodwill impairment, restructuring, acquisition and disposal-related items (non-recurring items)
Adjusted Operating Margin (AOP Margin) is defined as Adjusted Operating Profit / Revenue
Adjusted Net Profit is defined as net profit adjusted for non-recurring items after tax
Adjusted Net Debt is defined as net financial debt after currency hedging instruments, as defined in the calculation of banking covenants
AI: Artificial Intelligence
AIM: Asset Integrity Management
B&I: Buildings & Infrastructure
BIM: Building Information Modeling
E&E: Electronic & Equipment
E&P: Exploration & Production
EMC: Electromagnetic Compatibility
FPSO: Floating Production Storage and Offloading
FSO: Floating Storage and Offloading
GMO: Genetically Modified Organism
GRT (Marine): Gross Register Ton
GS: Government Services
IoT: Internet of Things
IMO: International Maritime Organization
LNG: Liquefied Natural Gas
M&M: Metals & Minerals
NDT: Non-destructive Testing
O&G: Oil & Gas
O&P: Oil & Petrochemicals
Organic growth: increase in revenue versus last year, at constant currency and scope (i.e. acquisitions excluded)
P&U: Power & Utilities
PSI: Pre-shipment Inspection
SSC: Shared Service Center
ULCS: Ultra Large Container Ships
VOC: Verification of Conformity
y/y: year-on-year
WC: Working Capital
WCR: Working Capital Requirement