provincial nominee programs - metropolis canada
TRANSCRIPT

Provincial Nominee ProgramsAn Evaluation of the Earnings and Retention
Rates of Nominees
Manish Pandey and James TownsendUniversity of Winnipeg

Acknowledgments
• Funding for this project was provided by the Prairie Metropolis Centre.
• Technical assistance was provided by Michael Wendt of Statistics Canada.

The Provincial Nominee Programs (PNPs)
• The Provincial Nominee Programs allow provinces to recruit and nominate potential immigrants using selection criteria that meet locally defined needs.– For example, Manitoba argued that it needed
skilled tradespeople that did not qualify under the Federal Skilled Worker (FSW) program.

The Provincial Nominee Programs (PNPs)
• Programs were also intended to help share the benefits of immigration more equitably.– National immigration rates were increased in
the mid 1980s.– Increase was not uniform across Canada;
Immigrants primarily went to Canada’s three largest cities (Toronto, Vancouver and Montreal).

The Provincial Nominee Programs (PNPs)
• The first Nominee programs were established in 1998 (BC, Manitoba and Saskatchewan).
• Incentive-based system; applications through one of the PNPs received expedited processing relative to Federal immigration programs.

The Provincial Nominee Programs (PNPs)
• The PNPs have expanded rapidly since the first Nominees were admitted in 1999.
• In 1999, 475 Nominees were admitted.• In The Annual Report to Parliament on
Immigration, 2010, CIC anticipated that between 42 000 and 45 000 Nominees would be admitted.
The Provincial Nominee Programs (PNPs)
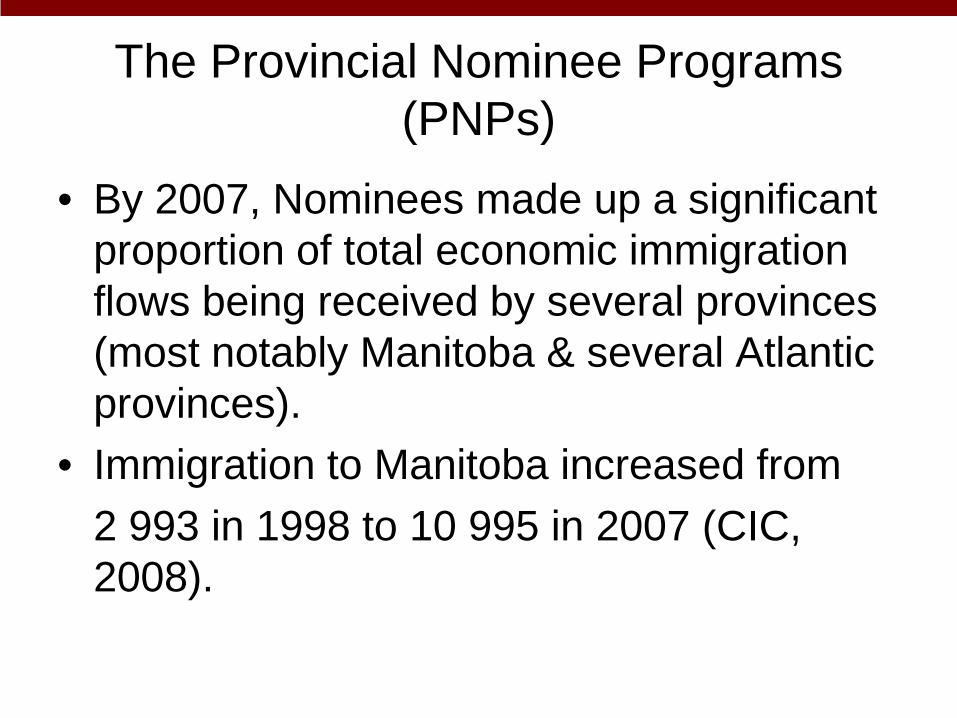
• By 2007, Nominees made up a significant proportion of total economic immigration flows being received by several provinces (most notably Manitoba & several Atlantic provinces).
• Immigration to Manitoba increased from 2 993 in 1998 to 10 995 in 2007 (CIC, 2008).

PNP Utilization by Province: 1999-2007
Province
ABBCMBNBNFLDNSONPEISK
YearSigned
200219981998199919992002200720021998
Nominees% of Total
2.61.9
49.832.312.413.00.2
56.220.8
Share ofNominees (%)
7.212.155.75.20.94.04.63.07.3
Source: Citizenship and Immigration Canada (2008)

Nominee Programs Are Not Uniform Across Provinces
• Each province may create various streams within its program.
• Streams include:– employer-direct: eligibility generally requires a
bona-fide job offer – business class: eligibility requires intention to
start business– Family-based: eligibility requires
demonstrating employability and existing family and/or friends within the province.

Prevalence of Streams Varies by Province
• Most provinces have an employer-direct stream.
• P.E.I. program began with an investor stream.
• Manitoba was one of the first to introduce a family-based stream.
• Information on the usage of the various streams is spotty.
• Programs are continuously evolving.

Motivation
• Despite the rapid expansion of the Nominee programs, little is known about the outcomes of the Nominee programs.
• The 2009 Auditor General’s report highlighted both the obligation of provinces to report on the retention of immigrants recruited through the programs and the failure to do so by a number of provinces.

Objectives
Questions we answer:• Characteristics - how do Nominees differ from
immigrants admitted through federal programs?• Retention - do Nominees tend to remain in the
province through which they obtain permanent residence status?
• Earnings - how do labour market outcomes of Nominees compare from those of federal economic immigrants?

Importance of Retention
• Charter of Rights does not permit restricting mobility of landed immigrants.
• Concerns were expressed that the PNPs would be used as a “back door” for entry into Canada– Individuals unable to obtain entry through other
programs could gain permanent resident status through a PNP and then move.
– If widespread, such usage would undermine the programs.

Importance of Earnings• Skepticism that provincial officials are
better equipped than federal counterparts at identifying labour market needs.
• On-going debate about short vs. long-term goals.
• Earnings are an imperfect measure of labour market outcomes.– Best available measure given available data. – A small survey compares intended and actual
occupations of Manitoba Nominees (Carter, 2010).

Data
Longitudinal Immigrant Data Base (IMDB)• Combines information from landing document of
each immigrant with information available from subsequent tax returns (T1 form) submitted to Revenue Canada.
• Information from landing records provides data on gender, marital status, source country, self-reported knowledge of official languages, and educational attainment at the time of landing.

DataLongitudinal Immigrant Data Base (IMDB)• Includes immigration category (e.g.Provincial
Nominee) and province/region to which the immigrant was initially destined.
• We limit analysis to • principal applicants, since the entry
requirements apply primarily to these individuals.• Immigrants landing between 1999 and 2006. At
the time of the analysis, 2007 was the last available tax year in the IMDB.

Methodology
• We compare the outcomes of Nominees with a benchmark group.
• IMDB only includes a variable indicating whether or not the individual was admitted through a Nominee program, but not the applicable stream within the program (e.g. employer-direct).

Methodology (con’t)
• As there are business and investor streams within the PNPs, we use a combination of FSWs, Federal Business and Investor class immigrants as our comparison group – Federal Economic Class immigrants (ECIs).
• Outcomes are compared between observationally equivalent immigrants in the two groups (i.e. same gender, educational attainment, region of residence, etc.)

Methodology (con’t)PNP “effect” allowed to vary by region: Atlantic,
Manitoba, Other• Real earnings – regression of earning
conditional on entry program, other characteristics.
• Retention rates – probit analysis of probability of staying in province, conditional on entry program, other characteristics.
• Do not fully exploit the panel aspects of the IMDB by accounting for individual effects, etc.
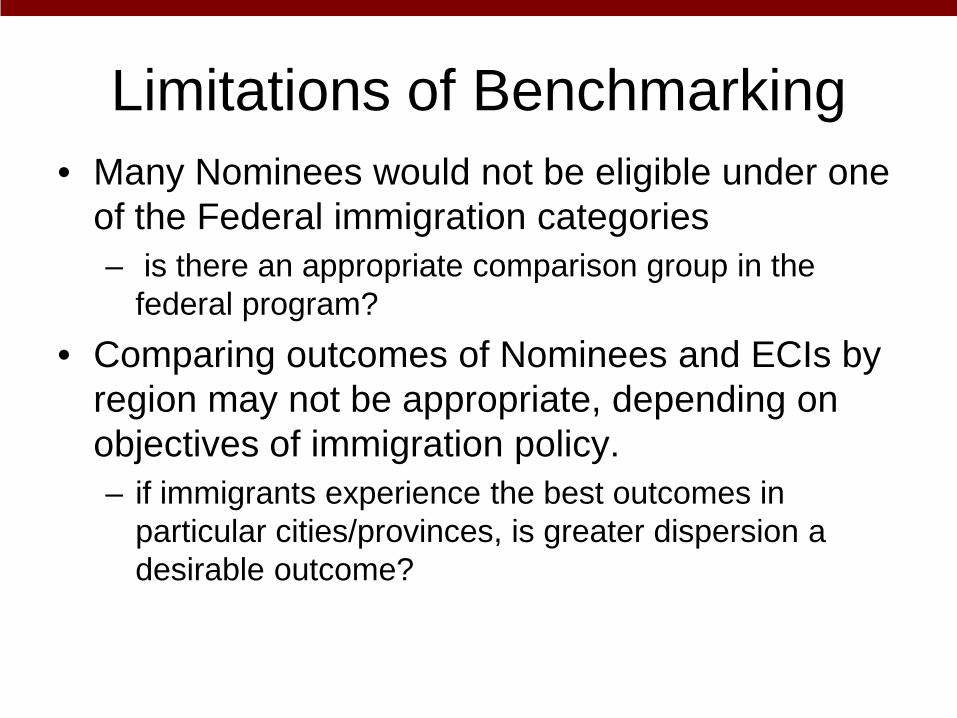
Limitations of Benchmarking• Many Nominees would not be eligible under one
of the Federal immigration categories – is there an appropriate comparison group in the
federal program?• Comparing outcomes of Nominees and ECIs by
region may not be appropriate, depending on objectives of immigration policy.– if immigrants experience the best outcomes in
particular cities/provinces, is greater dispersion a desirable outcome?
Limitations (con’t)
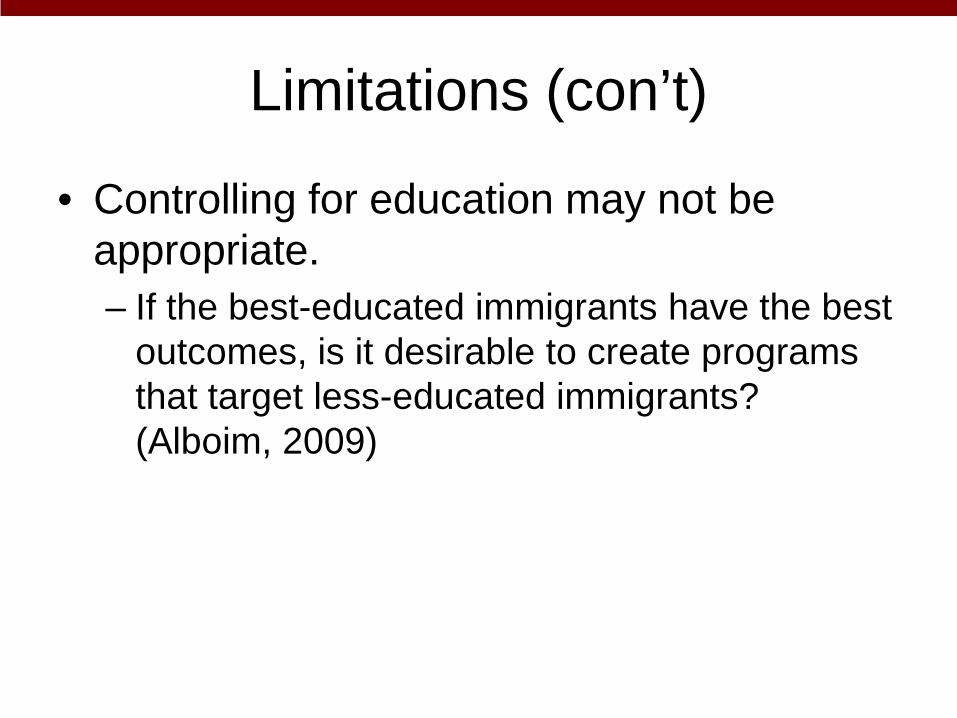
• Controlling for education may not be appropriate.– If the best-educated immigrants have the best
outcomes, is it desirable to create programs that target less-educated immigrants? (Alboim, 2009)

Definitions
• Retention - An immigrant stays when the destination province on landing document and province of residence match in a given tax year.
• Real earnings - sum of employment and self-employment earnings, expressed in 2002 dollars.
• Regions - Atlantic (NB, NFDL, NS, PEI); Manitoba; Other (BC, AB, SK & ON)

Definition (con’t)
• Nominee - A principal applicant entering through one of the PNPs
• Economic Class Immigrants (ECI) - A principal applicant entering through a Federal Program such as FSWs, business and investor class immigrants (excludes Live-In Caregivers)
Preview of Results
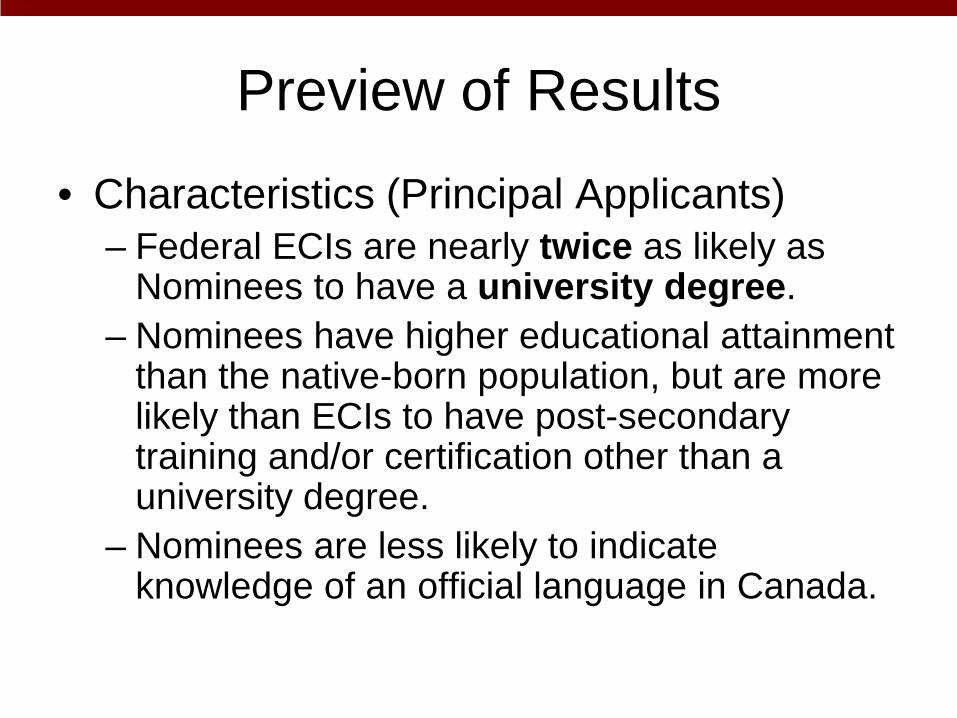
• Characteristics (Principal Applicants)– Federal ECIs are nearly twice as likely as
Nominees to have a university degree. – Nominees have higher educational attainment
than the native-born population, but are more likely than ECIs to have post-secondary training and/or certification other than a university degree.
– Nominees are less likely to indicate knowledge of an official language in Canada.
Preview of Results
• Characteristics (continued)– Despite these differences, unconditional
average earnings in the first and second full tax year after arrival were higher for Nominees in all regions except Manitoba.
– Unconditional retention rates of Nominees were higher than those of ECIs in Manitoba and similar to the benchmark group in the remaining regions.

Preview of results
• Results after conditioning on characteristics.– After controlling for differences between two
groups, earnings one and two years after landing were higher for ECIs in all three regions.
– In Manitoba, Nominees had higher conditional earnings one year after landing, but experienced lower subsequent earnings growth than ECIs in subsequent years.

Selected Characteristics: Principal Applicants Landing Between 2000-05, By Entry Category and Region
AtlanticPNP ECI
ManitobaPNP ECI
OtherPNP ECI
Univ. 57.7 79.0 43.8 77.9 52.3 80.2P.S. 31.5 15.5 42.0 16.5 38.8 16.2≤ H.S. 10.8 5.8 14.4 4.8 9.0 3.7
EnglishFrenchBothNeither
Earnings1
RetentionN1
73.91.1
12.613.5
42.662.20.55
77.01.8
12.09.0
31.365.42.17
67.50.21.8
30.4
23.786.54.32
77.41.75.8
14.8
26.467.72.00
79.50.06.7
15.8
55.786.21.64
56.75.5
17.020.9
23.887.6246.5
1 1,000s.

Main Findings: EarningsNominees have higher earnings than ECIs in first
and second full tax year after landing, after controlling for other characteristics.
• Smallest difference for Manitoba, largest for “Other” provinces.
• Largest earnings differential for University educated.
• Similar results for one and two years after, though PNP “advantage” is somewhat attenuated in second year.
• Similar results for men and women.

Relative Earnings, 1 Year After Landing, Men
1.00
1.39
1.64
1.98
1.00
1.25
2.01
2.54
01
23
All University
ECI MB PNP ATL PNP Other PNP

Longer term earnings outcomes
• At the time of analysis, only Manitoba’s program was sufficiently large in the early years of the programs to merit studying outcomes past a few years after landing.

Earnings progression of Manitoba Nominees
• We estimate an earnings equation in which:– Entry earnings vary by landing year.– All landing year cohorts have a common
earnings-years since landing profile.– The shape of the profile varies by entry
program and by level of educational attainment at time of landing.

Manitoba Provincial Nominees: 1999-2006
H.S. or P.S. Univ.P.S. MPNPMPNPx2000MPNPx2001MPNPx2002MPNPx2003MPNPx2004MPNPx2005MPNPx2006YSLMPNPxYSLN
0.178***0.124*0.313***0.369***0.231***0.542***0.0260.121-0.0410.119***-0.019*9487
-0.0610.340***0.511***0.194**-0.0800.0420.1220.1520.177***-0.023*11095
Notes: ***1% **5% *10%

Summary of Manitoba results
• Gap between “equivalent” Nominees and PNPs has disappeared for more recent landing year cohorts.
• Weak evidence that despite higher entry earnings, Nominees subsequently experienced slower earnings growth

Summary of Manitoba results(con’t)
• Regardless of immigration category, immigrants with lower educational attainment experience slower earnings growth in the years following arrival to Canada.
• Selection criteria of the Nominee programs appears to result in immigrants with lower average levels of educational attainment than the Federal programs.

Possible Interpretation of Manitoba Results
• Nominees may have initially had higher earnings due to better initial job matches; over time, earnings of ECIs caught up as they found better jobs.
• Advantage of Nominees at start may have vanished as program expanded streams, relying less on the employer-direct stream (and bona fide job offers for immigrants).
Retention
Analysis by level of educational attainment and region:
• Manitoba Nominees more likely to stay than ECIs; holds for educational levels.
• For remaining provinces, similar retention rates for two groups (and generally high).– Retention rates lower for all groups in Atlantic
Canada.

Fitted Retention Rates, 1 Year, Single 35-year old Male, By Province and Educational Level
0.870.94
0.67
0.59
0.970.92
0.810.88
0.73
0.58
0.940.88
0.2
.4.6
.81
Manitoba Atlantic B.C. Manitoba Atlantic B.C.
H.S. or Less P.S. Diploma
ECI Nominee

Fitted Retention Rates, 1 Year, Single 35-year old Male, By Province and Educational Level (con’t)
0.79
0.90
0.690.66
0.92 0.90
0.72
0.89
0.640.68
0.870.90
0.2
.4.6
.81
Manitoba Atlantic B.C. Manitoba Atlantic B.C.
All University
ECI Nominee

More on Retention• We tie overall retention rates to provincial
characteristics and the timing of the programs (Pandey and Townsend, forthcoming).
• Little evidence that Nominee programs were associated with a decline in retention.
• Higher retention rates for Nominees in Manitoba are at least partly associated with improving economic conditions in the province.
• Retention decline with years since landing, but remain relatively high in Manitoba 5 years after arrival (Carter, Pandey and Townsend, 2010).

Summary
Our results suggest:• Short term earnings of Nominees are at
least as good as comparable ECIs.– However, findings for Manitoba suggest that
over time lower educational attainment of Nominees means their average wage growth will lag that of ECIs.

Summary (con’t)
• Retention rates are similar between ECIs and Nominees in most regions.– Manitoba is the exception: higher retention
rates.– While retention rates for both federal and
provincial programs are lower in Atlantic Canada, the overall level of economic immigration to this part of Canada is small.
– Little evidence programs are being widely used as a “back door.”

What Should We Know?• Longer term earning outcomes outside of
Manitoba.• Relationship between earnings and
retention.• Relationship between outcomes and
specific streams within each province’s program. – Is there an optimal mix?– Will our results generalize as the scale of the
programs continues to expand?

What Should We Know? (con’t)
• Are the programs beneficial to the provinces using them? What is the nature of the benefits?
• What are the implications for the national economy of devolving immigration policy to the provinces? At the aggregate, is this beneficial?