provider payment and reimbursement rates · provider payment and reimbursement rates health care...
TRANSCRIPT

Provider Payment and Reimbursement Rates
Health Care Administration
Managed Care & Payment Policy
January 2011

Cost of Report
Pursuant to Minnesota Statutes, §3.195 the total cost of preparation of this report is $13,600.21.
Three staff persons from the Managed Care Purchasing and Payment Policy Division
participated in the development of this report. It is estimated that 284 combined hours of time
was spent in gathering the information, drafting and reviewing the report. The cost of salaries,
including fringe benefits is $13,552.21, and non-salary administrative costs such as printing, and
supplies incurred in development and preparation of this report is $48.00.
Copy costs are 25 cents per page. Eight copies of this twenty four-page report were prepared at
25 cents per page, a cost of $48.00.
This information is available in alternative formats to individuals with disabilities by calling
(651) 431-2511. TTY users can call through Minnesota Relay at (800) 627-3529.
For Speech-to-Speech, call (877) 627-3848. For additional assistance with legal rights and
protection for equal access to human services programs, contact your agency’s ADA coordinator.

Table of Contents
INTRODUCTION ........................................................................................................................................ 1
Legislative Mandate ............................................................................................................................... 1
Report Background and Implementation .................................................................................................. 1
PROVIDER PAYMENT DATA.................................................................................................................. 2
Report overview ...................................................................................................................................... 2
Section 1 – Aggregate provider payment data .................................................................................. 3
Table 1 – Medical Assistance (MA) Families & Children ................................................................... 5
Table 2 – General Assistance Medical Care (GAMC) .......................................................................... 6
Table 3 – MinnesotaCare Families with Children ................................................................................ 7
Table 4 – MinnesotaCare Adults without Children .............................................................................. 8
Table 5 – MA Minnesota Senior Care Plus (MSC+) ............................................................................ 9
Table 6 – MA Minnesota Senior Health Options (MSHO) ................................................................ 10
Table 7 – MA Special Needs Basic Care (SNBC) .............................................................................. 11
Table 8 – MA Minnesota Disability Health Options (MnDHO) ........................................................ 12
Section 2 – Legislative provider rate changes ................................................................................. 13
Section 3 – Provider rate methodologies.......................................................................................... 13
Table 9 – MCO Provider Rate Methodologies ................................................................................... 14
Section 4 – Aggregate provider reimbursement rates .................................................................... 15
Table 10 - Average Provider Reimbursement Rates by MCO ............................................................ 16
Table 10 - Average Provider Reimbursement Rates by MCO, Continued ......................................... 17
CONCLUSION ........................................................................................................................................... 18
APPENDIX 1 - Provider Type and Service Category Definitions ............................................................. 19
APPENDIX 2 – Procedure Codes ............................................................................................................... 22

1
INTRODUCTION
Legislative Mandate Minnesota Statutes §256B.69, subdivision 9b, paragraph (d) requires the Minnesota Department
of Human Services (DHS) to provide an annual report to the Legislature on managed care
organizations’ (MCOs) aggregate provider payment and reimbursement rate data. MCOs are
both health maintenance organizations and county-based purchasing plans contracted to provide
health care services to enrollees of Minnesota Health Care Programs (MHCP). This includes
Medical Assistance (MA), MinnesotaCare, and General Assistance Medical Care (GAMC). The
MCOs under contract are Blue Plus, HealthPartners, Itasca Medical Care (IMCare), Medica,
Metropolitan Health Plan (MHP), PrimeWest, South Country Health Alliance (SCHA), and
UCare1. This is the first report provided to the Legislature under this requirement.
The impetus for this legislative mandate was an evaluation report by the Office of the Legislative
Auditor (OLA) titled Financial Management of Health Care Programs. The report made several
recommendations to the legislature regarding the need for increased financial oversight of MCOs
and, specifically, provider payments by MCOs under contract with the state. The report
recommended that the legislature classify information provided to DHS on a health plan’s
provider contracts and contract-related payment rates as nonpublic data.
The 2008 legislation requires DHS to collect provider payment data from MCOs and classify the
data as nonpublic. In 2009, the law was further amended to include additional reporting by
MCOs to DHS and an annual report by DHS to the Legislature. Additional information required
from MCOs by the 2009 legislation includes: aggregate provider payment categorized by
primary and non-primary care providers; information on how MCOs pass through rate increases
and decreases; and specific information regarding the MCOs’ provider rate methodologies. DHS
is required to include in this report aggregate payments made to physicians, physician-extenders,
and hospitals, and to array aggregate reimbursement rates by MCO by primary care and non-
primary care categories.
Report Background and Implementation
This report was prepared by the Managed Care Purchasing and Payment Policy Division of DHS
which has the contract procurement, management, compliance, and rate setting responsibilities
for contracted MCOs. Preparations for this report began in early fall of 2009 for implementation
in calendar year 2010. As required by statute, DHS consulted with MCOs and provider groups
regarding the form and manner of the data collection. This included a workgroup of MCO
administrative and data staff that met during 2009 and into 2010 on the specifications for the first
phase of the provider payment data collection. DHS also met with provider organizations, such
1 DHS’ contract with First Plan Blue ended in calendar year 2009. No data is reported for First Plan because the reporting
requirement is in the calendar year 2010 managed care contracts.

2
as the Minnesota Medical Association (MMA) and the Minnesota Hospital Association (MHA),
to provide input on the proposed implementation of the data collection.
This new reporting requirement for MCOs will be accomplished in two phases. Phase I requires
MCOs to submit provider payment data for the most recent completed contract year by provider
type and service categories for each MHCP managed care product, information on passing
through rate increases and decreases, rate methodologies, and an array of provider contracted
rates. The first phase requires MCOs to submit this data manually to DHS, similar to the
financial data submission required by the Minnesota Department of Health (MDH). The format
of this submission was the product of the MCO administrative and technical payment data work
group. The workgroup agreed upon the provider types, service categories, and related definitions
as reported in Appendix 1.
Phase II will require MCOs to report provider payment data on individual encounter claims. The
second phase will be implemented January through April of 2011. Some data will still be
collected manually by DHS, e.g. provider payments outside the claims process, Medicare cost-
sharing, rate methodologies, etc.; however, the majority of data will be submitted via encounter
claims. This will support more consistent MCO data collection and allow DHS to perform more
in-depth analyses. In future reports, DHS will use individual-level data received on encounter
claims to produce aggregate reports.
PROVIDER PAYMENT DATA
Report overview The data submitted by the MCOs to DHS consisted of four major sections as outlined in statute:
1) aggregate provider payment data; 2) how MCOs pass through legislatively mandated provider
rate increases and decreases; 3) information on the MCOs’ provider rate methodologies; and 4)
an aggregate array of provider reimbursement rates. As required by statute, DHS has included in
this report payments to physicians, physician extenders, hospitals, and other provider types and
array aggregate provider reimbursement rates by MCO, by primary care and non-primary care
categories.
This legislative report includes the data required to be reported to the legislature as described
above and a high-level discussion of the nonpublic data submitted to DHS. All of the MCO-
specific data submitted to DHS under the reporting requirement is classified as nonpublic data
under Minnesota Statutes §13.02. For this first report, the reporting period is calendar year 2009,
the most recently completed contract year for which all data was available. Managed care
products include: MA Families and Children, GAMC, MinnesotaCare, Minnesota SeniorCare
Plus (MSC+), Minnesota Senior Health Options (MSHO), Minnesota Disability Health Options
(MnDHO), and Special Needs Basic Care (SNBC).

3
For Phase I of this reporting requirement, DHS focused the scope of the data submission to basic
care services. These services generally consist of medical services, medical facility fees, access
services, and home care services for all MHCP enrollees in managed care. The rates set by DHS
and paid to the MCOs for these services (referred to as basic care rates) are determined
separately from long-term care services such as elderly waiver (EW) services. Home and
community-based waiver services were not included in the first phase but will be collected on
encounter claims as part of the second phase of this reporting requirement beginning April 1,
2011.
It is also important to note that this report does not include payments made for Medicare covered
services for dual eligible enrollees in the Medicare integrated products MSHO and SNBC.
MCOs are only required to submit payment data for Medicaid covered services and Medicare
cost-sharing paid by Medicaid.
Section 1 – Aggregate provider payment data MCOs are required to submit aggregate provider payments separated by inpatient and outpatient
services and by primary care and non-primary care categories. In consultation with the MCO
workgroup, DHS defined service categories2 similar to those used in annual health plan financial
reporting to the Minnesota Department of Health (MDH), for the Health Plan Financial and
Statistical Report as a base to improve consistency in reporting. These categories are used by
MDH to collect expenditure data. DHS further expanded the categories to include other service
categories and provider types similar to the MHCP fee-for-service (FFS) program.
Since the legislation focused on MCOs reporting primary care and non-primary care categories
separately, DHS used the following primary care specialties for physician and advanced practice
nurse (APN) services to define the primary care category.
Family Medicine
General Medicine
Internal Medicine
Obstetrics and Gynecology (OB/GYN)
Pediatric (non-subspecialty)
Primary care specialties were established by using the American Board of Specialties recognized
specialties and subspecialties. Provider types, services categories and definitions are reported in
Appendix 1. All other provider specialties were categorized as non-primary care.
2 See Minnesota Department of Health, Health Plan Financial and Statistical Report, Formset & Instructions, Section 7: Health
Care Expenses. http://www.health.state.mn.us/divs/hpsc/dap/cdireports/grppurch/index.html

4
Aggregate provider payment data is reported in Tables 1-8 by MCO, service or provider type,
and managed care product. Payments for certain services or provider categories may appear low
or vary significantly for products for dual eligible enrollees (MSC+, MSHO, SNBC) because
those services are typically covered by Medicare Part A, B and D (e.g. physician services,
inpatient, outpatient, prescription drugs, etc.) and allocation of Medicaid dollars vis-à-vis
Medicare may differ across MCOs. Dual eligible enrollees make up 100 percent of the MSHO3
program, 80 percent of MSC+, and 60 percent of SNBC and MnDHO. The MSC+ product is not
integrated with Medicare.
The data reported in Tables 1-8 represent MCO payments for services provided January 1
through December 31, 2009 to MHCP enrollees in managed care. As mentioned above, these
payments are for state plan services included in the basic care rate and exclude payments for
home and community-based waiver services. Payments for services can vary greatly across
MCOs and across programs. Factors that contribute to that variation include:
Population demographics and health risk. Age, gender, institutional status, dual eligibility
status, and health risk are all factors that cause variation in what MCOs spend on medical
services comparatively. For example, an MCO may have high prevalence of mental health
diagnoses in its enrolled population compared to other MCOs, resulting in higher spending
on mental health services.
Program enrollment. MCOs with higher enrollment are more likely to have higher spending
across the board than MCOs with lower enrollment. Average monthly enrollment figures by
MCO and by program are provided for reference in Tables 1-8.
Service area/geographic location. MCO costs and types of services available can vary by
geographic region. For example, Personal Care Assistance (PCA) services are more widely
available in the metro area versus non-metro, therefore an MCO primarily serving the metro
area may have higher PCA spending than an MCO primarily serving the non-metro area.
Payment type or arrangement. MCOs employ a variety of payment arrangements with
contracted providers. Varying arrangements may result in a service category dollars being
higher or lower for one more or MCOs relative to all MCOs. For example, some MCOs may
bundle professional or technical services with its outpatient facility rate versus other MCOs
that do not. An MCO may have gain or risk-sharing arrangements that are allocated across
certain service categories or that are reported under “expenses not itemized above.”
3 In calendar year 2009 there was a small percentage of non-dual eligibles in MSHO. Beginning in calendar year 2010, all
MSHO enrollees are dual eligibles.
5
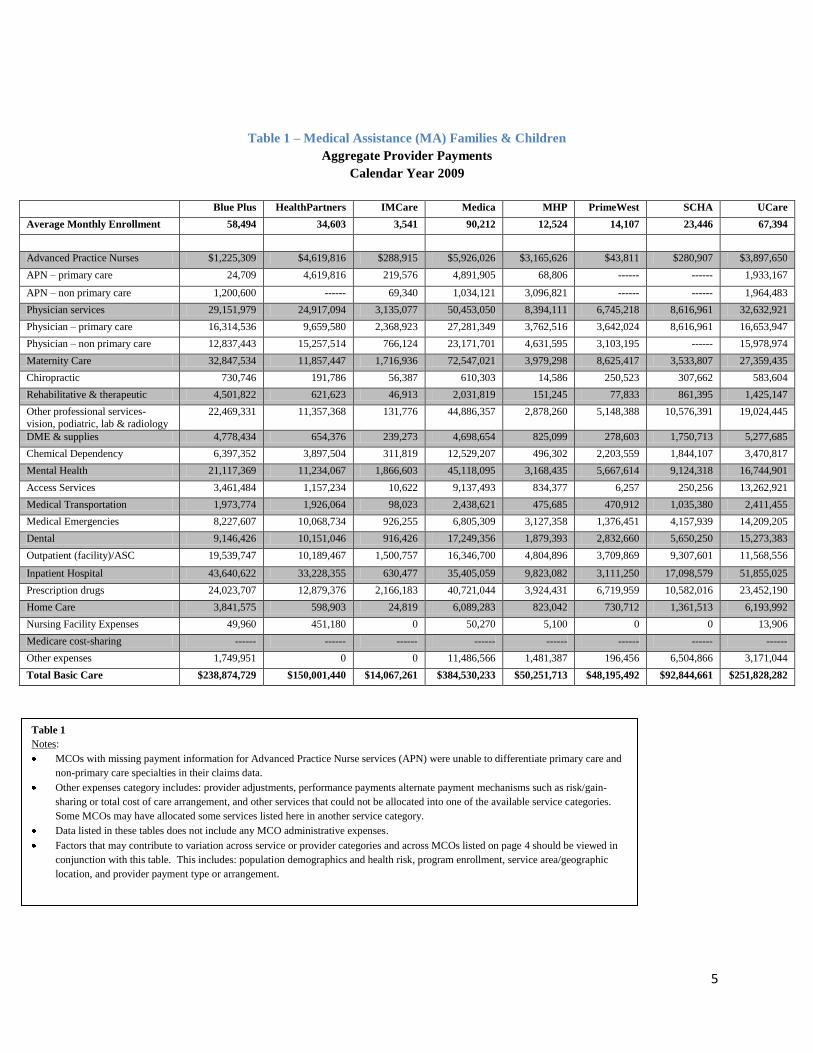
Table 1 – Medical Assistance (MA) Families & Children
Aggregate Provider Payments
Calendar Year 2009
Blue Plus HealthPartners IMCare Medica MHP PrimeWest SCHA UCare
Average Monthly Enrollment 58,494 34,603 3,541 90,212 12,524 14,107 23,446 67,394
Advanced Practice Nurses $1,225,309 $4,619,816 $288,915 $5,926,026 $3,165,626 $43,811 $280,907 $3,897,650
APN – primary care 24,709 4,619,816 219,576 4,891,905 68,806 ------ ------ 1,933,167
APN – non primary care 1,200,600 ------ 69,340 1,034,121 3,096,821 ------ ------ 1,964,483
Physician services 29,151,979 24,917,094 3,135,077 50,453,050 8,394,111 6,745,218 8,616,961 32,632,921
Physician – primary care 16,314,536 9,659,580 2,368,923 27,281,349 3,762,516 3,642,024 8,616,961 16,653,947
Physician – non primary care 12,837,443 15,257,514 766,124 23,171,701 4,631,595 3,103,195 ------ 15,978,974
Maternity Care 32,847,534 11,857,447 1,716,936 72,547,021 3,979,298 8,625,417 3,533,807 27,359,435
Chiropractic 730,746 191,786 56,387 610,303 14,586 250,523 307,662 583,604
Rehabilitative & therapeutic 4,501,822 621,623 46,913 2,031,819 151,245 77,833 861,395 1,425,147
Other professional services-
vision, podiatric, lab & radiology
22,469,331 11,357,368 131,776 44,886,357 2,878,260 5,148,388 10,576,391 19,024,445
DME & supplies 4,778,434 654,376 239,273 4,698,654 825,099 278,603 1,750,713 5,277,685
Chemical Dependency 6,397,352 3,897,504 311,819 12,529,207 496,302 2,203,559 1,844,107 3,470,817
Mental Health 21,117,369 11,234,067 1,866,603 45,118,095 3,168,435 5,667,614 9,124,318 16,744,901
Access Services 3,461,484 1,157,234 10,622 9,137,493 834,377 6,257 250,256 13,262,921
Medical Transportation 1,973,774 1,926,064 98,023 2,438,621 475,685 470,912 1,035,380 2,411,455
Medical Emergencies 8,227,607 10,068,734 926,255 6,805,309 3,127,358 1,376,451 4,157,939 14,209,205
Dental 9,146,426 10,151,046 916,426 17,249,356 1,879,393 2,832,660 5,650,250 15,273,383
Outpatient (facility)/ASC 19,539,747 10,189,467 1,500,757 16,346,700 4,804,896 3,709,869 9,307,601 11,568,556
Inpatient Hospital 43,640,622 33,228,355 630,477 35,405,059 9,823,082 3,111,250 17,098,579 51,855,025
Prescription drugs 24,023,707 12,879,376 2,166,183 40,721,044 3,924,431 6,719,959 10,582,016 23,452,190
Home Care 3,841,575 598,903 24,819 6,089,283 823,042 730,712 1,361,513 6,193,992
Nursing Facility Expenses 49,960 451,180 0 50,270 5,100 0 0 13,906
Medicare cost-sharing ------ ------ ------ ------ ------ ------ ------ ------
Other expenses 1,749,951 0 0 11,486,566 1,481,387 196,456 6,504,866 3,171,044
Total Basic Care $238,874,729 $150,001,440 $14,067,261 $384,530,233 $50,251,713 $48,195,492 $92,844,661 $251,828,282
Table 1
Notes:
MCOs with missing payment information for Advanced Practice Nurse services (APN) were unable to differentiate primary care and
non-primary care specialties in their claims data.
Other expenses category includes: provider adjustments, performance payments alternate payment mechanisms such as risk/gain-
sharing or total cost of care arrangement, and other services that could not be allocated into one of the available service categories.
Some MCOs may have allocated some services listed here in another service category.
Data listed in these tables does not include any MCO administrative expenses.
Factors that may contribute to variation across service or provider categories and across MCOs listed on page 4 should be viewed in
conjunction with this table. This includes: population demographics and health risk, program enrollment, service area/geographic
location, and provider payment type or arrangement.

6
Table 2 – General Assistance Medical Care (GAMC)
Aggregate Provider Payments
Calendar Year 2009
Blue Plus HealthPartners IMCare Medica MHP PrimeWest SCHA UCare
Average Monthly Enrollment 2,198 3,442 188 5,955 1,589 490 840 4,386
Advanced Practice Nurses $77,234 $606,682 $77,452 $489,127 $409,991 $33,844 $15,036 $143,176
APN – primary care 975 606,682 58,864 305,883 901 ------ ------ 68,517
APN – non primary care 76,259 ------ 18,589 409,091 409,091 ------ ------ 74,659
Physician services 3,097,402 5,787,571 393,736 8,246,001 1,936,165 620,463 365,575 4,900,957
Physician – primary care 1,081,333 1,048,581 299,239 2,055,566 453,556 138,091 365,575 1,363,109
Physician – non primary care 2,016,069 4,738,990 94,497 6,190,434 1,482,608 482,372 ------ 3,537,849
Maternity Care 62,403 29,857 1,230 252,243 2,074 7,305 133,723
Chiropractic 44,859 47,899 5,949 96,303 13,693 12,370 9,895 38,061
Rehabilitative & therapeutic 772,915 247,347 9,141 480,171 123,152 8,718 195,931 351,050
Other professional services-vision,
podiatric, lab & radiology
2,827,135 3,055,126 22,967 9,762,065 1,092,0702 572,466 1,342,450 3,937,272
DME & supplies 534,200 252,101 23,256 932,369 294,655 31,293 272,707 1,208,292
Chemical Dependency 5,981,675 6,427,036 293,162 18,114,361 1,880,657 1,073,351 894,007 5,610,845
Mental Health 4,282,957 5,592,349 245,409 14,362,557 1,605,282 503,041 1,804,925 7,465,489
Access Services 517,112 126,033 57 122,702 178,391 18 132,644 2,506,265
Medical Transportation 401,351 962,169 38,023 648,567 316,526 84,593 157,856 982,555
Medical Emergencies 732,003 3,092,638 125,088 1,049,955 1,191,928 82,914 363,005 3,556,698
Dental 751,636 2,296,024 95,947 2,246,373 479,873 225,636 384,605 1,990,240
Outpatient (facility)/ASC 2,726,877 3,251,312 224,342 4,206,307 1,141,034 414,739 1,056,097 3,001,533
Inpatient Hospital 5,620,957 11,467,728 369,573 10,084,208 591,974 807,874 1,765,206 12,317,148
Prescription drugs 4,791,541 5,752,114 716,945 13,027,063 2,960,871 1,261,897 2,342,845 8,657,785
Home Care 94,424 311 0 50,378 5,271 1,387 806 20,953
Nursing Facility Expenses 7,396 208,353 0 15,797 3,172 14,458 379 27,463
Medicare cost-sharing ------ ------ ------ ------ ------ ------ ------ ------
Other expenses 169,506 0 0 1,393,318 177,520 15,014 1,127,245 153,734
Total Basic Care $33,493,583 $49,202,650 $2,642,277 $85,579,865 $24,232,931 $5,764,076 $12,238,519 $57,003,239
Table 2
Notes:
MCOs with missing payment information for Advanced Practice Nurse services (APN) were unable to differentiate primary care
and non-primary care specialties in their claims data.
Other expenses category includes: provider adjustments, performance payments alternate payment mechanisms such as risk/gain-
sharing or total cost of care arrangement, and other services that could not be allocated into one of the available service categories.
Some MCOs may have allocated some services listed here in another service category.
Data listed in these tables does not include any MCO administrative expenses.
Factors that may contribute to variation across service or provider categories and across MCOs listed on page 4 should be viewed
in conjunction with this table. This includes: population demographics and health risk, program enrollment, service
area/geographic location, and provider payment type or arrangement.

7
Table 3 – MinnesotaCare Families with Children
Aggregate Provider Payments
Calendar Year 2009
Blue Plus HealthPartners IMCare Medica MHP PrimeWest SCHA UCare
Average Monthly Enrollment 28,153 7,234 847 17,309 716 621 606 10,477
Advanced Practice Nurses $444,446 $692,583 $33,064 $740,490 $332,718 $26,954 $6,365 $299,312
APN – primary care 7,212 692,583 25,128 538,102 6,892 ------ ------ 193,969
APN – non primary care 437,234 ------ 7,935 202,388 325,826 ------ ------ 105,343
Physician services 12,599,243 5,015,820 731,071 9,300,175 1,472,700 448,348 83,177 4,726,921
Physician – primary care 5,783,739 1,436,023 554,420 4,238,327 365,638 136,409 83,177 2,012,323
Physician – non primary care 6,815,504 3,579,797 176,651 5,061,848 1,107,062 311,939 ------ 2,714,598
Maternity Care 4,665,162 781,080 131,594 3,739,498 32,648 96,645 41,179 1,283,314
Chiropractic 734,952 116,343 23,323 288,620 558 29,824 4,891 92,605
Rehabilitative & therapeutic 2,432,120 194,674 13,082 534,747 7,728 12,002 31,565 234,025
Other professional services-vision, podiatric, lab & radiology
11,852,763 2,788,169 42,817 8,329,272 74,732 350,366 340,454 3,757,198
DME & supplies 2,277,448 134,209 50,286 941,402 28,612 23,024 65,029 1,029,413
Chemical Dependency 1,820,237 515,727 62,107 1,518,243 4,025 87,148 35,518 407,309
Mental Health 5,426,703 1,639,179 154,310 5,943,782 140,697 236,566 143,746 1,951,166
Access Services 77,769 200,156 0 225,851 5,752 257 2,702 231,439
Medical Transportation 594,792 189,493 1,885 266,934 5,212 13,376 11,092 212,110
Medical Emergencies 2,424,128 1,232,168 122,026 537,124 52,424 43,209 79,856 1,585,502
Dental 5,838,588 2,944,957 241,165 5,171,034 183,710 434,775 186,797 3,415,761
Outpatient (facility)/ASC 11,885,120 2,538,935 374,607 3,262,255 79,239 229,348 366,692 2,486,696
Inpatient Hospital 13,360,897 2,814,179 210,730 5,502,725 94,870 222,766 308,184 4,633,826
Prescription drugs 14,094,822 3,566,909 585,379 9,219,150 119,798 978,638 367,568 5,869,962
Home Care 619,444 91,488 55 165,355 5,527 1,024 4,088 273,445
Nursing Facility Expenses 431 58,140 0 2,466 0 0 0 45,343
Medicare cost-sharing ------ ------ ------ ------ ------ ------ ------ ------
Other expenses 477,005 0 0 2,180,371 37,418 10,324 292,928 252,744
Total Basic Care $91,626,070 $25,514,209 $2,777,501 $57,869,494 $2,678,369 $3,244,594 $2,371,831 $32,788,091
Table 3
Notes:
MCOs with missing payment information for Advanced Practice Nurse services (APN) were unable to differentiate primary care and
non-primary care specialties in their claims data.
Other expenses category includes: provider adjustments, performance payments alternate payment mechanisms such as risk/gain-
sharing or total cost of care arrangement, and other services that could not be allocated into one of the available service categories.
Some MCOs may have allocated some services listed here in another service category.
Data listed in these tables does not include any MCO administrative expenses.
Factors that may contribute to variation across service or provider categories and across MCOs listed on page 4 should be viewed in
conjunction with this table. This includes: population demographics and health risk, program enrollment, service area/geographic
location, and provider payment type or arrangement.

8
Table 4 – MinnesotaCare Adults without Children
Aggregate Provider Payments
Calendar Year 2009
Blue Plus HealthPartners IMCare Medica MHP PrimeWest SCHA UCare
Average Monthly Enrollment 15,805 7,076 655 12,774 1,305 1,148 1,752 9,805
Advanced Practice Nurses $446,388 $1,069,838 $70,545 $919,124 $1,791 $48,130 $24,949 $275,220
APN – primary care 4,424 1,069,838 53,614 620,145 ------ ------ ------ 147,643
APN – non primary care 441,964 ------ 16,931 298,979 1,791 ------ ------ 127,577
Physician services 14,516,886 9,507,344 1,099,452 14,146,235 9,983 862,403 520,038 7,939,501
Physician – primary care 5,625,895 1,839,863 835,584 4,005,586 1,648 264,695 520,038 1,944,401
Physician – non primary care 8,890,991 7,667,481 263,868 10,140,649 8,335 597,708 ------ 5,995,099
Maternity Care 547,154 90,946 0 357,872 24,254 12,952 4,349 212,387
Chiropractic 437,718 121,618 18,844 272,240 14,737 34,900 24,432 85,010
Rehabilitative & therapeutic 2,556,726 363,317 26,966 767,511 76,512 22,822 156,622 453,560
Other professional services-vision, podiatric, lab & radiology
14,180,238 5,102,969 41,945 14,544,187 929,441 867,735 1,683,038 7,143,764
DME & supplies 2,323,767 358,210 84,070 1,380,250 176,209 52,626 297,809 2,336,676
Chemical Dependency 5,891,622 3,325,647 190,816 7,663,629 379,303 956,614 933,206 2,600,723
Mental Health 6,073,375 2,468,811 159,054 8,461,788 705,815 459,980 837,841 3,340,732
Access Services 74,784 197,313 0 166,700 19,589 0 0 367,454
Medical Transportation 913,021 618,793 41,926 578,766 98,386 80,709 123,239 667,723
Medical Emergencies 2,278,131 2,434,943 185,739 736,185 472,859 107,569 363,307 3,260,942
Dental 4,460,637 4,713,421 307,035 3,813,778 384,729 237,257 933,157 4,407,660
Outpatient (facility)/ASC 14,770,839 4,729,463 696,901 6,014,366 814,803 651,422 1,576,103 5,507,330
Inpatient Hospital 9,757,589 4,285,903 400,879 5,812,273 226,523 581,295 1,327,713 5,336,373
Prescription drugs 18,454,252 7,766,536 982,997 17,812,346 1,895,980 974,895 1,836,213 12,747,885
Home Care 350,531 1,629 4,739 342,962 34,503 15,405 3,597 134,968
Nursing Facility Expenses 31,977 166,020 628 58,477 0 4,472 0 45,529
Medicare cost-sharing ------ ------ ------ ------ ------ ------ ------ ------
Other expenses 611,068 0 0 1,774,557 182,688 21,084 1,189,533 492,926
Total Basic Care $98,676,703 $47,322,721 $4,312,536 $85,623,246 $6,448,106 $5,992,270 $11,835,146 $57,356,363
Table 4
Notes:
MCOs with missing payment information for Advanced Practice Nurse services (APN) were unable to differentiate primary care
and non-primary care specialties in their claims data.
Other expenses category includes: provider adjustments, performance payments alternate payment mechanisms such as risk/gain-
sharing or total cost of care arrangement, and other services that could not be allocated into one of the available service categories.
Some MCOs may have allocated some services listed here in another service category.
Data listed in these tables does not include any MCO administrative expenses.
Factors that may contribute to variation across service or provider categories and across MCOs listed on page 4 should be viewed
in conjunction with this table. This includes: population demographics and health risk, program enrollment, service
area/geographic location, and provider payment type or arrangement.

9
Table 5 – MA Minnesota Senior Care Plus (MSC+)
Aggregate Provider Payments
Calendar Year 2009
Blue Plus HealthPartners IMCare Medica MHP PrimeWest SCHA UCare
Average Monthly Enrollment 2,085 1,298 146 3,379 652 1,050 956 1,417
Advanced Practice Nurses $674,733 $77,771 $9,322 $22,241 $63,929 ------ $996 $19,968
APN – primary care 85 77,771 7,084 14,043 130 ------ ------ 7,605
APN – non primary care 674,649 ------ 2,237 8,198 63,799 ------ ------ 12,363
Physician services 804,340 1,914,799 88,846 512,796 142,667 381,684 11,645 397,547
Physician – primary care 190,995 202,656 67,523 166,886 45,138 44,791 11,645 127,129
Physician – non primary care 613,345 1,712,142 21,323 345,910 97,529 336,893 ------ 270,419
Maternity Care 5,653 0 0 0 0 0 0 0
Chiropractic 7,341 1,456 456 6,107 1,414 6,580 12,937 1,555
Rehabilitative & therapeutic 297,973 137,553 1,683 223,929 1,019 72,409 12,263 36,362
Other professional services-vision, podiatric, lab & radiology
412,510 493,698 2,953 585,769 91,076 29,945 48,030 288,377
DME & supplies 1,023,583 183,923 7,382 75,667 44,870 3,697 71,079 761,893
Chemical Dependency 57,400 14,226 12,992 191,990 325 445 3,836 30,285
Mental Health 777,914 1,716,017 77,492 386,990 83,256 263,735 253,568 326,176
Access Services 936,522 328,964 443 1,725,466 258,387 202,523 61,116 878,965
Medical Transportation 154,800 223,795 3,985 59,531 8,524 5,567 290,398 366,648
Medical Emergencies 59,745 138,724 38,399 10,340 8,438 0 5,274 64,837
Dental 297,490 472,544 38,184 932,151 1,480 168,909 173,647 359,233
Outpatient (facility)/ASC 708,018 2,064,546 68,349 649,647 81,254 0 35,475 156,514
Inpatient Hospital 1,139,435 1,276,424 79,593 567,186 171,373 0 98,249 883,236
Prescription drugs 331,940 510,146 90,711 870,574 295,519 110,992 91,026 409,863
Home Care 4,681,123 2,231,930 595,648 15,233,846 2,317,379 2,066,077 1,782,280 6,950,207
Nursing Facility Expenses 1,022,433 745,512 67,479 1,528,002 34,239 589,460 988,872 580,260
Medicare cost-sharing ------ 566,899 196,874 10,480,052 1,972,241 2,128,618 2,185,612 1,629,494
Other expenses 105,557 0 0 399,198 118,033 19,094 123,684 103,447
Total Basic Care $13,498,510 $13,098,926 $1,380,791 $34,461,482 $5,695,423 $6,049,735 $6,249,987 $14,244,867
Table 5
Notes:
MCOs with missing payment information for Advanced Practice Nurse services (APN) were unable to differentiate primary care and non-
primary care specialties in their claims data.
Other expenses category includes: provider adjustments, performance payments alternate payment mechanisms such as risk/gain-sharing or
total cost of care arrangement, and other services that could not be allocated into one of the available service categories. Some MCOs may
have allocated some services listed here in another service category.
Data listed in these tables does not include any MCO administrative expenses
Data listed in these tables does not include payments for all services rendered for special needs population products (i.e. MSC+, MSHO,
MnDHO, and SNBC).
For MSC+, MSHO, SNBC, and MnDHO data may be under or over reported for some MCOs due to or data limitations and/or in categories
where services are covered by both Medicare and Medicaid.
For Medicare-integrated products, MCOs may use different methodologies for allocating Medicaid –only dollars across service and provider
categories where Medicare is the primary coverage; therefore some service categories may not be comparable across MCOs.
For seniors, MCOs are only required to cover 180 days of nursing home care.
Factors that may contribute to variation across service or provider categories and across MCOs listed on page 4 should be viewed in
conjunction with this table. This includes: population demographics and health risk, program enrollment, service area/geographic location,
and provider payment type or arrangement.

10
Table 6 – MA Minnesota Senior Health Options (MSHO)
Aggregate Provider Payments
Calendar Year 2009
Blue Plus HealthPartners IMCare Medica* MHP PrimeWest SCHA UCare
Average Monthly Enrollment 10,045 2,780 472 8,821 773 2,059 1,865 9,123
Advanced Practice Nurses $329,703 $160,950 $217,350 $33,837 $27 $73,990
APN – primary care ------ 160,950 165,186 15 ------ ------ $16,451
APN – non primary care 329,703 ------ 52,164 33,823 ------ ------ 57,539
Physician services 264,871 513,736 71,686 77,025 894,318 2,134 2,288,811
Physician – primary care 144,832 102,823 54,481 28,540 8,602 2,134 1,598,913
Physician – non primary care 120,039 410,913 17,205 48,485 885,716 ------ 689,898
Maternity Care 0 0 0 0 0 0 89
Chiropractic 562 3,727 1,445 6,865 0 33,806 10,576
Rehabilitative & therapeutic 840,876 270,136 1,081 24,295 125,344 20,854 281,044
Other professional services-vision, podiatric, lab & radiology
273,198 154,648 6,848 28,807 195,280 148,354 1,697,158
DME & supplies 4,253,863 44,237 271,948 1,485 19,545 148,133 2,700,355
Chemical Dependency 29,473 19,791 18,164 3,259 743 5,201 24,352
Mental Health 2,840,230 467,791 34,829 506,241 281,070 801,488 907,735
Access Services 2,782,964 772,091 17,717 357,436 379,826 97,687 5,222,578
Medical Transportation 15,460 457,137 3,081 7,065 43,830 377,142 1,456,649
Medical Emergencies 9,671 15,135 33,671 12,968 0 0 264,666
Dental 1,248,506 1,184,655 76,662 145,991 306,530 272,634 2,153,980
Outpatient (facility)/ASC 139,012 509,864 456,937 44,666 490 0 585,116
Inpatient Hospital 339,096 504,492 76,712 15,133 0 0 2,569,383
Prescription drugs 1,503,777 573,959 10,885 71,790 300,645 345,569 2,699,332
Home Care 23,025,385 12,114,864 900,587 3,385,582 2,338,727 2,175,047 43,127,233
Nursing Facility Expenses 9,253,767 2,152,702 300,970 330,235 6,125,353 5,809,259 7,442,791
Medicare cost-sharing 22,998,726 6,168,628 623,434 1,295,854 3,377,505 3,318,851 17,519,089
Other expenses 0 0 0 236,498 70,133 52,820 237,119
Total Basic Care $70,149,140 $26,088,544 $3,124,007 $6,584,762 $14,459,339 $13,609,006 $91,262,046
Table 6
Notes:
MCOs with missing payment information for Advanced Practice Nurse services (APN) were unable to differentiate primary care and non-
primary care specialties in their claims data.
Other expenses category includes: provider adjustments, performance payments alternate payment mechanisms such as risk/gain-sharing or
total cost of care arrangement, and other services that could not be allocated into one of the available service categories. Some MCOs may
have allocated some services listed here in another service category.
Data listed in these tables does not include any MCO administrative expenses
Data listed in these tables does not include payments for all services rendered for special needs population products (i.e. MSC+, MSHO,
MnDHO, and SNBC).
For MSC+, MSHO, SNBC, and MnDHO data may be under or over reported for some MCOs due to or data limitations and/or in categories
where services are covered by both Medicare and Medicaid.
For Medicare-integrated products, MCOs may use different methodologies for allocating Medicaid –only dollars across service and provider
categories where Medicare is the primary coverage; therefore some service categories may not be comparable across MCOs.
For seniors, MCOs are only required to cover 180 days of nursing home care.
Factors that may contribute to variation across service or provider categories and across MCOs listed on page 4 should be viewed in
conjunction with this table. This includes: population demographics and health risk, program enrollment, service area/geographic location,
and provider payment type or arrangement.
*Data are excluded for Medica due to data complications encountered in separating out Medicaid-only dollars. DHS will submit a
supplemental table to this report once the data are received.

11
Table 7 – MA Special Needs Basic Care (SNBC)
Aggregate Provider Payments
Calendar Year 2009
Blue Plus HealthPartners IMCare Medica* MHP PrimeWest SCHA UCare
Average Monthly Enrollment 1,334 ----- ----- 853 139 254 774 151
Advanced Practice Nurses $42,841 ----- ----- $36,237 $3,762 $1,783 $9,615
APN – primary care ------ ----- ----- ------ ------ ------ 5,493
APN – non primary care 42,841 ----- ----- 36,237 ------ ------ 4,122
Physician services 897,778 ----- ----- 173,629 565,004 35,083 99,745
Physician – primary care 374,767 ----- ----- 37,544 39,442 35,083 43,769
Physician – non primary care 523,011 ----- ----- 136,085 616,562 ------ 55,976
Maternity Care 9,065 ----- ----- 11,525 0 0 0
Chiropractic 16,287 ----- ----- 3,699 0 18,270 593
Rehabilitative & therapeutic 372,782 ----- ----- 42,711 11,214 24,876 5,772
Other professional services-vision, podiatric, lab & radiology
973,803 ----- ----- 72,120 131,317 187,613 99,223
DME & supplies 600,522 ----- ----- 33,199 24,436 111,566 42,204
Chemical Dependency 156,170 ----- ----- 12,086 49,020 28,612 36,123
Mental Health 1,467,873 ----- ----- 439,074 1,071,025 1,973,417 181,846
Access Services 540,643 ----- ----- 76,145 53,278 109,525 108,894
Medical Transportation 206,855 ----- ----- 23,260 26,253 215,010 38,876
Medical Emergencies 200,976 ----- ----- 93,939 13,779 31,219 58,046
Dental 418,563 ----- ----- 176,962 30,008 456,256 81,826
Outpatient (facility)/ASC 873,222 ----- ----- 61,749 139,798 207,102 60,931
Inpatient Hospital 3,390,099 ----- ----- 41,886 123,997 338,815 82,327
Prescription drugs 2,421,608 ----- ----- 546,444 741,576 599,638 235,391
Home Care 720,627 ----- ----- 23,958 125,072 287,269 32,449
Nursing Facility Expenses 162,766 ----- ----- 6,287 100,955 336,056 2,912
Medicare cost-sharing 2,060,707 ----- ----- 146,246 616,562 1,436,522 181,201
Other expenses 3,339 ----- ----- 208,513 15,813 174,521 90
Total Basic Care $15,536,526 ----- ----- $2,229,670 $3,842,869 $6,573,153 $1,358,064
Table 7
Notes:
MCOs with missing payment information for Advanced Practice Nurse services (APN) were unable to differentiate primary care and non-
primary care specialties in their claims data.
Other expenses category includes: provider adjustments, performance payments alternate payment mechanisms such as risk/gain-sharing or
total cost of care arrangement, and other services that could not be allocated into one of the available service categories. Some MCOs may
have allocated some services listed here in another service category.
Data listed in these tables does not include any MCO administrative expenses
Data listed in these tables does not include payments for all services rendered for special needs population products (i.e. MSC+, MSHO,
MnDHO, and SNBC).
For MSC+, MSHO, SNBC, and MnDHO data may be under or over reported for some MCOs due to or data limitations and/or in categories
where services are covered by both Medicare and Medicaid.
For Medicare-integrated products, MCOs may use different methodologies for allocating Medicaid –only dollars across service and provider
categories where Medicare is the primary coverage; therefore some service categories may not be comparable across MCOs.
For SNBC, MCOs are only required to cover 100 days of nursing home care.
Factors that may contribute to variation across service or provider categories and across MCOs listed on page 4 should be viewed in
conjunction with this table. This includes: population demographics and health risk, program enrollment, service area/geographic location,
and provider payment type or arrangement.
*Data are excluded for Medica due to data complications encountered in separating out Medicaid-only dollars. DHS will submit a
supplemental table to this report once the data are received.
HealthPartners and IMCare do not have a SNBC contract with DHS.

12
Table 8 – MA Minnesota Disability Health Options (MnDHO)
Aggregate Provider Payments
Calendar Year 2009
Blue Plus HealthPartners IMCare Medica MHP PrimeWest SCHA UCare
Average Monthly Enrollment ----- ----- ----- ----- ----- ----- ----- 1,288
Advanced Practice Nurses ----- ----- ----- ----- ----- ----- ----- $64,285
APN – primary care ----- ----- ----- ----- ----- ----- ----- 11,319
APN – non primary care ----- ----- ----- ----- ----- ----- ----- 52,966
Physician services ----- ----- ----- ----- ----- ----- ----- 1,175,148
Physician – primary care ----- ----- ----- ----- ----- ----- ----- 292,817
Physician – non primary care ----- ----- ----- ----- ----- ----- ----- 882,331
Maternity Care ----- ----- ----- ----- ----- ----- ----- 8,813
Chiropractic ----- ----- ----- ----- ----- ----- ----- 5,398
Rehabilitative & therapeutic ----- ----- ----- ----- ----- ----- ----- 697,867
Other professional services-vision, podiatric, lab & radiology
----- ----- ----- ----- ----- ----- ----- 983,092
DME & supplies ----- ----- ----- ----- ----- ----- ----- 2,069,949
Chemical Dependency ----- ----- ----- ----- ----- ----- ----- 261,642
Mental Health ----- ----- ----- ----- ----- ----- ----- 1,164,309
Access Services ----- ----- ----- ----- ----- ----- ----- 1,383,377
Medical Transportation ----- ----- ----- ----- ----- ----- ----- 2,278,781
Medical Emergencies ----- ----- ----- ----- ----- ----- ----- 378,324
Dental ----- ----- ----- ----- ----- ----- ----- 843,844
Outpatient (facility)/ASC ----- ----- ----- ----- ----- ----- ----- 938,914
Inpatient Hospital ----- ----- ----- ----- ----- ----- ----- 4,553,603
Prescription drugs ----- ----- ----- ----- ----- ----- ----- 2,995,146
Home Care ----- ----- ----- ----- ----- ----- ----- 22,229,334
Nursing Facility Expenses ----- ----- ----- ----- ----- ----- ----- 891,466
Medicare cost-sharing ----- ----- ----- ----- ----- ----- ----- 2,890,518
Other expenses ----- ----- ----- ----- ----- ----- ----- 445,453
Total Basic Care ----- ----- ----- ----- ----- ----- ----- $46,259,263
Table 8
Notes:
MCOs with missing payment information for Advanced Practice Nurse services (APN) were unable to differentiate primary care and non-
primary care specialties in their claims data.
Other expenses category includes: provider adjustments, performance payments alternate payment mechanisms such as risk/gain-sharing or
total cost of care arrangement, and other services that could not be allocated into one of the available service categories. Some MCOs may
have allocated some services listed here in another service category.
Data listed in these tables does not include any MCO administrative expenses
Data listed in these tables does not include payments for all services rendered for special needs population products (i.e. MSC+, MSHO,
MnDHO, and SNBC).
For MSC+, MSHO, SNBC, and MnDHO data may be under or over reported for some MCOs due to or data limitations and/or in categories
where services are covered by both Medicare and Medicaid.
For Medicare-integrated products, MCOs may use different methodologies for allocating Medicaid –only dollars across service and provider
categories where Medicare is the primary coverage; therefore some service categories may not be comparable across MCOs.
For MnDHO, MCOs are only required to cover 180 days of nursing home care.
Factors that may contribute to variation across service or provider categories and across MCOs listed on page 4 should be viewed in
conjunction with this table. This includes: population demographics and health risk, program enrollment, service area/geographic location,
and provider payment type or arrangement.
UCare is the only MCO that has contracted for MnDHO with DHS.

13
Section 2 – Legislative provider rate changes MCOs are required to submit information on how they pass through legislatively mandated
provider rate increases or decreases. Since the reporting period is for calendar year 2009, DHS
required MCOs to submit information based on provider rate changes that occurred in that
contract year. The following includes legislatively mandated provider rate changes4 during
calendar year 2009, the effective date for managed care payments, and discussion of how the
MCOs implemented the changes.
Inpatient 1% reduction - effective 1/1/2009
Physician services (non-primary care) 6.5% reduction - effective 10/1/2009
Basic care services 4.5% reduction- effective 10/1/2009
Home care services 2.58% reduction - effective 10/1/2009
In general, the MCOs followed MHCP FFS policy regarding specific services and codes to be
included or excluded from the rate reductions. This happened automatically for some providers
in an MCO’s network if the provider contracted rate is based on the MHCP fee schedule; in this
case, the MCO would reduce the claim before it is paid. This process is similar to DHS
implementation of FFS rate reductions. Other MCOs amended provider contracts for the
effective dates listed above or upon their renewal.
Section 3 – Provider rate methodologies The legislative mandate also requires MCOs to report specific information on provider rate
methodologies to DHS. For the major service categories or provider types requested by DHS
and listed in Table 9, most MCOs reported using a methodology similar to MHCP FFS rates or
using the FFS rates as a base for reimbursement (MHCP FFS rate methodologies differ
depending on the type of service). Other common rate methodologies reported by MCOs
include: a percent discount from their standard commercial rate, capitation, cost-based,
Medicare, and a percent discount from billed charges. It is important to note that for all service
categories or a provider type listed below, if the MCO did not report using the MHCP fee
schedule as a basis or was unable to report their rates as compared to the MCHP fee schedule,
those MCO rates are not reflected in the reported low to high rate ranges.
The data reported in Table 9 represents reimbursement rates paid for Medicaid services. It does
not include Medicare rates paid for services provided to dual eligible enrollees.
4 For the physician and professional services and basic care rate reductions, the reduction to Medical Assistance (MA) and General Assistance
Medical Care (GAMC) was 6.5% and 4.5% respectively and For MinnesotaCare, 5.0% and 3.0% respectively. The difference in rate reductions across program is due to the Governor’s unallotments.

14
Table 9 – MCO Provider Rate Methodologies
Calendar Year 2009
Provider/Service
Category
MCO Rate Methodologies
Physician & Advanced
Practice Nurse (APN) Services
Physician and APN services for most MCOs are based on relative value units (RVUs) or Resource Based Relative Value Scale
(RBRVS) methodology. Reported MCO rates range from: Low:100% MHCP fee schedule for both primary care and non-primary care providers; and
High: 122% MHCP fee schedule for primary care providers and 118% for non-primary care providers.
Most MCOs reported reimbursement rates below 110% of the MHCP fee schedule. Some MCOs pay a small per member per month
case management fee to their primary care providers. Some MCOs pay a higher percent for specific codes such as office visits (i.e.
evaluation & management) and Child & Teen Check-ups (C&TC).
Chiropractic services Some MCOs reported using the MHCP fee schedule for chiropractic services. Reported MCO rates range from:
Low: 100% MHCP fee schedule; and
High: 107% MHCP fee schedule.
Some MCO reported using an RVU method, cost-based method, capitated arrangements, or pay a percent of their standard commercial
rates.
Providers of
rehabilitative &
therapeutic services
(PT, OT, Speech)
Rehabilitative & therapeutic services are generally based on RVUs payment methodology and/or the MHCP fee schedule. Reported
MCO rates range from:
Low: 100% MHCP fee schedule; and
High: 118% MHCP fee schedule.
Most MCOs reported reimbursement rates below 110% of the MHCP fee schedule.
Outpatient Hospital Services (facility)
MCOs use Medicare’s Ambulatory Payment Classification (APC) methodology or a percent of billed charges for outpatient facility services. The MHCP fee schedule uses APC methodology. Reported MCO rates range from:
Low: 100% MHCP fee schedule; and
High: 110% MHCP fee schedule.
Some MCOs reported paying differently for emergency versus non-emergency services or for critical access hospitals.
Inpatient Hospital
Services
Most MCOs use Diagnostic Related Groups (DRGs) for inpatient hospital services. The MHCP fee schedule uses DRG methodology.
Reported MCO rates range from: Low: 100% MHCP fee schedule; and
High: 110% of MHCP fee schedule.
MCOs that did not report they use MHCP as a basis for their rates may pay higher or lower than the MHCP fee schedule.
Dental Services MCOs reported using the MHCP fee schedule as a base for their dental rates. Reported MCO rates range from:
Low: 100% of MHCP fee schedule; and
High: 140% of MHCP fee schedule.
Some MCOs reported paying some provider higher rates for higher needs populations, such as SNBC, or for specialty providers.
Prescription Drugs
For both brand-name prescription drugs, most MCOs reported using the Average Wholesale Price (AWP) as the benchmark for
reimbursement rates and Maximum Allowable Cost (MAC) for generics. Reported MCO rates range from:
Low: AWP-18% for brand, AWP-72.9% for generic; and High: AWP-7% for brand, AWP-58% for generic.
Most MCOs averaged between 12-16% discounts from AWP.
Mental Health Services - outpatient
Most MCOs reported using the MHCP fee schedule as the base for outpatient mental health services provider reimbursement. Reported MCO rates range from:
Low: 100% MHCP fee schedule; and
High: 115% MHCP fee schedule.
Some MCOs reported using a percent of their standard commercial rate or a cost-based method for mental health services.
Chemical Dependency Services - outpatient
Most MCOs reported using the MHCP fee schedule as the base for chemical dependency non-residential provider reimbursement. Reported MCO rates range from:
Low: 100% of MHCP fee schedule; and
High: 130% of MHCP fee schedule.
Some MCOs reported using a percent of their standard commercial rate for chemical dependency services.
Home Care Services –
PCA, PDN, home health aide, skilled
nurse visits
Most MCOs reported using the MHCP fee schedule as the base for home care provider reimbursement. Reported MCO rates range
from: Low: 100% of MHCP fee schedule; and
High: 110% of MHCP fee schedule.
Some MCOs reported using a percent of billed charges for certain home care providers or providers outside of the metro area.

15
Section 4 – Aggregate provider reimbursement rates
The statute requires DHS to report an aggregate array of reimbursement rates by MCO broken
down into primary and non-primary care categories. Primary care versus non-primary care is
defined for this purpose in section 1. MCOs submitted average reimbursement rates across all
provider contracts and across all public programs for the services or provider types similar to
section 1. Each category includes a series of common procedures for services or provider types
listed in Appendix 2. It is important to note that the rates reported in Table 10 are aggregated
across the procedure codes listed in Appendix 2 and across all programs. Many factors can
impact the reported average provider contracted rate, including but not limited to:
Program type. Many MCOs’ reimbursement rates differ by program because the
populations in the programs are unique (e.g. MA families with children versus MA
seniors, Medicare-integrated versus non-integrated) and because DHS sets rates
separately for each program (i.e. base rates are different for MA versus MinnesotaCare
families with children).
Population demographics and health status. MCO reimbursement rates may differ
depending on the case mix (population characteristics and health risk) and the MCO’s
enrollment or population size of the public programs they serve. For example, an MCO
may have a higher percent of senior enrollment compared to its other public program
enrollment and compared to other MCOs. This may result in higher or lower
reimbursement rates for certain services based on the needs of the populations they serve.
Geographic location/provider access. MCOs’ reimbursement may vary based on
provider costs in the metro versus non-metro and may be higher in some areas or by
service type in order to ensure access to care for MCHP enrollees. For example, an
MCO’s rate may be higher for dental services in greater Minnesota versus the metro area
and the majority of the MCO’s service area may be outside the metro area; therefore that
MCO’s average rate for dental services may be higher compared to other MCOs.
Payment type or payment arrangement. MCOs may reimburse providers differently
across service categories, provider types and populations. MCOs pay bundled rates, have
gain or risk-sharing contracts, and pay provider incentives or withholds. These varying
arrangements may result in over or under reporting of reimbursement rates in certain
categories in Table 10. The reporting reflects a standard FFS payment arrangement.

16
Table 10 - Average Provider Reimbursement Rates by MCO
Calendar Year 2009
Service Blue Plus HealthPartners IMCare Medica MHP PrimeWest SCHA UCare
Physician
Primary Care
Office visit-minimal (low) $ 13.28 $ 16.65 $ 13.30 $ 16.22 $ 15.06 $ 19.19 $ 17.57 $ 20.01
Office visit-low severity(med) $ 26.51 $ 30.28 $ 26.58 $ 35.62 $ 33.39 $ 30.30 $ 33.41 $ 37.64
Office visit-
comprehensive(high) $ 72.17 $ 85.75 $ - $ 85.93 $ 82.47 $ 81.99 $ 88.87 $ 90.28
Non-clinic outpatient visit $ 32.77 $ 41.55 $ 13.30 $ 78.43 $ 53.71 $ 21.58 $ 37.86 $ 34.57
Non-clinic inpatient visit $ 63.55 $ 60.67 $ 32.39 $ 77.75 $ 72.09 $ 71.38 $ 78.46 $ 74.68
Non-Primary Care
Office visit-minimal (low) $ 12.92 $ 24.73 $ 11.56 $ 18.94 $ 19.54 $ 25.27 $ 27.42 $ 22.15
Office visit-low severity(med) $ 28.10 $ 29.66 $ 23.11 $ 41.16 $ 33.83 $ 29.83 $ 33.89 $ 32.39
Office visit-
comprehensive(high) $ 73.85 $ 72.31 $ - $ 90.32 $ 75.35 $ 79.37 $ 99.17 $ 84.83
Non-clinic outpatient visit $ 46.69 $ 40.77 $ 11.56 $ 76.32 $ 50.11 $ 31.05 $ 37.10 $ 33.79
Non-clinic inpatient visit $ 53.11 $ 93.40 $ 28.16 $ 78.06 $ 58.05 $ 70.57 $ 71.61 $ 70.61
Advanced Practice Nurse
(APN)
Primary Care
Office visit-minimal (low) $ 19.55 $ 16.65 $ 13.30 $ 16.26 $ 19.87 $ 25.12 $ 25.91 $ 22.35
Office visit-low severity(med) $ 26.47 $ 30.28 $ 26.58 $ 30.90 $ 30.14 $ 29.73 $ 32.63 $ 33.45
Office visit-
comprehensive(high) $ 72.89 $ 85.75 $ - $ 73.38 $ 80.32 $ 79.58 $ - $ 85.94
Non-clinic outpatient visit $ 32.17 $ 41.55 $ 13.30 $ 69.24 $ 33.73 $ 27.23 $ 42.24 $ 30.96
Non-clinic inpatient visit $ 62.99 $ 60.67 $ 32.39 $ 56.89 $ 93.32 $ 68.80 $ 57.88 $ 69.10
Non-Primary Care
Office visit-minimal (low) $ - $ 24.73 $ 11.56 $ 19.88 $ 19.52 $ - $ 15.98 $ 21.85
Office visit-low severity(med) $ - $ 29.66 $ 23.11 $ 32.76 $ 32.22 $ - $ 35.15 $ 33.68
Office visit-comprehensive(high)
$ - $ 72.31 $ - $ 89.51 $ 79.75 $ - $ - $ 91.14
Non-clinic outpatient visit $ - $ 40.77 $ 11.56 $ 74.75 $ 55.56 $ - $ 56.77 $ 34.36
Non-clinic inpatient visit $ - $ 93.40 $ 28.16 $ 52.78 $ 93.40 $ - $ 58.89 $ 66.05
Chiropractic
Chiropractic manipulative treatment-One to two regions
$ 16.48 $ 30.65 $ 15.41 $ 19.87 $ 16.75 $ 17.44 $ - $ -
Rehabilitative & therapeutic
Speech therapy - treatment $ 56.17 $ 46.64 $ 49.45 $ 69.41 $ 60.35 $ 55.44 $ 53.22 $ 86.32
Physical therapy - treatment $ 21.71 $ 22.91 $ 18.66 $ 18.50 $ 34.86 $ - $ 28.41 $ 20.64
Occupational therapy -
treatment $ 21.75 $ 22.91 $ 22.49 $ - $ 34.86 $ - $ 21.64 $ 24.00

17
Table 10 - Average Provider Reimbursement Rates by MCO, Continued
Calendar Year 2009
Service Blue Plus HealthPartners IMCare Medica MHP PrimeWest SCHA UCare
Inpatient
Vaginal birth - normal $ 3,468.27 $ 3,380.69 $ 2,830.56 $ 3,071.21 $ 3,210.30 $ 3,400.92 $2,995.33 $ 2,948.34
C-section - normal $ 6,221.24 $ 5,506.96 $ 4,716.21 $ 4,353.63 $ 4,242.15 $ 5,581.90 $5,263.68 $ 5,283.95
Vaginal birth - complicated $ 4,482.95 $ 4,585.77 $ 3,546.46 $ 4,044.43 $ 4,023.30 $ 3,709.90 $3,871.05 $ 3,477.11
C-Section - complicated $ 7,012.33 $ 7,420.61 $ 6,054.55 $ 6,359.27 $ 4,759.88 $ 5,881.01 $6,566.36 $ 7,579.44
Mental Health (ages 19<) $ 2,473.07 $ 5,517.00 $ 5,251.26 $ 8,996.85 $ 5,209.86 $ 6,234.56 $ 955.96 $ 8,294.52
Mental Health (ages 19>) $ 2,469.81 $ 4,424.19 $ 5,270.48 $ 6,750.01 $ 5,729.27 $ 2,003.89 $ 920.58 $ 6,531.87
Chemical Dependency
Treatment $ 1,774.51 $ 115.69 $ 27.43 $ 3,606.16 $ - $ - $15,102.06 $ 3,727.99
Outpatient (facility)
Emergency $ 43.99 $ 152.96 $ 26.99 $ 256.60 $ 172.56 $ 122.23 $ 210.38 $ 151.87
Non-Emergency $ 36.23 $ 97.83 $ 13.30 $ 69.10 $ 72.03 $ 26.47 $ 69.52 $ 60.59
Dental
Diagnostic $ 25.91 $ 42.00 $ 30.95 $ 39.42 $ 26.79 $ 26.48 $ 20.41 $ 23.26
Preventive $ 50.05 $ 39.00 $ 55.99 $ 36.98 $ 52.04 $ 24.78 $ 18.54 $ 22.26
Home Care
Private Duty Nursing (PDN) $ 6.37 $ 7.26 $ 6.30 $ 10.84 $ - $ - $ 7.74 $ 7.80
Personal Care Assistance
(PCA) $ 3.81 $ 3.96 $ 3.96 $ 6.36 $ 4.06 $ 6.42 $ 5.01 $ 4.03
Mental Health (outpatient)
Children’s
Diagnostic assessment $ 215.50 $ 97.54 $ 139.11 $ 140.60 $ 115.34 $ 108.87 $ 140.53 $ 135.95
Interactive assessment $ 148.17 $ 148.17 $ 170.40 $ 191.11 $ 178.57 $ 157.85 $ 163.03 $ 177.54
Individual psychotherapy $ 37.47 $ 35.91 $ 53.13 $ 44.02 $ 33.20 $ 42.90 $ 42.36 $ 42.90
Adult
Diagnostic assessment $ 131.67 $ 97.54 $ 139.11 $ 134.90 $ 106.94 $ 108.85 $ 143.55 $ 131.37
Interactive assessment $ 148.17 $ 148.17 $ 170.40 $ 198.19 $ 135.21 $ - $ 142.52 $ 138.06
Individual psychotherapy $ 37.47 $ 35.91 $ 41.30 $ 49.41 $ 44.05 $ 46.44 $ 48.41 $ 45.32
Chemical Dependency
(outpatient)
Residential treatment $ 100.06 $ 89.42 $ 353.38 $ 2,106.22 $ 1,136.51 $ 1,140.34 $ 516.79 $ 97.30
Non-residential treatment $ 44.78 $ 31.88 $ 27.43 $ 27.88 $ 114.49 $ 295.04 $ 148.81 $ 32.60
Table 10
Notes:
MCOs with missing rate information for Advanced Practice Nurse (APN) services were unable to identify primary care versus non-
primary care specialties in their claims data.
MCOs with missing rate information for chiropractic services have capitated arrangements.
MCOs with missing rate information in other categories did not have sufficient claims under the required procedure codes listed in
Appendix 2 for the reporting period and/or the primary coverage was Medicare.
The data listed in table 10 represents the average rate reported by MCOs aggregated across and programs and procedures codes listed
in Appendix 2.
The data listed in table 10 does not include data or information on the volume of services (i.e. utilization) for each service category
reported.
Factors that may contribute to variation across service or provider categories and across MCOs listed on page 15 should be viewed in
conjunction with this table. This includes: program type, population demographics and health risk, geographic location/provider
access, and provider payment type or arrangement.

18
CONCLUSION
This report is intended to provide information and data to the legislature on payments made to
providers by MCOs under contract with DHS to provide services to MHCP enrollees. The
information in this report provides a general overview of detailed provider payment and rate
methodology data defined as nonpublic and aggregate provider payments and reimbursement
rate data separated into primary care and non-primary care categories as required by statute. It is
important to note that this reporting requirement is specific to MCO provider payments and does
not include MCO administrative dollars or discussion of MCO surplus or loss as required by
other health plan financial reporting5.
Overall, the data submitted by the MCOs to DHS under this reporting requirement were
generally consistent with some outliers and missing or incomplete data. Since this was the first
year MCOs were required to submit this data to DHS, some issues were to be expected. Three to
five years of data collection is necessary to improve consistency in the data submission and
allow appropriate analyses of trends.
As noted earlier, the data in this report is from the first phase of the MCO provider payment data
reporting requirement. Implementation of the second phase will be from January 1 through April
1, 2011. The second phase requires MCOs to start including provider payment and
reimbursement rate data on the individual encounter claims already submitted to DHS on a
monthly basis. Collecting data at the individual claim level will yield additional information to
support improved oversight and accountability of the dollars MCOs pay to providers for services
provided to MHCP enrollees.
5 Data reported by MCOs under this requirement may differ from MCO financial reporting required by MDH or Commerce due
to the timing of data submission (i.e. claims run out date) and other factors.

19
APPENDIX 1 - Provider Type and Service Category Definitions
Section 1: Aggregate Provider Payments
Provider/Service Type
Category for MDH financial
reporting Definition
ADVANCED PRACTICE NURSE SERVICES Other health professional services These are costs for all services provided by licensed nurse
practitioners, nurse anesthetists, nurse midwives, clinical nurse specialist, and public health nurses. Advanced
practice nurse services expenses should exclude the costs
of maternity care, mental health services, and chemical dependency services.
1. Primary Care Specialties
(American Board of Specialties)
Family Practice
General Practice
Internal Medicine
Pediatrics
OBGYN
2. All Other Non-Primary Care Specialties
PHYSICIAN SERVICES Physician services These are costs for all services provided by or under the
supervision of licensed medical doctors by a physician assistant and doctors of osteopathy, including
pharmaceuticals and supplies administered or dispensed
from the physician office and billed directly through the physician and health care home services. Physician
services expenses should exclude the costs of maternity
care, mental health services and chemical dependency services. Costs should be allocated to a physician's
primary specialty if they are credentialed in multiple
specialties.
1. Primary Care Specialties
(American Board of Specialties)
Family Practice
General Practice
Internal Medicine
Pediatrics
OBGYN
2. All Other Non-Primary Care Specialties
MATERNITY CARE Physician services, Inpatient services These are costs for all maternity care including prenatal
visits, labor & delivery, through the first post-natal visit.
CHEMICAL DEPENDENCY TREATMENT
SERVICES
Chemical Dependency and Mental
Health
These are costs related to chemical dependency services,
including inpatient and outpatient services, using the
following chemical health diagnosis codes starting with 291, 292, & 303-305.
CHIROPRACTIC SERVICES Other health professional services These are costs for all services provided by a licensed
chiropractor.
DENTAL SERVICES Dental services These are all costs, professional and other, provided under dental services contracts or riders. This includes services
provided by a licensed dentist and dental hygienist.
INPATIENT HOSPITAL SERVICES Inpatient hospital services These are costs for those services furnished by a hospital
for inpatient services, including inpatient hospice care. Inpatient hospital services expenses should exclude costs
where the primary diagnosis codes are mental health and
chemical dependency related. This excludes costs for maternity care.
ACCESS SERVICES N/A These are costs for interpreter services (language &
hearing), access transportation which includes transit, taxi
or volunteer transportation, common carrier, and
community health workers.
OTHER PROFESSIONAL SERVICES Other health professional services Lab, Diagnostic, & Radiological services: These are costs for all laboratory and radiology services provided outside
of an inpatient setting or ambulatory surgical center.
Podiatric services: These are costs for all services provided by a licensed podiatrist.
Vision care services: These are costs for all services
provided by a licensed ophthalmologist, optometrist, and optician. This does not include the cost of eyewear or
contact lenses.
Emergency Services

20
Provider/Service Type
Category for MDH financial
reporting Definition
DURABLE MEDICAL EQUIPMENT & Durable medical goods These are costs for such items as wheel chairs, eyewear, hearing aids, surgical appliances, bulk and cylinder
oxygen, equipment rental, and other devices or equipment
that can withstand repeated use; prosthetic and orthotic devices; and medical supplies including non-reusable
supplies or pieces of equipment that are used to treat a
health condition.
MEDICAL SUPPLIES
MEDICAL TRANSPORTATION Emergency services These are costs for all emergency and non-emergency transportation provided by an ambulance or a special
transportation service (STS) provider.
MENTAL HEALTH SERVICES
Chemical Dependency and Mental
Health
These are costs related to mental health services,
including inpatient and outpatient services, using mental
health diagnosis codes starting with 290, 293-302, & 306-316.
OUTPATIENT HOSPITAL SERVICES
(facility) Outpatient services
Outpatient hospital (facility): These are costs for those
services offered by a hospital which are furnished to
ambulatory patients not requiring emergency care and for which there is not a room and board charge, this includes
triage and stabilization care. Outpatient services expenses should exclude the costs of maternity, mental health
services and chemical dependency services. This
category excludes lab, diagnostic, and radiological services.
Ambulatory Surgical Center (ASC): These are costs for
services provide at a free-standing or hospital based ambulatory surgical center, including lab, diagnostic, and
radiological services. This category excludes professional
services, mental health and chemical dependency services.
AMBULATORY SURGICAL CENTER (ASC)
MEDICAL EMERGENCY SERVICES Emergency services These are costs for medical care provided in the
emergency room of a hospital. This includes the room,
board and any services such as x-ray and laboratory services billed by the facility. It does not include
expenditures for physician services.
PRESCRIPTION DRUGS
Pharmacy and other nondurable
medical goods
These are only costs paid by the health plan company to a
pharmacist to provide pharmaceuticals used to treat a
health condition. These data do not include the cost of pharmaceuticals and other nondurable medical goods
administered or dispensed which are billed directly through a hospital or health care provider. Expenditures
provided in this section should be net of pharmaceutical
rebates.
OVER-THE-COUNTER (OTCs)
REHABILITATIVE & THERAPEUTIC Other health professional services These are costs for all services provided by a licensed
physical therapist, speech therapist, occupational therapist, audiologist, and respiratory therapist outside of
an inpatient setting.
HOME CARE SERVICES N/A These are costs for the following non-waiver home care services: skilled nurse visits, private duty nursing, home
health aide, personal care assistance, and qualified
supervision of personal care services.
NURSING FACILITY EXPENSES Skilled nursing facility expenses These are costs for services furnished by a Medicare or
Medicaid certified facility primarily engaged in providing nursing care and skilled nursing care and related services
for patients who require medical or nursing care or
rehabilitation services. These expenses should include room and board incurred at nursing facilities. Nursing
facilities expenses should exclude costs of mental health
and chemical dependency services. This should include Medicare coinsurance paid by Medicaid.

21
Provider/Service Type
Category for MDH financial
reporting Definition
MEDICARE COST-SHARING N/A These are expenses for Medicare cost-sharing paid by Medicaid for Part A and B services.
EXPENSES NOT ITEMIZED ABOVE Expenses not itemized above This includes expense for capitated and total cost of care
arrangement that cannot be allocated into the other service categories (please provide a description of these
arrangements included in this category), performance
payments, administrative fee withhold, prepayment for appointment availability, and IBNR that cannot be
allocated into one of the other service/provider category.

22
APPENDIX 2 – Procedure Codes
Section 1: Aggregate Provider Reimbursement Rates
Provider/Service Type Procedure Code (CPT, HCPC, Dental, Revenue)
1. Physician/Advanced Practice Nurses (APNs)
A. Primary Care Providers
i. Clinic-based office visits
1. Level 1: minimal (new & established) 99201, 99211
2. Level 2: limited (new & established) 99202, 99212
3. Level 3: low severity (new & established) 99203, 99213
4. Level 4: moderate (new & established) 99204, 99214
5. Level 5: comprehensive (new & established) 99205, 99215
ii. Non clinic-based visits
1. Inpatient 99221-99233
2. Outpatient 99201-99215, 99381-99383
B. Non-Primary Care Providers
i. Clinic-based office visits
1. Level 1: minimal (new & established) 99201, 99211
2. Level 2: limited (new & established) 99202, 99212
3. Level 3: low severity (new & established) 99203, 99213
4. Level 4: moderate (new & established) 99204, 99214
5. Level 5: comprehensive (new & established) 99205, 99215
ii. Non clinic-based visits
1. Inpatient 99221-99233
2. Outpatient 99201-99215, 99381-99383
3. Chiropractors
A. Chiropractic manipulative treatment (CMT)
i. one to two regions 98940
4. Providers of rehabilitative and therapeutic services
(outpatient professional services)
A. Speech-language pathology
i. SLP treatment sessions 92507-92508, 92526, 92626-92627, 92630, 92633
B. Physical Therapy
i. PT treatment session 95851-95852
C. Occupational Therapy
i. OT treatment session 95851-95852
5. Inpatient Hospital
A. Maternity
i. vaginal birth - normal DRG - 373
ii. C-section - normal DRG - 371
iii. vaginal birth - complicated DRG - 372
iv. C-section - complicated DRG - 370
B. Chemical dependency
i. hospital-based treatment 0944, or 0945; H2036

23
Provider/Service Type Procedure Code (CPT, HCPC, Dental, Revenue)
C. Mental Health diagnosis codes starting with 290, 293-302, & 306-316.
6. Outpatient Hospital (facility only)
A. Emergency 99281-99285
B. Non-emergency 99201-99215, 99381-99383
7. Dentists, dental hygienists
A. Diagnostic D0120, D0140, D0145, D0150, D0210, D0220, D0230, D0272, D0274, D0330
B. Preventive D1110, D1120, D1203, D1204, D1206, D1330, D1351, D1510, D1515
9. Home care providers
A. Private Duty Nursing (RN/LPN) - 15 minute unit T1002-T1003, modifiers TG, TT
B. PCA services - 15 minute unit T1019, modifiers TT, HQ, U6, UA
10. Chemical Dependency services (non-hospital based)
A. Residential
i. treatment 0944 or 0945; H2036
B. Non-residential (outpatient)
i. treatment 0944 or 0945; H2035
11. Mental Health Services (outpatient only)
A. Children's Mental Health Services
i. Diagnostic assessment - 1 session 90801
ii. Interactive diagnostic assessment - 1 session 90802
iii. CTSS Individual psychotherapy - 30 minutes 90804- modifier UA
B. Adult Mental Health Services
i. Diagnostic assessment - 1 session 90801
ii. Interactive diagnostic assessment - 1 session 90802
iii. Individual psychotherapy - 20-30 minutes 90804