protocol for use of five passive samplers to sample for a …€¦ · · 2011-01-19this guidance...
TRANSCRIPT

Protocol for Use of Five Passive Samplers to Sample for a Variety of Contaminants
in Groundwater
Prepared by The Interstate Technology & Regulatory Council
Diffusion/Passive Sampler Team
February 2007
Technical and Regulatory Guidance

ABOUT ITRC
Established in 1995, the Interstate Technology & Regulatory Council (ITRC) is a state-led, national coalition of personnel from the environmental regulatory agencies of some 46 states and the District of Columbia, three federal agencies, tribes, and public and industry stakeholders. The organization is devoted to reducing barriers to, and speeding interstate deployment of better, more cost-effective, innovative environmental techniques. ITRC operates as a committee of the Environmental Research Institute of the States (ERIS), a Section 501(c)(3) public charity that supports the Environmental Council of the States (ECOS) through its educational and research activities aimed at improving the environment in the United States and providing a forum for state environmental policy makers. More information about ITRC and its available products and services can be found on the Internet at www.itrcweb.org. DISCLAIMER
ITRC documents and training are products designed to help regulators and others develop a consistent approach to their evaluation, regulatory approval, and deployment of specific technologies at specific sites. Although the information in all ITRC products is believed to be reliable and accurate, the product and all material set forth within are provided without warranties of any kind, either express or implied, including but not limited to warranties of the accuracy or completeness of information contained in the product or the suitability of the information contained in the product for any particular purpose. The technical implications of any information or guidance contained in ITRC products may vary widely based on the specific facts involved and should not be used as a substitute for consultation with professional and competent advisors. Although ITRC products attempt to address what the authors believe to be all relevant points, they are not intended to be an exhaustive treatise on the subject. Interested parties should do their own research, and a list of references may be provided as a starting point. ITRC products do not necessarily address all applicable health and safety risks and precautions with respect to particular materials, conditions, or procedures in specific applications of any technology. Consequently, ITRC recommends also consulting applicable standards, laws, regulations, suppliers of materials, and material safety data sheets for information concerning safety and health risks and precautions and compliance with then-applicable laws and regulations. The use of ITRC products and the materials set forth herein is at the user’s own risk. ECOS, ERIS, and ITRC shall not be liable for any direct, indirect, incidental, special, consequential, or punitive damages arising out of the use of any information, apparatus, method, or process discussed in ITRC products. ITRC product content may be revised or withdrawn at any time without prior notice. ECOS, ERIS, and ITRC do not endorse or recommend the use of, nor do they attempt to determine the merits of, any specific technology or technology provider through ITRC training or publication of guidance documents or any other ITRC document. The type of work described in any ITRC training or document should be performed by trained professionals, and federal, state, and municipal laws should be consulted. ECOS, ERIS, and ITRC shall not be liable in the event of any conflict between ITRC training or guidance documents and such laws, regulations, and/or ordinances. Mention of trade names or commercial products does not constitute endorsement or recommendation of use by ECOS, ERIS, or ITRC. The names, trademarks, and logos of ECOS, ERIS, and ITRC appearing in ITRC products may not be used in any advertising or publicity, or otherwise indicate the sponsorship or affiliation of ECOS, ERIS, and ITRC with any product or service, without the express written permission of ECOS, ERIS, and ITRC.
Protocol for Use of Five Passive Samplers to Sample for a Variety of Contaminants
in Groundwater
February 2007
Prepared by The Interstate Technology & Regulatory Council
Diffusion/Passive Sampler Team
Copyright 2007 Interstate Technology & Regulatory Council 444 North Capitol Street, NW, Suite 445, Washington, DC 20001

Permission is granted to refer to or quote from this publication with the customary acknowledgment of the source. The suggested citation for this document is as follows: ITRC (Interstate Technology & Regulatory Council). 2007. Protocol for Use of Five Passive
Samplers to Sample for a Variety of Contaminants in Groundwater. DSP-5. Washington, D.C.: Interstate Technology & Regulatory Council, Diffusion/Passive Sampler Team. www.itrcweb.org.
i
ACKNOWLEDGEMENTS
The members of the Interstate Technology & Regulatory Council (ITRC) Diffusion/Passive Sampler Team wish to acknowledge the individuals, organizations, and agencies that contributed to this guidance document. As part of the broader ITRC effort, the Passive Sampler team effort is funded primarily by the U.S. Department of Energy. Additional funding and support have been provided by the U.S. Department of Defense and the U.S. Environmental Protection Agency. ITRC operates as a committee of the Environmental Research Institute of the States, a Section 501(c)(3) public charity that supports the Environmental Council of the States through its educational and research activities aimed at improving the environment in the United States and providing a forum for state environmental policy makers. The team wishes to recognize the efforts of the following state personnel who contributed to the preparation of the document: • George Nicholas, New Jersey Department of Environmental Protection • Kim Ward, New Jersey Department of Environmental Protection • Hal Cantwell, Oklahoma Department of Environmental Quality • James Taylor, California Regional Water Quality Control Board, Central Valley Region • Lily Barkau, Wyoming Department of Environmental Quality The team also wishes to recognize the efforts, substantial contributions, and support of the following individuals and organizations: • Brad Varhol, EON Products • Dee O’Neill, Columbia Analytical
Services, Inc • Louise Parker, USA ERDC CRREL • Don Gronstal, USAF Real Property
Agency • Don Vroblesky, Ph.D., USGS • Hugh Rieck, Army Corps of Engineers • Javier Santillan, HQ AFCEE/ERT • Jim Bernard, Draper Arden Associates • Joseph Gibson, Earth Tech • Joey Trotsky, NFESC • Jay Hodny, W.L. Gore & Associates
• Kent Cordry, GeoInsight • Mark Wilson, Columbia Analytical
Services, Inc. • Michael Crain, Army Corps of
Engineers • Michael Hart, USGS • Sandra Gaurin, BEM Systems • Sandy Britt, ProHydro, Inc • Sharon Matthews, EPA Region 4 • Tom Imbrigiotta, USGS • George Shaw, W.L. Gore & Associates • Richard Willey, EPA
Without the help and cooperation of all the individuals and organizations listed, this document could not have been completed, nor would it represent the input from so many capable and informed perspectives within the environmental community.
iii
EXECUTIVE SUMMARY
This guidance contains protocols for five passive sampling technologies. “Passive sampling” is synonymous with “no-purge sampling.” The technologies included in this document include Snap Sampler™ and Hydrasleeve™ (grab-type well water samplers); regenerated-cellulose dialysis membrane sampler and rigid, porous polyethylene sampler (diffusion/equilibrium-type samplers), and GORE™ Module (a diffusion and sorption–type sampler). These three categories or types of passive samplers are described in detail in the precursor to this document, Technology Overview of Passive Sampler Technologies (DSP-4, ITRC 2006). That overview document and other supporting information are included on a CD in an envelope on the back cover of this document. All groundwater samplers or sampling methodologies attempt to collect a sample that is formation-quality water of the groundwater adjacent to the well. Studies have shown that most wells receive groundwater flow through the screened interval of the well. This screened interval, considered in equilibrium with the adjacent groundwater (formation water), can be sampled with passive samplers with little or no well-water agitation, which can alter the contaminant concentrations in the sampled water. Passive samplers, which remain submerged during a deployment period, collect from a discrete position within a well a sample of water in ambient equilibrium with adjacent groundwater. Passive samplers • are relatively easy to use; • can be deployed in most wells; • are practical for use where access is difficult or where discretion is desirable; • can sample discrete intervals in a well; • can be deployed in series to provide a vertical contaminant profile; • have no depth limit; • reduce field sampling variability, resulting in highly reproducible data; • allow rapid field sample collection; • decrease field labor and project management costs for long-term monitoring; • eliminate purge-water production and thus all or most disposal cost. Not all well water is thoroughly mixed within the screened interval. Passive samplers can be deployed at any location within the screened interval to evaluate the highest or lowest contaminant concentration in a stratified-flow screened interval. Deployed in a series within a screened interval, passive samplers can provide a contaminant concentration profile of the screened interval. According to 16 states responding to a questionnaire, there are no specific regulatory barriers to using passive samplers to collect groundwater samples. There is, however, guidance that specifically requires purge-type sampling, thereby requiring passive samplers to obtain an

iv
exception when used. However, most states require some sort of comparative study if passive samplers are intended to replace an existing sampling program. Some state respondents were unaware of the operating mechanisms of passive sampler technologies and how the samplers collect a formation quality sample from a well. This misconception among regulators is a major reason why the ITRC Diffusion/Passive Sampler Team is publishing this protocol document—to provide a sound guidance on how to properly deploy and collect samples using passive devices. During preparation of four previous ITRC documents on this subject, it is the consensus of the ITRC Diffusion/Passive Sampler Team that the samplers included in this protocol document have been validated through laboratory and field testing. When these samplers are deployed appropriately, the resulting data are reliable and accurate.

v
TABLE OF CONTENTS
ACKNOWLEDGEMENTS............................................................................................................. i
EXECUTIVE SUMMARY ........................................................................................................... iii
1. INTRODUCTION TO PASSIVE SAMPLER TECHNOLOGIES ...........................................1
1.1 Passive Sampling .............................................................................................................2 1.2 Advantages and Limitations of Passive Sampler Technologies ......................................2 1.3 Considerations Common to all Five Passive Sampler Technologies...............................3 1.4 Comparison Approach .....................................................................................................6 1.5 State Survey .....................................................................................................................7 1.6 Summary ..........................................................................................................................9 1.7 Introduction References ...................................................................................................9
2. GORE MODULE.....................................................................................................................12
2.1 Introduction to the GORE Module.................................................................................13 2.2 Sampler Advantages ......................................................................................................14 2.3 Sampler Limitations.......................................................................................................15 2.4 Typical Sampler Deployment ........................................................................................15 2.5 Determining the Applicability of Sampler and Interpretation of Data ..........................19 2.6 Method-Specific Quality Assurance and Quality Control .............................................23 2.7 GORE Module References.............................................................................................24
3. HYDRASLEEVE ....................................................................................................................26
3.1 Introduction to HydraSleeve ..........................................................................................26 3.2 Sampler Advantages ......................................................................................................28 3.3 Sampler Limitations.......................................................................................................28 3.4 Typical Sampler Deployment ........................................................................................28 3.5 Determining the Applicability of Sampler and Interpretation of Data ..........................35 3.6 Method-Specific Quality Control and Quality Assurance .............................................36 3.7 HydraSleeve References ................................................................................................37
4. SNAP SAMPLER....................................................................................................................39
4.1 Introduction to the Snap Sampler...................................................................................39 4.2 Sampler Advantages ......................................................................................................41 4.3 Sampler Limitations.......................................................................................................42 4.4 Typical Sampler Deployment ........................................................................................42 4.5 Determining the Applicability of Sampler and Interpretation of Data ..........................46 4.6 Method-Specific Quality Assurance and Quality Control .............................................53 4.7 Snap Sampler References...............................................................................................53
5. REGENERATED-CELLULOSE DIALYSIS MEMBRANE SAMPLER..............................55
5.1 Introduction to the Regenerated-Cellulose Dialysis Membrane ,Sampler.....................56 5.2 Sampler Advantages ......................................................................................................58 5.3 Sampler Limitations.......................................................................................................58
vi
5.4 Typical Sampler Deployment ........................................................................................58 5.5 Determining Applicability of Sampler and Interpretation of Data ................................67 5.6 Method-Specific Quality Assurance and Quality Control .............................................72 5.7 Dialysis Sampler References .........................................................................................73
6. RIGID POROUS POLYETHYLENE SAMPLER..................................................................75
6.1 Introduction to the Rigid Porous Polyethylene Sampler................................................75 6.2 Sampler Advantages ......................................................................................................78 6.3 Sampler Limitations.......................................................................................................78 6.4 Typical Sampler Deployment ........................................................................................78 6.5 Determining the Applicability of Sampler and Interpretation of Data ..........................80 6.6 Method-Specific Quality Assurance and Quality Control .............................................87 6.7 RPP Sampler References ...............................................................................................87
LIST OF TABLES Table 2-1 Target analytes detected in bench studies and field sampling by the GORE
Module. .....................................................................................................................14 Table 2-2 GORE Module data, calculated concentrations compared to disposable
bailer data collected after purging from monitoring wells at a convenience store/gas station site ..................................................................................................21
Table 2-3 Calculated concentrations (GORE) and measured concentrations, bailer method.......................................................................................................................23
Table 3-1 Typical HydraSleeve specifications .........................................................................27 Table 5-1 Dialysis membrane widths, filled diameters, and filled volumes .............................60 Table 5-2 Analytes tested in the laboratory for equilibration in dialysis samplers...................61 Table 5-3 Water quality parameters tested in field comparisons studies of dialysis
samplers and purging methods..................................................................................71 Table 6-1 RPP vs. conventional sampling results .....................................................................77 Table 6-2 Laboratory results for metals ....................................................................................81 Table 6-3 Laboratory results for 1,4-dioxane............................................................................81 Table 6-4 Laboratory results for wet chemistry ........................................................................81 Table 6-5 Laboratory results for volatile organic compounds ..................................................82 Table 6-6 Laboratory results for methane, ethane and ethene ..................................................83 Table 6-7 Laboratory results for semivolatile organics ............................................................83 Table 6-8 ERDC CRREL explosives standpipe bench study—original RPP design ...............85 Table 6-9 Second ERDC CRREL explosive standpipe bench study—modified RPP
design ........................................................................................................................85 Table 6-10 North Carolina site using RPP for 1,4-dioxane sampling.........................................86
LIST OF FIGURES Figure 1-1 Graphical representation of responses to the ITRC Diffusion/Passive
Sampler Team’s 2006 state survey .............................................................................9 Figure 2-1 GORE module...........................................................................................................12
vii
Figure 2-2 Correlation between GORE Module and low-flow groundwater data for TCE (ETV study)......................................................................................................12
Figure 2-3 Comparison of GORE Module data and low-flow groundwater sampling data for 1,1,2,2-tetrachloroethane (mid-Atlantic U.S. military site)… ....................13
Figure 2-4 GORE Module deployment ......................................................................................16 Figure 2-5 GORE Module deployment ......................................................................................17 Figure 2-6 GORE Module data in units of mass, compared to groundwater
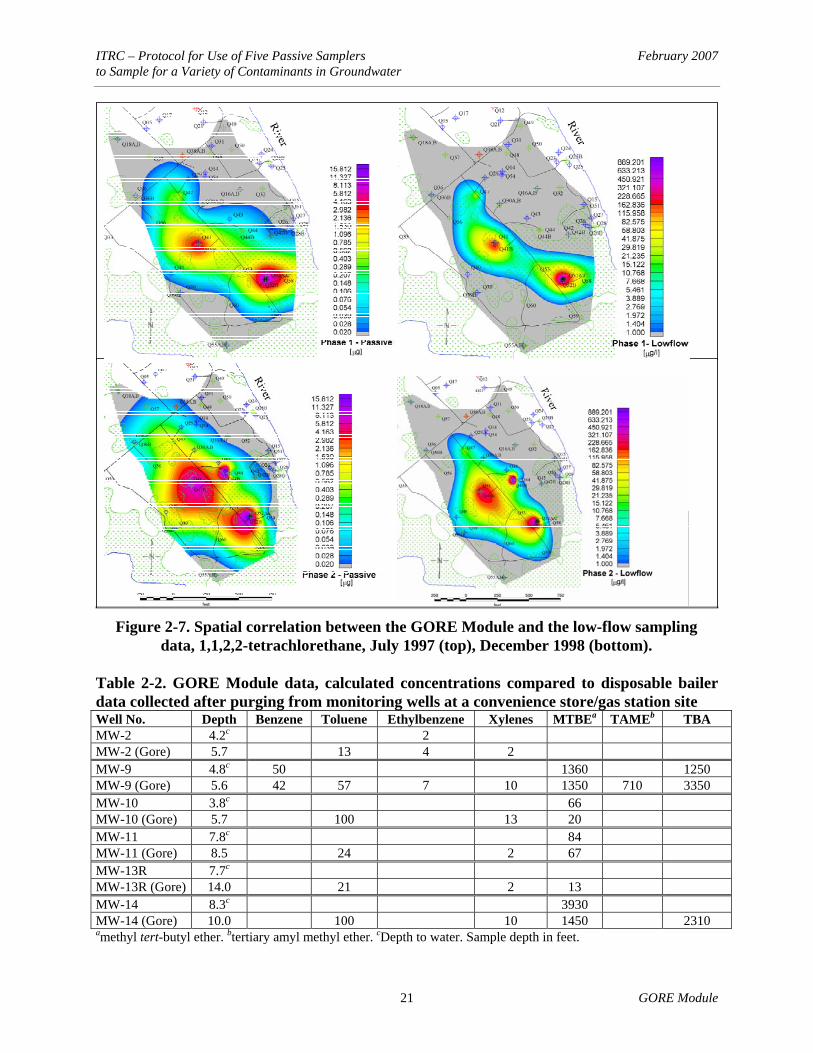
concentration data from conventional sampling.......................................................19 Figure 2-7 Spatial correlation between the GORE Module and the low-flow sampling
data, 1,1,2,2-tetrachlorethane, July 1997 and December 1998.................................21 Figure 2-8 Comparison of the chlorinated compounds observed in monitoring wells at a
dry cleaner.................................................................................................................22 Figure 3-1 Full HydraSleeve retrieved from a well....................................................................27 Figure 3-2 HydraSleeve assembly ..............................................................................................30 Figure 3-3 Top-down deployment ..............................................................................................31 Figure 3-4 Bottom-up deployment .............................................................................................31 Figure 3-5 Bottom anchor deployment.......................................................................................32 Figure 3-6 Multiple samplers attached to a single suspension line ............................................32 Figure 3-7 Multiple samplers attached end to end .....................................................................32 Figure 3-8 Continuous-pull HydraSleeve recovery....................................................................33 Figure 3-9 Sampling low-yield wells with HydraSleeve............................................................34 Figure 3-10 HydraSleeve flexible reed valve ...............................................................................34 Figure 3-11 Discharging sample from HydraSleeve ....................................................................35 Figure 4-1 Snap Sampler body ...................................................................................................40 Figure 4-2 Snap Sampler bottle ..................................................................................................40 Figure 4-3 Inserting sample bottle into Snap Sampler bodies....................................................43 Figure 4-4 Securing the Snap Sampler body parts .....................................................................43 Figure 4-5 Setting the Snap Caps ...............................................................................................44 Figure 4-6 Feeding and securing trigger cable ...........................................................................44 Figure 4-7 Securing sampler into wellhead docking station ......................................................44 Figure 4-8 Preparation of Snap Sampler bottles.........................................................................45 Figure 4-9 Adding preservative to Snap Sampler bottles...........................................................46 Figure 4-10 Equilibrated Snap-PDB/low-flow deployment configuration ..................................48 Figure 4-11 VOC concentrations comparisons for the Snap Sampler vs. PDB and low-
flow sampling............................................................................................................49 Figure 4-12 Snap Sampler, regenerated-cellulose sampler, and polyethylene diffusion
bag vs. low-flow sampling..................................................................................50–51 Figure 4-13 Comparison of VOC concentrations in samples taken in 12 wells using the
Snap Sampler and low-flow purge sampling ............................................................52 Figure 4-14 Comparison of VOC concentrations in a single well: Snap Sampler vs.
volume purge sampling.............................................................................................53 Figure 5-1 Regenerated-cellulose dialysis membrane sampler ..................................................56 Figure 5-2 Parts of a dialysis sampler before assembly .............................................................64 Figure 5-3 Partially assembled dialysis sampler before filling with deionized water with
external supports installed in the protective mesh....................................................64

viii
Figure 5-4 Fully assembled dialysis sampler with supports external to the dialysis membrane..................................................................................................................65
Figure 5-5 Dialysis sampler with rigid perforated support internal to the dialysis membrane..................................................................................................................65
Figure 5-6 A 1:1 correspondence plot comparing cis-1,2-dichloroethene results in dialysis sampler and low-flow purging samples from wells at the Naval Air Warfare Center, West Trenton, New Jersey, 2000–2002 .........................................68
Figure 5-7 A 1:1 correspondence plot of dialysis sampler vs. low-flow purging results for manganese ...........................................................................................................70
Figure 5-8 A 1:1 correspondence plot of dialysis sampler vs. low-flow purging results for chloride................................................................................................................71
Figure 6-1 Original RPP design by Vroblesky with caps and valves at both ends ....................76 Figure 6-2 Current RPP design...................................................................................................76 Figure 6-3 RPP in protective mesh.............................................................................................76 Figure 6-4 RPP sampler deployment at the wellhead.................................................................79 Figure 6-5 Transferring the RPP sample to a standard laboratory sample container .................80 Figure 6-6 Correlation of results for North Carolina site study .................................................86
APPENDICES Appendix A. Minimum Volumes for Analytes Appendix B. State Survey and Responses Appendix C. Diffusion/Passive Sampler Team Contacts Appendix D. Acronyms

PROTOCOL FOR USE OF FIVE PASSIVE SAMPLERS TO SAMPLE FOR A VARIETY OF CONTAMINANTS IN GROUNDWATER
1. INTRODUCTION TO PASSIVE SAMPLER TECHNOLOGIES
This protocol describes the deployment and sample recovery methods for five passive, no-purge sampling devices: the GORE™ Module (formerly referred to as “Gore-Sorber”); Hydrasleeve™; regenerated-cellulose dialysis membrane sampler; rigid, porous polyethylene sampler; and Snap Sampler™. Additionally, this document—which uses the term “passive” synonymously with “no-purge”—addresses approaches for determining the applicability of passive samplers and identifies various factors influencing data interpretation. The guidance is intended for regulators, technical and field personnel, and stakeholders to facilitate the selection and deployment of these passive samplers. The guidelines in this protocol represent a consensus of the Interstate Technology & Regulatory Council (ITRC) Diffusion/Passive Sampler Team, whose participants include five state regulators, as well as representatives from federal agencies, academia, and the private sector. This document also discusses regulatory perspectives related to the use of passive sampling technologies and provides brief case histories involving implementation of each technology. This protocol follows the Technology Overview of Passive Sampler Technologies (DSP-4, ITRC 2006), developed by this same ITRC team to evaluate the maturity, availability, and application of passive sampler technologies. That overview is a companion document to this protocol and has more descriptive information on passive sampling approaches. DSP-4 describes the basis of operation, intended applications, advantages, limitations, and development status of 12 passive sampling devices. The overview also contains a summary table highlighting the important attributes of each technology, including appropriate analytes, availability, and sampler cost. From the 12 technologies evaluated in DSP-4, five samplers were selected for this document based on availability of sampler material, field and lab studies, ease of operation, and utility for passive groundwater sampling. Contacts for additional information are also provided at the end of each technology section. In 2004 the team published Technical and Regulatory Guidance for Using Polyethylene Diffusion Bag Samplers to Monitor Volatile Organic Compounds in Groundwater (DSP-3, ITRC 2004). Detailed technical guidance for use of polyethylene diffusion bag (PDB) samplers is also presented in the U.S. Geological Survey Water-Resources Investigations Report User’s Guide for Polyethylene-Based Passive Diffusion Bag Samplers to Obtain Volatile Organic Compound Concentrations in Wells (Vroblesky 2001). Much of the technical basis of passive sampling is described in detail in the references above and is applicable for the passive sampler technologies described in this document. Additional information on PDBs and other passive samplers can be obtained through the Diffusion/Passive Sampler Team page on the ITRC Web Site and in a CD enclosed in an envelope at the back cover of printed copies of this document. Copies of CD, which contains an overview and Diffusion/Passive Sampler Team documents DSP-1, DSP-3, DSP-4, as well a this volume, DSP-5, can be requested through the ITRC Web Site.
ITRC – Protocol for Use of Five Passive Samplers February 2007 to Sample for a Variety of Contaminants in Groundwater
2
1.1 Passive Sampling
The Diffusion/Passive Sampler Team defines a passive groundwater sampler as one able to acquire a sample from a discrete position in a well without active media transport induced by pumping or purge techniques. All of the passive technologies described in this document rely on the sampling device being exposed to media in ambient equilibrium during the designated sampler deployment period. In wells, the water is expected to be in natural exchange with the formation water (Robin and Gillham 1987). All of the devices provide a sample from a discrete interval within the open borehole or screened interval of a well. The five passive sampler technologies addressed in this document fall into three categories on the basis of sampler mechanism and nature of the collected sample. The categories are described as follows: • Devices that rely on diffusion and sorption to accumulate analytes in the sampler.
Samples are a time-integrated representation of conditions at the sampling point over the entire deployment period. The accumulated mass and duration of deployment are used to calculate analyte concentrations in the sampled medium. – GORE Module
• Devices that recover a grab well water sample. Samples are an instantaneous
representation of conditions at the sampling point at the moment of sample collection. – HydraSleeve – Snap Sampler
• Devices that rely on diffusion of analytes across the sampler membrane to reach and
maintain equilibrium with the sampled medium. Samples are time-weighted toward conditions at the sampling point during the latter portion of the deployment period. The degree of weighting depends on analyte- and device-specific diffusion rates. – regenerated-cellulose dialysis membrane (dialysis) sampler – rigid, porous polyethylene (RPP) sampler
The Diffusion/Passive Sampler Team consensus is that these samplers have been validated through laboratory and field testing. When deployed appropriately, they produce reliable and accurate data.
1.2 Advantages and Limitations of Passive Sampler Technologies
Passive sampler technologies have advantages specific to the nature of each technology. When they are selected appropriately and operated in accordance with the guidelines in this document, users can realize resource savings and accurate results from most groundwater sampling programs.

ITRC – Protocol for Use of Five Passive Samplers February 2007 to Sample for a Variety of Contaminants in Groundwater
3 Introduction to Passive Sampler Technologies
1.2.1 Advantages of Passive Sampler Technologies
Passive samplers • are relatively easy to use; • can be deployed in most wells; • are practical for use where access is difficult or where discretion is desirable; • can sample discrete intervals in a well; • can be deployed in series to provide a vertical contaminant profile; • have no depth limit; • reduce field sampling variability, resulting in highly reproducible data; • allow rapid field sample collection; • decrease field labor and project management costs for long-term monitoring; • eliminate purge-water production and thus all or most disposal cost.
1.2.2 Limitations of Passive Sampler Technologies
Passive samplers • must be submerged in the screened interval during deployment; • require the aquifer to be in hydraulic communication with the screened portion of the well; • require special consideration in wells having a layer of free product; • may have volume/analyte limitations; • require consideration of contaminant stratification.
1.3 Considerations Common to all Five Passive Sampler Technologies
Groundwater sampling is performed to collect a sample of formation-quality water from the screened or open portion of a well. Research shows that many if not most wells exhibit ambient flow-through under natural groundwater gradients (Robin and Gillham 1987, Powell and Puls 1993, Vroblesky 2001, ASTM 2002). The screened sections of these wells may be considered in equilibrium with the formation water without pumping. Ongoing research (Britt 2005, Martin-Hayden and Britt 2006; Vroblesky, Casey, and Lowery 2006), suggests that natural ambient flow-through, temperature inversions, and density effects can induce mixing within wells, resulting in a flow-weighted averaging effect in many wells without purging. Though not all wells are thoroughly mixed, many wells show relatively narrow ranges of vertical concentrations when vertically profiled (Vroblesky 2001, Parsons 2005). Deployment of multiple passive samplers within a well may be advised to characterize vertical contaminant distribution. A single passive sampler may be used for long-term monitoring, depending on data quality objectives (DQOs).
1.3.1 Data Quality Objectives
When using passive samplers, the user must consider DQOs, target analytes, and hydrogeologic concerns. Each sampling technique characterizes contamination in the groundwater differently. Differences may occur when comparing well volume purge, low-flow, or passive sampling techniques. It is important to understand the conceptual basis of any sampling technology since results from the methods may differ. These differences do not necessarily indicate inaccuracies

ITRC – Protocol for Use of Five Passive Samplers February 2007 to Sample for a Variety of Contaminants in Groundwater
4
but reflect the nature of the sampling methods. These differences should be considered when comparing and interpreting sampling results. It is highly recommended that all parties involved in the implementation of new monitoring programs identify and agree on the site-specific DQOs and data evaluation techniques prior to implementation. As with any sampling technique, site-specific DQOs guide the design of sampling programs, including the selection of sampling devices. A representative DQO process, as it is used by the U.S. Department of Energy, can be found at http://dqo.pnl.gov/why.htm.
1.3.2 Deployment
In addition to DQOs, there are certain deployment considerations for passive samplers. Some are device specific and are discussed in the relevant chapter of this protocol; general deployment considerations are discussed here. As with all groundwater sampling, adequate information should be available on well construction (diameter, screen interval, etc.), water level, type and concentration of contaminants, and hydraulic properties of the formation. The sampling device must be suitable for collecting the analytes of interest and required sample volume. Passive samplers are designed to collect samples from a specific depth and must be fully submerged. The depth of deployment is an important variable that affects the results of any sample collected with a passive sampler. The samplers must be deployed at a location where contaminants of concern exchange between the well and aquifer. To determine the proper depth for a single passive sampler deployment, vertical chemical profiling is sometimes required (see Section 1.3.3.3). Passive samplers must allow formation water and well water to restabilize after sampler deployment. Additionally, membrane samplers (RPP, dialysis, GORE Module) must be submerged in a well for a prescribed length of time, based on the permeability of the membrane and the constituents of interest. Each of these deployment periods is described in the sampler-specific chapter.
1.3.3 Hydrological Considerations for Deployment
Passive sampling relies on flow through the well screen to provide formation-quality water from the adjacent aquifer. In interpreting sampling results, it may be important to know whether there is contaminant stratification in the well and to what extent vertical and horizontal flows within the well affect sample collection.
1.3.3.1 Ambient Horizontal Flow through the Well
Studies (Robin and Gillham 1987, Powell and Puls 1993, Vroblesky 2001, ASTM 2002) have shown that, with sufficient aquifer flow conditions, groundwater will continually flow through a properly constructed well. Borehole dilution tests (Halevy et al. 1967; Drost et al. 1968; Grisak, Merritt, and Williams 1977; Palmer 1993) can be used to determine whether water is freely exchanged between the aquifer and the well screen. Under these conditions, groundwater in the
ITRC – Protocol for Use of Five Passive Samplers February 2007 to Sample for a Variety of Contaminants in Groundwater
5 Introduction to Passive Sampler Technologies
screened interval may be replaced in as little as 24 hours. For water in the well to be formation-quality water from the aquifer, the rate of solute contribution from the aquifer to the well must equal or exceed the rate of in-well contaminant loss, such as through volatilization or convection. This condition may not occur where groundwater velocities are very low or the well has a low yield, which is commonly a result of a very low gradient or a very low hydraulic conductivity. It is difficult to collect a formation-quality water sample from low-yield wells due to possible dewatering, aeration, and increased turbidity associated with purging. Passive samplers may be a preferred alternative if considerations are made for restabilization (the period of time well water requires to reach its ambient state following physical agitation) and equilibration (the period of time required for well water and or sampler material to reach chemical equilibrium with the formation water). In limited cases water in a well screened in an anaerobic aquifer may be affected if oxygenated water at the air-water interface is disturbed.
1.3.3.2 Vertical Flow
Vertical flow is common in longer-screened wells and fractured bedrock. If vertical flow is suspected and discrete interval sampling is required by the DQOs of the project, vertical flow profiling should be conducted. Vertical flow profiling can be conducted with a borehole flow meter or a short interval packer/pump located in the well bore to determine the depth of the primary inflow and outflow of groundwater from the open interval of a well.
1.3.3.3 Contaminant Stratification
The screened interval of monitoring wells often contains zones of different contaminant concentrations. For instance, stratification of trichloroethene (TCE) has been observed over vertical distances of as little as 3 feet (Vroblesky 2001). A single passive sampler represents a discrete interval within the well; therefore, if stratified contaminant concentrations are migrating through the aquifer above or below the depth where the sampler is positioned, a single passive sampler may not represent the higher concentration intervals. In this case, it is recommended that the well be vertically profiled using multiple passive samplers to describe the vertical variation in contaminant concentration through the screened interval and to document the most appropriate depth interval for a single passive sampler deployment. As discrete interval samplers, passive samplers depend on a clear understanding of contaminant stratification for proper interpretation of the data. A refinement of knowledge of contaminant stratification can allow refinement of the site conceptual model and potentially optimize any remediation system. If contaminant stratification is found or suspected, vertical chemical profiling can be done by suspending multiple samplers, in series, at discrete intervals within the screened water columns or open interval. This approach will locate zone(s) of higher and lower contaminant concentration in the open interval of a well. It has been recommended that screens or open intervals greater than 5 feet should be initially vertically profiled to detect contaminant stratification (ITRC 2004). However, longer or shorter intervals may be profiled based on site-specific data requirements. Vertical profiling information can be used to select the optimal vertical location for a single sampler deployment. To lower the cost of multiple vertical
It should be stressed that vertical profiling may be needed only once per well, prior to the first sampling.

ITRC – Protocol for Use of Five Passive Samplers February 2007 to Sample for a Variety of Contaminants in Groundwater
6
profile samples, samples can be analyzed with field analytical screening tools or by a certified laboratory for appropriate indicator parameters.
1.3.4 Deployment Depth
The depth at which a passive sampler is deployed should not be arbitrary. The decision must be made based on knowledge of the aquifer, vertical contaminant distribution, well construction, and flow within the well, as well as on historical sampling results. After the user has an adequate understanding of the hydrogeologic environment and contaminant distribution in a given monitoring well, there remains the question of the depth at which a passive sampler should be deployed to collect samples. That decision must be made in accordance with site-specific and even well-specific sampling objectives. If previous vertical profiling of a known or suspected stratified well has been conducted, a selected single deployment depth may be chosen based on the sampling objective. For example, previous data may conclude that the bottom 3 feet of a well have historically contained the highest contaminant concentration; deployment at this depth could be selected based on an objective to sample the highest known concentration within stratified wells. Alternatively, if a well is not stratified, a midscreen deployment may be appropriate. When performing ongoing sampling events, it is critical to place the sampler in the same location or depth for sample consistency and data comparability over time. Sampling at a consistent deployment depth in a well with vertical contaminant stratification improves data reproducibility. As mentioned previously, a passive sampler must be fully submerged. Groundwater levels should be monitored to ensure the sampler remains submerged during the deployment period. This consideration is particularly important where long deployment times are required or where water levels fluctuate (e.g., tidal, temporal, adjacent pumping).
1.3.5 Sample Volume
Passive samplers collect limited sample volumes. With the exception of the GORE Module, the volume needed to fill all bottles for the chosen analyses must be calculated and a safety factor included to make sure enough water volume is collected to complete the analysis and any quality assurance/quality control (QA/QC) that might be required (see Appendix A of this document or go to the Diffusion/Passive Sampler Team Web page. However, laboratories using the new technologies such as “large volume injectors” do not require the standard sample volumes of many volatile and semivolatile analytes. For example, samples that required 1000 mL for standard analysis (for low detection limits) may be reduced to as little as 100 mL when using the “large volume injector” analysis. Consult your laboratory prior to collecting samples.
1.4 Comparison Approach
Converting to a passive sampling method sometimes includes a side-by-side comparison test with the site’s current method (e.g., well volume purge sampling or low-flow purge sampling) to determine whether passive samplers are appropriate at a particular well. Tests have shown that contaminant concentrations from passive samplers adequately represent local ambient conditions within the screened interval despite whether the contaminant concentrations are higher or lower
ITRC – Protocol for Use of Five Passive Samplers February 2007 to Sample for a Variety of Contaminants in Groundwater
7 Introduction to Passive Sampler Technologies
than the conventional method. This effect may be due to the pumped samples’ incorporating water containing higher or lower concentrations either from other water-bearing zones not directly adjacent to the well screen (Vroblesky and Petkewich 2000) or from mixing of chemically stratified zones (Vroblesky and Peters 2000). Because of these potential differences, it is essential that all parties involved in the use of passive samplers identify and agree on DQOs, data evaluation techniques, and data end use beforehand. If acceptance criteria are met, then a passive sampler may be approved for use in the well. In a well having high temporal concentration variability, a side-by-side comparison may be useful. In a well having relatively low temporal concentration variability, comparison of the passive sampler results to historical data may provide enough information to determine whether passive samplers are appropriate for the well. If the passive sampler is to be compared with a conventional pumping approach, then it is suggested that both the pump and the passive sampler be deployed at the same time, with the sampler attached near the pump inlet. Alternatively, the passive samplers can be deployed independently of the pumps and recovered immediately prior to placing the pump down the well. Both these approaches will reduce potential concentration differences between the two methods that may result from well disturbance during equipment removal and deployment at the time of sampling. It should be noted that there are differences between active and passive sampling approaches and a one-to-one correlation may not occur. Disagreement in the data does not necessarily invalidate either sampling method. Examples of comparison studies performed with each of the five passive samplers are included in the specific chapters later in this document.
1.5 State Survey
A survey sent to the ITRC state Points of Contact (POCs, see Appendix B) confirmed that there are few regulatory barriers (statutes, regulations, or guidance) that prohibit use of passive sampler technologies. Of the 16 states responding to the survey, 25% seem to have, or interpret the state as having, a prohibition to use of passive sampling technologies since it appears they require three-purge or low flow. All states appear receptive but lean towards a demonstration to verify their reliability. New Jersey is the only responding state that has published guidance on using a specific passive sampling technology for sampling groundwater. The New Jersey Department of Environmental Protection (NJDEP) published a revised field sampling procedures manual in 2005 to modify sampling techniques and add procedures for “new” sampling technologies. One of the manual additions was the procedure to use PDBs for the collection of groundwater and surface water within the state. The manual specifically states that NJDEP will approve the use of PDBs on a well-by-well basis. The purpose of the guidance and the intended application of PDBs is for long-term monitoring of volatile organic compounds (VOCs) in groundwater at well-characterized sites. NJDEP also provided the following response on using other passive sampling technologies:
NJDEP does not have guidance that prohibits the use of other passive sampling technologies to collect groundwater. To consider using a new technology, we require a sampling plan and historical sampling data to compare the new sampling approach. If
ITRC – Protocol for Use of Five Passive Samplers February 2007 to Sample for a Variety of Contaminants in Groundwater
8
sampling data did not match up, we would request additional work for the proposed sampling technology to be considered.
The survey also identified the following state-specific barriers for utilizing passive samplers: • Georgia does not have specific prohibitions; however, lacking formal guidance on the proper
methodology for using passive samplers, the state defers to methodologies that do have guidance.
• Iowa’s Tier 1 Guidance, Site Assessment of Leaking Underground Storage Tanks and Using Risk-Based Corrective Action requires purging (see p. 23, “Ground Water Monitoring,” www.iowadnr.com/land/ust/technicalresources/lustsiteassessment/documents/tier1guide.pdf)
• Michigan Department of Environmental Quality’s “Collection of Samples for Comparison to Generic Criteria,” Sampling and Analysis Attachment 5 (October 22, 2004, (http://www.deq.state.mi.us/documents/deq-rrd-OpMemo_2_Attachment5.pdf) recommends low-flow sampling. Alternative sampling methods can be used upon departmental approval.
• There appears to be some concern that passive samplers cannot collect quantitative data and, therefore, would not be useful for compliance and confirmation monitoring where a value must be compared to a practical quantitation limit or other standard value.
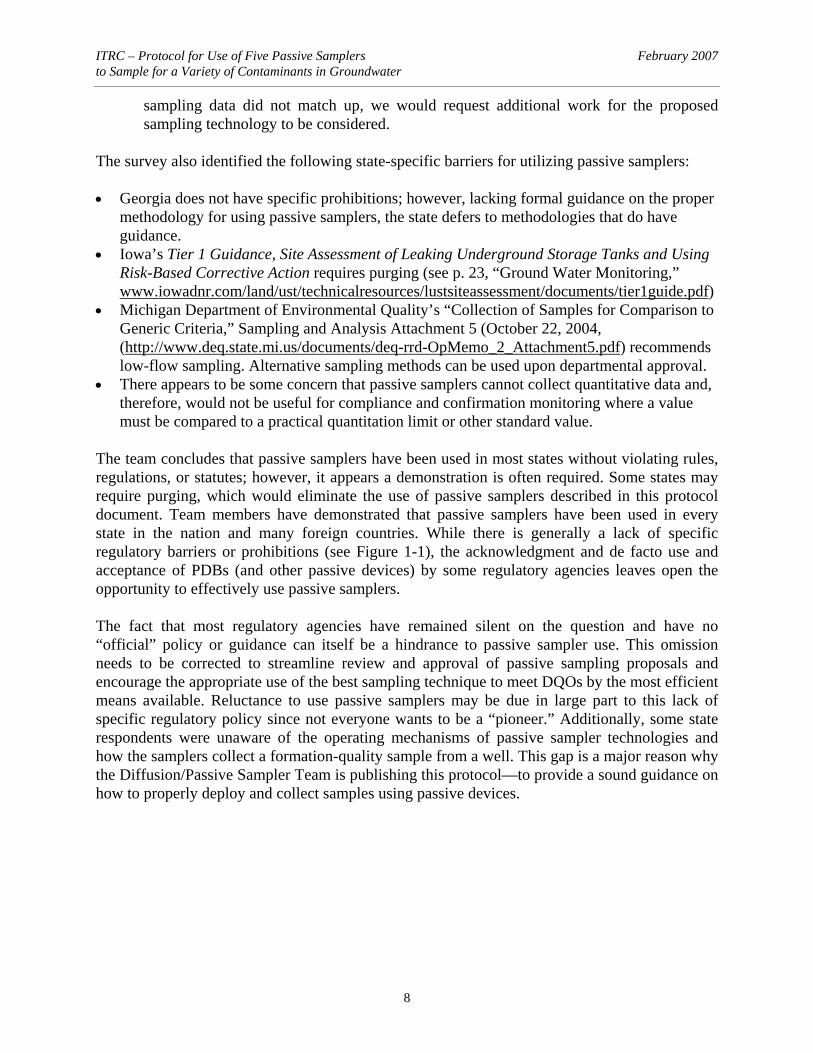
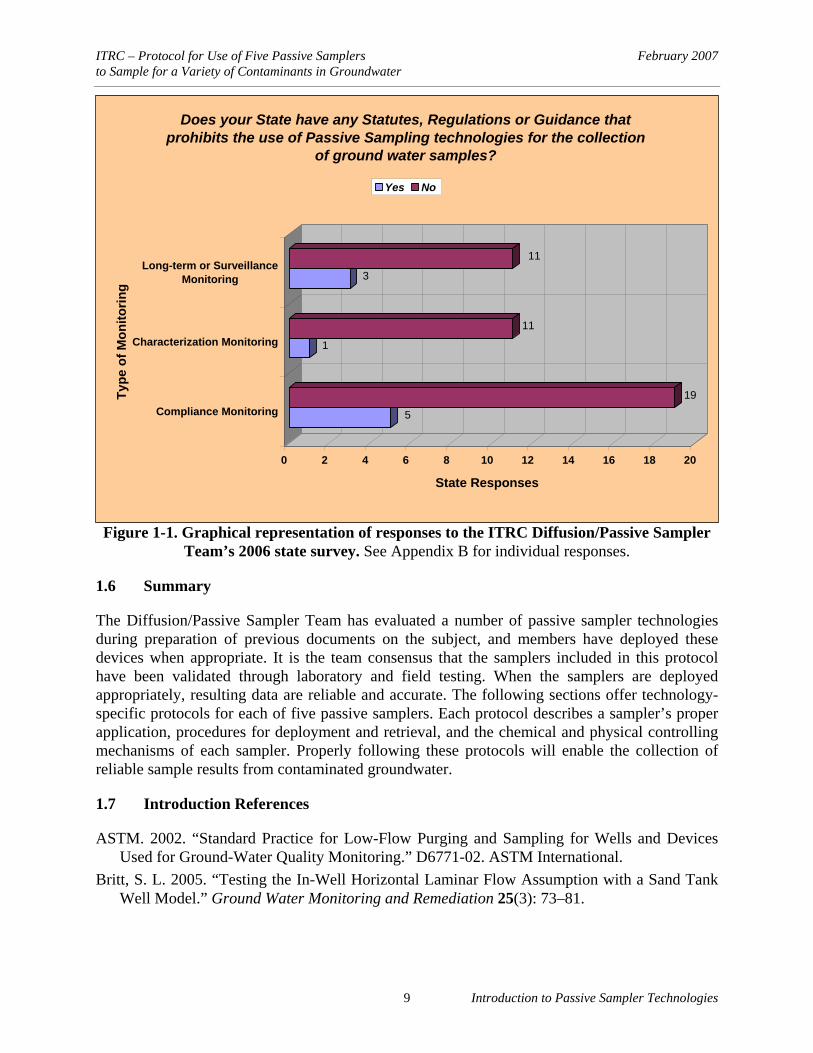
The team concludes that passive samplers have been used in most states without violating rules, regulations, or statutes; however, it appears a demonstration is often required. Some states may require purging, which would eliminate the use of passive samplers described in this protocol document. Team members have demonstrated that passive samplers have been used in every state in the nation and many foreign countries. While there is generally a lack of specific regulatory barriers or prohibitions (see Figure 1-1), the acknowledgment and de facto use and acceptance of PDBs (and other passive devices) by some regulatory agencies leaves open the opportunity to effectively use passive samplers. The fact that most regulatory agencies have remained silent on the question and have no “official” policy or guidance can itself be a hindrance to passive sampler use. This omission needs to be corrected to streamline review and approval of passive sampling proposals and encourage the appropriate use of the best sampling technique to meet DQOs by the most efficient means available. Reluctance to use passive samplers may be due in large part to this lack of specific regulatory policy since not everyone wants to be a “pioneer.” Additionally, some state respondents were unaware of the operating mechanisms of passive sampler technologies and how the samplers collect a formation-quality sample from a well. This gap is a major reason why the Diffusion/Passive Sampler Team is publishing this protocol—to provide a sound guidance on how to properly deploy and collect samples using passive devices.
ITRC – Protocol for Use of Five Passive Samplers February 2007 to Sample for a Variety of Contaminants in Groundwater
9 Introduction to Passive Sampler Technologies
Figure 1-1. Graphical representation of responses to the ITRC Diffusion/Passive Sampler Team’s 2006 state survey. See Appendix B for individual responses.
1.6 Summary
The Diffusion/Passive Sampler Team has evaluated a number of passive sampler technologies during preparation of previous documents on the subject, and members have deployed these devices when appropriate. It is the team consensus that the samplers included in this protocol have been validated through laboratory and field testing. When the samplers are deployed appropriately, resulting data are reliable and accurate. The following sections offer technology-specific protocols for each of five passive samplers. Each protocol describes a sampler’s proper application, procedures for deployment and retrieval, and the chemical and physical controlling mechanisms of each sampler. Properly following these protocols will enable the collection of reliable sample results from contaminated groundwater.
1.7 Introduction References
ASTM. 2002. “Standard Practice for Low-Flow Purging and Sampling for Wells and Devices Used for Ground-Water Quality Monitoring.” D6771-02. ASTM International.
Britt, S. L. 2005. “Testing the In-Well Horizontal Laminar Flow Assumption with a Sand Tank Well Model.” Ground Water Monitoring and Remediation 25(3): 73–81.
5
19
1
11
3
11
0 2 4 6 8 10 12 14 16 18 20
State Responses
Compliance Monitoring
Characterization Monitoring
Long-term or SurveillanceMonitoring
Type
of M
onito
ring
Does your State have any Statutes, Regulations or Guidance that prohibits the use of Passive Sampling technologies for the collection
of ground water samples?
Yes No

ITRC – Protocol for Use of Five Passive Samplers February 2007 to Sample for a Variety of Contaminants in Groundwater
10
Drost, W., D. Klotz, A. Koch, H. Moser, F. Neurnaier, and W. Rauert. 1968. “Point Dilution Methods of Investigating Ground Water Flow by Means of Radioisotopes.” Water Resources Research 4(1): 125–46.
Grisak, G. E., W. F. Merritt, and D. W. Williams. 1977. “A Fluoride Borehole Dilution Apparatus or Ground-Water Velocity Measurements.” Canadian Geotechnical Journal 14(4): 554–61.
Halevy, E., H. Moser, O. Zellhofer, and A. Zuber. 1967. “Borehole Dilution Techniques: A Critical Review.” In Isotopes in Hydrology, 1966 Symposium of the International Atomic Energy Agency, Vienna, Austria, pp. 531–64.
ITRC. 2004. Technical and Regulatory Guidance for Using Polyethylene Diffusion Bag Samplers to Monitor for Volatile Organic Compounds in Groundwater. DSP-3. Washington, D.C.: Interstate Technology & Regulatory Council, Diffusion/Passive Sampler Team. www.itrcweb.org.
ITRC. 2006. Technology Overview of Passive Sampler Technologies. DSP-4. Washington, D.C.: Interstate Technology & Regulatory Council, Diffusion/Passive Sampler Team. www.itrcweb.org.
Martin-Hayden, J. M., and S. L. Britt. 2006. “Revealing the Black Box of Groundwater Sampling: Effects of Well-Bore Flow and Mixing.” In Proceedings, 2006 North American Environmental Field Conference, January 10–12, Tampa, Fla.
Palmer, C. D. 1993. “Borehole Dilution Tests in the Vicinity of an extraction Well.” Journal of Hydrology 146: 245–66.
Parsons. 2005. Results Report for the Demonstration of No-Purge Groundwater Sampling Devices at Former McClellan Air Force Base, California. Prepared for the U.S. Army Corps of Engineers, Air Force Center for Environmental Excellence, and Air Force Real Property Agency.
Powell, R. M., and R. W. Puls. 1993. “Passive Sampling of Ground-Water Monitoring Wells Without Purging: Multilevel Well Chemistry and Tracer Disappearance.” Journal of Contaminant Hydrology 12: 51–77.
Robin, M. L. J., and R. W. Gillham. 1987. “Field Evaluation of Well Purging Procedures.” Ground Water Monitoring Review 7(4): 85–93.
Vroblesky, D. A. 2001. User’s Guide for Polyethylene-Based Passive Diffusion Bag Samplers to Obtain Volatile Organic Compounds Concentrations in Wells, Part 1—Deployment, Recovery, Data Interpretation, and Quality Control and Assurance and Part 2— Field Tests. U.S. Geological Survey Water Resources Investigation Reports 01-4060 and 01-4061. Available as DSP-1, Interstate Technology & Regulatory Council, Diffusion/Passive Sampler Team, www.itrcweb.org.
Vroblesky, D. A., C. C. Casey, and M. A. Lowery. 2006. Influence of In-Well Convection on Well Sampling. U.S. Geological Survey Scientific Investigations Report 2006–5247.
Vroblesky, D. A., J. Manish, J. Morrell, and J. E. Peterson. 2003. Evaluation of Passive Diffusion Bag Samplers, Dialysis Samplers, and Nylon-Screen Samplers in Selected Wells at Andersen Air Force Base, Guam, March-April 2002. U.S. Geological Survey Water-Resources Investigations Report 03-4157.

ITRC – Protocol for Use of Five Passive Samplers February 2007 to Sample for a Variety of Contaminants in Groundwater
11 Introduction to Passive Sampler Technologies
Vroblesky, D. A., and B. C. Peters. 2000. Diffusion Sampler Testing at Naval Air Station North Island, San Diego County, California, November 1999 to January 2000. U.S. Geological Survey Water-Resources Investigations Report 00-4812.
Vroblesky, D. A., and M. D. Petkewich. 2000. Field Testing of Passive Diffusion Bag Samplers for Volatile Organic Compound Concentrations in Groundwater, Naval Industrial Reserve Ordnance Plant, Fridley, Minnesota, November 1999 and May 2000. U.S. Geological Survey Water-Resources Investigations Report 00-4246.
Vroblesky, D. A., M. D. Petkewich, and T. R. Campbell. 2002. Field Tests of Diffusion Samplers or Inorganic Constituents in Wells and at a Ground-Water Discharge Zone. U.S. Geological Survey Water-Resources Investigations Report 02-4031.
Vroblesky, D. A., and T. Pravecek. 2002. Evaluation of Passive Diffusion Bag and Dialysis Samplers in Selected Wells at Hickam Air Force Base, Hawaii, July 2001. U.S. Geological Survey Water-Resources Investigations Report 02-4159.

ITRC – Protocol for Use of Five Passive Samplers February 2007 to Sample for a Variety of Contaminants in Groundwater
12
2. GORE MODULE
The GORE Module (also known as the GORE-SORBER™ Module, Figure 2-1) is a patented passive sampling device that can be used to collect and report VOCs and semivolatile organic compounds (SVOCs) in air, unsaturated and saturated soils, and water. The GORE Module is a sorbent-based diffusion sampler. A waterproof, vapor-permeable GORE-TEX™ membrane serves as the interface between the aqueous setting (e.g., groundwater) and the adsorbent housed within the membrane tube. Compounds dissolved in water partition to vapor (Henry’s law) through the membrane and accumulate on the adsorbent. A wide variety of compounds, including water solubles, VOCs, and SVOCs, can be detected and reported. The sampling rate, time of exposure, and mass desorbed are input to a model to determine concentrations (discussed further in Section 2.4.4). The sampling rate is calibrated to the well based on water temperature and pressure. For groundwater sampling and monitoring applications, one or more modules are suspended in a monitoring well on a length of string at the desired sampling depth(s), dependent on site DQOs. The narrow diameter of the module facilitates deployment in piezometers and wells ½ inch in diameter or larger. The U.S. Environmental Protection Agency (EPA) Environmental Technology Verification (ETV) program evaluated the GORE Module at a test site with TCE in groundwater. Figure 2-2
illustrates the correlation between the low-flow groundwater sampling results and the GORE Module results. Figure 2-3 illustrates the spatial correlation between low-flow groundwater sampling and the GORE Module results for 1,1,2,2-tetrachloroethane at a military site in the mid-Atlantic United States. Costs associated with using GORE Modules for groundwater sampling at this site resulted in a 70% cost saving compared to low-flow sampling (Einfeld and Koglin 2000).
Figure 2-1. GORE Module.
TRICHLOROETHENE
y = 0.0981xR2 = 0.99
0
50
100
150
200
0 500 1000 1500 2000
TCE (ug/l)
TCE
(ave
, ug) MW 12-01
MW 06-09
MW 12-09
MW 06-04
MW 12-06
Figure 2-2. Correlation between GORE Module and low-flow groundwater data for TCE (ETV study).

ITRC – Protocol for Use of Five Passive Samplers February 2007 to Sample for a Variety of Contaminants in Groundwater
13 GORE Module
2.1 Introduction to the GORE Module
2.1.1 Use and Application
The GORE Module can be placed directly in groundwater and surface water, saturated soils and sediments, or other aqueous environments. The device is used for site assessment, conceptual site model development, groundwater monitoring, vapor intrusion investigations, sediment sampling, remediation optimization, and monitoring. It has also been used in site investigations for more than 13 years to sample indoor, outdoor, and crawlspace air; subslab vapor; and soil gas.
2.1.2 Sampler Description
The GORE Module is constructed of GORE-TEX membrane, a microporous, chemically inert, polymer membrane tube, which is waterproof but vapor permeable. The module is approximately 8 inches long and ¼ inch in diameter. The upper end of the module is fashioned into a loop secured with a unique serial number; the lower end contains engineered adsorbents, selected for the target compounds, in duplicate. The adsorbents are hydrophobic (resist water vapor uptake) while having an affinity for a broad range of organic compounds (VOCs, SVOCs, polycyclic aromatic hydrocarbons [PAHs]). Each module contains enough adsorbent packets to perform replicate analyses. The modules are shipped inside individual sample vials in boxed containers to and from the site. Each vial lid has the same unique serial number (bar code) as the module. No ice or other special handling needs are required for shipping.
Figure 2-3. Comparison of GORE Module data (left) and low-flow groundwater sampling data (right) for 1,1,2,2-tetrachloroethane (mid-Atlantic U.S. military site).

ITRC – Protocol for Use of Five Passive Samplers February 2007 to Sample for a Variety of Contaminants in Groundwater
14
2.1.3 Applicable Analytes
The adsorbents are analyzed by modified EPA methods 8260/8270 (gas chromatography, mass selective detection) following thermal desorption. Target analytes include but are not limited to VOCs and include water-soluble compounds (e.g., tert-butyl alcohol [TBA] and 1,4-dioxane), SVOCs, and PAHs (Table 2-1). Benchtop and field testing has demonstrated the detection sensitivity of these classes of compounds down to sub–parts per billion (ppb) levels and greater range in groundwater and the headspace vapor of wells. Table 2-1. Target analytes detected in bench studies and field sampling by the GORE Module
Volatiles Semivolatiles Explosives 1,3,5-trimethylbenzene 1,2,4-trimethylbenzene 1,2-dichlorobenzene 1,3-dichlorobenzene 1,4-dichlorobenzene undecane tridecane pentadecane naphthalene 2-methylnaphthalene
nitrobenzene 2-nitrotoluene 3-nitrotoluene 4-nitrotoluene 1,3-dinitrobenzene 2,4-dinitrotoluene 2,6-dinitrotoluene 1,3,5-trinitrobenzene 2,4,6-trinitrotoluene
Chemical agents/breakdown products
methyl t-butyl ether benzene toluene ethylbenzene o-xylene m,p-xylene octane 1,1-dichloroethane 1,2-dichloroethane 1,1,1-trichloroethane 1,1,2-trichloroethane 1,1,1,2-
tetrachloroethane
1,1,2,2-tetrachloroethane
1,1-dichloroethene trans-1,2-
dichloroethene cis-1,2-dichloroethene trichloroethene tetrachloroethene chloroform carbon tetrachloride chlorobenzene 1,4-dioxane freons fuel oxygenates
1,4-dithiane 1,4-oxathiane 2-chloroacetophenone
2.1.4 Vendor Availability
GORE Modules are commercially available from W.L. Gore & Associates, Inc. and are covered by U.S. and foreign patents. Currently, there are no import/export restrictions for international deployments.
W.L. Gore & Associates, Inc. 100 Chesapeake Boulevard Elkton, MD 21922 Phone: 410-392-7600 Fax: 410-506-4780 E-mail: [email protected] Web site: www.gore.com/surveys
2.2 Sampler Advantages
The GORE Module • does not collect a water sample and therefore does not require sample transfer; • is single use and therefore requires no decontamination;
ITRC – Protocol for Use of Five Passive Samplers February 2007 to Sample for a Variety of Contaminants in Groundwater
15 GORE Module
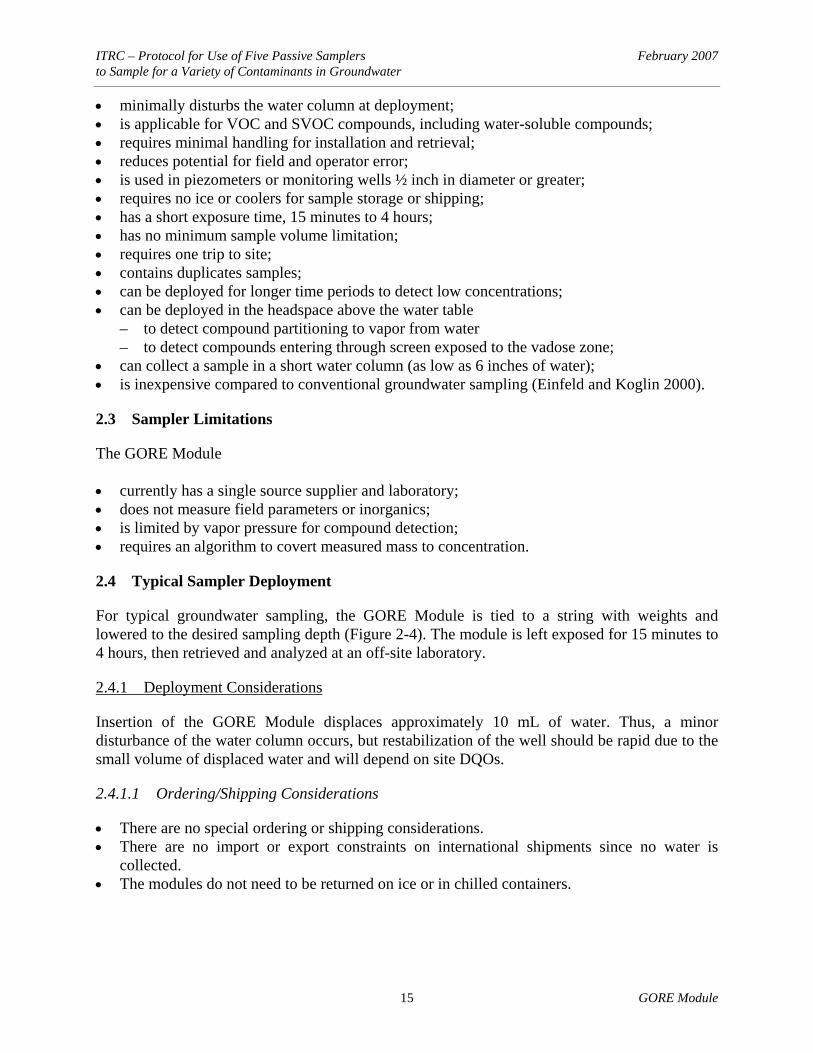
• minimally disturbs the water column at deployment; • is applicable for VOC and SVOC compounds, including water-soluble compounds; • requires minimal handling for installation and retrieval; • reduces potential for field and operator error; • is used in piezometers or monitoring wells ½ inch in diameter or greater; • requires no ice or coolers for sample storage or shipping; • has a short exposure time, 15 minutes to 4 hours; • has no minimum sample volume limitation; • requires one trip to site; • contains duplicates samples; • can be deployed for longer time periods to detect low concentrations; • can be deployed in the headspace above the water table
– to detect compound partitioning to vapor from water – to detect compounds entering through screen exposed to the vadose zone;
• can collect a sample in a short water column (as low as 6 inches of water); • is inexpensive compared to conventional groundwater sampling (Einfeld and Koglin 2000).
2.3 Sampler Limitations
The GORE Module • currently has a single source supplier and laboratory; • does not measure field parameters or inorganics; • is limited by vapor pressure for compound detection; • requires an algorithm to covert measured mass to concentration.
2.4 Typical Sampler Deployment
For typical groundwater sampling, the GORE Module is tied to a string with weights and lowered to the desired sampling depth (Figure 2-4). The module is left exposed for 15 minutes to 4 hours, then retrieved and analyzed at an off-site laboratory.
2.4.1 Deployment Considerations
Insertion of the GORE Module displaces approximately 10 mL of water. Thus, a minor disturbance of the water column occurs, but restabilization of the well should be rapid due to the small volume of displaced water and will depend on site DQOs.
2.4.1.1 Ordering/Shipping Considerations
• There are no special ordering or shipping considerations. • There are no import or export constraints on international shipments since no water is
collected. • The modules do not need to be returned on ice or in chilled containers.

ITRC – Protocol for Use of Five Passive Samplers February 2007 to Sample for a Variety of Contaminants in Groundwater
16
2.4.1.2 Special Handling
• Accurate groundwater temperature data are required. Insert temperature probe to the sample depth after retrieval of the module and record temperature on chain of custody.
• Accurate sampling depth and depth to water table data are required.
• Modules are to be kept away from potential sources of contamination and to remain sealed in their glass vials until deployment.
• Upon retrieval, the outside of the module must be wiped dry with clean paper towel, removing all visible liquid water, before being placed in the vial.
• The adsorbent begins to work as soon as the module is removed from the vial; thus, the module should be installed into the water as quickly as possible and returned to its vial upon retrieval as quickly as possible after wiping dry.
2.4.2 Deployment Steps
2.4.2.1 Well Measurements
• Depth to the water table relative to ground surface, depth of the well (well bottom), and screen length and location within the well should be known and recorded in the Installation and Retrieval Log.
• The water temperature should be recorded at the sample depth(s). Both the water depth and the temperature are used in the concentration calculations.
2.4.2.2 Assembling Device
• Wear clean disposable nitrile or latex gloves. • Measure the length of string required to lower the module to the desired depth, plus some
extra for tying off the assembly to the wellhead and to attach weights. Tie a secure loop in the string at the desired sampling depth.
• Allow enough string to account for the elevation of the module, which tends to float up, with the adsorbent above the weights.
• Secure the string to the wellhead or similar surface anchor. • Remove the module and attach to the string.
Figure 2-4. GORE Module deployment.

ITRC – Protocol for Use of Five Passive Samplers February 2007 to Sample for a Variety of Contaminants in Groundwater
17 GORE Module
2.4.2.3 Securing Device—Secure the string to the wellhead or similar anchor before lowering the module into the well. 2.4.2.4 Deployment
• Immediately lower the module and weights into the well once the assembly is completed and secured (Figure 2-5).
• Record the installation date and time and sample depth on the Installation and Retrieval Log by module serial number.
• Vertical profiling with sample intervals of as little as 6 inches can be achieved with the GORE Module: – Tie modules at specified locations along the deployment string. – Record the individual sampling depths with the associated module serial number in the
Installation and Retrieval Log, along with the deployment date and time.
2.4.3 Sample Recovery
2.4.3.1 Equilibrium Period
• Exposure period depends on the known or suspected concentration; 15 minutes to 4 hours has been adequate to detect a wide range of organic compounds and compute a concentration.
• Variations in water temperature should be recorded in the field as they have an influence on the calculated concentration.
• High compound concentration may saturate the absorbent during a long exposure period, and the actual concentration may be underreported.
• Long-term exposure periods will allow for detection of compounds at very low concentrations.
2.4.3.2 Sample Recovery Steps
• Clean paper towels and clean disposable latex or nitrile gloves should be used for retrieval to minimize cross-contamination.
Figure 2-5. GORE Module deployment. L to R: Module and weights secured to string, lowering module into well, and capping well after installation. Note: String is secured to
wellhead before lowering module into well.
ITRC – Protocol for Use of Five Passive Samplers February 2007 to Sample for a Variety of Contaminants in Groundwater
18
• Upon retrieval of the GORE Module, dry/remove any visible liquid water from the exterior of the module and serial number tag with clean paper towel.
• Verify the module serial number and promptly return the module to its matching vial. • Record the retrieval date, time, and field notes about the condition of the module (e.g.,
stained, strong odor) in the Installation and Retrieval Log or chain of custody. • Utilizing a temperature probe, record the water temperature at the depth the module was
deployed.
2.4.3.3 Disposal or Decontamination Procedures for Device
• No requirements for special decontamination procedures. • String and weights are removed and discarded along with the paper towel and safety gloves. • No generation of purge water or hazardous waste.
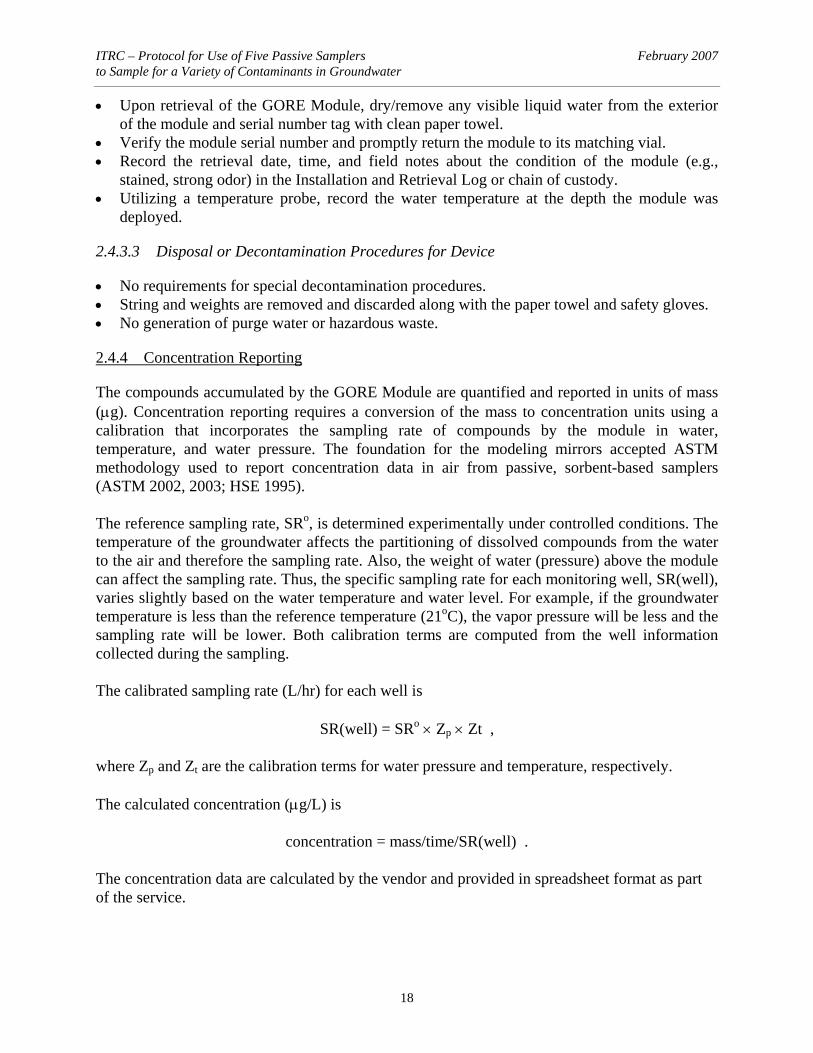
2.4.4 Concentration Reporting
The compounds accumulated by the GORE Module are quantified and reported in units of mass (μg). Concentration reporting requires a conversion of the mass to concentration units using a calibration that incorporates the sampling rate of compounds by the module in water, temperature, and water pressure. The foundation for the modeling mirrors accepted ASTM methodology used to report concentration data in air from passive, sorbent-based samplers (ASTM 2002, 2003; HSE 1995). The reference sampling rate, SRo, is determined experimentally under controlled conditions. The temperature of the groundwater affects the partitioning of dissolved compounds from the water to the air and therefore the sampling rate. Also, the weight of water (pressure) above the module can affect the sampling rate. Thus, the specific sampling rate for each monitoring well, SR(well), varies slightly based on the water temperature and water level. For example, if the groundwater temperature is less than the reference temperature (21oC), the vapor pressure will be less and the sampling rate will be lower. Both calibration terms are computed from the well information collected during the sampling. The calibrated sampling rate (L/hr) for each well is
SR(well) = SRo × Zp × Zt , where Zp and Zt are the calibration terms for water pressure and temperature, respectively. The calculated concentration (μg/L) is
concentration = mass/time/SR(well) . The concentration data are calculated by the vendor and provided in spreadsheet format as part of the service.

ITRC – Protocol for Use of Five Passive Samplers February 2007 to Sample for a Variety of Contaminants in Groundwater
19 GORE Module
2.5 Determining the Applicability of Sampler and Interpretation of Data
2.5.1 Comparison Studies
Figures 2-3 and 2-6 illustrate data reported from GORE Modules correlated to conventional groundwater data collected from monitoring wells at several sites (gas station and military sites) for petroleum and chlorinated compounds. The data are from earlier studies (mass only), which includes the EPA ETV study1 (Einfeld and Koglin 2000).
2.5.2 Variability within Comparison Studies
There was little observed variability with the data generated from the monitoring wells sampled in the EPA ETV study (Einfeld and Koglin, 2000).
1In the period since the EPA ETV study occurred, deployment time has been shortened to accommodate calculating concentrations from mass.
BTEX
y = 0.0482xR2 = 0.9713
n = 45
0200400600800
100012001400160018002000
0 5000 10000 15000 20000 25000 30000 35000 40000
Groundwater Data (ug/L)
GO
RE
Mod
ule
Dat
a (u
g)
Naphthalene
y = 0.0439xR2 = 0.9028
n = 9
0
2
4
6
8
10
12
0 50 100 150 200 250
Groundwater Data (ug/L)
GO
RE
Mod
ule
Dat
a (u
g)
Carbon Tetrachloride
y = 0.1587xR2 = 0.9687
n = 48
0
50
100
150
200
250
0 500 1000 1500
Groundwater Data (ug/L)
GO
RE
Mod
ule
Dat
a (u
g)
Figure 2-6. GORE Module data in units of mass, compared to groundwater concentration data from conventional sampling.

ITRC – Protocol for Use of Five Passive Samplers February 2007 to Sample for a Variety of Contaminants in Groundwater
20
2.5.3 Sampler Specific Variability and Accurate Comparisons
Groundwater sampling was conducted using the GORE Modules along with conventional groundwater sampling techniques (e.g., disposable bailer method and low-flow sampling). In one case study, only the mass desorbed from the GORE Modules is discussed. For the remaining case studies, the mass was converted to a concentration value following a method under development by W.L. Gore & Associates, Inc. and described in Section 2.4.4. The sites were military bases in the mid-Atlantic United States, a dry-cleaner site in the southeastern United States, and a convenience store with gasoline-dispensing services in the northeastern United States.
2.5.3.1 Military Site, Mid-Atlantic United States (mass data only)
The site is a military installation in the mid-Atlantic United States where munitions testing has occurred for more than 30 years. The water table is approximately 30 feet below ground surface, and soils are unconsolidated alluvial deposits. Compound concentrations in the water are as high as 2000 μg/L. GORE Modules were deployed in the screened intervals in a series of wells at two different time periods, each followed by low-flow groundwater sampling. Figure 2-7 illustrates the spatial correlation of both sampling events. A cost comparison revealed a 70% decrease in long-term sampling and monitoring costs by including a passive sampling component to the program (Einfeld and Koglin 2000). If the long-term monitoring (trend monitoring) is the emphasis of the routine groundwater sampling, the absorbent mass alone can be used. A strong spatial correlation is evident in Figure 2-7 between the measured masses and concentrations. The trends in mass over time can be used to monitor the changes in groundwater concentrations. As an alternative to calculating the concentrations using the method described in Section 2.4.4, statistical modeling (i.e., linear regression between the initial mass and measured concentrations) can be used to estimate compound concentrations for future groundwater sampling. The mass desorbed is input to the regression equation, and the concentrations are calculated. If the module is deployed for extended periods of time, a statistical comparison may be more applicable than calculating concentrations.
2.5.3.2 Convenience Store with Fuel Dispensing, Northeastern United States
A small convenience store and gas station had groundwater impacted by fuel-related compounds. Groundwater sampling was conducted using GORE Modules and conventional purge and disposable bailer sampling in six wells under the direction of the state regulator. The modules were placed at multiple depths in monitoring wells; the comparison in Table 2-2 is for those modules most closely located to the bailer sample.
ITRC – Protocol for Use of Five Passive Samplers February 2007 to Sample for a Variety of Contaminants in Groundwater
21 GORE Module
Table 2-2. GORE Module data, calculated concentrations compared to disposable bailer data collected after purging from monitoring wells at a convenience store/gas station site Well No. Depth Benzene Toluene Ethylbenzene Xylenes MTBEa TAMEb TBA MW-2 4.2c 2 MW-2 (Gore) 5.7 13 4 2 MW-9 4.8c 50 1360 1250 MW-9 (Gore) 5.6 42 57 7 10 1350 710 3350 MW-10 3.8c 66 MW-10 (Gore) 5.7 100 13 20 MW-11 7.8c 84 MW-11 (Gore) 8.5 24 2 67 MW-13R 7.7c MW-13R (Gore) 14.0 21 2 13 MW-14 8.3c 3930 MW-14 (Gore) 10.0 100 10 1450 2310 amethyl tert-butyl ether. btertiary amyl methyl ether. cDepth to water. Sample depth in feet.
Figure 2-7. Spatial correlation between the GORE Module and the low-flow sampling data, 1,1,2,2-tetrachlorethane, July 1997 (top), December 1998 (bottom).

ITRC – Protocol for Use of Five Passive Samplers February 2007 to Sample for a Variety of Contaminants in Groundwater
22
2.5.3.3 Dry Cleaner Site, Southeastern United States Chlorinated solvents from a dry-cleaning establishment had impacted groundwater. Monitoring wells were sampled with GORE Modules, followed by slow purging and disposable bailer sampling. Modules were placed at multiple depths in the wells to profile the column. Concentrations calculated from modules placed in the middle of the well screen were compared to the bailer results collected near the top of the water column after purging (Figure 2-8).
2.5.3.4 Military Site, Mid-Atlantic United States
The site is an active military airfield in the mid-Atlantic United States. Chlorinated compounds and fuels have impacted the groundwater, though the nature and history of the releases are not well-documented. Monitoring wells were sampled by slow purge and low-flow methods following the GORE Module sampling event. Compound concentrations were calculated, and the data are presented in Table 2-3.
Figure 2-8. Comparison of the chlorinated compounds observed in monitoring wells at a dry cleaner. The concentrations on the x-axis were calculated and
compared to the measured concentrations (y-axis).
PCE, TCE, cis-1,2-DCE (ug/L)
y = 1.1611xR2 = 0.982
n = 12
0
5000
10000
15000
20000
25000
30000
35000
0 5000 10000 15000 20000 25000 30000 35000
Concentrations - Passive
Con
cent
ratio
ns -
Baile
r
c12DCETCEPCELinear
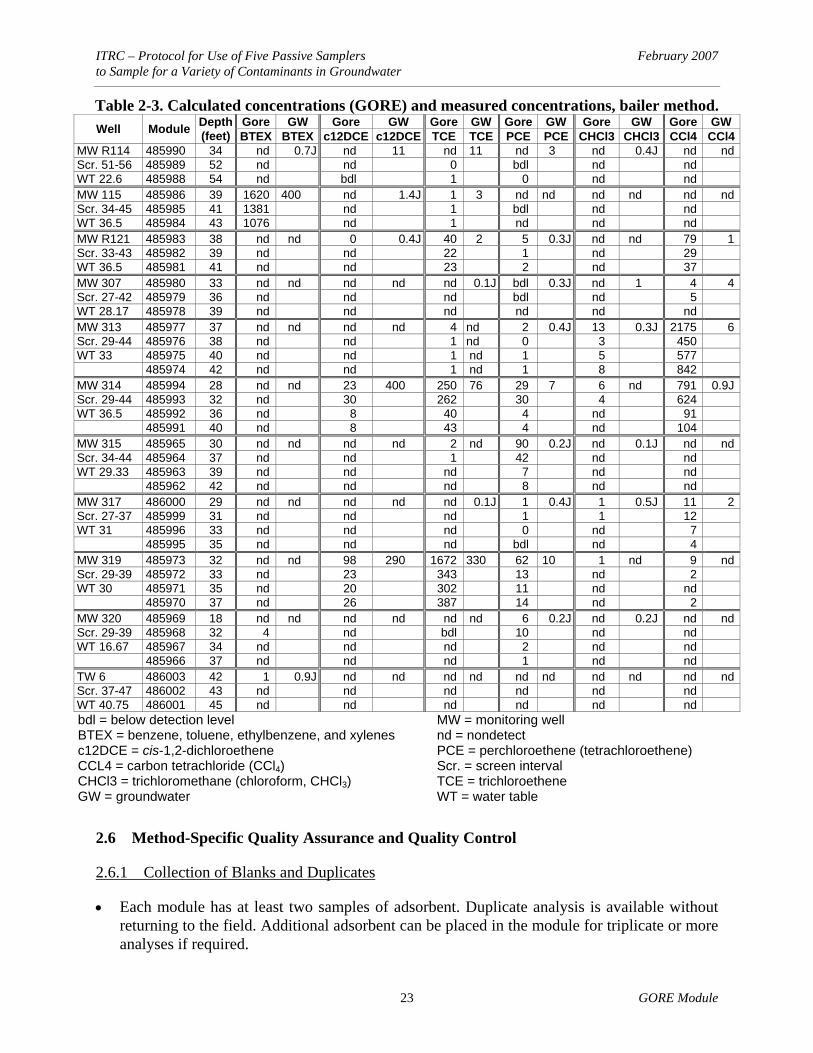
ITRC – Protocol for Use of Five Passive Samplers February 2007 to Sample for a Variety of Contaminants in Groundwater
23 GORE Module
Table 2-3. Calculated concentrations (GORE) and measured concentrations, bailer method. Gore GW Gore GW Gore GW Gore GW Gore GW Gore GW Well Module Depth
(feet) BTEX BTEX c12DCE c12DCE TCE TCE PCE PCE CHCl3 CHCl3 CCl4 CCl4MW R114 485990 34 nd 0.7J nd 11 nd 11 nd 3 nd 0.4J nd ndScr. 51-56 485989 52 nd nd 0 bdl nd nd WT 22.6 485988 54 nd bdl 1 0 nd nd MW 115 485986 39 1620 400 nd 1.4J 1 3 nd nd nd nd nd ndScr. 34-45 485985 41 1381 nd 1 bdl nd nd WT 36.5 485984 43 1076 nd 1 nd nd nd MW R121 485983 38 nd nd 0 0.4J 40 2 5 0.3J nd nd 79 1Scr. 33-43 485982 39 nd nd 22 1 nd 29 WT 36.5 485981 41 nd nd 23 2 nd 37 MW 307 485980 33 nd nd nd nd nd 0.1J bdl 0.3J nd 1 4 4Scr. 27-42 485979 36 nd nd nd bdl nd 5 WT 28.17 485978 39 nd nd nd nd nd nd MW 313 485977 37 nd nd nd nd 4 nd 2 0.4J 13 0.3J 2175 6Scr. 29-44 485976 38 nd nd 1 nd 0 3 450 WT 33 485975 40 nd nd 1 nd 1 5 577 485974 42 nd nd 1 nd 1 8 842 MW 314 485994 28 nd nd 23 400 250 76 29 7 6 nd 791 0.9JScr. 29-44 485993 32 nd 30 262 30 4 624 WT 36.5 485992 36 nd 8 40 4 nd 91 485991 40 nd 8 43 4 nd 104 MW 315 485965 30 nd nd nd nd 2 nd 90 0.2J nd 0.1J nd ndScr. 34-44 485964 37 nd nd 1 42 nd nd WT 29.33 485963 39 nd nd nd 7 nd nd 485962 42 nd nd nd 8 nd nd MW 317 486000 29 nd nd nd nd nd 0.1J 1 0.4J 1 0.5J 11 2Scr. 27-37 485999 31 nd nd nd 1 1 12 WT 31 485996 33 nd nd nd 0 nd 7 485995 35 nd nd nd bdl nd 4 MW 319 485973 32 nd nd 98 290 1672 330 62 10 1 nd 9 ndScr. 29-39 485972 33 nd 23 343 13 nd 2 WT 30 485971 35 nd 20 302 11 nd nd 485970 37 nd 26 387 14 nd 2 MW 320 485969 18 nd nd nd nd nd nd 6 0.2J nd 0.2J nd ndScr. 29-39 485968 32 4 nd bdl 10 nd nd WT 16.67 485967 34 nd nd nd 2 nd nd 485966 37 nd nd nd 1 nd nd TW 6 486003 42 1 0.9J nd nd nd nd nd nd nd nd nd ndScr. 37-47 486002 43 nd nd nd nd nd nd WT 40.75 486001 45 nd nd nd nd nd nd bdl = below detection level BTEX = benzene, toluene, ethylbenzene, and xylenes c12DCE = cis-1,2-dichloroethene CCL4 = carbon tetrachloride (CCl4) CHCl3 = trichloromethane (chloroform, CHCl3) GW = groundwater
MW = monitoring well nd = nondetect PCE = perchloroethene (tetrachloroethene) Scr. = screen interval TCE = trichloroethene WT = water table
2.6 Method-Specific Quality Assurance and Quality Control
2.6.1 Collection of Blanks and Duplicates
• Each module has at least two samples of adsorbent. Duplicate analysis is available without returning to the field. Additional adsorbent can be placed in the module for triplicate or more analyses if required.
ITRC – Protocol for Use of Five Passive Samplers February 2007 to Sample for a Variety of Contaminants in Groundwater
24
• Alternatively, multiple modules can be tied to the deployment string, lowered, retrieved, and treated as duplicates.
• An extra number of modules are shipped to the field to be used as trip blanks. The modules are identical to those being deployed. The field installer randomly selects which modules are to be treated as trip blanks and remain unopened.
• Additional modules can be requested as field blanks. The sample vials would be opened and the module removed and exposed to the site air for approximately the same amount of time it takes to tie on and lower the modules into the well
2.6.2 Samples to Consider to Ensure QA/QC Parameters
2.6.2.1 Quality Assurance Measures
All aspects of the module manufacturing, analysis, and data reporting follow Gore’s QA manual. As standard practice, all modules are individually numbered and tracked throughout the entire manufacturing, field deployment, and analytical process. Completed modules are tested to stringent cleanliness standards and stored in clean glass vials that are labeled with the module serial number. All modules are transported to and from the customer’s site in the sealed glass vials and boxes supplied by the vendor. An additional number of modules are included as trip blanks. Trip blanks travel unopened to and from the site and are analyzed as controls along with field-exposed modules. Full details of Gore’s QA measures are documented in the QA manual.
2.6.2.2 Analytical Method Quality Assurance
Gore’s standard analytical method is a modified EPA method 8260/8270. Before each run sequence, two instrument blanks, a mass spectrometer tune check compound—bromofluorobenzene (BFB)—and a method blank are analyzed. The BFB mass spectra must meet the criteria set forth in Contract Laboratory Program (CLP) Statement of Work (SOW) for Organic Analysis Multi-Media Multi-Concentration (SOW OLM010.0 and revisions) before samples can be analyzed. BFB tune check and method blank analysis are also performed after every 30 samples and/or trip blanks. Standards containing target compounds at five calibration levels are analyzed at the beginning of each run. Second-source reference standards are also analyzed throughout the analytical sequence. Positive identification of target compounds is determined by the presence of the target ion and at least two secondary ions, retention time versus reference standard, and the analyst’s judgment.
2.7 GORE Module References
ASTM. 2002. “Standard Practice for Evaluating the Performance of Diffusive Samplers.” D6246-02. ASTM International.
ASTM. 2003. “Standard Guide for Placement and Use of Diffusion Controlled Passive Monitors for Gaseous Pollutants in Indoor Air.” D6306-98 (reapproved 2003). ASTM International.
Brown, A., J. W. Hodny, G. Shaw, and D. J. Green. 2001. “Estimating Groundwater Contamination Using Passive Sampling.” Presented at the U.S. Army Corps of Engineers Environmental Development Workshop, Portland, Ore.

ITRC – Protocol for Use of Five Passive Samplers February 2007 to Sample for a Variety of Contaminants in Groundwater
25 GORE Module
Einfeld, W., and E. N. Koglin. 2000. GORE-SORBER® Water Quality Monitoring. EPA/600/R-00/091. EPA Environmental Technology Verification Report. www.epa.gov/etv/pdfs/vrvs/01_vr_gore.pdf
Hodny, J. W., and A. Brown. 2000. “Passive Collectors as a Groundwater Monitoring Tool.” Presented at the Small Drinking Water and Wastewater Systems Conference, Phoenix, Ariz.
Hodny, J. W., G. Shaw, and D. J. Green. 2001a. “Estimating Groundwater Contamination Using Passive Sampling.” Presented at the 13th Annual South Dakota Department of Environmental and Natural Resources Ground Water Quality Monitoring Conference, Aberdeen, S.D.
Hodny, J. W., G. Shaw, and D. J. Green. 2001b. “Passive Sampling and Groundwater Contamination.” Presented at the 3rd NSF International Symposium on Small Drinking Water and Wastewater Systems Conference, Washington, D.C.
HSE (U.K. Health & Safety Executive). 1995. Laboratory Method Using Diffusive Solid Sorbent Tubes, Thermal Desorption and Gas Chromatography. Methods for the Determination of Hazardous Substances (MDHS) 80. London.
Acknowledgement W.L. Gore & Associates, Inc. thanks Louise Parker for her thoughtful insight and support of the
GORE Module and its application to aqueous sampling.

ITRC – Protocol for Use of Five Passive Samplers February 2007 to Sample for a Variety of Contaminants in Groundwater
26
3. HYDRASLEEVE
HydraSleeve groundwater samplers are considered instantaneous grab-sampling devices designed to collect water samples from groundwater wells without purging or mixing fluid from other intervals. HydraSleeve samplers can be used to sample for most groundwater analytes (e.g., VOCs, SVOCs, and metals) as long as an adequate volume of sample is recovered for analysis. HydraSleeve samplers cause no well drawdown and minimal agitation of the water column. HydraSleeve samplers are made from a collapsible tube of polyethylene or other flexible material, sealed at the bottom end, and built with a self-sealing reed-valve at the top end. The HydraSleeve sampler is installed empty into the water column where hydrostatic pressure keeps the devise closed except during sample collection. One or more samplers can be suspended on a weighted line and positioned in a well at the desired screen sampling intervals or target horizons. Following sampler deployment, the samplers are left in place long enough for the well water, contaminant distribution, and flow dynamics to restabilize after the minor vertical mixing caused by the installation of the sampler. To obtain a water sample, the HydraSleeve is pulled upward on the suspension line through the zone of interest, which causes water to enter the one-way reed-valve and fill the sampler. HydraSleeve samplers are suitable for sampling wells for both short- and long-term groundwater monitoring. They can also be used in low-yield wells and in narrow, constricted, or damaged wells. The samplers can also be used to sample discrete intervals from surface water bodies and tanks. Samples collected with the HydraSleeve correlate well to other sampling methods, and it can even be used for special challenges such as in-well vertical profiling of multilayered contaminant concentrations.
3.1 Introduction to HydraSleeve
HydraSleeve groundwater samplers are instantaneous grab-sampling devices used to collect water samples from groundwater wells without purging or mixing fluid from other intervals. HydraSleeve samplers can be used to sample for most groundwater analytes (e.g., VOCs, SVOCs, and metals) as long as an adequate volume of sample is recovered for analysis. HydraSleeve samplers cause no well drawdown until the acquired sample is withdrawn from the well, cause minimal agitation of the water column during sample acquisition, and can be used to sample low-yielding wells.
3.1.1 Use and Application
In groundwater wells, HydraSleeve samplers rely on the ambient movement of groundwater from the aquifer or water-bearing zone through the well screen in the same way as passive diffusion samplers (for a detailed example demonstration of ambient flow-through, see Robin and Gillham 1987).

ITRC – Protocol for Use of Five Passive Samplers February 2007 to Sample for a Variety of Contaminants in Groundwater
27 HydraSleeve
3.1.2 Sampler Description
A HydraSleeve installation consists of three basic components: a reusable weight; the HydraSleeve sampler, which is a flexible, collapsible sample tube or sleeve (usually made of 4-mil polyethylene tubing) closed at the bottom with a self-sealing reed-valve at the top; and a suspension tether for lowering, locating, and retrieving the sampler. The weight is attached to the bottom of the sampler or tether line to carry the sampler below the water surface to the intended depth. The flexible tube is the sample chamber and the reed valve prevents water from entering or leaving the sampler except during sample acquisition. Manufacturers can modify the length and diameter of a sampler to meet specific sampling requirements. A photograph of a full HydraSleeve retrieved from a well is shown below (Photo 3-1). Table 3-1 shows the specifications for standard HydraSleeves.
Table 3-1. Typical HydraSleeve specifications 2 inch 4 inch General specification Fits 2-inch and
larger wells Fits 4-inch and larger wells
Sample sleeve lay-flat width, inches 2.5 4 Filled sample sleeve diameter, inches 1.5 2.6 Total volume for 30-inch HydraSleeve, mL 650 1250 Sampler tensile strength, pounds 25–35 Standard sample sleeve material Virgin 4-mil polyethylene Volume displaced, mL • 8-ounce stainless steel weight • 30-inch empty sleeve • Total, weight and empty sleeve
25
~70 ~95
25
~85 ~110
Volume displaced, optional 16-ounce top weight, mL 65 Sample collection single-pull distance to fill (at >1 fps) 1–1.5 times sampler length
3.1.3 Applicable Analytes
HydraSleeve samplers can sample most physical and chemical parameters as long as an adequate volume of sample is recovered for analysis or measurement. HydraSleeve samplers can be used to sample a wide spectrum of analytes including, but not limited to, VOCs, SVOCs, metals, major cations and anions, dissolved trace metals, dissolved sulfide, dissolved gases (methane/ ethene/carbon dioxide), total dissolved solids (TDS), dissolved organic carbon, dissolved silica, explosive compounds, and perchlorate.
Figure 3-1. Full HydraSleeve retrieved from a well.
ITRC – Protocol for Use of Five Passive Samplers February 2007 to Sample for a Variety of Contaminants in Groundwater
28
3.1.4 Vendor Availability
Both diameters of the 30-inch standard HydraSleeve are shipped flat and folded in individual 4- by 6-inch plastic bags and weigh about 0.5 ounce each. HydraSleeves are lightweight and inexpensive to ship. Standard HydraSleeves can be shipped from stock usually the same day. Custom sizes and lengths usually take at least one week for the vendor to prepare and ship. No hazardous materials need to be shipped with the HydraSleeve. At the publication of this document, HydraSleeve samplers are manufactured by GeoInsight, Inc. (www.hydrasleeve.com) under U.S. Patents 6,481,300 and 6,837,120. As of November 2006, they are commercially available through GeoInsight (www.geoinsightonline.com) and EON Products (www.eonpro.com). Because HydraSleeve samplers employ patented technology, users must purchase commercially produced samplers from a licensed manufacturer or approved distributor.
3.2 Sampler Advantages
HydraSleeve • reduces field time and therefore sampling costs by 50%–80%; • can be used to sample for most physical and chemical parameters; • is inexpensive; • is easy to deploy and recover; • is disposable, eliminating the need for decontamination; • can be used to sample low-yield wells; • collects a discrete grab sample; • does not rely on diffusion; • displaces a minimal amount of water; • can be used for sampling of surface water and tanks; • can be left in the well between sampling events.
3.3 Sampler Limitations
HydraSleeve • has limited sample volume, requiring consideration of laboratory sample volume
requirements; • is limited by a minimum well diameter; • should not be longer than the screened interval of the well; • without special accessories, requires 1–2 feet above bottom of well to sample a 2-inch well.
3.4 Typical Sampler Deployment
HydraSleeve samplers are deployed by attaching a suspension tether to the top and a weight to the bottom of an empty sampler and lowering the assembly into the well. Alternatively, the weight can be attached to the bottom of the suspension tether and the sampler(s) attached to the side of the tether. During installation and for indefinite periods prior to sample collection,

ITRC – Protocol for Use of Five Passive Samplers February 2007 to Sample for a Variety of Contaminants in Groundwater
29 HydraSleeve
hydrostatic pressure causes the empty sampler to retain its flat and empty profile. After lowering the sampler to the desired sample depth, the water column is allowed to stabilize until the water column reestablishes its natural concentration gradient after the minor vertical mixing caused by installation. The slim cross section minimizes the disturbance to the water column during placement, reducing the time required for restabilization. To initiate sample collection, the HydraSleeve is pulled upward through the sample zone (or a distance of 1–1.5 times the sampler length) at one foot per second or faster, similar to pulling on a sock. The reed-valve at the top opens as sleeve is pulled through a “core” of water, and the sleeve expands to contain the sample. Once the sample sleeve is full, the self-sealing reed-valve closes, preventing loss of the sample or the entry of extraneous fluid as the HydraSleeve is recovered. At the surface, the HydraSleeve is punctured with the pointed discharge straw and the sample transferred to suitable containers for transport to the laboratory. An empty HydraSleeve can be installed and left in the well until the next sampling events. To test for vertical stratification within a well, multiple HydraSleeve samplers can be suspended on the same suspension tether and deployed simultaneously.
3.4.1 Deployment Considerations
Deployment considerations common to all passive type samplers are presented in the introduction to this document. Deployment considerations specific to the HydraSleeve are presented below.
3.4.1.1 Sampler Size
A variety of HydraSleeve lengths and diameters can be used, and manufacturers are generally able to accommodate a variety of well diameters and sleeve lengths. Factors to consider include the volume of sample needed for analysis (see Appendix A), well diameter, and the length of screen section(s) to be sampled. A HydraSleeve length of 30 inches is commonly used (see Table 3-1), with a diameter that can accommodate 2- or 4-inch-diameter wells. HydraSleeves greater than 36 inches long become difficult to handle.
3.4.1.2 Sample Volume
Volume varies with diameter and length of HydraSleeve. Standard HydraSleeve samplers are sized to fit in 2-inch wells (1.5-inch outside diameter [OD] by 30 inches long) and 4-inch wells (2.6 inches OD by 30 inches long). The 1.5-inch-diameter sampler holds 650 mL; the 2.6-inch-diameter sampler holds 1250 mL. HydraSleeve samplers can be custom fabricated in various lengths and diameters for specific volume requirements. To date, HydraSleeve samplers have been made to fit wells 1-inch in diameter and larger and to obtain sample volumes ranging from 80 mL to more than 4 L. A standard HydraSleeve will collect adequate sample volume to run the typical analysis for VOCs, SVOCs, and metals, including all associated QA/QC and any reruns that may be required. If additional volume is required, multiple samplers may be deployed in series. Sampling for multiple analytical suites can increase the minimum sample volume required for analysis, QA/QC, and any reruns that may be required. Since sample volume is finite, laboratory
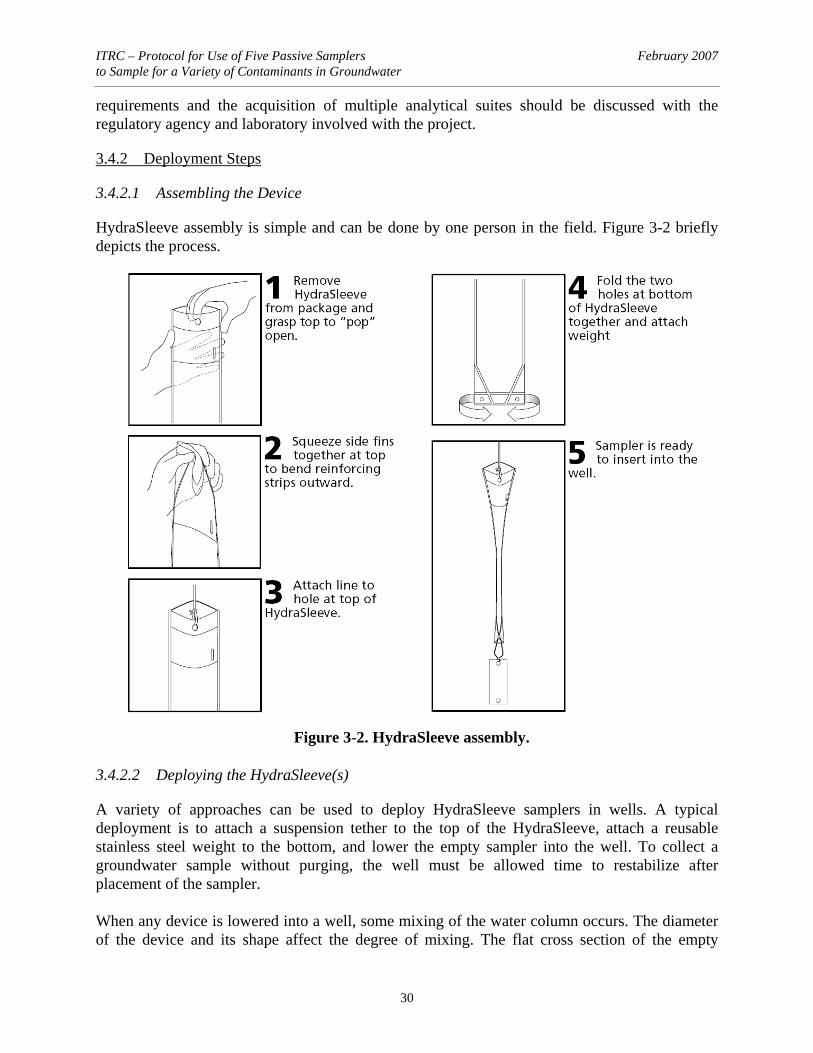
ITRC – Protocol for Use of Five Passive Samplers February 2007 to Sample for a Variety of Contaminants in Groundwater
30
requirements and the acquisition of multiple analytical suites should be discussed with the regulatory agency and laboratory involved with the project.
3.4.2 Deployment Steps
3.4.2.1 Assembling the Device
HydraSleeve assembly is simple and can be done by one person in the field. Figure 3-2 briefly depicts the process.
3.4.2.2 Deploying the HydraSleeve(s)
A variety of approaches can be used to deploy HydraSleeve samplers in wells. A typical deployment is to attach a suspension tether to the top of the HydraSleeve, attach a reusable stainless steel weight to the bottom, and lower the empty sampler into the well. To collect a groundwater sample without purging, the well must be allowed time to restabilize after placement of the sampler. When any device is lowered into a well, some mixing of the water column occurs. The diameter of the device and its shape affect the degree of mixing. The flat cross section of the empty
Figure 3-2. HydraSleeve assembly.

ITRC – Protocol for Use of Five Passive Samplers February 2007 to Sample for a Variety of Contaminants in Groundwater
31 HydraSleeve
HydraSleeve minimizes the disturbance to the water column as the sampler is lowered into position, reducing the time needed for the well to restabilize. There are three basic methods for holding a HydraSleeve in position as the well restabilizes are presented below. Single-Interval Deployment. Measure the correct amount of suspension tether needed to place the top of the HydraSleeve(s) at the bottom of the desired sampling interval so that the sampler collects a sample as it is pulled up through the intended sampling interval (Figure 3-3). The upper end of the suspension tether can be connected to the well cap to suspend the HydraSleeve at the correct depth until activated for sampling. For deep settings, it may be difficult to accurately measure long segments of suspension line in the field. Factory prepared, custom suspension line and attachment points are available. It is often easier to measure a few feet from the bottom of the well up to the sample point than it is to measure from the top of the well down. Sound the well to determine the exact depth. Lower the weighted HydraSleeve into the well and let it touch the bottom. Very slowly (less than ½ foot per second) raise the sampler until the check valve is at the depth where the sample is to be collected (Figure 3-4). Attach the suspension line to the top of the well to suspend it at this depth. Alternatively, the sampler can be left on the bottom until the well restabilizes. To position the HydraSleeve, slowly pull (less than ½ foot per second) to the desired sampling depth. Another approach is to determine the exact depth of the well and calculate the distance from the bottom of the well to the desired sampling depth. Attach an appropriate length anchor line between the weight and the bottom of the sampler (Figure 3-5) and lower the assembly until the weight rests on the bottom of the well, allowing the top of the sampler to float at the correct sampling depth.
Figure 3-4. Bottom-up deployment.
Figure 3-3. Top-down deployment.

ITRC – Protocol for Use of Five Passive Samplers February 2007 to Sample for a Variety of Contaminants in Groundwater
32
Multiple-Interval Deployment. There are two basic methods for placing multiple HydraSleeves in a well to collect samples from different levels simultaneously. To use three or more samplers simultaneously, all are attached to a suspension tether for support and to prevent the sampling string from pulling apart (Figure 3-5). The weight is attached to a single length of suspension line and allowed to rest on the bottom of the well. The top and bottom of each HydraSleeve are attached to the suspension line at the desired sample intervals. Cable ties or stainless steel clips (available from vendor) work well for attaching HydraSleeves to the line. Push one end of the clip between strands of the rope at the desired point before attaching the clip to the HydraSleeve. To place two HydraSleeves for vertical profiling, use one of the methods described above to locate the bottom sampler. Attach the bottom of the top
sampler to the top of the following HydraSleeve with a carefully measured length of suspension tether (Figure 3-7). Connect the weight to the bottom sampler. If multiple HydraSleeves are attached to a suspension line, more weight may be required than with a single sampler.
Figure 3-5. Bottom anchor deployment.
Figure 3-6. Multiple samplers attached to a single suspension line.
Figure 3-7. Multiple samplers attached end to end.
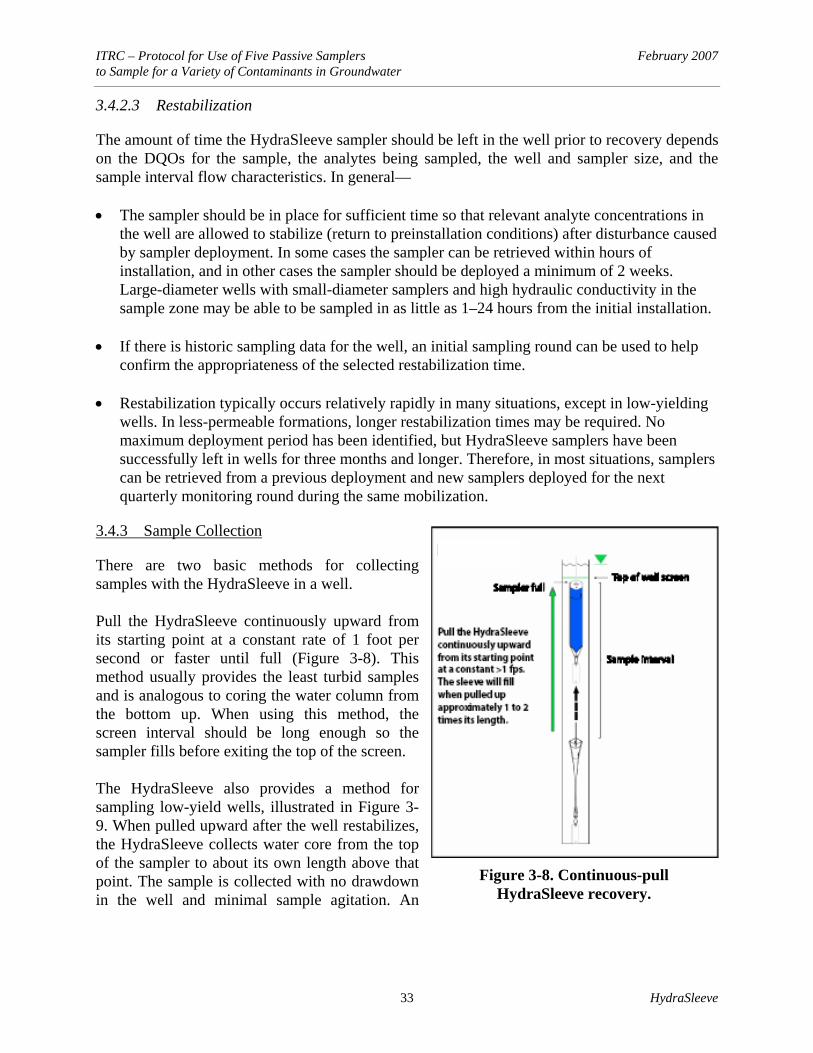
ITRC – Protocol for Use of Five Passive Samplers February 2007 to Sample for a Variety of Contaminants in Groundwater
33 HydraSleeve
3.4.2.3 Restabilization
The amount of time the HydraSleeve sampler should be left in the well prior to recovery depends on the DQOs for the sample, the analytes being sampled, the well and sampler size, and the sample interval flow characteristics. In general— • The sampler should be in place for sufficient time so that relevant analyte concentrations in
the well are allowed to stabilize (return to preinstallation conditions) after disturbance caused by sampler deployment. In some cases the sampler can be retrieved within hours of installation, and in other cases the sampler should be deployed a minimum of 2 weeks. Large-diameter wells with small-diameter samplers and high hydraulic conductivity in the sample zone may be able to be sampled in as little as 1–24 hours from the initial installation.
• If there is historic sampling data for the well, an initial sampling round can be used to help confirm the appropriateness of the selected restabilization time.
• Restabilization typically occurs relatively rapidly in many situations, except in low-yielding wells. In less-permeable formations, longer restabilization times may be required. No maximum deployment period has been identified, but HydraSleeve samplers have been successfully left in wells for three months and longer. Therefore, in most situations, samplers can be retrieved from a previous deployment and new samplers deployed for the next quarterly monitoring round during the same mobilization.
3.4.3 Sample Collection
There are two basic methods for collecting samples with the HydraSleeve in a well. Pull the HydraSleeve continuously upward from its starting point at a constant rate of 1 foot per second or faster until full (Figure 3-8). This method usually provides the least turbid samples and is analogous to coring the water column from the bottom up. When using this method, the screen interval should be long enough so the sampler fills before exiting the top of the screen. The HydraSleeve also provides a method for sampling low-yield wells, illustrated in Figure 3-9. When pulled upward after the well restabilizes, the HydraSleeve collects water core from the top of the sampler to about its own length above that point. The sample is collected with no drawdown in the well and minimal sample agitation. An
Figure 3-8. Continuous-pull HydraSleeve recovery.

ITRC – Protocol for Use of Five Passive Samplers February 2007 to Sample for a Variety of Contaminants in Groundwater
34
optional top weight can be attached to compress the sampler in the bottom of the well if needed for an extremely short water column. With a top weight, the reed-valve is pushed down to within a foot of the bottom of the well.
3.4.4 Sample Recovery
The HydraSleeve must move upward at a rate of 1 foot per second or faster (about the speed a bailer is usually pulled upward) for water to pass through the reed-valve into the sample sleeve. The reed-valve must travel about 1–1.5 times the length of the sampler to fill the sample sleeve. For example, a 30-inch HydraSleeve needs a total upward movement of 30 to no more than 45 inches to fill. The upward motion can be accomplished using one long, continuous pull that moves the reed-valve the required distance in the open position. A special technique can be used for
sampling low-yield wells. Figures 3-8 and 3-9 depict sample collection with the HydraSleeve and a method for sample collection in low-yield wells.
3.4.4.1 Sample Transfer
Transfer the sample from the HydraSleeve to the sample containers immediately to minimize diffusive loss of VOCs through the walls of the sampler. To transfer a sample from the HydraSleeve with the least amount of aeration and agitation, use the short discharge tube included with the sampler. First, squeeze the full sampler just below the top to expel water resting above the flexible reed-valve. Then push the pointed discharge tube through the outer polyethylene sleeve about 3–4 inches below the white reinforcing strips (Figure 3-10). Discharge the sample into the desired container (Figure 3-11). Raising and lowering the bottom of the sampler or pinching the sample sleeve just below the discharge tube will control the flow of the sample. The sample sleeve can also be squeezed, forcing fluid up through the discharge tube, similar to squeezing a tube of toothpaste. With practice and using a flat surface to set the sample containers on, HydraSleeve sampling can typically be accomplished by one person.
Figure 3-9. Sampling low-yield wells with HydraSleeve.
Figure 3-10. HydraSleeve flexible reed valve.
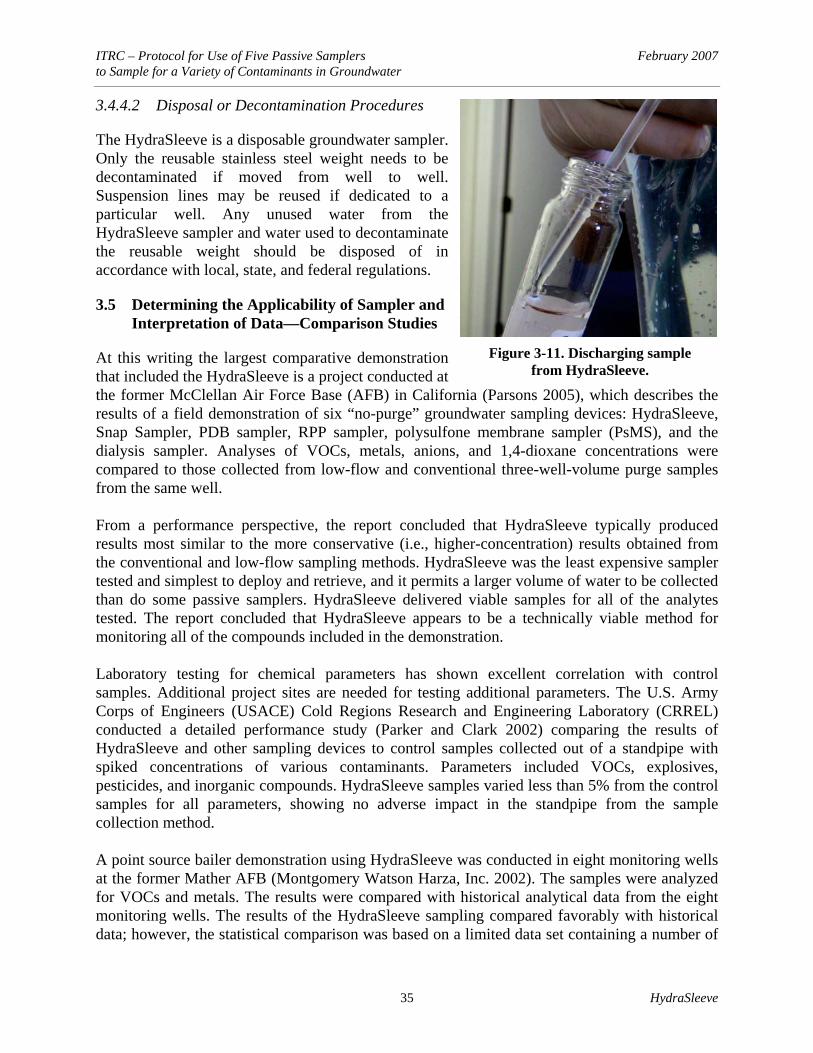
ITRC – Protocol for Use of Five Passive Samplers February 2007 to Sample for a Variety of Contaminants in Groundwater
35 HydraSleeve
3.4.4.2 Disposal or Decontamination Procedures
The HydraSleeve is a disposable groundwater sampler. Only the reusable stainless steel weight needs to be decontaminated if moved from well to well. Suspension lines may be reused if dedicated to a particular well. Any unused water from the HydraSleeve sampler and water used to decontaminate the reusable weight should be disposed of in accordance with local, state, and federal regulations.
3.5 Determining the Applicability of Sampler and Interpretation of Data—Comparison Studies
At this writing the largest comparative demonstration that included the HydraSleeve is a project conducted at the former McClellan Air Force Base (AFB) in California (Parsons 2005), which describes the results of a field demonstration of six “no-purge” groundwater sampling devices: HydraSleeve, Snap Sampler, PDB sampler, RPP sampler, polysulfone membrane sampler (PsMS), and the dialysis sampler. Analyses of VOCs, metals, anions, and 1,4-dioxane concentrations were compared to those collected from low-flow and conventional three-well-volume purge samples from the same well. From a performance perspective, the report concluded that HydraSleeve typically produced results most similar to the more conservative (i.e., higher-concentration) results obtained from the conventional and low-flow sampling methods. HydraSleeve was the least expensive sampler tested and simplest to deploy and retrieve, and it permits a larger volume of water to be collected than do some passive samplers. HydraSleeve delivered viable samples for all of the analytes tested. The report concluded that HydraSleeve appears to be a technically viable method for monitoring all of the compounds included in the demonstration. Laboratory testing for chemical parameters has shown excellent correlation with control samples. Additional project sites are needed for testing additional parameters. The U.S. Army Corps of Engineers (USACE) Cold Regions Research and Engineering Laboratory (CRREL) conducted a detailed performance study (Parker and Clark 2002) comparing the results of HydraSleeve and other sampling devices to control samples collected out of a standpipe with spiked concentrations of various contaminants. Parameters included VOCs, explosives, pesticides, and inorganic compounds. HydraSleeve samples varied less than 5% from the control samples for all parameters, showing no adverse impact in the standpipe from the sample collection method. A point source bailer demonstration using HydraSleeve was conducted in eight monitoring wells at the former Mather AFB (Montgomery Watson Harza, Inc. 2002). The samples were analyzed for VOCs and metals. The results were compared with historical analytical data from the eight monitoring wells. The results of the HydraSleeve sampling compared favorably with historical data; however, the statistical comparison was based on a limited data set containing a number of
Figure 3-11. Discharging sample from HydraSleeve.
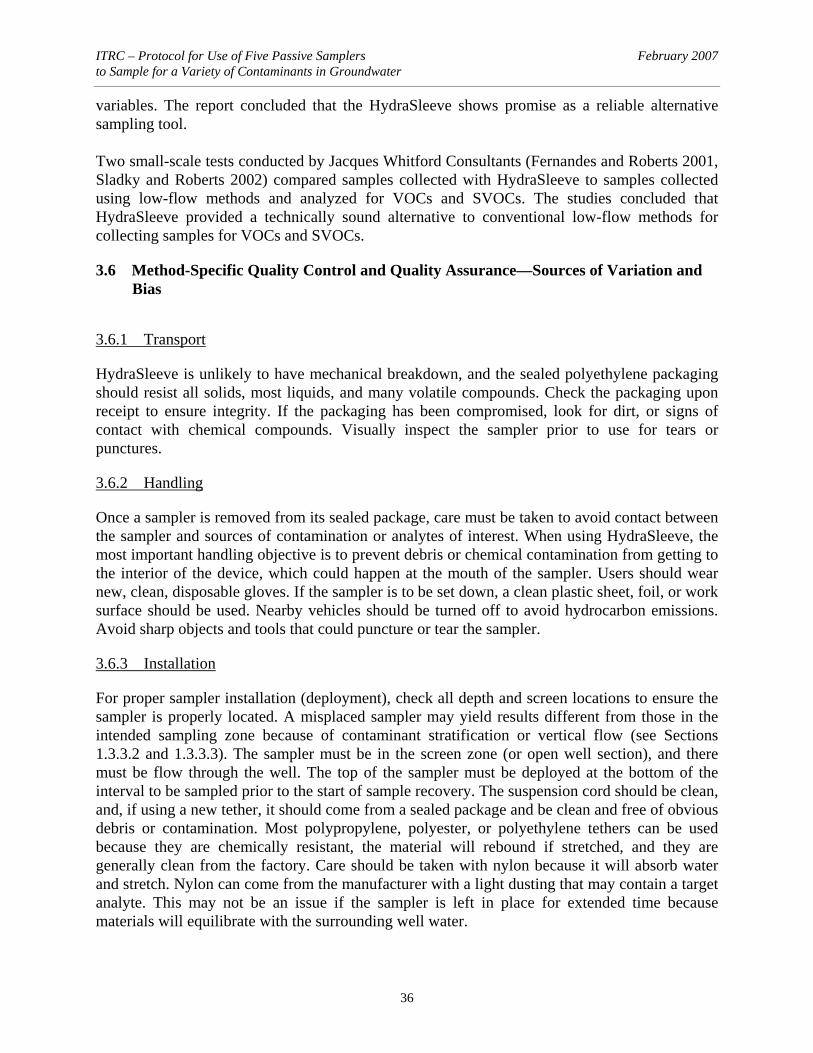
ITRC – Protocol for Use of Five Passive Samplers February 2007 to Sample for a Variety of Contaminants in Groundwater
36
variables. The report concluded that the HydraSleeve shows promise as a reliable alternative sampling tool. Two small-scale tests conducted by Jacques Whitford Consultants (Fernandes and Roberts 2001, Sladky and Roberts 2002) compared samples collected with HydraSleeve to samples collected using low-flow methods and analyzed for VOCs and SVOCs. The studies concluded that HydraSleeve provided a technically sound alternative to conventional low-flow methods for collecting samples for VOCs and SVOCs.
3.6 Method-Specific Quality Control and Quality Assurance—Sources of Variation and Bias
3.6.1 Transport
HydraSleeve is unlikely to have mechanical breakdown, and the sealed polyethylene packaging should resist all solids, most liquids, and many volatile compounds. Check the packaging upon receipt to ensure integrity. If the packaging has been compromised, look for dirt, or signs of contact with chemical compounds. Visually inspect the sampler prior to use for tears or punctures.
3.6.2 Handling
Once a sampler is removed from its sealed package, care must be taken to avoid contact between the sampler and sources of contamination or analytes of interest. When using HydraSleeve, the most important handling objective is to prevent debris or chemical contamination from getting to the interior of the device, which could happen at the mouth of the sampler. Users should wear new, clean, disposable gloves. If the sampler is to be set down, a clean plastic sheet, foil, or work surface should be used. Nearby vehicles should be turned off to avoid hydrocarbon emissions. Avoid sharp objects and tools that could puncture or tear the sampler.
3.6.3 Installation
For proper sampler installation (deployment), check all depth and screen locations to ensure the sampler is properly located. A misplaced sampler may yield results different from those in the intended sampling zone because of contaminant stratification or vertical flow (see Sections 1.3.3.2 and 1.3.3.3). The sampler must be in the screen zone (or open well section), and there must be flow through the well. The top of the sampler must be deployed at the bottom of the interval to be sampled prior to the start of sample recovery. The suspension cord should be clean, and, if using a new tether, it should come from a sealed package and be clean and free of obvious debris or contamination. Most polypropylene, polyester, or polyethylene tethers can be used because they are chemically resistant, the material will rebound if stretched, and they are generally clean from the factory. Care should be taken with nylon because it will absorb water and stretch. Nylon can come from the manufacturer with a light dusting that may contain a target analyte. This may not be an issue if the sampler is left in place for extended time because materials will equilibrate with the surrounding well water.

ITRC – Protocol for Use of Five Passive Samplers February 2007 to Sample for a Variety of Contaminants in Groundwater
37 HydraSleeve
With any sampler it is always a good idea to mark the top of the tether with the well ID to help avoid sample mislabeling at the surface. Using a factory-prepared tether and reusing the same tether will help ensure reproducible sampling results at the same location. It is best to measure the tether for connection point locations from the closest stable reference point, which is usually the bottom of the well. The well should be sounded to ensure references from bottom of the well are accurate. Avoid installing a HydraSleeve sampler through floating product layers. As the sampler moves through product layers, globules can cling to the sampler or be lodged in the area around the intake, which can then potentially make their way into the sampler during recovery.
3.6.4 Recovery
It is important that the sampler be left in the well sufficient time for restabilization of the well after the slight disturbance caused by sampler deployment. Since the HydraSleeve causes minimal displacement, the restabilization time could be as little as an hour in high-transmissivity wells or more in low-transmissivity wells. When using the continuous-pull sample collection method, it is important that the vertical interval available for sampling be longer than the sampler, up to 1.5 or 2 times the length of the sampler. This will ensure that the sampler fills completely and seals itself within the specified interval, making sure water from overlying zones doesn’t mix and cause misrepresentation. There is no maximum in-well residence time for an unfilled HydraSleeve. Once recovered from the well, the sampler should be emptied into a suitable lab container within minutes of recovery to minimize changes in chemistry. Gently tilt the sampler to drain water sitting on the closed valve. The discharge straw should remain in the sealed or otherwise clean package between deployment and sample collection to prevent contamination. When discharging sampler contents using the discharge straw, discharge a small amount of sample water to waste before capturing a sample for the laboratory. This will remove any potential contamination from the interior of the straw. Sample vials for VOCs should be filled from the bottom up to minimize loss of volatiles. Laboratory bias and error are no greater for HydraSleeve than for other sampling methods.
3.6.5 Collection of Blanks and Duplicate Samples
It is recommended that occasional equipment blanks be acquired by filling a sampler with deionized water and discharging the contents into a lab container in the same manner as a sample. A blank should also be tested as a control. Presence of compounds in the blank can alert the user to be aware of results for the indicated compounds and that biases may occur. Duplicate samples are difficult to acquire in 2-inch wells because the samplers cannot be colocated. It is possible to colocate two samplers in a 4-inch or larger well.
3.7 HydraSleeve References
Cordry, K. E. 2004. HydraSleeve Field Manual. Las Cruces, N.M.: GeoInsight, Inc.

ITRC – Protocol for Use of Five Passive Samplers February 2007 to Sample for a Variety of Contaminants in Groundwater
38
Fernandes, A. C., and J. Roberts. 2001. “Zero-Purge Groundwater Sampling at a Spent Purifier Media Disposal Site.” Presented at the 14th International Symposium on Site Remediation and Environmental Management in the Utility Industry, Orlando, Fla.
ITRC. 2004. Technical and Regulatory Guidance for Using Polyethylene Diffusion Bag Samplers to Monitor for Volatile Organic Compounds in Groundwater. DSP-3. Washington, D.C.: Interstate Technology & Regulatory Council, Diffusion/Passive Sampler Team. www.itrcweb.org.
Montgomery Watson Harza, Inc. 2002. Point Source Bailer Demonstration Report, Former Mather Air Force Base, Mather, California.
Parker, L. V., and C. H. Clark. 2002. Study of Five Discrete Interval-Type Ground Water Sampling Devices. ERDC/CRREL TR-02-12. U. S. Army Corps of Engineers, Engineer Research and Development Center, Cold Regions Research and Engineering Laboratory. www.crrel.usace.army.mil/techpub/CRREL_Reports/reports/TR02-12.pdf
Parker, L. V., and C. H. Clark. 2004. “Study of Five Discrete-Interval-Type Groundwater Sampling Devices.” Ground Water Monitoring and Remediation 24(3): 111–23.
Parsons. 2005. Results Report for the Demonstration of No-Purge Groundwater Sampling Devices at Former McClellan Air Force Base, California. Prepared for the U.S. Army Corps of Engineers, Air Force Center for Environmental Excellence, and Air Force Real Property Agency.
Robin, M. L. J., and R. W. Gillham. 1987. “Field Evaluation of Well Purging Procedures.” Ground Water Monitoring Review 7(4): 85–93.
Sladky, B., and J. Roberts. 2002. “Zero-Purge Groundwater Sampling for Semivolatile Organic Compounds.” Presented at the Gas Technology Institute Conference, Orlando, Fla.
Vroblesky, D. A. 2001. User’s Guide for Polyethylene-Based Passive Diffusion Bag Samplers to Obtain Volatile Organic Compounds Concentrations in Wells, Part 1—Deployment, Recovery, Data Interpretation, and Quality Control and Assurance and Part 2— Field Tests. U.S. Geological Survey Water Resources Investigation Reports 01-4060 and 01-4061. Available as DSP-1, Interstate Technology & Regulatory Council, Diffusion/Passive Sampler Team, www.itrcweb.org.
Acknowledgements The Diffusion/Passive Sampler Team recognizes and thanks the following individuals for helping develop the HydraSleeve protocol: • John Hicks, Parsons, Denver, Colorado • Don Gronstal, Air Force Real Property Agency, Western Region Execution Center,
McClellan, California • Matthew Poljanac and Cory Dunham, Bauer Dunham & Barr, Ann Arbor, Michigan
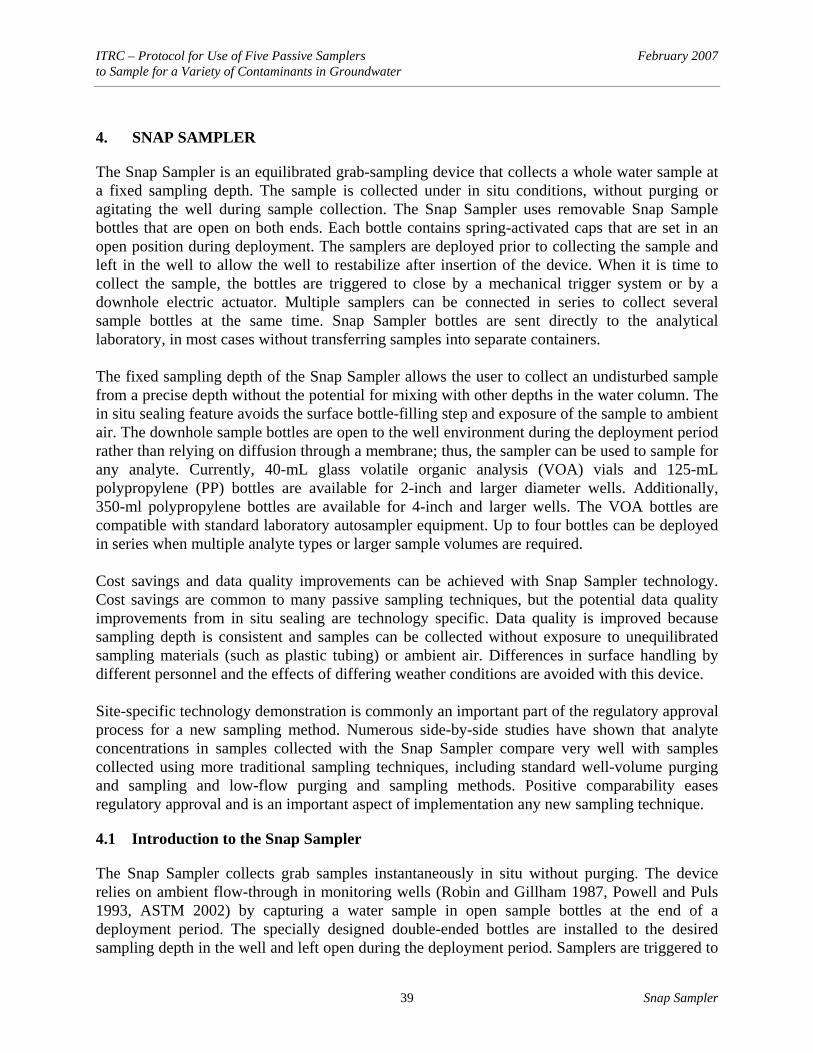
ITRC – Protocol for Use of Five Passive Samplers February 2007 to Sample for a Variety of Contaminants in Groundwater
39 Snap Sampler
4. SNAP SAMPLER
The Snap Sampler is an equilibrated grab-sampling device that collects a whole water sample at a fixed sampling depth. The sample is collected under in situ conditions, without purging or agitating the well during sample collection. The Snap Sampler uses removable Snap Sample bottles that are open on both ends. Each bottle contains spring-activated caps that are set in an open position during deployment. The samplers are deployed prior to collecting the sample and left in the well to allow the well to restabilize after insertion of the device. When it is time to collect the sample, the bottles are triggered to close by a mechanical trigger system or by a downhole electric actuator. Multiple samplers can be connected in series to collect several sample bottles at the same time. Snap Sampler bottles are sent directly to the analytical laboratory, in most cases without transferring samples into separate containers. The fixed sampling depth of the Snap Sampler allows the user to collect an undisturbed sample from a precise depth without the potential for mixing with other depths in the water column. The in situ sealing feature avoids the surface bottle-filling step and exposure of the sample to ambient air. The downhole sample bottles are open to the well environment during the deployment period rather than relying on diffusion through a membrane; thus, the sampler can be used to sample for any analyte. Currently, 40-mL glass volatile organic analysis (VOA) vials and 125-mL polypropylene (PP) bottles are available for 2-inch and larger diameter wells. Additionally, 350-ml polypropylene bottles are available for 4-inch and larger wells. The VOA bottles are compatible with standard laboratory autosampler equipment. Up to four bottles can be deployed in series when multiple analyte types or larger sample volumes are required. Cost savings and data quality improvements can be achieved with Snap Sampler technology. Cost savings are common to many passive sampling techniques, but the potential data quality improvements from in situ sealing are technology specific. Data quality is improved because sampling depth is consistent and samples can be collected without exposure to unequilibrated sampling materials (such as plastic tubing) or ambient air. Differences in surface handling by different personnel and the effects of differing weather conditions are avoided with this device. Site-specific technology demonstration is commonly an important part of the regulatory approval process for a new sampling method. Numerous side-by-side studies have shown that analyte concentrations in samples collected with the Snap Sampler compare very well with samples collected using more traditional sampling techniques, including standard well-volume purging and sampling and low-flow purging and sampling methods. Positive comparability eases regulatory approval and is an important aspect of implementation any new sampling technique.
4.1 Introduction to the Snap Sampler
The Snap Sampler collects grab samples instantaneously in situ without purging. The device relies on ambient flow-through in monitoring wells (Robin and Gillham 1987, Powell and Puls 1993, ASTM 2002) by capturing a water sample in open sample bottles at the end of a deployment period. The specially designed double-ended bottles are installed to the desired sampling depth in the well and left open during the deployment period. Samplers are triggered to
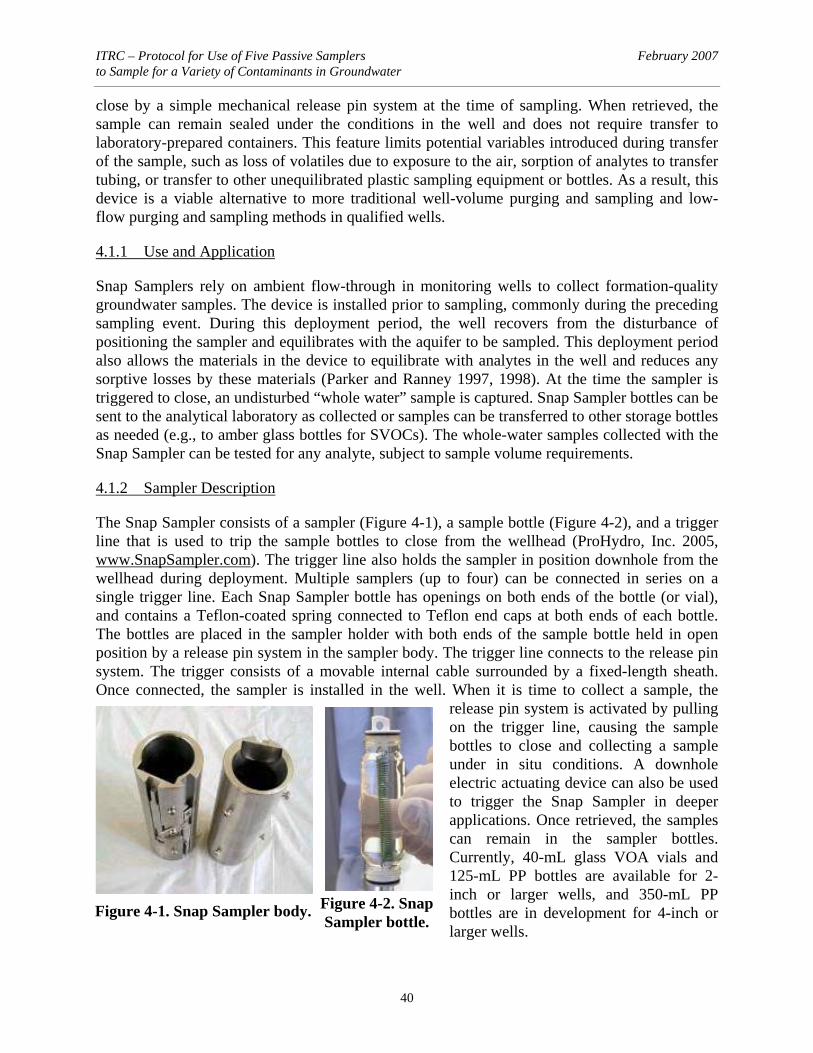
ITRC – Protocol for Use of Five Passive Samplers February 2007 to Sample for a Variety of Contaminants in Groundwater
40
close by a simple mechanical release pin system at the time of sampling. When retrieved, the sample can remain sealed under the conditions in the well and does not require transfer to laboratory-prepared containers. This feature limits potential variables introduced during transfer of the sample, such as loss of volatiles due to exposure to the air, sorption of analytes to transfer tubing, or transfer to other unequilibrated plastic sampling equipment or bottles. As a result, this device is a viable alternative to more traditional well-volume purging and sampling and low-flow purging and sampling methods in qualified wells.
4.1.1 Use and Application
Snap Samplers rely on ambient flow-through in monitoring wells to collect formation-quality groundwater samples. The device is installed prior to sampling, commonly during the preceding sampling event. During this deployment period, the well recovers from the disturbance of positioning the sampler and equilibrates with the aquifer to be sampled. This deployment period also allows the materials in the device to equilibrate with analytes in the well and reduces any sorptive losses by these materials (Parker and Ranney 1997, 1998). At the time the sampler is triggered to close, an undisturbed “whole water” sample is captured. Snap Sampler bottles can be sent to the analytical laboratory as collected or samples can be transferred to other storage bottles as needed (e.g., to amber glass bottles for SVOCs). The whole-water samples collected with the Snap Sampler can be tested for any analyte, subject to sample volume requirements.
4.1.2 Sampler Description
The Snap Sampler consists of a sampler (Figure 4-1), a sample bottle (Figure 4-2), and a trigger line that is used to trip the sample bottles to close from the wellhead (ProHydro, Inc. 2005, www.SnapSampler.com). The trigger line also holds the sampler in position downhole from the wellhead during deployment. Multiple samplers (up to four) can be connected in series on a single trigger line. Each Snap Sampler bottle has openings on both ends of the bottle (or vial), and contains a Teflon-coated spring connected to Teflon end caps at both ends of each bottle. The bottles are placed in the sampler holder with both ends of the sample bottle held in open position by a release pin system in the sampler body. The trigger line connects to the release pin system. The trigger consists of a movable internal cable surrounded by a fixed-length sheath. Once connected, the sampler is installed in the well. When it is time to collect a sample, the
release pin system is activated by pulling on the trigger line, causing the sample bottles to close and collecting a sample under in situ conditions. A downhole electric actuating device can also be used to trigger the Snap Sampler in deeper applications. Once retrieved, the samples can remain in the sampler bottles. Currently, 40-mL glass VOA vials and 125-mL PP bottles are available for 2-inch or larger wells, and 350-mL PP bottles are in development for 4-inch or larger wells.
Figure 4-1. Snap Sampler body. Figure 4-2. Snap Sampler bottle.
ITRC – Protocol for Use of Five Passive Samplers February 2007 to Sample for a Variety of Contaminants in Groundwater
41 Snap Sampler
4.1.3 Applicable Analytes
The Snap Sampler can be used to sample any analyte using 40-mL glass VOA vials or 125-mL and 350-mL PP bottles. However, sample volume requirements may limit the number of analyte types that can be analyzed (see Appendix A). Up to four Snap Samplers of any combination of available sizes can be placed on a single trigger to accommodate multiple analyte suites. When more than four bottles are needed, multiple triggers are required.
4.1.4 Physical Characteristics
The diameter of the Snap Sampler with bottles installed ranges 1.65–3.1 inches, depending on sampler and bottle type. Snap Samplers with 40-mL and 125-mL bottles will fit into 2-inch or larger monitoring wells; Snap Samplers with 350-mL bottles will fit into 4-inch or larger wells. Length of the Snap Sampler string depends on the number of Snap Samplers placed in series and which samplers are used. Each 40-mL Snap Sampler is 7.8 inches long, including connection hardware. Each 125-mL and 350-mL Snap Sampler is 10.4 inches long. Any combination of Snap Sampler bottles (up to a total of four) can be connected in series with a single trigger. If required, multiple trigger lines can be used to collect more than four bottles.
4.1.5 Vendor Availability
Snap Samplers are manufactured and sold by
ProHydro, Inc. Fairport, New York Phone: 585-385-0023 E-mail: [email protected] Web site: www.SnapSampler.com
Snap Samplers are U.S. and international patent pending.
4.2 Sampler Advantages
Snap Samplers • can be used to test for any analyte, including field parameters; • reduce field time and sampling cost; • can collect samples without exposure to air at the wellhead; • are able to recover a sample without mixing or exposing sample to other intervals during
retrieval; • reduce potential sampling error; • collect from a specific depth in the well; • can sample low-yield, short screen, and short standing water column wells; • require one mobilization per sampling event to collect and replace bottles.
ITRC – Protocol for Use of Five Passive Samplers February 2007 to Sample for a Variety of Contaminants in Groundwater
42
4.3 Sampler Limitations
Snap Samplers • must be deployed in wells 2 inches in diameter or larger; • collect a limited sample volume—long analyte lists may not be practical; • require dedicated trigger lines; • require advanced planning to determine trigger lengths for specific wells.
4.4 Typical Sampler Deployment
Snap Samplers typically require a single mobilization to retrieve samples and redeploy new bottles for the next sampling event. Single or multiple sampling depths are selected based on the site’s sampling plan and DQOs. Snap Sampler trigger lines are purchased in advance based on well construction, water level, and site-specific sampling objectives. To deploy the samplers at the desired depth(s), bottles are inserted into the Snap Sampler bodies, cocked into an open position, and attached to the trigger line (specific instructions follow). The samplers are lowered into the well by the trigger line and “docked” at the wellhead docking station. Samplers are left in the well in an open position until sampling is desired. To collect a sample, the trigger line is manually pulled to activate closure of the sample bottles downhole. An electric actuator may be preferred for deep applications (~150 feet). Once closed, the samplers are retrieved using the trigger line. Bottles are removed and prepared for submittal to the laboratory. Bottle preparation includes trimming retainer tabs off the bottle caps, adding preservative (if needed), and placing septa caps. New bottles are then reinserted into the Snap Sampler bodies, cocked, and redeployed downhole for the next sampling event. Beyond normal sampling equipment (e.g., water level indicator, sampling documentation, ice chest), only new bottles are required to sample and redeploy Snap Samplers.
4.4.1 Deployment Considerations
Prior to initial deployment of Snap Samplers, several items must be considered. This sampler cannot be deployed in wells narrower than 2 inches. Trigger lines must be selected and procured for each well and deployment depth. The length of the trigger line is fixed once constructed, so the triggers cannot be used in other wells of different depths. Accurate information about screen interval and depth from top-of-casing to the screen interval is needed to select the correct length of the trigger lines. This information must be gathered in advance and provided to the Snap Sampler vendor for construction of well-specific triggers. Trigger lines are a predetermined fixed length for each set of sample bottles based on the desired depth of sampling. The trigger connects at the top of the top sampler, so trigger length should be based on distance from top of well casing to the desired point of the top of the sampler string. For the electric trigger, the depth to deployment position is measured and marked on the electric wireline and hung from that position at the wellhead. Deploying any type of sampling device into a well disturbs the ambient state of resident groundwater. Therefore, a period of time between deployment and sample collection is recommended to allow the well to restabilize. The time period for restabilization varies

ITRC – Protocol for Use of Five Passive Samplers February 2007 to Sample for a Variety of Contaminants in Groundwater
43 Snap Sampler
depending on site hydrogeology. Typical first-time deployment periods are one to two weeks, but longer deployment periods extending between sampling events are recommended for repeated monitoring. Because Snap Sampler bottles are specially designed to be open on both ends, conventional sample bottles cannot be used in this sampler. Therefore, Snap Sampler VOA vials and PP bottles must be ordered from the vendor prior to deployment.
4.4.2 Deployment Steps
The following describes the deployment and sampling procedures for the Snap Sampler groundwater sampling method (adapted from ProHydro, Inc. 2005). These procedures describe steps for deploying dedicated and nondedicated systems.
4.4.2.1 Assembling the Snap Sampler
1. Using disposable gloves, remove the Snap Sampler bottle from its package. 2. Insert the bottle into the upper end of the Snap Sampler body as shown in Figure 4-3. 3. Place the sampler cover/connector onto each end of the sampler and then gently tighten the
setscrew with the Snap Driver Tool (Figure 4-4). 4. Pivot the Snap Cap into its seat with the Snap Driver Tool. Push up the retainer pin through
the lower hole in the vial cap. Repeat for all Snap Caps (Figure 4-5). 5. Click trigger into connector. Attach ball fitting to release pin (Figure 4-6). 6. Deploy to selected depth with trigger line and attach to the wellhead docking station (Figure
4-7).
LIGHTLY TIGHTEN SETSCREW
Figure 4-4. Securing the Snap Sampler body parts.
Figure 4-3. Inserting sample bottles into Snap Sampler bodies.
INSERT
40 mL
INSERT
125 mL

ITRC – Protocol for Use of Five Passive Samplers February 2007 to Sample for a Variety of Contaminants in Groundwater
44
7. Additional Snap Samplers can be deployed with separate trigger lines or in series with a single trigger line. If separate trigger lines are used, the ID tags should be marked at the surface for later reference.
8. The recommended minimum deployment period prior to sampling is two weeks where site hydrogeology and flow are not well established. There are hydrogeologic conditions where a shorter deployment is possible, but two weeks would generally ensure a well is restabilized (Vroblesky 2001).
9. The Snap Sampler can also be deployed for more extended periods. If sampling quarterly, for example, one mobilization can be employed to collect samples and redeploy for the next quarterly sample.
4.4.2.2 Securing the Device
Snap Samplers are secured by attaching the trigger line to a wellhead docking station. The dock has a fitting for attaching the trigger to hang between deployment and retrieval.
4.4.2.3 Sample Recovery
To collect a sample, the sampler is triggered at the wellhead without disturbing the sampler position. This is accomplished by holding the trigger line in place while pulling the inner cable. The trigger line should be pulled with sufficient force to move the cable up the tubing. Depending on the length of the trigger line, closure of the samplers usually can be felt through the trigger line when the samplers trip. If more than one triggering line is present, closure should proceed from the deepest to the shallowest sampler position to limit capture of sediment resuspended by closure of the first sampler. For the electric trigger, a fully charged battery should be used to actuate the trigger. After the sampler is triggered and retrieved, the upper connector is removed by loosening the retainer screw and turning the connector to remove it.
Figure 4-5. Setting the Snap Caps.
ROTATE VIAL CAP INTO ITS SEAT
Figure 4-6. Feeding and securing trigger cable.
ATTACH BALL
FITTING
FEED AND “CLICK” TRIGGER
LOWER DOWN HOLE, HANG TRIGGER ON DOCK RING
Figure 4-7. Securing sampler into wellhead docking station.
SECURE WELLHEAD
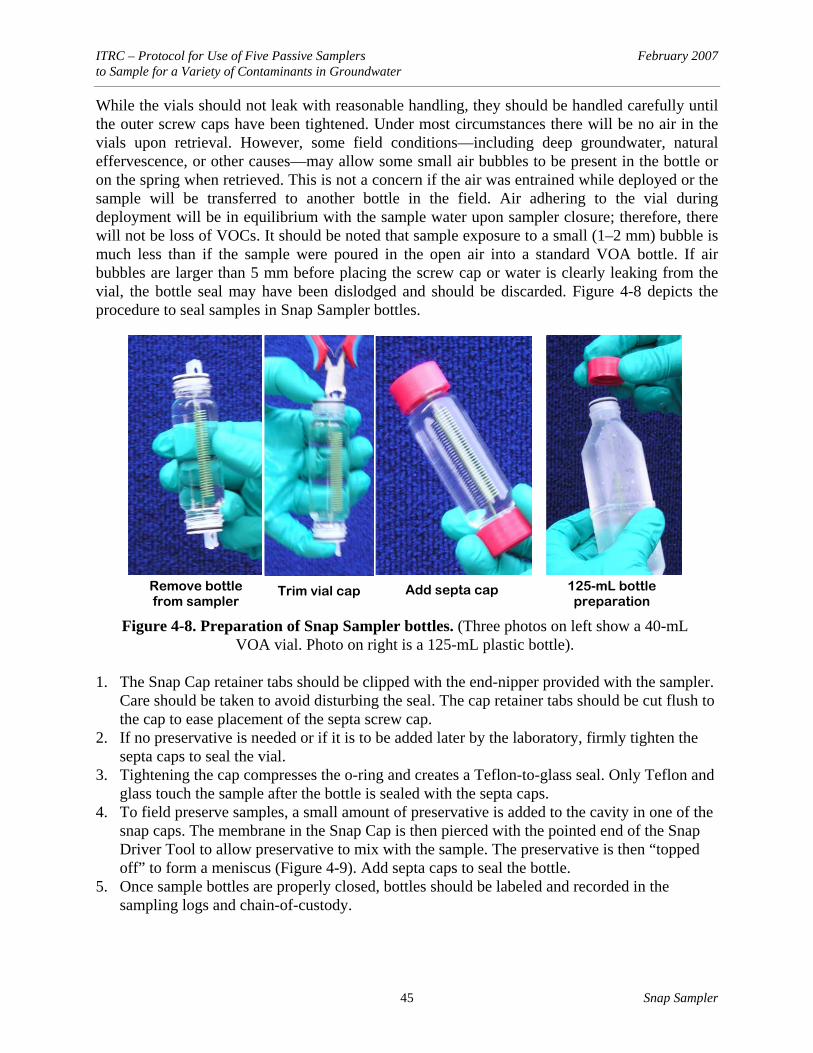
ITRC – Protocol for Use of Five Passive Samplers February 2007 to Sample for a Variety of Contaminants in Groundwater
45 Snap Sampler
While the vials should not leak with reasonable handling, they should be handled carefully until the outer screw caps have been tightened. Under most circumstances there will be no air in the vials upon retrieval. However, some field conditions—including deep groundwater, natural effervescence, or other causes—may allow some small air bubbles to be present in the bottle or on the spring when retrieved. This is not a concern if the air was entrained while deployed or the sample will be transferred to another bottle in the field. Air adhering to the vial during deployment will be in equilibrium with the sample water upon sampler closure; therefore, there will not be loss of VOCs. It should be noted that sample exposure to a small (1–2 mm) bubble is much less than if the sample were poured in the open air into a standard VOA bottle. If air bubbles are larger than 5 mm before placing the screw cap or water is clearly leaking from the vial, the bottle seal may have been dislodged and should be discarded. Figure 4-8 depicts the procedure to seal samples in Snap Sampler bottles.
1. The Snap Cap retainer tabs should be clipped with the end-nipper provided with the sampler.
Care should be taken to avoid disturbing the seal. The cap retainer tabs should be cut flush to the cap to ease placement of the septa screw cap.
2. If no preservative is needed or if it is to be added later by the laboratory, firmly tighten the septa caps to seal the vial.
3. Tightening the cap compresses the o-ring and creates a Teflon-to-glass seal. Only Teflon and glass touch the sample after the bottle is sealed with the septa caps.
4. To field preserve samples, a small amount of preservative is added to the cavity in one of the snap caps. The membrane in the Snap Cap is then pierced with the pointed end of the Snap Driver Tool to allow preservative to mix with the sample. The preservative is then “topped off” to form a meniscus (Figure 4-9). Add septa caps to seal the bottle.
5. Once sample bottles are properly closed, bottles should be labeled and recorded in the sampling logs and chain-of-custody.
Figure 4-8. Preparation of Snap Sampler bottles. (Three photos on left show a 40-mL VOA vial. Photo on right is a 125-mL plastic bottle).
125-mL bottle preparation
Add septa cap Trim vial cap Remove bottle from sampler
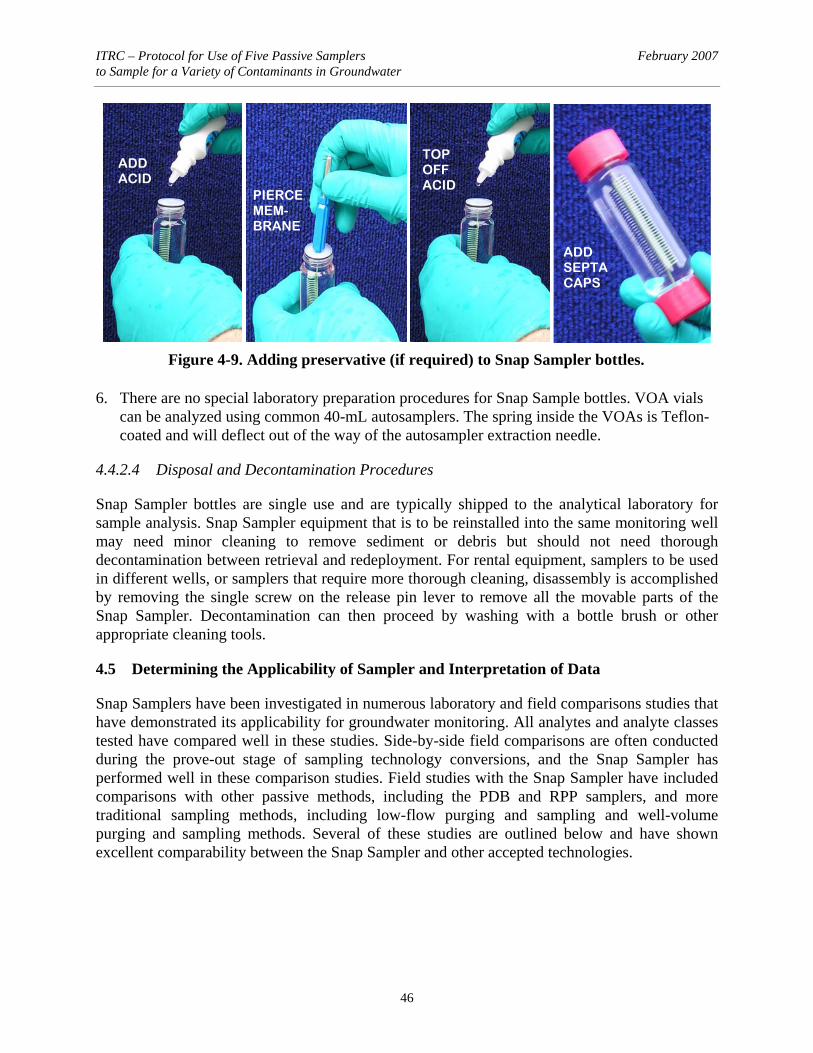
ITRC – Protocol for Use of Five Passive Samplers February 2007 to Sample for a Variety of Contaminants in Groundwater
46
6. There are no special laboratory preparation procedures for Snap Sample bottles. VOA vials
can be analyzed using common 40-mL autosamplers. The spring inside the VOAs is Teflon-coated and will deflect out of the way of the autosampler extraction needle.
4.4.2.4 Disposal and Decontamination Procedures
Snap Sampler bottles are single use and are typically shipped to the analytical laboratory for sample analysis. Snap Sampler equipment that is to be reinstalled into the same monitoring well may need minor cleaning to remove sediment or debris but should not need thorough decontamination between retrieval and redeployment. For rental equipment, samplers to be used in different wells, or samplers that require more thorough cleaning, disassembly is accomplished by removing the single screw on the release pin lever to remove all the movable parts of the Snap Sampler. Decontamination can then proceed by washing with a bottle brush or other appropriate cleaning tools.
4.5 Determining the Applicability of Sampler and Interpretation of Data
Snap Samplers have been investigated in numerous laboratory and field comparisons studies that have demonstrated its applicability for groundwater monitoring. All analytes and analyte classes tested have compared well in these studies. Side-by-side field comparisons are often conducted during the prove-out stage of sampling technology conversions, and the Snap Sampler has performed well in these comparison studies. Field studies with the Snap Sampler have included comparisons with other passive methods, including the PDB and RPP samplers, and more traditional sampling methods, including low-flow purging and sampling and well-volume purging and sampling methods. Several of these studies are outlined below and have shown excellent comparability between the Snap Sampler and other accepted technologies.
ADD ACID
PIERCE MEM-BRANE
TOP OFF ACID
ADD SEPTA CAPS
Figure 4-9. Adding preservative (if required) to Snap Sampler bottles.
ITRC – Protocol for Use of Five Passive Samplers February 2007 to Sample for a Variety of Contaminants in Groundwater
47 Snap Sampler
4.5.1 Laboratory Comparison Studies
U.S. Army Corps of Engineers, Cold Regions Research Engineering Laboratory Laboratory trials using a standpipe containing known concentrations of seven VOCs and six explosives were conducted by Engineer Research and Development Center (ERDC)-CRREL (Parker and Mulherin, in preparation). Four Snap Samplers were deployed in the standpipe containing the explosives, and six samplers were deployed in the standpipe containing the VOCs. The devices were deployed at the same depth as the sampling port on the standpipe and were left for 24 hours to allow time for the materials in the sampler to equilibrate with the test solution. Samples collected from the sampling port served as the controls, and analyses were conducted within 24 hours. For all the analytes tested, analyses revealed that there was no statistically significant difference between the concentrations of the analytes in the Snap Samplers and those in the controls.
4.5.2 Field Comparison Studies
Field trials were conducted in one of the TCE-contaminated monitoring wells on site at CRREL in New Hampshire (Parker and Mulherin, in preparation). In this study, a Snap Sampler was placed in a 4-inch-diameter well near the pump intake at a depth of ~125 feet and left to equilibrate overnight. The next day, the Snap Sampler was activated (by closing the sample vial), a sample was collected using a bladder pump and low-flow purge and sampling protocol, and then the Snap Sampler was removed from the well. To avoid elevating the turbidity in the well prior to collecting the low-flow sample, the Snap Sampler was not removed from the well until after the low-flow sample was collected. The process was repeated five times over 5 days. No significant difference was found between the concentration of TCE in the samples collected with the Snap Sampler and that in the samples collected using the low-flow sampling method. University of Waterloo / University Solvents Consortium Comparison Study A chlorinated solvents release site in southern Ontario, Canada, was selected for a multimethod comparison with the Snap Sampler (Britt, Parker, and Cherry, in preparation). Five wells in the study were each completed in the shallow bedrock with relatively short open intervals ranging 1.5–3 m. Depth to completions ranged 3–6 m. Primary constituents of concern are perchloroethene (PCE), TCE, 1,1,1-trichloroethane (TCA) and cis-1,2-dichloroethene (DCE). Sampler deployment and sampling were conducted in two single-day mobilizations. The comparison was implemented by preparing Snap Samplers for deployment, attaching pump tubing to one of the Snap Samplers and PDB samplers to both Snap Samplers. (Figure 4-10). Sampling was conducted at each well by first triggering the Snap Samplers. Then, purging was initiated without removing the Snap Samplers or PDB samplers from the well. The Snap Samplers were sealed, so flow around the samplers during purging would have no effect on the samples. PDB samplers require hours or days to reequilibrate; therefore, concentrations in the PDB samplers were not expected to change substantially for the brief time the well was purged (less than 35 minutes in all cases). After purging was complete, Snap Samplers, PDB samplers, and pump tubing were removed from each well. To limit exposure of the pumped sample to the

ITRC – Protocol for Use of Five Passive Samplers February 2007 to Sample for a Variety of Contaminants in Groundwater
48
pump tubing and negative pressure lift, these samples were collected by draining the lower end of the tubing into a VOA vial (Chapman and Parker 2005). Snap Sampler samples were prepared for shipping by clipping the tabs on the caps and securing septa caps. PDB samples were collected by clipping a corner of the bag and carefully pouring the sampler’s contents into standard VOA vials. Figure 4-11 is an x-y plot of data generated in this comparison. Each point on the plot represents a single-constituent data pair of each sampling method. The best-fit linear trend line slope and associated correlation coefficient (R2) values for the set of comparison pairs are included on the plot. The trend line “y” slope of 1.13 in the PDB indicates the Snap Sampler results are, on average, 1.13 times greater than the values for the PDB samples. The R2 value of 0.99 indicates a very good correlation between the two sampling methods and confidence in the comparability of the methods and the value of the slope. Visually, the correlation between the methods is good over several orders of magnitude. The differences between the results for PDBs, low-flow purged samples, and the Snap Samplers are likely due to two main factors: loss of analytes to new polyethylene tubing
during sampling and loss of volatiles to air during sample collection at the surface. McClellan Air Force Base Study Parsons (2005) conducted a field study at the former McClellan AFB that compared several passive sampling devices, including the Snap Sampler, with two purging and sampling protocols. In the study, several passive diffusion samplers were deployed in each of 20 wells about three weeks ahead of sample collection. These devices were retrieved, followed by deployment of passive grab-sampling devices, including the Snap Sampler. The grab samplers were left in the wells for 5–7 days then retrieved. Active purging by low-flow sampling protocol was conducted within 1–2 days. Sampling by low flow was immediately, followed by well-volume purging and sampling. Volume purging was completed by increasing the pump rate of the submersible pump. Well-volume purge samples were collected with new polyethylene disposable bailers.
Figure 4-10. Equilibrated Snap-PDB/ low-flow deployment configuration.
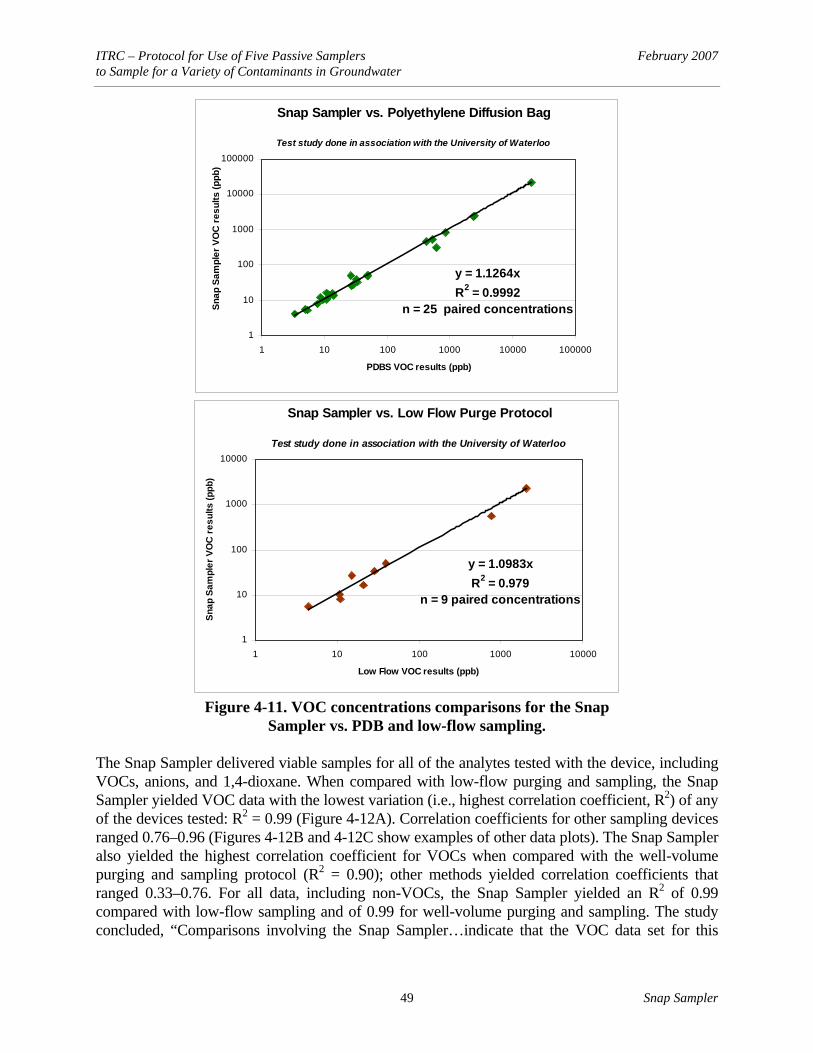
ITRC – Protocol for Use of Five Passive Samplers February 2007 to Sample for a Variety of Contaminants in Groundwater
49 Snap Sampler
Snap Sampler vs. Polyethylene Diffusion Bag
Test study done in association with the University of Waterloo
y = 1.1264xR2 = 0.9992
n = 25 paired concentrations
1
10
100
1000
10000
100000
1 10 100 1000 10000 100000
PDBS VOC results (ppb)
Snap
Sam
pler
VO
C re
sults
(ppb
)
Snap Sampler vs. Low Flow Purge Protocol
Test study done in association with the University of Waterloo
y = 1.0983xR2 = 0.979
n = 9 paired concentrations
1
10
100
1000
10000
1 10 100 1000 10000
Low Flow VOC results (ppb)
Snap
Sam
pler
VO
C re
sults
(ppb
)
Figure 4-11. VOC concentrations comparisons for the Snap
Sampler vs. PDB and low-flow sampling. The Snap Sampler delivered viable samples for all of the analytes tested with the device, including VOCs, anions, and 1,4-dioxane. When compared with low-flow purging and sampling, the Snap Sampler yielded VOC data with the lowest variation (i.e., highest correlation coefficient, R2) of any of the devices tested: R2 = 0.99 (Figure 4-12A). Correlation coefficients for other sampling devices ranged 0.76–0.96 (Figures 4-12B and 4-12C show examples of other data plots). The Snap Sampler also yielded the highest correlation coefficient for VOCs when compared with the well-volume purging and sampling protocol (R2 = 0.90); other methods yielded correlation coefficients that ranged 0.33–0.76. For all data, including non-VOCs, the Snap Sampler yielded an R2 of 0.99 compared with low-flow sampling and of 0.99 for well-volume purging and sampling. The study concluded, “Comparisons involving the Snap Sampler…indicate that the VOC data set for this

ITRC – Protocol for Use of Five Passive Samplers February 2007 to Sample for a Variety of Contaminants in Groundwater
50
sampler may be more consistently representative of the actual VOC concentrations in the well at the time of sample collection” (Parsons 2005).
Figure 4-12A.
Figure 4-12B.

ITRC – Protocol for Use of Five Passive Samplers February 2007 to Sample for a Variety of Contaminants in Groundwater
51 Snap Sampler
Figure 4-12C.
Figure 4-12. Snap Sampler, regenerated-cellulose sampler, and polyethylene diffusion bag and vs. low-flow sampling. (A) Snap Sampler vs. low-flow sampling: individual VOC concentration comparisons are depicted by red data points, anions in green, and 1,4-dioxane in gold; R2 for VOCs = 0.99, slope y = 1.77. (B) Regenerated-cellulose (RGC) sampler vs. low-flow: R2 for VOCs = 0.96, slope y = 1.22. (C) PDB vs. low-flow sampling; R2 for VOCs = 0.79, slope y = 1.41. (Source: Parsons 2005)
In addition to the high correlation coefficients, slight to somewhat higher VOC concentrations were consistently found in samples taken with the Snap Sampler when compared with samples collected using low-flow purge sampling and the other passive sampling methods (Figure 4-12). The magnitudes of the differences were specific to the analyte and different among the different sampling devices (Parsons 2005; Britt 2006a,b). Differences between sampling methods/devices appear to be related to the analyte’s Henry’s vapor partition coefficient and/or octanol-water partitioning coefficient. These tendencies were evident in all sampling methods that were compared with the Snap Sampler. Several factors may have contributed to losses of VOCs with other sampling devices, where the samples are not sealed in the well. These factors include deep groundwater (>100 feet), high ambient air temperatures during sample collection (at times >90°F), and new pump tubing (in the case of low-flow purging and sampling). Britt (2006a,b) reviewed the McClellan data to assess individual VOC recoveries of each sampling method compared with the Snap Sampler. Percent recoveries were calculated by dividing the lower result by the higher result for each data pair (a data pair consists of a single

ITRC – Protocol for Use of Five Passive Samplers February 2007 to Sample for a Variety of Contaminants in Groundwater
52
chemical from one sampling point collected by two different methods). Higher results were assumed to be closest to full recovery. For example, if Sampler A concentration = 80 and Sampler B concentration = 100, then Sampler A has 80% recovery with respect to Sampler B. Several examples of direct comparison pairs were available for each chemical-sampler pair. Median percent recoveries were tallied for each chemical and sampler pair to assess average recoveries. In the comparison of median percent recoveries, the Snap Sampler was higher in 34 out of 35 chemical-sampler pairs. This comparison highlights the potential for losses associated with surface handling of VOC samples. These losses are avoided with in situ closure of the Snap Sampler. Other Field Comparison Examples Figure 4-13 shows the field data from a petroleum hydrocarbon–contaminated site in California, including benzene, toluene, ethylbenzene, and xylenes; methyl tert-butyl ether (MTBE); and other oxygenates. Each point on the plot represents a single-constituent data pair of each sampling method (e.g., MTBE in CBC-34 = 66 μg/L for Snap Sampler and 65 μg/L for purge). There is good correlation between concentrations of VOCs in samples taken with the Snap Sampler vs. low-flow sampling (ProHydro, Inc., unpublished data, 2005).
Figure 4-14 shows a plot of concentrations of nine VOCs in a sample collected from a single well in California (ProHydro, Inc., unpublished data, 2004). For several analytes, there is divergence between the concentrations in the samples collected using the volume purge method vs. those collected with the Snap Sampler. Note that concentrations of the VOCs in samples collected using another passive sampler, the PDB sampler deployed at the same depth, corresponds well with the data for the Snap Sampler. However, the Snap Sampler was able to detect 1,4-dioxane while the PDB was not (open circle indicates detection limit).
Figure 4-13. Comparison of VOC concentrations in samples taken in 12 wells using the Snap Sampler and low-flow purge sampling.

ITRC – Protocol for Use of Five Passive Samplers February 2007 to Sample for a Variety of Contaminants in Groundwater
53 Snap Sampler
4.6 Method-Specific Quality Assurance and Quality Control
There are no specific additional QA/QC procedures required for the Snap Sampler. However, sample volume must be considered when planning for primary duplicates, matrix spikes, and matrix spike duplicates. Additional samplers may need to be deployed to provide the extra sample volume needed for these analyses. However, it should be noted that a sealed sample is not critical for matrix spike samples. For example, a single larger bottle could be used for VOC matrix spikes/matrix spike duplicates by pouring into laboratory VOA bottles.
4.7 Snap Sampler References
ASTM. 2002. “Standard Practice for Low-Flow Purging and Sampling for Wells and Devices Used for Ground-Water Quality Monitoring.” D6771-02. ASTM International.
Britt, S. L. 2005. “Testing the In-Well Horizontal Laminar Flow Assumption with a Sand Tank Well Model.” Ground Water Monitoring and Remediation 25(3): 73–81.
Britt, S. L. 2006a. “Differential Recoveries in VOC Sampling: Low Flow, the Snap Sampler™, and Remedial Decision-Making.” Proceedings, Battelle International Conference on Remediation of Chlorinated and Recalcitrant Compounds, Monterey, Calif.
Britt, S. L. 2006b. “Differential VOC Losses in Ex Situ Bottle Filling: In Situ Snap Sampler Results Compared to Poured Samples.” Proceedings, North American Environmental Field Conference and Exposition, Tampa, Fla.
Figure 4-14. Comparison of VOC concentrations in a single well: Snap Sampler vs. volume purge sampling. (Open circle indicates nondetect at the corresponding concentration.)
ITRC – Protocol for Use of Five Passive Samplers February 2007 to Sample for a Variety of Contaminants in Groundwater
54
Britt, S. L., B. L. Parker, and J. A. Cherry. In preparation. “Field Testing the Snap Sampler™—A Comparison with Low Flow, Volume Purging and the Polyethylene Diffusion Bag Sampler.”
Chapman, S. W., and B. L. Parker. 2005. “Plume Persistence due to Aquitard Back Diffusion Following Dense Nonaqueous Phase Liquid Source Removal or Isolation.” Water Resources Research 41: W12411.
ITRC. 2004. Technical and Regulatory Guidance for Using Polyethylene Diffusion Bag Samplers to Monitor for Volatile Organic Compounds in Groundwater. DSP-3. Washington, D.C.: Interstate Technology & Regulatory Council, Diffusion/Passive Sampler Team. www.itrcweb.org.
Parker, L. V., and N. Mulherin. In preparation. ERDC Technical Report. U.S. Army Corps of Engineers, Engineer Research and Development Center, Cold Regions Research and Engineering Laboratory.
Parker, L. V., and T. A. Ranney. 1997. “Sampling Trace-Level Organics with Polymeric Tubing: Part I. Static Studies.” Ground Water Monitoring and Remediation 17(4): 115–24.
Parker, L. V., and T. A. Ranney. 1998. “Sampling Trace-Level Organics with Polymeric Tubing: Part 2. Dynamic Studies.” Ground Water Monitoring and Remediation 18(1): 148–55.
Parsons. 2005. Results Report for the Demonstration of No-Purge Groundwater Sampling Devices at Former McClellan Air Force Base, California. Prepared for the U.S. Army Corps of Engineers, Air Force Center for Environmental Excellence, and Air Force Real Property Agency.
Powell, R. M., and R. W. Puls. 1993. “Passive Sampling of Ground-Water Monitoring Wells Without Purging: Multilevel Well Chemistry and Tracer Disappearance.” Journal of Contaminant Hydrology 12: 51–77.
ProHydro, Inc. 2005. Standard Operating Procedure for the Snap Sampler Passive Groundwater Sampling Method. Fairport, N.Y.: ProHydro, Inc.
Robin, M. L. J., and R. W. Gillham. 1987. “Field Evaluation of Well Purging Procedures.” Ground Water Monitoring Review 7(4): 85–93.
Vroblesky, D. A. 2001. User’s Guide for Polyethylene-Based Passive Diffusion Bag Samplers to Obtain Volatile Organic Compounds Concentrations in Wells, Part 1—Deployment, Recovery, Data Interpretation, and Quality Control and Assurance and Part 2— Field Tests. U.S. Geological Survey Water Resources Investigation Reports 01-4060 and 01-4061. Available as DSP-1, Interstate Technology & Regulatory Council, Diffusion/Passive Sampler Team, www.itrcweb.org.

ITRC – Protocol for Use of Five Passive Samplers February 2007 to Sample for a Variety of Contaminants in Groundwater
55 Regenerated-Cellulose Dialysis Membrane
5. REGENERATED-CELLULOSE DIALYSIS MEMBRANE SAMPLER
Regenerated-cellulose dialysis membrane (dialysis) samplers were developed to sample groundwater in wells for inorganic and organic constituents using a diffusion-type sampler. Prior to their development, diffusion samplers constructed with polyethylene membrane could sample for only select VOCs (Vroblesky 2001). The dialysis sampler consists of a deionized water–filled tube of high-grade regenerated-cellulose dialysis membrane inside an outer protective layer of low-density polyethylene (LDPE) mesh. Typically, the dialysis sampler is deployed in the open interval of a well at a desired sampling depth consistent with site DQOs. Once deployed, the dialysis sampler must be left in the well for sufficient time for the concentrations inside the membrane sampler to equilibrate with the concentrations of chemical constituents present in the groundwater outside the membrane sampler. After the appropriate equilibration time, the dialysis sampler is retrieved from the well, and samples are transferred to conventional sample containers, shipped to a laboratory, and analyzed. Laboratory equilibration testing has shown that dialysis samplers equilibrate within • 1–3 days for anions, silica, methane, dissolved organic carbon, all VOCs on the EPA 8260B
list (including MTBE); • 3–7 days for most cations and trace elements; • 7–14 days for most explosive compounds. A number of field comparison studies have shown that dialysis samplers can be used to collect samples for analysis of a wide variety of both organic and inorganic chemical constituents in groundwater. Field comparisons have shown that dialysis samplers recover concentrations of VOCs similar to those recovered by PDBs and low-flow purging and sampling. It has also been shown that dialysis samplers recover concentrations of most inorganic and nonvolatile organic constituents similar to those recovered by low-flow purging and sampling. Dialysis samplers have been shown to have many advantages in sampling groundwater wells. Sampling time in the field using a dialysis sampler is decreased by 67%–83% (3–6 times less) compared to sampling time in the field using a low-flow purging procedure (Imbrigiotta, Trotsky, and Place, forthcoming; Parsons 2005). Overall, collection of samples using a dialysis sampler is 50%–75% less expensive (2 to 4 times less expensive) than using low-flow purging (Imbrigiotta, Trotsky, and Place, forthcoming; Parsons 2005). Dialysis samplers eliminate purge-water production and therefore purge-water disposal costs. Dialysis membranes exclude particulates from groundwater samples due to their 0.0018-micron pore size. Therefore, dialysis samplers collect truly “dissolved” analytes, and no field filtration is required. Dialysis samplers are disposable, so there is no need for field decontamination, and no cross-contamination between wells is possible. Dialysis samplers have a few limitations. The samplers must be kept wet between the time of construction and time of deployment to preserve the permeability, flexibility, and strength of the membrane. Regenerated-cellulose dialysis membranes can biodegrade with time in groundwater

ITRC – Protocol for Use of Five Passive Samplers February 2007 to Sample for a Variety of Contaminants in Groundwater
56
systems. Depending on temperature and bacterial populations, dialysis membranes have been found to develop perforations in four to six weeks (Imbrigiotta, Trotsky, and Place, forthcoming). However, because deployment times are typically two weeks or less for all tested analytes, this is not a problem. Dialysis samplers lose a small percentage of their water volume with time (<3% per week) due to the nature of the dialysis process (Imbrigiotta, Trotsky, and Place, forthcoming). Once again, because ideal deployment times are typically two weeks or less, this is not a significant problem. Regulators at NJDEP have approved the use of dialysis samplers in 25 wells in the long-term monitoring plan of a former U.S. Navy facility in West Trenton. The contractor sampling staff saves a considerable amount of time in the field because they do not have to pump these 25 wells before collecting samples; decontaminate pumps in between these wells; or collect, transport, and treat purge water from these wells. Use of dialysis samplers is therefore saving the Navy a significant amount of money annually in field sampling costs.
5.1 Introduction to the Regenerated-Cellulose Dialysis Membrane Sampler
5.1.1 Use and Application
The dialysis sampler is a diffusion-type no-purge sampler designed to collect both inorganic and organic constituents from groundwater. Prior to its development, diffusion samplers constructed with polyethylene membrane could sample only for VOCs (Vroblesky 2001). Dialysis samplers were developed to meet the need to sample for inorganics and nonvolatile organics, particularly when evaluating natural attenuation at groundwater contamination sites. Dialysis samplers have been successfully used to sample wells for a wide variety of both organic and inorganic chemical constituents (Vroblesky, Petkewich, and Campbell 2002; Vroblesky and Pravecek 2002; Imbrigiotta et al. 2002; Vroblesky et al. 2003; Harter and Talozi 2004; Parsons 2005; Imbrigiotta, Trotsky, and Place, forthcoming). In addition, dialysis samplers have been buried in stream or lake sediments to evaluate potential source areas of groundwater contamination (George Nicholas, NJDEP, written communication, 2005; Leblanc 2003).
5.1.2 Sampler Description
The dialysis sampler consists of a deionized water–filled tube of high-grade, regenerated-cellulose, dialysis membrane inside an outer protective layer of LDPE mesh (Figure 5-1). The sampler may have protective polyvinyl chloride (PVC) supports external to the dialysis membrane in low-ionic-strength waters or an internal, perforated PVC pipe or rigid polypropylene
Figure 5-1. Regenerated-cellulose dialysis membrane sampler. (2.5 inches in diameter by 24 inches long)
ITRC – Protocol for Use of Five Passive Samplers February 2007 to Sample for a Variety of Contaminants in Groundwater
57 Regenerated-Cellulose Dialysis Membrane
mesh to support the membrane in high-ionic-strength waters. The sampler can be constructed with a valve at one end to facilitate sample transfer. Each dialysis sampler has an attached or enclosed weight to overcome its buoyancy and is suspended in a well by means of a dedicated or disposable line. Fully constructed dialysis samplers are not currently available from any commercial vendors. Regenerated-cellulose dialysis membrane can be ordered from the material vendors listed in Section 5.1.4. Purchase of precleaned dialysis membrane material is recommended, particularly if trace metals and sulfides are to be sampled, because these constituents will be present in dry, uncleaned dialysis membrane material. The dialysis membrane should have a nominal molecular weight cut-off of 8000 Daltons with an average pore size of 0.0018 μm (microns). Regenerated-cellulose dialysis membrane remains usable for one to two years if kept refrigerated in its preservative solution.
5.1.3 Applicable Analytes
Dialysis samplers have been tested and shown to be useful in sampling for both chlorinated and aromatic VOCs, major cations and anions, nutrients, most trace metals, specific conductance, TDS, dissolved organic carbon, dissolved gases, sulfide, and several explosive compounds. A more detailed listing of all chemicals evaluated for dialysis samplers in the laboratory and in the field is given later Tables 5-2 and 5-3.
5.1.4 Vendor Availability and Material Suppliers:
No commercial vendors currently provide constructed dialysis samplers. Regenerated-cellulose dialysis membrane is available from the following vendors:
Membrane Filtration Products, Inc. 314 N. River Street Seguin, TX 78155 Phone: 800-647-5758 Phone: 830-379-9170 FAX: 830-379-0720 E-mail: [email protected] Web site: www.membrane-mfpi.com Spectrum Laboratories, Inc. 23022 La Cadena Drive Laguna Hills, CA 92653 Phone: 949-581-3500 FAX: 949-855-6120 E-mail: [email protected] Web site: www.spectrapor.com

ITRC – Protocol for Use of Five Passive Samplers February 2007 to Sample for a Variety of Contaminants in Groundwater
58
Protective, flexible polyethylene mesh can be purchased from
M-Line, Inc. 3005 Interstate Parkway Brunswick, OH 44212 Phone: 330-225-8559 FAX: 330-225-6992 E-mail: [email protected] Web site: www.m-line.com
Rigid, internal-support polypropylene mesh can be purchased from
Internet, Inc. 1201 Lund Blvd. Anoka, MN 55303 Phone: 800-328-8456 FAX: 763-971-0872 E-mail: [email protected] Web site: www.internetmesh.net
5.2 Sampler Advantages
Dialysis samplers • are easy to deploy and recover; • reduce field labor costs for long-term monitoring; • do not generate purge water; • can collect samples for analysis for organic and inorganic chemical constituents; • are inexpensive and easy to assemble ($50–$70 per sampler); • can be used to sample low-yield wells; • require no field filtration; • are disposable.
5.3 Sampler Limitations
Dialysis samplers • require two trips to the field, one to deploy and one to retrieve and sample; • must be kept immersed in deionized water between construction and deployment; • can biodegrade in groundwater systems in four to six weeks; • lose a small percentage of their water volume with time (<3% per week).
5.4 Typical Sampler Deployment
The dialysis sampler is typically deployed in the open interval of a well by lowering it on a dedicated rope or line to the appropriate depth below ground surface and securing it at the

ITRC – Protocol for Use of Five Passive Samplers February 2007 to Sample for a Variety of Contaminants in Groundwater
59 Regenerated-Cellulose Dialysis Membrane
wellhead. Dialysis samplers must be allowed to equilibrate for the appropriate length of time for the constituents of interest. After equilibration, the dialysis sampler is removed from the well, the outside protective mesh is cut back, and water is drained from the device into conventional sample bottles.
5.4.1 Deployment Considerations
5.4.1.1 Deployment Depth and Vertical Profiling
As previously mentioned, for any diffusion samplers—including dialysis samplers—to work properly, they must be allowed to equilibrate with chemical concentrations in groundwater flowing naturally through the open interval of a well. The depth of deployment of a diffusion sampler is therefore crucial to collecting a formation-quality sample. The depth of deployment should not be arbitrary. The diffusion sampler can be placed at a depth where the highest mass flux of the chemicals of interest passes through the open interval of each well (ITRC 2004). This means the variation in groundwater flow and any stratification of concentrations of contaminants should be determined over the length of the open interval prior to deployment of a diffusion sampler. Vertical profiling by preferably both hydraulic and chemical methods is recommended to obtain this information. Hydraulic vertical profiling is usually done using either a straddle-packer pump or a borehole flow meter. Chemical vertical profiling is usually accomplished by equilibrating, sampling, and analyzing small, closely spaced dialysis samplers suspended over the length of the open interval of a well, for a representative indicator parameter. In addition to hydraulic and chemical vertical profiling information, some knowledge of the site geology, lithology, and past contamination history is required to make an informed decision on the depth of deployment. Based on this information, the dialysis sampler may be positioned at what is thought to be the depth of the zone of highest mass flux of the contaminant of concern, that is, the depth at which the product of the groundwater flow rate and the contaminant concentration give the highest mass per unit time.
5.4.1.2 Well diameter and depth
Dialysis samplers can be used to sample wells 2 inches or greater in diameter. Dialysis samplers have been used in wells to depths of 410 feet but should be usable at even greater depths (Imbrigiotta, Trotsky, and Place, forthcoming).
5.4.1.3 Sampler Length
Dialysis samplers can be constructed to whatever length is needed to contain the volume of water necessary for the intended analyses. Dialysis samplers as long as 4.5 feet have been constructed, deployed, and sampled successfully. However, as a matter of practicality, dialysis samplers that are greater than 3 feet in length become somewhat unwieldy and more difficult to manipulate. With longer samplers there is a concern that different chemical concentrations may be sampled by the top and bottom of the sampler. One solution is to include a clean glass marble that will mix the water inside the sampler when inverted several times prior to sampling. ITRC

ITRC – Protocol for Use of Five Passive Samplers February 2007 to Sample for a Variety of Contaminants in Groundwater
60
2004 states that a single diffusion sampler should not represent more than a 5-foot interval in a well.
5.4.1.4 Sampler Volume
The volume of water contained in a dialysis sampler can be adjusted by varying the length and diameter of the membrane used to construct it. Once constructed, the volume of the sampler is fixed. For this reason, it is important to carefully determine the minimum volume (see the Diffusion/Passive Sampler Team Web page or Appendix A of this guidance) of water needed for all the chemical analyses intended for this sample before sampler construction begins. In fact, this minimum volume should be increased by 10%–20% to compensate for volume used to rinse bottles or losses during sample handling in the field. Dialysis membrane can be purchased in several different widths. Table 5-1 gives the filled diameters and volumes of the two common widths used to construct samplers for 2- and 4-inch-diameter wells.
Table 5-1. Dialysis membrane widths, filled diameters, and filled volumes Filled diameter Filled volume Well
diameter (inches)
Lay-flat width (mm) (mm) (inches) (mL/cm) (mL/foot)
2 50 31.8 1.25 7.94 242 4 100 63.7 2.5 31.87 971
For example, dialysis samplers made to fit in 2-inch and 4-inch-diameter wells that are 24.8 in (63 cm) long will contain volumes of 500 mL and 2007 mL, respectively.
5.4.1.5 Sampler Construction
Dialysis samplers cannot currently be purchased as a unit. The materials must be purchased and the samplers constructed prior to deployment. Sampler construction should take place under clean conditions in a laboratory equipped with a source of high-quality, deionized water. Section 5.4.2 gives details of dialysis sampler assembly.
5.4.1.6 Sampler Hydration
Dialysis samplers should be constructed within a few weeks of deployment and must be kept immersed in deionized water between construction and deployment. If allowed to dry, the material becomes stiff and brittle, and the membrane’s diffusive properties change. Section 5.4.2 discusses methods for keeping dialysis samplers hydrated.
5.4.1.7 Sampler Equilibration Time
Table 5-2 summarizes all the chemical constituents that have been equilibration tested in laboratory studies for dialysis samplers. The length of time necessary for different chemical constituents to equilibrate through dialysis membranes has been determined in several laboratory
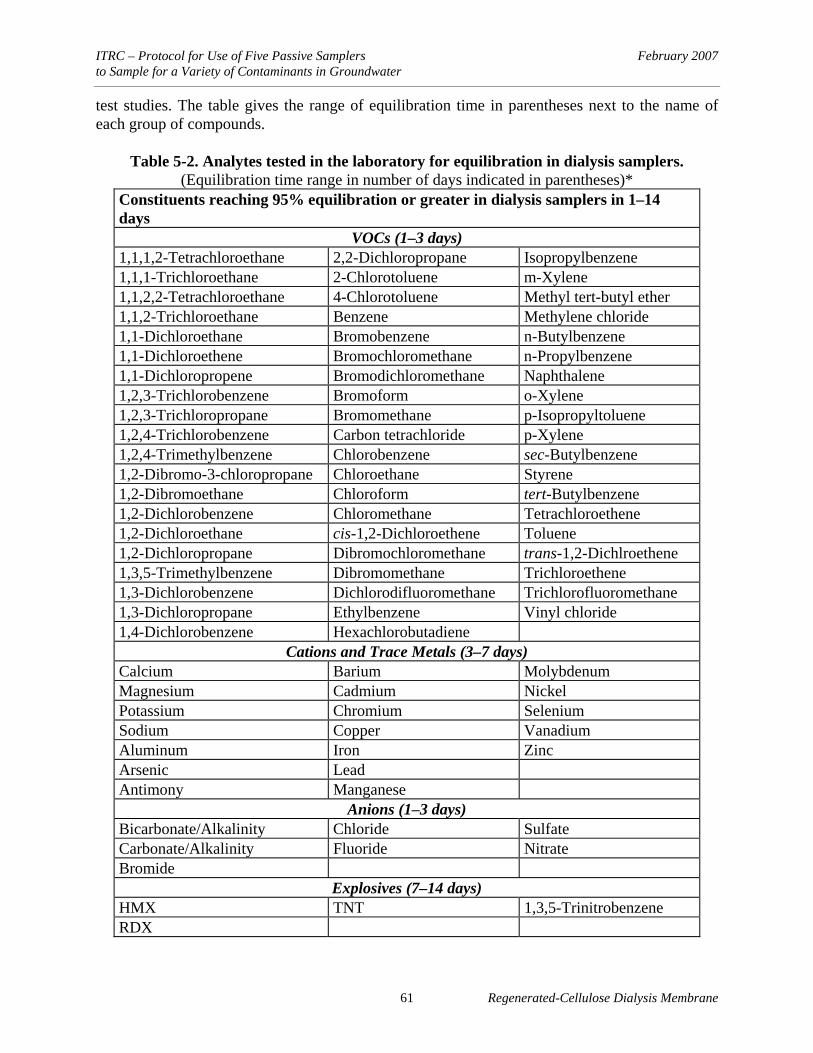
ITRC – Protocol for Use of Five Passive Samplers February 2007 to Sample for a Variety of Contaminants in Groundwater
61 Regenerated-Cellulose Dialysis Membrane
test studies. The table gives the range of equilibration time in parentheses next to the name of each group of compounds.
Table 5-2. Analytes tested in the laboratory for equilibration in dialysis samplers. (Equilibration time range in number of days indicated in parentheses)*
Constituents reaching 95% equilibration or greater in dialysis samplers in 1–14 days
VOCs (1–3 days) 1,1,1,2-Tetrachloroethane 2,2-Dichloropropane Isopropylbenzene 1,1,1-Trichloroethane 2-Chlorotoluene m-Xylene 1,1,2,2-Tetrachloroethane 4-Chlorotoluene Methyl tert-butyl ether 1,1,2-Trichloroethane Benzene Methylene chloride 1,1-Dichloroethane Bromobenzene n-Butylbenzene 1,1-Dichloroethene Bromochloromethane n-Propylbenzene 1,1-Dichloropropene Bromodichloromethane Naphthalene 1,2,3-Trichlorobenzene Bromoform o-Xylene 1,2,3-Trichloropropane Bromomethane p-Isopropyltoluene 1,2,4-Trichlorobenzene Carbon tetrachloride p-Xylene 1,2,4-Trimethylbenzene Chlorobenzene sec-Butylbenzene 1,2-Dibromo-3-chloropropane Chloroethane Styrene 1,2-Dibromoethane Chloroform tert-Butylbenzene 1,2-Dichlorobenzene Chloromethane Tetrachloroethene 1,2-Dichloroethane cis-1,2-Dichloroethene Toluene 1,2-Dichloropropane Dibromochloromethane trans-1,2-Dichlroethene 1,3,5-Trimethylbenzene Dibromomethane Trichloroethene 1,3-Dichlorobenzene Dichlorodifluoromethane Trichlorofluoromethane 1,3-Dichloropropane Ethylbenzene Vinyl chloride 1,4-Dichlorobenzene Hexachlorobutadiene
Cations and Trace Metals (3–7 days) Calcium Barium Molybdenum Magnesium Cadmium Nickel Potassium Chromium Selenium Sodium Copper Vanadium Aluminum Iron Zinc Arsenic Lead Antimony Manganese
Anions (1–3 days) Bicarbonate/Alkalinity Chloride Sulfate Carbonate/Alkalinity Fluoride Nitrate Bromide
Explosives (7–14 days) HMX TNT 1,3,5-Trinitrobenzene RDX

ITRC – Protocol for Use of Five Passive Samplers February 2007 to Sample for a Variety of Contaminants in Groundwater
62
Other Parameters (1–3 days) Silica Methane Specific conductance Dissolved organic carbon Sulfide Constituents reaching 95% equilibrium or greater in dialysis samplers in 28 days or more
Trace elements (>28 days) Mercury Silver Tin
*The range in days considers variations between constituents in a group or variations caused by high and low contaminant concentrations and temperatures.
Ehlke, Imbrigiotta, and Dale (2004) tested the permeability of the regenerated-cellulose dialysis membrane for iron, bromide, and six chlorinated VOCs in the laboratory at 21°C. They found that iron and bromide equilibrated within 3–7 days and the six chlorinated VOCs equilibrated within 1–3 days. Vroblesky, Petkewich, and Campbell (2002) lab-tested the permeability of the dialysis membrane and equilibration times for arsenic, chloride, chromium, iron, lead, manganese, selenium, and sulfate at room temperature. All of these inorganic constituents equilibrated within approximately 1–4 days. Harter and Talozi (2004) tested the equilibration times for nitrate and specific conductance in dialysis samplers and found both equilibrated within 1 day. Imbrigiotta, Trotsky, and Place (forthcoming) tested the permeability of dialysis membrane for 59 VOCs, major cations and anions, trace elements, dissolved organic carbon, methane, and sulfide and determined equilibration times for these constituents. These tests were done at two temperatures (10°C and 21°C) and at two different concentrations. Results at all temperatures and concentrations showed equilibration within 1–3 days for anions, silica, methane, dissolved organic carbon, and all VOCs on the EPA 8260b list (including MTBE) and 3–7 days for most cations and trace elements. Sulfide had a mixed result, with one test showing equilibration within 1 day and another test showing no equilibration after 28 days. Mercury, silver, and tin were the only trace elements that did not equilibrate within 28 days. Equilibration times for selected explosive compounds through dialysis membranes were tested by LeBlanc (2003). These tests, run at 4°C, revealed that HMX (oxyhydro 1,3,5,7-tetranitro-1,3,5,7-triazine) and RDX (2,3,5-trinitro-1,3,5 triazine) were 75%–80% equilibrated after 12 days. More recently, Parker and Mulherin (2006) conducted laboratory equilibration tests for HMX, 1,3,5-trinitrobenzene, RDX, and TNT (trinitrotoluene) at room temperature and found these explosive compounds equilibrated in dialysis samplers within 7–14 days.
5.4.1.8 Biodegradation of Dialysis Membrane
Several previous studies of dialysis samplers noted that dialysis membranes became discolored or biofouled during extended equilibration periods ranging from two to three weeks in shallow wells with warm groundwater temperatures (~21°C) (Vroblesky, Petkewich, and Campbell 2002; Vroblesky and Pravacek 2002; Vroblesky et al. 2003). Imbrigiotta, Trotsky, and Place (forthcoming) compared biodegradation of four identical dialysis samplers in an anaerobic 75-foot-deep well with an average groundwater temperature of ~15°C at the Naval Air Warfare Center, West Trenton, New Jersey site. The samplers were removed and weighed at approximately one-week intervals and then redeployed in the same well. Discoloration was

ITRC – Protocol for Use of Five Passive Samplers February 2007 to Sample for a Variety of Contaminants in Groundwater
63 Regenerated-Cellulose Dialysis Membrane
noted after one week but did not appear to become any more severe with time. The first perforations were observed in one sampler after four weeks. The other three samplers developed perforations over the course of the next two weeks. The authors concluded that dialysis samplers should retain their structural integrity for at least four weeks in an anaerobic well at ~15°C before biodegradation would compromise the membrane. These findings imply that biodegradation should not be a significant limitation for dialysis samplers if one- to two-week deployments are used.
5.4.1.9 Volume Loss due to the Dialysis Process
The process of dialysis through the regenerated-cellulose membrane occurs in both directions simultaneously. At the same time the ions in well water are diffusing inward to equilibrate inside the sampler, the deionized water is slowly diffusing outward, essentially trying to dilute the aquifer to deionized water. Previous studies pointed out this loss of sampler volume during the equilibration period in wells with high-ionic-strength groundwaters (Vroblesky, Petkewich, and Campbell 2002; Vroblesky and Pravacek 2002; Vroblesky et al. 2003). The volume lost was determined in these studies to be severe enough to warrant the insertion of a rigid support inside the regenerated-cellulose membrane to limit the collapse of the sampler to a set volume. Imbrigiotta, Trotsky, and Place (forthcoming) used dialysis samplers to sample wells in the coastal plain and bedrock aquifers of New Jersey, where dissolved solids concentrations were not particularly high (<500 mg/L) and to sample wells in the coastal plain aquifer at Port Hueneme, California, near the Pacific Ocean, where TDS concentrations were much higher (up to 2300 mg/L). All samplers were constructed without internal rigid supports and were weighed prior to deployment. Samplers were reweighed in the field immediately after retrieval from a well. The weight differences for 28 different dialysis samplers showed an average volume loss of 2.7% per week. The volume loss only in the high dissolved solids wells at the Port Hueneme site ranged from 0%–7% per week. From these findings, it was concluded that the volume loss due to dialysis appeared to be small even for wells with dissolved solids concentrations as high as 2300 mg/L. The <3% volume loss per week was not considered a limitation for dialysis samplers since one- to two-week deployment periods were sufficient for most constituents measured.
5.4.2 Construction of a Dialysis Sampler
5.4.2.1 Materials
Because fully constructed dialysis samplers are not currently available from any commercial vendors, regenerated-cellulose dialysis membrane must be ordered from material vendors such as those mentioned in Section 5.1.4. Purchase of precleaned dialysis membrane material from the manufacturer is recommended for use in constructing dialysis samplers. Precleaned, regenerated-cellulose dialysis membrane remains usable for one to two years if kept refrigerated in its preservative solution of ethanol, sodium benzoate, and ethylenediaminetetraacetic acid (EDTA). Alternatively, the membrane can be purchased dry but then must be cleaned in a series of steps that includes soaking and rinsing in deionized water, heated sodium bicarbonate solution, EDTA, and sodium azide solution to remove residual gylcerol, sulfide, cadmium, chromium, copper, iron, nickel, zinc, and lead (Don Keil, Membrane Filtration Products, Inc., written

ITRC – Protocol for Use of Five Passive Samplers February 2007 to Sample for a Variety of Contaminants in Groundwater
64
communication, 2002). The precleaned dialysis membrane costs slightly more than the dry membrane but more than makes up the difference in preparation time saved. The regenerated-cellulose dialysis membrane used to construct dialysis samplers has an average pore size of 0.0018 μm and a molecular weight cut-off of 8000 Daltons. Dialysis samplers have been constructed using membranes both 50 mm and 100 mm in width. These two sizes result in filled diameters that will fit down 2- and 4-inch wells, respectively (see Table 5-1).
5.4.2.2 Sampler Assembly
Dialysis sampler construction should take place in clean conditions (e.g., in a laboratory or another controlled environment). The user should wear clean, disposable gloves while assembling the sampler to avoid contamination. It is very important to have a source of high-quality, deionized water available when assembling, filling, and storing dialysis samplers. The following steps should be followed in assembling a dialysis sampler: (1) Cut the regenerated-cellulose
membrane to a length long enough to enclose the volume needed for all analyses at a particular well and site (Section 5.4.1.3).
(2) Rinse the membrane thoroughly with deionized water at least five times to remove the preservative solution it is shipped in.
(3) For low-ionic-strength wells, tie a knot or clamp one end of the rinsed membrane and clamp to a disposable PVC valve at the opposite end.
(4) Cut a length of protective LDPE mesh slightly longer than the membrane.
(5) Install external PVC supports in the ends of the mesh (Figures 5-2 and 5-3). This mesh protects the dialysis membrane from abrasion against the well casing and screen during deployment and retrieval, and the external PVC supports relieve pressure from the mesh on the ends of the dialysis membrane.
Figure 5-2. Parts of a dialysis sampler before assembly.(~2.5 inches in diameter by 24 inches long)
Figure 5-3. Partially assembled dialysis sampler before filling with deionized water with external
supports installed in the protective mesh. (~2.5 inches in diameter by 24 inches long)
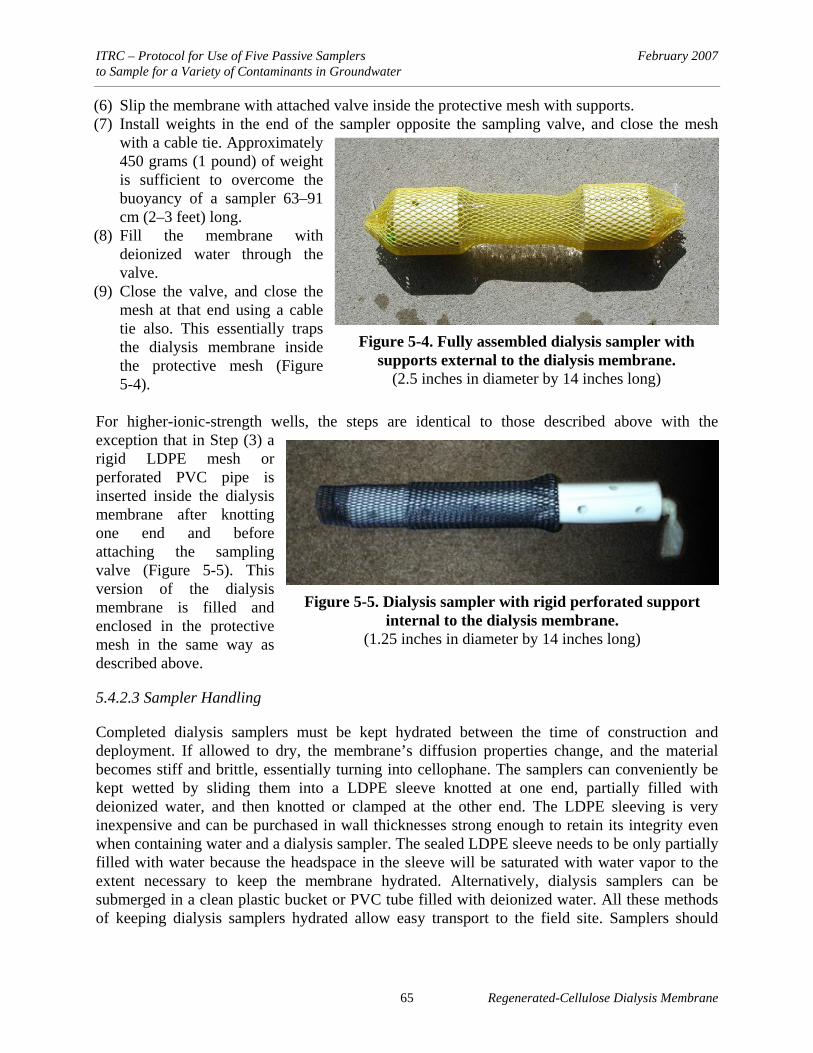
ITRC – Protocol for Use of Five Passive Samplers February 2007 to Sample for a Variety of Contaminants in Groundwater
65 Regenerated-Cellulose Dialysis Membrane
(6) Slip the membrane with attached valve inside the protective mesh with supports. (7) Install weights in the end of the sampler opposite the sampling valve, and close the mesh
with a cable tie. Approximately 450 grams (1 pound) of weight is sufficient to overcome the buoyancy of a sampler 63–91 cm (2–3 feet) long.
(8) Fill the membrane with deionized water through the valve.
(9) Close the valve, and close the mesh at that end using a cable tie also. This essentially traps the dialysis membrane inside the protective mesh (Figure 5-4).
For higher-ionic-strength wells, the steps are identical to those described above with the exception that in Step (3) a rigid LDPE mesh or perforated PVC pipe is inserted inside the dialysis membrane after knotting one end and before attaching the sampling valve (Figure 5-5). This version of the dialysis membrane is filled and enclosed in the protective mesh in the same way as described above.
5.4.2.3 Sampler Handling
Completed dialysis samplers must be kept hydrated between the time of construction and deployment. If allowed to dry, the membrane’s diffusion properties change, and the material becomes stiff and brittle, essentially turning into cellophane. The samplers can conveniently be kept wetted by sliding them into a LDPE sleeve knotted at one end, partially filled with deionized water, and then knotted or clamped at the other end. The LDPE sleeving is very inexpensive and can be purchased in wall thicknesses strong enough to retain its integrity even when containing water and a dialysis sampler. The sealed LDPE sleeve needs to be only partially filled with water because the headspace in the sleeve will be saturated with water vapor to the extent necessary to keep the membrane hydrated. Alternatively, dialysis samplers can be submerged in a clean plastic bucket or PVC tube filled with deionized water. All these methods of keeping dialysis samplers hydrated allow easy transport to the field site. Samplers should
Figure 5-4. Fully assembled dialysis sampler with supports external to the dialysis membrane.
(2.5 inches in diameter by 14 inches long)
Figure 5-5. Dialysis sampler with rigid perforated support internal to the dialysis membrane.
(1.25 inches in diameter by 14 inches long)
ITRC – Protocol for Use of Five Passive Samplers February 2007 to Sample for a Variety of Contaminants in Groundwater
66
wear clean disposable gloves when deploying dialysis samplers. Sharp objects or tools that could puncture the dialysis membrane should be avoided.
5.4.2.4 Samplers for Anoxic Wells
Dialysis samplers should be filled or equilibrated with deoxygenated, deionized water if the sampler is to be deployed in an anoxic well where redox-active constituents, such as iron, are to be sampled. Filling water can be deoxygenated by sparging it with nitrogen or helium. Newly constructed samplers can be filled with deoxygenated water and stored overnight prior to deployment in anoxic wells. Previously constructed samplers can be reequilibrated in deoxygenated water overnight prior to deployment in anoxic wells.
5.4.2.5 Suspension Line
Dialysis samplers are suspended in a well by attachment to a disposable or dedicated line. Polypropylene rope, stainless steel cable, or plastic-coated galvanized cable can all be used as suspension lines. The suspension line must be measured and marked so the sampler can easily be set at the desired depth in the well. The usual convention is to mark land surface as zero and mark every 10 feet until the depth to the top of the sampler is reached. Suspension lines or ropes are attached in the field just before deployment of the dialysis sampler in a well.
5.4.3 Deployment Steps
5.4.3.1 Initial Well Measurements
The depth to water, total depth of the well, and the depth of the open or screened interval must be determined prior to the installation of the dialysis samplers to ensure that the desired depth of the dialysis sampler is submerged below the water level in the well and is located within the screened or open interval of the well.
5.4.3.2 Installation of the Sampler
The dialysis sampler is attached to the previously measured suspension line at the appropriate depth using cable ties or stainless steel clips. The line is tied through either the mesh or one of the external supports. The sampler is then simply lowered slowly into the well. Once submerged in the water column, the dialysis sampler should easily sink to the desired depth. The sampler is lowered until the zero point on the line is at land surface. The suspension line must be secured to the casing at land surface during the period of equilibration. The installation of dialysis samplers is easily accomplished by one person.
5.4.4 Sample Recovery
5.4.4.1 Retrieving and Emptying Dialysis Samplers
In the field, after the appropriate equilibration and restabilization time, the dialysis sampler is retrieved by pulling up the line on which it is suspended. Once the sampler is at the surface, observations as to any significant reduction in the volume of the sampler, the presence of any

ITRC – Protocol for Use of Five Passive Samplers February 2007 to Sample for a Variety of Contaminants in Groundwater
67 Regenerated-Cellulose Dialysis Membrane
perforations in the membrane, or the presence of biological growth on the membrane should be documented prior to collection of the samples. The dialysis sampler is suspended on a hook or held up so the emptying valve end is pointing downward. The protective mesh is cut away from the lower end to allow access to the emptying valve. The valve is rinsed with deionized water to remove any particulates that may have collected in it while suspended in the well. An extension tube is inserted into the valve to help prevent splashing and to direct the flow of water from the sampler. Samples are collected by opening the emptying valve and collecting the water from the sampler in conventional sample containers. Use of the emptying valve allows easy and quick transfer of the sample while minimizing its exposure to the atmosphere. If the dialysis sampler is not equipped with an emptying valve, the membrane must be opened by unclipping or cutting one end and pouring the sample carefully into the sample containers, taking care not to splash or aerate the sample during the sample transfer process. Dialysis samplers should be sampled as soon as possible after removal from the well to minimize any potential loss of volatile compounds or change in redox-active chemical species. Dialysis sampler recovery and sampling is easily accomplished by two persons wearing clean, disposable gloves.
5.4.4.2 Disposal and Decontamination
If the dialysis sampler is sized correctly for the number and type of sample bottles being filled, essentially no water or only a minimal amount of water should remain at the end of sample transfer. The dialysis membrane, protective mesh, emptying valve, and clamp can all be discarded after the sample is collected. The suspension line can be dedicated to the well it was used in originally for subsequent samplings. The weights used may be retained and cleaned so they can be used in subsequent samplings.
5.5 Determining Applicability of Sampler and Interpretation of Data
Dialysis samplers have been tested in a number of field comparison studies against low-flow because that has been EPA’s standard method recommended for sampling wells (Puls and Barcelona 1996). Results obtained from dialysis samplers sometimes disagree with low-flow purging and other sampling methods. Explanation of the differences can help understand situations where dialysis samplers may or may not be more appropriate than other sampling methods. The effects of vertical chemical stratification and hydraulic heterogeneities over the length of the well screen or open interval are especially important considerations. A variety of field studies have compared dialysis samplers to low-flow purging, PDB samplers, and other types of no-purge samplers in their ability to sample for a wide variety of common inorganic constituents and VOCs. Results of those studies are summarized in this section. Dialysis samplers have been tested and reported on at the following sites: Naval Air Warfare Center, West Trenton, N.J. (9 wells, Imbrigiotta et al. 2002); Naval Industrial Ordnance Plant, Fridley, Minn. (2 wells; Vroblesky, Petkewich, and Campbell 2002); Hickam AFB, Hawaii (13 wells, Vroblesky and Pravecek 2002); Davis, Calif. (43 wells, Harter and Talozi 2004); Massachusetts Military Reservation, Cape Cod, Mass. (130 samplers buried in lake sediments, Leblanc 2003); Andersen AFB, Guam (5 wells, Vroblesky et al. 2003); McClellan AFB, Calif.

ITRC – Protocol for Use of Five Passive Samplers February 2007 to Sample for a Variety of Contaminants in Groundwater
68
(20 wells, Parsons 2005); and Naval Air Engineering Station, Lakehurst, N.J. (6 wells), Naval Base Ventura County, Port Hueneme, Calif. (8 wells), and Naval Air Warfare Center, West Trenton, N.J. (8 wells; Imbrigiotta, Trotsky, and Place, forthcoming). The field comparison study conducted at the Naval Air Warfare Center, West Trenton, N.J. (Imbrigiotta et al. 2002) sampled nine wells twice with dialysis samplers, low-flow purging, and a modified conventional purge method for chlorinated VOCs, calcium, chloride, iron, and alkalinity. The dialysis sampler results compared very favorably (no statistical difference at p < 0.05) with the purging techniques for all these constituents. Figure 5-6 shows the comparison between dialysis sampler results and low-flow purging results for cis-1,2-DCE in wells sampled in this study.
In a field comparison study at the Naval Industrial Reserve Ordnance Plant, Fridley, Minn. (Vroblesky, Petkewich, and Campbell 2002), dialysis samplers were compared to low-flow purging and nylon screen samplers in their ability to sample two wells for arsenic, calcium, chloride, iron, manganese, and sulfate. In general, results for all these inorganic constituents obtained with both the dialysis sampler and the nylon screen sampler agreed well with results from low-flow purging in these wells.
Well Sampling Technique Comparison cis-1,2-dichloroethene 2000-2002
0.01
0.10
1.00
10.00
100.00
1000.00
10000.00
100000.00
0.01 0.10 1.00 10.00 100.00 1000.00 10000.00 100000.00
Dialysis Membrane Diffusion Sampler cisDCE (μg/L)
Low
-Flo
w P
urgi
ng
cisD
CE
( μg/
L)
Figure 5-6. A 1:1 correspondence plot comparing cis-1,2-dichloroethene results in dialysis sampler and low-flow purging samples from wells at the Naval Air Warfare Center, West Trenton, New Jersey, 2000–2002. (Sources: Imbrigiotta et al. 2002 and
Imbrigiotta, unpublished data)

ITRC – Protocol for Use of Five Passive Samplers February 2007 to Sample for a Variety of Contaminants in Groundwater
69 Regenerated-Cellulose Dialysis Membrane
In another study conducted at Hickam Air Force Base, Hawaii (Vroblesky and Pravecek 2002), 13 wells were sampled with dialysis samplers, PDB samplers, and low-flow purging for aromatic VOCs, alkalinity, arsenic, chloride, iron, lead, methane, sulfate, sulfide, and zinc. Results showed generally favorable comparisons between VOC samples collected with all three sampling techniques and inorganics collected with the dialysis sampler and low-flow purging. A study by Harter and Talozi (2004) compared dialysis samplers to conventional purging in 43 wells in sampling for specific conductance and nitrate. Dialysis samplers compared favorably with a conventional 5–10 volume purge technique for these two water-quality parameters. LeBlanc (2003) buried dialysis samplers in the sediments of a lake near the Massachusetts Military Reservation, Cape Cod, Mass. to determine whether explosive compounds in groundwater from the base were discharging into the lake. More than 130 dialysis samplers were installed in the lake sediments and allowed to equilibrate for 13–27 days before retrieval and sampling. The results were compared with a like number of drive-point pore water samples collected from the pore sediments of the lake adjacent to the locations where the dialysis samplers had been buried. Many samplers were broken prior to sample recovery and the author attributed it to biodegradation effects. The author suspected that bacterial action on buried dialysis samplers contributed to making the membranes more brittle and easily breakable. Four explosive compounds were detected at low concentrations in samples from the dialysis samplers. No explosive compounds were detected in samples from the drive-point water samples. Because so few comparisons resulted, no conclusions were made about the applicability of dialysis samplers to sample for explosives in this manner. Five wells were sampled for chlorinated VOCs and chloride at Andersen Air Force Base, Guam, using dialysis samplers, PDB samplers, nylon screen samplers, and low-flow purging (Vroblesky et al. 2003). Dialysis samplers were found to recover chloride concentrations as well as low-flow purging did. However, dialysis samplers were found to generally recover lower chlorinated VOC concentrations when compared to both PDBs and low-flow purging. The reason for the disagreement was postulated as due to the use of longer equilibration time in this study (22–23 days), possibly allowing degradation of the membrane to influence the contaminant concentrations (Vroblesky et al. 2003). A study comparing a number of different diffusion samplers and purging technologies was conducted in 20 wells at McClellan Air Force Base, Sacramento, Calif. (Parsons 2005). Dialysis samplers, PDB samplers, RPP samplers, polysulfone samplers, the Snap sampler, the Hydrasleeve sampler, low-flow purging, and conventional purging were all compared in their ability to sample for anions, trace metals, hexavalent chromium, 1,4-dioxane, and VOCs. Results of this study indicated that dialysis samplers recovered concentrations of VOCs, anions, 1,4-dioxane, and hexavalent chromium as well as or better than low-flow purging. Dialysis samplers generally recovered lower concentrations of trace metals than low-flow purging in their tests. However, metals were treated as a lumped parameter in this study’s statistical evaluation, so it is difficult to determine whether only certain metals or all metals were problematic. Overall, the dialysis sampler was rated equal to low-flow purging in ability to recover chemical concentrations in this study.
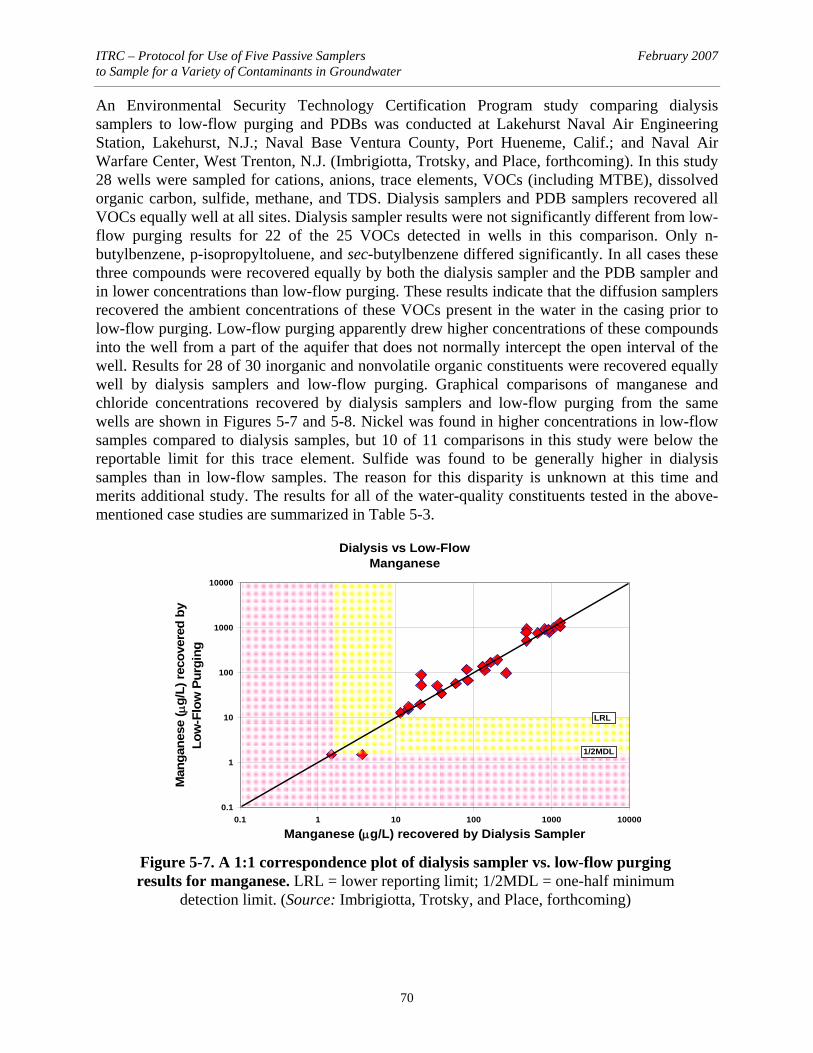
ITRC – Protocol for Use of Five Passive Samplers February 2007 to Sample for a Variety of Contaminants in Groundwater
70
An Environmental Security Technology Certification Program study comparing dialysis samplers to low-flow purging and PDBs was conducted at Lakehurst Naval Air Engineering Station, Lakehurst, N.J.; Naval Base Ventura County, Port Hueneme, Calif.; and Naval Air Warfare Center, West Trenton, N.J. (Imbrigiotta, Trotsky, and Place, forthcoming). In this study 28 wells were sampled for cations, anions, trace elements, VOCs (including MTBE), dissolved organic carbon, sulfide, methane, and TDS. Dialysis samplers and PDB samplers recovered all VOCs equally well at all sites. Dialysis sampler results were not significantly different from low-flow purging results for 22 of the 25 VOCs detected in wells in this comparison. Only n-butylbenzene, p-isopropyltoluene, and sec-butylbenzene differed significantly. In all cases these three compounds were recovered equally by both the dialysis sampler and the PDB sampler and in lower concentrations than low-flow purging. These results indicate that the diffusion samplers recovered the ambient concentrations of these VOCs present in the water in the casing prior to low-flow purging. Low-flow purging apparently drew higher concentrations of these compounds into the well from a part of the aquifer that does not normally intercept the open interval of the well. Results for 28 of 30 inorganic and nonvolatile organic constituents were recovered equally well by dialysis samplers and low-flow purging. Graphical comparisons of manganese and chloride concentrations recovered by dialysis samplers and low-flow purging from the same wells are shown in Figures 5-7 and 5-8. Nickel was found in higher concentrations in low-flow samples compared to dialysis samples, but 10 of 11 comparisons in this study were below the reportable limit for this trace element. Sulfide was found to be generally higher in dialysis samples than in low-flow samples. The reason for this disparity is unknown at this time and merits additional study. The results for all of the water-quality constituents tested in the above-mentioned case studies are summarized in Table 5-3.
Dialysis vs Low-Flow Manganese
0.1
1
10
100
1000
10000
0.1 1 10 100 1000 10000
Manganese (μg/L) recovered by Dialysis Sampler
Man
gane
se ( μ
g/L)
reco
vere
d by
Lo
w-F
low
Pur
ging
LRL
1/2MDL
Figure 5-7. A 1:1 correspondence plot of dialysis sampler vs. low-flow purging results for manganese. LRL = lower reporting limit; 1/2MDL = one-half minimum
detection limit. (Source: Imbrigiotta, Trotsky, and Place, forthcoming)

ITRC – Protocol for Use of Five Passive Samplers February 2007 to Sample for a Variety of Contaminants in Groundwater
71 Regenerated-Cellulose Dialysis Membrane
Table 5-3. Water-quality parameters tested in field comparison studies of dialysis samplers and purging methods
Parameters with favorable field comparison results for dialysis samplers vs. purging methods
VOCs 1,1,1-Trichloroethane cis-1,2-Dichloroethene o-Xylene 1,1-Dichloroethane Dichlorodifluoromethane p-Xylene 1,1-Dichloroethene Ethylbenzene Styrene 1,2,4-Trimethylbenzene Isopropylbenzene tert-Butylbenzene 1,2-Dibromoethane m-Xylene Tetrachloroethene 1,3,5-Trimethylbenzene Methyl tert-butyl ether Toluene Benzene Methylene chloride trans-1,2-Dichloroethene Chloroform n-Propylbenzene Trichloroethene Chloromethane Naphthalene Vinyl chloride
Cations and Trace Metals Calcium Antimony Lead Magnesium Barium Manganese Potassium Cadmium Molybdenum Sodium Chromium Selenium Aluminum Copper Vanadium Arsenic Iron Zinc
Dialysis vs Low-Flow Chloride
0.1
1
10
100
1000
0.1 1 10 100 1000
Chloride (mg/L) recovered by Dialysis Sampler
Chl
roid
e (m
g/L)
reco
vere
d b
y Lo
w-F
low
Pur
ging
LRL
1/2MDL
Figure 5-8. A 1:1 correspondence plot of dialysis sampler vs. low-flow purging results for chloride. LRL = lower reporting limit; 1/2MDL = one-half minimum detection limit. (Source: Source: Imbrigiotta, Trotsky, and Place, forthcoming)
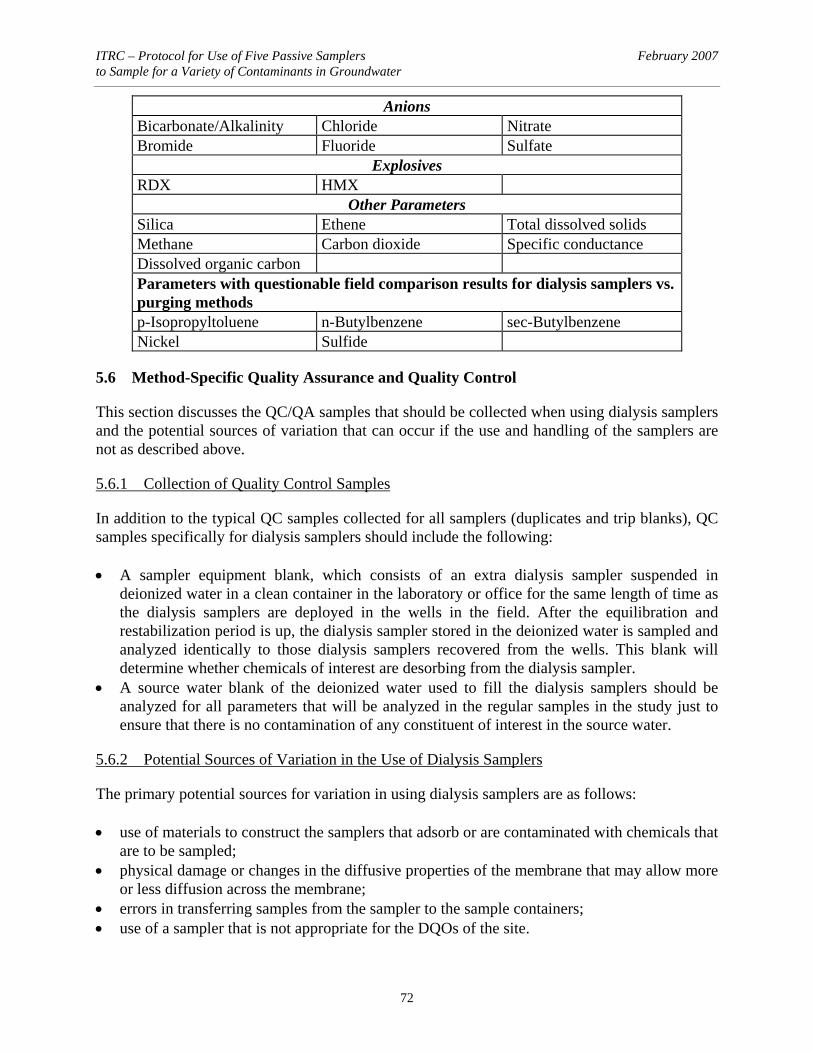
ITRC – Protocol for Use of Five Passive Samplers February 2007 to Sample for a Variety of Contaminants in Groundwater
72
Anions Bicarbonate/Alkalinity Chloride Nitrate Bromide Fluoride Sulfate
Explosives RDX HMX
Other Parameters Silica Ethene Total dissolved solids Methane Carbon dioxide Specific conductance Dissolved organic carbon Parameters with questionable field comparison results for dialysis samplers vs. purging methods p-Isopropyltoluene n-Butylbenzene sec-Butylbenzene Nickel Sulfide
5.6 Method-Specific Quality Assurance and Quality Control
This section discusses the QC/QA samples that should be collected when using dialysis samplers and the potential sources of variation that can occur if the use and handling of the samplers are not as described above.
5.6.1 Collection of Quality Control Samples
In addition to the typical QC samples collected for all samplers (duplicates and trip blanks), QC samples specifically for dialysis samplers should include the following: • A sampler equipment blank, which consists of an extra dialysis sampler suspended in
deionized water in a clean container in the laboratory or office for the same length of time as the dialysis samplers are deployed in the wells in the field. After the equilibration and restabilization period is up, the dialysis sampler stored in the deionized water is sampled and analyzed identically to those dialysis samplers recovered from the wells. This blank will determine whether chemicals of interest are desorbing from the dialysis sampler.
• A source water blank of the deionized water used to fill the dialysis samplers should be analyzed for all parameters that will be analyzed in the regular samples in the study just to ensure that there is no contamination of any constituent of interest in the source water.
5.6.2 Potential Sources of Variation in the Use of Dialysis Samplers
The primary potential sources for variation in using dialysis samplers are as follows: • use of materials to construct the samplers that adsorb or are contaminated with chemicals that
are to be sampled; • physical damage or changes in the diffusive properties of the membrane that may allow more
or less diffusion across the membrane; • errors in transferring samples from the sampler to the sample containers; • use of a sampler that is not appropriate for the DQOs of the site.

ITRC – Protocol for Use of Five Passive Samplers February 2007 to Sample for a Variety of Contaminants in Groundwater
73 Regenerated-Cellulose Dialysis Membrane
Variation in results between duplicate dialysis sampler results may be due to the following: • Samplers are not constructed identically from the same materials. • Samplers are not assembled in the same way. • Duplicate dialysis samplers cannot be suspended at the same depth in a well. • One duplicate sampler is recovered from a well and sampled immediately, while the other
duplicate sampler sits out exposed to the atmosphere before it is sampled.
5.7 Dialysis Sampler References
Ehlke, T. A., T. E. Imbrigiotta, and J. M. Dale. 2004. “Laboratory Comparison of Polyethylene and Dialysis Membrane Diffusion Samplers.” Ground Water Monitoring and Remediation 34(1): 53–59.
Harter, T., and S. Talozi. 2004. “Evaluation of a Simple Inexpensive Dialysis Sampler for Small Diameter Monitoring Wells.” Ground Water Monitoring and Remediation 24(4): 97–105.
Hopner, T. 1981. “Design and Use of a Diffusion Sampler for Interstitial Water from Fine-Grained Sediments.” Environmental Technology Letters 2: 187–96.
Imbrigiotta, T. E., T. A. Ehlke, P. J. Lacombe, and J. M. Dale. 2002. “Comparison of Dialysis Membrane Diffusion Samplers and Two Purging Methods in Bedrock Wells.” In Remediation of Chlorinated and Recalcitrant Compounds: Proceedings, 3rd International Conference on Remediation of Chlorinated and Recalcitrant Compounds, Monterey, Calif., A. R. Gavaskar and A. S. C. Chen, eds.
Imbrigiotta, T. E., J. S. Trotsky, and M. Place. Forthcoming. Demonstration and Validation of a Regenerated-Cellulose Dialysis Membrane Diffusion Sampler for Monitoring Groundwater Quality and Remediation Progress at DoD Sites. Final Technical Report for ESTCP Project CU-0313.
ITRC. 2004. Technical and Regulatory Guidance for Using Polyethylene Diffusion Bag Samplers to Monitor for Volatile Organic Compounds in Groundwater. DSP-3. Washington, D.C.: Interstate Technology & Regulatory Council, Diffusion/Passive Sampler Team. www.itrcweb.org.
LeBlanc, D. R. 2003. Diffusion and Drive-Point Sampling to Detect Ordnance-Related Compounds in Shallow Ground Water Beneath Snake Pond, Cape Cod, Massachusetts, 2001–2002. U.S. Geological Survey Water Resources Investigations Report 03-4133.
Magaritz, M., M. Wells, A. J. Amiel, and D. Ronen. 1989. “Application of a Multi-Layer Sampler Based on the Dialysis Cell Technique for the Study of Trace Metals in Groundwater.” Applied Geochemistry 4: 617–24.
Martens, C. S., and J. V. Klump. 1980. “Biogeochemical Cycling in an Organic-Rich Coastal Marine Basin; 1. Methane Sediment-Water Exchange Processes.” Geochimica et Cosmochimica Acta 44: 471–90.
Parker, L. V., and N. D. Mulherin. 2006. “Preliminary Studies of Alternative Passive Diffusion Devices for Sampling Explosives.” In Proceedings, 2006 North American Environmental Field Conference and Exposition, Tampa, Fla.
Parsons. 2005. Results Report for the Demonstration of No-Purge Groundwater Sampling Devices at Former McClellan Air Force Base, California. Prepared for the U.S. Army Corps
ITRC – Protocol for Use of Five Passive Samplers February 2007 to Sample for a Variety of Contaminants in Groundwater
74
of Engineers, Air Force Center for Environmental Excellence, and Air Force Real Property Agency.
Puls, R. W., and M. J. Barcelona. 1996. Low-Flow (Minimal Draw-Down) Ground-Water Sampling Procedures. EPA/540/S-95/504.
Ronen, D., M. Magaritz, and I. Levy. 1987. “An In Situ Multilevel Sampler for Preventive Monitoring and Study of Hydrochemical Profiles in Aquifers.” Ground Water Monitoring Review 7(4): 69–74.
U.S. Environmental Protection Agency. 2003. SW-846 Online, Test Methods for Evaluating Solid Waste, Physical/Chemical Methods. www.epa.gov/epaoswer/hazwaste/test/main.htm
Vroblesky, D. A. 2001. User’s Guide for Polyethylene-Based Passive Diffusion Bag Samplers to Obtain Volatile Organic Compounds Concentrations in Wells, Part 1—Deployment, Recovery, Data Interpretation, and Quality Control and Assurance and Part 2— Field Tests. U.S. Geological Survey Water Resources Investigation Reports 01-4060 and 01-4061. Available as DSP-1, Interstate Technology & Regulatory Council, Diffusion/Passive Sampler Team, www.itrcweb.org.
Vroblesky, D. A., J. Manish, J. Morrell, and J. E. Peterson. 2003. Evaluation of Passive Diffusion Bag Samplers, Dialysis Samplers, and Nylon-Screen Samplers in Selected Wells at Andersen Air Force Base, Guam, March-April 2002. U.S. Geological Survey Water-Resources Investigations Report 03-4157.
Vroblesky, D. A., M. D. Petkewich, and T. R. Campbell. 2002. Field Tests of Diffusion Samplers or Inorganic Constituents in Wells and at a Ground-Water Discharge Zone. U.S. Geological Survey Water-Resources Investigations Report 02-4031.
Vroblesky, D. A., and T. Pravecek. 2002. Evaluation of Passive Diffusion Bag and Dialysis Samplers in Selected Wells at Hickam Air Force Base, Hawaii, July 2001. U.S. Geological Survey Water-Resources Investigations Report 02-4159.

ITRC – Protocol for Use of Five Passive Samplers February 2007 to Sample for a Variety of Contaminants in Groundwater
75 Rigid Porous Polyethylene Sampler
6. RIGID, POROUS POLYETHYLENE SAMPLER
The RPP sampler is a passive, diffusion-based groundwater sampling device used to collect a analytes from groundwater wells without purging. It is designed to collect a broad range of analytes, including dissolved ions, explosives, VOCs, SVOCs, emergent chemicals, and natural attenuation parameters. RPP samplers are cylinders of rigid, porous polyethylene filled with deionized water. In groundwater wells, analytes in solution within the well water diffuse through the water-filled pores of the RPP material until concentrations of the constituents in the sampler reach equilibrium with those in the well water. As with all passive groundwater sampling devices, the RPP sampler relies on ambient movement of groundwater through the well screen to maintain chemical equilibrium with the aquifer immediately adjacent to the well screen. Because this is a passive method, purging of the well is eliminated. The RPP sampler is constructed from thin sheets of foamlike, porous polyethylene with pore sizes of 6–20 microns. When completely filled with water, these pores allow the diffusion of constituents into the sampler. The RPP sampler is deployed attached to a weighted line so that it hangs at the desired depth of the screened interval of the well. More than one sampler can be deployed at the same well screen interval or in tandem if vertical profiling is of interest. The RPP sampler is generally left in place for two weeks, the equilibration period for most analytes of interest. Longer deployment periods are required for explosives. Investigation of longer deployment periods for hydrophobic organic analytes is needed. The samplers are then brought to the surface and their contents immediately transferred into appropriate containers for transport. Quantitative analysis of field samples collected with RPP samplers compare well with those of samples taken by other sampling techniques. Laboratory studies also show good recoveries with the exception of certain hydrophobic VOCs and SVOCs. It is expected that these constituents will equilibrate if the RPP sampler is deployed for longer periods (investigations are under way this writing). If longer deployment times are not possible and hydrophobic VOCs must be tested as well as inorganic and hydrophilic VOC parameters, bundling of RPP samplers with PDB samplers is recommended (see field studies).
6.1 Introduction to the Rigid, Porous Polyethylene Sampler
6.1.1 Use and Application
RPP samplers are used to sample dissolved analytes in groundwater within a well. They rely on the ambient flow of groundwater from the aquifer through the well screen (Robin and Gillham 1987) to obtain a sample in equilibrium with the formation water. They can be used for long-term monitoring or for characterization of the vertical profile within the screened length of a groundwater well.
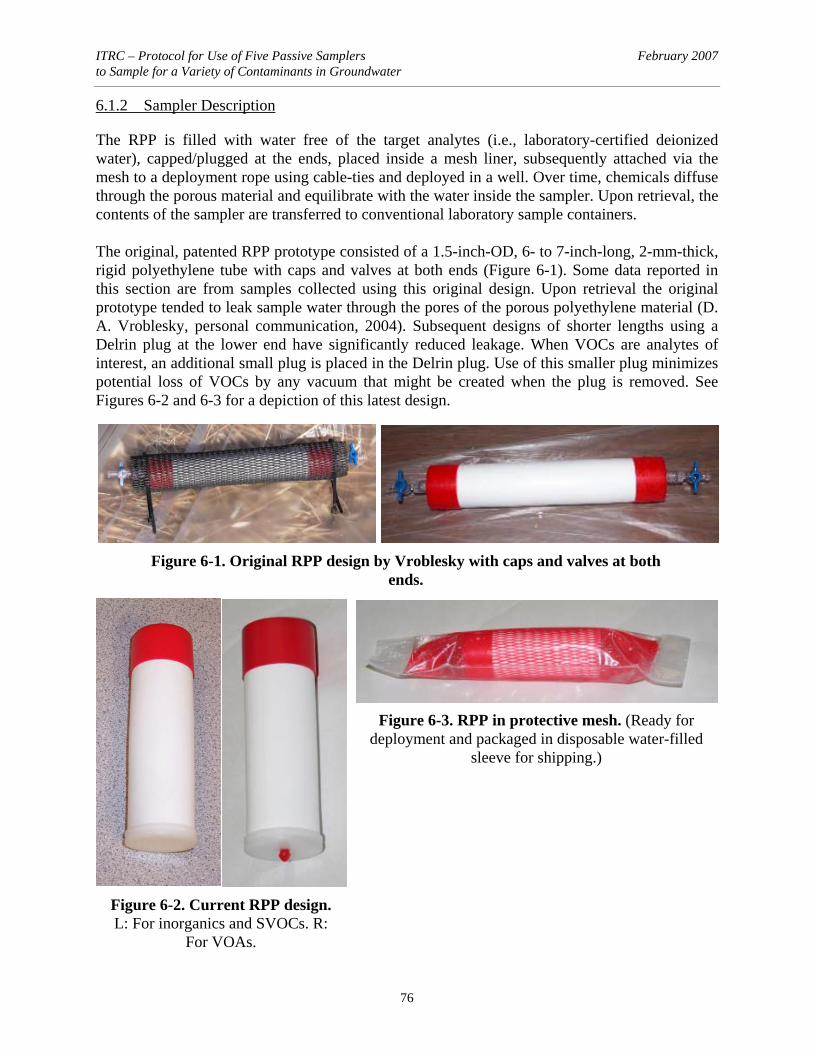
ITRC – Protocol for Use of Five Passive Samplers February 2007 to Sample for a Variety of Contaminants in Groundwater
76
6.1.2 Sampler Description
The RPP is filled with water free of the target analytes (i.e., laboratory-certified deionized water), capped/plugged at the ends, placed inside a mesh liner, subsequently attached via the mesh to a deployment rope using cable-ties and deployed in a well. Over time, chemicals diffuse through the porous material and equilibrate with the water inside the sampler. Upon retrieval, the contents of the sampler are transferred to conventional laboratory sample containers. The original, patented RPP prototype consisted of a 1.5-inch-OD, 6- to 7-inch-long, 2-mm-thick, rigid polyethylene tube with caps and valves at both ends (Figure 6-1). Some data reported in this section are from samples collected using this original design. Upon retrieval the original prototype tended to leak sample water through the pores of the porous polyethylene material (D. A. Vroblesky, personal communication, 2004). Subsequent designs of shorter lengths using a Delrin plug at the lower end have significantly reduced leakage. When VOCs are analytes of interest, an additional small plug is placed in the Delrin plug. Use of this smaller plug minimizes potential loss of VOCs by any vacuum that might be created when the plug is removed. See Figures 6-2 and 6-3 for a depiction of this latest design.
Figure 6-1. Original RPP design by Vroblesky with caps and valves at both ends.
Figure 6-3. RPP in protective mesh. (Ready for deployment and packaged in disposable water-filled
sleeve for shipping.)
Figure 6-2. Current RPP design. L: For inorganics and SVOCs. R:
For VOAs.

ITRC – Protocol for Use of Five Passive Samplers February 2007 to Sample for a Variety of Contaminants in Groundwater
77 Rigid Porous Polyethylene Sampler
The current RPP is 5 inches long, has an OD of 1.5 inches, and contains a volume of about 100 mL. Larger volumes may be obtained by using multiple samplers, stacked side by side or end to end. If they are stacked, consideration should be given to potential contaminant stratification within the sampled interval.
6.1.3 Applicable Analytes
Table 6-1 summarizes the acceptable laboratory studies and field performance to date.
Table 6-1. RPP vs. conventional sampling results Analyte Laboratory Study Field Study
Water-soluble VOCs Phenols Pending Explosives MTBE Water-soluble SVOCs N-nitrosodimethylamine 1,4-Dioxane Metals Hexavalent chromium Perchlorate Chloride Nitrate Sulfate Methane, ethane, and ethane (MEE) Dissolved gases
Certain hydrophobic VOCs and SVOCs have had unacceptably low recoveries. It is suspected that these compounds sorbed to the polyethylene material and there was insufficient time to reach static equilibrium with the polyethylene material. It is expected that these compounds will equilibrate over time with a continuing contaminant supply. Please contact Columbia Analytical Services, Inc. (or the manufacturer) for the latest information concerning applicability of RPPs for specific analytes of interest not mentioned in this protocol.
6.1.4 Vendor Availability
Dee O’Neill Columbia Analytical Services, Inc 1317 South 13th Ave. Kelso, WA 98626 Phone: 360-577-7222 Web site: www.caslab.com E-mail: [email protected]

ITRC – Protocol for Use of Five Passive Samplers February 2007 to Sample for a Variety of Contaminants in Groundwater
78
6.2 Sampler Advantages
RPP samplers: • can be used to collect most inorganic and organic analytes; • are easily deployed and retrieved; • significantly reduce field sampling costs; • can be supplied field-ready, enhancing field QC control; • provide adequate volume for most analytical suites.
6.3 Sampler Limitations
RPP samplers: • may require additional equilibrium time for less-water-soluble VOCs and SVOCs; • must be stored and shipped fully immersed in deionized water; • are not suitable for wells smaller than 2 inches in diameter; • have not been tested for all analytes (refer to tables below); • may collect insufficient sample volume for multiple analyses and/or QC; • require advanced analytical extraction techniques when analyzing for SVOCs.
6.4 Typical Sampler Deployment
6.4.1 Deployment Considerations
Deployment depth should not be arbitrary but should be based on the well-specific DQOs. Please see Section 1.3.4 for additional information on deployment depth. The RPP is deployed plug end down in a predetermined interval in a groundwater well and left to equilibrate for at least 14 days or until the next sampling event. Biodegradation has not been observed on polyethylene samplers. The maximum deployment period is unknown. The currently available RPP must be deployed in a well with an inside diameter of at least 2 inches. Limited sample volumes inherent with the use of the RPP may require sampler stacking to collect sufficient sample volume (see Appendix A for sample specifics per analyte). Because stacking of samplers may represent a longer sampling interval within the well screen, potential contaminant stratification between the samplers must be considered. Vertical profiling within the screened or open interval in a well should be considered when contaminant stratification is suspected.
6.4.1.1 Ordering/Shipping Considerations
The samplers are currently supplied field-ready. They are shipped in a sealed polyethylene sleeve filled with laboratory-grade deionized water to ensure that the pores of the RPP do not become air filled (see Figure 6-3).
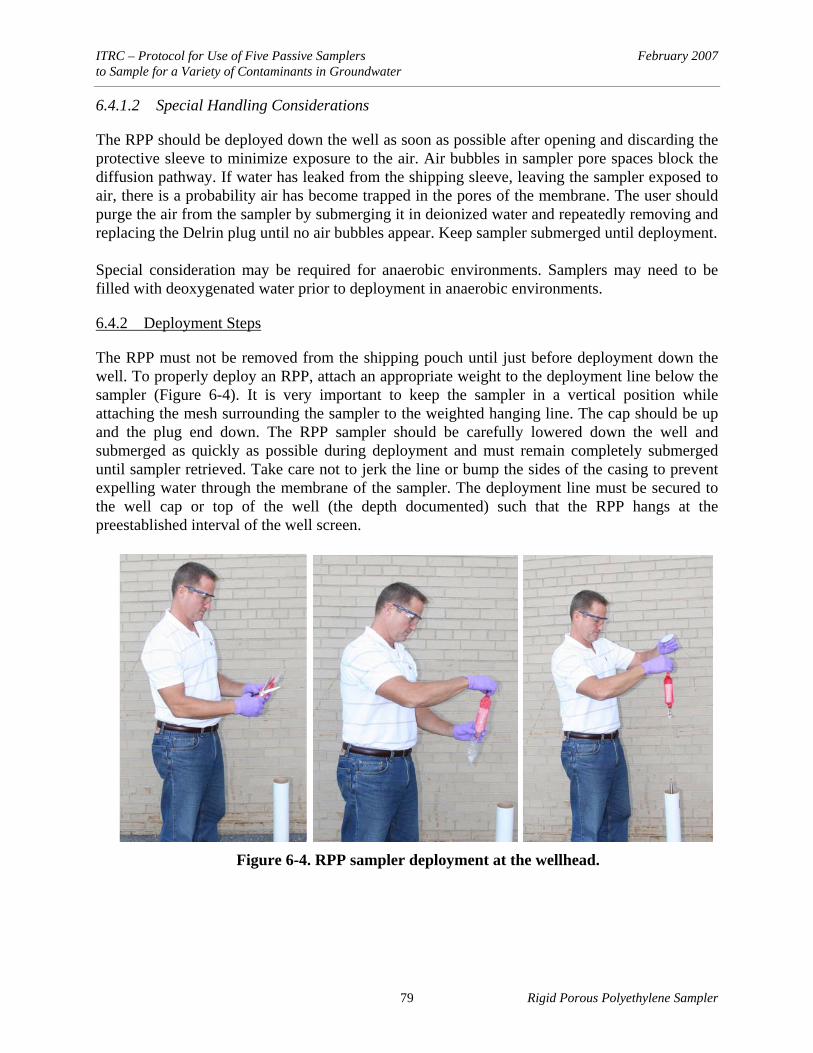
ITRC – Protocol for Use of Five Passive Samplers February 2007 to Sample for a Variety of Contaminants in Groundwater
79 Rigid Porous Polyethylene Sampler
6.4.1.2 Special Handling Considerations
The RPP should be deployed down the well as soon as possible after opening and discarding the protective sleeve to minimize exposure to the air. Air bubbles in sampler pore spaces block the diffusion pathway. If water has leaked from the shipping sleeve, leaving the sampler exposed to air, there is a probability air has become trapped in the pores of the membrane. The user should purge the air from the sampler by submerging it in deionized water and repeatedly removing and replacing the Delrin plug until no air bubbles appear. Keep sampler submerged until deployment. Special consideration may be required for anaerobic environments. Samplers may need to be filled with deoxygenated water prior to deployment in anaerobic environments.
6.4.2 Deployment Steps
The RPP must not be removed from the shipping pouch until just before deployment down the well. To properly deploy an RPP, attach an appropriate weight to the deployment line below the sampler (Figure 6-4). It is very important to keep the sampler in a vertical position while attaching the mesh surrounding the sampler to the weighted hanging line. The cap should be up and the plug end down. The RPP sampler should be carefully lowered down the well and submerged as quickly as possible during deployment and must remain completely submerged until sampler retrieved. Take care not to jerk the line or bump the sides of the casing to prevent expelling water through the membrane of the sampler. The deployment line must be secured to the well cap or top of the well (the depth documented) such that the RPP hangs at the preestablished interval of the well screen.
Figure 6-4. RPP sampler deployment at the wellhead.

ITRC – Protocol for Use of Five Passive Samplers February 2007 to Sample for a Variety of Contaminants in Groundwater
80
6.4.3 Sample Recovery
6.4.3.1 Sample Recovery Steps
Similar care should be exercised when retrieving the RPP sampler as when deploying it. When the sampler is at the surface, cut the cable ties that attach the mesh sleeve and sampler to the line. Keeping the same vertical orientation, push on the red cap until the plug end is free of the mesh. Invert the sampler, remove the plug, and pour the contents into the sample bottles immediately to minimize leakage and exposure to the air (Figure 6-5). The lab sample container and the filling method will differ depending on the analytes and analyses to be performed on the sample. Sampling personnel should be observant and note any conditions that may affect the quality of the sample.
6.4.3.2 Disposal or Decontamination Procedures for Device
After use, the RPP may be discarded according to appropriate disposal procedures. The deployment lines and weight may be reused if dedicated to a specific well or decontaminated and reused depending on site requirements.
6.5 Determining the Applicability of Sampler and Interpretation of Data
6.5.1 Equilibrium
Recent laboratory results indicate that RPP samplers yield accurate results for anions, most metals, hexavalent chromium, MEE and 1,4-dioxane, as seen in Tables 6-2 through 6-5 (Columbia Analytical Services, Inc. 2005).
Figure 6-5. Transferring the RPP sample to a standard laboratory sample container.
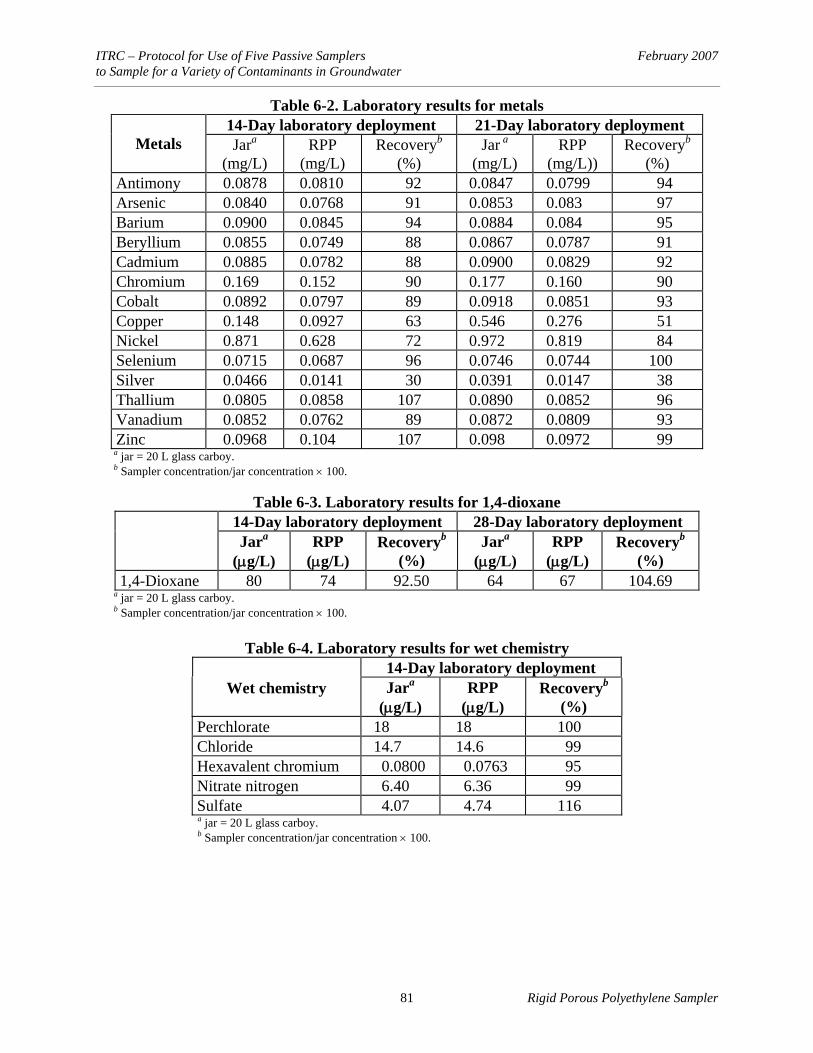
ITRC – Protocol for Use of Five Passive Samplers February 2007 to Sample for a Variety of Contaminants in Groundwater
81 Rigid Porous Polyethylene Sampler
Table 6-2. Laboratory results for metals 14-Day laboratory deployment 21-Day laboratory deployment
Metals Jara (mg/L)
RPP (mg/L)
Recoveryb (%)
Jar a (mg/L)
RPP (mg/L))
Recoveryb (%)
Antimony 0.0878 0.0810 92 0.0847 0.0799 94 Arsenic 0.0840 0.0768 91 0.0853 0.083 97 Barium 0.0900 0.0845 94 0.0884 0.084 95 Beryllium 0.0855 0.0749 88 0.0867 0.0787 91 Cadmium 0.0885 0.0782 88 0.0900 0.0829 92 Chromium 0.169 0.152 90 0.177 0.160 90 Cobalt 0.0892 0.0797 89 0.0918 0.0851 93 Copper 0.148 0.0927 63 0.546 0.276 51 Nickel 0.871 0.628 72 0.972 0.819 84 Selenium 0.0715 0.0687 96 0.0746 0.0744 100 Silver 0.0466 0.0141 30 0.0391 0.0147 38 Thallium 0.0805 0.0858 107 0.0890 0.0852 96 Vanadium 0.0852 0.0762 89 0.0872 0.0809 93 Zinc 0.0968 0.104 107 0.098 0.0972 99
a jar = 20 L glass carboy. b Sampler concentration/jar concentration × 100.
Table 6-3. Laboratory results for 1,4-dioxane
14-Day laboratory deployment 28-Day laboratory deployment Jara
(μg/L) RPP
(μg/L) Recoveryb
(%) Jara
(μg/L) RPP
(μg/L) Recoveryb
(%) 1,4-Dioxane 80 74 92.50 64 67 104.69
a jar = 20 L glass carboy. b Sampler concentration/jar concentration × 100.
Table 6-4. Laboratory results for wet chemistry
14-Day laboratory deployment Wet chemistry
Jara
(μg/L) RPP
(μg/L) Recoveryb
(%) Perchlorate 18 18 100 Chloride 14.7 14.6 99 Hexavalent chromium 0.0800 0.0763 95 Nitrate nitrogen 6.40 6.36 99 Sulfate 4.07 4.74 116 a jar = 20 L glass carboy. b Sampler concentration/jar concentration × 100.
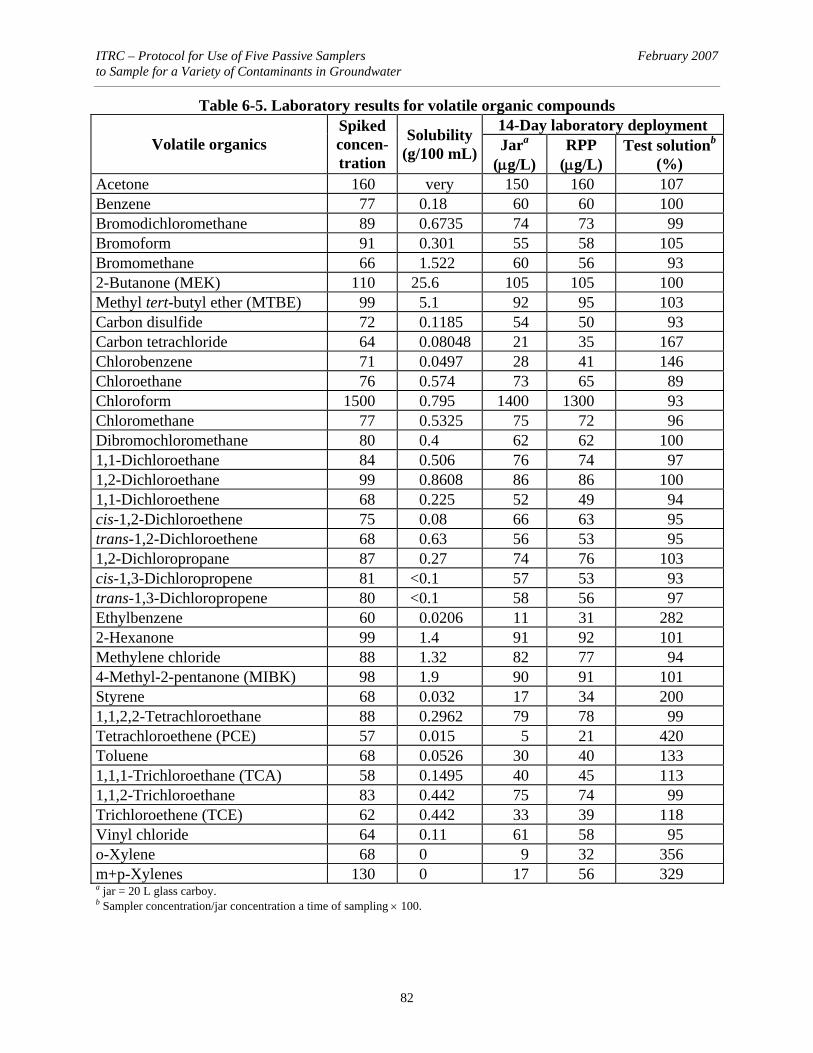
ITRC – Protocol for Use of Five Passive Samplers February 2007 to Sample for a Variety of Contaminants in Groundwater
82
Table 6-5. Laboratory results for volatile organic compounds 14-Day laboratory deployment
Volatile organics Spiked concen-tration
Solubility (g/100 mL) Jara
(μg/L) RPP
(μg/L) Test solutionb
(%) Acetone 160 very 150 160 107 Benzene 77 0.18 60 60 100 Bromodichloromethane 89 0.6735 74 73 99 Bromoform 91 0.301 55 58 105 Bromomethane 66 1.522 60 56 93 2-Butanone (MEK) 110 25.6 105 105 100 Methyl tert-butyl ether (MTBE) 99 5.1 92 95 103 Carbon disulfide 72 0.1185 54 50 93 Carbon tetrachloride 64 0.08048 21 35 167 Chlorobenzene 71 0.0497 28 41 146 Chloroethane 76 0.574 73 65 89 Chloroform 1500 0.795 1400 1300 93 Chloromethane 77 0.5325 75 72 96 Dibromochloromethane 80 0.4 62 62 100 1,1-Dichloroethane 84 0.506 76 74 97 1,2-Dichloroethane 99 0.8608 86 86 100 1,1-Dichloroethene 68 0.225 52 49 94 cis-1,2-Dichloroethene 75 0.08 66 63 95 trans-1,2-Dichloroethene 68 0.63 56 53 95 1,2-Dichloropropane 87 0.27 74 76 103 cis-1,3-Dichloropropene 81 <0.1 57 53 93 trans-1,3-Dichloropropene 80 <0.1 58 56 97 Ethylbenzene 60 0.0206 11 31 282 2-Hexanone 99 1.4 91 92 101 Methylene chloride 88 1.32 82 77 94 4-Methyl-2-pentanone (MIBK) 98 1.9 90 91 101 Styrene 68 0.032 17 34 200 1,1,2,2-Tetrachloroethane 88 0.2962 79 78 99 Tetrachloroethene (PCE) 57 0.015 5 21 420 Toluene 68 0.0526 30 40 133 1,1,1-Trichloroethane (TCA) 58 0.1495 40 45 113 1,1,2-Trichloroethane 83 0.442 75 74 99 Trichloroethene (TCE) 62 0.442 33 39 118 Vinyl chloride 64 0.11 61 58 95 o-Xylene 68 0 9 32 356 m+p-Xylenes 130 0 17 56 329 a jar = 20 L glass carboy. b Sampler concentration/jar concentration a time of sampling × 100.
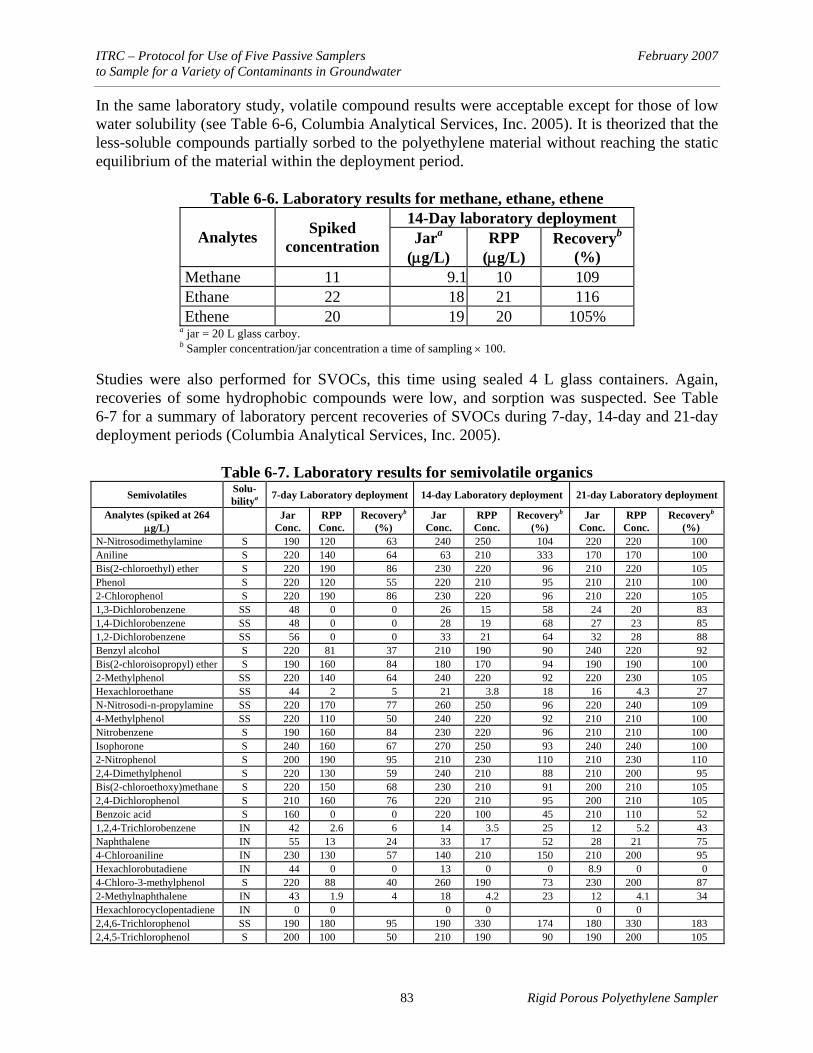
ITRC – Protocol for Use of Five Passive Samplers February 2007 to Sample for a Variety of Contaminants in Groundwater
83 Rigid Porous Polyethylene Sampler
In the same laboratory study, volatile compound results were acceptable except for those of low water solubility (see Table 6-6, Columbia Analytical Services, Inc. 2005). It is theorized that the less-soluble compounds partially sorbed to the polyethylene material without reaching the static equilibrium of the material within the deployment period.
Table 6-6. Laboratory results for methane, ethane, ethene 14-Day laboratory deployment
Analytes Spiked concentration Jara
(μg/L) RPP
(μg/L) Recoveryb
(%) Methane 11 9.1 10 109 Ethane 22 18 21 116 Ethene 20 19 20 105%
a jar = 20 L glass carboy. b Sampler concentration/jar concentration a time of sampling × 100.
Studies were also performed for SVOCs, this time using sealed 4 L glass containers. Again, recoveries of some hydrophobic compounds were low, and sorption was suspected. See Table 6-7 for a summary of laboratory percent recoveries of SVOCs during 7-day, 14-day and 21-day deployment periods (Columbia Analytical Services, Inc. 2005).
Table 6-7. Laboratory results for semivolatile organics Semivolatiles Solu-
bilitya 7-day Laboratory deployment 14-day Laboratory deployment 21-day Laboratory deployment
Analytes (spiked at 264 μg/L) Jar
Conc. RPP
Conc. Recoveryb
(%) Jar
Conc. RPP
Conc. Recoveryb
(%) Jar
Conc. RPP
Conc. Recoveryb
(%) N-Nitrosodimethylamine S 190 120 63 240 250 104 220 220 100 Aniline S 220 140 64 63 210 333 170 170 100 Bis(2-chloroethyl) ether S 220 190 86 230 220 96 210 220 105 Phenol S 220 120 55 220 210 95 210 210 100 2-Chlorophenol S 220 190 86 230 220 96 210 220 105 1,3-Dichlorobenzene SS 48 0 0 26 15 58 24 20 83 1,4-Dichlorobenzene SS 48 0 0 28 19 68 27 23 85 1,2-Dichlorobenzene SS 56 0 0 33 21 64 32 28 88 Benzyl alcohol S 220 81 37 210 190 90 240 220 92 Bis(2-chloroisopropyl) ether S 190 160 84 180 170 94 190 190 100 2-Methylphenol SS 220 140 64 240 220 92 220 230 105 Hexachloroethane SS 44 2 5 21 3.8 18 16 4.3 27 N-Nitrosodi-n-propylamine SS 220 170 77 260 250 96 220 240 109 4-Methylphenol SS 220 110 50 240 220 92 210 210 100 Nitrobenzene S 190 160 84 230 220 96 210 210 100 Isophorone S 240 160 67 270 250 93 240 240 100 2-Nitrophenol S 200 190 95 210 230 110 210 230 110 2,4-Dimethylphenol S 220 130 59 240 210 88 210 200 95 Bis(2-chloroethoxy)methane S 220 150 68 230 210 91 200 210 105 2,4-Dichlorophenol S 210 160 76 220 210 95 200 210 105 Benzoic acid S 160 0 0 220 100 45 210 110 52 1,2,4-Trichlorobenzene IN 42 2.6 6 14 3.5 25 12 5.2 43 Naphthalene IN 55 13 24 33 17 52 28 21 75 4-Chloroaniline IN 230 130 57 140 210 150 210 200 95 Hexachlorobutadiene IN 44 0 0 13 0 0 8.9 0 0 4-Chloro-3-methylphenol S 220 88 40 260 190 73 230 200 87 2-Methylnaphthalene IN 43 1.9 4 18 4.2 23 12 4.1 34 Hexachlorocyclopentadiene IN 0 0 0 0 0 0 2,4,6-Trichlorophenol SS 190 180 95 190 330 174 180 330 183 2,4,5-Trichlorophenol S 200 100 50 210 190 90 190 200 105
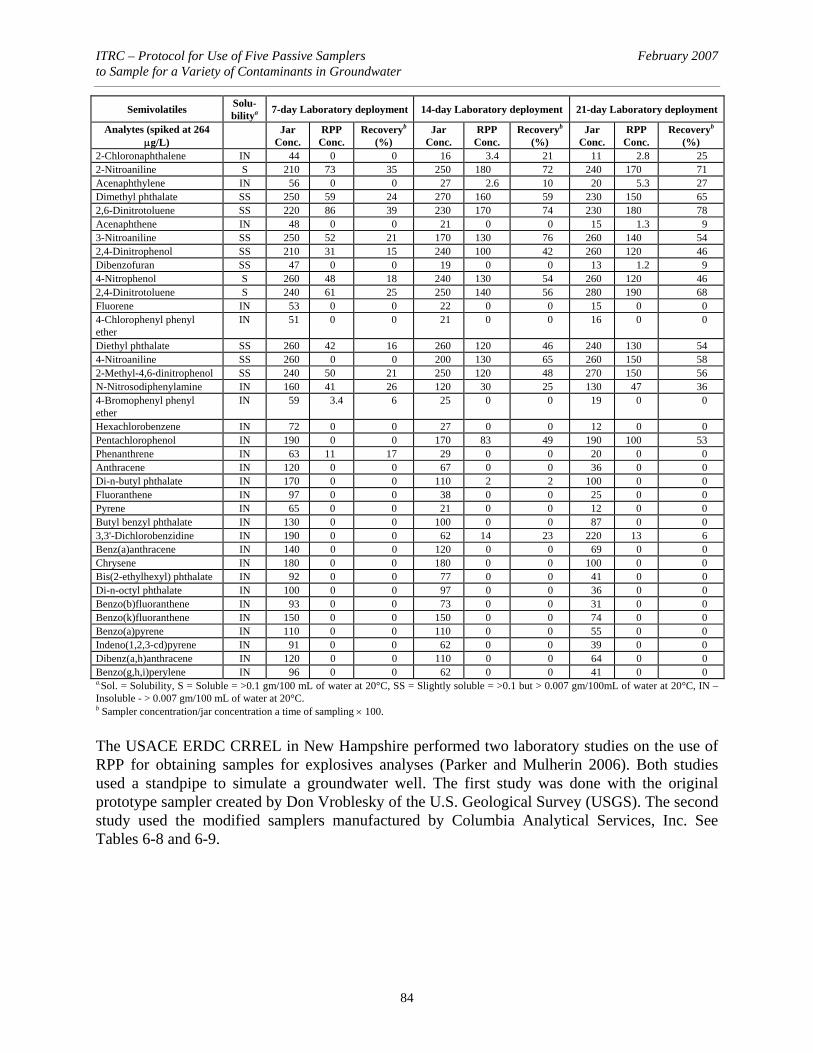
ITRC – Protocol for Use of Five Passive Samplers February 2007 to Sample for a Variety of Contaminants in Groundwater
84
Semivolatiles Solu-bilitya 7-day Laboratory deployment 14-day Laboratory deployment 21-day Laboratory deployment
Analytes (spiked at 264 μg/L) Jar
Conc. RPP
Conc. Recoveryb
(%) Jar
Conc. RPP
Conc. Recoveryb
(%) Jar
Conc. RPP
Conc. Recoveryb
(%) 2-Chloronaphthalene IN 44 0 0 16 3.4 21 11 2.8 25 2-Nitroaniline S 210 73 35 250 180 72 240 170 71 Acenaphthylene IN 56 0 0 27 2.6 10 20 5.3 27 Dimethyl phthalate SS 250 59 24 270 160 59 230 150 65 2,6-Dinitrotoluene SS 220 86 39 230 170 74 230 180 78 Acenaphthene IN 48 0 0 21 0 0 15 1.3 9 3-Nitroaniline SS 250 52 21 170 130 76 260 140 54 2,4-Dinitrophenol SS 210 31 15 240 100 42 260 120 46 Dibenzofuran SS 47 0 0 19 0 0 13 1.2 9 4-Nitrophenol S 260 48 18 240 130 54 260 120 46 2,4-Dinitrotoluene S 240 61 25 250 140 56 280 190 68 Fluorene IN 53 0 0 22 0 0 15 0 0 4-Chlorophenyl phenyl ether
IN 51 0 0 21 0 0 16 0 0
Diethyl phthalate SS 260 42 16 260 120 46 240 130 54 4-Nitroaniline SS 260 0 0 200 130 65 260 150 58 2-Methyl-4,6-dinitrophenol SS 240 50 21 250 120 48 270 150 56 N-Nitrosodiphenylamine IN 160 41 26 120 30 25 130 47 36 4-Bromophenyl phenyl ether
IN 59 3.4 6 25 0 0 19 0 0
Hexachlorobenzene IN 72 0 0 27 0 0 12 0 0 Pentachlorophenol IN 190 0 0 170 83 49 190 100 53 Phenanthrene IN 63 11 17 29 0 0 20 0 0 Anthracene IN 120 0 0 67 0 0 36 0 0 Di-n-butyl phthalate IN 170 0 0 110 2 2 100 0 0 Fluoranthene IN 97 0 0 38 0 0 25 0 0 Pyrene IN 65 0 0 21 0 0 12 0 0 Butyl benzyl phthalate IN 130 0 0 100 0 0 87 0 0 3,3'-Dichlorobenzidine IN 190 0 0 62 14 23 220 13 6 Benz(a)anthracene IN 140 0 0 120 0 0 69 0 0 Chrysene IN 180 0 0 180 0 0 100 0 0 Bis(2-ethylhexyl) phthalate IN 92 0 0 77 0 0 41 0 0 Di-n-octyl phthalate IN 100 0 0 97 0 0 36 0 0 Benzo(b)fluoranthene IN 93 0 0 73 0 0 31 0 0 Benzo(k)fluoranthene IN 150 0 0 150 0 0 74 0 0 Benzo(a)pyrene IN 110 0 0 110 0 0 55 0 0 Indeno(1,2,3-cd)pyrene IN 91 0 0 62 0 0 39 0 0 Dibenz(a,h)anthracene IN 120 0 0 110 0 0 64 0 0 Benzo(g,h,i)perylene IN 96 0 0 62 0 0 41 0 0 a.Sol. = Solubility, S = Soluble = >0.1 gm/100 mL of water at 20°C, SS = Slightly soluble = >0.1 but > 0.007 gm/100mL of water at 20°C, IN – Insoluble - > 0.007 gm/100 mL of water at 20°C. b Sampler concentration/jar concentration a time of sampling × 100.
The USACE ERDC CRREL in New Hampshire performed two laboratory studies on the use of RPP for obtaining samples for explosives analyses (Parker and Mulherin 2006). Both studies used a standpipe to simulate a groundwater well. The first study was done with the original prototype sampler created by Don Vroblesky of the U.S. Geological Survey (USGS). The second study used the modified samplers manufactured by Columbia Analytical Services, Inc. See Tables 6-8 and 6-9.

ITRC – Protocol for Use of Five Passive Samplers February 2007 to Sample for a Variety of Contaminants in Groundwater
85 Rigid Porous Polyethylene Sampler
Table 6-8. ERDC CRREL explosives standpipe study—original RPP design Recovery of Standpipe Solution (%) Explosives Day 7 Day 14 Day 21 Day 28
HMX 52 78 98 99.7 Trinitrobenzene (TNB) 45 65 86 84 RDX 56 83 99.3 99.3 TNT 49 74 95 95
Table 6-9. Second ERDC CRREL explosives standpipe study—modified RPP design
Recovery of Standpipe Solution (%) Explosives Day 7 Day 14 Day 21 HMX 81 95 99 TNB 77 87 99 RDX 83 96 100 TNT 73 89 98
These data suggest that a minimum deployment period of 21 days is required for quantitative accuracy. The modified RPP are undergoing a field trial for explosives in early 2006; however, the data have not been released at this writing. Summary of Laboratory Studies: These bench studies suggest that these devices are useful for inorganics, water-soluble volatile, and semivolatile analytes. For hydrophobic compounds, equilibrium is expected to be established with longer deployment periods and with a sustained source or larger reservoir of contaminant.
5.5.2 Field Comparison Studies
RPP devices were included in a side-by-side field demonstration of multiple passive groundwater sampling devices at the former McClellan AFB near Sacramento, California in 2004 (Parsons 2005) The passive devices were deployed for a period of three weeks before retrieval. The report stated, “The RPPS appears to be a technically viable method for monitoring hexavalent chromium, metals and anions. Although concentration of VOCs and 1,4-dioxane obtained using this method are statistically similar to low-flow concentrations of these analytes, they tended to be biased low relative to concentrations obtained using the three-volume-purge method.” It must be noted that the low-flow concentrations in this study were also biased low relative to three-volume-purge concentrations. Additional field studies have been completed or are under way. Those completed to date have shown good correlations with either low-flow purge sampling or conventional sampling methods. Three have focused on 1,4 dioxane, one on perchlorates, one on iron, and one on explosives. Table 6-10 shows data from one site, and Figure 6-6 shows the correlation (unnamed site in North Carolina, J. Kubal, Kubal-Furr & Associates, 3802 Ehrlich Rd., Tampa, FL 33624, [email protected], personal communication, 2005). Concentrations of 1,4-dioxane ranged 0.01–0.22 mg/L with a correlation coefficient of 0.9224 with low-flow sampling.
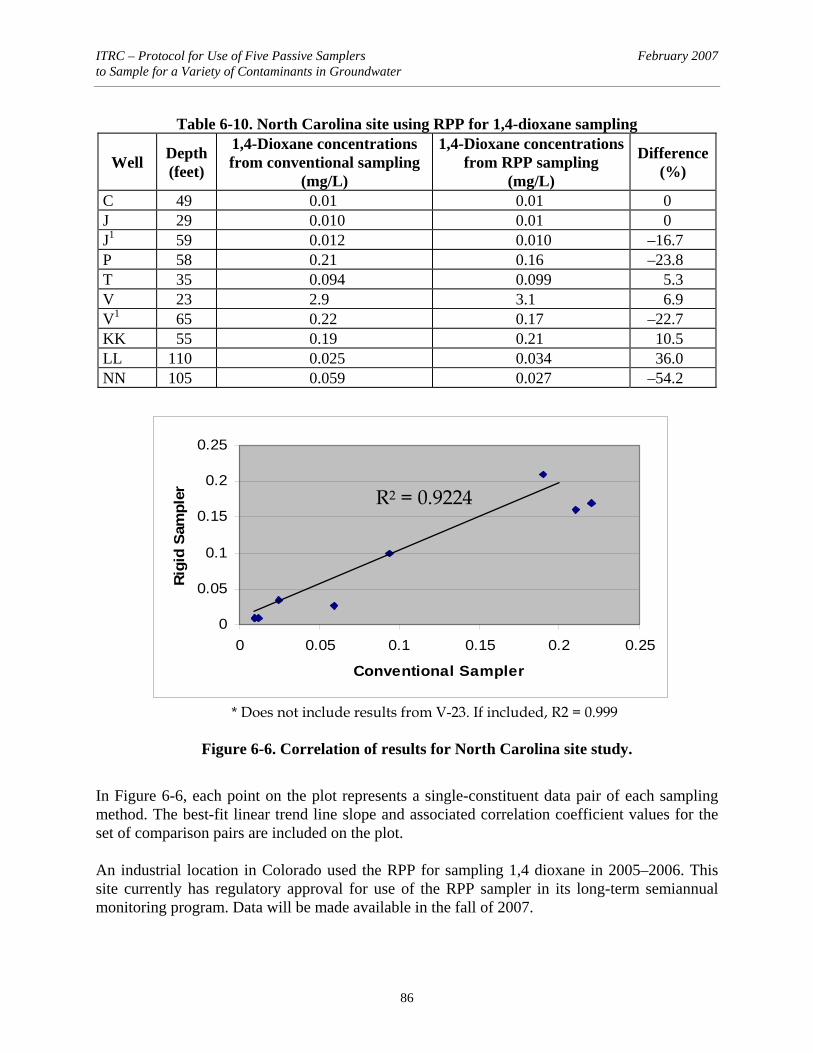
ITRC – Protocol for Use of Five Passive Samplers February 2007 to Sample for a Variety of Contaminants in Groundwater
86
Table 6-10. North Carolina site using RPP for 1,4-dioxane sampling
Well Depth (feet)
1,4-Dioxane concentrations from conventional sampling
(mg/L)
1,4-Dioxane concentrations from RPP sampling
(mg/L)
Difference(%)
C 49 0.01 0.01 0 J 29 0.010 0.01 0 J1 59 0.012 0.010 –16.7 P 58 0.21 0.16 –23.8 T 35 0.094 0.099 5.3 V 23 2.9 3.1 6.9 V1 65 0.22 0.17 –22.7 KK 55 0.19 0.21 10.5 LL 110 0.025 0.034 36.0 NN 105 0.059 0.027 –54.2
In Figure 6-6, each point on the plot represents a single-constituent data pair of each sampling method. The best-fit linear trend line slope and associated correlation coefficient values for the set of comparison pairs are included on the plot. An industrial location in Colorado used the RPP for sampling 1,4 dioxane in 2005–2006. This site currently has regulatory approval for use of the RPP sampler in its long-term semiannual monitoring program. Data will be made available in the fall of 2007.
0
0.05
0.1
0.15
0.2
0.25
0 0.05 0.1 0.15 0.2 0.25
Conventional Sampler
Rig
id S
ampl
er
* Does not include results from V-23. If included, R2 = 0.999
R2 = 0.9224
Figure 6-6. Correlation of results for North Carolina site study.
ITRC – Protocol for Use of Five Passive Samplers February 2007 to Sample for a Variety of Contaminants in Groundwater
87 Rigid Porous Polyethylene Sampler
Consultants (RTI and Brown and Caldwell) used the RPP for sampling 1,4 dioxane at unnamed industrial site in California in 2006. The data are under evaluation and not yet available at this writing. The RPP samplers have reportedly been used effectively at a site in New Jersey to collect samples for soluble iron (Geosyntec, unnamed New Jersey site, 2006). The results showed good correlation compared to results from samples collected using low-flow purge techniques. Data will be published at a later date. The RPP sampler is being used most extensively at a site located adjacent to a former rocket fuel manufacturing plant within central Arizona. The sampling program is in its second year of quarterly monitoring using RPP samplers to collect samples for perchlorate analysis and using PDB samplers to collect groundwater samples for volatile organic analysis. Both the RPP and PDB samplers are bundled side-by-side in large-diameter wells throughout the 20–30 foot well screens to obtain vertical stratification data as well as extent-of-plume information. Concentrations vary from 1 to 3 ppb. Results will be published later. RPP samplers are also being investigated for viability as a cost-effective replacement to low-flow and conventional sampling methods when sampling for explosive compounds of interest. Building on the success with the RPP in the laboratory, Louise Parker of the USACE ERDC CRREL is conducting field trials. Data should be available in 2007 for a side-by-side groundwater study conducted in Louisiana.
6.6 Method-Specific Quality Assurance and Quality Control
6.6.1 Sources of Variation and Bias
Low bias may be suspected if using RPP to sample for certain VOCs and SVOCs at shorter deployment periods. Bench studies have suggested that hydrophobic VOCs and SVOCs may sorb to the side of the sampler. Additional exposure time may be needed for equilibration to occur. Investigations continue.
6.6.2 Collection of Blanks and Duplicates
One additional RPP should be sampled at the time samplers are deployed in wells to serve as a field blank. Duplicate samples may be obtained from the RPP being sampled depending on the sample volume required for the test for the analyte(s). If the sample volume required is such that a duplicate sample cannot be taken, it is suggested that a replicate RPPs be deployed with the original. Replicate samplers can be hung at the same position for 4-inch-diameter wells and immediately above or below original sampler for 2-inch-diameter wells.
6.7 RPP Sampler References
Columbia Analytical Services, Inc. 2005. “Various Bench Study Test Results of the Use of RPP Technology.” Presented at the National Environment Monitoring Conference, July 25–28, Washington, D.C.
ITRC – Protocol for Use of Five Passive Samplers February 2007 to Sample for a Variety of Contaminants in Groundwater
88
Columbia Analytical Services, Inc. 2006. “Various Bench Study Test Results of the Use of RPP.” Presented at the Environmental Monitoring and Data Quality Workshop, April 5–7, San Antonio, Tex.
Parker, L. V., and N. D. Mulherin. 2006. “Preliminary Studies of Alternative Passive Diffusion Devices for Sampling Explosives.” In Proceedings, 2006 North American Environmental Field Conference and Exposition, Tampa, Fla.
Parsons. 2005. Results Report for the Demonstration of No-Purge Groundwater Sampling Devices at Former McClellan Air Force Base, California. Prepared for the U.S. Army Corps of Engineers, Air Force Center for Environmental Excellence, and Air Force Real Property Agency.
Robin, M. L. J., and R. W. Gillham. 1987. “Field Evaluation of Well Purging Procedures.” Ground Water Monitoring Review 7(4): 85–93.

Appendix A
Minimum Volumes for Analytes
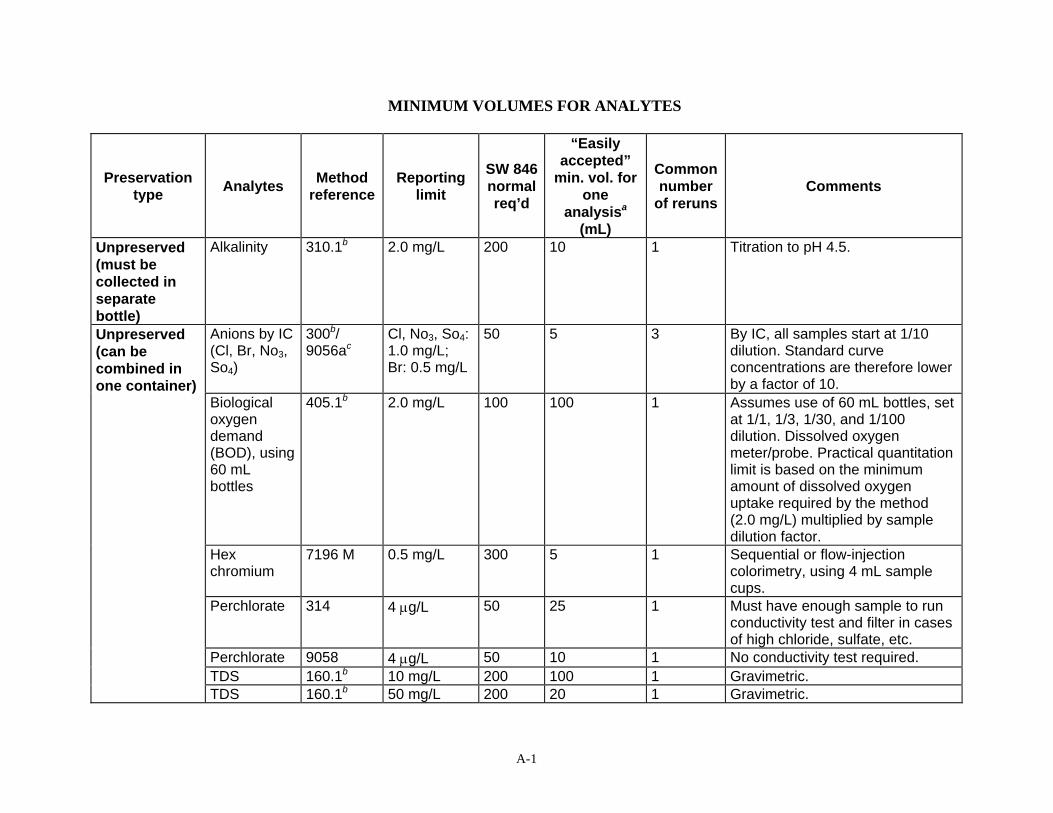
A-1
MINIMUM VOLUMES FOR ANALYTES
Preservation type Analytes Method
referenceReporting
limit
SW 846 normal req’d
“Easily accepted”
min. vol. for one
analysisa
(mL)
Common number
of rerunsComments
Unpreserved (must be collected in separate bottle)
Alkalinity 310.1b 2.0 mg/L 200 10 1 Titration to pH 4.5.
Anions by IC (Cl, Br, No3, So4)
300b/ 9056ac
Cl, No3, So4: 1.0 mg/L; Br: 0.5 mg/L
50 5 3 By IC, all samples start at 1/10 dilution. Standard curve concentrations are therefore lower by a factor of 10.
Biological oxygen demand (BOD), using 60 mL bottles
405.1b 2.0 mg/L 100 100 1 Assumes use of 60 mL bottles, set at 1/1, 1/3, 1/30, and 1/100 dilution. Dissolved oxygen meter/probe. Practical quantitation limit is based on the minimum amount of dissolved oxygen uptake required by the method (2.0 mg/L) multiplied by sample dilution factor.
Hex chromium
7196 M 0.5 mg/L 300 5 1 Sequential or flow-injection colorimetry, using 4 mL sample cups.
Perchlorate 314 4 μg/L 50 25 1 Must have enough sample to run conductivity test and filter in cases of high chloride, sulfate, etc.
Perchlorate 9058 4 μg/L 50 10 1 No conductivity test required. TDS 160.1b 10 mg/L 200 100 1 Gravimetric.
Unpreserved (can be combined in one container)
TDS 160.1b 50 mg/L 200 20 1 Gravimetric.

A-2
Preservation type Analytes Method
referenceReporting
limit
SW 846 normal req’d
“Easily accepted”
min. vol. for one
analysisa
(mL)
Common number
of rerunsComments
Chemical oxygen demand (COD)
410.4b 5 mg/L 100 5 1 Hach COD digestion tubes (p/n 21259-15: high level, 21258.15: low-level) using 2 mL/tube.
NH3, without distillation
350.1b 0.05 mg/L 100 5 1 Sequential or flow-injection colorimetry, using 4 or 8 mL sample cups, assuming no distillation required.
Total Kjehldahl nitrogen (TKN)
351.2b 2.0 mg/L 500 20 1 Up to ~5 dilutions from 1 distillation, but no repeat distillations. Block digestion using 20 mL of sample, followed by sequential or flow-injection colorimetry using 4 or 8 mL sample vials.
Phenols, distilled
420.2b 0.005 mg/L 100 50 1 In-line sequential-flow distillation followed by colorimetry.
Dissolved gases (methane, ethane, ethene)
RSK 175 5 μg/L 120 40 1 Using gas chromatography (GC) flame ionization detection (FID) thermal conductivity detection (TCD).
Sulfuric acid
Total organic carbon (TOC)
415.1b 1.0 mg/L 120 50 1 Ultraviolet (UV) or heated-persulfate TOC analyzer, with 40 mL VOA vial autosampler.
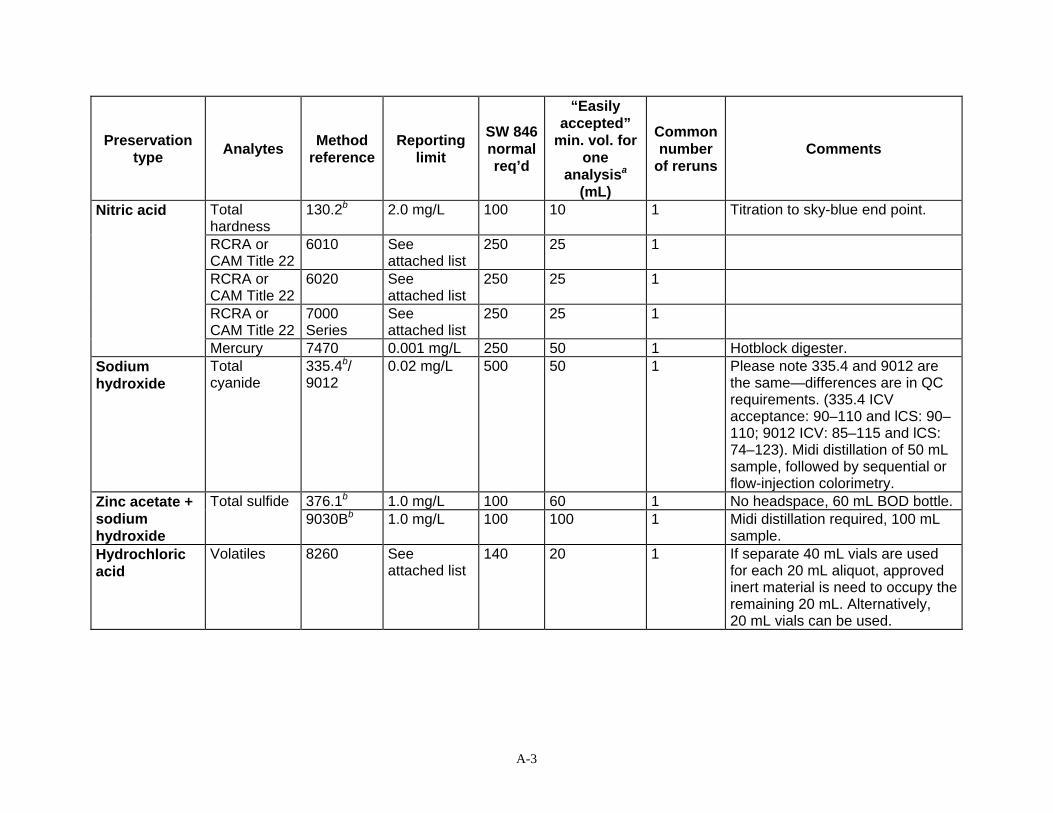
A-3
Preservation type Analytes Method
referenceReporting
limit
SW 846 normal req’d
“Easily accepted”
min. vol. for one
analysisa
(mL)
Common number
of rerunsComments
Total hardness
130.2b 2.0 mg/L 100 10 1 Titration to sky-blue end point.
RCRA or CAM Title 22
6010 See attached list
250 25 1
RCRA or CAM Title 22
6020 See attached list
250 25 1
RCRA or CAM Title 22
7000 Series
See attached list
250 25 1
Nitric acid
Mercury 7470 0.001 mg/L 250 50 1 Hotblock digester. Sodium hydroxide
Total cyanide
335.4b/ 9012
0.02 mg/L 500 50 1 Please note 335.4 and 9012 are the same—differences are in QC requirements. (335.4 ICV acceptance: 90–110 and lCS: 90–110; 9012 ICV: 85–115 and lCS: 74–123). Midi distillation of 50 mL sample, followed by sequential or flow-injection colorimetry.
376.1b 1.0 mg/L 100 60 1 No headspace, 60 mL BOD bottle. Zinc acetate + sodium hydroxide
Total sulfide 9030Bb 1.0 mg/L 100 100 1 Midi distillation required, 100 mL
sample. Hydrochloric acid
Volatiles 8260 See attached list
140 20 1 If separate 40 mL vials are used for each 20 mL aliquot, approved inert material is need to occupy the remaining 20 mL. Alternatively, 20 mL vials can be used.
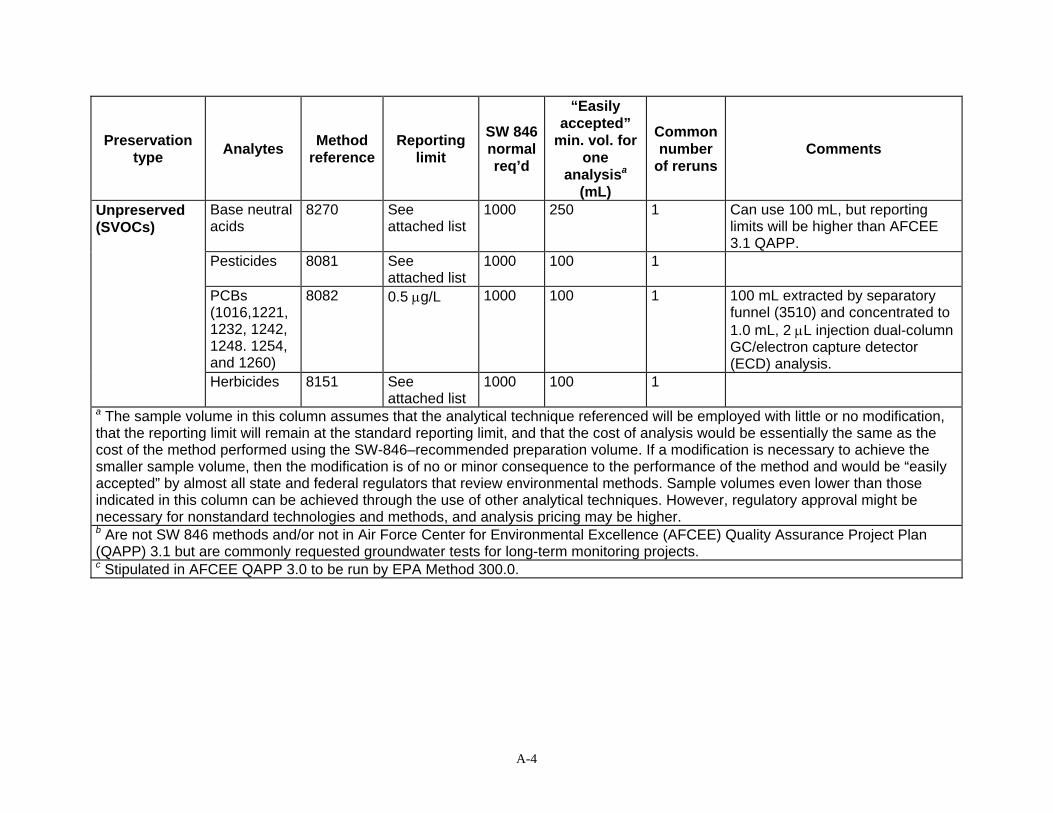
A-4
Preservation type Analytes Method
referenceReporting
limit
SW 846 normal req’d
“Easily accepted”
min. vol. for one
analysisa
(mL)
Common number
of rerunsComments
Base neutral acids
8270 See attached list
1000 250 1 Can use 100 mL, but reporting limits will be higher than AFCEE 3.1 QAPP.
Pesticides 8081 See attached list
1000 100 1
PCBs (1016,1221, 1232, 1242, 1248. 1254, and 1260)
8082 0.5 μg/L 1000 100 1 100 mL extracted by separatory funnel (3510) and concentrated to 1.0 mL, 2 μL injection dual-column GC/electron capture detector (ECD) analysis.
Unpreserved (SVOCs)
Herbicides 8151 See attached list
1000 100 1
a The sample volume in this column assumes that the analytical technique referenced will be employed with little or no modification, that the reporting limit will remain at the standard reporting limit, and that the cost of analysis would be essentially the same as the cost of the method performed using the SW-846–recommended preparation volume. If a modification is necessary to achieve the smaller sample volume, then the modification is of no or minor consequence to the performance of the method and would be “easily accepted” by almost all state and federal regulators that review environmental methods. Sample volumes even lower than those indicated in this column can be achieved through the use of other analytical techniques. However, regulatory approval might be necessary for nonstandard technologies and methods, and analysis pricing may be higher. b Are not SW 846 methods and/or not in Air Force Center for Environmental Excellence (AFCEE) Quality Assurance Project Plan (QAPP) 3.1 but are commonly requested groundwater tests for long-term monitoring projects. c Stipulated in AFCEE QAPP 3.0 to be run by EPA Method 300.0.
Appendix B
State Survey and Responses

B-1
STATE SURVEY AND RESPONSES A questionnaire prepared by the Diffusion/Passive Sampler ITRC team was sent to the ITRC State Points of Contact (POCs) on March 1, 2006. Responses were received from 16 states, some answering in more detail than others. The survey form as it was delivered to the POCs is included below. The state responses to the question are broken into the three monitoring categories: (1) compliance, (2) characterization, and (3) long-term or surveillance monitoring. The yes and no responses are illustrated in the chart which follows the survey. It is clear that no direct prohibitions exist in statutes, regulations, or guidance. To the contrary, the team has identified that passive samplers have been used in every state in the nation and many foreign countries. In addition to the chart, a number of states provided more detailed explanation of their states use and acceptance of passive samplers.
E-MAIL SUBJECT LINE: ITRC SURVEY REQUEST – Diffusion Sampler
To: ITRC State Points of Contact
From: Kim Ward – NJ Diffusion Sampler Team & Steve Hill, Team Program Advisor
Date: March 1, 2006
SURVEY REQUEST: This request intends to identify state regulatory barriers to the consideration and deployment of passive sampler technologies for the collection of groundwater samples.
TEAM BACKGROUND/GOAL: The team’s goal is to evaluate, document, and provide guidance for the appropriate deployment of passive groundwater sampling technologies. A passive sampler can acquire a sample from a discrete well interval without pumping or purge techniques. All of the passive sampler technologies rely on the sampling device being exposed to the media in ambient equilibrium during the sampler deployment period.
Since 2001 the team has completed
1. DSP-1, 2001, Users Guide for Polyethylene-Based Passive Diffusion Sampler to Obtain VOC Concentrations in Wells
2. DSP-2, 2004, Diffusion Sampler Resource Guide, CD, Version 3
3. DSP-3, 2004, Technical and Regulatory Guidance for Using Polyethylene Diffusion Samplers to Monitor VOCs in Groundwater
4. DSP-4, February 2006, Technology Overview of Passive Sampler Technologies
PROGRAMS/STAFF TO TARGET FOR SURVEY: Staff who review sampling plans or the use of innovative technologies within your department should be consulted during the completion of these brief survey questions.
TIMEFRAME FOR COMPLETION: The survey is to be delivered to the state ITRC POCs March 1 and returned on April 14, 2006.
HOW THE INFORMATION WILL BE USED: The team will use this information to evaluate the extent statutes, regulations, or guidance prohibit the use of innovative sampling technologies, specifically passive samplers, to collect water samples and provide reliable
B-2
analytical information. This information will be summarized in DSP-5, Protocol for Use of Five Passive Samplers to Sample for a Variety of Contaminants in Groundwater. This protocol will be sent to the ITRC state POCs for draft review in the 3rd quarter of 2006.
STATE TEAM MEMBERS: Team leader, Kim Ward, New Jersey, DEP; Hugh Reick, Arizona, DEQ; Jim Bernard, Virginia, DEQ, and James Taylor, California, Regional Water Quality Control Board—Central Valley Region, are current members of the team.
FOR ADDITIONAL DETAILS ON TEAM: The 2006 team product DSP-5, Protocol for Use of Five Passive Samplers to Sample for a Variety of Contaminants in Groundwater (Tech Reg eq.) is the 5th and final document the team will develop. These same passive samplers are evaluated in DSP-4 (2006) and are classified on the basis of sampler mechanism and nature of the collected sample. The technology overview was available for POC courtesy during the fall of 2005. If you need more background on these passive sampling technologies, the final DSP-4 can be downloaded at www.itrcweb.org in Guidance Documents. Please reply to this e-mail with your answers to the following questions. Please be sure Kim Ward and Steve Hill are included in your response:
• Kim Ward, Team Leader, [email protected] (609 584-4277) and
• Steve Hill, ITRC Program Advisor, [email protected] (208-442-4383)
Thank you in advance for your attention to this request. Your state’s input will make our team’s products more valuable to states and the broader environmental community.
Questions:
1. Does your state have any statutes, regulations, or guidance that prohibit or impede the use of passive sampling technologies for the collection of groundwater samples? Yes No Left Double click on your choice of answer box. In the window click checked under default value.
Examples of requirements that might impede or prohibit the use of passive sampler systems might include:
• Groundwater monitoring requirements may vary depending on the objective of the data. Examples include groundwater samples collected for compliance, characterization, or long-term (surveillance or performance) monitoring.
• Field parameter collection may be required to demonstrate a stable geochemical environment before sample collection.
2. If you answered yes to the question above; please identify, via electronic copy or html link, the specific statue, regulation, or guidance that forms the basis for the prohibition or impedance and identify if it applies to any particular sample type (e.g. compliance samples, characterization sampling, long-term sampling, or others).
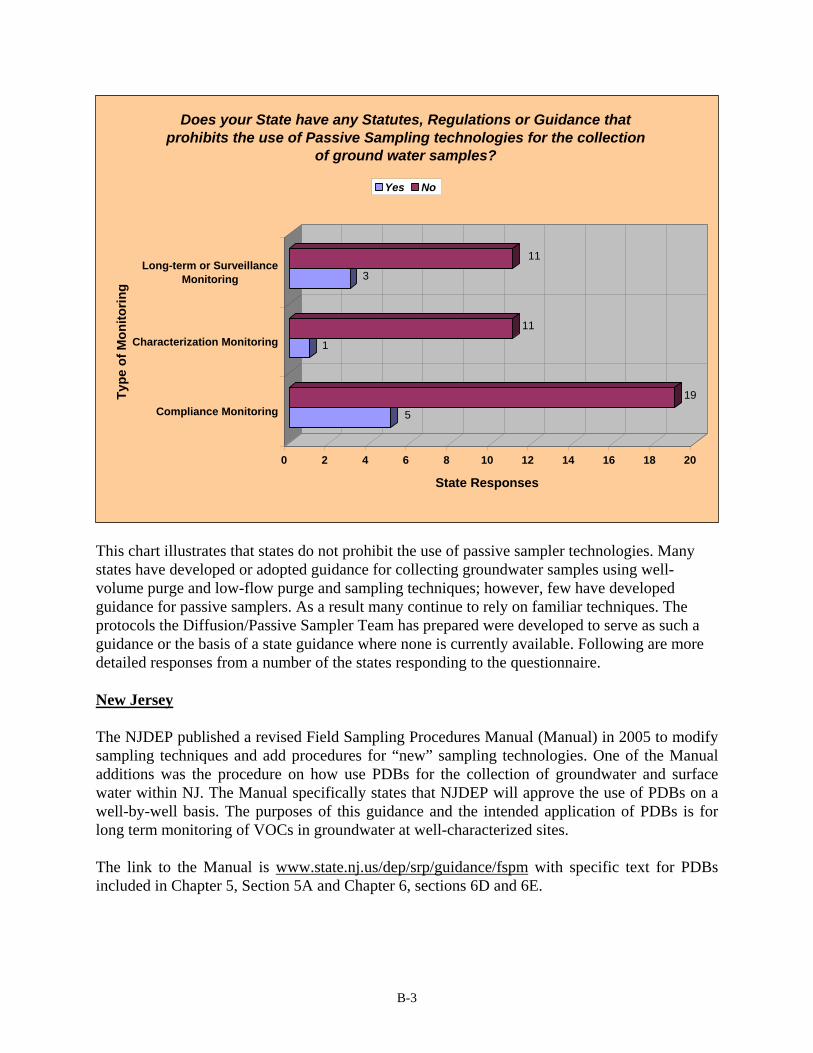
B-3
This chart illustrates that states do not prohibit the use of passive sampler technologies. Many states have developed or adopted guidance for collecting groundwater samples using well-volume purge and low-flow purge and sampling techniques; however, few have developed guidance for passive samplers. As a result many continue to rely on familiar techniques. The protocols the Diffusion/Passive Sampler Team has prepared were developed to serve as such a guidance or the basis of a state guidance where none is currently available. Following are more detailed responses from a number of the states responding to the questionnaire. New Jersey The NJDEP published a revised Field Sampling Procedures Manual (Manual) in 2005 to modify sampling techniques and add procedures for “new” sampling technologies. One of the Manual additions was the procedure on how use PDBs for the collection of groundwater and surface water within NJ. The Manual specifically states that NJDEP will approve the use of PDBs on a well-by-well basis. The purposes of this guidance and the intended application of PDBs is for long term monitoring of VOCs in groundwater at well-characterized sites. The link to the Manual is www.state.nj.us/dep/srp/guidance/fspm with specific text for PDBs included in Chapter 5, Section 5A and Chapter 6, sections 6D and 6E.
5
19
1
11
3
11
0 2 4 6 8 10 12 14 16 18 20
State Responses
Compliance Monitoring
Characterization Monitoring
Long-term or SurveillanceMonitoring
Type
of M
onito
ring
Does your State have any Statutes, Regulations or Guidance that prohibits the use of Passive Sampling technologies for the collection
of ground water samples?
Yes No
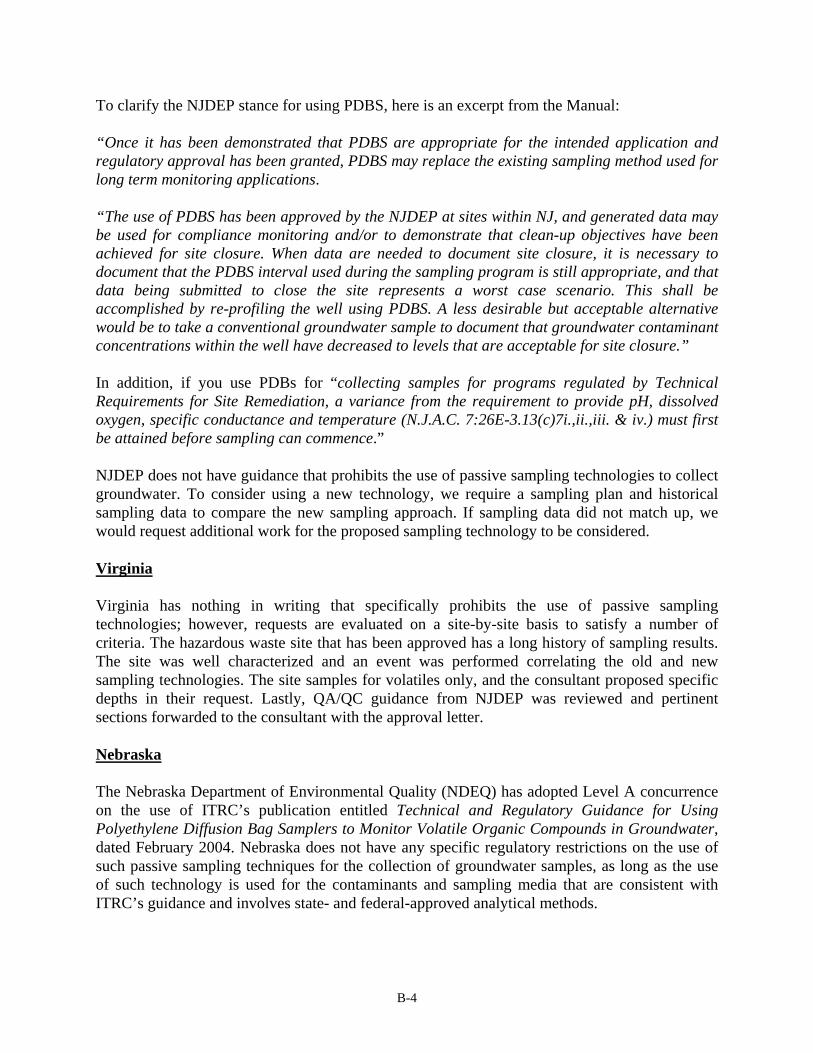
B-4
To clarify the NJDEP stance for using PDBS, here is an excerpt from the Manual: “Once it has been demonstrated that PDBS are appropriate for the intended application and regulatory approval has been granted, PDBS may replace the existing sampling method used for long term monitoring applications. “The use of PDBS has been approved by the NJDEP at sites within NJ, and generated data may be used for compliance monitoring and/or to demonstrate that clean-up objectives have been achieved for site closure. When data are needed to document site closure, it is necessary to document that the PDBS interval used during the sampling program is still appropriate, and that data being submitted to close the site represents a worst case scenario. This shall be accomplished by re-profiling the well using PDBS. A less desirable but acceptable alternative would be to take a conventional groundwater sample to document that groundwater contaminant concentrations within the well have decreased to levels that are acceptable for site closure.” In addition, if you use PDBs for “collecting samples for programs regulated by Technical Requirements for Site Remediation, a variance from the requirement to provide pH, dissolved oxygen, specific conductance and temperature (N.J.A.C. 7:26E-3.13(c)7i.,ii.,iii. & iv.) must first be attained before sampling can commence.” NJDEP does not have guidance that prohibits the use of passive sampling technologies to collect groundwater. To consider using a new technology, we require a sampling plan and historical sampling data to compare the new sampling approach. If sampling data did not match up, we would request additional work for the proposed sampling technology to be considered. Virginia Virginia has nothing in writing that specifically prohibits the use of passive sampling technologies; however, requests are evaluated on a site-by-site basis to satisfy a number of criteria. The hazardous waste site that has been approved has a long history of sampling results. The site was well characterized and an event was performed correlating the old and new sampling technologies. The site samples for volatiles only, and the consultant proposed specific depths in their request. Lastly, QA/QC guidance from NJDEP was reviewed and pertinent sections forwarded to the consultant with the approval letter. Nebraska The Nebraska Department of Environmental Quality (NDEQ) has adopted Level A concurrence on the use of ITRC’s publication entitled Technical and Regulatory Guidance for Using Polyethylene Diffusion Bag Samplers to Monitor Volatile Organic Compounds in Groundwater, dated February 2004. Nebraska does not have any specific regulatory restrictions on the use of such passive sampling techniques for the collection of groundwater samples, as long as the use of such technology is used for the contaminants and sampling media that are consistent with ITRC’s guidance and involves state- and federal-approved analytical methods.

B-5
There are regulations that specify that the Department must review/approve sampling and analytical methods but this process is standard with all environmental sampling activities. Within Nebraska Title 118, entitled “Groundwater Quality Standards and Use Classification,” Chapter 5 stipulates:
Paragraph 001: Sample collection shall be performed according to methods approved by the Department to insure the collection of a representative sample. Paragraph 002: Any sample analysis method used must be approved by the U.S. Environmental Protection Agency (EPA) and/or approved by the Department and provide protection to public health, safety, and the environment.
Below is a reference to the possible use of passive diffusion bag samplers within one of NDEQ’s petroleum release guidance documents entitled Risk-Based Corrective Action (RBCA) at Petroleum Release Sites: Tier 1/Tier 2 Assessments and Reports. In Section 4.6.5 it states:
Any method used to collect groundwater samples must minimize agitation. Suction, airlift (inertial lift) or peristaltic pumps are not to be used to collect samples. Acceptable sampling methods include the use of: gear-drive pumps; helical rotor pumps; pneumatic piston pumps (sealed drive gas); bladder pumps; passive diffusion bag samplers (for wells totally screened below the water table where MTBE is not identified and a vertical gradient is not present in the aquifer); bailing (provided the bailer is lowered gently into the groundwater); Hydrosleeves.
In addition, the Department often reviews groundwater sampling work plans and other related QA/QC documents, such as Quality Assurance Project Plans, for approval, and as such, those sampling procedure documents are subject to conformance with groundwater sampling and monitoring requirements set forth in various state environmental programs and regulations. However, none of the guidance and regulatory requirements are intended to inhibit or impede the use of passive diffusion bag sampling technology. In fact, not only do the regulatory requirements we have in place not inhibit or impede the use of passive diffusion bag sampling technology; on the contrary, they allow our agency to institute a technical review and approval process that is necessary to ensure that, when used, the technology is applied to the appropriate conditions that are consistent with EPA approved methods and ITRC’s guidance document. South Carolina South Carolina DHEC does not have any regulations or guidance that prohibits the use of passive sampling technologies to collect groundwater. In fact, South Carolina has been proactive in encouraging their use (Passive sampling technologies have been used successfully at several Resource Conservation and Recovery Act and CERCLA sites in SC).
B-6
Illinois Illinois regulation and/or guidance do not specify a technology to be used. However, sampling and analysis procedures must provide a reliable indication of groundwater quality below the unit. We would review a proposal and if appropriate, would approve. Georgia The Hazardous Sites Response Program (HSRP) functions under the authority of the Georgia Hazardous Site Response Act (Chapter 391-3-19) of the Georgia Hazardous Waste Management Act (§ 12-8-60). The Rules promulgated by the Hazardous Site Response Act specify that “approved analytical test methods” are SW-846 test methods that have been promulgated, recommended, or otherwise approved by USEPA, or methods approved by EPD. The Rules also specify that “all pertinent field data and the results of all laboratory analyses [be] supported by sufficient quality assurance/quality control data to validate results” (Section 391-3-19.06(3)(b)(3)(xi)). There is no specific language in the Rules regarding “approved sample collection methods”; however, the HSRP relies on test methods and quality assurance guidance specified the Region 4 USEPA Environmental Investigations Standard Operating Procedures and Quality Assurance Manual (November 2001) and Test Methods for Evaluating Solid Waste, Physical/Chemical Methods, USEPA Publication SW-846. Neither document provides guidance for the collection groundwater samples using passive diffusion sampling methods. Georgia HSRP has offered to allow diffusion sampling on a “Site-by-Site” basis for the purpose of long-term surveillance or performance monitoring if, after a period of 2 years, diffusion sampling methods are shown to be representative of site conditions in side-by-side comparisons using low-flow sampling methods. Ohio Ohio does not have rules or guidance prohibiting the use of passive sampling technologies to collect groundwater samples. Ohio has addressed passive diffusion sampling in the Ohio EPA Technical Guidance Manual (TGM) for Hydrogeologic Investigations and Ground Water Monitoring. This document recommends techniques for investigating groundwater at known or potential groundwater pollution sources. TGM Chapter 10 (available at www.epa.state.oh.us/ddagw/Documents/tgmguid10sap2006final.pdf covers diffusion sampling but does not address other types of passive sampling. The document was prepared by the Division of Drinking and Ground Waters with review and comment by the agency’s waste management divisions (Hazardous Waste Management, Emergency and Remedial Response, and Solid and Infectious Waste Management). The following is excerpted from the two places in the chapter where passive diffusion sampling is covered:

B-7
Passive Diffusion Samplers (pp. 10–14) Passive diffusion bag samplers (PDBs) use a low-density polyethylene diffusion membrane filled with deionized water to collect water samples for VOC analysis. The polyethylene acts as a semi-permeable membrane allowing volatile contaminants to diffuse into the deionized water. Once chemical equilibrium is reached, a water sample that is representative of the VOC concentrations may be obtained for the interval at which the sampler is placed. Use of multiple PDB samplers at different depths within a well screen interval can allow for a vertical profile of the VOC contamination within the well. Advantages of PDB sampling include its low cost, minimal purging and water disposal, and the ability to monitor a variety of VOCs. A disadvantage is that they are not applicable to inorganics and other contaminants that do not readily diffuse across the semi-permeable membrane. PDB sampling may not be applicable for sites where water in the well casing may not be representative of the saturated zone adjacent to the well screen. This may occur when water in the well casing is stagnant, or when there is a vertical flow within the well. In addition, PDB samplers do not provide a discrete time-interval sample, but rather an average of the concentrations in the well over the equilibrium period. Passive diffusion bag samplers are appropriate for long-term monitoring at well-characterized sites. The target analytes should be limited to chemicals that have been demonstrated to diffuse well through polyethylene (i.e., most VOCs and limited non-VOCs), as listed in Tables 1-1 and 4-1 of ITRC’s PDB sampler guidance document (ITRC, 2004). A combined version of these tables is provided below as a reference (Table 10.2). However, as the compound list may change as further tests are conducted, ITRC (http://www.itrcweb.org) should be contacted for the most recent list of chemicals favorable for sampling with PDB. The site sampled should have sufficient groundwater flow to provide equilibrium between the water in the well screen and the surrounding groundwater zone. ITRC (2004) suggests that care should be given in interpreting PDB results when the hydraulic conductivity is <10-5 cm/s, the hydraulic gradient is <0.001, or the groundwater velocity is < 0.5 ft/day. Use of PDBs is not appropriate when a vertical flow in the well exists. A deployment time of at least two weeks is recommended to allow for diffusion of the analytes across the membrane (ITRC, 2004, Vroblesky, 2001; Vroblesky and Hyde, 1997; Yeskis and Zavala, 2001; and U.S.G.S , 2002). Passive Diffusion Sampling (pp. 10–34) Passive diffusion samplers are a simple and inexpensive way to sample monitoring wells for a variety of VOCs. As described in the previous section (Types of Equipment), the passive diffusion bag is suspended in the well at the target horizon by a weighted line and allowed to equilibrate with the surrounding water (typically 2 weeks). The sampler bags are retrieved from the well after the equilibration period and the enclosed water is immediately transferred to the sample container. Passive diffusion sampling is recommended only for long term groundwater monitoring of VOCs at well-characterized sites (ITRC, 2004). PDS is not applicable for inorganics, were there is vertical flow, or when discrete interval samples are needed. See pages 10–15 for more description of the applicability of PDS. The NJDEP published a revised Field Sampling Procedures Manual (Manual) in 2005 to modify sampling techniques and add procedures for “new” sampling technologies. One of

B-8
the Manual additions was the procedure on how use PDBs for the collection of groundwater and surface water within NJ. The Manual specifically states that NJDEP will approve the use of PDBs on a well by well basis. The purposes of this guidance and the intended application of PDBs is for long term monitoring of VOCs in groundwater at well-characterized sites.
Rhode Island Rhode Island Solid Waste, LUST, Site Remediation statues, regulations or guidance does not specify how any samples are collected. Decisions as to whether a diffusion bag sampler is appropriate are made on a site-by-site basis. Our UST Section has Regulations/Guidance we have to follow; however, our Contaminated Sites Section is not under the same constraints. Our Tier 1 Guidance, page 23: www.iowadnr.com/land/ust/technicalresources/lustsiteassessment/documents/tier1guide.pdf Michigan Although, there is no statute, regulation, or guidance in Michigan that prohibits the use of passive sampling technologies, the applicable groundwater sampling guidance can be interpreted to impede implementation of passive sampling technologies in that it specifically recommends low-flow sampling methods for the collection of groundwater samples. However, it should be noted that the guidance does allow for the use of another sampling method if approved by the Department. For clarification, the applicable groundwater sampling guidance is copied below. The title of the Guidance Document is: Attachment 5 (Collection of Samples for Comparison to Generic Criteria) of Remediation and Redevelopment Division’s (RRD) Operational Memorandum 2 (Sampling and Analysis Guidance). A link to the guidance is provided in the below. COLLECTION OF GROUNDWATER SAMPLES FOR COMPARISON TO THE GENERIC CRITERIA www.deq.state.mi.us/documents/deq-rrd-OpMemo_2_Attachment5.pdf
General Considerations Groundwater samples collected for analyses must be representative of the water moving in the aquifer, in the contaminant plume or in the target zone where contaminants are expected to be located or to migrate. Groundwater samples must represent the contaminant concentrations, including dissolved and naturally suspended particles. Stagnant water in monitor well casings is not representative of the groundwater. Purging of the stagnant water in monitor well casings is necessary but must minimize changes in groundwater chemistry to yield water samples that are representative of the groundwater. Indicator parameters including temperature, pH, dissolved oxygen, specific conductivity and turbidity must be monitored during the purging process to determine stabilization between the well casing waters and the formation waters. Turbidity is the most conservative indicator of stabilization as it is often the last to stabilize. Turbidity in groundwater samples may be naturally
B-9
occurring, caused by the contamination, or a result of sampling disturbances such as accidental inclusion of aquifer matrix materials from disturbances or mixing that may occur while sampling. Knowledge of site geology, well design, and sampling methodology is helpful in determining the source of turbidity and the method of sampling. Turbidity due to sampling disturbances should be eliminated or minimized while naturally occurring turbidity or turbidity due to contamination should not. A sampling methodology must be used that accounts for the effects of aquifer heterogeneities while minimizing alterations in water chemistry that could result from sampling disturbances. The MDEQ will accept properly conducted purging methods designed to minimize drawdown by controlling the flow from the well while monitoring stabilization indicator parameters, commonly referred to as Low-Flow methods. Available Low-Flow procedures include United States Environmental Protection Agency, Office of Research and Development, Office of Solid Waste and Emergency Response, EPA/540/S-95/504, December 1995, EPA Ground Water Issue, Low-Flow (Minimal Drawdown) Ground-Water Sampling Procedures, Robert Puls and Michael Barcelona (http://www.epa.gov/ahaazvuc/download/issue/lwflw2a.pdf) and Low Stress (low flow) Purging and Sampling Procedure for the Collection of Ground Water Samples from Monitoring Wells, United States Environmental Protection Agency Region 1, July 30, 1996, Revision 2 (http://www.epa.gov/region01/measure/well/wellmon.html). If another sampling methodology is used, documentation must be submitted to the MDEQ with the data that demonstrates why it is as representative of aquifer conditions as low-flow methodologies. Careful use of the Low-Flow methods is essential in collection of groundwater samples from wells that contain non-aqueous phase liquids, as these substances may be stratified in the monitoring well. Where non-aqueous phase liquid is present, refer to additional guidance for sampling strategies for non-aqueous phase liquids available in RRD Operational Memorandum No. 4, Attachment 5.
Appendix C
Diffusion/Passive Sampler Team Contacts

C-1
DIFFUSION/PASSIVE SAMPLER TEAM CONTACTS
Kim Ward (Team Leader) NJDEP 401 E. State Street, 4th Fl Trenton, New Jersey 08625 Tel 609-584-4277 [email protected]
George Nicholas (Team Leader) NJDEP 401 E. State Street, 4th Fl Trenton, New Jersey 08625 Tel 609-984-6565 [email protected]
Lilly Barkau Wyoming DEQ Tel 307-777-7541 Fax 307-777-5973 [email protected] Walter Berger Mitretek Systems Tel 703-610-2509 [email protected] James Bernard Draper Aden Associates 8090 Villa Park Drive Richmond, VA 23228 Tel 804-264-2228 Fax 804-264-8773 [email protected] Sandy Britt, CHG ProHydro, Inc. 1011 Fairport Road Fairport, NY 14450 Tel 585-385-0023 ph. Fax 585-385-1774 fax [email protected] www.SnapSampler.com Andre Brown W.L. Gore and Associates Tel 415-648-0438 Fax 415-648-0398 [email protected]
Hal Cantwell Oklahoma DEQ and Land protection Tel 405-702-5139 [email protected] Kent Cordry GeoInsight, Inc Tel 800-996-2225 [email protected] Diane Easley USEPA Region 7 Tel 913-551-7797 Fax 913-551-7063 [email protected] Theodore Ehlke USGS Mountain View Office Park Tel 609-771-3924 [email protected] Glen Ernstmann Burns & McDonnell Tel 816-822-3222 Fax 816-822-3494 [email protected] Sandra Gaurin BEM Systems, Inc. Tel (908) 598-2600, Ext. 157 [email protected]

C-2
Bob Genau DuPont Barley Mill Plaza, 27-2274 Dover, Delaware Tel 302-992-6771 [email protected] Joseph Gibson Earth Tech Tel 850-862-5191 [email protected] Don Gronstal AFRPA Tel 916-643-3672, Ext. 211 [email protected] Phillip Harte USGS Tel 603-2267813 [email protected] Keith Henn Tetra Tech URS, Inc Tel 412-921-8146 Fax 412-921-6550 [email protected] Steve R. Hill RegTech, Inc 6750 Southside blvd Nampa, Idaho 83686 Tel 208-442-4383 Fax 208-442 1762 [email protected] Jay W. Hodney, Ph. D W.L. Gore and Associates, Inc 100 Chesapeake Blvd P.O. Box 10 Elkton, MD 21922-0010 Tel 410-506-4774 Fax 410-506-4780 [email protected]
Ron Hoeppel NFESC Code ESC411 Tel 805-982-1655 [email protected] Tom Imbrigiotta USGS Tel 609-771-3914 [email protected] Sharon Matthews USEPA Region 4 Tel 706-355-8608 [email protected] Paul Ollila Massachusetts DEP Tel 508-849-4015 [email protected] Dee O’Neill Columbia Analytical Services Tel 360-577-7222 [email protected] Louise Parker USA ERDC CRREL Tel 603-646-4393 [email protected] Hugh Rieck USACOE 12565 West Center Road Omaha, NE 68144 Tel 402-697-2660 [email protected] Joseph Saenz Naval Facilities Engineering Center Tel 805-982-6501 [email protected]

C-3
Javier Santillan HQ AFFCEE/TDE Tel 210-241-9441 Fax 210-536-5989 [email protected] Walt Scheible Columbia Analytical labs [email protected] George Shaw W.L. Gore and Associates, Inc 100 Chesapeake Blvd P.O. Box 10 Elkton, MD 21922-0010 Tel 410-506-4776 Fax 410-506-4780 [email protected] James D. Taylor, R.G. CV-RWQCB 11020 Sun Center Drive # 200 Rancho Cordova, CA 95670-6114 Tel 916-464-4669 Fax 916-464-4797 [email protected] Joey Trotsky US Navy – NFESC Tel 805-982-1258 Fax 805-982-4304 [email protected] John Tunks Mitretek Systems, Tel 303-779-2672 [email protected] Brad Varhol EON Products Tel 800-474-2490 [email protected]
Don Vroblesky, PhD USGS Tel 803-750-6115 [email protected] Barron Weand, PhD Mitretek Systems Tel 703-610-1745 [email protected] Mark Weeger TX Commission on Environmental Quality Tel 512-239-2360 [email protected] Jim Whetzel W.L. Gore and Associates, Inc 100 Chesapeake Blvd P.O. Box 10 Elkton, MD 21922-0010 [email protected] Rod Whitten Air Force Real Property Agency Tel 415-977-8885 Fax 415-977-8900 [email protected] Richard Willey EPA Region 1 Office of Site Remediation & Restoration Tel 617-918-1266 [email protected] Mark Wilson Columbia Analytical Services Tel 585-749-0634 [email protected]
Appendix D
Acronyms

D-1
ACRONYMS
ASTM ASTM International, formerly American Society of Testing and Materials AFB Air Force Base AFCEE Air Force Center for Environmental Excellence BFB bromofluorobenzene BOD biochemical oxygen demand BTEX benzene, toluene, ethylbenzene, and xylenes CO carbon monoxide COD chemical oxygen demand CLP Contract Laboratory Program CRREL Cold Regions Research and Engineering Laboratory DCE dichloroethene DQO data quality objective ECOS Environmental Council of States EDTA ethylenediaminetetraacetic acid EPA U.S. Environmental Protection Agency ERDC Engineer Research and Development Center ERIS Environmental Institute of the States ETV Environmental Technology Verification GC/ECD gas chromatograph/electron capture detector GW groundwater HMX oxyhydro 1,3,5,7-tetranitro-1,3,5,7-triazine ITRC Interstate Technology & Regulatory Council LDPE low-density polyethylene MDL method detection limit MEE methane, ethane, and ethene MEK 2-butanone MIBK 4-methyl-2-pentanone MTBE methyl tert-butyl ether NAWC Naval Air Warfare Center nd nondetect NJDEP New Jersey Department of Environmental Protection OD outside diameter PAH polycyclic aromatic hydrocarbon PCB polychlorinated biphenyl PCE perchloroethene PDB polyethylene diffusion bag POC point of contact PP polypropylene PsMS polysulfone membrane sampler PVC polyvinyl chloride QA quality assurance QAPP quality assurance project plan QC quality control

D-2
RCRA Resource Conservation and Recovery Act RDX 2,3,5-trinitro-1,3,5 triazine RPP rigid, porous polyethylene RPO Remedial Process Optimization SOW statement of work SVOC semivolatile organic compound TAME tertiary amyl methyl ether TBA tert-butyl alcohol TCA trichloroethane TCE trichloroethene TDS total dissolved solids TNB trinitrobenzene TNT trinitrotoluene TOC total organic carbon USACE U.S. Army Corp of Engineers USGS U.S. Geological Survey VOA volatile organic analysis VOC volatile organic compound