protein structure alignment and comparison
TRANSCRIPT
27th November 2008, University of Warwick
Natalio Krasnogorwww.cs.nott.ac.uk/~nxk
Interdisciplinary Optimisation LaboratoryAutomated Scheduling, Optimisation & Planning Research Group
School of Computer Science and Information Technology
Centre for Integrative Systems BiologySchool of Biology
Centre for Healthcare Associated InfectionsInstitute of Infection, Immunity & Inflammation
University of Nottingham
An on-line Decision Support System for Protein Structure Comparison
The ProCKSI-Server
1

27th November 2008, University of Warwick
Outline
Introduction
− Brief introduction to proteins
− Protein structures Comparison
− Methods
ProCKSI
− Motivation
− External Methods
− USM & MAX-CMO
− Consensus building
Results
− From a structural bioinformatics perspective
− From a Computational perspective
Conclusions
Acknowledgement
2

27th November 2008, University of Warwick
Introduction
3
www.procksi.org

27th November 2008, University of Warwick
What are Proteins?
Proteins are biological molecules of primary importance to the functioning of living organisms
Perform many and varied functions
4

27th November 2008, University of Warwick
Structural Proteins: the organism's basic building blocks, eg. collagen, nails, hair, etc
Enzymes: biological engines which mediate multitude of biochemical reactions. Usually enzymes are very specific and catalyze only a single type of reaction, but they can play a role in more than one pathway.
Transmembrane proteins: they are the cell’s housekeepers, eg. By regulating cell volume, extraction and concentration of small molecules from the extracellular environment and generation of ionic gradients essential for muscle and nerve cell function (sodium/potasium pump is an example)
5

27th November 2008, University of Warwick
Protein Structures
Varying: size, shape, structure
Structure determines their biological activity
“Natures Robots”
Understanding protein structure is key to understanding function and dysfunction
6

27th November 2008, University of Warwick
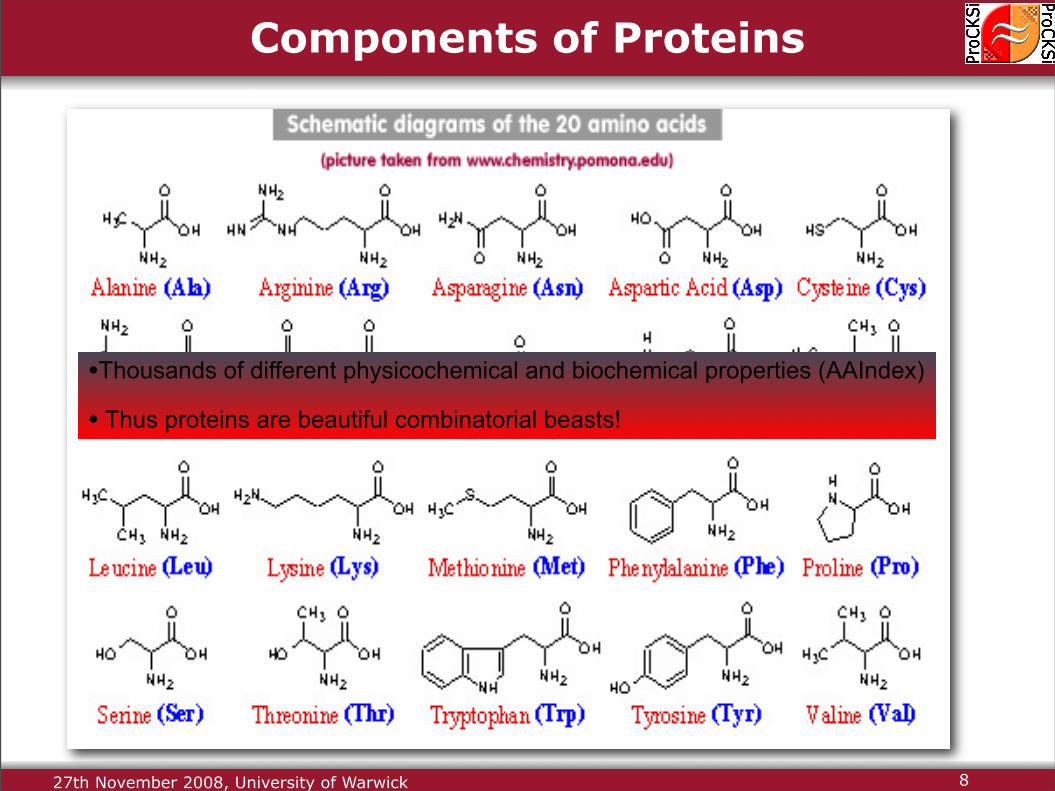
Components of Proteins
Build Blocks:− Amino Acids− Common Basic Unit
Livingstone and Barton:(1993)• Distinct “side chains”
• 20 Amino Acid Types
7

27th November 2008, University of Warwick
Components of Proteins
8
27th November 2008, University of Warwick
Components of Proteins
8
•Thousands of different physicochemical and biochemical properties (AAIndex)
• Thus proteins are beautiful combinatorial beasts!

27th November 2008, University of Warwick
Protein Synthesis Amino Acid Sequences
− AAs polymerised into Chains (Residues)
− Gene sequence determines Protein sequence
Protein Structure
− Chains fold into specific compact structures
Structure formation (folding) is spontaneous
Sequence determines Structure
Structure determines function
9

27th November 2008, University of Warwick
Determining Protein Structures
Protein Structure determination is slow and difficult
Determining protein sequence is relatively easy (Genomics)
PDB vs Genbank
Thomas Splettstoesser
10

27th November 2008, University of Warwick
Comparing Protein Structures
• Proteins build the majority of cellular structures and perform most life functions
• Extend knowledge about the protein universe:– Understand interrelations
between structures and functions of proteins through measured similarities
– Group (cluster) proteins by structural similarities as to infer commonalities
• Goal is to predict functions of proteins from their structure, or design new proteins for specific functions
• Considering any two objects:
What does “similar” mean?
Similar or not? How / Where similar?
11

27th November 2008, University of Warwick
Protein Structure Comparison
Picture source: http://www.cathdb.info
Many different similarity comparison methods available, each with its own strengths and weaknesses
Different concepts of similarity: sequence vs. structural, local vs. global, chemical role vs. biological function vs. evolution sequence vs. …
Different algorithms and implementations: exact vs. approximation vs. heuristic, local vs. global search
Maximum Contact Map Overlap using e.g. Memetic algorithms, Variable Neighbourhood Search, Tabu Search
Similarity comparison of protein structures is not trivial even though it is obvious that proteins may share certain common patterns (motifs)
12

27th November 2008, University of Warwick
Existing ApproachesA variety of structure comparison methodologies exist, e.g.:
•SSAP (Orengo & Taylor, 96)
•ProSup (Feng & Sippl, 96)
•DALI (Holm & Sander, 93)
•CE (Shindyalov & Bourne, 98)
•Max-CMO (Goldman, Papadimitriou, Istrail, Lancia, 99 & 2001)
•LGA (Zemla, 2003)
•USM (Krasnogor & Pelta, 2004)
•SCOP (Murzin, Brenner, Hubbard & Chothia, 95)
•CATH (Orengo, Mithie, Jones, Jones, Swindells & Thornton, 97)13
27th November 2008, University of Warwick
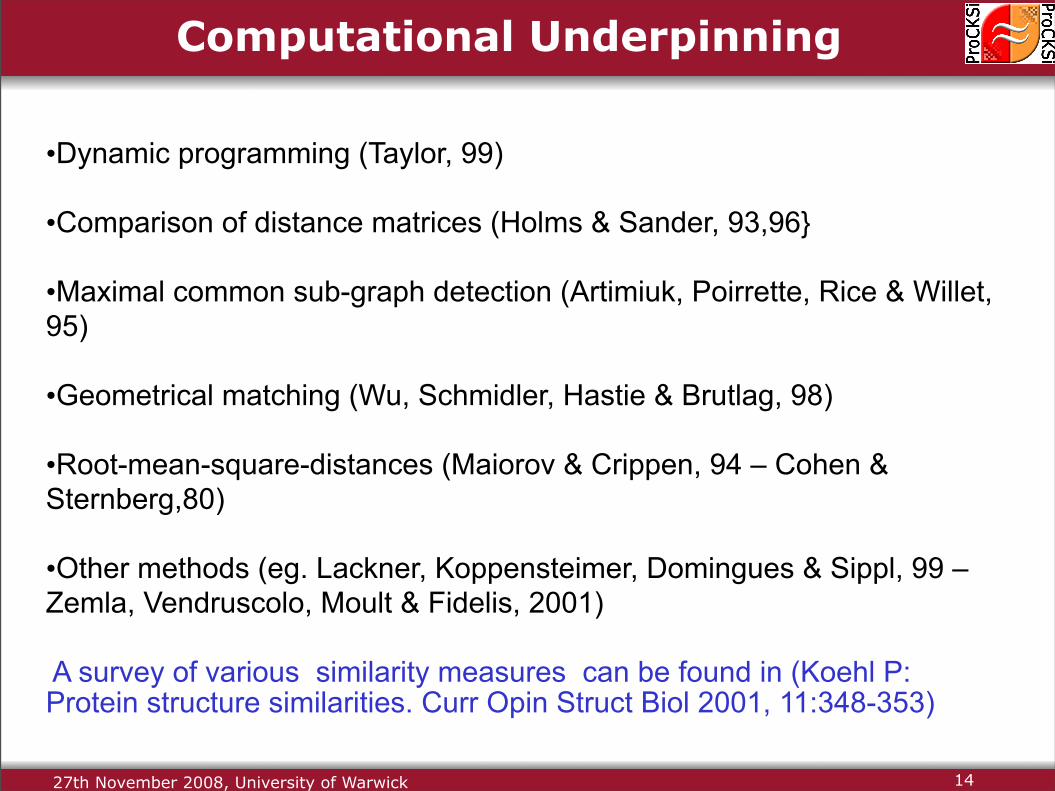
•Dynamic programming (Taylor, 99)
•Comparison of distance matrices (Holms & Sander, 93,96}
•Maximal common sub-graph detection (Artimiuk, Poirrette, Rice & Willet, 95)
•Geometrical matching (Wu, Schmidler, Hastie & Brutlag, 98)
•Root-mean-square-distances (Maiorov & Crippen, 94 – Cohen & Sternberg,80)
•Other methods (eg. Lackner, Koppensteimer, Domingues & Sippl, 99 – Zemla, Vendruscolo, Moult & Fidelis, 2001)
A survey of various similarity measures can be found in (Koehl P: Protein structure similarities. Curr Opin Struct Biol 2001, 11:348-353)
Computational Underpinning
14

27th November 2008, University of Warwick
•No agreement on which of these is the best method
• Various difficulties are associated with each.
• They assume that a suitable scoring function can be defined for which optimum values correspond to the best possible structural match between two structures (clearly not allways true, e.g. RMSD)
• Some methods cannot produce a proper ranking due to:
• ambiguous definitions of the similarity measures or
• neglect of alternative solutions with equivalent similarity values. Structure Comparison, is at its core a multi-competence (multi-objective) problem but it is seldom treated as such, e.g.:
ProSup (Feng & Sippl, 96) optimizes the number of equivalent residues with the RMSD being an additional constraint (and not another search dimension).
DALI (Holm & Sander, 93) combines various derived measures into one value, effectively transforming a multi-objective problem into a (weighted) single objective one.
Some Observations
15

27th November 2008, University of Warwick
What/How are we comparing?
Models, Measures, Metrics & Methods
16
or other tasks...

27th November 2008, University of Warwick
Until very recently researchers would: Focus on steps 1-4 , often collapsed into one single
step Compare one algorithm against others on a given
data set Conclude that their algorithm “is best” for that data
set and write a paperMeanwhile, in the real world… No method is best in all data sets. The biologist will only use the method (s)he is most
familiar with! Regardless of the suitability to his/her problem.
17
Q: How do we change this reality?
A: We make it easy for the biologist to use the correct method (and more)

27th November 2008, University of Warwick
ProCKSI
18
www.procksi.org

27th November 2008, University of Warwick
The ProCKSI-Server
ProCKSI: Protein Comparison, Knowledge, Similarity, and Information
Web Server for protein structure comparison
Decision Support System / analysis tool – Visualises, compares and clusters all similarity measure results– Incorporates all results and suggests a similarity consensus
Workbench / portal for established methods and repositories for protein structure information– Integrates results from many
comparison methods in one place– Home-grown comparison methods,
Max-CMO and USM (using contact maps as their input)
19

27th November 2008, University of Warwick
The ProCKSI-Server
Calculation Manager
Dataset Manager
Requests and Results DataBase /Filesystem
USM
MaxCMO
Local External
ResultsManagement
OverviewManager
StructureManager
AnalysisManager
Task / JobScheduling
TaskManagers
Similarity Comparison
Minimise the Management Overhead for Experiments• Upload your own dataset or download structures from the PDB repository
• Validate your PDB file, and extract desired models and chains
• Choose from multiple similarity comparison methods at one place (including your own similarities) or don’t choose and use all!
• Submit and monitor the progress of your experiment
• Integrate results from all pair-wise comparisons
• Analyse and visualise results from different similarity comparison methods
• Combine results and produce a similarity consensus profile
• Download desired results
20

27th November 2008, University of Warwick
Protein Comparison Methods United
Home-grown methods:− USM
− Max-CMO
External methods:− DaliLight
− FAST
− CE
− TMalign
− Vorolign
− URMS
Additional informational sources:
− CATH, iHOP, RSCB, SCOP
21

27th November 2008, University of Warwick
Home-Grown Methods
Sequenceofatoms
Sequenceofatoms
• Representation of 3D protein structures as 2D contact maps- Atoms that are far away in the linear chain,
come close together in the folded state
- If the distance between two atomsi,j is below a threshold t, they are said to form a contact
• Mathematical description of contact maps- Calculation of all pairwise Euclidean distances between atoms i,j- Translation into a binary, symmetrical
matrix, called the contact map C
• Contact maps in ProCKSIInput for the two main similarity measures:
- Universal Similarity Metric (USM)- Maximum Contact Map Overlap (MaxCMO)
22

27th November 2008, University of Warwick
An Example of a contact map
23
1C7W.PDB

27th November 2008, University of Warwick
Protein Structure Comparison
Protein1NATwithα-helicesandβ-sheets
• Secondary structure elements can be identified in the contact map:− α-helix: wide bands on main diagonal− β-sheet: parallel or perpendicular bands to main
diagonal
• Comparison of contact maps - using different similarity measures, e.g.
number of alignments, overlap values, information content, …
• Protein relationships- Pair-wise comparison of multiple proteins
results in a (standardised) similarity matrix- Comparison of all possible proteins describes
the protein universe
24

27th November 2008, University of Warwick
Protein Structure Comparison
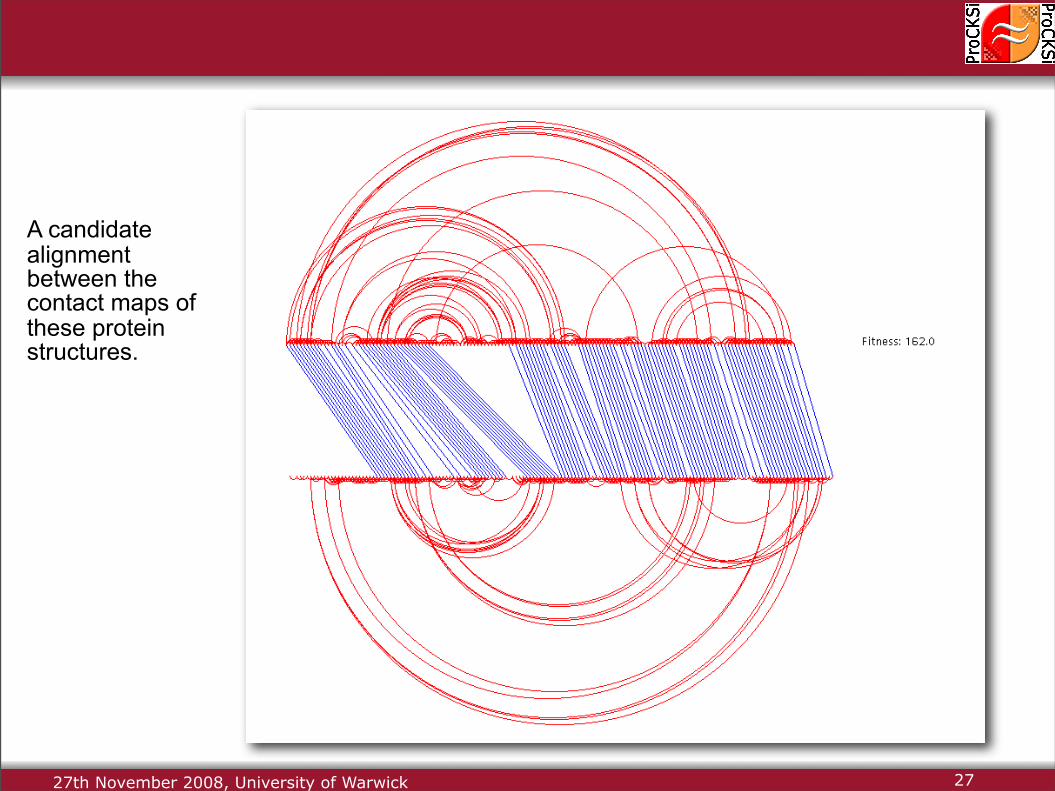
• Maximum Contact Map Overlap (MaxCMO) method is a specific measure of equivalence
- Number of aligned residues (dashed lines) and equivalent contacts (aligned bows, called overlap)
- Overlap gives strong indication for topological similarity taking the local environment into account
25
27th November 2008, University of Warwick
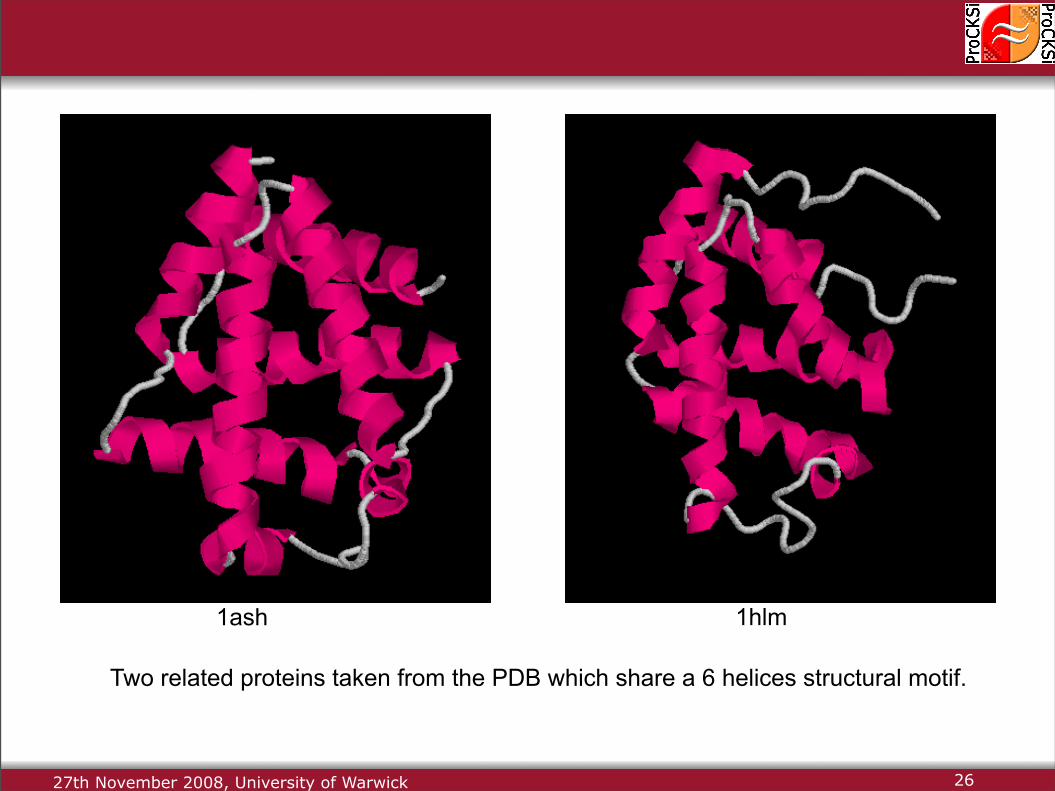
Two related proteins taken from the PDB which share a 6 helices structural motif.
1ash 1hlm
26

27th November 2008, University of Warwick
Two related proteins taken from the PDB which share a 6 helices structural motif.
1ash 1hlm
26

27th November 2008, University of Warwick
Two related proteins taken from the PDB which share a 6 helices structural motif.
1ash 1hlm
26

27th November 2008, University of Warwick
Two related proteins taken from the PDB which share a 6 helices structural motif.
1ash 1hlm
26
Two locally and globally similar contact maps.
27th November 2008, University of Warwick
A candidate alignment between the contact maps of these protein structures.
27

27th November 2008, University of Warwick
Protein Structure Comparison
• Universal Similarity Metric (USM) is the most concept/domain independent measure in ProCKSI
- detects similarities between (quite) divergent structures
- based on the concept of Kolmogorov complexity
- compares the information content of two contact maps by compression (NCD)
28

• Contact maps are the input to Universal Similarity Metric (USM)
• Basic concept is Kolmogorov Complexity:- Prior Kolmogorov complexity K(o):
Measures the amount of information contained in a given object o
- Conditional Kolmogorov complexity K(o1|o2):How much (more) information is needed to produce object o1 if one knows object o2 (as input)
• Calculation of the Normalized Information Distance (NID), which is a proper, universal and normalized similarity metric
27th November 2008, University of Warwick
Protein Structure Comparison
29

27th November 2008, University of Warwick
Protein Structure Comparison
• Kolmogorov complexity is not computable directly, but can be heuristically approximated
• Approximation of the Normalised Information Distance (NID) by the Normalised Compression Distance (NCD):
– Objects are represented as bit strings s (or files) that can be concatenated (.)
– Objects are compressed by any lossless real-world compressor (e.g. zip, bzip2, …)
– Length of the compressed string/fileapproximates the Kolmogorov complexity
00010000000000000 00010000000000000 00001000000000000 11000100000000000 0010000000000000000010000000000011 000000001000001 11 00000000010000110 00000010000000000 00000001 00001000000000000000000000 00000000000001100 00000000010000100 00000000000100000 000000110001100000000011100000000000000110000000000
[0+ε;1+ε ]NCD NCD
000100000000000000001000000000000000001000000000000110001000000000000010000000000000000010000000000011000000001000001 11000000000100001100000001000000000000000001 00001000000000000000000000000000000000011000000000001000010000000000000100000000000110001100000000011100000000000000110000000000
concatenation
000000000011 0001000001 11 000010000110 010000000000 001 000010000 000000000000 000000001100 000010000100 000000100000 011000110000 111000000000110000000000
– Compression of the second string/file using the dictionary of the first one gives cond. Kolmogorov complexity
30

27th November 2008, University of Warwick
Protein Structure Comparison
• Analysis of similarity matrices by hierarchical clustering:– Similarity matrices not easy to analyse,
especially for very large datasets– Similar proteins (with small values)
are grouped together (clustered)– Many clustering algorithms available,
e.g. Ward’s Minimum Variance
– Hyperbolic tree is favourable for large sets of proteins
– Fish-eye perspective– Navigation through the tree
possible– Tree comparison across
methods/data sets
• Results of the hierarchical clustering can be visualised as linear or hyperbolic tree
31

27th November 2008, University of Warwick
Total Evidence Consensus
• Comparison of a pair of proteins P1 and P2 with a given similarity method 1M results in a similarity score 1S12
• Comparison of a dataset with multiple proteins P1 … Pn with the same similarity method 1M results in similarity matrix 1S
• Comparison of the same dataset with multiple similarity methods 1M … mM results in multiple similarity matrices 1S … mS providing multiple similarity measures
P1
P2
1M 1S12
Pn
1S1n1M 1Snn
1Sn1
1S221S21
1S1n1S12
1S11
…
…
…
32
Text

27th November 2008, University of Warwick
Consensus Analysis
Consensus/Greedy – Standardisation of similarity distances: [0;1]– Assumption: For a given pair of structures,
the best method produces the best similarity values– Compilation of a similarity matrix including the
best values from the best similarity method for each pair
Consensus/Average – Expert user selects similarity measures; included measures contribute equally to the
consensus– The intelligent combination of similarity comparison measures leads to better results
than any single one can provide!
Consensus/Weighted – Assign weights to similarity measures according to
preference by ranking, e.g. Z-score > N-Align > RMSD– Optimise weights: Determine minimum, average and
maximum weights by solving linear programming problem
33

• The consensus operator determines how the different similarity matrices are weighted and averaged, e.g.:
27th November 2008, University of Warwick
Total Evidence Consensus
• Each similarity matrix must be standardised [0;1] as different methods produce different qualities and ranges of measures
• Integration of multiple similarity matrices 1M … mM in order to build a consensus similarity matrix C
1Snn1Sn1
1S221S21
1S1n1S12
1S11
mSnnmSn1
1S22mS21
mS1nmS12
mS11CnnCn1
C22C21
C1nC12C11
…
…
…
…
……
…
34

27th November 2008, University of Warwick
Results
35
www.procksi.org

27th November 2008, University of Warwick
Evaluation of CASP6 Results
CASP Target (T0196)
ProCKSI CONSENSUS
MaxCMOOverlap
CASP EvaluationGDT-TS
• Similarity ranking with different methods– CONSENSUS = Unweighted arithmetic average of
USM + MaxCMO/Overlap + DaliLite/Z– Comparable results between ProCKSI‘s CONSENSUS method and the
community‘s gold standard GDT-TS supplemented with expert curation– CONSENSUS detect better model for target T0196
• Evaluation of CASP6 competition results • Prediction of protein structure against a given target
– Evaluation of predictions with similarity comparison methods
36

27th November 2008, University of Warwick
Clustering of Protein KinasesComparison of sequence-based classification with structure-based clustering from single similarity comparison methods and ProCKSI's
consensus method
• Biological background: – Kinases are enzymes that catalyse the transfer of a phosphate to a protein substrate– Play essential role in most of the cellular processes
e.g. cellular differentiation and repair, cell proliferation
• Kinases dataset:− 45 structures published at the Protein Kinase Resourse (PKR) web site
• Hanks' and Hunter's (HH) classification as gold standard:– Based on sequence information– HH-Clusters: Mainly 9 different groups (super-families)– Sub-Clusters: Common features according to the SCOP database
• Experiments with 3 different comparison methods (USM, MaxCMO, DaliLite), 3 different contact map thresholds, 7 different clustering methods (e.g. Wards, UPGAA)
http
://w
ww
.nih
.go.
jp/m
irror
/Kin
ases
37

27th November 2008, University of Warwick
Clustering of Protein Kinases
MaxCMO/OverlapUSM/USMDaliLite/ZSingle Similarity Measures• Best results with clustering
with Ward's Minimum Variance method
• Each method/measure has its own strengths and flaws
Strengths:• Green: Classification on
Class level, e.g. α+β/PK-like• Blue: Detect similarities
up to Species level with e.g. mice, pigs, cows
• Red: Produce mixed bag of proteins being least similar in Blue
Flaws:• MaxCMO/Overlap only distinguishes proteins on Class level• DaliLite/Z adds fairly wrong protein 1IAN to Green• USM/USM reverses order of last two clustering steps (Blue and Green)
38

27th November 2008, University of Warwick
Clustering of Protein Kinases
Similarity Consensus• Exhaustive combination of all
available similarity measures
USM/USM + DaliLite/Z+ MaxCMO/Overlap
USM/USM + DaliLite/Z
General Trends:● Including similarity measures
derived from the number of alignments (e.g. MaxCMO/Align, DaliLite/Align) partially destroy good clustering outside Green● Adding noisier measures (e.g.
MaxCMO/Overlap) still produces comparable good and robust results
Best Results:● Correct clustering with
USM/USM + DaliLite/Z compensating for each others flaws
39

27th November 2008, University of Warwick
Consensus Analysis
Comparison of the influence of the combination of different similarity measures on the quality of the consensus method
• Rost/Sander dataset:– Designed for secondary structure prediction– Pairwise sequence similarity of less than 25%– 126 globular proteins incl. 18 multi-domain proteins
• SCOP classification as gold standard:– Manually curated database containing expert knowledge– Hierarchical classification levels:
Class, Fold, Superfamily, Family, Protein, Species
• Analyse performance of each established comparison method against consensus method using ROC analysis
– Compare true positives against false positives– Performance measure is Area under the Curve (AUC)
40

27th November 2008, University of Warwick
Consensus Analysis - Technique
Column Totals
TNFNN
FPTPY
np
Test
Cla
sses
True Classes
P N
ROC = Receiver Operator Characteristics– Technique for comparing the overall performance of
different methods / algorithms / tests on the same dataset – Widely employed e.g. in signal detection theory,
machine learning, and diagnostic testing in medicine
• ROC curves depict the relative trade-off between benefits (True Positives) and costs (False Positives)
• Confusion matrix of a binary test– Hit rate: True Positive rate TPr
– False alarm: False Positive rate FPr
41

27th November 2008, University of Warwick
Consensus Analysis - Technique
ROC curves for methods with continuous output– Not a simple binary (discrete) decision problem (yes/no) – Ranking or scoring output estimates the class membership probability
of an instance [0;1]– Application of a variable threshold in order to produce and validate
discrete classifiers – The best method has an uppermost (north-western) curve– Area Under the Curve (AUC) quantifies the performance
Important points in ROC space(0,1) : high TPr and low FPr; perfect classifiction(0,0) : never issue positive classifications; useless (1,1) : always issue positive classifications; useless{y=x} : randomly guessing a classification; useless
42

27th November 2008, University of Warwick
Consensus Analysis
Analysis of SCOP’s Class level (as example for all levels)
- RMSD values are not good similarity measures (except for DaliLite)- Best performance with FAST/SN and FAST/Align (Class level),
and with CE/Z, DaliLite/Z, and DaliLite/Align (all other levels)- Consensus/All gives worse AUC value than best method but very close to it
43

27th November 2008, University of Warwick
Consensus Analysis
Results from Comparisons/Singles
rating ranking*** first** second* third
44

27th November 2008, University of Warwick
Consensus Analysis
Results from Consensus/Average
rating ranking*** first** second* third
45

27th November 2008, University of Warwick
Consensus Analysis
Analysis of SCOP’s Superfamily level (exemplary for all levels)
- Consensus/Average-Best3 gives better AUC values than any of the contributing similarity measures (except Protein level)
- Further reduction to Consensus/Average-Best2 improved only performance for Protein and Superfamily level
Consensus/Average-Best3
46

27th November 2008, University of Warwick
Distributed Computing
– Simple automated scheduling system for job distribution works well on dedicated ProCKSI cluster (5 nodes, dual)
– Research on how to bundle jobs including fast/slow methods and small/large dataset► Optimise the ratio between calculation time and
overhead (data transfer time, waiting time, ...)
– Generalised scheduler for usage of clusters on the GRID and/or the University of Nottingham's cluster (> 1000 nodes)
Similarity comparison of proteins with multiple methods and large datasets is very time consuming and needs to be parallelised / distributed / gridified
47

27th November 2008, University of Warwick
Problem / Solution Space
Structures
Stru
ctur
es
Methods
All-against-all comparison of a dataset of S protein structures using M different similarity comparison methods can be represented as 3D cube.
Heterogeneity: 1. Each structure has
different length i.e number of residues
2. Each method has different execution time even for same pair of structures
3. Back-end computational nodes may have different speeds etc
48

27th November 2008, University of Warwick
Possible Strategies
1. Comparison of one pair of proteins using one method in the task list => SxSxM jobs, each performing 1 comparison >> far too fine-grained
2. All-against-all comparison of the entire dataset with one method => M jobs, each performing SxS comparisons >> currently running , valid only for |S|<500 proteins
3. Comparison of one pair of proteins using all methods in the task list => SxS jobs, each performing M comparisons >> Slightly different from 1, does not allow intelligent load balancing
4. Intelligent partitioning of the 3D problem space, comparing a subset of proteins with a set/subset of methods >> under investigation
49

27th November 2008, University of Warwick
• p = number of nodes
• N1, N2, .. Np= Cluster or Grid nodes
•The system is able to run both on a parallel environment using the MPI libraries and on a grid computing environment using the MPICH-G2 libraries.
•Complexity of Proteins is estimated and bag of proteins are distributed on different nodes
50
Distributed (grid-enabled) architecture

27th November 2008, University of Warwick 51
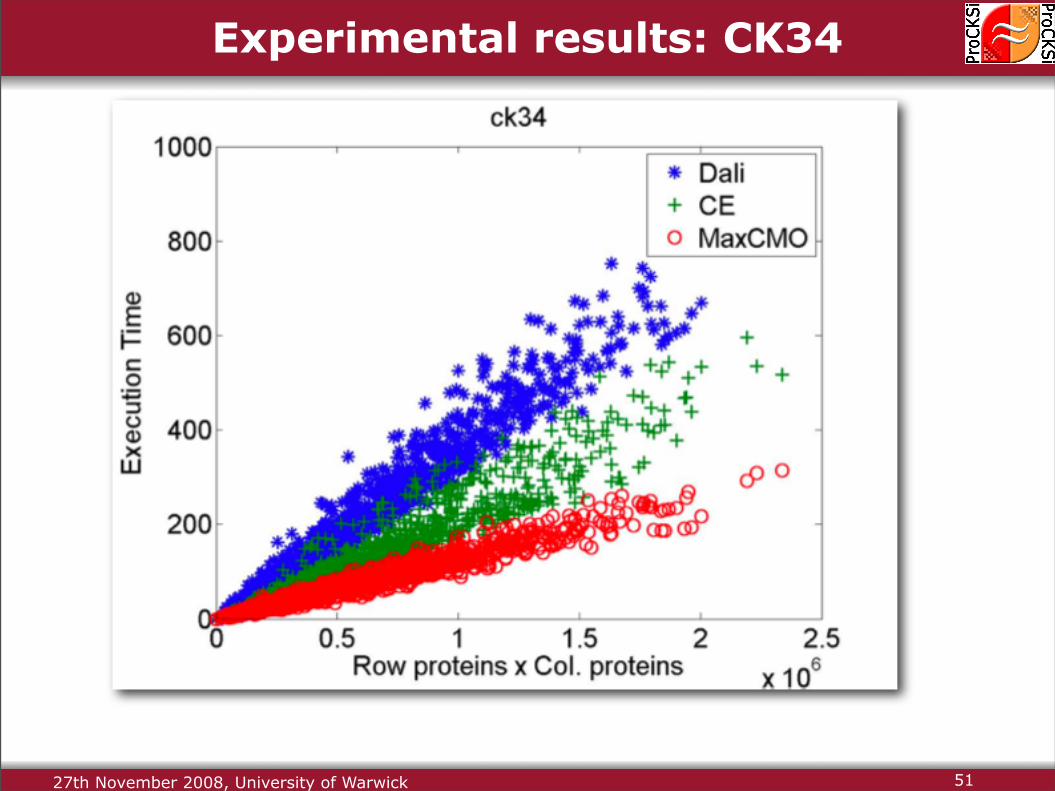
Experimental results: CK34
27th November 2008, University of Warwick 51
Experimental results: CK34

27th November 2008, University of Warwick 52
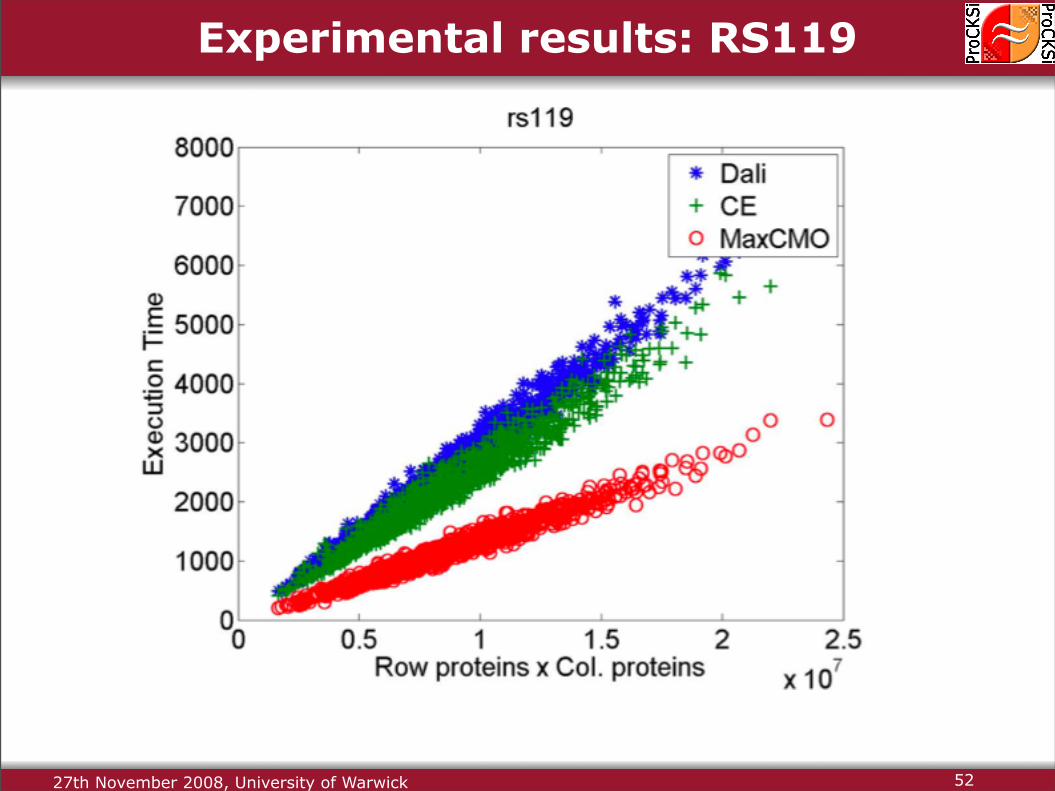
Experimental results: RS119
27th November 2008, University of Warwick 52
Experimental results: RS119

27th November 2008, University of Warwick
Speed-up = Ts /Tp
Where,
Ts: sequential exec time
Tp: Parallel exec time on P
processors
Ideal speed-up = pwhere,
P: number of processors
53
Experimental results: overall speed-up

27th November 2008, University of Warwick
Conclusions
54
www.procksi.org

27th November 2008, University of Warwick
Conclusions
• ProCKSI is a workbench for protein structure comparison – Implements multiple different similarity comparison methods with different
similarity concepts and algorithms – Facilitates the comparison and analysis of large datasets of protein
structures through a single, user-friendly interface
• ProCKSI is a decision-support system– Integrates many different similarity measures and suggests a consensus
similarity profile, taking their strengths and weaknesses into account
The combination of multi-competence similarity comparison measures leads to better results than any single one can provide!
• Additional Tools:• One of the most tested PDB parsers out-there• Very flexible tool for generating contact maps under a variety of definitions
and parameters• Flexible contact maps visualisation• Trees comparison and visualisation• You can add your own distance matrix
55

27th November 2008, University of Warwick
• ProCKSI keeps expanding:
• More methods are being added.
• If you have a method and want it included contact us!
• More sophisticated data fusion and visualisation are in their way!
• Hardware is evolving.
Conclusions
• ProCKSI is publicly available at:
http://www.procksi.net
56

27th November 2008, University of Warwick
Literature
Conference Papers– Grid and Distributed Public Comupting Schemes for Structural Proteomics: A Short
OverviewAzhar A. Shah, Daniel Barthel, Natalio Krasnogor. In Frontiers of High Performance Computing and Networking (ISPA2007), Lecture Notes in Computer Science 4743, 424-434. Springer-Verlag, Niagara Falls, Canada, August 2007.
– Protein Structure Comparison, Clustering and Analysis: An Overview of the ProCKSI Decision Support System Azhar Ali Shah, Daniel Barthel, Natalio Krasnogor. In Proceedings of the 4th International Symposium on Biotechnology (IBS) and 1st Pakistan-China-Iran International Conference on Biotechnology, Bioengineering and Biophysical Chemistry (ICBBB'07), Jamshoro, Pakistan, November 2007.
Journal Papers– The ProCKSI Server: a decision support system for Protein (Structure)
Comparison, Knowledge, Similarity and InformationDaniel Barthel, Jonathan D. Hirst, Jacek Błażewicz, Edmund K. Burke, Natalio Krasnogor. BMC Bioinformatics 2007, 8, 416.
– Web and Grid Technologies in Bioinformatics, Computational and Systems Biology: A ReviewAzhar A. Shah, Daniel Barthel, Piotr Lukasiak, Jacek Błażewicz, Natalio Krasnogor. Current Bioinformatics 2008, 3, 10-31.
57

27th November 2008, University of Warwick
Acknowledgements
58