protein sample preparation - wolfson centre home...
TRANSCRIPT

Protein Sample Preparation – H
andbook
GE HealthcareLife Sciences
imagination at work imagination at work28-9887-41 AA 12/2010
GE, imagination at work, and GE monogram are trademarks of General Electric Company.
ÄKTAmicro, ÄKTA, Biacore, CyDye, Deep Purple, DeCyder, ECL Plex, Ettan, ExcelGel, Ficoll, HiTrap, illustra, ImageQuant, Immobiline, Klari-Flex, MidiTrap, Mini Q, Mini S, MiniTrap, Mono P, Mono Q, Mono S, MultiTrap, Percoll, Pharmalyte, RESOURCE, Sephadex, Sepharose, SOURCE, SpinTrap, Superdex, Superose, UNIFILTER, and Whatman are trademarks of GE Healthcare companies.
2-D Fluorescence Difference Gel Electrophoresis: 2-D Fluorescence Difference Gel Electrophoresis (2-D DIGE) technology is covered by US patent numbers 6,043,025, 6,127,134 and 6,426,190 and equivalent patents and patent applications in other countries and exclusively licensed from Carnegie Mellon University. CyDye: this product or portions thereof is manufactured under an exclusive license from Carnegie Mellon University under US patent numbers 5,569,587, 5,627,027 and equivalent patents in other countries. The purchase of CyDye DIGE Fluors includes a limited license to use the CyDye DIGE Fluors for internal research and development, but not for any commercial purposes. A license to use the CyDye DIGE Fluors for commercial purposes is subject to a separate license agreement with GE Healthcare.
CyDye: This product or portions thereof is manufactured under an exclusive license from Carnegie Mellon University under US patent number 5,268,486 and equivalent patents in the US and other countries.
The purchase of CyDye products includes a limited license to use the CyDye products for internal research and development but not for any commercial purposes. A license to use the CyDye products for commercial purposes is subject to a separate license agreement with GE Healthcare. Commercial use shall include:
1. Sale, lease, license or other transfer of the material or any material derived or produced from it.
2. Sale, lease, license or other grant of rights to use this material or any material derived or produced from it.
3. Use of this material to perform services for a fee for third parties, including contract research and drug screening.
If you require a commercial license to use this material and do not have one, return this material unopened to GE Healthcare Bio-Sciences AB, Bjorkgatan 30, SE-751 84 Uppsala, Sweden and any money paid for the material will be refunded.
DeCyder: This release of DeCyder software is provided by GE Healthcare to the customer under a non-exclusive license and is subject to terms and conditions set out in the 2-D Differential Gel Electrophoresis Technology Access Agreement. Customer has no rights to copy or duplicate or amend the Software without the prior written approval of GE Healthcare.
Deep Purple Total Protein Stain: Deep Purple Total Protein Stain is exclusively licensed to GE Healthcare from Fluorotechnics Pty Ltd. Deep Purple Total Protein Stain may only be used for applications in life science research. Deep Purple is covered under a granted patent in New Zealand entitled “Fluorescent Compounds”, patent number 522291 and equivalent patents and patent applications in other countries.
GST Gene Fusion Vectors: A license for commercial use of GST Gene Fusion Vectors under US patent 5,654,176 and equivalent patents and patent applications in other countries must be obtained from Millipore Corp (formerly Chemicon International Inc).
IMAC Sepharose products, Ni Sepharose products, and Fe Sepharose products: These products are covered by US patent number 6 623 655 and equivalent patents and patent applications in other countries.
IMAC Sepharose products and Ni Sepharose products (Histidine-tagged protein purification) Purification and preparation of fusion proteins and affinity peptides comprising at least two adjacent histidine residues may require a license under US patent numbers 5,284,933 and 5,310,663, and equivalent patents and patent applications in other countries (assignee: Hoffman La Roche, Inc).
StrepTrap HP and StrepTactin Sepharose High Performance: These products are covered by US patent number 6,103,493 and equivalent patents and patent applications in other countries. The purchase of StrepTrap HP and StrepTactin Sepharose High Performance includes a license under such patents for non-profit and in-house research only. Please contact IBA ([email protected]) for further information on licenses for commercial use of Strep-Tactin.
All third party trademarks are the property of their respective owners.
© 2010 General Electric Company—All rights reserved. First published Dec. 2010.
All goods and services are sold subject to the terms and conditions of sale of the company within GE Healthcare which supplies them. A copy of these terms and conditions is available on request. Contact your local GE Healthcare representative for the most current information.
GE Healthcare UK Limited Amersham Place Little Chalfont Buckinghamshire, HP7 9NA UK
GE Healthcare Europe, GmbH Munzinger Strasse 5 D-79111 Freiburg Germany
GE Healthcare Bio-Sciences Corp. 800 Centennial Avenue, P.O. Box 1327 Piscataway, NJ 08855-1327 USA
GE Healthcare Japan Corporation Sanken Bldg., 3-25-1, Hyakunincho Shinjuku-ku, Tokyo 169-0073 Japan
For local office contact information,please visit www.gelifesciences.com/contact
www.gelifesciences.com/sampleprep
GE Healthcare Bio-Sciences ABBjörkgatan 30751 84 UppsalaSweden
imagination at work
Protein Sample PreparationHandbook
Handbooks from GE Healthcare
GST Gene Fusion System Handbook 18-1157-58
Affinity Chromatography Principles and Methods 18-1022-29
Antibody Purification Handbook 18-1037-46
Ion Exchange Chromatography and Chromatofocusing Principles and Methods 11-0004-21
Cell Separation Media Methodology and Applications 18-1115-69
Purifying Challenging Proteins Principles and Methods 28-9095-31
Isolation of mononuclear cells Methodology and Applications 18-1152-69
High-throughput Process Development with PreDictor Plates Principles and Methods 28-9403-58
Protein Sample Preparation Handbook 28-9887-41
Gel Filtration Principles and Methods 18-1022-18
Recombinant Protein Purification Handbook Principles and Methods 18-1142-75
Hydrophobic Interaction and Reversed Phase Chromatography Principles and Methods 11-0012-69
2-D Electrophoresis using immobilized pH gradients Principles and Methods 80-6429-60
Microcarrier Cell Culture Principles and Methods 18-1140-62
Nucleic Acid Sample Preparation for Downstream Analyses Principles and Methods 28-9624-00
Strategies for Protein Purification Handbook 28-9833-31
28-9887-41 AA 1
Protein Sample PreparationHandbook

2 28-9887-41 AA
Contents
Introduction..........................................................................................................................................5Focus and scope ...............................................................................................................................................................6Acronyms and abbreviations used in this handbook .....................................................................................7Protein sample preparation terminology .............................................................................................................9Symbols used in this handbook ..............................................................................................................................11Reference ............................................................................................................................................................................11
Chapter 1 Overview of protein sample preparation ......................................................................................13Introduction ...................................................................................................................................................................... 13Challenges that need to be tackled in proper sample preparation ..................................................... 13Workflow design considerations and general concerns ............................................................................17Contaminant tolerance and analytical capabilities of selected techniques ....................................22Other techniques ........................................................................................................................................................... 23References ..........................................................................................................................................................................24
Chapter 2 Sample collection, stabilization, and protein extraction............................................................27Introduction .......................................................................................................................................................................27Overview of steps to prepare a protein extract ............................................................................................. 28Sample collection .......................................................................................................................................................... 28Breaking up cellular and tissue architecture ................................................................................................... 29Stabilization of proteins ...............................................................................................................................................32Solubilization of proteins .............................................................................................................................................37Extraction examples .................................................................................................................................................... 42Clarification of protein extract .................................................................................................................................49Protein quantitation.......................................................................................................................................................49References ..........................................................................................................................................................................51
Chapter 3 Increasing detectability of targeted proteins ..............................................................................53Introduction ...................................................................................................................................................................... 53Protein fractionation .................................................................................................................................................... 54Affinity-based protein depletion of high-abundance proteins ................................................................57Affinity-based enrichment of proteins and protein subgroups ............................................................. 60References ..........................................................................................................................................................................69
Chapter 4 Ensuring compatibility in protein sample preparation workflows .........................................71Introduction and overview of available methodology .................................................................................71Clarification ....................................................................................................................................................................... 72Buffer exchange and desalting .............................................................................................................................. 73Sample cleanup .............................................................................................................................................................. 83Concentration/volume reduction .......................................................................................................................... 84References ......................................................................................................................................................................... 84

28-9887-41 AA 3
Chapter 5 Increasing sample throughput/screening applications .............................................................85Introduction ...................................................................................................................................................................... 85Overview of available methodology .................................................................................................................... 85Design considerations and general concerns ................................................................................................. 86Individual products and protocols ....................................................................................................................... 86
Appendices Appendix 1Overview of protein analysis techniques ........................................................................................................... 98
Appendix 2 Protein determination ................................................................................................................................................101
Appendix 3 Chromatography columns for use with ÄKTAmicro chromatography system ...............................103
Appendix 4 Characteristics of Vivaspin sample concentrators .......................................................................................105
Appendix 5 Characteristics of PD products prepacked with Sephadex G-25 ..........................................................108
Appendix 6 Amino acid data ............................................................................................................................................................110
Product index ....................................................................................................................................112
Related literature ............................................................................................................................113
Ordering information ......................................................................................................................114

4 28-9887-41 AA

28-9887-41 AA 5
Introduction
This handbook is divided into five chapters, starting with an overview of protein sample preparation, followed by three chapters based on a conceptual, high-level workflow for protein sample preparation and analysis (Fig I.1), and wrapping up with a chapter that focuses on parallel processing and screening strategies in recombinant protein and monoclonal antibody production workflows.
The overall goal of sample preparation, as viewed in the high-level workflow, is to feed the analytical technique of choice with protein subsamples of a quality that maximizes the chances for a successful analysis. The techniques and operations available to reach this goal are bundled into three main categories based on purpose. The first category and main sample preparation stage includes unit operations such as sample collection, stabilization, and extraction. The purpose of this stage is to move all the targeted protein population—while preserving the in vivo state—from the initial biological source into a homogeneous solution. Two simple examples include preparing a plasma sample from the bloodstream of a human or animal donor and creating a lysate from a cell culture. The next category and main stage embraces unit operations with the purpose of improving detectability in the intended analytical technique by selectively modulating the protein content of the input solution. Operations include combinations of protein fractionation, enrichment of selected protein groups or subgroups, and depletion of high-abundance or other unwanted proteins that can interfere with the analysis. The final category contains unit operations modulating the nonprotein properties of protein solutions. These modulations are introduced with the purpose of ensuring compatibility in the overall workflow by:
1. removing interfering nonprotein contaminants (nucleic acids, lipids, polysaccharides, phenols, etc.) present in the initial biological source
2. removing interfering contaminants and adjusting noncompatible buffer compositions introduced during previous sample preparation or labeling operations
3. adjusting the volume and total protein concentration to suit the next step
To ensure full compatibility in a workflow, multiple modulations at various points are generally needed.
Collect sample and extract/stabilize
proteins (Chapter 2)
Increase detectabilityof targeted proteins
(Chapter 3)Analyze proteins
Sample source (bacterial or other cell culture,
tissue, body fluids, etc.)
Homogeneous protein solution with complex
composition
One or multiple protein subsamples with
improved compositionAnalytical results
Ensure compatibility in workflow (Chapter 4)Sample state
Unit operation category
Fig I.1. High-level workflow for protein sample preparation and analysis.
6 28-9887-41 AA
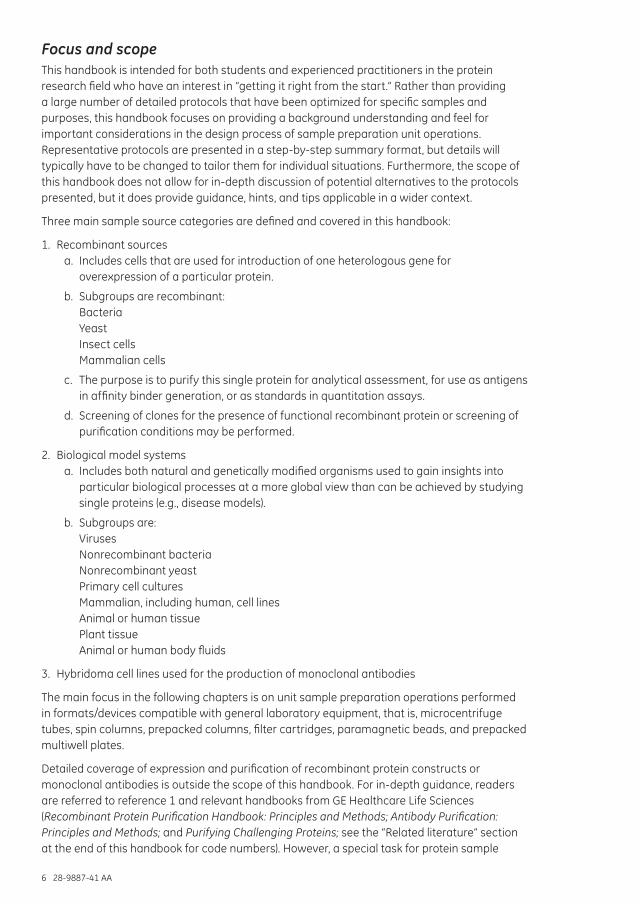
Focus and scopeThis handbook is intended for both students and experienced practitioners in the protein research field who have an interest in “getting it right from the start.” Rather than providing a large number of detailed protocols that have been optimized for specific samples and purposes, this handbook focuses on providing a background understanding and feel for important considerations in the design process of sample preparation unit operations. Representative protocols are presented in a step-by-step summary format, but details will typically have to be changed to tailor them for individual situations. Furthermore, the scope of this handbook does not allow for in-depth discussion of potential alternatives to the protocols presented, but it does provide guidance, hints, and tips applicable in a wider context.
Three main sample source categories are defined and covered in this handbook:
1. Recombinant sourcesa. Includes cells that are used for introduction of one heterologous gene for
overexpression of a particular protein.
b. Subgroups are recombinant: Bacteria Yeast Insect cells Mammalian cells
c. The purpose is to purify this single protein for analytical assessment, for use as antigens in affinity binder generation, or as standards in quantitation assays.
d. Screening of clones for the presence of functional recombinant protein or screening of purification conditions may be performed.
2. Biological model systems a. Includes both natural and genetically modified organisms used to gain insights into
particular biological processes at a more global view than can be achieved by studying single proteins (e.g., disease models).
b. Subgroups are:VirusesNonrecombinant bacteriaNonrecombinant yeastPrimary cell culturesMammalian, including human, cell linesAnimal or human tissuePlant tissueAnimal or human body fluids
3. Hybridoma cell lines used for the production of monoclonal antibodies
The main focus in the following chapters is on unit sample preparation operations performed in formats/devices compatible with general laboratory equipment, that is, microcentrifuge tubes, spin columns, prepacked columns, filter cartridges, paramagnetic beads, and prepacked multiwell plates.
Detailed coverage of expression and purification of recombinant protein constructs or monoclonal antibodies is outside the scope of this handbook. For in-depth guidance, readers are referred to reference 1 and relevant handbooks from GE Healthcare Life Sciences (Recombinant Protein Purification Handbook: Principles and Methods; Antibody Purification: Principles and Methods; and Purifying Challenging Proteins; see the “Related literature” section at the end of this handbook for code numbers). However, a special task for protein sample
28-9887-41 AA 7
preparation as defined in this handbook is to provide techniques/technology enabling initial small-scale screening strategies in recombinant protein production (i.e., expression and solubility screening) or monoclonal antibody generation (i.e., expression screening and screening of binding properties). General aspects of extraction and stabilization are of course also applicable to recombinant sources.
Sample preparation methodology for broad assessment of proteins in biological model systems is the main focus of this handbook. For guidance on purifying individual proteins from these sample sources, readers are referred to the handbook Strategies for Protein Purification from GE Healthcare (see the “Related literature” section at the end of this handbook for more information). Only techniques involving the handling of proteins in solution are covered, thus excluding workflows based on immunohistochemistry and cell assays. In addition, the main focus is on workflows using protein-independent analytical procedures such as mass spectrometry (MS) and electrophoresis. However, several of the sample preparation techniques covered are generally applicable to many situations where the properties of a protein solution need to be manipulated. Details on major challenges that sample preparation needs to handle in the above context are given in Chapter 1 for selected protein analysis techniques. An overview of these techniques is given in Appendix 1.
Acronyms and abbreviations used in this handbookA280 UV absorbance at specified wavelength, in this example, 280 nanometersAAA amino acid analysisAb antibodyAC affinity chromatographyACES N-(2-Acetamido)-2-aminoethanesulfonic acid (biological buffer)ADA N-(2-Acetamido)iminodiacetic acid (biological buffer)AEBSF aminoethyl benzylsulfonyl fluoride (serine protease inhibitor)AIEX anion exchange chromatographyAP alkaline phosphataseAPMSF 4-aminophenyl-methylsulfonyl fluoride (serine protease inhibitor)ASB amidosulfobetaine BCA bicinchoninic acidBES N,N-Bis(2-hydroxyethyl)-2-aminoethanesulfonic acidBME β-mercaptoethanolBSA bovine serum albuminCAPS N-cyclohexyl-3-aminopropanesulfonic acid (biological buffer)CAPSO 3-(Cyclohexylamino)-2-hydroxy-1-propanesulfonic acid (biological buffer)CHAPS 3-[(3-cholamidopropyl)dimethylammonio]-1-propanesulfonateCHAPSO 3-[(3-cholamidopropyl)dimethylammonio]-2-hydroxy-1-propanesulfonateCHES N-Cyclohexyl-2-aminoethanesulfonic acid (biological buffer)CHO Chinese hamster ovaryCIP cleaning-in-placeCMC critical micellar concentrationCSF cerebrospinal fluidCTAB cetyl trimethylammonium bromide (surfactant)Da Dalton DDM n-dodecyl-β-D-maltoside (detergent)DIGE differential gel electrophoresis (sometimes referred to as 2-D DIGE)DMP dimethyl pimelimidate dihydrochlorideDNase deoxyribonucleaseDTE dithioerythritol, also 1,4 dithioerythritol (reducing agent)DTT dithiothreitol, also 1,4 dithiothreitol (reducing agent, Cleland’s reagent)E. coli Escherichia coli

8 28-9887-41 AA
ECL enhanced chemiluminescenceEDTA ethylenediaminetetraacetic acid (chelating agent)EGTA ethylene glycol tetraacetic acid (chelating agent)ELISA enzyme-linked immunosorbent assayEPPS 3-[4-(2-hydroxyethyl)-1-piperazinyl] propanesulfonic acid (biological buffer)ESI electrospray ionizationESI-MS electrospray ionization-mass spectrometryFA formic acidFAK focal adhesion kinaseGABA gamma-aminobutyric acid (biological buffer)GF gel filtration (sometimes referred to as SEC; size exclusion chromatography)GST glutathione S-transferaseHEPES (4-(2-hydroxyethyl)-1-piperazineethanesulfonic acid (biological buffer)HIC hydrophobic interaction chromatographyHMW high molecular weightHP high performanceHPLC high performance liquid chromatographyHRP horseradish peroxidaseIAA iodoacetamideIEF isoelectric focusing; usually the first dimension in 2-D electrophoresisIEX ion exchange chromatography (also seen as IEC in the literature)IMAC immobilized metal ion affinity chromatographyIPG immobilized pH gradientIUBMB International Union of Biochemistry and Molecular BiologyLC liquid chromatographyLC-MS liquid chromatography-mass spectrometryLDAO lauryldimethylamine oxide (detergent)LMW low molecular weightLPS lipopolysaccharidesmAb monoclonal antibodyMALDI matrix-assisted laser desorption ionizationMALDI-MS matrix-assisted laser desorption ionization-mass spectrometryMALDI-ToF matrix-assisted laser desorption ionization-time of flight MBP maltose binding proteinMES 2-(N-morpholino)ethanesulfonic acid (biological buffer)MOAC metal oxide affinity chromatographyMOPS 3-(N-morpholino)propanesulfonic acid (biological buffer)MPa megaPascalM
r relative molecular weightMS mass spectrometryMS/MS tandem MS MW molecular weightMWCO molecular weight cutoffNP-40 nonyl phenoxypolyethoxylethanolPBS phosphate-buffered saline (biological buffer)PEG polyethylene glycolPES polyethersulfone pI isoelectric point, the pH at which a protein has zero net surface chargePIPES Piperazine-1,4-bis(2-ethanesulfonic acid) (biological buffer)pK
a acid dissociation constantPKA protein kinase APKC protein kinase CPMF peptide mass fingerprinting

28-9887-41 AA 9
PMSF phenylmethylsulfonyl fluoride (serine protease inhibitor) PTM post-translational modification; plural is PTMsPTP phosphotyrosyl phasphatasePTRF polymerase I-transcript release factor pTyr phosphorylated tyrosine residue in proteinsPVDF polyvinylidene fluorideRC regenerated cellulose RIA radioimmunoassay RIPA radioimmunoprecipitation assayRNase ribonucleaseRPC reversed phase chromatographyRSD relative standard deviationSDS sodium dodecyl sulfate (detergent)SDS-PAGE sodium dodecyl sulfate polyacrylamide gel electrophoresisSEC size exclusion chromatography (same as gel filtration, GF)SNAG1 sorting nexin associated Golgi protein-1SNP single nucleotide polymorphism SPE solid-phase extractionSRM selected reaction monitoringTAPS N-Tris(hydroxymethyl)methyl-3-aminopropanesulfonic acid (biological buffer)TBS tris-buffered saline (biological buffer)TCA trichloroacetic acidTCEP tris(2-carboxyethyl)phosphine hydrochloride (reducing agent)TES N-Tris(hydroxymethyl)methyl-2-aminoethanesulfonic acid (biological buffer)TFA trifluoroacetic acidTLCK tosyl-L-lysine chloromethyl ketone (serine protease inhibitor)ToF time-of-flight TPCK tosyl-L-phenylalanine chloromethyl ketone (serine protease inhibitor)u unit (unit for activity of an enzyme)UF ultrafiltrationUV ultraviolet lightVEGF vascular endothelial growth factor Vis visible light
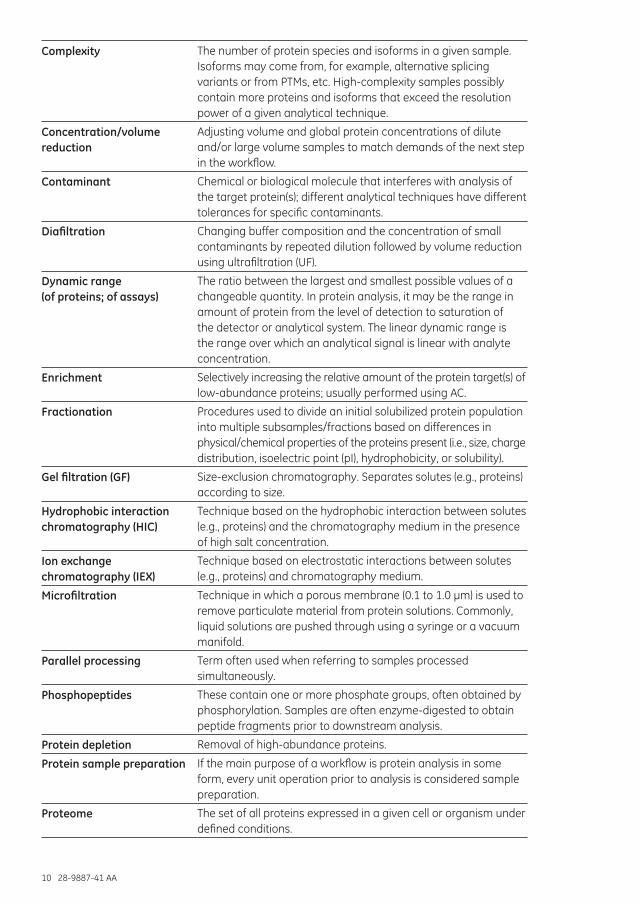
Protein sample preparation terminology
Abundance Concentration or number of copies of specific proteins in a given sample source. Mostly used as a relative term, for example, high or low abundance.
Affinity chromatography (AC) A group of techniques based on various types of specific affinities between target molecule(s), for example, a protein and a specific ligand coupled to a chromatography medium.
Affinity enrichment Enrichment of protein(s) of interest using AC.
Buffer exchange and desalting
Manipulating the buffer system (including pH) and reducing the concentration of small ionic species in samples.
Clarification Removing particulate matter (cell debris, aggregated proteins, etc.) from the sample to avoid complications such as clogging of filters/columns in later steps.
10 28-9887-41 AA
Complexity The number of protein species and isoforms in a given sample. Isoforms may come from, for example, alternative splicing variants or from PTMs, etc. High-complexity samples possibly contain more proteins and isoforms that exceed the resolution power of a given analytical technique.
Concentration/volume reduction
Adjusting volume and global protein concentrations of dilute and/or large volume samples to match demands of the next step in the workflow.
Contaminant Chemical or biological molecule that interferes with analysis of the target protein(s); different analytical techniques have different tolerances for specific contaminants.
Diafiltration Changing buffer composition and the concentration of small contaminants by repeated dilution followed by volume reduction using ultrafiltration (UF).
Dynamic range (of proteins; of assays)
The ratio between the largest and smallest possible values of a changeable quantity. In protein analysis, it may be the range in amount of protein from the level of detection to saturation of the detector or analytical system. The linear dynamic range is the range over which an analytical signal is linear with analyte concentration.
Enrichment Selectively increasing the relative amount of the protein target(s) of low-abundance proteins; usually performed using AC.
Fractionation Procedures used to divide an initial solubilized protein population into multiple subsamples/fractions based on differences in physical/chemical properties of the proteins present (i.e., size, charge distribution, isoelectric point (pI), hydrophobicity, or solubility).
Gel filtration (GF) Size-exclusion chromatography. Separates solutes (e.g., proteins) according to size.
Hydrophobic interaction chromatography (HIC)
Technique based on the hydrophobic interaction between solutes (e.g., proteins) and the chromatography medium in the presence of high salt concentration.
Ion exchange chromatography (IEX)
Technique based on electrostatic interactions between solutes (e.g., proteins) and chromatography medium.
Microfiltration Technique in which a porous membrane (0.1 to 1.0 µm) is used to remove particulate material from protein solutions. Commonly, liquid solutions are pushed through using a syringe or a vacuum manifold.
Parallel processing Term often used when referring to samples processed simultaneously.
Phosphopeptides These contain one or more phosphate groups, often obtained by phosphorylation. Samples are often enzyme-digested to obtain peptide fragments prior to downstream analysis.
Protein depletion Removal of high-abundance proteins.
Protein sample preparation If the main purpose of a workflow is protein analysis in some form, every unit operation prior to analysis is considered sample preparation.
Proteome The set of all proteins expressed in a given cell or organism under defined conditions.

28-9887-41 AA 11
Proteomics Global-scale study of protein interactions, expression, and functionality.
Reversed phase chromatography (RPC)
Technique based on hydrophobic interactions between solutes (sample components) and ligands coupled to the chromatography medium. Organic modifiers (e.g., acetonitrile) in the eluent are used for elution.
Sample cleanup A set of techniques used to remove contaminants such as detergents, lipids, polysaccharides, nucleic acids, and phenols from protein solutions.
Sample state The composition of a sample after a given unit operation is performed.
Sample throughput The number of samples that are processed. Term can apply to the number of samples processed simultaneously (parallel processing) or to the number processed in a specified time period (e.g., 24 h).
Ultrafiltration (UF) In UF, liquid is forced against membranes with smaller and better defined pore sizes than in microfiltration. Molecules larger than the pores are retained (retentate) whereas smaller molecules and solvent pass through the membrane (filtrate). Pore sizes are most often defined as Molecular Weight Cutoff (MWCO) values.
Unit operation Process being performed on a sample, for example, buffer exchange/desalting or affinity enrichment.
Unit operation category Broad grouping of unit operations that refers to the purpose of the operations, for example, increasing detectability of target proteins.
Western blotting An analytical technique that first separates proteins by molecular weight using sodium dodecyl sulfate polyacrylamide gel electrophoresis (SDS-PAGE), after which proteins are transferred to a membrane, which is probed with antibody to the protein(s) of interest; also known as immunoblotting.
Workflow A sequence of connected steps starting at the sample source and ending at protein analysis.
Symbols used in this handbook This symbol indicates general advice to improve procedures or recommend action
under specific situations.
This symbol denotes mandatory advice and gives a warning when special care should be taken.
Reference1. Structural Genomics Consortium et al. Protein production and purification. Nat. Methods 5,
135-147 (2008).

12 28-9887-41 AA
28-9887-41 AA 13
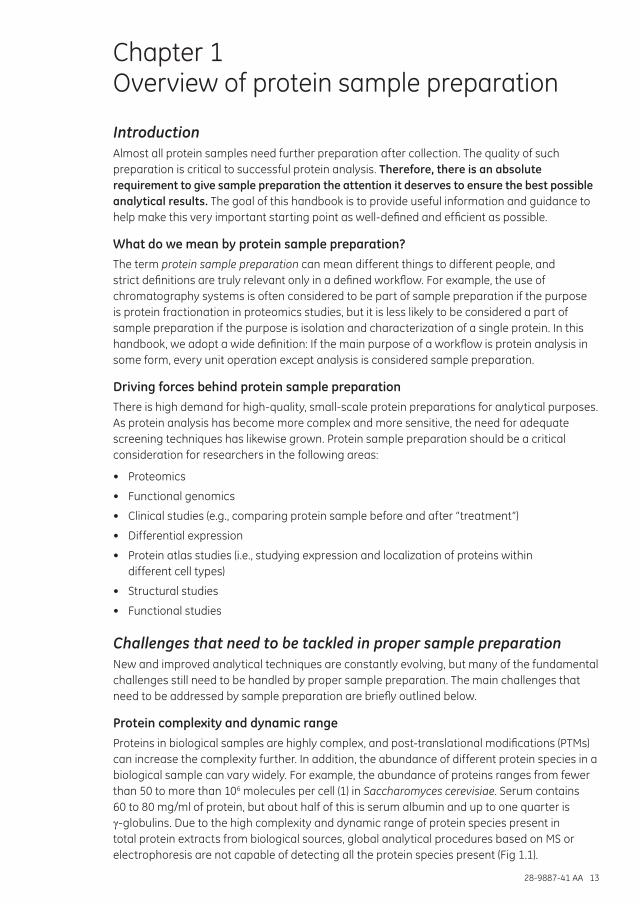
Chapter 1 Overview of protein sample preparation
IntroductionAlmost all protein samples need further preparation after collection. The quality of such preparation is critical to successful protein analysis. Therefore, there is an absolute requirement to give sample preparation the attention it deserves to ensure the best possible analytical results. The goal of this handbook is to provide useful information and guidance to help make this very important starting point as well-defined and efficient as possible.
What do we mean by protein sample preparation?The term protein sample preparation can mean different things to different people, and strict definitions are truly relevant only in a defined workflow. For example, the use of chromatography systems is often considered to be part of sample preparation if the purpose is protein fractionation in proteomics studies, but it is less likely to be considered a part of sample preparation if the purpose is isolation and characterization of a single protein. In this handbook, we adopt a wide definition: If the main purpose of a workflow is protein analysis in some form, every unit operation except analysis is considered sample preparation.
Driving forces behind protein sample preparationThere is high demand for high-quality, small-scale protein preparations for analytical purposes. As protein analysis has become more complex and more sensitive, the need for adequate screening techniques has likewise grown. Protein sample preparation should be a critical consideration for researchers in the following areas:
• Proteomics
• Functional genomics
• Clinical studies (e.g., comparing protein sample before and after “treatment”)
• Differential expression
• Protein atlas studies (i.e., studying expression and localization of proteins within different cell types)
• Structural studies
• Functional studies
Challenges that need to be tackled in proper sample preparationNew and improved analytical techniques are constantly evolving, but many of the fundamental challenges still need to be handled by proper sample preparation. The main challenges that need to be addressed by sample preparation are briefly outlined below.
Protein complexity and dynamic rangeProteins in biological samples are highly complex, and post-translational modifications (PTMs) can increase the complexity further. In addition, the abundance of different protein species in a biological sample can vary widely. For example, the abundance of proteins ranges from fewer than 50 to more than 106 molecules per cell (1) in Saccharomyces cerevisiae. Serum contains 60 to 80 mg/ml of protein, but about half of this is serum albumin and up to one quarter is γ-globulins. Due to the high complexity and dynamic range of protein species present in total protein extracts from biological sources, global analytical procedures based on MS or electrophoresis are not capable of detecting all the protein species present (Fig 1.1).

14 28-9887-41 AA
Proteins in sample
Detectedproteins
Log (protein amount)
Num
ber o
f pro
tein
s
Fig 1.1. 2-D gel electrophoresis and global MS techniques are capable of detecting only a small portion of the proteins present in a total protein extract from a complex biological source. Figure adapted from reference 2.
A rough overview of the dynamic range and protein complexity found in different sample sources is given in Table 1.1. In general, analytical performance of electrophoresis or MS-based techniques is reduced with increased complexity and dynamic range in the sample. In fact, without sample preparation strategies to reduce the complexity and dynamic range of samples passed on to the analytical step, even medium-abundance protein species are likely to be nonreproducibly detected and/or quantitated during repeat experiments. Without a targeted approach to improve detectability, the low-abundance part of proteomes, where most specific biomarkers are thought to reside, is in essence inaccessible. This is due to three main reasons:
1. A mismatch in dynamic range between biological samples and analytical techniques. The dynamic range found in many biological sources varies from ~ 5 to 12 orders of magnitude (Table 1.1), yet global electrophoresis and MS-based techniques are currently capable of handling a dynamic range of only ~ 2 to 3 orders of magnitude (Table 1.5, introduced later in this chapter).
2. Inability of analytical techniques to handle the complexity of biological samples. Even if the dynamic range could be heavily reduced, very high sample complexity cannot be handled by current techniques. With an increased number of proteins present, a lower amount of each individual protein can be loaded. In addition, 2-D gel electrophoresis cannot resolve all protein forms present, and the mass spectrometers used in liquid chromatography (LC)-MS approaches (LC-MS/MS) are hampered by ionization suppression effects, insufficient resolving power, and limitations in MS/MS scan speed (even if peptides are resolved and detectable in MS mode, there is not sufficient time to perform MS/MS scans for all peptide ions present at each point in the chromatogram).
3. Insufficient sensitivity of analytical techniques. Even setting the dynamic range and complexity challenges aside, without manipulating the concentration of proteins in some way, current MS or 2-D gel electrophoresis techniques are not sensitive enough to analyze the low-abundance part of many proteomes (sub ng/ml concentrations; see Table 1.5).

28-9887-41 AA 15
Table 1.1. Overview of dynamic range and complexity in selected sample sources (1–5)
Source Dynamic range Number of proteins Comments
Bacteria ~105 ~103 Protein composition varies depending on species and culture conditions.
Cultured animal or human cells
~105-6 ~104 If the biological state and/or cell type is not well-controlled during culture, complexity will increase further.
Tissue Increased compared with cell culture samples due to the presence of multiple cell types
Increased compared with cell culture samples due to the presence of multiple cell types
Sample characteristics will vary heavily depending on the specific tissue and the precision of sample collection from that tissue. In general, it is important to keep the heterogeneity of the isolated tissue as low as possible, while keeping the analytical purpose in mind.
Plasma ~1010-12 ~106 Blood perfuses all other tissues in the body, and most cells are thought to leak or secrete proteins into circulation. Therefore, the plasma proteome is the most complex proteome and may reflect the health status of every organ and tissue in the body. It is therefore of great interest for biomarker development.
Other human or animal body fluids
Lower than plasma
Lower than plasma
Due to the complexity of plasma, other body fluids are increasingly being used during biomarker development even if the ultimate goal is a blood test. Although still very complex sample sources, the rationale is that many biomarkers specific for a particular disease are thought to arise locally from the affected tissue, displaying a gradient of diminishing concentration with increasing distance from disease that steps off markedly with admixture into blood. The term proximal fluid has been defined as a body fluid closer to, or in direct contact with, the site of disease (6).
Protein detectability is improved if targeted approaches can be used to reduce the dynamic range of proteins in the biological sample. However, only affinity-based approaches are, in principle, capable of detecting most proteins present. In the absence of antibodies (or other affinity binders), sample preparation operations to improve detectability are essential for a targeted approach.
Protecting proteins from degradationProtecting proteins from the action of proteases and other protein-modifying enzymes is a critical consideration for ensuring that analytical results can be trusted to mirror the in vivo state of the proteins or proteomes assayed in tissue- and cell-based samples. Incomplete control may destroy or distort vital information about the protein population and lead to large variations between different samples and incorrect conclusions. Detrimental enzymatic activity is less of a concern in most body fluids, because the causal enzymes are generally part of cellular pathways for signal transduction and controlled protein degradation. The blood-clotting cascade is of course a well-known exception that needs to be avoided or activated in a well-controlled fashion in the creation of plasma or serum samples, respectively.

16 28-9887-41 AA
Although the above-mentioned enzyme systems are part of normal cellular processes, two mandatory sample preparation steps cause them to exert detrimental enzymatic activity that distorts the presampling proteome:
1. The sample collection or sampling step removes a tissue sample from its natural surroundings, leading to a major disturbance of tissue homeostasis. This in turn causes a release of degradation mediators, leading to an increased activity of varying proteases and enzymes involved in PTMs. Similar stress responses can also be activated during sampling from cell cultures.
2. Under in vivo conditions, many of the cellular proteins are kept separate from proteolytic enzymes. Disruption of cellular and tissue architecture during protein extraction facilitates distortion of the in vivo state by making all proteins potentially accessible for degradation or modification.
If not controlled, degradation and protein modification can potentially take place throughout the complete sample preparation workflow. However, large variations based on type of sample source are to be expected. Recently it has been shown that detrimental effects can be more rapid than previously thought. Extensive proteolysis has been demonstrated already 3 min after sampling, and the levels of several PTMs in brain tissue are significantly changed within minutes post mortem (7).
Global protein extractionThe large heterogeneity of proteins and interfering contaminants makes global extraction, the simultaneous release and solubilization of all proteins, a great challenge for any cell- or tissue-based sample source. Integration of proteins into membranes and the formation of complexes with other proteins or nucleic acids hamper the process significantly. As a natural result, extracted protein populations are likely to be more or less distorted compared to in vivo populations. Minimizing these effects by optimizing the extraction protocol is a challenging task that generally has to be reiterated for each new sample source and analytical purpose.
Complete removal of nonprotein contaminantsThe concentration of contaminants such as salts, nucleic acids, lipids-polysaccharides, and phenols varies widely with sample source (8). Their presence can substantially reduce the performance of both sample preparation and analytical techniques. Additional substances, such as detergents, added to improve one aspect of the workflow often interfere with later steps.
Introduction of additional sample preparation artifactsIn addition to enzymatic degradation and incomplete extraction, other processes threaten to lower the overall sensitivity and distort the original protein distribution. They include:
- Precipitation or aggregation caused by intentional or nonintentional changes of the physical or chemical properties of protein solutions (temperature, pH, salt or detergent concentration, etc.)
- Nonspecific adsorption to surfaces exposed by sample vials, liquid-handling tips, or solid-phase manipulators such as chromatography media, filters, membranes, or magnetic beads
- Introduction of “sample-handling-induced” chemical modifications of proteins (e.g., oxidation)
These effects tend to increase in magnitude with increasing number and complexity of unit operations included in the workflow.

28-9887-41 AA 17
Workflow design considerations and general concernsThe first rule for the design of a successful protein analysis workflow is to maintain a holistic view and collect as much background information as possible. See also references 1 and 2. It is advisable to keep manipulations of the nonprotein properties of sample solutions at a minimum, as all the techniques available introduce some level of protein loss (generally differential).
1. Clearly define the purpose or goal of the overall experiment or study.
2. Consider different analytical strategies that can be used in accordance with the purpose.
– Is global protein analysis required or can the sought-after protein population be narrowed down by available knowledge or legitimate hypotheses?
– Can different sample sources be used? – Can different analytical techniques or modes of operation be used?
Is the analytical purpose compatible with focusing on only a subpart of a cellular proteome? If so, employ subcellular fractionation techniques to reduce complexity and maximize relevance (Chapter 2).
Do multiple choices exist that are compatible with the analytical purpose? Which is the most favorable? For example, proximal biofluids should be considered as alternatives to plasma for initial biomarker discovery (Table 1.1). They are less complex and are likely to be naturally enriched in potential biomarker candidates. Targeted verification and validation of candidates can then be performed in plasma if a blood test is the final goal.
Does background knowledge on potentially interesting proteins exist? Consider using target-tailored analytical techniques (targeted LC-MS/MS, Western blots, or enzyme-linked immunosorbent assay [ELISA] and its modern alternatives). These techniques offer increased sensitivity and are less influenced by high sample complexity and dynamic range (Table 1.5). Therefore, they require less sample preparation.
3. Know the sample sources available to you!
– Protein complexity and dynamic range? – Rough concentration of the sought-after protein population? – Are dynamics in the sought-after protein population thought to be well reflected in the
sample source? – Type and abundance of contaminants? – Compartmentalization of proteins and difficulty of extraction? – Level and type of detrimental enzymatic activity?
4. Know the analytical techniques available to you! What are their criteria for optimal overall detectability? (See Appendix 1 for an overview of selected techniques.)
– Range of total protein amount loaded? – Volume range? – Limit of detection for individual proteins? – Dynamic range? – Complexity tolerance (~ resolving power)? – Contaminant tolerance – Need for retained biological structure and activity?
Strive to reduce contaminants to acceptable levels but do not overdo it (see Tables 1.3 and 1.4 for contaminant acceptance for MALDI and 2-D gel electrophoresis, respectively).

18 28-9887-41 AA
5. Additional considerations – Number of samples to be processed simultaneously (i.e., parallel processing; see Chapter 5)? – Amount of initial sample available for each specimen? – Available resources? – Acceptable cost? – Logical order for steps and/or adjustments for certain steps?
Keep the overall workflow in mind and try to minimize the instances in which adjustments are needed. Examples include avoiding Tris buffers when protein labeling on primary amines will be performed and selecting an appropriate sequence of chromatographic techniques during fractionation (i.e., IEX followed by RPC). However, by introducing adjustments at a few steps in the workflow, a better overall performance can be achieved.
6. Based on your background knowledge, list and rank the challenges associated with the different analytical strategies (combinations of sample source, targeted protein population, and analytical technique). The inverse relationship between optimal detectability, yield, and reproducibility is complex and needs to be considered as well. A general rule is to keep your design principles as simple as possible.
7. Roughly design sample preparation schemes to handle the listed challenges and assess the likelihood of success.
8. Select the most promising alternative and proceed to a detailed design of the number and type of sample preparation unit operations and optimization of their performance.
Common combinations of depletion, fractionation, and affinity enrichment to improve protein detectability
See Chapter 3 for details on these techniques.
Global analysis of biofluids involves depletion of the most abundant proteins followed by extensive fractionation (> 50 fractions). Solutions exist for removal of up to the 20 most abundant proteins in plasma. However, extensive fractionation is still needed to enable deep coverage of the proteome. If the depletion solution has a low capacity, it can become a bottleneck, because a large amount of plasma needs to be processed to enable fractionation. There is also a concern that interesting proteins are removed during depletion, because many of the high-abundance proteins can act as carrier proteins (9, 10). Therefore, it is advisable to focus on a depletion solution that removes a moderate number of proteins with high capacity and to consider passing on the bound fraction in addition to the flowthrough fraction.
Targeted analysis of protein groups using nondenaturing conditions involves affinity enrichment alone or followed by moderate fractionation. Specific binders of good quality need to be available.
Analysis using denaturing conditions involves moderate to extensive fractionation by combinations of orthogonal separation principles that are compatible in series. A common strategy is IEX followed by RPC on each first-step fraction.
Even though fractionation at the protein level is a powerful way of increasing the analytical depth in a workflow, several challenging aspects exist:
• A large amount of sample is needed to take full advantage of fractionation by enabling an increased loading of low-abundance proteins. Sufficient amounts might not be available.
• There is a decreased overall yield and increased risk of differential loss of proteins with increasing number and complexity of fractionation techniques employed.
• Time and cost constraints exist. Extensive fractionation coupled with analysis of each fraction will severely impact the throughput in the workflow and dramatically increase the cost per initial sample.

28-9887-41 AA 19
Because global analysis generally requires substantial fractionation to even start making complete coverage possible, it is recommended that targeted approaches, such as subcellular fractionation and enrichment of protein subgroups, are used whenever possible. Even if global analysis is the ultimate goal, it may be more efficient and feasible to combine the results of multiple subproteomic investigations rather than use a direct global approach. In situations where fractionation is the best approach, it is recommended to design for a minimal number of fractionation steps and number of subsamples to analyze, while still being able to reach the analytical goal.
Example of a complete workflowThis detailed workflow example supports the more theoretical workflow design considerations discussed above.
Background
Fundamental cellular functions such as cell signaling are commonly regulated by phosphorylation of tyrosine residues in proteins (pTyr) (11). When dysregulated, they often play a prominent role in human cancer, making the study of tyrosine-phosphorylated proteins highly interesting. A basic objective is to create a pTyr substrate map by identifying proteins that undergo tyrosine phosphorylation using global MS techniques. This hypothesis-free and global search for tyrosine-phosphorylated proteins is the purpose of the workflow outlined below. With minor adjustments, it can also be used for more detailed studies (such as differential studies) of specific tyrosine phosphorylations.
A major challenge is that most cell signaling proteins are known to reside at the lower end of intracellular protein copy number and can generally not be detected by global MS techniques directly. Another consideration is that during normal running conditions, the MS sensitivity is lower for phosphorylated peptides due to reduced ionization efficiency. The pTyr proteins are also comparatively rare in relation to other types of phosphorylations. Threonine and serine phosphorylation represents around 10% and 90%, respectively, of the total human phosphorylation, while tyrosine phosphorylation accounts for only approximately 0.1% (11). In addition, in vivo phosphorylation levels can often be the result of simultaneous high activities of both kinases and phosphatases. If not well designed, the first steps of sample preparation will introduce a bias by shifting the delicate in vivo balance of enzymatic activity toward dephosphorylation (kinase activity is dependent on ATP, which is only generated during in vivo conditions).
Description of workflow
The workflow was built around the critical need to substantially enrich pTyr proteins prior to MS analysis. Due to the availability of pTyr-epitope-specific antibodies of good quality, highly specific affinity-based enrichment could be designed. By keeping the complete workflow in mind during the design of all steps, the number of operations could be minimized: the use of the magnetic bead format combines enrichment and concentration in one step; the use of a digestion-compatible elution buffer simplifies digestion; and concentration/desalting of peptides is performed online in direct sequence with analytical separation. Chinese hamster ovary (CHO) cells cultured in rich medium were selected as a source to enable large initial sample amounts from which to enrich as well as the option of in vivo inhibition of tyrosine phosphatases. By adding pervanadate, an irreversible tyrosine phosphatase inhibitor, to the culture medium 2 h prior to sample collection, the number of pTyr proteins could be maximized. Pervanadate is also known to induce other changes in the protein composition (oxidative stress response, etc.), but these artifacts were not considered to interfere with the purpose of the experiment. A control experiment without in vivo pervanadate treatment was included to assess the effect of inhibition. The workflow as a whole is outlined in Figure 1.2.

20 28-9887-41 AA
A total of 76 potential pTyr proteins were identified (Fig 1.3 and Table 1.2). Of these hits, 54 were exclusively found in the pervanadate treated cells and were found neither in the control cells nor in the starting material. Some of these proteins, such as Caveolin-1 and focal adhesion kinase (FAK), are known to be involved in focal adhesion pathways. These proteins may be involved in the regulation of the actin cytoskeleton. Other proteins that are involved in cell motility or cell survival were also found. In the control samples (untreated cells), only 22 proteins were detected, mainly highly abundant enzymes and ribosomal proteins. This clearly indicates the importance of enzymatic control.
CHO cell culture
In vivo stabilization
Collection
Lysis/stabilization
Clarification
Enrichment
Digestion
Cleanup/concentration
Analysis
Grow ~ 7 × 10⁷ cells in rich culture medium.
Add pervanadate to the culture medium 2 h prior to sample collection to inhibit tyrosine phosphatase activity.
Centrifuge using swing-out rotor, 3000 x g for 5 min. Collect pellet.
Suspend pellet with 10 volumes of lysis buffer [Mammalian lysis buffer (GE Healthcare), supplemented with EDTA, Na-deoxycholate, protease inhibitor mix (GE Healthcare), and phosphatase inhibitor mix). Incubate on ice 15 min.
Centrifuge in refrigerated centrifuge, 20 000 x g for 20 min. Collect the supernatant. Dilute 1:1 with binding buffer (TBS, pH 7.5) to ensure proper conditions for enrichment.
Incubate 10 ml of sample with 100 µl of magnetic beads containing cross-linked pTyr-specific antibodies. After washing, elute bound proteins in 100 µl of digestion-compatible buffer (100 mM phenylphosphate, pH 8) through competitive elution. Through the use of Protein G Mag Sepharose magnetic beads (GE Healthcare), there is no need for a concentration step.
Denature and reduce proteins (add 10 µl of acetonitrile and 2µl of TCEP, 95ºC, 5 min). Alkylate free cysteines (add 10 µl IAA, 37ºC, 30 min). Generate tryptic peptides through incubation with trypsin (add 4 µl of trypsin stock, room temperature, overnight).
Mix an aliquot of the digest with enough 10% Formic acid (FA) to generate a final concentration of 1% FA. Concentrate and desalt the sample by injecting it onto an RPC trap column, followed by washing with 0.1% FA and elution onto an analytical RPC column (see below).
Separate and identify proteins by nano-LC MS/MS (Buffer A 0.1% FA, Buffer B Acetonitrile, 0.1% FA). Confirm pTyr modified proteins by additional analysis of MS/MS spectra (search for fragment corresponding to loss of phosphor-group).
Figure 1.2. Overview of workflow for mapping of pTyr proteins in CHO cells using MS.
Grow ~ 7 × 10⁷ cells in rich culture medium.
Add pervanadate to the culture medium 2 h prior to sample collection to inhibit tyrosine phosphatase activity.
Centrifuge using swing-out rotor, 3000 x g for 5 min. Collect pellet.
Suspend pellet with 10 volumes of lysis buffer (Mammalian lysis buffer [GE Healthcare], supplemented with ethylenediaminetetraacetic acid [EDTA], Na-deoxycholate, protease inhibitor mix [GE Healthcare], and phosphatase inhibitor mix). Incubate on ice for 15 min.
Centrifuge in refrigerated centrifuge, 20 000 × g for 20 min. Collect the supernatant. Dilute 1:1 with binding buffer (TBS, pH 7.5) to ensure proper conditions for enrichment.
Incubate 10 ml of sample with 7.5 µl of Protein G Mag Sepharose™ magnetic beads (GE Healthcare), containing cross-linked pTyr-specific antibodies. After washing, elute bound proteins in 100 µl of digestion-compatible buffer (100 mM phenylphosphate, pH 8) via competitive elution. Through the use of Protein G Mag Sepharose, the complexity and volume of the sample have been reduced.
Denature and reduce proteins (add 10 µl of acetonitrile and 2 µl of tris[2-carboxyethyl]phosphine hydrochloride [TCEP], 95ºC, 5 min). Alkylate free cysteines (add 10 µl of iodoacetamide [IAA], 37ºC, 30 min). Generate tryptic peptides through incubation with trypsin (add 4 µl of trypsin stock, room temperature, overnight).
Mix an aliquot of the digest with enough 10% formic acid (FA) to generate a final concentration of 1% FA. Concentrate and desalt the sample by injecting it onto an RPC trap column (ZORBAX™ 300SB-C18, 5 µm, 5 × 0.3 mm [Agilent Technologies]), followed by washing with 0.1% FA and elution onto an analytical RPC column (C18 PepMap™ 100 Å, 3 µm, length 150 mm, diameter 75 µm [Dionex™]).
Separate and identify proteins by nano-LC MS/MS (Buffer A 0.1% FA; Buffer B Acetonitrile, 0.1% FA). Confirm pTyr modified proteins by additional analysis of MS/MS spectra (search for fragment corresponding to loss of phosphor group).
Fig 1.2. Overview of workflow for mapping of pTyr proteins in CHO cells using MS.

28-9887-41 AA 21
scan
350 000
300 000
250 000
200 000
150 000
100 000
50 000
0
54 5 17 Control cellsPervanadate-treatedCHO cells
Fig 1.3. Number of identified pTyr proteins in pervanadate-treated and control cells. A Base Ion Chromatogram from a nano-LC-MS/MS run together with an example MS/MS spectrum of a pTyr peptide is shown. The peptide was identified as PTPn11.
Table 1.2. The first 20 pTyr hits exclusively identified in the pervanadate-treated CHO cells
Protein Total Mr Accession number
protein tyrosine phosphatase 22 68.3 gi|458333|
caveolin-1 11 20.5 gi|603661|
beta-tubulin isotype I [Cricetulus griseus] 6 49.6 gi|473884|
Cav1 protein [Rattus norvegicus] 1 19.7 (H) gi|124504347|
AHNAK [Mus musculus] 6 224.0 gi|37675525|
focal adhesion kinase 8 119.1 gi|193224|
beta tubulin [Cricetulus griseus] 1 49.7 (H) gi|537407|
gamma-actin 1 41.8 (H) gi|309089|
M1 pyruvate kinase [Rattus norvegicus] 5 57.8 gi|206204|
cortactin 5 61.2 gi|509495|
47-kDa heat shock protein [Mus musculus] 4 46.5 gi|303678|
ABL2 [Mus musculus] 3 128.1 gi|68139002|
sorting nexin associated Golgi protein-1 (SNAG1) [Mus musculus]
4 67.9 gi|15559064|
polymerase I-transcript release factor (PTRF) [Mus musculus]
3 43.9 gi|2674195|
calmodulin synthesis 3 16.8 gi|192365|
beta-actin [Marmota monax] 1 32.0 (H) gi|9864780|
unnamed protein product [Rattus norvegicus], enolase 1 3 47.1 gi|56107|
eps8 binding protein [Rattus norvegicus] 3 51.7 gi|5882255|
Chain B, Refined 1.8 Angstroms Resolution Crystal Structure Of Porcine Epsilon-Trypsin
3 8.8 gi|999627|
Rous sarcoma oncogene [Mus musculus] 3 59.9 gi|123219085|

22 28-9887-41 AA
Contaminant tolerance and analytical capabilities of selected techniquesContaminant tolerance of selected techniques
ESI-MS
Electrospray ionization (ESI) is very susceptible to contamination. The sample should contain minimal amounts of buffers, salts, and detergents. Optimally, only water, organic modifier, and a volatile acid or base should be present. Buffers such as phosphate, Tris, and 4-(2-hydroxyethyl)-1-piperazineethanesulfonic acid (HEPES) cannot be used. Even trace levels of these interfere with the ESI process. If buffers are needed, volatile buffers such as ammonium acetate can be used at a concentration ≤ 30 mM. Ionic detergents should be completely avoided, whereas useful data may be obtained for certain nonionic detergents (nonionic saccharides such as n-dodecyl-β-D-glucopyranoside) at concentrations between 0.01% and 0.1% (12).
MALDI-MS
When compared with ESI, the matrix-assisted laser desorption ionization (MALDI) process is relatively tolerant to salts and small amounts of certain detergents (13). However, sensitivity and the quality of the data obtained are quite dependent on the purity of the sample. Best results are achieved if salts, buffers, and detergents are kept to a minimum. In Table 1.3, approximate tolerance levels for different contaminants are given. Also, any component present at a concentration above that of the matrix (~ 50 mM) may pose a problem.
Table 1.3. MALDI tolerance for common contaminants. Values should be viewed as approximate. Type of matrix, spotting technique, and combinatorial contaminant effects will influence the exact tolerance (Table 16.2.1 from reference 14.)
Contaminant Maximum concentration
Sodium chloride 50 mM
Phosphate 10 mM
Tris base 50 mM
Urea 1 M
Guanidine 1 M
Azide 0.1% (v/v)
Glycerol 1% (v/v)
Polyethylene glycol (PEG) 2000 0.1% (w/v)
Sodium dodecly sulfate (SDS) 0.01% (w/v)
Triton™ X-100, RTX-100, NP-40 0.1% (v/v)
Tween™ 0.1% (v/v)
CHAPS 0.01% (w/v)
n-Octyl-β-glucopyranoside 1% (v/v)
Zwittergent™ 0.1% (v/v)
Lauryldimethylamine oxide (LDAO) 1% (w/v)
2-D gel electrophoresis
The first-dimension isoelectric focusing (IEF) step of 2-D electrophoresis is particularly sensitive to low-molecular-weight ionic impurities. Even relatively low concentrations of salts (< 5 mM) can slow down separation, prevent sharp focusing, or cause disturbances that result in poor-quality 2-D gel analysis results. Also, other nonprotein impurities in the sample can interfere with separation and subsequent visualization of the 2-D gel analysis results. Table 1.4 lists and discusses contaminants that affect 2-D gel analysis results negatively (15).

28-9887-41 AA 23
Table 1.4. Discussion of contaminants that affect 2-D gel electrophoresis negatively
Contaminant Comments
Salts, residual buffers, and other charged small molecules that carry over from sample preparation
Salts disturb the electrophoresis process and must be removed or maintained at as low a concentration as possible. Salts in the immobilized pH gradient (IPG) strip result in high strip conductivity. Focusing of the proteins will not occur until the ions have moved to the ends of the strips, prolonging the time required for IEF. Water movement can also occur, causing one end of the strip to dry out and the other end to swell. Salt in the IPG strip can result in large regions at either end of the IPG strip where proteins do not focus (seen as horizontal streaking or empty regions in the final result). If the sample is rehydrated into the IPG strip, the salt concentration in the rehydration solution should be lower than 10 mM. If the sample is applied in sample cups, salt concentrations of up to 50 mM may be tolerated. However, proteins may precipitate at the sample application point as they abruptly move into a lower salt environment.
Endogenous small ionic molecules (nucleotides, metabolites, phospholipids, etc.)
Endogenous small ionic molecules are present in any cell lysate. These substances are often negatively charged and can result in poor focusing toward the anode. See also above.
Ionic detergent Ionic detergents (usually SDS) are often used during protein extraction, but can strongly interfere with IEF. SDS forms complexes with proteins, and the resulting negatively charged complex will not focus unless the SDS is removed or sequestered.
Nucleic acids (DNA, RNA) Nucleic acids increase sample viscosity and cause background smears. High-molecular-weight nucleic acids can bind to proteins through electrostatic interactions, preventing focusing. If the separated sample proteins are visualized by silver staining, nucleic acids present in the gel will also stain, resulting in a background smear on the 2-D gel.
Polysaccharides Polysaccharides can clog gel pores causing either precipitation or extended focusing times, resulting in horizontal streaking. Some polysaccharides contain negative charges and can complex with proteins by electrostatic interactions.
Lipids Many proteins, particularly membrane proteins, are complexed with lipids. This reduces their solubility and can affect both the pI and the molecular weight. Lipids form complexes with detergents, reducing the effectiveness of solubilization. When extracts of lipid-rich tissue are centrifuged, there is often a lipid layer that can be difficult to remove.
Phenolic compounds Phenolic compounds are present in many plant tissues and can modify proteins through an enzyme-catalyzed oxidative reaction.
Insoluble material Insoluble material in the sample can clog gel pores and result in poor focusing. Insoluble material is particularly problematic when the sample is applied using sample cups as it can prevent protein entry into the IPG strip.
1-D SDS-PAGE: Generally, to yield clear, distortion-free bands of constant width, each sample must have the same buffer and ionic composition.
Trypsin digestion: Trypsin is a serine protease with an optimal operating pH of 8 and an optimal operating temperature of 37°C. Trypsin predominantly cleaves proteins at the carboxyl end (or C-terminal end) of the amino acids lysine and arginine, except when either is followed by proline. Sequencing-grade trypsin is normally methylated (on the lysines) to prevent extensive autocatalysis. A volatile buffer is most often recommended: 50 mM NH4HCO3 (pH 7.8). Cleavage is generally faster and more complete in the presence of 1 M urea or up to 10% acetonitrile, whereas reducing agents will abolish the activity.

24 28-9887-41 AA
Chromatography: Contaminants may clog the pores of any chromatography medium. Specific contaminants affect different chromatography media differently, depending on the basis of separation. For example, salt may interfere with IEX, and detergents and lipids may hinder effective separation using HIC. When using any packed column, samples should be free of visible particulates to avoid pore clogging. This is especially true for GF, which separates molecules based on size. Pass samples through a 0.45 or 0.5 µm filter to remove particulates (see Chapter 4; ensure that filters have low protein adsorption).
Analytical capabilities of protein analysis techniquesGlobal analysis of proteins is a complex and challenging task, mainly due to the large heterogeneity of chemical properties and the lack of general amplification techniques similar to the Polymerase Chain Reaction (PCR) for nucleic acids. However, a large number of both global and targeted techniques do exist for proteins. As stated earlier, the main focus in this handbook is on electrophoresis and MS-based techniques. Each of these main categories can be operated in both protein independent (2-D gel electrophoresis and global MS) and targeted (Western blots and targeted MS) modes. Brief descriptions of the techniques can be found in Appendix 1. A rough comparison of their analytical capabilities (without the aid of extensive sample preparation) related to expression analysis of proteins can be found in Table 1.5. Data for top-of-the-line affinity-based assays (i.e., bead-based protein arrays, proximity ligation assays, etc.) have been added for reference.
Table 1.5. Indications of analytical capabilities for selected categories of protein analysis techniques. Exact values will of course vary extensively based on the specific equipment, protocol, and sample used.
Technique Dynamic range SensitivityResolving power/
multiplexing References
2-D gel electrophoresis 102-103 10–100 ng/ml ~2–5000 proteins (2, 3, 16, 17)
Global quantitative MS including RPC peptide separation
102-103 1–10 ng/ml ~ 1000 proteins (2, 3, 18, 19)
Targeted quantitative MS including RPC peptide separation
104-105 0.1–1 ng/ml ~ 20–100 known proteins
(20–22)
Western blotting 103-104* 10–100 pg/ml A few known proteins
(23, 24)
Affinity-based assays 105-106* < 0.1 pg/ml ~10–100 known proteins
(25, 26)
* The values given indicate dynamic range for a single protein in an assay. By making adjustments (e.g., adjusting antibody dilutions), global dynamic range can be extended so that any protein from the sensitivity limit upward can be measured (at least in a single-plex mode).
References1. Ghaemmaghami, S. et al., Global analysis of protein expression in yeast. Nature 425,
737–741 (2003).
2. Eriksson, J. and Fenyö, D. Improving the success rate of proteome analysis by modeling protein-abundance distributions and experimental designs. Nat. Biotechnol. 25, 651-655 (2007).
3. Ali-Khan, N. et al. Overview of proteome analysis, in Current Protocols in Protein Science, John Wiley and Sons, Inc., New York. 22.1.1-22.1.19, supplement 30 (2002).
4. Anderson, N. L. and Anderson, N. G. The human plasma proteome: history, character, and diagnostic prospects. Mol. Cell. Proteomics 1, 845–867 (2002).
5. Bodzon-Kulakowska, A. et al. Methods for samples preparation in proteomic research. J. Chromatogr. 849, 1–31 (2007).

28-9887-41 AA 25
6. Rifai, N. et al. Protein biomarker discovery and validation: the long and uncertain path to clinical utility. Nat. Biotechnol. 24, 971-983 (2006).
7. Svensson, M. et al. Heat stabilization of the tissue proteome: a new technology for improved proteomics. J. Proteome Res. 8, 974–981 (2009).
8. Bodzon-Kulakowska, A., et al., Methods for samples preparation in proteomic research, J. Chromatogr. B, 849, 1–31 (2007).
9. Granger, J. et al. Albumin depletion of human plasma also removes low abundance proteins including the cytokines. Proteomics 5, 4713–4718 (2005).
10. Liu, T. et al. Evaluation of multiprotein immunoaffinity subtraction for plasma proteomics and candidate biomarker discovery using mass spectrometry. Mol. Cell. Proteomics 5, 2167–2174 (2006).
11. Hunter, T. The Croonian Lecture 1997. The phosphorylation of proteins on tyrosine: its role in cell growth and disease. Philos. Trans. R. Soc. Lond. B. Biol. Sci. 353, 583-605 (1998).
12. Ogorzalek Loo, R. R. et al Surfactant effects on protein structure examined by electrospray ionization mass spectrometry. Protein Science 3, 1975-1983 (1994).
13. Cohen, S. L. and Chait, B. T. Influence of matrix solution conditions on the MALDI-MS analysis of peptides and proteins. Anal. Chem. 68,31-37 (1996).
14. Jiménez, C.R. et al., Sample Preparation for MALDI Mass Analysis of Peptides and Proteins, Curr. Protoc. Protein Sci., Unit 16.3, 10.1002/0471140864.ps1603s14 [Online] 1 May 2001.
15. Berkelman, T. Removal of interfering substances in samples prepared for two-dimensional (2-D) electrophoresis. Methods in Molecular Biology 424 Humana Press, New Jersey, pp 51-62 (2008).
16. Görg, A. et al. Current two-dimensional electrophoresis technology for proteomics. Proteomics 4, 3665-3685 (2004).
17. 2-D Electrophoresis: Principles and Methods, GE Healthcare, 80-6429-60 Edition AD (2010).
18. Wysocki V. H. et al. Mass spectrometry of peptides and proteins. Methods 35 211–222 (2005).
19. Domon, B. and Aebersold, R. Mass spectrometry and protein analysis. Science 312, 212-217 (2006).
20. Pan, S. et al. Mass spectrometry based targeted protein quantification: methods and applications. J. Proteome Res. 8, 787–797 (2009).
21. Brun, V. et al. Isotope dilution strategies for absolute quantitative proteomics. J. Proteomics 72, 740-749 (2009).
22. Picotti, P. et al. Full dynamic range proteome analysis of S. cerevisiae by targeted proteomics. Cell 138, 795–806 (2009).
23. Kurien, B. T. et al. Protein blotting: a review. J. Immunol. Methods 274, 1-15 (2003).
24. Application note: Multiplex protein detection using the ECL Plex™ fluorescent Western blotting system, GE Healthcare, Edition 28-4015-40 AB (2005).
25. Fredriksson, S. et al. Multiplexed protein detection by proximity ligation for cancer biomarker validation. Nat. Methods 4, 327-329 (2007).
26. Joos, T. O. et al. Protein microarray technologies: an array of applications, in Optical Biosensors: Today and Tomorrow 2nd Edition (Ligler, F. S. and Taitt, C. R. eds.), Elsevier, Oxford (2008).

26 28-9887-41 AA

28-9887-41 AA 27
Chapter 2 Sample collection, stabilization, and protein extraction
IntroductionThe first interrelated steps in any protein analysis workflow include the collection of a well-defined sample specimen, followed by stabilization and extraction of the protein population relevant to the analytical purpose (Fig 2.1). These steps are the focus of this chapter. The purpose is to move all the targeted protein population—while preserving the in vivo state—from the initial biological source into a homogeneous solution. Any bias introduced during these steps cannot be compensated for, regardless of the sophistication and performance of additional sample preparation and analytical techniques.
Due to the large chemical/physical heterogeneity of both proteins and the sample sources in which they are contained, no universal set of protocols exists. Methods need to be adjusted based on sample source, the analytical purpose, and technique. The level of manipulation needed at this stage also varies greatly. At one end, body fluids such as urine or plasma are already more or less homogeneous protein solutions with low enzymatic activity, and they require only minor adjustments after collection. At the other end, tissue samples require extensive manipulations to break up tissue architecture, control enzymatic activity, and solubilize proteins. The intent of this chapter is to provide an overview of important methodology and considerations together with specific examples of products and protocols. A closely related and sometimes integrated objective is the removal of nonprotein contaminants (nucleic acids, lipids, polysaccharides, phenols, etc.) present in the sample sources used. Some aspects, such as nuclease treatment to reduce the size of DNA, are covered here, but the subject is mainly covered in Chapter 4.
Collect sample and extract/stabilize proteins
Increase detectabilityof targeted proteins
Analyze proteins
Sample source (bacterial or other cell culture,
tissue, body fluids, etc.)
Homogeneous protein solution with complex
composition
One or multiple protein subsamples with
improved compositionAnalytical results
Ensure compatibility in workflowSample state
Unit operation category
Fig 2.1. High-level workflow for protein sample preparation and analysis. The unit operation category discussed in this chapter is framed.
In addition to uniform and high-yield extraction of targeted proteins, the quality of the isolated proteins is also an important consideration. Quality refers to the physical form of the isolated proteins. As outlined in Chapter 1, protein modifying enzymes are often activated and released during sample collection and protein extraction. If not controlled, they can cause degradation and alter PTMs. Degradation and chemical modifications can also be induced by the conditions

28 28-9887-41 AA
used in sample preparation operations. Because relatively harsh conditions are often needed to break tissue/cell architecture and solubilize proteins, induced modifications are of special concern at this stage. Aside from the requirement for intact protein, some workflows require that proteins are functionally active or at least retain their 3-D structure.
Overview of steps to prepare a protein extractDirectly at or after sample collection, there is an onset of processes that will begin to degrade or alter the proteome, as discussed in Chapter 1. There must be a strategy to cope with the deteriorating proteome, possibly including one or more of these processes:
• snap-freezing of sample in liquid nitrogen
• chemical- and/or temperature-induced denaturation of proteins (including modifying enzymes)
• addition of protective or stabilizing compounds (reducing agents, enzyme inhibitors, etc.)
• stabilization or inactivation of proteins by precipitation
• working quickly and keeping samples cold during processing
Next, there is a need to solubilize the proteins using a suitable buffer to control the pH and other additives that enhance solubility of proteins and are compatible with later processes. Depending on the sample, there may be a need for homogenization and cell disruption using one of the techniques in Table 2.1. A kit-based protocol for small-scale homogenization of tissue samples follows Table 2.1.
Additional general considerations include time of exposure to extraction buffer/solvent and the ratio of solubilization agent to protein.
Keep the sample preparation strategy as simple as possible to avoid protein losses. Additional sample preparation steps may improve the quality of the final experimental result, but at the possible expense of selective protein loss.
The following steps will be discussed in greater detail in this chapter. Note that protein stabilization and solubilization often occur concurrently with breaking up cellular and tissue architecture.
• Sample collection
• Breaking up cellular and tissue architecture- Subcellular fractionation
• Stabilization of proteins against:- Hydrolysis by proteases and phosphatases- Oxidation- Conformational destabilization
• Solubilization of proteins
• Clarification of protein extract
• Protein quantitation
Sample collectionSample collection, or sampling, is the process of withdrawing a defined portion of the biological system to be analyzed. A multitude of sample sources exist, but the most important biological model systems can be found among mammalian cell cultures, tissues, or body fluids. For recombinant protein expression, different cell cultures (bacteria, yeast, insect, or mammalian cells) are the most common sources. Hybridoma cells are a source of monoclonal antibodies.

28-9887-41 AA 29
Breaking up cellular and tissue architectureTo extract proteins from cells and tissue, cellular and tissue architecture needs to be broken up so that proteins or subcellular components are accessible for manipulation. Extraction is further dependent on the concurrent action of a solution with suitable additives to release and solubilize all targeted proteins. The need to stabilize proteins should also be carefully considered at or before extraction. The latter objectives are covered separately below. Methods available to achieve the first objective can be roughly divided into gentle lysis methods, moderate methods, or vigorous homogenization and cell disruption methods (Table 2.1). In lysis methods, cells are generally only perforated or partly ruptured, leaving parts of the architecture intact. In contrast, the more vigorous methods tend to achieve more or less full homogenization of the sample (absence of higher-order structure).
Monitor the effectiveness of the disruption method by closely inspecting the lysate, looking for particulate matter. For stringent downstream analyses, remove all particulate material by filtration (see “Clarification of protein extract,” below) or centrifugation/ultracentrifugation. For example, solid particles and lipids must be removed prior to 2-D electrophoresis because they will block the gel pores.
Disrupt the cells or tissue in such a way as to minimize proteolysis and other modes of protein degradation. Cell disruption should be performed at as low a temperature as possible and with a minimum of heat generation. Often, carrying out cell disruption in a solution containing protease inhibitors will give good results.
Prepare the sample just prior to the analysis (or store samples in aliquots at -80°C) to preserve sample quality.
Do not expose protein solutions to repeated freeze/thawing.
The design of this step is highly dependent on whether or not subcellular fractionation will be applied. As outlined in Chapter 1, current analytical technologies are insufficient to handle the large complexity of biological samples without some sort of simplification. One possible route is to restrict the breadth of analysis by focusing on subcellular structures such as organelles (nuclei, Golgi, mitochondria, endoplasmic reticulum, etc.).
Subcellular fractionationIn subcellular fractionation, protein extraction becomes a multistep procedure. First, cells from culture or tissue need to be lysed to release their organelles. In general, the method needs to be very gentle to minimize disruption of organelles. Once the cells have been opened, the components of interest are generally roughly purified by differential centrifugation in, for example, density gradient media. The resulting fractions often contain significant amounts of contaminating components, so further fractionation is generally advisable, although the overall yields are lowered. Available methods for these purifications include free-flow electrophoresis and immuno-purification. Finally, proteins are extracted from purified organelles in a similar manner as for cells. For more detailed guidance, refer to reference 1.

30 28-9887-41 AA
Table 2.1. Homogenization and cell disruption methods
Extraction process Mechanism Typical conditions Sample source CommentsGentle
Cell lysis (osmotic shock)
Very gentle method suitable for fractionation of subcellular organelles.
Add two volumes water to one volume packed, prewashed cells.
Erythrocytes, E. coli (periplasmic proteins).
Reduced protease release, but lower product yield.
Enzymatic digestion Enzymes remove cell walls.
Add lysozyme at 0.2 mg/ml.
Good for Gram-positive bacteria. For Gram-negative bacteria (e.g., E. coli), combine with detergent and/or osmotic shock lysis.
Often combined with mechanical disruption.
Detergent lysis Detergents solubilize cellular membranes.
Suspend cells in lysis solution containing detergent.
Eukaryotes, E. coli.
Hand homogenization Use a handheld homogenizer or a blender to physically break up tissue and cells.
Chop tissue into small pieces first, if necessary. Add chilled homogenization buffer (3–5 vol/vol tissue). Homogenize briefly. Clarify lysate by filtration and/or centrifugation.
Liver tissue, etc. Homogenization is rapid. Poses little danger for proteins except by the proteases that may be liberated upon disruption.
Grinding Grind with mortar and pestle.
Freeze in liquid nitrogen and grind to a fine powder.
Muscle tissue, etc.
Moderate
Blade homogenizer Follow equipment instructions.
Muscle tissue, most animal tissue, plant tissue.
Grinding with abrasive, e.g., glass beads
The abrasive actions of vortexed beads break cell walls, liberating cellular contents.
Add 1–3 g of glass beads per g of prewashed cells, vortex, chill, centrifuge, repeat up to five times, pooling supernatants.
Bacteria, plant tissue. Physical method.
Chemical conditions are less important for cell lysis but may be important for subsequent removal of cell debris and for purification steps.
Freeze/thaw Cells are subjected to one or more cycles of quick freezing and subsequent thawing.
Freeze cells, thaw (repeat several times), resuspend pellet by pipetting or gentle vortexing in room-temperature lysis buffer.
Incubate, centrifuge, retain supernatant.
Several freeze/thaw cycles may affect the integrity of the proteins.
Vigorous
Ultrasonication or bead milling
Ultrasonic sound waves generated by a sonicator disrupt cells through shear forces.
Sonicate cell suspension in appropriate buffer using short bursts to avoid heating. Cool on ice between bursts.
Cell suspensions: intracellular proteins in cytoplasm, periplasm, inclusion bodies.
Release of nucleic acids may cause viscosity problems; if so, add deoxyribonuclease (DNase).
Inclusion bodies must be resolubilized.
French press Cells are disrupted by shear forces resulting from forcing cell suspension through a small orifice under high pressure.
Place cell suspension in chilled French pressure cell. Apply pressure and collect extruded lysate.
Bacteria, plant cells.

28-9887-41 AA 31
Kit-based sample grindingSample Grinding Kit from GE Healthcare is designed for the grinding of small tissue or cell samples (100 mg or less) for protein extraction. The kit consists of fifty 1.5 ml microcentrifuge tubes each containing a small quantity of abrasive grinding resin suspended in water. Fifty pestles for sample grinding are also supplied. To begin the protocol (Fig 2.2), one would centrifuge the tube to pellet the resin and remove the water, then add an extraction solution of choice along with the sample to be ground. After the sample is ground with a disposable pestle, cellular debris and grinding resin are removed by centrifugation. Sample Grinding Kit will effectively grind most animal and plant tissues. Intracellular organelles are also disrupted, resulting in the liberation and extraction of all proteins soluble in the extraction solution. A brief protocol is provided below. See product instructions for a detailed protocol.
Pellet grinding resin Add extraction solution and sample
Grind sample with pestle
Centrifuge sample and collect supernatant
Fig 2.2. Sample disruption using Sample Grinding Kit.
Materials
Pestles and Grinding Tubes (microcentrifuge tubes containing grinding resin) are provided with the product.
Extraction solution/buffers of choice1
Advance preparation
The tissue of interest may be sliced with a scalpel to yield an appropriately sized fragment, or it may be frozen with liquid nitrogen and broken into small fragments in a mortar and pestle. Sample grinding may be simpler if the tissue is minced prior to adding to the grinding tube.
1 GE Healthcare provides a range of extraction buffers. See below.
Protocol
1. Pellet grinding resin
Centrifuge one or more grinding tubes briefly at maximum speed to pellet the grinding resin. Remove liquid.
2. Add extraction solution and sample
Add extraction solution of choice to the grinding tube and vortex. Add tissue or cells. The extraction buffer and additives should solubilize the target proteins and protect against chemical and/or enzymatic activity as previously discussed.
3. Grind sample with pestle to disrupt cells/tissue
Use a pestle to thoroughly grind the sample. Add more extraction solution if needed.
4. Centrifuge sample and collect supernatant
Centrifuge the tube at maximum speed to remove resin and cellular debris. Carefully transfer the clear supernatant to another tube. The extract is now ready for further cleanup or analysis by SDS-PAGE, 2-D electrophoresis, or other means.

32 28-9887-41 AA
Stabilization of proteinsProtein lifetimes range from seconds (hormones) to years (collagen) and are related to charge and secondary structure. The stability and thereby the quality of protein extracts is limited by enzymatic activity (proteases and other protein modifying enzymes) as well as deleterious chemical reactions and conformational changes (denaturation) induced during handling. See Table 2.2 for an overview of possible modifications. Destabilization can be reversible or irreversible. Further details about some of the commonly occurring modifications are discussed below.
Table 2.2. Destabilizing chemical reactions and effects on protein stability in vitro
Chemical (covalent) modifications
Modification Comment
Hydrolysis For example, proteolysis
Oxidation Especially Met, Trp, and His residues
Deamidation Asn, some Gln residues
β-elimination Asp residues
Isopeptide formation Amide bond between Lys and Glu or Asp side chains
Racemization
S-S interchange and/or thiol/S-S exchange
Conversion of L-amino acids to D-form; slow
Cys-bridges
Maillard reaction Amino acid amine reaction with reducing sugar
Conformational (noncovalent) modifications (unfolding/denaturation/aggregation)
Protonation/deprotonation pH extremes
Solvation of hydrophobic core For example, by detergents
Transfer of water to hydrophobic core For example, pressure
Shear force For example, by mixing, flow in tubes, or UF
Transfer of nonpolar residues to the surface For example, by high temperature
Repulsive or attractive intramolecular salt bridges Divalent metal ions
Lyotropism Salting-in
Unless very stable proteins are to be studied, there is a need to quickly stabilize a sample specimen after collection. Freeze/thawing and homogenization of a sample bring all proteins together unordered, which means that modifying enzymes come in contact with proteins that were previously separated in space and in different cell compartments. The strategy is simple: reduce all enzymatic activity and keep all modifications to a minimum. In practice, however, this is a real challenge. It is important to decide whether or not the proteins need to retain their conformation. Enzymatic activity may be stopped quickly by denaturation of all proteins in a sample, for example, by quick heating, but it may be impossible to return the proteins to their active native state later. Working with native proteins normally requires use of gentle extraction methods combined with chemical compounds that inhibit detrimental enzymatic activity.

28-9887-41 AA 33
Protection against hydrolysis Nonenzymatic hydrolysis of the peptide bonds in proteins requires heating of the sample in the presence of a strong acid such as hydrochloric acid for a prolonged time (e.g., for amino acid analysis). During sample preparation, there may be some limited nonenzymatic peptide hydrolysis, facilitated at Asp-Pro bonds at pH 2 or below (2). Otherwise, the major cause of peptide hydrolysis in proteins is due to the action of proteases (also known as peptidases or peptide hydrolases). Proteases occur naturally in all organisms. There are two sets of subclasses recognized by the International Union of Biochemistry and Molecular Biology (IUBMB): exopeptidases and endopeptidases. Exopeptidases act only near the ends of a polypeptide chain whereas endopeptidases are divided into sub-subclasses on the basis of catalytic mechanism.
Examples of proteases include:
Exopeptidases
• Aminopeptidases (e.g., Alanine aminopeptidase)
• Dipeptidyl peptidases (e.g., Cathepsin C)
Endopeptidases
• Serine proteases (e.g., Chymotrypsin)
• Cysteine proteases (e.g., Papain)
• Aspartic acid proteases (e.g., Penicillopepsin)
• Metallo endopeptidases (e.g., Thermolysin)
Characteristic inhibitors of the members of each catalytic type of protease exist; some examples are shown in Table 2.3. See references 3, 4, and 5 for further reading.
Another important reaction involving hydrolysis is the reversible phosphorylation of serine, threonine, and tyrosine residues. The phosphorylation-dephosphorylation is tightly controlled by the opposing action of protein kinases and phosphatases, respectively. Phosphatases are of special concern when preparing samples for detection of phosphorylated proteins and peptides. There are two superfamilies of phosphatases, Ser/Thr and Tyr phosphatases, and they can be chemically inhibited, preferably by a mix of different compounds. Salts of vanadate, molybdate, tartrate, imidazole, okadaic acid, and so on, inhibit various classes of phosphatases.

34 28-9887-41 AA
Table 2.3. Examples of protease and phosphatase inhibitors1
Protease inhibitors2
Inhibitor Working concentration
Target Comments
Phenylmethylsulfonyl fluoride (PMSF)3
0.5–1 mM Inhibits serine proteases and some cysteine proteases
PMSF is an irreversible inhibitor that inactivates serine and some cysteine proteases. PMSF is rapidly inactivated in aqueous solutions. Prepare just prior to use. Less effective in the presence of thiol reagents. PMSF is very toxic.
Aminoethyl benzylsulfonyl fluoride (AEBSF)
up to 4 mM Inhibits serine proteases More soluble and less toxic than PMSF. Induces modifications that can potentially alter the pI of a protein, which could affect 2D-PAGE and MS analysis.
4-Aminophenyl-methylsulfonyl fluoride (APMSF)
0.4–4 mM Inhibits serine proteases
EDTA 2–10 mM Inhibits metal-dependent proteases, zinc, and iron
Inhibits nucleases by binding Mg2+ added to break down nucleic acids in viscous samples.
EGTA 2–10 mM Inhibits metal-dependent proteases, e.g., calcium
Does not bind Mg2+, thus does not inhibit nucleases.
Pepstatin 1 µM Inhibits aspartic proteases May interfere with protein analysis.
Leupeptin 10–100 µM Inhibits cysteine and serine proteases
May interfere with protein analysis.
Chymostatin 10–100 µM Inhibits chymotrypsin, papain, cysteine proteases
May interfere with protein analysis.
Antipain-HCl 1–100 µM Inhibits papain, cysteine and serine proteases
Tosyl lysine chloromethyl ketone (TLCK), tosyl phenylalanine chloromethyl ketone (TPCK)
0.1–0.5 mM Inhibits serine and cysteine proteases
Irreversible inhibition.
Benzamidine-HCl 0.2 mM Inhibits serine proteases
Phosphatase inhibitors
Sodium orthovanadate 0.4–0.5 mM Inhibits phosphotyrosyl phosphatases (PTPs)
Competitive inhibition. The inhibition by vanadate is completely reversible upon the addition of EDTA or by dilution.
Calyculin A 50–100 nM Inhibits serine and threonine phosphatases
1 Details taken from references 6 and 7, and other sources2 Protease inhibitors are available in premade mixes from several suppliers3 PMSF is a hazardous chemical. Half-life time in aqueous solution is 35 min. PMSF is usually stored as a 10 mM or 100 mM
stock solution (1.74 or 17.4 mg/ml) in isopropanol at –20°C

28-9887-41 AA 35
Protease inhibition using Protease Inhibitor Mix
GE Healthcare offers Protease Inhibitor Mix, which is a combination of competitive and noncompetitive protease inhibitors that inhibits serine, cysteine, and calpain proteases.Protease Inhibitor Mix effectively inhibits over 95% of protease activity and protects proteins from proteolysis during preparation from animal tissues, plant tissues, yeast, and bacteria. The cocktail was specifically developed for sample preparation in 2-D electrophoresis studies, but it can be more broadly used. Optionally, EDTA may be added to inhibit metalloproteases, although keep in mind that the absence of EDTA allows optimal nuclease activity for removing nucleic acids from samples. Therefore, if nucleases will be added to the protein sample, use EGTA instead of EDTA because it does not chelate the Mg2+ that is required for nuclease activity.
Materials
Protease Inhibitor (100× solution) is provided with the product.
Advance preparation
None
Protocol
1. Allow the solution to warm to room temperature.
2. The solution is in suspension form. Vortex briefly before using.
3. Dilute Protease Inhibitor 1:100 (10 µl/ml) in an appropriate volume of extraction buffer or extract.1
1 GE Healthcare provides a range of extraction buffers. See below.
Further options
• If a higher potency of protease inhibition is required, add Protease Inhibitor at a concentration of 20 to 30 µl/ml to get a 2× to 3× final concentration.
• For the inhibition of metalloproteases, add EDTA directly in an appropriate volume of extraction buffer or extract to give a final concentration of 5 mM EDTA in the reaction.
Do not add EDTA if the solution is to be used in conjunction with Nuclease Mix, as EDTA acts as a nuclease inhibitor. Use EGTA instead.
Protection against oxidationNaturally occurring oxidases exist that have important functions in vivo, such as oxidation of –SH groups to generate disulfide bonds or hydroxylation of Pro, Lys, and Asn residues in collagen. Oxidation is often directly or indirectly mediated by free radicals and may be catalyzed by transition metal ions. Iron (II) and copper(II) salts will slowly oxidize in the presence of oxygen and water to form reactive oxygen species that may attack any amino acid side-chain of a protein in a sample, but there are a few amino acid residues that are preferentially targeted by metal-ion-catalyzed oxidation: His, Met, Cys, and Trp. See reference 8 for further reading.
One common example of oxidation of proteins during handling occurs during electrophoresis. Reactive oxygen species may be generated during electrophoresis especially when using nondegassed acrylamide solutions (9). The resulting oxidation may be detected as a mass shift (+16 Da) in peptides after enzymatic digestion and MS analysis. An oxygen species scavenger such as thioglycolate may be added to the cathode buffer to minimize such artifactual oxidation reactions.
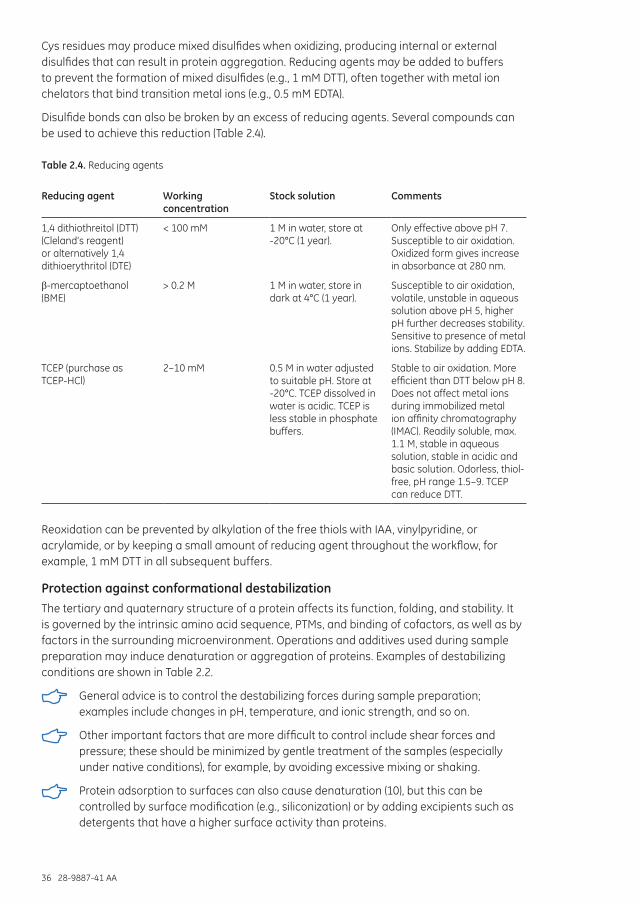
36 28-9887-41 AA
Cys residues may produce mixed disulfides when oxidizing, producing internal or external disulfides that can result in protein aggregation. Reducing agents may be added to buffers to prevent the formation of mixed disulfides (e.g., 1 mM DTT), often together with metal ion chelators that bind transition metal ions (e.g., 0.5 mM EDTA).
Disulfide bonds can also be broken by an excess of reducing agents. Several compounds can be used to achieve this reduction (Table 2.4).
Table 2.4. Reducing agents
Reducing agent Working concentration
Stock solution Comments
1,4 dithiothreitol (DTT) (Cleland’s reagent) or alternatively 1,4 dithioerythritol (DTE)
< 100 mM 1 M in water, store at -20°C (1 year).
Only effective above pH 7. Susceptible to air oxidation. Oxidized form gives increase in absorbance at 280 nm.
β-mercaptoethanol (BME)
> 0.2 M 1 M in water, store in dark at 4°C (1 year).
Susceptible to air oxidation, volatile, unstable in aqueous solution above pH 5, higher pH further decreases stability. Sensitive to presence of metal ions. Stabilize by adding EDTA.
TCEP (purchase as TCEP-HCl)
2–10 mM 0.5 M in water adjusted to suitable pH. Store at -20°C. TCEP dissolved in water is acidic. TCEP is less stable in phosphate buffers.
Stable to air oxidation. More efficient than DTT below pH 8. Does not affect metal ions during immobilized metal ion affinity chromatography (IMAC). Readily soluble, max. 1.1 M, stable in aqueous solution, stable in acidic and basic solution. Odorless, thiol-free, pH range 1.5–9. TCEP can reduce DTT.
Reoxidation can be prevented by alkylation of the free thiols with IAA, vinylpyridine, or acrylamide, or by keeping a small amount of reducing agent throughout the workflow, for example, 1 mM DTT in all subsequent buffers.
Protection against conformational destabilizationThe tertiary and quaternary structure of a protein affects its function, folding, and stability. It is governed by the intrinsic amino acid sequence, PTMs, and binding of cofactors, as well as by factors in the surrounding microenvironment. Operations and additives used during sample preparation may induce denaturation or aggregation of proteins. Examples of destabilizing conditions are shown in Table 2.2.
General advice is to control the destabilizing forces during sample preparation; examples include changes in pH, temperature, and ionic strength, and so on.
Other important factors that are more difficult to control include shear forces and pressure; these should be minimized by gentle treatment of the samples (especially under native conditions), for example, by avoiding excessive mixing or shaking.
Protein adsorption to surfaces can also cause denaturation (10), but this can be controlled by surface modification (e.g., siliconization) or by adding excipients such as detergents that have a higher surface activity than proteins.

28-9887-41 AA 37
Solubilization of proteinsBiological samples are in general highly complex in their protein composition. Cells, for example, express from a few thousand up to 20 000 proteins that differ in their cellular and subcellular distribution, charges, molecular mass, and hydrophobicity. The proteins are expressed at different levels and with various PTMs. Cells contain proteins that are either bound in protein complexes or to various components of the cell. Cytoplasmic proteins are normally “soluble” in that they can move around the cell.
The solubilization of any protein mixture is of major importance, because it will affect the overall performance of the final analysis. The aim with global protein analysis is to solubilize as many target proteins as possible with a high reproducibility to achieve the best possible results. When working with recombinantly produced proteins, the aim is to maximize the solubility of the target protein while minimizing the solubility of contaminants, but reproducibility is equally important.
Most often all interactions with other proteins, lipids, or nucleic acids also need to be disrupted (except when the actual aim is to study interactions). The chosen solubilization strategy should be compatible with other steps in the workflow. It may sometimes be crucial to keep the proteins in their natively folded state, if the aim is to perform an analysis based on functionality or for compatibility with other steps in a workflow, but native protein extraction inevitably compromises extraction efficiency. Efficient extraction is in fact, in part, dependent on breaking protein interactions to release proteins bound in macromolecular assemblies; therefore, the conditions needed to maximize the solubilization of proteins are often denaturing to some degree.
A successful preparation of a protein extract includes the release of fully soluble proteins from the source material in a form that is compatible with the next step(s) in the workflow while avoiding unwanted chemical or conformational degeneration. If the protein source is cells or tissue this involves:
homogenization – solubilization – stabilization
These steps are ideally executed simultaneously, involving choice of disruption method and extraction buffer, and including a strategy to avoid modification of the proteins. The extraction procedure should be executed in the exact same way for all samples in the experimental series.
Solubility is governed by some of the factors that stabilize/destabilize proteins, as shown in Table 2.2. Apart from temperature and hydration, the major solubilizing factors depend on electrostatic, hydrophobic, and hydrogen bonding interactions.

38 28-9887-41 AA
Extraction and lysis buffersAn extraction or lysis buffer usually contains a buffer substance, salts, and additives such as detergents and/or urea. The composition of the actual extraction/lysis buffer will differ depending on source material and the workflow. Stabilizing factors are also commonly added. Some considerations relating to the different constituents of an extraction/lysis buffer are discussed below.
Buffers and salts
Solubility is governed mainly by electrostatic factors such as the presence of ionizable amino acid side chains by exposure of charged residues in aqueous solutions. The protein is usually least soluble at a pH equal to its pI. The distribution of pI and molecular weight of the different proteins in a sample is not normally distributed (11). Most proteins form part of one of two major clusters with peaks at pH 5.5 and 9.5, respectively, although minor peaks can be detected at pH 7.8 and pH 12 (12). Relatively few proteins have their pI values between pH 7 and 8, which happens to be the physiological pH range.
During sample preparation, the salt concentration and type, the pH and temperature, or additive type and concentration must be controlled. The influence of the salt type on protein solubility was first described by Hofmeister in 1888. He ranked several anions and cations according to their ability to precipitate proteins from egg white. The salting-out ability of some anions and cations according to the Hofmeister (or lyotropic) series is shown below:
anions SCN- < ClO4- < NO3
- < Br- < Cl- < CH3COO- < SO42- < PO4
3-
“salting-in” “salting-out”
cations guanidinium < Ca2+ < Mg2+ < Li+ < Na+ < K+ < NH4+
Ions at either end of the Hofmeister series may have a large impact on the conformational stability of proteins. Salting-out ions increase the surface tension and strengthen hydrophobic interactions and may be used to precipitate proteins. Salting-in ions (chaotropes) increase the entropy of water and weaken the hydrophobic interactions and may potentially denature proteins. Nonelectrolytes may also exhibit salting-in or salting-out effects, for example, urea (salting-in) and carbohydrates (salting-out).
For solubilization of proteins, a neutral or salting-in compound is normally chosen. Sodium chloride at a concentration of 0.15 M, which at pH 7.4 corresponds to physiological conditions, may be used for native extraction, for example.
Buffers are used to control the pH and protect against changes in pH. They are most effective at ± 0.5 pH units around their acid dissociation constant (pK
a) values. The buffer capacity is a measure of the protection against changes in pH and is generally dependent on the buffer concentration. A buffer concentration of 25 to 50 mM is normally sufficient. Different buffers are characterized by their pKa value(s), pKa/temperature relationships (ΔpKa/°C), charge, solubility, and other characteristics such as metal ion binding, reactive groups, for example, primary amines, volatility, etc. Some commonly used buffers are shown in Table 2.5. Physiological pH is often referred to as the pH of blood, which is commonly around pH 7.4. Phosphate-buffered saline (PBS) is a commonly used physiological buffer. One version of PBS contains 140 mM NaCl, 2.7 mM KCl, 10 mM Na2HPO4, 1.8 mM KH2PO4, pH 7.4.

28-9887-41 AA 39
Table 2.5. Buffer substances commonly used
Common name pKa (25°C) Buffer range ΔpKa/°C
Phosphate1 2.11
Glycine 2.39
Citric acid1 3.13 2.6-3.6 -0.0024
Formic acid 3.75 3.8-4.3 0.0002
Lactic acid 3.8
Gamma-aminobutyric acid (GABA) 4.07
Acetic acid 4.76
Propionic acid 4.83
Histidine 6.04
2-(N-morpholino)ethanesulfonic acid (MES) 6.1 5.5–6.7 −0.011
Bis-Tris 6.5 5.8–7.2
N-(2-Acetamido)iminodiacetic acid (ADA) 6.59 6.0–7.2
Piperazine-1,4-bis(2-ethanesulfonic acid) (PIPES) 6.76 6.1–7.5 −0.008
N-(2-Acetamido)-2-aminoethanesulfonic acid (ACES) 6.78 6.1–7.5
3-(N-Morpholino)-2-hydroxypropanesulfonic acid (MOPSO) 6.9 6.2–7.6
Phosphate2 6.95
N,N-Bis(2-hydroxyethyl)-2-aminoethanesulfonic acid (BES) 7.09 6.4–7.8
3-(N-morpholino)propanesulfonic acid (MOPS) 7.2 6.5–7.9 −0.015
N-Tris(hydroxymethyl)methyl-2-aminoethanesulfonic acid (TES)
7.4 6.8–8.2 −0.020
4-(2-hydroxyethyl)-1-piperazineethanesulfonic acid (HEPES) 7.55 6.8–8.2 −0.014
Triethanolamine 7.76 7.3–8.2
3-[4-(2-hydroxyethyl)-1-piperazinyl] propanesulfonic acid (EPPS)
8 7.3–8.7
Tricine 8.05 7.4–8.8 −0.021
Tris 8.06 7.5–9.0 −0.028
Glycylglycine 8.21 7.5–8.9
Bicine 8.35 7.6–9.0 −0.018
N-Tris(hydroxymethyl)methyl-3-aminopropanesulfonic acid (TAPS)
8.43 7.7–9.1 −0.018
Morpholine 8.6
Taurine 9.02
Boric acid 9.2
N-Cyclohexyl-2-aminoethanesulfonic acid (CHES) 9.49 8.6–10.0
Ethanolamine 9.54
3-(Cyclohexylamino)-2-hydroxy-1-propanesulfonic acid (CAPSO)
9.6 8.9–10.3
Piperazine 9.73
Glycine 9.74
N-cyclohexyl-3-aminopropanesulfonic acid (CAPS) 10.4 9.7–11.1 1 pKa12 pKa2

40 28-9887-41 AA
Detergents
Protein solubility may be further increased by additives. Detergents (or surfactants, tensides) are amphiphatic molecules consisting of both a polar or ionic group (head-group) and a hydrocarbon chain (tail). In an aqueous solution, the hydrophilic head will form dipole-dipole or ion-dipole interactions with water molecules, while the hydrophobic tails aggregate, resulting in spherical structures called micelles. These properties allow detergents to be soluble in water and to solubilize hydrophobic compounds. In low concentrations, the detergent molecules are isolated, but above a certain concentration (the critical micellar concentration, CMC) micelles are formed. Micelles may consist of pure detergent or a mixture of detergent and lipids and/or proteins (mixed micelles). CMC for a particular detergent depends on the intrinsic properties of the molecule, ionic strength, and temperature, for example.
The classification of detergents normally refers to the nature of the head-group. Some examples are:
anionic SDS
cationic Cetyltrimethylammonium bromide (CTAB)
nonionic Octyl glucoside
zwitterionic CHAPS
The hydrocarbon chain may be linear or branched and is often referred to as flexible or rigid.
The choice of detergents for protein solubilization is almost unlimited; some commonly used detergents are shown in Table 2.6. The appropriate detergent should:
• give maximum yield of target proteins in the soluble fraction
• be soluble in buffer solutions at the working temperature
• be easily removed later in the workflow (if necessary)
• preserve the biological activity (if necessary)
• not introduce unwanted protein modifications
• not interfere with analysis (e.g., detection by UV or MS)
• not interfere with other steps in the workflow
SDS, for instance, is known to solubilize almost any protein at a ratio of 1.4 g of SDS per g of protein (13). SDS denatures and inactivates most proteins and enzymes, including proteases. It is widely used for electrophoresis (SDS-PAGE) and Western blotting. However, it is not suitable for functional studies because it denatures proteins, nor is it suitable for analysis with RPC because of its interference with the media.

28-9887-41 AA 41
Table 2.6. Some commonly used detergents in protein work
Nonionic detergents MW (anhydrous) CMC2 (mM) Average micellar weight
Brij™-35 1199.6 0.09 48 000
Digitonin 1229.3 - 7000
MEGA-8 321.5 58 -
Nonidet™ P-401 306 0.25 -
n-Nonyl-b-d-glucopyranoside 306.4 6.5 -
n-Octyl-b-d-glucopyranoside 292.4 20-25 25 000
n-Octyl-b-d-maltopyranoside 454.5 23.4 38 000
Triton X-1001 625 (avg) 0.2-0.9 80 000
Triton X-114 537 (avg) 0.35 -
TWEEN 20 1228 (avg) 0.059 -
TWEEN 80 1310 (avg) 0.012 76 000
Zwitterionic detergents
CHAPS 614.9 6-10 6150
CHAPSO 630.9 8 7000
Zwittergent 3-10 307.6 25-40 12 500
Zwittergent 3-12 335.6 2-4 18 500
Ionic detergentsCetyltrimethylammonium Bromide (CTAB) 364.5 1 62 000
Cholic acid, sodium salt 430.6 9-15 900
Deoxycholic acid, sodium salt 414.6 2-6 1200-4900
Lauroylsarcosine, sodium salt 293.4 - 600
SDS 288.4 7-10 18 0001 Nonidet P-40, IGEPAL CA-630, and Triton X-100 are liquid detergents of similar structure and average formula weight2 Temperature: 20°C to 25°C
The first step in choosing a detergent involves a survey of the literature. Next, the choice of detergent in the initial step of solubilization is often made on an empirical basis; this involves random testing of a number of detergents and assaying for the yield of the protein(s) of interest. The detergent/protein ratio is important, and during solubilization an excess, for example, 2 to 3 times the amount of detergent compared with protein (and lipids), should be used. It is important to work with the highest-quality “protein-grade” detergents to prevent artifacts and protein modifications. Detergents with polyoxyethylene head-groups for instance, may contain hydrogen peroxide and organic peroxides, which can cause oxidation.
Detergents show different preferential extraction of lipids and proteins as well as solubilization potency. This has been demonstrated in Differential Detergent Fractionation (14).
Often it is sufficient to use detergents only in the extraction step and it is not necessary to continue to use them in all steps throughout a workflow. For membrane proteins it is the opposite, when protein and detergents are complexed in mixed micelles.
Spectral properties
Detergents with aromatic groups such as Triton X-100 will have substantial absorbance at 280 nm.
Compatibility with divalent cations
Long-chain carboxylic acids, for example, N-lauryl sarcosinate, as well as bile salts, have the property of precipitating with divalent cations. Bile salt such as cholate, derivatives such as CHAPS or CHAPSO do not precipitate with divalent cations.
42 28-9887-41 AA
pH dependence on solubility
Detergents containing carboxylic acids can be expected to protonate and become insoluble at weakly acidic pH values.
Temperature effects
Nonionic polyoxyethylene ethers, such as Triton X-100 and Lubrol™ PX, have a characteristic change of micellar weight with temperature. As temperature increases linearly, the micelle expands in an exponential fashion. This process leads to a separation of detergent as a nonaqueous phase at a discrete temperature known as the cloud point.
Chaotropes
A chaotropic agent is a substance that disrupts hydrogen bonds within or between biological molecules. At low concentrations, chaotropic agents cause selective solubilization. At higher concentrations they lead to protein inactivation. The most effective extracting chaotropes are in general the most effective protein denaturants. Urea and guanidine hydrochloride are commonly used chaotropes that increase protein solubility and minimize aggregation. 6 M guanidine hydrochloride or 8 M urea is generally needed to fully denature proteins. Ultrapure-grade compounds should be used.
To avoid modification of proteins, never heat a sample after adding urea. Elevated temperatures cause urea to hydrolyze to isocyanate, which modifies proteins by carbamylation. When the sample contains urea, it must not be heated above 37°C.
Urea forms complexes with nonionic detergents, which may affect chromatographic behavior. Many detergents are insoluble in moderate concentrations of guanidine hydrochloride. CHAPS and guanidine hydrochloride or urea have proved especially useful for the solubilization of aggregating proteins.
High-quality buffers and solutions should be used for protein sample preparation. We recommend filtration to remove particulates. For small volumes, Whatman™ syringe or syringeless filters may be used. Whatman Klari-Flex™ bottle-top filtration system can accommodate volumes from 15 ml to 1 l.
Extraction examplesExtracting protein from mammalian cultured cellsBecause mammalian cells lack a cell wall, they can be readily lysed by a variety of methods. Most mammalian cultured cells can be easily lysed by use of mild detergents (see discussion above). When gentle conditions are required (i.e., to maintain structural integrity or biological activity), Nonidet P-40 or similar detergent should be used in a lysis buffer. An advantage of Nonidet P-40 is that lysis using it releases cytoplasmic and nuclear proteins without releasing chromosomal DNA, which, because of its viscous nature, can cause numerous problems during protein preparation and analysis.
If maintaining structural integrity or biological activity is not a requirement, harsher conditions can be used (e.g., radioimmunoprecipitation assay [RIPA] lysis buffer).
Use of Mammalian Protein Extraction Buffer
A variety of commercial products are available to assist in extracting protein from mammalian cultured cells. Among them is the Mammalian Protein Extraction Buffer from GE Healthcare.
Mammalian Protein Extraction Buffer is based on organic buffering agents, which utilize mild nonionic detergents, and a proprietary combination of various salts and agents to enhance extraction and stability of proteins. Depending on the application, additional agents such as

28-9887-41 AA 43
chelating agents, reducing agents, and protease inhibitors may be added into the buffer (see Protease Inhibitor Mix, above) as well as Nuclease Mix for reducing DNA (see Chapter 4).
Mammalian Protein Extraction Buffer reagent can be used for both suspension and adherent cells. It is compatible with most applications, including enzyme assays, various chromatography protocols, electrophoresis, etc. The protein extract prepared with Mammalian Protein Extraction Buffer may be used for most enzyme assays including reporter gene assays (e.g., β-galactosidase, luciferase, chloramphenicol acetyltransferase), kinases (e.g., protein kinase C [PKC], protein kinase A [PKA] tyrosine kinase), and immunoassays (e.g., ELISA, Western blot, radioimmunoassay [RIA]). A summary of the protocol is provided below. See product instructions for details.
Materials
500 ml of Mammalian Protein Extraction Buffer is provided with the product.
PBS
Refrigerated centrifuge.
Advance preparation
Depending on applications, DTT and EDTA may be added. Prepare an appropriate volume of the Mammalian Protein Extraction Buffer for use by adding both DTT and EDTA to a final concentration of 5 mM. If the presence of a divalent metal ion is necessary for any application, do not add EDTA; instead, add an appropriate divalent salt to a final concentration of 5 mM.
If the inhibition of protease activity is required, add a cocktail of protease inhibitors to prevent protease activities during the extraction procedure (see Protease Inhibitor Mix, above).
Protocol
1. Collect cells
For cell suspension: pellet the cells by centrifugation.
For adherent cells: scrape or detach cells then pellet OR perform steps 2 to 4 on the culture plate.
2. Wash cell pellet
Wash the cell pellet with 5 to 10 ml of PBS. Residual cell culture medium is washed away.
3. Resuspend cell pellet
Add Mammalian Protein Extraction Buffer and suspend the cell pellet.
4. Extract protein
Incubate on ice for 15 to 30 min. This is to allow solubilization to reach equilibrium.
A freeze/thaw step is not necessary for lysis. However, one or two freeze/thaw cycles are not detrimental to the cell extract, and often ensure complete lysis.
5. Recover extracted protein
Centrifuge at high g-force (e.g., > 10 000 x g) for 30 min in a refrigerated centrifuge. Collect the clear suspension for downstream processing and analysis. Solubilized proteins are recovered in the supernatant.
The cellular debris may contain some nuclear and membrane-bound proteins, which may be further extracted with a variety of detergents.
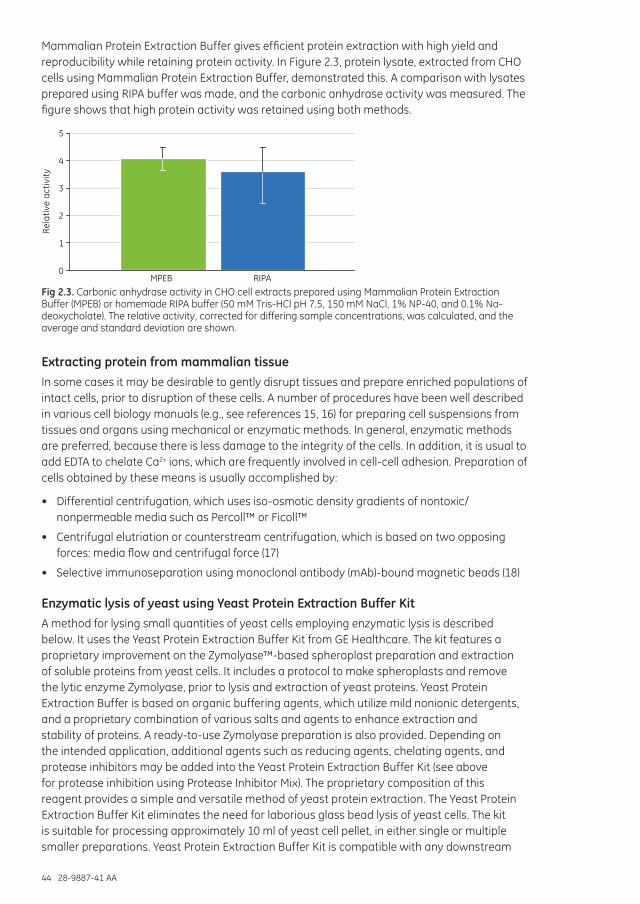
44 28-9887-41 AA
Mammalian Protein Extraction Buffer gives efficient protein extraction with high yield and reproducibility while retaining protein activity. In Figure 2.3, protein lysate, extracted from CHO cells using Mammalian Protein Extraction Buffer, demonstrated this. A comparison with lysates prepared using RIPA buffer was made, and the carbonic anhydrase activity was measured. The figure shows that high protein activity was retained using both methods.
0
1
2
3
4
5
Rel
ativ
e ac
tivi
ty
MPEB RIPA
Fig 2.3. Carbonic anhydrase activity in CHO cell extracts prepared using Mammalian Protein Extraction Buffer (MPEB) or homemade RIPA buffer (50 mM Tris-HCl pH 7.5, 150 mM NaCl, 1% NP-40, and 0.1% Na-deoxycholate). The relative activity, corrected for differing sample concentrations, was calculated, and the average and standard deviation are shown.
Extracting protein from mammalian tissueIn some cases it may be desirable to gently disrupt tissues and prepare enriched populations of intact cells, prior to disruption of these cells. A number of procedures have been well described in various cell biology manuals (e.g., see references 15, 16) for preparing cell suspensions from tissues and organs using mechanical or enzymatic methods. In general, enzymatic methods are preferred, because there is less damage to the integrity of the cells. In addition, it is usual to add EDTA to chelate Ca2+ ions, which are frequently involved in cell-cell adhesion. Preparation of cells obtained by these means is usually accomplished by:
• Differential centrifugation, which uses iso-osmotic density gradients of nontoxic/nonpermeable media such as Percoll™ or Ficoll™
• Centrifugal elutriation or counterstream centrifugation, which is based on two opposing forces: media flow and centrifugal force (17)
• Selective immunoseparation using monoclonal antibody (mAb)-bound magnetic beads (18)
Enzymatic lysis of yeast using Yeast Protein Extraction Buffer KitA method for lysing small quantities of yeast cells employing enzymatic lysis is described below. It uses the Yeast Protein Extraction Buffer Kit from GE Healthcare. The kit features a proprietary improvement on the Zymolyase™-based spheroplast preparation and extraction of soluble proteins from yeast cells. It includes a protocol to make spheroplasts and remove the lytic enzyme Zymolyase, prior to lysis and extraction of yeast proteins. Yeast Protein Extraction Buffer is based on organic buffering agents, which utilize mild nonionic detergents, and a proprietary combination of various salts and agents to enhance extraction and stability of proteins. A ready-to-use Zymolyase preparation is also provided. Depending on the intended application, additional agents such as reducing agents, chelating agents, and protease inhibitors may be added into the Yeast Protein Extraction Buffer Kit (see above for protease inhibition using Protease Inhibitor Mix). The proprietary composition of this reagent provides a simple and versatile method of yeast protein extraction. The Yeast Protein Extraction Buffer Kit eliminates the need for laborious glass bead lysis of yeast cells. The kit is suitable for processing approximately 10 ml of yeast cell pellet, in either single or multiple smaller preparations. Yeast Protein Extraction Buffer Kit is compatible with any downstream
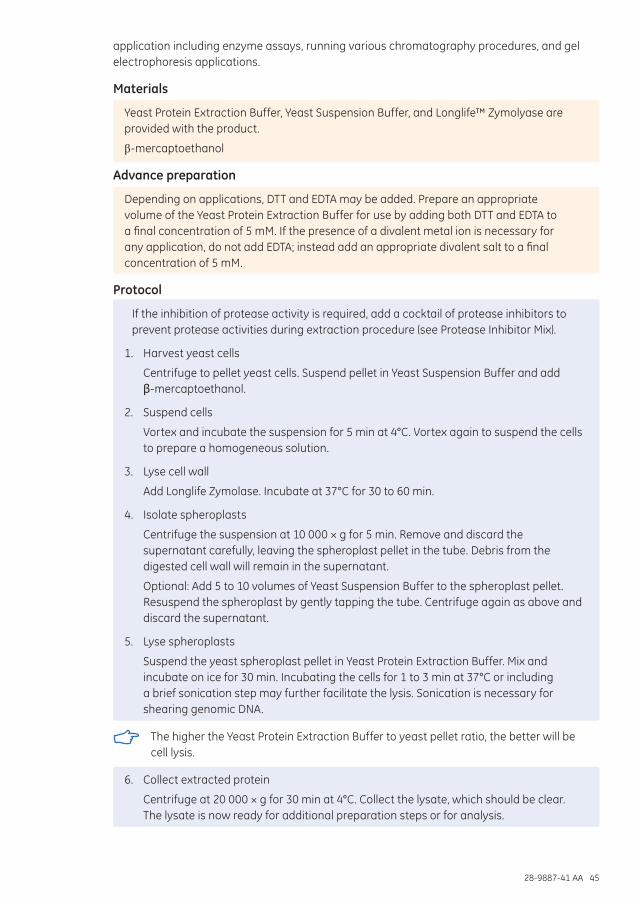
28-9887-41 AA 45
application including enzyme assays, running various chromatography procedures, and gel electrophoresis applications.
Materials
Yeast Protein Extraction Buffer, Yeast Suspension Buffer, and Longlife™ Zymolyase are provided with the product.
β-mercaptoethanol
Advance preparation
Depending on applications, DTT and EDTA may be added. Prepare an appropriate volume of the Yeast Protein Extraction Buffer for use by adding both DTT and EDTA to a final concentration of 5 mM. If the presence of a divalent metal ion is necessary for any application, do not add EDTA; instead add an appropriate divalent salt to a final concentration of 5 mM.
Protocol
If the inhibition of protease activity is required, add a cocktail of protease inhibitors to prevent protease activities during extraction procedure (see Protease Inhibitor Mix).
1. Harvest yeast cells
Centrifuge to pellet yeast cells. Suspend pellet in Yeast Suspension Buffer and add β-mercaptoethanol.
2. Suspend cells
Vortex and incubate the suspension for 5 min at 4°C. Vortex again to suspend the cells to prepare a homogeneous solution.
3. Lyse cell wall
Add Longlife Zymolase. Incubate at 37°C for 30 to 60 min.
4. Isolate spheroplasts
Centrifuge the suspension at 10 000 × g for 5 min. Remove and discard the supernatant carefully, leaving the spheroplast pellet in the tube. Debris from the digested cell wall will remain in the supernatant.
Optional: Add 5 to 10 volumes of Yeast Suspension Buffer to the spheroplast pellet. Resuspend the spheroplast by gently tapping the tube. Centrifuge again as above and discard the supernatant.
5. Lyse spheroplasts
Suspend the yeast spheroplast pellet in Yeast Protein Extraction Buffer. Mix and incubate on ice for 30 min. Incubating the cells for 1 to 3 min at 37°C or including a brief sonication step may further facilitate the lysis. Sonication is necessary for shearing genomic DNA.
The higher the Yeast Protein Extraction Buffer to yeast pellet ratio, the better will be cell lysis.
6. Collect extracted protein
Centrifuge at 20 000 × g for 30 min at 4°C. Collect the lysate, which should be clear. The lysate is now ready for additional preparation steps or for analysis.
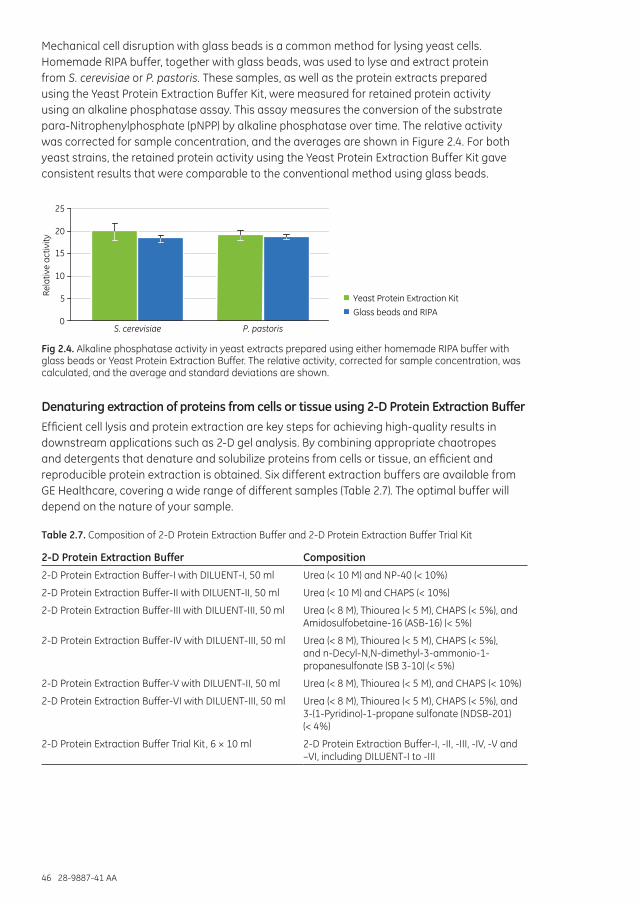
46 28-9887-41 AA
Mechanical cell disruption with glass beads is a common method for lysing yeast cells. Homemade RIPA buffer, together with glass beads, was used to lyse and extract protein from S. cerevisiae or P. pastoris. These samples, as well as the protein extracts prepared using the Yeast Protein Extraction Buffer Kit, were measured for retained protein activity using an alkaline phosphatase assay. This assay measures the conversion of the substrate para-Nitrophenylphosphate (pNPP) by alkaline phosphatase over time. The relative activity was corrected for sample concentration, and the averages are shown in Figure 2.4. For both yeast strains, the retained protein activity using the Yeast Protein Extraction Buffer Kit gave consistent results that were comparable to the conventional method using glass beads.
0
5
10
15
20
25
Rela
tive
activ
ity
S. cerevisiae P. pastoris
Yeast Protein Extraction Kit
Glass beads and RIPA
Fig 2.4. Alkaline phosphatase activity in yeast extracts prepared using either homemade RIPA buffer with glass beads or Yeast Protein Extraction Buffer. The relative activity, corrected for sample concentration, was calculated, and the average and standard deviations are shown.
Denaturing extraction of proteins from cells or tissue using 2-D Protein Extraction BufferEfficient cell lysis and protein extraction are key steps for achieving high-quality results in downstream applications such as 2-D gel analysis. By combining appropriate chaotropes and detergents that denature and solubilize proteins from cells or tissue, an efficient and reproducible protein extraction is obtained. Six different extraction buffers are available from GE Healthcare, covering a wide range of different samples (Table 2.7). The optimal buffer will depend on the nature of your sample.
Table 2.7. Composition of 2-D Protein Extraction Buffer and 2-D Protein Extraction Buffer Trial Kit
2-D Protein Extraction Buffer Composition
2-D Protein Extraction Buffer-I with DILUENT-I, 50 ml Urea (< 10 M) and NP-40 (< 10%)
2-D Protein Extraction Buffer-II with DILUENT-II, 50 ml Urea (< 10 M) and CHAPS (< 10%)
2-D Protein Extraction Buffer-III with DILUENT-III, 50 ml Urea (< 8 M), Thiourea (< 5 M), CHAPS (< 5%), and Amidosulfobetaine-16 (ASB-16) (< 5%)
2-D Protein Extraction Buffer-IV with DILUENT-III, 50 ml Urea (< 8 M), Thiourea (< 5 M), CHAPS (< 5%), and n-Decyl-N,N-dimethyl-3-ammonio-1-propanesulfonate (SB 3-10) (< 5%)
2-D Protein Extraction Buffer-V with DILUENT-II, 50 ml Urea (< 8 M), Thiourea (< 5 M), and CHAPS (< 10%)
2-D Protein Extraction Buffer-VI with DILUENT-III, 50 ml Urea (< 8 M), Thiourea (< 5 M), CHAPS (< 5%), and 3-(1-Pyridino)-1-propane sulfonate (NDSB-201) (< 4%)
2-D Protein Extraction Buffer Trial Kit, 6 × 10 ml 2-D Protein Extraction Buffer-I, -II, -III, -IV, -V and –VI, including DILUENT-I to -III

28-9887-41 AA 47
Because the buffers are provided in a dry powder formulation, problems associated with carbamylation are avoided. Necessary additives, such as enzyme inhibitors and/or reducing agents, may be added depending on the samples and application used (see general considerations above). The buffers are compatible with 2-D electrophoresis but may also be used for other applications such as 1-D PAGE, for example. 2-D Protein Extraction Buffers are compatible with CyDye™ differential gel electrophoresis (DIGE) Fluors with the following exceptions:
• 2-D Protein Extraction Buffer-I is not optimal when CyDye DIGE Fluor minimal dye is used. The labeling efficiency will be slightly reduced.
• 2-D Protein Extraction Buffer-III and -IV are not recommended when CyDye DIGE Fluor Labeling Kit for Scarce Samples is used. Labeling efficiency is significantly reduced.
Extraction Buffer-I and -II are suitable for most applications. However, for stronger solubilization effects, Extraction Buffer-III, -IV, -V, or –VI may be used.
An example of a 2-D electrophoresis workflow is shown below in Figure 2.5.
Tissue sample ≤ 100 mg 2-D Protein Extraction Buffer
Homogenization Sample Grinding Kit
Quantitation of protein lysate 2-D Quant Kit
Sample labeling CyDye DIGE Fluor minimal dyes
CyDye DIGE Fluor for Scarce Samples
2-D electrophoresis Immobiline™ DryStrip Gels
SDS-PAGE gels
Image capture Ettan™ DIGE Imager
Image analysis software DeCyder™ 2-D
Fig 2.5. Workflow using 2-D DIGE to investigate differences in extraction capabilities of 2-D Protein Extraction Buffer-I to -VI.
In the following example (Fig 2.6), all six extraction buffers were compared with a reference buffer for their ability to extract rat liver protein. Most of the extraction buffers were compatible with minimal dyes and gave a high labeling intensity compared with the reference, although Extraction Buffer (EB)-I gave a reduced labeling intensity and is therefore not recommended when using CyDye minimal dyes.
Fig 2.6. Rat liver samples were extracted using either the reference buffer or 2-D Protein Extraction Buffer-I to -VI. Protein extracts were subsequently labeled with a CyDye minimal dye and run on ExcelGel™ 8–18. In each set of three lanes, 20, 10, or 5 µl of sample was loaded.
48 28-9887-41 AA
Materials
2-D Protein Extraction Buffers I-VI (dry) and Diluents I-III are provided with the 2-D Protein Extraction Buffer Trial Kit
Enzyme inhibitors (e.g., Protease Inhibitor Mix)
Buffer additives and other additives (see considerations above)
Reducing agents
Advance preparation
Reconstitute the supplied 2-D Protein Extraction Buffers -I to –VI by adding 5.75 ml or 5.0 ml of specific DILUENT. Add the specified DILUENT (according to the instructions) directly into the corresponding 2-D Protein Extraction Buffer bottle.
A smaller volume can also be prepared by using 1 g of dry powder mix with 1 ml or 1.15 ml of specific DILUENT (see instructions).
Add needed agents such as reducing agents, inhibitors, carrier ampholyte, bromophenol blue dye, etc.
Mix periodically by vortexing, and incubate at room temperature until the solution is clear.
Depending on applications, DTT and EDTA may be added. Prepare an appropriate volume of the 2-D Protein Extraction Buffer for use by adding both DTT and EDTA to a final concentration of, for example, 5 mM.
Protocol
If the inhibition of protease activity is required, add a cocktail of protease inhibitors to prevent protease activities during extraction (see Protease Inhibitor Mix).
1. Collect tissue sample
2. Homogenize tissue
Add up to 2-3 volumes of 2-D Extraction Buffer to the tissue. Disrupt the tissue structure by using a suitable homogenization technique, for example, grinding with the Sample Grinding Kit. This will result in simultaneous disruption of the tissue, solubilization of the proteins, and inactivation of detrimental enzymatic activity.
3. Add additional 2-D Extraction Buffer to about 5-10 volumes per initial sample size. Mix thoroughly.
4. Clarify the extract
Centrifuge the suspension at 15 000 × g for 20 min. Remove the supernatant carefully, leaving the pellet in the tube.
5. Determine protein concentration
Quantitate the protein content by using a method that is compatible with chaotropes, detergents, and possibly reducing agents, for example, 2-D Quant Kit from GE Healthcare.
6. Run 2-D electrophoresis (see 2-D Electrophoresis using immobilized pH gradients: Principles and Methods or Ettan DIGE System User Manual) or move on to the next step in the workflow if running a different application.
Protein precipitation as an alternative to protein extractionSometimes it is advantageous to make the proteins insoluble by precipitation during cell disruption or tissue homogenization, for example, by grinding flash-frozen samples in the presence of trichloroacetic acid (TCA). The major nonprotein contaminants (e.g., nucleic acids, lipids, carbohydrates, etc.) are kept soluble for easy removal. Precipitates can be recovered by filtration or centrifugation, and the proteins may be redissolved in a suitable buffer. Precipitation is discussed further in Chapter 3 for removal of contaminants in samples.
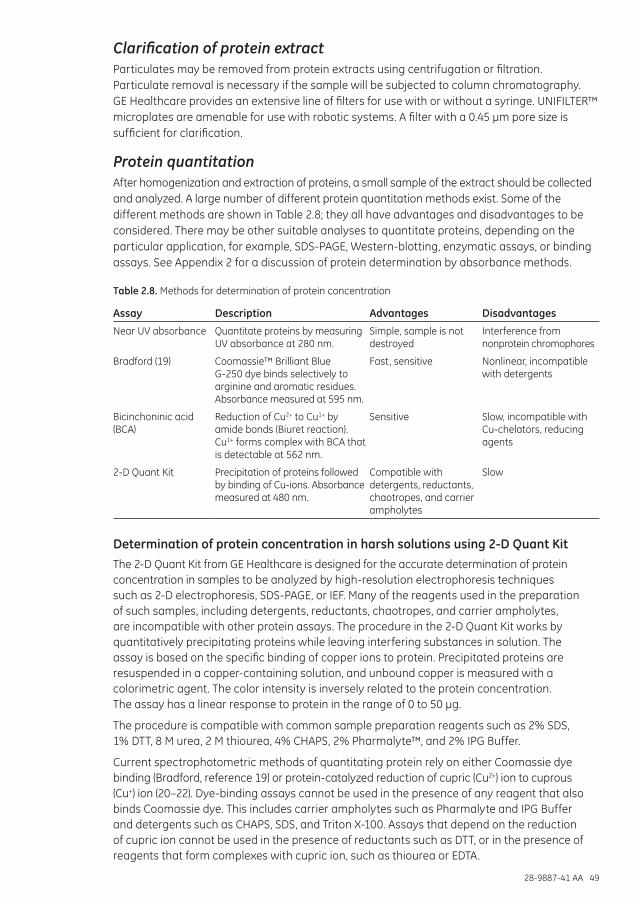
28-9887-41 AA 49
Clarification of protein extractParticulates may be removed from protein extracts using centrifugation or filtration. Particulate removal is necessary if the sample will be subjected to column chromatography. GE Healthcare provides an extensive line of filters for use with or without a syringe. UNIFILTER™ microplates are amenable for use with robotic systems. A filter with a 0.45 µm pore size is sufficient for clarification.
Protein quantitationAfter homogenization and extraction of proteins, a small sample of the extract should be collected and analyzed. A large number of different protein quantitation methods exist. Some of the different methods are shown in Table 2.8; they all have advantages and disadvantages to be considered. There may be other suitable analyses to quantitate proteins, depending on the particular application, for example, SDS-PAGE, Western-blotting, enzymatic assays, or binding assays. See Appendix 2 for a discussion of protein determination by absorbance methods.
Table 2.8. Methods for determination of protein concentration
Assay Description Advantages Disadvantages
Near UV absorbance Quantitate proteins by measuring UV absorbance at 280 nm.
Simple, sample is not destroyed
Interference from nonprotein chromophores
Bradford (19) Coomassie™ Brilliant Blue G-250 dye binds selectively to arginine and aromatic residues. Absorbance measured at 595 nm.
Fast, sensitive Nonlinear, incompatible with detergents
Bicinchoninic acid (BCA)
Reduction of Cu2+ to Cu1+ by amide bonds (Biuret reaction). Cu1+ forms complex with BCA that is detectable at 562 nm.
Sensitive Slow, incompatible with Cu-chelators, reducing agents
2-D Quant Kit Precipitation of proteins followed by binding of Cu-ions. Absorbance measured at 480 nm.
Compatible with detergents, reductants, chaotropes, and carrier ampholytes
Slow
Determination of protein concentration in harsh solutions using 2-D Quant Kit The 2-D Quant Kit from GE Healthcare is designed for the accurate determination of protein concentration in samples to be analyzed by high-resolution electrophoresis techniques such as 2-D electrophoresis, SDS-PAGE, or IEF. Many of the reagents used in the preparation of such samples, including detergents, reductants, chaotropes, and carrier ampholytes, are incompatible with other protein assays. The procedure in the 2-D Quant Kit works by quantitatively precipitating proteins while leaving interfering substances in solution. The assay is based on the specific binding of copper ions to protein. Precipitated proteins are resuspended in a copper-containing solution, and unbound copper is measured with a colorimetric agent. The color intensity is inversely related to the protein concentration. The assay has a linear response to protein in the range of 0 to 50 µg.
The procedure is compatible with common sample preparation reagents such as 2% SDS, 1% DTT, 8 M urea, 2 M thiourea, 4% CHAPS, 2% Pharmalyte™, and 2% IPG Buffer.
Current spectrophotometric methods of quantitating protein rely on either Coomassie dye binding (Bradford, reference 19) or protein-catalyzed reduction of cupric (Cu2+) ion to cuprous (Cu+) ion (20–22). Dye-binding assays cannot be used in the presence of any reagent that also binds Coomassie dye. This includes carrier ampholytes such as Pharmalyte and IPG Buffer and detergents such as CHAPS, SDS, and Triton X-100. Assays that depend on the reduction of cupric ion cannot be used in the presence of reductants such as DTT, or in the presence of reagents that form complexes with cupric ion, such as thiourea or EDTA.

50 28-9887-41 AA
Materials
Precipitant, Coprecipitant, Copper solution, Color reagent A, Color reagent B, and BSA standard solution are provided with the product.
2 ml microcentrifuge tubes
Vortex mixer
Microcentrifuge
Visible light spectrophotometer
Advance preparation
Prepare an appropriate volume of working color reagent by mixing 100 parts of color reagent A with 1 part color reagent B. Each individual assay requires 1 ml of working color reagent.
Working color reagent can be stored at 4ºC to 8ºC for up to one week or as long as the optical absorbance (A480) of the solution remains below 0.025 at 480 nm.
Protocol
See product instructions for the full protocol.
1. Prepare a standard curve.
2. Add the BSA standard solution (2 mg/ml) to six tubes to final amount 0 µg (blank), 10, 20, 30, 40, and 50 µg.
3. Prepare samples.
4. Add 1 to 50 µl of the sample to be assayed in separate tubes.
5. Proceed according to the instructions to generate samples for spectrophotometric measurement.
6. Read the absorbance of each sample and standard at 480 nm using water as the reference. The absorbance should be read within 40 min of the addition of working color reagent.
7. Generate a standard curve by plotting the absorbance of the standards against the quantity of protein. Use this standard curve to determine the protein concentration of the samples.
Note: Unlike most protein assays, the absorbance of the assay solution decreases with increasing protein concentration. Do not subtract the blank reading from the sample reading or use the assay blank as the reference.
The 2-D Quant Kit can be used to accurately quantitate protein in the presence of the substances shown in Table 2.9. A typical standard curve is shown in Figure 2.6.

28-9887-41 AA 51
Table 2.9. Compounds tested for compatibility with 2-D Quant Kit
Compound tested Concentration
SDS 2% (w/v)
CHAPS 4% (w/v)
Triton X-100 1% (w/v)
Pharmalyte pH 3-10 2% (v/v)
IPG Buffer pH 3-10 NL 2% (v/v)
Tris 50 mM
EDTA 10 mM
DTT 1% (65 mM)
β-Mercaptoethanol 2% (v/v)
Urea 8 M
Thiourea 2 M
Glycerol 30% (w/v)
0 10 20 30 40 50
0.6
0.8
0.4
0.7
0.5
µg BSA
A480
Fig 2.7. Typical standard curve for 2-D Quant Kit.
References1. Aniento, F. and Gruenberg, J. Subcellular fractionation of tissue culture cells, in Current Protocols
in Protein Science (Coligan, J. et al. eds) John Wiley and Sons, Inc., New York, 4.3.1-4.3.21 (2003).
2. Marcus, F. Preferential cleavage at aspartyl-prolyl peptide bonds in dilute acid. Int. J. Pept. Protein Res. 25, 542-546 (1985).
3. Barrett, A. J. and Salvesen, G. S. eds. Proteinase Inhibitors, Elsevier Science Publishers, Amsterdam (1986).
4. Beynon, R. J. and Bond, J. S. Proteolytic Enzymes. A Practical Approach, IRL Press, Oxford (1989).
5. Barrett, A. J. et al. eds. Handbook of Proteolytic Enzymes, Academic Press, London (1998).
6. Janson, J-C. and Rydén, L. Protein Purification, Principles, High Resolution Methods and Applications 2nd ed., Wiley-VCH, Germany (1998).
7. Scopes, R. K. Protein Purification, Principles and Practice, 3rd ed., Springer Publishing Company, New York (1994).
52 28-9887-41 AA
8. McNally E. J. and Hastedt, J. E. eds. Protein Formulation and Delivery (Drugs and the Pharmaceutical Sciences), 2nd edition, Informa Healthcare, Zug (2007).
9. Sun, G. and Anderson, V. E. Prevention of artifactual protein oxidation generated during sodium dodecyl sulfate-gel electrophoresis. Electrophoresis 25, 959-965 (2004).
10. Lenk, T.J. et al. IR spectral changes of bovine serum albumin upon surface adsorption. J. Biomed. Mater Res. 23, 549-569 (1989).
11. Righetti, P. G. and Gianazza, E., New developments in isoelectric focusing. J. Chromatogr. 193, 1-8 (1980).
12. Weiller, G. F. et al. The modal distribution of protein isoelectric points reflects amino acid properties rather than sequence evolution. Proteomics 4, 943-949 ( 2004).
13. Pitt-Rivers, R. and Ambesi Impiombato, F. S. The binding of sodium dodecyl sulphate to various proteins. Biochem. J. 109, 825–830 (1968).
14. Ramsby, M. L. et al. Differential detergent fractionation of isolated hepatocytes: biochemical, immunochemical and two-dimensional gel electrophoresis characterization of cytoskeletal and noncytoskeletal compartments. Electrophoresis 15, 265–277 (1994).
15. Celis, J. E. ed., Cell Biology: A Laboratory Handbook Vol. 1, Academic Press, London UK (1998).
16. Spector, D. L. et. al. eds. Cells: A Laboratory Manual, Cold Spring Harbor Laboratory Press, New York (1998).
17. Bird, R. C. Cell separation by centrifugal elutriation, in Cell Biology: A Laboratory Handbook 2nd edition (Celis, J. E. ed.) Academic Press, California, pp. 205-208 (1998).
18. Neurauter, A. A. et al. Immunomagnetic separation of animal cells, in Cell Biology: A Laboratory Handbook 2nd edition (Celis, J. E. ed.) Academic Press, California, pp. 197-204 (1998).
19. Bradford, M. M. Rapid and sensitive method for the quantitation of microgram quantities of protein utilizing the principle of protein-dye binding. Anal. Biochem. 72, 248–254 (1976).
20. Goshev, I. and Nedkov, P. Extending the range of application of the biuret reaction: quantitative determination of insoluble proteins. Anal. Biochem. 95, 340-343 (1979).
21. Lowry, O. H. et al. Protein measurement with the Folin phenol reagent. J. Biol. Chem. 193, 265-275 (1951).
22. Smith, P. K. et al. Measurement of protein using bicinchoninic acid. Anal. Biochem. 150, 76-85 (1985).

28-9887-41 AA 53
Chapter 3 Increasing detectability of targeted proteins
IntroductionChapter 2 discussed the process of collecting a sample from the original source, followed by extracting and stabilizing its proteins. The output from this process is a protein population in solution that resembles the in vivo state of the sampled biological source as closely as possible. Before final preparation of the sample for a specific analytical method, an additional step aimed at increasing detectability of targeted proteins is often necessary (Fig 3.1). The rationale for this step is to improve the likelihood of successful analysis of all protein species of interest by modulating the protein content to match the capabilities of the analytical step.
Sample source (bacterial or other cell culture,
tissue, body fluids, etc.)
Homogeneous protein solution with complex
composition
One or multiple protein subsamples with
improved compositionAnalytical results
Ensure compatibility in workflow (Chapter 4)Sample state
Unit operation category
Collect sample and extract/stabilize proteins
Increase detectabilityof targeted proteins
Analyze proteins
Fig 3.1. High-level workflow for protein sample preparation and analysis. The unit operation category discussed in this chapter is framed.
For recombinant or hybridoma cell cultures, this is generally identical to generating one final sample for detailed analytical interrogation (i.e., structure determination or antibody screening and characterization) by purifying a single target protein close to homogeneity. Tagged recombinant proteins and monoclonal antibodies can be purified based on use of efficient affinity media followed by polishing, if needed. Detailed discussions of these subjects are outside the scope of this handbook and can be found elsewhere (refer to additional handbooks from GE Healthcare, including Recombinant Protein Purification Handbook: Principles and Methods; Antibody Purification: Principles and Methods; and Purifying Challenging Proteins; see the “Related literature” section at the end of this handbook for code numbers). However, the preparation of small-scale samples for screening purposes is briefly described in this chapter. See Chapter 5 for details on screening in microwell plates and the use of robotic systems.
For analytical procedures aimed at broad analysis of proteins present in biological model systems (i.e., proteomics in general, systems biology, or biomarker development), increasing detectability means applying methods to generate one or multiple subsamples with reduced protein complexity and dynamic range. Starting out with large initial samples, this approach will also enable increased loading of low-abundance proteins, thereby increasing the overall sensitivity. This process is needed because the sensitivity, resolving power, dynamic range, and data acquisition speed of current global protein analysis methods (2-D electrophoresis and LC-MS/MS) cannot fully match the complexity and dynamic range found in most biological systems (see discussion in Chapter 1). It is difficult to advise on the optimal composition of fractions passed on to analysis because several parameters influence the final success rate (1). The properties of the sample itself, limitations in each step of the sample manipulation, and the performance of the final analysis will all affect the results.

54 28-9887-41 AA
Procedures for enrichment or depletion of proteins that will be discussed in this chapter are based on:
• Protein fractionation
- using differential precipitation
- using chromatography
• Affinity-based depletion of high-abundance proteins
- removal of albumin and IgG from plasma or serum
• Affinity-based enrichment of proteins and protein subgroups
- of immunoglobulins
- of biotinylated proteins
- of proteins using a covalently coupled ligand
- of phosphorylated proteins and peptides
- of target proteins using immunoprecipitation
Before entering into a discussion of protein fractionation, it is worth pointing out that a more “global” sort of fractionation, into DNA, RNA, and protein, all from the same undivided sample, is possible.
Until recently, researchers in fields such as functional genomics, molecular genetics, and biomarker studies used three separate kits to isolate DNA, RNA, and proteins for use as probes and targets in downstream applications. However, the use of divided samples could potentially skew results due to heterogeneity between different cell and tissue samples. The demand for good correlation between transcript (gene) expression, protein expression, copy number variation, and single nucleotide polymorphism (SNP) detection has resulted in the development of methods for isolating multiple analytes from the same sample. When DNA, RNA, and protein are prepared from the same sample, it is possible to correlate DNA/RNA/protein data directly. This ensures that results are not an artifact of experimental design, but are characteristic of the sample.
GE Healthcare provides a method for preparing genomic DNA, total RNA, and denatured protein from an undivided sample, using illustra™ triplePrep Kit, which isolates these three categories of molecules sequentially. The chaotropic lysis buffer immediately inactivates DNase, RNases, and proteases, which are present in virtually all biological materials, and creates appropriate binding conditions that favor adsorption of DNA to the silica membrane in a minicolumn. RNA and protein pass through the column. The conditions of the flowthrough are adjusted to favor total RNA adsorption to a second silica column. Protein passes through the column, and total denatured protein is precipitated. See illustra triplePrep Kit instructions for more detail.
Protein fractionationProtein fractionation is defined in this handbook as encompassing procedures used to divide an initial solubilized protein population into multiple subsamples/fractions based on differences in nonspecific (chemical/physical) properties of the proteins present (i.e., size, charge distribution, pI, hydrophobicity, or solubility). Procedures can be tailored to handle both denaturing and nondenaturing conditions. Often, several unit operations with complementing selectivity are combined in series. Protein fractionation can be used in two principal ways:
1. For hypothesis-driven and focused analysis of an initial protein population: Only one or a few fractions are analyzed, for example, after removing high-molecular-weight proteins from plasma. As a strategy, this approach is based on the fact that most of the high-abundance proteins in plasma have a high molecular weight (M
r > 60 000) and the hypothesis that most potential biomarkers are of low molecular weight.
2. For global analysis of an initial protein population: Each protein is of potential interest and, in general, multiple fractions are generated and analyzed.

28-9887-41 AA 55
Technology options for protein fractionation include (2-7):
• Differential precipitation (e.g., using 2-D Fractionation Kit from GE Healthcare)
• Chromatography techniques (i.e., IEX, GF, chromatofocusing, RPC, and HIC)
• Filters that provide cutoff based on molecular weight (e.g., UF)
• 1-D PAGE
• Free-flow IEF
• Differential detergent fractionation (based on protein solubility)
Differential precipitation of proteins using 2-D Fractionation KitProtein precipitation in general will be discussed in Chapter 4. Here we address the use of protein precipitation as a fractionation technique. 2-D Fractionation Kit from GE Healthcare exploits the property of protein molecules to precipitate in response to changes in solvent composition (e.g., ionic strength, pH, temperature). The solvent composition is changed in a stepwise fashion such that a series of protein fractions is produced based on differential solubility. Fractionated proteins are suitable for use in 2-D electrophoresis or MS.
An example of protein fractionation using the 2-D Fractionation Kit is shown in Figure 3.2. This method first fractionates the sample into soluble and insoluble fractions. The soluble fraction is fractionated further. The kit has been optimized around a protocol that produces a set of seven fractions. A summary protocol is provided below. However, there is the option to optimize the protocol to your own needs. See product instructions for details.
Fig 3.2. Schematic representation of protein fractionation using 2-D Fractionation Kit.
56 28-9887-41 AA
Materials
The following solutions are provided in the kit:
Lysis Buffer, Fraction Precipitant, Precipitant, Coprecipitant, Wash Buffer, Solubilizer, and Diluent.
Advance preparation
1. Transfer Wash Buffer to -20°C for 1 to 2 h before use.
2. Chill Lysis Buffer in a wet ice bath.
3. Warm the bottle of Fraction Precipitant if crystals are visible.
4. Prepare the Solubilizer solution by adding dry powder to an aliquot of Diluent. Prepare only as much as is needed for each experiment.
Protocol
1. Sonicate the cells or tissue in Lysis Buffer at 0°C to 4°C to lyse the cells.
2. Pellet insoluble proteins by centrifugation at 20 000 x g for 30 min at 4°C.
3. Transfer the supernatant to a separate tube.
4. Repeat steps 1 and 2 on the remaining pellet. Pool this supernatant with the supernatant from step 3. Label the tube “Soluble Protein Component.”
5. Wash the pellet. Label the tube with the pellet “Insoluble Protein Fraction.”
6. Process the Soluble Protein Component using differential precipitation. Six fractions will be produced. See kit instructions for details.
7. Process the Insoluble Protein Fraction in Solubilizer according to kit instructions.
Fractionation based on chromatographyFractionation of proteins in small scale using IEX, GF, or RPC can be performed manually with a syringe (stepwise change of buffers used) or with a chromatography system such as ÄKTAmicro™ from GE Healthcare, which gives better control and reproducibility by delivering accurate flow rates and gradients. A vast number of different prepacked columns are available in proper scale that can be used with the chromatography system (see Appendix 3). The different techniques are covered in other handbooks and are outside the main scope here. An example of fractionation of proteins extracted from a cell culture is shown in Figure 3.3. In this example, the fractions obtained after IEX were digested by trypsin followed by identification of the proteins by nano-LC-MS/MS (data not shown).

28-9887-41 AA 57
Column: Mono Q™ PC 1.6/5Sample: Total protein extract from immortalized lymphatic endothelial cells left untreated (controls)
or treated with growth factors vascular endothelial growth factor A (VEGF-A) or vascular endothelial growth factor C (VEGF-C)
Buffer A: 20 mM Tris-HCl, 8 M urea, 6% isopropanol, pH 8.0Buffer B: Buffer A + 1 M NaClFlow rate: 0.2 ml/minGradient: Linear salt gradient, 0% to 50% BDetection: UV 215 nm and UV 280System: ÄKTAmicroVEGF-A
100
80
60
40
20
0
A280 (mAU)
0.0 2.0 4.0 6.0 8.0 10.0Volume (ml)
A280
Conductivity
Fig 3.3. Chromatogram resulting from strong anion exchange chromatography (AIEX) of total protein extracts prepared from VEGF-A treated cells using Mono Q PC 1.6/5 on ÄKTAmicro system. Data for prefractionation of control and VEGF-C treated cells are not shown. Fractions of 0.4 ml were collected throughout the separations.
Affinity-based protein depletion of high-abundance proteinsAffinity-based protein depletion, also called negative chromatography, can be seen as a more targeted form of protein fractionation, where a fraction void of a selected number of proteins is generated. In the technique, affinity binders (ligands) of some sort are immobilized to a solid support (i.e., chromatographic medium) and used to specifically bind unwanted proteins from a complex protein solution. Normally, only the flowthrough fraction is passed on to analysis. By depleting abundant proteins from the samples, the analysis of less abundant proteins will be facilitated; the depletion will also permit a higher sample load of the remaining other proteins. The technique is generally limited to nondenaturing conditions because specific interactions are dependent on retained 3-D structure of both ligands and targeted proteins. Unwanted proteins can include any protein present in a particular source that is not relevant to the analytical purpose and that interferes with the analysis in some way, for example, protein isoforms that mask an interesting region of a 2-D gel map. Another example is ribulose bisphosphate carboxylase/oxygenase (RuBisCO), which is a highly abundant protein in plants (~ 40% of total protein) and is found in green leaves.
However, by far the most common application is the removal/depletion of high-abundance proteins from animal or human plasma/serum. This application is based on the importance of plasma/serum for biomarker discovery, its compatibility with nondenaturing conditions, and the fact that its protein abundance is dominated by a relatively small number of proteins (Fig 3.4). Albumin and the total IgG population make up ~ 70% of the total protein content in
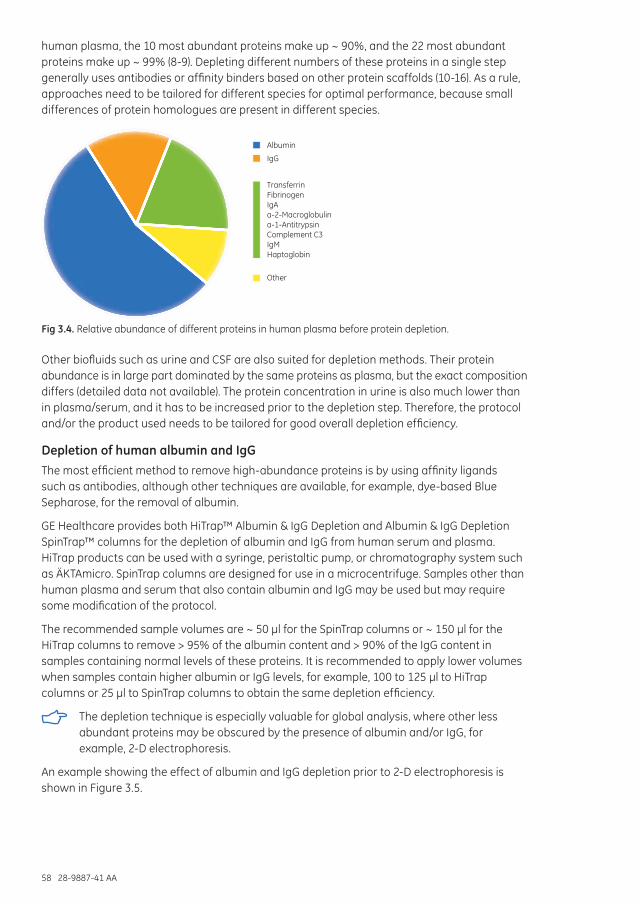
58 28-9887-41 AA
human plasma, the 10 most abundant proteins make up ~ 90%, and the 22 most abundant proteins make up ~ 99% (8-9). Depleting different numbers of these proteins in a single step generally uses antibodies or affinity binders based on other protein scaffolds (10-16). As a rule, approaches need to be tailored for different species for optimal performance, because small differences of protein homologues are present in different species.
Albumin
IgG
TransferrinFibrinogenIgAa-2-Macroglobulina-1-AntitrypsinComplement C3IgMHaptoglobin
Other
Fig 3.4. Relative abundance of different proteins in human plasma before protein depletion.
Other biofluids such as urine and CSF are also suited for depletion methods. Their protein abundance is in large part dominated by the same proteins as plasma, but the exact composition differs (detailed data not available). The protein concentration in urine is also much lower than in plasma/serum, and it has to be increased prior to the depletion step. Therefore, the protocol and/or the product used needs to be tailored for good overall depletion efficiency.
Depletion of human albumin and IgGThe most efficient method to remove high-abundance proteins is by using affinity ligands such as antibodies, although other techniques are available, for example, dye-based Blue Sepharose, for the removal of albumin.
GE Healthcare provides both HiTrap™ Albumin & IgG Depletion and Albumin & IgG Depletion SpinTrap™ columns for the depletion of albumin and IgG from human serum and plasma. HiTrap products can be used with a syringe, peristaltic pump, or chromatography system such as ÄKTAmicro. SpinTrap columns are designed for use in a microcentrifuge. Samples other than human plasma and serum that also contain albumin and IgG may be used but may require some modification of the protocol.
The recommended sample volumes are ~ 50 µl for the SpinTrap columns or ~ 150 µl for the HiTrap columns to remove > 95% of the albumin content and > 90% of the IgG content in samples containing normal levels of these proteins. It is recommended to apply lower volumes when samples contain higher albumin or IgG levels, for example, 100 to 125 µl to HiTrap columns or 25 µl to SpinTrap columns to obtain the same depletion efficiency.
The depletion technique is especially valuable for global analysis, where other less abundant proteins may be obscured by the presence of albumin and/or IgG, for example, 2-D electrophoresis.
An example showing the effect of albumin and IgG depletion prior to 2-D electrophoresis is shown in Figure 3.5.
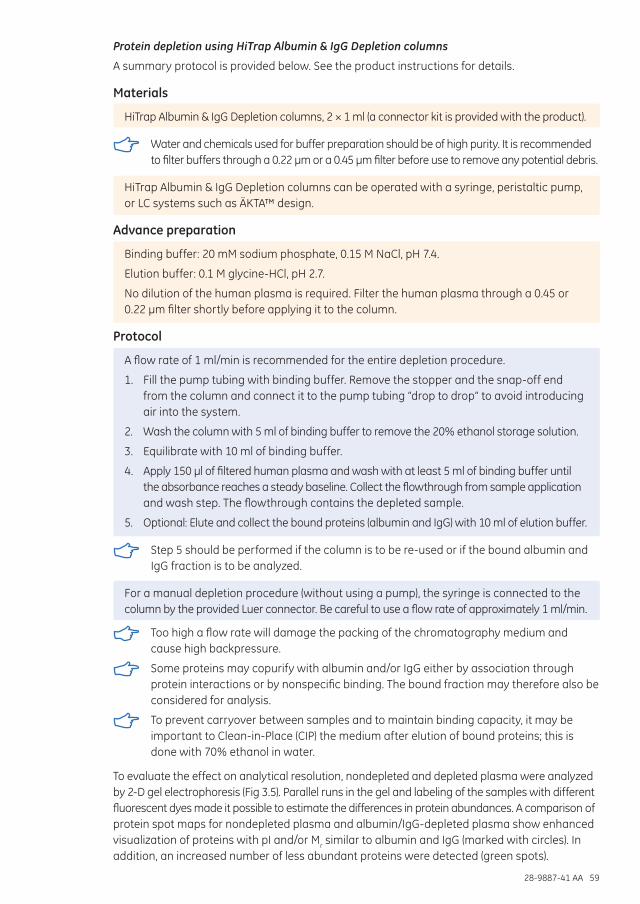
28-9887-41 AA 59
Protein depletion using HiTrap Albumin & IgG Depletion columns
A summary protocol is provided below. See the product instructions for details.
Materials
HiTrap Albumin & IgG Depletion columns, 2 × 1 ml (a connector kit is provided with the product).
Water and chemicals used for buffer preparation should be of high purity. It is recommended to filter buffers through a 0.22 µm or a 0.45 µm filter before use to remove any potential debris.
HiTrap Albumin & IgG Depletion columns can be operated with a syringe, peristaltic pump, or LC systems such as ÄKTA™ design.
Advance preparation
Binding buffer: 20 mM sodium phosphate, 0.15 M NaCl, pH 7.4.
Elution buffer: 0.1 M glycine-HCl, pH 2.7.
No dilution of the human plasma is required. Filter the human plasma through a 0.45 or 0.22 µm filter shortly before applying it to the column.
Protocol
A flow rate of 1 ml/min is recommended for the entire depletion procedure.
1. Fill the pump tubing with binding buffer. Remove the stopper and the snap-off end from the column and connect it to the pump tubing “drop to drop” to avoid introducing air into the system.
2. Wash the column with 5 ml of binding buffer to remove the 20% ethanol storage solution.
3. Equilibrate with 10 ml of binding buffer.
4. Apply 150 µl of filtered human plasma and wash with at least 5 ml of binding buffer until the absorbance reaches a steady baseline. Collect the flowthrough from sample application and wash step. The flowthrough contains the depleted sample.
5. Optional: Elute and collect the bound proteins (albumin and IgG) with 10 ml of elution buffer.
Step 5 should be performed if the column is to be re-used or if the bound albumin and IgG fraction is to be analyzed.
For a manual depletion procedure (without using a pump), the syringe is connected to the column by the provided Luer connector. Be careful to use a flow rate of approximately 1 ml/min.
Too high a flow rate will damage the packing of the chromatography medium and cause high backpressure.
Some proteins may copurify with albumin and/or IgG either by association through protein interactions or by nonspecific binding. The bound fraction may therefore also be considered for analysis.
To prevent carryover between samples and to maintain binding capacity, it may be important to Clean-in-Place (CIP) the medium after elution of bound proteins; this is done with 70% ethanol in water.
To evaluate the effect on analytical resolution, nondepleted and depleted plasma were analyzed by 2-D gel electrophoresis (Fig 3.5). Parallel runs in the gel and labeling of the samples with different fluorescent dyes made it possible to estimate the differences in protein abundances. A comparison of protein spot maps for nondepleted plasma and albumin/IgG-depleted plasma show enhanced visualization of proteins with pI and/or Mr similar to albumin and IgG (marked with circles). In addition, an increased number of less abundant proteins were detected (green spots).

60 28-9887-41 AA
Fig 3.5. 2-D spot maps of depleted plasma (green spots) and nondepleted plasma (red spots). The yellow spots are proteins detected in both samples.
Custom depletion options
Several ways exist to customize a depletion or enrichment procedure by using one of the tools available for immunoaffinity and pull-down experiments.
Affinity-based enrichment of proteins and protein subgroups Affinity-based enrichment techniques can also be seen as a more targeted form of protein fractionation, in which a single fraction enriched in a selected group of proteins is generated (10, 11, 17). They are naturally limited to investigational strategies focusing on particular subgroups of proteins (based on some level of a priori knowledge or hypothesis). Affinity binders (ligands) with specific affinity for a particular group of proteins are immobilized to a solid support (i.e., chromatographic medium or magnetic beads) and used to bind the targeted group while allowing all other proteins to go into flowthrough and/or wash fractions. The bound fraction is then eluted, yielding a highly enriched protein population for further analysis. Solutions/formats that allow the processing of large initial volumes, followed by elution in small volumes, are particularly valuable for enrichment of low-abundance proteins. In most cases affinity-based enrichment is not compatible with denaturing conditions, because specific binding is dependent on protein 3-D structure.
Proteins that can be enriched include:
• γ Immunoglobulins—Ligands are Protein A or Protein G.
• Biotinylated proteins—Streptavidin is used for specific binding.
• Phosphorylated proteins and peptides—Ligand options include phospho-epitope/specific antibodies (see Chapter 1 for an example), metal chelates, or metal oxides.
• Glycosylated proteins—Various lectins are generally used as ligands.
• Kinases—ATP analogues can be used as ligands.
• DNA-binding proteins—Ligands include heparin, nonspecific and sequence-specific DNA.
• Protein complexes—Antibodies directed against a component in a protein complex are used as ligands for native sample sources. Affinity-tag ligands are used for genetically engineered systems, where a suspected complex member (bait) is expressed in a tagged format. The handbook Purifying Challenging Proteins from GE Healthcare includes details on enrichment of complexes via tagged approaches (see the “Related literature” section at the end of this handbook for code number).
• Protein isomers—Antibodies directed against conserved regions can be used as ligands.

28-9887-41 AA 61
• Tagged recombinant proteins—Purification of tagged proteins is typically based on specific interactions between the tags and ligands. Four commonly used tags are polyhistidines (histidine), glutathione S-transferase (GST), Strep-tag™ II, and Maltose Binding Protein (MBP). Recombinant Protein Purification Handbook: Principles and Methods from GE Healthcare includes additional details (see the “Related literature” section at the end of this handbook for code number).
Products for affinity-based protein enrichmentSpecific products from GE Healthcare are listed in Table 3.1. These products may be used in a wide range of applications, for example, capture of a single protein in a complex sample or enrichment of post-translationally modified proteins. They are available in several chromatography-based formats (Fig 3.6) and also as magnetic beads (Fig 3.6 and 3.7).
Table 3.1. Products from GE Healthcare for affinity-based protein enrichment
Product Mechanism Suitable samplesSample preparation format
Sample volume
NHS HP SpinTrap
NHS Mag Sepharose
Coupling via primary amine of affinity ligand
Cell lysates, serum, plasma
SpinTrap: Minispin columns (microcentrifuge)
Magnetic beads (MagRack 6)
0.2–0.6 ml
0.01–50 ml
HiTrap NHS-activated HP
HiTrap: 1 and 5 ml columns (LC system or syringe)
> 0.5 ml
Streptavidin HP SpinTrap
Streptavidin HP MultiTrap™
Coupling via biotinylated affinity molecule
Cell lysates, serum, plasma
SpinTrap: Minispin columns (microcentrifuge)
MultiTrap: 96-well plate (centrifugation)
0.2–0.6 ml
0.1–0.6 ml
HiTrap Streptavidin HP
HiTrap: 1 and 5 ml columns (LC system or syringe)
> 0.5 ml
Protein A products1 Antibody binding to Protein A
Serum, plasma, ascites, or cell culture supernatants
SpinTrap: Minispin columns (microcentrifuge)
MultiTrap: 96-well plate (centrifugation)
Magnetic beads (Test tube, MagRack 6)
0.2–0.6 ml
0.1–0.6 ml
0.01–50 ml
HiTrap Protein A HP HiTrap: 1 and 5 ml columns (LC system or syringe)
> 0.5 ml
Protein G products1 Antibody binding to Protein G
Serum, plasma, ascites, or cell culture supernatants
SpinTrap: Minispin columns (microcentrifuge)
MultiTrap: 96-well plate (centrifugation)
Magnetic beads (Test tube, MagRack 6)
0.2–0.6 ml
0.1–0.6 ml
0.01-50 ml
HiTrap Protein G HP HiTrap: 1 and 5 ml columns (LC system or syringe)
> 0.5 ml
Immuno- precipitation Starter Pack
Antibody binding to Protein A or G
Serum, plasma, ascites, or cell culture supernatants
Test tube (microcentrifuge) 0.05–1.5 ml
Phos SpinTrap Fe Enrichment of phosphopeptides by Fe3+ IMAC
Enzymatic digest of phosphorylated proteins
Minispin columns (microcentrifuge)
0.04–0.6 ml of diluted sample 1:1
TiO2 Mag Sepharose Enrichment of phosphopeptides by TiO2 metal oxide affinity chromatograph (MOAC)
Enzymatic digest of phosphorylated proteins
Magnetic beads (test tube, MagRack 6)
0.1–0.25 ml
1 These products may be used for small-scale antibody preparation (immunoglobulin enrichment) or for immunoprecipitation using an antibody of choice. Refer to the handbook Antibody Purification: Principles and Methods for additional details (see the “Related literature” section at the end of this handbook for code number).

62 28-9887-41 AA
A) B) C) D)
Fig 3.6. HiTrap columns (A), SpinTrap columns (B), MultiTrap plates (C), and Mag Sepharose magnetic beads (D).
HiTrap columns can be used with a syringe, peristaltic pump, or chromatography system such as ÄKTAmicro. Table 3.2 summarizes the flow rate specifications for HiTrap columns.
Table 3.2. Flow rates for HiTrap columns
Maximum flow rate1
1 ml column 4 ml/min
5 ml column 15–20 ml/min
Recommended flow rate2
1 ml column 0.2–1 ml/min
5 ml column 0.5–5 ml/min
1 H2O at 25°C2 Depending on chromatography medium
The maximum pressure is 3 bar (43 psi, 0.3 MPa).
The protocol for a HiTrap product, HiTrap Albumin & IgG Depletion, was provided earlier in this chapter.
SpinTrap columns are designed for use in standard laboratory microcentrifuges.
Lids and bottom caps are used during incubation and elution but not during equilibration and washing. Before centrifugation, remove the bottom cap and slightly open the screw cap lid (twist the cap lid ~ 90º counterclockwise).
Make sure that the medium is fully suspended before incubating with end-over-end mixing. All incubations should normally be performed at room temperature. However, incubations may be performed at lower temperatures when a slower process is preferable.
For the elution steps, mix by manually inverting the SpinTrap column.
MultiTrap plates are supplied in a 96-well format for higher throughput applications. These products are designed for use with centrifugation or vacuum and may be used with robotic systems. One exception is PD MultiTrap G-25 for desalting and buffer exchange; these are designed for use entirely with centrifugation. MultiTrap plates are discussed in further detail in Chapter 5.
Mag Sepharose magnetic beads are superparamagnetic Sepharose beads with different functionality. The beads are magnetic only within an external magnetic field, making them very useful for small-scale experiments without the need of centrifuges or chromatography systems. The beads are hydrophilic and disperse easily in aqueous solutions for binding of target proteins, during washing, and elution. Between each step, the beads are magnetized within an external magnetic field, for example, a permanent magnet, which will withdraw the beads toward the test tube wall; see Figure 3.7. See below for an example of Protein A Mag Sepharose or Protein G Mag Sepharose beads for immunoprecipitation of antibodies.

28-9887-41 AA 63
Fig 3.7. To the left, Mag Sepharose beads are drawn to the tube wall when exposed to a magnetic field. To the right, the beads are dispersed into the liquid when the magnet is removed.
Use the magnetic rack with the magnet in place for each liquid removal step.
Before application of liquid, wash buffer, elution buffer, etc., remove the magnet from the magnetic rack. After addition of liquid, allow resuspension of the beads by vortexing or manual inversion of the microcentrifuge tube.
When processing multiple samples, manual inversion of the magnetic rack is recommended.
During incubation steps, make sure the gel beads are resuspended well and kept in solution by end-over-end mixing or by using a benchtop shaker suitable for 1.5 ml microcentrifuge tubes.
To prevent degradation of target protein, inhibition of protease activity may be required. Protease Inhibitor Mix is available from GE Healthcare (see Chapter 2).
Transfer the magnetic bead solution to a fresh microcentrifuge tube during the last wash buffer step. This action prevents potential elution of proteins nonspecifically bound to the plastic material in the microcentrifuge tube.
After elution, to prevent sample degradation place the fractions in the freezer or add sample buffer if SDS-PAGE is to be performed.
Immunoglobulin enrichmentProducts from GE Healthcare based on Protein A and Protein G are suitable for binding monoclonal or polyclonal IgG antibodies from a wide range of species; see Table 3.3.
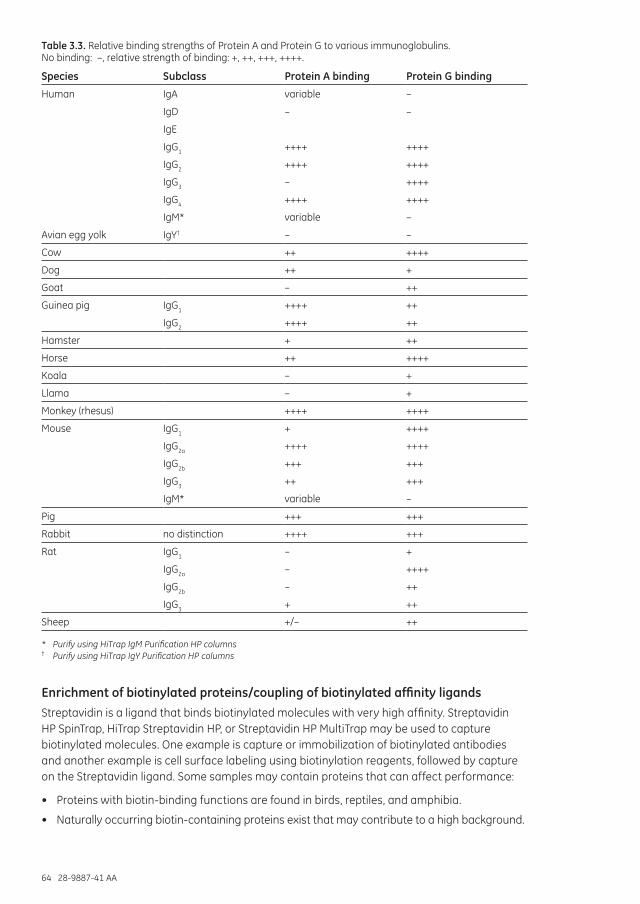
64 28-9887-41 AA
Table 3.3. Relative binding strengths of Protein A and Protein G to various immunoglobulins. No binding: –, relative strength of binding: +, ++, +++, ++++.
Species Subclass Protein A binding Protein G binding
Human IgA variable –
IgD – –
IgE
IgG1 ++++ ++++
IgG2 ++++ ++++
IgG3 – ++++
IgG4 ++++ ++++
IgM* variable –
Avian egg yolk IgY† – –
Cow ++ ++++
Dog ++ +
Goat – ++
Guinea pig IgG1 ++++ ++
IgG2 ++++ ++
Hamster + ++
Horse ++ ++++
Koala – +
Llama – +
Monkey (rhesus) ++++ ++++
Mouse IgG1 + ++++
IgG2a ++++ ++++
IgG2b +++ +++
IgG3 ++ +++
IgM* variable –
Pig +++ +++
Rabbit no distinction ++++ +++
Rat IgG1 – +
IgG2a – ++++
IgG2b – ++
IgG3 + ++
Sheep +/– ++
* Purify using HiTrap IgM Purification HP columns† Purify using HiTrap IgY Purification HP columns
Enrichment of biotinylated proteins/coupling of biotinylated affinity ligandsStreptavidin is a ligand that binds biotinylated molecules with very high affinity. Streptavidin HP SpinTrap, HiTrap Streptavidin HP, or Streptavidin HP MultiTrap may be used to capture biotinylated molecules. One example is capture or immobilization of biotinylated antibodies and another example is cell surface labeling using biotinylation reagents, followed by capture on the Streptavidin ligand. Some samples may contain proteins that can affect performance:
• Proteins with biotin-binding functions are found in birds, reptiles, and amphibia.
• Naturally occurring biotin-containing proteins exist that may contribute to a high background.

28-9887-41 AA 65
Enrichment of plasminogen from human plasmaTo show the performance of Streptavidin HP SpinTrap, plasminogen was enriched from human plasma using a biotinylated mAb. The concentration of the total protein was approximately 50 mg/ml, and the concentration of the plasminogen was between 0.2 and 0.3 mg/ml, which is equivalent to 0.5% of the total protein concentration. Figure 3.8 shows the SDS-PAGE result of enrichment of plasminogen using Streptavidin HP SpinTrap.
Trap product: Streptavidin HP SpinTrapSample: Human plasmaSample volumes: 20 and 100 µlAntibody: Monoclonal mouse anti-plasminogen (biotinylated)Binding buffer: TBS (50 mM Tris, 150 mM NaCl, pH 7.5)Wash buffer: TBS, 2 M urea, pH 7.5Elution buffer: 0.1 M glycine/HCl, 2 M urea, pH 3.0
1 2 3 4 5 6 7 8
Lanes1. Protein Molecular Weight Standards (broad range)2. Antibody 3. Flowthrough (diluted 1:30)4. First wash (diluted 1:10)5. Third wash6. Fifth wash7. First elution8. Second elution9. Third elution
9 3 4 5 6 7 8 9
116 97 80 66 55
45
30
21
14
Mr × 103
A) 20 µl plasma B) 100 µl plasma (control)
Fig 3.8. Enrichment of plasminogen from human plasma. (A) Analysis by SDS-PAGE (wash steps 2 and 4 have been omitted from the gel). The gel was poststained with Deep Purple™ Total Protein Stain and scanned using Ettan DIGE Imager. The arrow indicates the position of the plasminogen (Mr 93 000) identified by MS analysis. (B) The control sample was run in an identical manner compared with the plasma sample, but without a coupled antibody.
Enrichment of proteins using a covalently coupled ligandNHS-activated media are suitable for chemical coupling of ligands containing primary amine functionality, for example, proteins via their lysine side chains or the α-amine in an unblocked N terminus. Coupling of proteins via the ε-amine of lysine is commonly performed in freshly prepared 0.2 M NaHCO3, 0.5 M NaCl buffers at pH 8.3. The result is a stable amide bond.
The reaction competes with the hydrolysis reaction for NHS esters. The hydrolysis occurs more rapidly at increasing pH and in more dilute protein or biomolecule solution. Other molecules containing primary amines should be avoided or removed by, for example, a desalting or buffer exchange step (see Chapter 4).
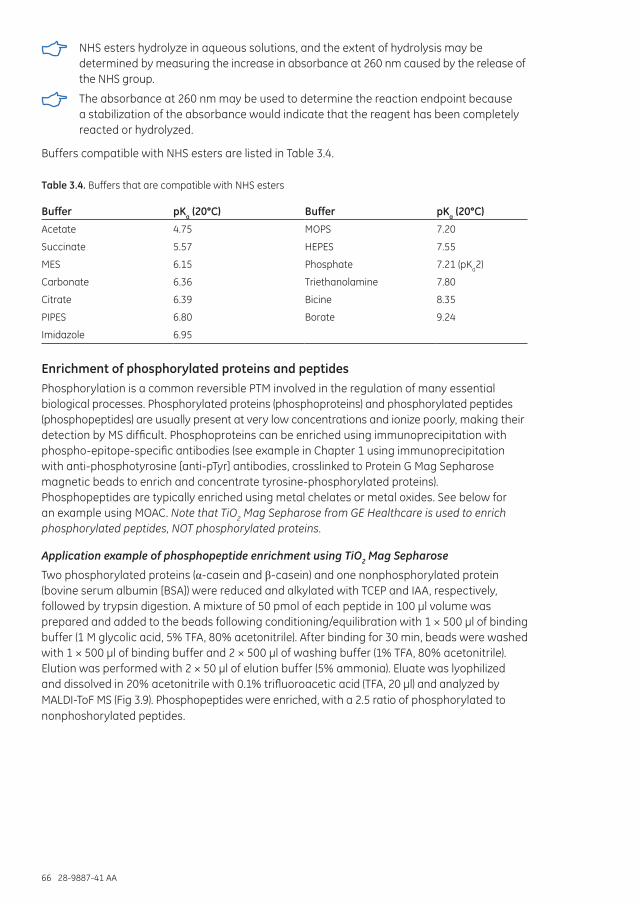
66 28-9887-41 AA
NHS esters hydrolyze in aqueous solutions, and the extent of hydrolysis may be determined by measuring the increase in absorbance at 260 nm caused by the release of the NHS group.
The absorbance at 260 nm may be used to determine the reaction endpoint because a stabilization of the absorbance would indicate that the reagent has been completely reacted or hydrolyzed.
Buffers compatible with NHS esters are listed in Table 3.4.
Table 3.4. Buffers that are compatible with NHS esters
Buffer pKa (20°C) Buffer pKa (20°C)
Acetate 4.75 MOPS 7.20
Succinate 5.57 HEPES 7.55
MES 6.15 Phosphate 7.21 (pKa2)
Carbonate 6.36 Triethanolamine 7.80
Citrate 6.39 Bicine 8.35
PIPES 6.80 Borate 9.24
Imidazole 6.95
Enrichment of phosphorylated proteins and peptidesPhosphorylation is a common reversible PTM involved in the regulation of many essential biological processes. Phosphorylated proteins (phosphoproteins) and phosphorylated peptides (phosphopeptides) are usually present at very low concentrations and ionize poorly, making their detection by MS difficult. Phosphoproteins can be enriched using immunoprecipitation with phospho-epitope-specific antibodies (see example in Chapter 1 using immunoprecipitation with anti-phosphotyrosine [anti-pTyr] antibodies, crosslinked to Protein G Mag Sepharose magnetic beads to enrich and concentrate tyrosine-phosphorylated proteins). Phosphopeptides are typically enriched using metal chelates or metal oxides. See below for an example using MOAC. Note that TiO2 Mag Sepharose from GE Healthcare is used to enrich phosphorylated peptides, NOT phosphorylated proteins.
Application example of phosphopeptide enrichment using TiO2 Mag Sepharose
Two phosphorylated proteins (α-casein and β-casein) and one nonphosphorylated protein (bovine serum albumin [BSA]) were reduced and alkylated with TCEP and IAA, respectively, followed by trypsin digestion. A mixture of 50 pmol of each peptide in 100 µl volume was prepared and added to the beads following conditioning/equilibration with 1 × 500 µl of binding buffer (1 M glycolic acid, 5% TFA, 80% acetonitrile). After binding for 30 min, beads were washed with 1 × 500 µl of binding buffer and 2 × 500 µl of washing buffer (1% TFA, 80% acetonitrile). Elution was performed with 2 × 50 µl of elution buffer (5% ammonia). Eluate was lyophilized and dissolved in 20% acetonitrile with 0.1% trifluoroacetic acid (TFA, 20 µl) and analyzed by MALDI-ToF MS (Fig 3.9). Phosphopeptides were enriched, with a 2.5 ratio of phosphorylated to nonphoshorylated peptides.

28-9887-41 AA 67
14
79
.99
0
15
67
.93
8
11
63
.77
8
13
83
.97
7
12
49
.76
9
16
40
.14
2
13
24
.89
6
11
38
.65
7
10
14
.71
4
20
45
.22
9
17
49
.88
5
18
17
.18
2
18
89
.12
5
15
38
.00
0
22
02
.36
40.50
1.00
×104
Inte
ns. [
a.u.
]
20
61
.31
9
20
08
.50
0
19
51
.48
8
31
21
.64
8
18
70
.35
0
16
60
.38
9
30
39
.49
6
29
59
.27
7
31
75
.61
6
0
0
2000
4000
6000
Inte
ns. [
a.u.
]
1250 1500 1750 2000 2250 2500 2750 3000 m/z
A)
B)
*
* **
*
•
* = phosphopeptide • = metastable phosphopeptide
Fig 3.9. MALDI-ToF MS analysis of trypsin-digested protein mix (50 pmol each of BSA, α-casein, and β-casein) enriched using TiO2 Mag Sepharose. Lyophilized eluates were dissolved in 20 µl before spotting. The spectra show starting material (A) and eluates from TiO2 Mag Sepharose (B).
Custom enrichment options
Several ways are available to customize a depletion or enrichment procedure by using one of the tools for immunoaffinity and pull-down experiments.
Generic procedure for immunoprecipitation using Protein A Mag Sepharose and Protein G Mag Sepharose magnetic beadsThe following procedure is a good starting point for general immunoprecipitation experiments. The protocol can be used as it is or optimized to suit a particular application.
See Chapter 1 for a specific example using immunoprecipitation with anti-phosphotyrosine (anti-pTyr) antibodies, crosslinked to Protein G Mag Sepharose magnetic beads to enrich and concentrate tyrosine phosphorylated proteins.
Materials
Protein A Mag Sepharose or Protein G Mag Sepharose available as 1 × 500 µl or 4 × 500 µl, 20% gel slurry.
Mag Sepharose can be operated with 1.5 ml microcentrifuge tubes and a magnetic rack such as MagRack 6.
Advance preparationRecommended buffers for crosslink protocol
Binding buffer: TBS (50 mM tris, 150 mM NaCl, pH 7.5)
Wash buffer: TBS (optionally with 2 M urea), pH 7.5
Elution buffer: 0.1 M glycine-HCl (optionally with 2 M urea), pH 2.9
Crosslink solutions:
Crosslink solution A: 200 mM triethanolamine, pH 8.9
DMP solution: 50 mM dimethyl pimelimidate dihydrochloride (DMP) in 200 mM triethanolamine, pH 8.9
Crosslink solution B: 100 mM ethanolamine, pH 8.9
A Protein A/G HP SpinTrap Buffer Kit is available as an accessory for increased convenience.

68 28-9887-41 AA
Protocol
Prepare magnetic beads
1. Dispense the required amount of magnetic beads into the microcentrifuge tube. 25 µl of gel slurry is equal to 5 µl of magnetic beads, which is a good starting point for using 5 to 40 µg of antibodies.
2. Place the microcentrifuge tube in the magnetic rack and remove the storage solution.
Binding and crosslinking of antibodies
1. Equilibrate the magnetic beads by adding 500 µl of binding buffer. Resuspend the medium. Remove the liquid.
2. Immediately after equilibration, add the antibody solution (preferably in PBS or TBS).
Resuspend the medium and incubate with slow end-over-end mixing for at least 15 min.
Remove the liquid. Wash out nonbound antibodies by adding 500 µl of binding buffer.
Remove the liquid.
3. Change buffer by adding 500 µl of crosslink solution A (triethanolamine buffer). Remove the liquid.
Add 500 µl of DMP solution (in triethanolamine buffer).
Fully resuspend the medium by manual inversion, and incubate with slow end-over-end mixing for 15 to 60 min. Remove the liquid.
Wash by adding 500 µl of crosslink solution A (triethanolamine buffer). Remove the liquid.
Block residual crosslinking reagent by adding 500 µl of crosslink solution B (ethanolamine buffer).
Fully resuspend the medium by manual inversion and incubate with slow end-over-end mixing for 15 min. Remove the liquid.
Remove nonbound antibody by adding 500 µl of elution buffer. Remove the liquid.
4. Equilibrate the magnetic beads for immunoprecipitation by adding 500 µl of binding buffer. Resuspend the medium. Repeat this step once. Remove the liquid before adding the sample.
Binding of target proteins/molecules1. Bind target protein(s) by adding sample (diluted in, for example, binding buffer). In case
of larger volume of starting material (> 1.5 ml), a 50 ml plastic tube could be used when binding the target protein. To recover the magnetic beads after incubation, a magnetic pickpen could be used for transferring the beads to a microcentrifuge tube. Another alternative is to spin down the beads by using a swing-out rotor.
Incubate with slow end-over-end mixing for 10 to 60 min.
Remove and collect the nonbound fraction.
2. Wash (perform this step three times in total)
Wash out nonbound material by adding 500 µl of wash buffer. Remove the liquid. Optional: Collect the washes in case troubleshooting is required.
3. Elution (perform this step two times in total)
Elute bound protein(s) by adding 10 volumes of elution buffer compared with the magnetic bead volume. For example, 50 µl of buffer to 5 µl of magnetic beads (starting from 25 µl of medium slurry).
Fully resuspend the medium and let incubate for at least 2 min.
Remove and collect the elution fraction. Continue with the next step in the workflow.
For considerations and tips on using Mag Sepharose beads in general, see above.
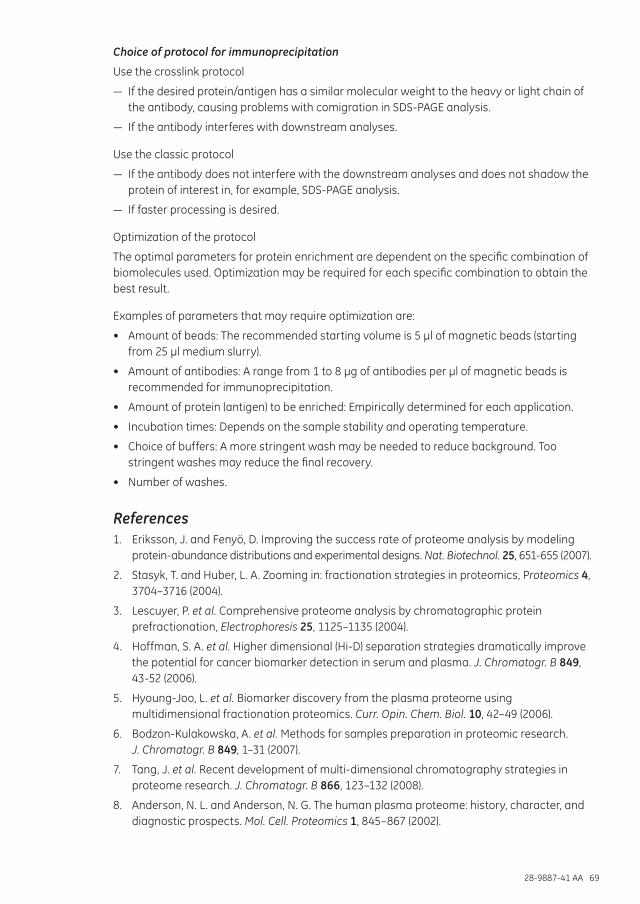
28-9887-41 AA 69
Choice of protocol for immunoprecipitation
Use the crosslink protocol
— If the desired protein/antigen has a similar molecular weight to the heavy or light chain of the antibody, causing problems with comigration in SDS-PAGE analysis.
— If the antibody interferes with downstream analyses.
Use the classic protocol
— If the antibody does not interfere with the downstream analyses and does not shadow the protein of interest in, for example, SDS-PAGE analysis.
— If faster processing is desired.
Optimization of the protocol
The optimal parameters for protein enrichment are dependent on the specific combination of biomolecules used. Optimization may be required for each specific combination to obtain the best result.
Examples of parameters that may require optimization are:
• Amount of beads: The recommended starting volume is 5 µl of magnetic beads (starting from 25 µl medium slurry).
• Amount of antibodies: A range from 1 to 8 µg of antibodies per µl of magnetic beads is recommended for immunoprecipitation.
• Amount of protein (antigen) to be enriched: Empirically determined for each application.
• Incubation times: Depends on the sample stability and operating temperature.
• Choice of buffers: A more stringent wash may be needed to reduce background. Too stringent washes may reduce the final recovery.
• Number of washes.
References1. Eriksson, J. and Fenyö, D. Improving the success rate of proteome analysis by modeling
protein-abundance distributions and experimental designs. Nat. Biotechnol. 25, 651-655 (2007).
2. Stasyk, T. and Huber, L. A. Zooming in: fractionation strategies in proteomics, Proteomics 4, 3704–3716 (2004).
3. Lescuyer, P. et al. Comprehensive proteome analysis by chromatographic protein prefractionation, Electrophoresis 25, 1125–1135 (2004).
4. Hoffman, S. A. et al. Higher dimensional (Hi-D) separation strategies dramatically improve the potential for cancer biomarker detection in serum and plasma. J. Chromatogr. B 849, 43-52 (2006).
5. Hyoung-Joo, L. et al. Biomarker discovery from the plasma proteome using multidimensional fractionation proteomics. Curr. Opin. Chem. Biol. 10, 42–49 (2006).
6. Bodzon-Kulakowska, A. et al. Methods for samples preparation in proteomic research. J. Chromatogr. B 849, 1–31 (2007).
7. Tang, J. et al. Recent development of multi-dimensional chromatography strategies in proteome research. J. Chromatogr. B 866, 123–132 (2008).
8. Anderson, N. L. and Anderson, N. G. The human plasma proteome: history, character, and diagnostic prospects. Mol. Cell. Proteomics 1, 845–867 (2002).

70 28-9887-41 AA
9. Hortin, G. L. et al. High-abundance polypeptides of the human plasma proteome comprising the top 4 logs of polypeptide abundance. Clin. Chem. 54, 1608–1616 (2008).
10. Pernemalm, M. et al. Affinity prefractionation for MS-based plasma proteomics. Proteomics 9, 1420–1427 (2009).
11. Xiangming, F. et al. Affinity separation and enrichment methods in proteomic analysis, J. Proteomics 71, 284–303 (2008).
12. Pieper, R. et al. Multi-component immunoaffinity subtraction chromatography: an innovative step toward a comprehensive survey of the human plasma proteome, Proteomics 3, 422–432 (2002).
13. Bjorhall, K. et al. Comparison of different depletion strategies for improved resolution in proteomic analysis of human serum samples. Proteomics 5, 307–317 (2005).
14. Gong, Y. et al. Different immunoaffinity fractionation strategies to characterize the human plasma proteome. J. Proteome Res. 5, 1379–1387 (2006).
15. Pernemalm, M. et al. Evaluation of three principally different intact protein prefractionation methods for plasma biomarker discovery. J. Proteome Res. 7, 2712–2722 (2008).
16. Gao, M. et al. Large scale depletion of the high-abundance proteins and analysis of middle- and low-abundance proteins in human liver proteome by multidimensional liquid chromatography. Proteomics 8, 939–947 (2008).
17. Azarkan, M. et al. Affinity chromatography: a useful tool in proteomics studies. J. Chromatogr. B 849, 81–90 (2007).

28-9887-41 AA 71
Chapter 4 Ensuring compatibility in protein sample preparation workflowsIntroduction and overview of available methodologyThe focus of this chapter is to describe some of the techniques that are available for ensuring compatibility. These techniques are generally applied multiple times throughout a workflow and not only as a final step before analysis. In addition, these techniques are highly applicable in many other circumstances, for example, to remove excessive labeling reagents after antibody labeling or to adjust conditions between chromatography steps during protein purification.
Sample state
Unit operation category
Sample source (bacterial or other cell culture,
tissue, body fluids, etc.)
Homogeneous protein solution with complex
composition
One or multiple protein subsamples with
improved compositionAnalytical results
Ensure compatibility in workflow
Collect sample and extract/stabilize proteins
Increase detectabilityof targeted proteins
Analyze proteins
Fig 4.1. High-level workflow for protein sample preparation. The step discussed in this chapter is framed.
Protein sample preparation techniques for ensuring compatibility can be categorized in a number of ways. Often, a single technique can be used for several main purposes. In this chapter, manipulations are broken down into several categories based on purpose:
• Clarification
• Buffer exchange and desalting
• Sample cleanup
• Concentration/volume reduction
A short description of the main technology options is given below. Keep in mind the discussion in Chapter 1 relating to contaminant tolerance of different analysis techniques (ESI-MS, MALDI-MS, 2-D gel electrophoresis, etc.).
ClarificationClarification in the context of this handbook means removing particulate matter (cell debris, aggregated proteins, etc.) from the sample to avoid clogging filters or columns in later steps. Particulate removal is mandatory in general because it may foul filters and columns at later stages in the workflow. Particles such as cell debris, connective tissue, insoluble salts, dust, protein aggregates, and so on, may be introduced during sample preparation and can most often be removed by centrifugation or microfiltration.

72 28-9887-41 AA
CentrifugationAfter a centrifugation step, solubilized proteins will remain in the supernatant whereas particulate matter will normally form a tightly packed pellet. A centrifugation force of 15 000 × g for 15 min is adequate for most samples. However, centrifugation of highly viscous samples may be difficult. Centrifugation relies on a difference in the density between the particles and the liquid, so for liquids with high densities, a pellet may not form. Lipids and other fatty molecules that have a lower density than water may float on top of the sample solution after centrifugation. In these situations, it may be better to change the method. If the sample is still not clear after centrifugation, use microfiltration (see below).
MicrofiltrationIn microfiltration, a porous membrane is used to remove particulate material from protein solutions. Commonly, a nominal pore size of 0.2 µm, 0.45 µm, or 0.5 µm is used, and liquid solutions are filtered using pressure, vacuum, or centrifugal force. Particles in the micrometer range are retained by the filter, and the filtrate is used in subsequent steps.
GE Healthcare provides a wide range of Whatman filters including syringe filters, syringeless filters (self-contained filtration devices that do not require a syringe; see Fig 4.2 for an example), spin tubes, microwell plates, and Klari-Flex bottle-top filters (Fig 4.2). Filter devices containing polyvinylidene fluoride (PVDF), polyethersulfone (PES), or Regenerated Cellulose (RC) are generally suitable because of their low protein-binding characteristics. High-particulate-loaded samples may require the use of a filter device with a glass prefilter (such as Whatman GD/X syringe filters), because the glass prefilter allows more sample to be filtered before the membrane blocks. However, glass may bind proteins and hence the suitability of such filters for a given application needs to be determined prior to use.
Cap/septum
Filtration seal
Fill line Chamber
Evaporation seal
Plunger
Membrane
Vent hole
Fig 4.2. Diagram of Mini Uni-Prep syringeless filter.
Some proteins may bind nonspecifically to filter surfaces, especially if materials other than those listed above are used. A test filtration is useful for sensitive proteins.
Buffer exchange and desaltingBuffer exchange and desalting involve manipulating the buffer system (including pH) and reducing the concentration of small ionic species in samples. Technology options include GF, UF, diafiltration, dialysis, precipitation, and solid-phase extraction (SPE).
Gel filtrationGF is a well-established chromatography method that separates molecules according to size and shape as they pass through a packed bed of medium. The medium consists of spherical particles with well-defined porosity and designed inertness (lack of reactivity and adsorptive
28-9887-41 AA 73
properties). By designing the pore distribution such that only low-molecular-weight species can penetrate the spheres, group separation between proteins and low-molecular-weight contaminants is achieved. After the column has first been equilibrated with a desired buffer, samples can undergo buffer exchange and removal of low-molecular-weight contaminants in one quick and simple step. For further details on theory, refer to the handbook Gel Filtration: Principles and Methods, from GE Healthcare (see the “Related literature” section at the end of this handbook for code number).
Desalting or buffer exchange using GF is preferable when a complete change in buffer composition is needed. Other techniques such as diafiltration, for example, will reduce compounds in the starting material by roughly 95% after three volumes of diafiltration solution, and dialysis will require several changes of fluid. Also, the pellet obtained after protein precipitation may include other material that has been coprecipitated.
GE Healthcare offers a range of prepacked chromatography columns and 96-well filter plates that can be used manually, together with a chromatography system, or in high-throughput applications (see the GE Healthcare catalog/website, reference 1, and Chapter 5). The majority of these products contain Sephadex™ G-25, a GF medium that allows effective removal of low-molecular-weight-substances from proteins. Sephadex G-10 products may be used to desalt peptide and carbohydrate samples with M
r > 700. Refer to the handbook Strategies for Protein Purification, from GE Healthcare, for more information on these applications (see the “Related literature” section at the end of this handbook for code number).
Procedure for desalting/buffer exchange
PD MiniTrap™ and MidiTrap™ G-25 columns from GE Healthcare are used with gravity or centrifugation to desalt samples up to 0.5 ml and 1.0 ml, respectively. For smaller sample volumes in the range of 100 to 180 µl, multiple samples can be run on PD SpinTrap G-25 spin columns together with a microcentrifuge or PD MultiTrap G-25 96-well plates (sample volumes 70 to 130 µl) using centrifugation. Although possible to perform, using PD MultiTrap G-25 with vacuum is not recommended due to reduced reproducibility compared with using centrifugation. A procedure and diagram (Fig 4.3) for use of PD SpinTrap G-25 are provided below. PD MultiTrap G-25 can be used with common automated liquid-handling stations such as Tecan™ Freedom EVO™ equipped with a centrifuge. Refer to Chapter 5 for information on increasing sample throughput for screening purposes using PD MultiTrap G-25 and to Appendix 4 for characteristics of PD-10 products prepacked with Sephadex G-25.
Materials
PD SpinTrap G-25 columns
Equilibration buffer: Buffer of choice
Advance preparation
None

74 28-9887-41 AA
Suspend chromatography medium and remove storage solution
Equilibrate
Apply sample
Elute sample in new buffer
Fig 4.3. Flowchart for use of PD SpinTrap G-25.
Protocol
See product instructions for details on appropriate centrifuges. Most standard microcentrifuges are compatible with SpinTrap columns.
1. Suspend chromatography medium and remove storage solution
Vortex column. Centrifuge for 1 min at 800 × g.
2. Equilibrate
Add 500 µl of equilibration buffer and centrifuge for 1 min at 800 × g. Repeat four times.
3. Apply sample
Apply 100 to 180 µl of sample to the middle of the prepacked column.
4. Elute sample in new buffer
Elute by centrifugation at 800 × g for 2 min.
Recovery is dependent on type of protein or other biomolecule. Typically, the recovery is in the range of 70% to 90%. Recovery can be improved for sample volumes less than 140 µl by adding equilibration buffer after the sample has fully absorbed into the column bed to reach a sample volume of 140 µl.
Ultrafiltration (UF)In UF, liquid is forced against membranes with smaller and better-defined pore sizes. Molecules larger than the pores are retained (retentate) whereas smaller molecules and solvent pass through the membrane (filtrate). Pore sizes are most often defined as Molecular Weight Cutoff (MWCO) values. Buffer composition and the concentration of small contaminants can be changed by repeated dilution followed by volume reduction using UF (diafiltration).

28-9887-41 AA 75
GE Healthcare offers two types of UF products: VectaSpin™ and Vivaspin™. VectaSpin UF products are of the traditional type and are available in 12 000, 20 000, 30 000, and 100 000 MWCO ranges. Vivaspin products are discussed in more detail below.
Sample concentration using Vivaspin sample concentrators
In centrifuge-based UF (e.g., using Vivaspin sample concentrators from GE Healthcare), the entire process can be performed in a single tube with an upper compartment containing sample and a lower compartment separated by a semipermeable membrane with a predefined MWCO. Centrifugation is applied to force solvent through the membrane, leaving a more concentrated sample in the upper chamber. With Vivaspin sample concentrators, biological samples can be concentrated up to 30-fold. Recovery of the target molecule typically exceeds 95%. Vivaspin sample concentrators accommodate sample volumes from 100 µl to 20 ml, with a range of MWCO values from M
r 3000 to 100 000. See Figure 4.4 and Table 4.1, respectively, for images of and volume ranges for the four sizes of Vivaspin sample concentrators. Vivaspin concentrators can also be used for buffer exchange and desalting. Protocols for both concentration and buffer exchange/desalting using Vivaspin 500 are provided below. See Table 4.2 for Vivaspin 500 performance characteristics. Appendix 5 includes several tables listing maximum sample volumes, maximum centrifugation speeds, and performance characteristics of the various Vivaspin sample concentrators.
Fig 4.4. Vivaspin 500, 2, 6, and 20. All four products are available with MWCO values of 3000, 5000, 10 000, 30 000, 50 000, and 100 000.
Table 4.1. Volume ranges for Vivaspin sample concentrators
Volume range Product
100 to 500 µl Vivaspin 500
400 µl to 2 ml Vivaspin 2
2 to 6 ml Vivaspin 6
5 to 20 ml Vivaspin 20
Membranes fitted to Vivaspin concentrators contain trace amounts of glycerin and sodium azide. Should these interfere with analysis, they can be removed by rinsing the fill volume of buffer solution or deionized water through the concentrator.

76 28-9887-41 AA
Decant filtrate and concentrate before processing sample solution. If you do not want to use the prerinsed sample concentrator immediately, store it in the refrigerator with buffer or water, covering the membrane surface.
Do not allow the membrane to dry out.
Vivaspin devices should not be autoclaved because high temperatures will substantially increase the membrane MWCO. To sterilize, use a 70% ethanol solution or sterilizing gas mixture.
Materials
Vivaspin 500 sample concentrators
Fixed-angle centrifuge with a minimum angle of 40 degrees and 2.2 ml tube capacity
Advance preparation
Select the most appropriate membrane cutoff for your sample. For maximum recovery, select a MWCO at least 50% smaller than the molecular size of the species of interest.
Protocol for concentration using Vivaspin 5001
Use a centrifuge with a fixed angle. Most standard microcentrifuges are appropriate. See product instructions for details.
1. Apply sample
Apply 100 to 500 µl of sample to the top compartment. Ensure lid is fully seated.
2. Concentrate using centrifugation
Insert the assembled concentrator into centrifuge. Centrifuge for 5 to 30 min at 15 000 x g. See product instructions for details.
3. Recover concentrate
The concentrated sample will remain in the top chamber.
1 A desalting/buffer exchange protocol using Vivaspin 500 is provided below.
Table 4.2. Performance characteristics of Vivaspin 500
Protein Filter
Up to 30-fold sample concentration1
Recovery
Aprotinin 0.25 mg/ml (Mr = 6 500)
MWCO 3000 30 min 96%
BSA 1.0 mg/ml (Mr = 66 000)
MWCO 5000 15 min 96%
MWCO 10 000 5 min 96%
MWCO 30 000 5 min 95%
IgG 0.25 mg/ml (Mr = 160 000)
MWCO 30 000 10 min 96%
MWCO 50 000 10 min 96%
MWCO 100 000 10 min 96%
1 Centrifugation time to achieve an up to 30-fold sample concentration with a starting volume of 500 µl at 20°C

28-9887-41 AA 77
Desalting/buffer exchange using Vivaspin 500Materials
Vivaspin 500 sample concentrators are provided with the product
Fixed-angle centrifuge with a minimum angle of 40 degrees and 2.2 ml tube capacity
Buffer of choice for final sample
Advance preparation
Select the most appropriate membrane cutoff for your sample. For maximum recovery, select a MWCO at least 50% smaller than the molecular size of the species of interest.
Protocol
Use a centrifuge with a fixed angle. Most standard microcentrifuges are appropriate. See product instructions for details.
1. Concentrate sample to desired level (see later in this chapter).
2. Empty filtrate container.
3. Refill concentrator with an appropriate solvent.
4. Concentrate the sample again, and repeat the process until the concentration of contaminating microsolutes is sufficiently reduced. Typically, three wash cycles will remove 99% of initial salt content.
Evaporation Centrifugational vacuum concentration allows easy and reproducible concentration of biological samples by removal of solvents with high vapor pressure. The technique is particularly useful for concentration of peptides, for example, prior to phosphopeptide enrichment using TiO2 Mag Sepharose or prior to MS analysis. Many different systems are available. They are usually based on a vacuum pump connected to a centrifuge via a cold trap, which condenses solvents to prevent them from entering the pump.
DialysisIn dialysis, a protein solution is placed inside a container where at least part of the structure consists of a semipermeable membrane with a MWCO selected by the user. By placing the container in a large liquid volume of defined composition, the properties of the protein solution can be changed, driven by osmotic pressure differences. Molecules below the MWCO limit move across the membrane until concentration differences are eliminated. The degree of contaminant removal or buffer change is controlled by the volume of the surrounding liquid. The speed of the process can be increased by repeatedly moving the dialysis container to fresh buffer without waiting for equilibrium conditions.
Mini Dialysis KitDialysis of small samples can present handling problems. Sample can be lost during transfer in and out of dialysis bags. The Mini Dialysis Kit from GE Healthcare offers a simple solution to the handling problems of small volume dialysis; see Figure 4.5. The kit contains dialysis tubes consisting of a sample tube with a cap that is adapted with a dialysis membrane. Sample is easily and quantitatively transferred into and out of the tube by pipetting. The capped tube is inverted in a stirred beaker containing the solution against which the sample is to be dialyzed. Salts and molecules smaller than the MWCO of the dialysis membrane rapidly exchange through the membrane. Following dialysis, the tube is centrifuged briefly. This forces the entire contents of the dialysis tube into the bottom of the tube, ensuring essentially 100% recovery. The dialyzing cap is replaced with a normal cap for storage of the dialyzed sample.
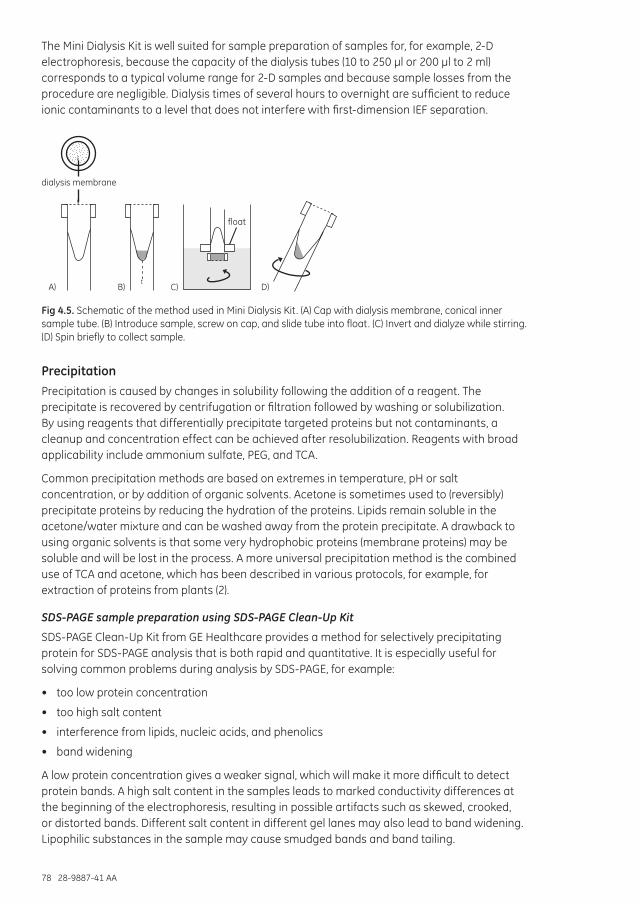
78 28-9887-41 AA
The Mini Dialysis Kit is well suited for sample preparation of samples for, for example, 2-D electrophoresis, because the capacity of the dialysis tubes (10 to 250 µl or 200 µl to 2 ml) corresponds to a typical volume range for 2-D samples and because sample losses from the procedure are negligible. Dialysis times of several hours to overnight are sufficient to reduce ionic contaminants to a level that does not interfere with first-dimension IEF separation.
t
t
t
A) B) C) D)
dialysis membrane
float
Fig 4.5. Schematic of the method used in Mini Dialysis Kit. (A) Cap with dialysis membrane, conical inner sample tube. (B) Introduce sample, screw on cap, and slide tube into float. (C) Invert and dialyze while stirring. (D) Spin briefly to collect sample.
PrecipitationPrecipitation is caused by changes in solubility following the addition of a reagent. The precipitate is recovered by centrifugation or filtration followed by washing or solubilization. By using reagents that differentially precipitate targeted proteins but not contaminants, a cleanup and concentration effect can be achieved after resolubilization. Reagents with broad applicability include ammonium sulfate, PEG, and TCA.
Common precipitation methods are based on extremes in temperature, pH or salt concentration, or by addition of organic solvents. Acetone is sometimes used to (reversibly) precipitate proteins by reducing the hydration of the proteins. Lipids remain soluble in the acetone/water mixture and can be washed away from the protein precipitate. A drawback to using organic solvents is that some very hydrophobic proteins (membrane proteins) may be soluble and will be lost in the process. A more universal precipitation method is the combined use of TCA and acetone, which has been described in various protocols, for example, for extraction of proteins from plants (2).
SDS-PAGE sample preparation using SDS-PAGE Clean-Up Kit
SDS-PAGE Clean-Up Kit from GE Healthcare provides a method for selectively precipitating protein for SDS-PAGE analysis that is both rapid and quantitative. It is especially useful for solving common problems during analysis by SDS-PAGE, for example:
• too low protein concentration
• too high salt content
• interference from lipids, nucleic acids, and phenolics
• band widening
A low protein concentration gives a weaker signal, which will make it more difficult to detect protein bands. A high salt content in the samples leads to marked conductivity differences at the beginning of the electrophoresis, resulting in possible artifacts such as skewed, crooked, or distorted bands. Different salt content in different gel lanes may also lead to band widening. Lipophilic substances in the sample may cause smudged bands and band tailing.

28-9887-41 AA 79
Treatment of the sample with SDS-PAGE Clean-Up Kit can improve the quality of SDS-PAGE results, reducing lane distortion, increasing resolution, and yielding “publication quality” electrophoresis results. The kit can enable effective SDS-PAGE analysis of samples that are otherwise too dirty or dilute. SDS-PAGE Clean-Up Kit procedure uses a combination of precipitant and coprecipitant to quantitatively precipitate the sample proteins. The proteins are pelleted by centrifugation, and the precipitate is washed to further remove nonprotein contaminants. The mixture is centrifuged again, and the resulting pellet is resuspended, mixed with SDS-PAGE sample buffer, and heated. The sample is then ready to be loaded onto an SDS gel.
Concentrated protein samples can be prepared from sources as dilute as 1 ng/ml. Recovery is generally above 90%. Before using SDS-PAGE Clean-Up Kit, make sure that the sample is essentially free of particulate material by, for example, centrifugation.
Materials
Precipitant, Coprecipitant, Wash buffer, Wash additive, Buffer I, Buffer II, and SDS-PAGE sample buffer are supplied with the kit.
Microcentrifuge
Heat block set at 95°C to 100°C
Vortexer
Advance preparation
Remove particulate material if necessary by centrifugation at 10 000 × g for 10 min.
Chill wash buffer at -20°C for at least 1 h.
Add reductant to SDS-PAGE sample buffer, either 3.1 mg of DTT or 5 µl of β-mercaptoethanol per 100 µl.
Protocol1
1. Precipitate proteins Add precipitant. Vortex and incubate on ice for 15 min. Add coprecipitant and mix.
2. Pellet proteins Centrifuge at 12 000 × g for 5 min and remove supernatant.
3. Disperse pellet Add water and vortex.
4. Wash Add chilled wash buffer and wash additive. Incubate for 30 min, vortexing every 10 min
to remove contaminants.
5. Pellet proteins and dry Centrifuge at 12 000 x g for 5 min and remove supernatant. Invert tube to dry.
6. Resuspend pellet Add buffer I. Vortex and incubate on ice for 5 min.
7. Adjust pH Add buffer II. Vortex and incubate on ice for 5 to 10 min.
8. Prepare sample for loading Add SDS sample buffer that contains reductant. Vortex and incubate for 5 to 10 min.
9. Heat sample to denature protein Incubate for 3 min at 95°C to 100°C.
10. Load sample onto SDS-PAGE gel.
1 For 1 to 100 µl sample volumes containing 1 to 100 µg of protein; see product instructions if volume is larger.
80 28-9887-41 AA
2-D electrophoresis/DIGE sample preparation using 2-D Clean-Up Kit
Current methods of protein precipitation suffer from several significant disadvantages:
• Precipitation can be incomplete, resulting in the loss of proteins from the sample and introduction of bias into the 2-D result.
• The precipitated protein can be difficult to resuspend and often cannot be fully recovered.
• The precipitation procedure can itself introduce ions that interfere with first-dimension IEF.
• Precipitation can be time consuming, requiring overnight incubation of the sample.
The 2-D Clean-Up Kit from GE Healthcare provides a method for selectively precipitating protein for 2-D electrophoretic analysis that circumvents these disadvantages. Protein can be quantitatively precipitated from a variety of sources without interference from detergents, chaotropes, and other common reagents used to solubilize protein. Recovery is generally above 90%. The procedure does not result in spot gain or loss, or changes in spot position relative to untreated samples. The precipitated proteins are easily resuspended in 2-D sample solution. The procedure can be completed in less than 1 h.
Treatment of the sample with the 2-D Clean-Up Kit can improve the quality of 2-D electrophoresis results, reducing streaking, background staining, and other consequences of interfering contaminants. The kit can enable effective 2-D analysis of samples that are otherwise too dirty or dilute.
The 2-D Clean-Up Kit procedure uses a combination of precipitant and coprecipitant to quantitatively precipitate the sample proteins. The proteins are pelleted by centrifugation, and the precipitate is washed to further remove nonprotein contaminants. The mixture is centrifuged again, and the resulting pellet can be easily resuspended into a 2-D sample solution of choice.
Materials
Precipitant, Coprecipitant, Wash buffer, and Wash additive are supplied with the kit.
Microcentrifuge
Vortexer
Rehydration or sample solution for resuspension1
Advance preparation
The protein sample should be substantially free of particulate material. Clarify by centrifugation if necessary (see above).
Chill wash buffer at -20°C for at least 1 h.
1 See Table 4.3 for examples of suitable buffers.
Protocol2
1. Precipitate proteins
Add precipitant. Vortex and incubate on ice for 15 min. Add coprecipitant and mix.
2. Pellet proteins
Centrifuge at 12 000 x g for 5 min and remove supernatant.
3. Wash pellet
Add coprecipitant on top of the pellet and incubate on ice for 5 min.
28-9887-41 AA 81
4. Pellet proteins
Centrifuge at 12 000 x g for 5 min. Remove the supernatant.
5. Disperse pellet
Add water to the pellet. Vortex and incubate on ice for 5 min.
6. Wash
Add chilled wash buffer and wash additive. Incubate for 30 min, vortexing every 10 min to remove contaminants.
7. Pellet proteins and dry
Centrifuge at 12 000 x g for 5 min and remove supernatant. Invert tube to dry.
8. Resuspend pellet
Resuspend pellet in rehydration or sample solution of choice.
9. Sample is ready to load onto first-dimension IEF gel.
2 For 1 to 100 µl sample volumes containing 1-100 µg of protein; see product instructions if volume is larger.
Table 4.3. Examples of rehydration/IEF sample loading solutions
Rehydration solution containing 8 M urea
(8 M urea, 2% CHAPS, 40 mM DTT, 0.5% Pharmalyte or IPG buffer, 0.002% bromophenol blue, 2.5 ml)
This is a good, all-purpose solution that gives clean, sharp 2-D separations.
Final concentration Amount
Urea (FW 60.06) 8 M 1.20 g
CHAPS1 2% (w/v) 50 mg
Carrier ampholyte2 (Pharmalyte or IPG Buffer)
0.5% (v/v)3 12.5 µl
DTT (FW 154.2) 40 mM 15.4 mg
Bromophenol Blue 0.002% (w/v) 5 µl of a 1% (w/v) solution
Distilled or deionized water to 2.5 ml
Rehydration solution containing 7 M urea, 2 M thiourea
(7 M urea, 2 M thiourea, 4% CHAPS, 40 mM DTT, 0.5% Pharmalyte or IPG buffer, 0.002% bromophenol blue, 2.5 ml)
This is a more strongly solubilizing solution that can result in more proteins solubilized and more spots in the final 2-D pattern. IEF separations performed with this solution may not be as sharp as with the previous solution, resulting in a 2-D separation with more horizontal streaking.
Urea (FW 60.06) 7 M 1.05 g
Thiourea (FW 76.12) 2 M 381 mg
CHAPS1 4% (w/v) 100 mg
Carrier ampholyte2
(Pharmalyte or IPG Buffer) 0.5% (v/v)3 12.5 µl
DTT (FW 154.2) 40 mM 15.4 mg
Bromophenol Blue 0.002% (w/v) 5 µl of a 1% (w/v) solution
Distilled or deionized water to 2.5 ml
1 Other neutral or zwitterionic detergents may be used. Examples include Triton X-100, NP-40, octyl glucoside and the alkylamidosulfobetaine detergents ASB-14 and ASB-16.
2 Use IPG buffer in the pH range corresponding to the pH range of the IEF separation to be performed, or Pharmalyte in a pH range approximating the pH range of the IEF separation to be performed.
3 Concentrations greater than 0.5% may be used for some applications. Refer to the handbook 2-D Electrophoresis, Principles and Methods for guidelines.

82 28-9887-41 AA
When samples were prepared using 2-D Clean-Up Kit, the overall quality of protein separation was superior to that observed with whole cell extracts or samples precipitated with acetone.There was less vertical streaking, suggesting better protein transfer from strips into the gel (Fig 4.6). While distortion or other significant variations in protein migration patterns was not observed for any of the methods, spot resolution was sharper and the number of spots was higher for samples prepared with the 2-D Clean-Up Kit (Fig 4.6C). These samples yielded 801 protein spots, compared with 758 and 726 spots for acetone-precipitated samples or whole cell extracts, respectively. Use of 2-D Clean-Up Kit thus significantly improved resolution and recovery of proteins in 2-D electrophoresis.
M × 103r
— 220
— 97
— 66
— 46
— 30
3 10pl
Mr
— 220
— 97
— 66
— 46
— 30
A) B)
3 10pl
Mr
— 220
— 97
— 66
— 46
— 30
C)
3 10pl
1
2
1
2
1
2
× 103
× 103
Fig 4.6. MCF7 cell proteome maps generated using whole cell extract (A), acetone-precipitated extracts (B), and extracts treated with Clean-Up Kit (C). For all gels, 50 µg of protein was loaded. The pH gradient of the first-dimension electrophoresis is shown at the bottom of the gel. Migration of molecular mass markers for SDS-PAGE in the second dimension is shown on the side of the gel in molecular range. Migration positions of proteins used for MS analysis are indicated by arrows. Data from reference 3.
Solid-phase extractionSolid-phase extraction is similar to adsorption chromatography, but the purpose here is to achieve separation of molecular classes. The procedure is generally performed in batch mode, and the type of solid phase and device used to retain it might differ from chromatography columns. SPE concentrates proteins and/or removes contaminants by differential binding to a solid phase with defined ligand chemistry. Either proteins are bound and contaminants washed away or contaminants are bound and proteins collected directly. Ligands include variations of the common chromatography selectivities (IEX, RPC, and HIC) and specialized ones designed to remove specific contaminants (e.g., SDS removal by ceramic hydroxyapatite [4]).

28-9887-41 AA 83
Sample cleanupSample cleanup encompasses a set of techniques used to remove contaminants such as detergents, lipids, polysaccharides, nucleic acids, and phenols from protein solutions. Technology options are generally the same as for buffer exchange and desalting, although the protocols differ. In addition, nuclease treatment is sometimes included to reduce the molecular size of DNA and RNA. Sample cleanup is often closely integrated with protein extraction (see Chapter 2).
Nucleic acid removalThe viscosity of a sample will typically increase during lysis, especially in bacterial cells, because nucleic acids are released into the extract. To avoid or minimize complications arising from increasing viscosity, nucleases are often added during the extraction step. Not only does this help increase the efficiency and yield, but it also helps avoid contamination and subsequent artifacts in downstream analyses.
Nucleic acid removal using Nuclease Mix
Nuclease Mix from GE Healthcare offers an effective mix of DNase and RNase enzymes, as well as the necessary cofactors for optimal nuclease activity. The mix was specifically developed for removal of nucleic acids in sample preparation for IEF/2-D electrophoresis applications in proteomic studies, but it can be used more broadly for other applications. Nuclease Mix is compatible with Protease Inhibitor Mix (discussed in Chapter 2).
Materials
Nuclease Mix (100× solution) is provided with the product. Each Nuclease Mix contains 80 units of DNase (bovine pancreas) and 1.2 units of RNase (bovine pancreas) per 10 µl solution.
Advance preparation
None
Protocol
1. Nuclease Mix is supplied as a suspension. Vortex briefly before taking an aliquot.
2. Add 10 µl of Nuclease Mix per 1 ml of reaction mix. Vortex briefly and incubate at room temperature for 30 to 45 min.
Note: Protease Inhibitor, a cocktail of protease inhibitors, may be added in the same reaction mix.
Concentration/volume reductionConcentration/volume reduction involves adjusting the volume and global protein concentrations of dilute and/or large volume samples to match demands of the next step in the workflow. Technology options include UF, precipitation, SPE, and evaporation. These techniques have been discussed above, although the protocols may differ based on volume and concentration parameters.
References1. Selection guide: Sample preparation for analysis of proteins, peptides and carbohydrates:
Desalting, Buffer Exchange, Cleanup, Concentration, GE Healthcare, 18-1128-62 AG (2008).
2. Maldonado, A. M. et al. Evaluation of three different protocols of protein extraction for Arabidopsis thaliana leaf proteome analysis by two-dimensional electrophoresis. J. Proteomics 71, 461–472 (2008).
84 28-9887-41 AA
3. Stasyk, T. et al. Optimizing sample preparation for 2-D electrophoresis, Life Science News 9, 8-11 (2001).
4. Dong, M. et al. Complete removal and exchange of sodium dodecyl sulfate bound to soluble and membrane proteins and restoration of their activities, using ceramic hydroxyapatite chromatography, Anal. Biochem. 247, 333-341 (1997).
28-9887-41 AA 85
Chapter 5 Increasing sample throughput/screening applicationsIntroductionSample throughput refers to the number of samples that are processed. It can apply to the number of samples processed simultaneously or to the number processed in a specified time period. The term parallel processing or multiplexing is often used when referring to samples processed simultaneously. When higher sample throughput is required, there are a number of technology options for parallel or multiplexed sample preparation.
Overview of available methodologyThere are multiple factors that can be considered for increasing the efficiency in a laboratory, and increasing sample throughput by parallel processing is one way to accomplish this.
The format. Format influences throughput in ways similar to how the choice of chemistry does. A proper choice can improve the speed of a unit operation or remove the need for another unit operation originally present in the workflow. In addition, compatibility with laboratory equipment enabling parallel handling (multi-pipettes, centrifuges, etc.) or with already existing automation infrastructure is an important factor. Examples of formats include (i) tubes for solution-phase operations, (ii) chromatography media in gravity columns, spin columns, pipette tips, or 96-well filter plates, (iii) filter cartridges, and (iv) magnetic beads/particles.
Automation/robotics. Using robotics (1, 2) to improve throughput, in terms of both parallel processing and samples per unit of time, is an obvious strategy. However, there are additional rationales for introducing automation solutions into a workflow. Automation decreases hands-on time, thereby decreasing the need for staff or freeing up their time for other tasks. In addition, it offers a means to standardize the process, which in turn can improve reproducibility, lower the need for training/expertise, and enable better transferability between laboratories.
Design considerations and general concernsWhen considering increasing throughput, it is advisable to start with a complete workflow analysis. First answer the following questions, then sketch out and evaluate designs based on the options outlined above.
• Where are the bottlenecks in terms of throughput today?
• What is the overall throughput need for the workflow, in terms of both parallel processing and samples per unit time?
• How does that propagate into needs at the level of specific unit operations? How many samples will be handled in parallel? What is the expected number of samples to be handled per unit of time? How much variation is there in these needs?
• What are the sample volumes to be handled?
Individual products and protocols GE Healthcare provides a number of products for protein sample preparation that are amenable to increased throughput. They are based on formats such as 96-well filter plates (MultiTrap), spin columns (SpinTrap), and magnetic beads (Mag Sepharose). Specific products can be found

86 28-9887-41 AA
for desalting/ buffer exchange and affinity-based protein enrichment, including small-scale affinity-based purification of either tagged recombinant proteins or antibodies. In addition, robotic systems for gel-spot processing for MALDI analysis are available. MultiTrap plates are highlighted below, as is the use of Mag Sepharose for increased throughput and screening applications. The spin-column and manual magnetic bead formats are discussed in Chapter 3. See the ordering information for a full listing of GE Healthcare products in these formats.
Available formatsOverview of the MultiTrap 96-well format
MultiTrap from GE Healthcare (Fig 5.1) is a ready-to-use, prepacked 96-well filter plate that simplifies screening and small-scale parallel sample preparation and secures consistent results with high reproducibility, both well-to-well and plate-to-plate. The format is compatible with complete automation using existing robotic solutions (such as Tecan Freedom EVO liquid-handling station or equivalent equipment). As an alternative, MultiTrap plates can be processed using a combination of multi-channel pipettes and either a centrifuge or a computer-controlled vacuum manifold.
Fig 5.1. MultiTrap 96-well filter plate in a robotic workstation.
Overview of the Mag Sepharose format used with automation
The magnetic bead format has excellent properties for small-scale experiments. The high density of the beads allows rapid capture by magnetic devices, and samples are concentrated automatically to help enhance the signal in analysis. In addition, the process is scalable to allow flexibility in volume of sample processed. MagRack 6 enables preparation of up to six samples captured in 1.5 ml microcentrifuge tubes. See Chapter 3 for an example of TiO2 Mag Sepharose used with MagRack 6. The use of magnetic beads can also be readily automated on a variety of platforms. Examples below use robotic systems from Tecan.
Increasing sample throughputDesalting/buffer exchange using PD MultiTrap G-25 and manual centrifugation
Desalting of protein samples is often required in order to perform subsequent analyses such as MS and for label-free study of protein interactions using Biacore™ systems. PD MultiTrap G-25 gives highly reproducible and efficient desalting with high levels of protein recovery, typically over 85%. Figure 5.2 shows a schematic diagram of the process. In the example below, removal of NaCl from BSA was 93%, and well-to-well variation was 1% relative standard deviation (RSD; see Fig 5.3).

28-9887-41 AA 87
Place MultiTrap on collection plate. Centrifuge at 500 × g for 2 min
Centrifuge at 500 × g for 2 min. Repeat once
Centrifuge at 500 × g for 2 min.
Removing storage solution
Equilibrating with binding buffer
Desalting or buffer exchange of protein sample
Step Centrifugation
From microgram amounts to 0.5 mg is collected
Fig 5.2. Flowchart for desalting/buffer exchange using PD MultiTrap G-25 and manual centrifugation. The schematic shows a single well in the plate.
1Sample number
Salt
rem
oval
(%)
0
2010
40
60
80
100
30
50
70
90
96
Fig 5.3. Conductivity measurements following PD MultiTrap G-25 purification. Experimental conditions: sample =130 µl/well, 1000 µg/µl of of BSA, 1 M NaCl; sample loading volumes = 80 to 180 µl; equilibration buffer = Milli-Q™ water; high-throughput method = manual centrifugation; detection method = conductivity measurement.
Antibody purification using Protein A HP MultiTrap and automation
Protein A HP MultiTrap and Protein G HP MultiTrap are versatile tools that can be used for a number of operations such as antibody screening or purifying antibodies from a variety of sources. They offer highly reproducible well-to-well performance with no detectable cross-contamination. Excellent well-to-well reproducibility is shown with a simple setup on a Tecan Freedom EVO liquid-handling station equipped with Te-VacS™ high-throughput vacuum separation module and Magellan™ data analysis software.
Human monoclonal IgG was purified on Protein A HP MultiTrap dispensed in a chessboard pattern (Fig 5.4), with neighboring wells left empty. The sample consisted of 200 µl/well of pure monoclonal human IgG. Buffers included binding buffer (20 mM sodium phosphate, pH 7.0); wash buffer (20 mM sodium phosphate, pH 7.0); neutralizing buffer (1 M Tris-HCl, pH 9.0); and elution buffer (0.1 M glycine-HCl, pH 2.7). Every well was analyzed for possible cross-contamination. After elution, yields were calculated by measuring absorbance at 280 nm, and fractions were analyzed by SDS-PAGE (Fig 5.5). Highly reproducible purification was achieved with an RSD of 1.4%, with no detectable antibody in the empty wells (Fig 5.6).

88 28-9887-41 AA
1 2 3 4 5 6 7 8 9 10 11 12
A S E S E S E S E S E S E
B E S E S E S E S E S E S
C S E S E S E S E S E S E
D E S E S E S E S E S E S
E S E S E S E S E S E S E
F E S E S E S E S E S E S
G S E S E S E S E S E S E
H E S E S E S E S E S E S
Fig 5.4. Samples were applied in a chessboard pattern, where S indicates sample present and E indicates an empty well.
M 1 2 3 4 5 6 7 8 9 10 11 12 M 1 2 3 4 5 6 7 8 M
A1-A12 B1 –B8
Fig 5.5. SDS polyacrylamide gel (nonreduced) of eluted monoclonal IgG from the first elution, stained using Deep Purple Total Protein Stain. Samples were taken from wells A1-A12 and B1-B8. M = molecular weight marker. In this test, every second well in the MultiTrap plate was empty.
1 96
Amount added sample
Amou
nt e
lute
d Ig
G (µ
g)
Well number
Amount IgG in first elution Amount IgG in second elution
300
250
200
150
100
50
0
Fig 5.6. The total yield of IgG among wells varied with a standard deviation of 1.4%.

28-9887-41 AA 89
Binding of human IgG to Protein G Mag Sepharose Xtra down to 1 µl of beads
Reproducibility and robustness are important when developing increased throughput and screening methodologies. The experiment described below shows an example of this, using Protein G Mag Sepharose Xtra. In this experiment, binding of human IgG was measured for different volumes of Protein G Mag Sepharose Xtra that were dispensed into wells of a 96-well plate (Table 5.1). Each bead volume was run with 16 replicates. Processing was done automatically on a Tecan Freedom EVO robot according to the steps outlined in Figure 5.7. Twenty µg of human IgG (gammanorm™, Octapharma AG) was used for each 1 µl of beads. PBS was used for binding, and elution was performed using 100 mM glycine-HCl, pH 2.8. Before each step, the magnetic separator was used to withdraw beads and to remove “liquid” (buffer, sample residuals, washes).
Table 5.1. Volume of beads and amount of IgG used in experiment
Volume of beads (µl) 5 4 3 2 1 No beads
Amount of IgG loaded (µg) 100 80 60 40 20 20
Resinin well
Equilibration Remove the buffer
Sampleaddition
30 min incubation with mixing
Mix 30 sec
Wash (x2) Elution
Magnetic separator Fig 5.7. Steps in the binding experiment.
Absorbance at 280 nm was measured for each well to determine the amount of eluted protein (Fig 5.8). The eight rows in the 96-well plate show similar patterns. The wells with the same bead volume have similar amounts of eluted protein, and there is no measurable protein in wells without beads. No cross-contamination can be seen.
1 Well number0
20
10
40
60
80
30
50
70
96
Amou
nt (µ
g)
Fig 5.8. Amount of eluted IgG as measured by A280 in each well.
Purification of low sample volumes of histidine-tagged GFP using His Mag Sepharose Ni
In the following experiment, GFP-(His)6 was spiked in an E. coli lysate. The amount of tagged protein varied with the volume of His Mag Sepharose Ni used (see Table 5.2). Sixteen replicates were prepared for each bead volume. The experiment was carried out in a 96-well plate. The compositions of the binding and elution buffers are as follows: binding buffer = 20 mM Na phosphate,

90 28-9887-41 AA
500 mM NaCl, 20 mM imidazole, pH 7.4, and elution buffer = 20 mM Na phosphate, 500 mM NaCl, 500 mM imidazole, pH 7.4. Eluted protein was measured by absorbance at 280 nm (Fig 5.9A) and run on SDS-PAGE (Fig 5.9B). The same purity was obtained independently of the volume of the magnetic beads and sample. A very low variation in yield of GFP-(His)6 was observed between replicates. The RSDs were between 2% and 5%.
Table 5.2. Volume of beads and amount of GFP-(His)6 used in the experiment
Volume of beads (µl) 5 4 3 2.5 2 1
Amount of GFP-(His)6 loaded (µg) 94 75 56 47 38 19
80
70
60
50
40
30
20
10
05 µl
beads
LaneM. LMW Marker1. Starting material2. Flowthrough3 and 4. Replicates from 5 µl bead volume5 and 6. Replicates from 4 µl bead volume7 and 8. Replicates from 3 µl bead volume9 and 10. Replicates from 2.5 µl bead volume11 and 12. Replicates from 2 µl bead volume13 and 14. Replicates from 1 µl bead volume M. LMW Marker
4 µl beads
3 µl beads
2.5 µl beads
2 µl beads
1 µl beads
40
35
30
25
20
15
10
5
0
Average
RDS (%)
RSD
(%)
Elut
ed p
rote
in (µ
g)
A)
B)M 1 2 3 4 5 6 7 8 9 10 11 12 13 14 M
Fig 5.9. (A) Average amount of the eluted protein according to A280 readings and the corresponding RSD. (B) SDS-polyacrylamide gel of the starting material, flowthrough, and the eluates using six different bead volumes (two replicates from each bead volume). The Mr of GFP-(His)6 is indicated by the arrow in the SDS-PAGE image.
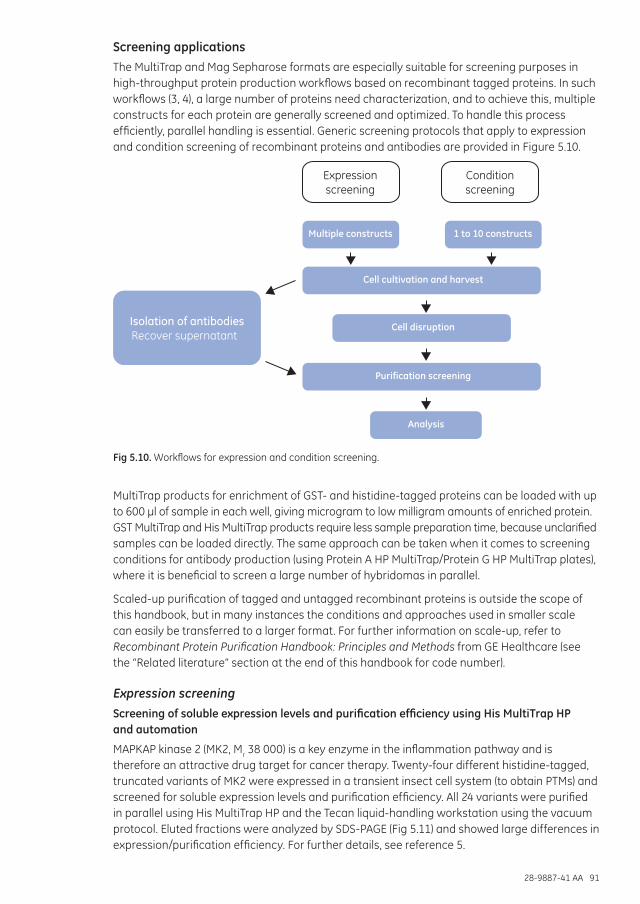
28-9887-41 AA 91
Screening applicationsThe MultiTrap and Mag Sepharose formats are especially suitable for screening purposes in high-throughput protein production workflows based on recombinant tagged proteins. In such workflows (3, 4), a large number of proteins need characterization, and to achieve this, multiple constructs for each protein are generally screened and optimized. To handle this process efficiently, parallel handling is essential. Generic screening protocols that apply to expression and condition screening of recombinant proteins and antibodies are provided in Figure 5.10.
Expression screening
Conditionscreening
Multiple constructs
Cell cultivation and harvest
Cell disruption
Purification screening
1 to 10 constructs
Analysis
Isolation of antibodies Recover supernatant
Fig 5.10. Workflows for expression and condition screening.
MultiTrap products for enrichment of GST- and histidine-tagged proteins can be loaded with up to 600 µl of sample in each well, giving microgram to low milligram amounts of enriched protein. GST MultiTrap and His MultiTrap products require less sample preparation time, because unclarified samples can be loaded directly. The same approach can be taken when it comes to screening conditions for antibody production (using Protein A HP MultiTrap/Protein G HP MultiTrap plates), where it is beneficial to screen a large number of hybridomas in parallel.
Scaled-up purification of tagged and untagged recombinant proteins is outside the scope of this handbook, but in many instances the conditions and approaches used in smaller scale can easily be transferred to a larger format. For further information on scale-up, refer to Recombinant Protein Purification Handbook: Principles and Methods from GE Healthcare (see the “Related literature” section at the end of this handbook for code number).
Expression screeningScreening of soluble expression levels and purification efficiency using His MultiTrap HP and automation
MAPKAP kinase 2 (MK2, Mr 38 000) is a key enzyme in the inflammation pathway and is therefore an attractive drug target for cancer therapy. Twenty-four different histidine-tagged, truncated variants of MK2 were expressed in a transient insect cell system (to obtain PTMs) and screened for soluble expression levels and purification efficiency. All 24 variants were purified in parallel using His MultiTrap HP and the Tecan liquid-handling workstation using the vacuum protocol. Eluted fractions were analyzed by SDS-PAGE (Fig 5.11) and showed large differences in expression/purification efficiency. For further details, see reference 5.
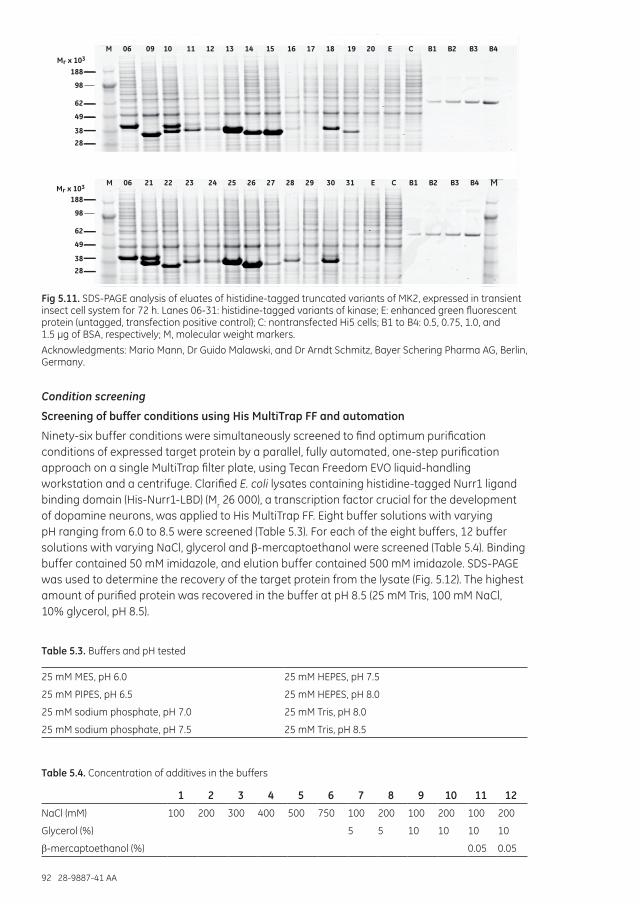
92 28-9887-41 AA
Fig 5.11. SDS-PAGE analysis of eluates of histidine-tagged truncated variants of MK2, expressed in transient insect cell system for 72 h. Lanes 06-31: histidine-tagged variants of kinase; E: enhanced green fluorescent protein (untagged, transfection positive control); C: nontransfected Hi5 cells; B1 to B4: 0.5, 0.75, 1.0, and 1.5 µg of BSA, respectively; M, molecular weight markers.
Acknowledgments: Mario Mann, Dr Guido Malawski, and Dr Arndt Schmitz, Bayer Schering Pharma AG, Berlin, Germany.
Condition screening
Screening of buffer conditions using His MultiTrap FF and automation
Ninety-six buffer conditions were simultaneously screened to find optimum purification conditions of expressed target protein by a parallel, fully automated, one-step purification approach on a single MultiTrap filter plate, using Tecan Freedom EVO liquid-handling workstation and a centrifuge. Clarified E. coli lysates containing histidine-tagged Nurr1 ligand binding domain (His-Nurr1-LBD) (Mr 26 000), a transcription factor crucial for the development of dopamine neurons, was applied to His MultiTrap FF. Eight buffer solutions with varying pH ranging from 6.0 to 8.5 were screened (Table 5.3). For each of the eight buffers, 12 buffer solutions with varying NaCl, glycerol and β-mercaptoethanol were screened (Table 5.4). Binding buffer contained 50 mM imidazole, and elution buffer contained 500 mM imidazole. SDS-PAGE was used to determine the recovery of the target protein from the lysate (Fig. 5.12). The highest amount of purified protein was recovered in the buffer at pH 8.5 (25 mM Tris, 100 mM NaCl, 10% glycerol, pH 8.5).
Table 5.3. Buffers and pH tested
25 mM MES, pH 6.0 25 mM HEPES, pH 7.5
25 mM PIPES, pH 6.5 25 mM HEPES, pH 8.0
25 mM sodium phosphate, pH 7.0 25 mM Tris, pH 8.0
25 mM sodium phosphate, pH 7.5 25 mM Tris, pH 8.5
Table 5.4. Concentration of additives in the buffers
1 2 3 4 5 6 7 8 9 10 11 12
NaCl (mM) 100 200 300 400 500 750 100 200 100 200 100 200
Glycerol (%) 5 5 10 10 10 10
β-mercaptoethanol (%) 0.05 0.05
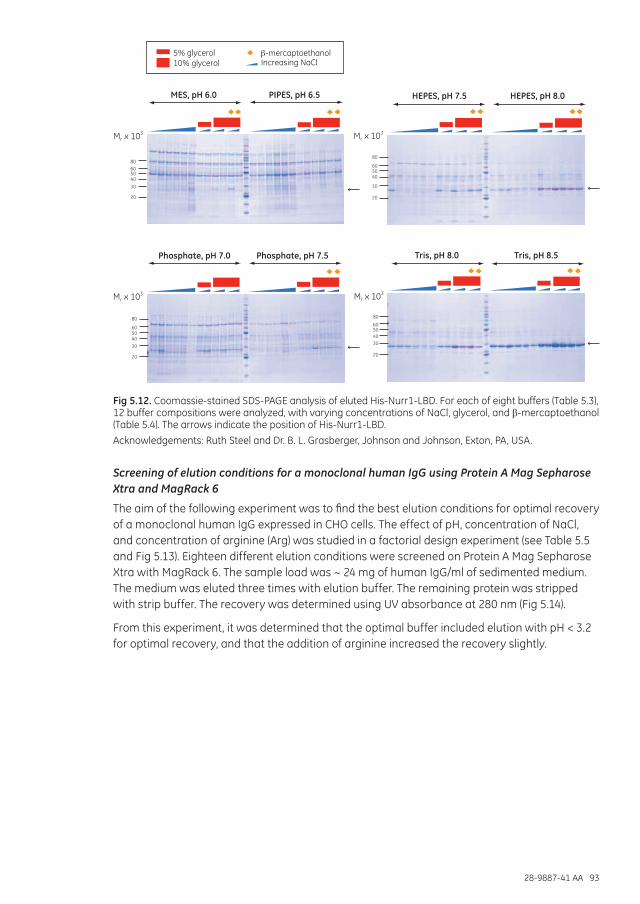
28-9887-41 AA 93
Mr x 103
Mr x 103
Mr x 103
Mr x 103
MES, pH 6.0 PIPES, pH 6.5 HEPES, pH 7.5 HEPES, pH 8.0
Phosphate, pH 7.0 Phosphate, pH 7.5 Tris, pH 8.0 Tris, pH 8.5
Fig 5.12. Coomassie-stained SDS-PAGE analysis of eluted His-Nurr1-LBD. For each of eight buffers (Table 5.3), 12 buffer compositions were analyzed, with varying concentrations of NaCl, glycerol, and β-mercaptoethanol (Table 5.4). The arrows indicate the position of His-Nurr1-LBD.
Acknowledgements: Ruth Steel and Dr. B. L. Grasberger, Johnson and Johnson, Exton, PA, USA.
Screening of elution conditions for a monoclonal human IgG using Protein A Mag Sepharose Xtra and MagRack 6
The aim of the following experiment was to find the best elution conditions for optimal recovery of a monoclonal human IgG expressed in CHO cells. The effect of pH, concentration of NaCl, and concentration of arginine (Arg) was studied in a factorial design experiment (see Table 5.5 and Fig 5.13). Eighteen different elution conditions were screened on Protein A Mag Sepharose Xtra with MagRack 6. The sample load was ~ 24 mg of human IgG/ml of sedimented medium. The medium was eluted three times with elution buffer. The remaining protein was stripped with strip buffer. The recovery was determined using UV absorbance at 280 nm (Fig 5.14).
From this experiment, it was determined that the optimal buffer included elution with pH < 3.2 for optimal recovery, and that the addition of arginine increased the recovery slightly.
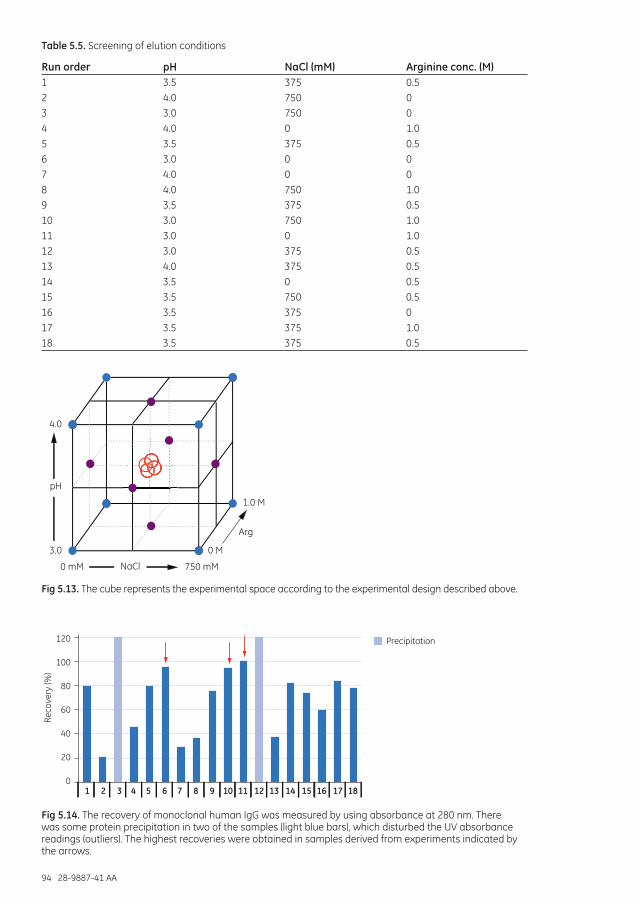
94 28-9887-41 AA
Table 5.5. Screening of elution conditions
Run order pH NaCl (mM) Arginine conc. (M)1 3.5 375 0.5
2 4.0 750 0
3 3.0 750 0
4 4.0 0 1.0
5 3.5 375 0.5
6 3.0 0 0
7 4.0 0 0
8 4.0 750 1.0
9 3.5 375 0.5
10 3.0 750 1.0
11 3.0 0 1.0
12 3.0 375 0.5
13 4.0 375 0.5
14 3.5 0 0.5
15 3.5 750 0.5
16 3.5 375 0
17 3.5 375 1.0
18 3.5 375 0.5
4.0
3.0 0 M
1.0 M
pH
0 mM 750 mMNaCl
Arg
Fig 5.13. The cube represents the experimental space according to the experimental design described above.
120
100
80
60
40
20
0
Reco
very
(%)
1 2 3 4 5 6 7 8 9 10 11 12 13 14 15 16 17 18
Precipitation
Fig 5.14. The recovery of monoclonal human IgG was measured by using absorbance at 280 nm. There was some protein precipitation in two of the samples (light blue bars), which disturbed the UV absorbance readings (outliers). The highest recoveries were obtained in samples derived from experiments indicated by the arrows.

28-9887-41 AA 95
Screening of purification conditions for GST-GFP-(His)6 using His Mag Sepharose Ni and automation
The aim here was to find the best purification conditions for GST-GFP-(His)6. Eight different imidazole concentrations and four different sample loads were screened in triplicate using 1 µl of His Mag Sepharose Ni beads in each well in a 96-well plate handled by a Tecan Freedom EVO robot. The sample was evaluated by absorbance measurements at 400 nm (GFP absorbs strongly at this wavelength) and on an SDS-polyacrylamide gel stained using Deep Purple Protein Stain (Fig 15.5A) and analyzed with ImageQuant™ TL software. Not all data points are shown, because at an imidazole concentration of 200 mM imidazole, no histidine-tagged protein was bound at all. The best balance between yield and purity of the target protein was at a concentration of 40 mM imidazole with a sample load of 50% to 100% of the total binding capacity.
Mr x 103
97
45
66
30
20.1
14.4
25% sample load 50% sample load 75% sample load 100% sample load
GST-GFP-(His) 6
Increasing imidazole 0 - 200 mM
100
90
80
70
60
50
40
30
20
10
00 10 20 40
mM imidazole
60 80 100
Yield
Purity
Purit
y an
d re
lativ
e yi
eld
(%)
A)
B)
Fig 5.15. (A) SDS-polyacrylamide gel image of GST-GFP-(His)6 enriched from a background of E. coli proteins. At each side of the gel are low-molecular-weight markers. Starting material and flowthrough from 75% sample load, 40 mM imidazole are in lanes 2 and 3, respectively. Proteins were detected using Deep Purple Total Protein Stain and a fluorescence scanner. GST-GFP-(His)6 is indicated on the gel by the arrow. The gel image was analyzed with ImageQuant TL. (B) A plot of yield and purity. Very little protein was bound at 200 mM imidazole, so these data points were excluded.
Screening of detergents for solubilizing membrane proteins using His Mag Sepharose Ni
Solubilization of membrane proteins is achieved through the action of detergents, which have different critical micelle concentrations (CMC; see Table 5.6). Temperature and salt can drastically change the CMC value for a given detergent, which will affect the solubilization features of that detergent. The following example (Fig 5.16) shows screening of membrane solubilization with seven detergents. IMAC purification is performed using His Mag Sepharose Ni. Detergents and beads are included in Membrane Protein Purification Kit.

96 28-9887-41 AA
Table 5.6. Seven detergents tested for effect on solubilizing membranes
Detergent CMCLauryldimethylamine-N-oxide (LDAO) 0.02%
Octyl glucoside (OG) 0.53%
Fos-Choline 12 (FOS 12) 0.05%
Decyl Maltoside (DM) 0.09%
Dodecyl Maltoside (DDM) 0.009%
CYMAL™-5 0.12%
Dodecyl octaethyleneglycol ether (C12E8) 0.005%
DDM DM LDAO FOS 12 C12E8 Cymal5 OG
DDM DM LDAO FOS 12 C12E8 Cymal5 OG
0,00
20,00 40,00 60,00 80,00
100,00 120,00
DDM DM LDAO FOS12 C12E8 Cy5 OG
SolubilizationMix membranes + detergent stock solutionIncubate at room temperature for 30 min
ClarificationCentrifuge at 50 000 x g
Purification (IMAC)Collect supernatants and add His Mag Sepharose Ni into each detergent-solubilized membrane protein sample
Analysis of target membrane proteinMeasure and evaluate by use of relevant analytical method(s)
Fig 5.16. Procedure for screening various detergents using the Membrane Protein Purification Kit. Very small amount of samples are needed when using the His Mag Sepharose Ni beads included in the kit.
References1. Manjasetty, B. A. et al. Automated technologies and novel techniques to accelerate protein
crystallography for structural genomics. Proteomics 8, 612-625 (2008).
2. Alterovitz, G. et al. Automation, parallelism, and robotics for proteomics, Proteomics 6, 4016–4022 (2006).
3. Structural Genomics Consortium et al. Protein production and purification. Nat. Methods 5, 135-147 (2008).
4. Joachimiak, A. High-throughput crystallography for structural genomics, Curr. Opin. Struct. Biol. 19, 573-584 (2009).
5. Malawski, G. et al., Identifying protein construct variants with increased crystallization propensity – A case study, Protein Science 15, 2718–2728 (2006).

28-9887-41 AA 97
Appendices
Appendix 1Overview of protein analysis techniques
2-D gel electrophoresis2-D gel electrophoresis is a powerful and widely used technique for the analysis of complex protein mixtures extracted from biological samples. This technique separates proteins according to two independent properties in two discrete steps. The first-dimension step, IEF, separates proteins according to their pI; the second-dimension step, SDS-PAGE, separates proteins according to their MW. Each spot on the resulting two-dimensional gel potentially corresponds to a single protein species in the sample. After first- and second-dimension electrophoresis have been completed, the next step is to visualize the results of 2-D electrophoresis. This can be accomplished by staining the gel (e.g., Coomassie, silver stain, fluorescent stain) or by prelabeling the protein mixture using an isotope or fluorescent dye (e.g., CyDye DIGE dyes from GE Healthcare). A digital image is generally acquired by an imager and analyzed using dedicated software. In this way, thousands of different proteins can be separated, and information such as the protein pI, the apparent molecular weight, and relative amounts of each protein can be obtained. A special form is 2-D DIGE, based on the Ettan DIGE system from GE Healthcare (1); it is based on size- and charge-matched fluorescent dyes for covalent prelabeling of protein mixtures. Three distinct CyDye DIGE dyes—Cy2, Cy3, and Cy5—enable co-electrophoresis of up to three samples on the same gel. This increases throughput and enables the use of an internal standard on each gel to minimize experimental variation.
Analysis of 2-D results can be an end point, but normally gel spots of interest to the analytical purpose are analyzed by MS (generally MALDI-MS) to identify the corresponding proteins (see below). For more information, refer also to 2-D Electrophoresis: Principles and Methods (see the “Related literature” section at the end of this handbook for code number).
MSToday MS is a central technique for protein analysis in research and increasingly also for clinical applications. This started with the invention of ionization techniques compatible with proteins and peptides. Two different techniques are available to create an ion source that can transform proteins and peptides into gas phase ions: MALDI and ESI. By combining an ion source with mass analyzers of different kinds (time-of-flight [ToF], ion trap, quadropole, and ion cyclotrone or hybrid combinations thereof) the molecular species present are separated in gas phase and detected with accurate mass values. Some of these mass analyzers (tandem mass spectrometers, or MS/MS) are also capable of selecting specific ions and initiating structure-specific fragmentation followed by mass measurement of the resulting ions. Currently, bottom-up approaches are most common for detailed analysis. Proteins are treated (digested) with sequence-specific proteases (commonly trypsin) to generate peptide mixtures that are then interrogated to build up information about the original proteins present. Three main modes of MS based on this approach can be defined:
1. Protein identification of 2-D gel spots
Gel spots of interest are excised from the gel, in-gel digested and made compatible with the selected ionization technique. Normally, identification is performed using the process of peptide mass fingerprinting (PMF) on MALDI-ToF instruments. In PMF, a list of peptide masses are compared to theoretical lists generated from sequence databases. Based on the
98 28-9887-41 AA
degree of similarity, protein identities are assigned with different degrees of probability. This approach is only valid for pure proteins, and the more stringent process of using sequence-specific fragmentation data is increasingly replacing PMF for identification (for example using MALDI-ToF/ToF).
2. Global LC-MS/MS
Protein mixtures are digested and fed to tandem mass spectrometers after separation of the peptide mixtures using nano-LC (generally RPC or a combination of IEX and RPC). Protein identification is enabled by acquiring sequence-specific fragmentation data from the eluted peptides. Mass spectrometers with fast scan rates are used to enable interrogation of as many peptides as possible at each point in the chromatogram. Generally, samples are labeled (either at the protein or peptide level) with isotope-coded tags, and depending on the technique used, two or more samples are merged before analysis. By comparing peak areas (MS or MS/MS level) for peptides that are identical except for their different tags, relative quantitation data can be extracted.
3. Targeted LC-MS/MS
In contrast to the global approach, targeted LC-MS/MS analysis is tailored for a defined set of proteins. For each targeted protein, one or a few tryptic peptides are selected as quantitation probes. Optimally, probes should be proteotypic (present in only one protein in the assayed sample) and have favorable analytical properties. To achieve absolute quantitation, an internal standardization approach is used; stable isotope-labeled analogs of the proteotypic peptides are spiked into the samples in defined amounts before LC-MS/MS analysis. Spiked samples are separated in similar ways as in global approaches, but mass spectrometers can be programmed to focus on the defined proteotypic peptides only. Instrument types (i.e., triple quadropole) capable of selected reaction monitoring (SRM) are especially suitable in this approach. Signals from specific fragmentation transitions (pairs of intact peptide ion/fragment ion) are monitored, whereby quantitation accuracy, sensitivity, and dynamic range can be improved compared with global approaches.
As high-performance mass spectrometers continue to evolve, top-down approaches to protein analysis in complex samples are starting to emerge (2, 3). Full-length proteins are introduced and their structure deduced by complex fragmentation reactions in the gas phase. However, sensitivity is substantially lower compared with bottom-up approaches, and large proteins or truly complex mixtures cannot currently be handled.
Western blottingWestern blotting—also known as “protein blotting” or “immunoblotting”—is a well-established technique used to detect a target protein in a mixture of proteins. This technique can determine the expression levels of the target protein in selected cells or tissues, either under normal or experimental conditions. Compared with ELISA-like techniques, a wider range of proteins can potentially be targeted for detection, because denaturing conditions can be utilized during extraction. Proteins in a mixture are first separated by electrophoresis, generally by MW using 1-D PAGE. The proteins are then transferred (blotted) from the gel to a membrane (nitrocellulose or PVDF) for easier handling and manipulation. Following the blotting step, the target protein is probed using antibodies. The primary antibody, which is specific for the target protein, can be labeled or unlabeled. To maximize sensitivity and signal-to-noise ratio, most Western blotting procedures use an unlabeled primary antibody and a conjugated or labeled secondary antibody (the secondary antibody is specific for the primary antibody). The secondary antibody can be labeled with a fluorescent dye or conjugated with an enzyme. Typical enzymes used are horseradish peroxidase (HRP) and alkaline phosphatase (AP), both of which use a detection reagent to generate a signal that can be quantitated. The signal can be the production of an insoluble

28-9887-41 AA 99
dye (chromogenic) or the generation of light (chemiluminescent or chemifluorescent). Finally, proteins are detected using the appropriate detection reagents to generate a signal that can be quantitated. For chromogenic techniques, the signal is captured directly on the membrane. For fluorescent, chemiluminescent, or chemifluorescent techniques, the signal is captured using an imaging system. The acquired image is quantitated using image-analysis software.
References1. Marouga, R. et al. The development of the DIGE system: 2D fluorescence difference gel
analysis technology. Anal. Bioanal. Chem. 382, 669-678 (2005).
2. Kelleher, N. L. Top-down proteomics. Anal. Chem. 76 197A–203A (2004).
3. Sze, S. K. et al. Top-down mass spectrometry of a 29-kDa protein for characterization of any posttranslational modification to within one residue. Proc. Natl. Acad. Sci. U.S.A. 99 1774–1779 (2002).

100 28-9887-41 AA
Appendix 2 Protein determination
Proteins generally have UV absorbance maxima at 190 nm caused by the peptide bonds and at 280 nm caused by the aromatic amino acids Trp and Tyr. Protein structure (secondary, tertiary, and quaternary) and solution conditions (e.g., pH, ionic strength) may affect the absorbance spectrum. Coenzymes and cofactors may introduce absorbance at other wavelengths.
The absorbance is proportional to the protein concentration, c:
A = c × E × l
where A = absorbance, E = absorbance coefficient, and l = path length of the cuvette in cm. E varies greatly for different proteins. Absorbance at 280 nm (A280) is typically used for concentration determination.
Some proteins, however, lack Trp and Tyr amino acid residues and therefore do not give absorbance at 280 nm. For these proteins, measurement can be made at 205 nm (absorbance from peptide bonds). This value is used instead of the maximum at 190 nm because various technical limitations may be introduced at this low wavelength. In addition to peptide bonds some amino acid side chains also contribute to absorbance at 205 nm. For a detailed protocol, refer to Current Protocols in Protein Science, Unit 3.1 (Spectrophotometric Determination of Protein Concentration), John Wiley and Sons, Inc. (date varies, as it is updated regularly).
Absorbance measurementsAbsorbance should be measured within the linear range of the absorbance photometer. Keeping the values between 0.2 and 1.0 is recommended, but absorbance values of up to 1.5 to 2 can sometimes be used (see the manual for the instrument used). If higher values are obtained, dilute the sample. A quartz cuvette, or a plastic cuvette or multiwell plates made for UV measurement, should be used. Remember to correct for the pathlength of the cuvette. Fill enough sample to cover the light path.
1. Prepare the instrument. Warming up may take some time.
2. Measure A280 for the buffer used (blank).
3. Measure A280 for the protein sample. If the value is above the limit for the instrument, dilute the sample.
4. For correction of light scattering contribution at A280, also measure A330 for the protein sample and correct as described on the following page.
Protein concentration calculationsThe protein concentration, c, in mg/ml is calculated by:
c = A280/(E280,1 mg/ml) × l)
The absorbance coefficient (E280,1 mg/ml) corresponds to the A280 of a 1 mg/ml solution of the protein and varies between proteins. E280,1 mg/ml can be determined 1) by measuring the absorbance of the protein in a solution of known concentration or 2) by the theoretical calculation:
E280, 1 mg/ml = (5500nTrp + 1490nTyr + 125nS-S)/M
where nTrp, nTyr and nS-S are the number of Trp and Tyr residues, nS-S is the number of disulfide bonds (S-S bonds) in the protein sequence, and M is the molecular weight of the protein. Coenzymes and cofactors may also contribute. Examples of values for E280, 1 mg/ml include 0.67 for BSA, 1.37 for IgG, and 2.64 for lysozyme.

28-9887-41 AA 101
Light scattering correction of the A280 value can be made by:
A280 = A280 (measured) – 1.929 × A330 (measured)
Nucleic acids have absorbance at 280 nm (maximum at 260 nm). If the presence of nucleic acids is suspected, the protein concentration can be estimated (with less accuracy) according to Christian, W. and Warburg, O. Biochemische Zeitung 310, 384 (1941):
C (mg/ml) = 1.55 × A280 - 0.76 × A260
The constants 1.55 and 0.76 refer to a specific protein used by Christian and Warburg. For best accuracy, the factors should be determined for the target protein at hand. Refer to the NanoVue Plus User Manual, Code No. 28-9574-75 AD from GE Healthcare.
Make sure that plastic cuvettes or multiwell plates are suitable for UV absorbance measurements and that the cuvette surface is kept clean on the outside.
The sample should be free from particles or opalescence. Remove particles by centrifugation or filtration.
Adding cold solutions into the cuvette may cause fogging of the cuvette surface, and warming of a solution in the cuvette may cause air bubbles.
Purity determination by SDS-PAGE analysis
Reagents required
6× SDS loading buffer: 0.35 M Tris-HCl (pH 6.8), 10.28% (w/v) SDS, 36% (v/v) glycerol, 0.6 M DTT (or 5% β-mercaptoethanol), 0.012% (w/v) bromophenol blue. Store in 0.5 ml aliquots at -80°C.
1. Add 2 µl of 6× SDS loading buffer to 5 to 10 µl of supernatant from crude extracts, cell lysates, or purified fractions as appropriate.
2. Vortex briefly and heat for 5 min at between 90°C and 100°C.
3. Load the samples onto an SDS-polyacrylamide gel.
4. Run the gel and stain with Coomassie Blue or silver stain (PlusOne Silver Staining Kit).
The percentage of acrylamide in the SDS-gel should be selected according to the expected molecular weight of the protein of interest (see Table A2.1).
Table A2.1. Relationship between percentage acrylamide in SDS gel and Mr of the protein
Percentage acrylamide in resolving gel Separation size range (Mr x 103)
Single percentage: 5% 36–200
7.5% 24–200
10% 14–200
12.5% 14–100
15% 14–601
Gradient: 5–15% 14–200
5–20% 10–200
10–20% 10–1501 Larger proteins fail to move significantly into the gel
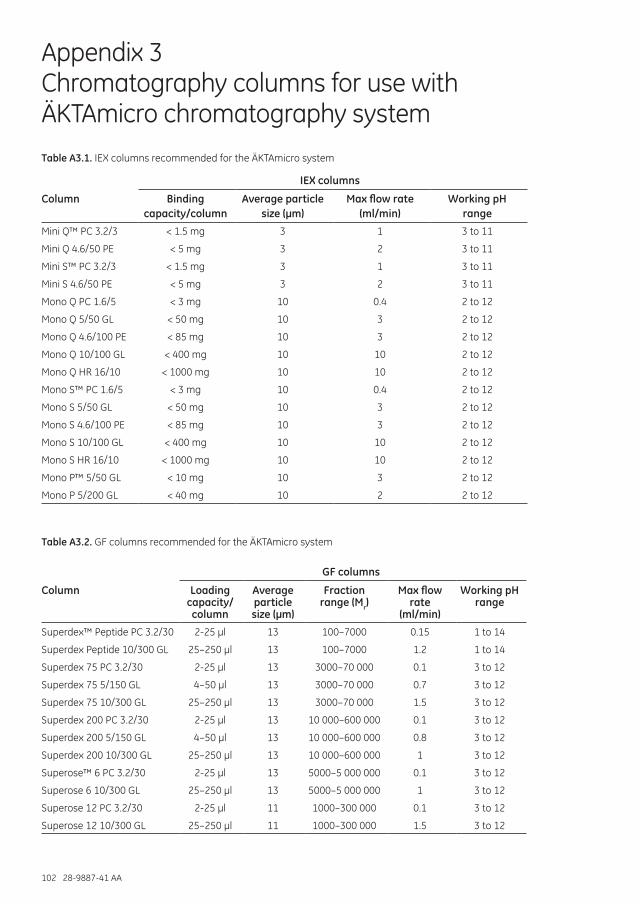
102 28-9887-41 AA
Appendix 3 Chromatography columns for use with ÄKTAmicro chromatography system
Table A3.1. IEX columns recommended for the ÄKTAmicro system
IEX columns
Column Binding capacity/column
Average particle size (µm)
Max flow rate (ml/min)
Working pH range
Mini Q™ PC 3.2/3 < 1.5 mg 3 1 3 to 11
Mini Q 4.6/50 PE < 5 mg 3 2 3 to 11
Mini S™ PC 3.2/3 < 1.5 mg 3 1 3 to 11
Mini S 4.6/50 PE < 5 mg 3 2 3 to 11
Mono Q PC 1.6/5 < 3 mg 10 0.4 2 to 12
Mono Q 5/50 GL < 50 mg 10 3 2 to 12
Mono Q 4.6/100 PE < 85 mg 10 3 2 to 12
Mono Q 10/100 GL < 400 mg 10 10 2 to 12
Mono Q HR 16/10 < 1000 mg 10 10 2 to 12
Mono S™ PC 1.6/5 < 3 mg 10 0.4 2 to 12
Mono S 5/50 GL < 50 mg 10 3 2 to 12
Mono S 4.6/100 PE < 85 mg 10 3 2 to 12
Mono S 10/100 GL < 400 mg 10 10 2 to 12
Mono S HR 16/10 < 1000 mg 10 10 2 to 12
Mono P™ 5/50 GL < 10 mg 10 3 2 to 12
Mono P 5/200 GL < 40 mg 10 2 2 to 12
Table A3.2. GF columns recommended for the ÄKTAmicro system
GF columns
Column Loading capacity/column
Average particle size (µm)
Fraction range (Mr)
Max flow rate
(ml/min)
Working pH range
Superdex™ Peptide PC 3.2/30 2-25 µl 13 100–7000 0.15 1 to 14
Superdex Peptide 10/300 GL 25–250 µl 13 100–7000 1.2 1 to 14
Superdex 75 PC 3.2/30 2-25 µl 13 3000–70 000 0.1 3 to 12
Superdex 75 5/150 GL 4–50 µl 13 3000–70 000 0.7 3 to 12
Superdex 75 10/300 GL 25–250 µl 13 3000–70 000 1.5 3 to 12
Superdex 200 PC 3.2/30 2-25 µl 13 10 000–600 000 0.1 3 to 12
Superdex 200 5/150 GL 4–50 µl 13 10 000–600 000 0.8 3 to 12
Superdex 200 10/300 GL 25–250 µl 13 10 000–600 000 1 3 to 12
Superose™ 6 PC 3.2/30 2-25 µl 13 5000–5 000 000 0.1 3 to 12
Superose 6 10/300 GL 25–250 µl 13 5000–5 000 000 1 3 to 12
Superose 12 PC 3.2/30 2-25 µl 11 1000–300 000 0.1 3 to 12
Superose 12 10/300 GL 25–250 µl 11 1000–300 000 1.5 3 to 12

28-9887-41 AA 103
Table A3.3. RPC columns recommended for the ÄKTAmicro system
RPC columns
Column Loading capacity/column
Average particle size
(µm)
Max flow rate (ml/min)
Working pH range
SOURCE™ 5RPC ST 4.6/150 200 mg bacitracin 5 1 1 to 12
SOURCE 15RPC ST 4.6/100 17 mg BSA 15 2.5 1 to 12
RESOURCE™ RPC 1 ml 10 mg BSA 15 10 1 to 12
RESOURCE RPC 3 ml 30 mg BSA 15 10 1 to 12
µRPC C2/C18 ST 4.6/100 9 mg proteins/peptides 3 1.2 2 to 8

104 28-9887-41 AA
Appendix 4 Characteristics of Vivaspin sample concentrators
Vivaspin concentrators are designed for use with biological fluids and aqueous solutions. Compatible pH range is pH 1 to 9. For chemical compatibility details, see Table A4.1. For maximum sample volume, recommended maximum centrifugation speeds, and performance characteristics, see Tables A4.2 to A4.7.
Table A4.1. Vivaspin chemical compatibility (2 h contact time)
Solution Compatibility1 Solution Compatibility1
Acetic acid (25%) Yes Mercaptoethanol (1 M) No
Acetone (10%) No Nitric acid (10%) Yes
Acetonitrile (10%) No Phosphate buffer (1 M) Yes
Ammonium sulfate (saturated) Yes PEG (10%) Yes
Benzene (100%) No Pyridine (100%) No
Chloroform (1%) No Sodium carbonate (20%) Yes
Dimethyl sulfoxide (5%) Yes Sodium deoxycholate (5%) Yes
Ethanol (70%) Yes SDS (0.1 M) Yes
Ethyl acetate (100%) No Sodium hydroxide (2.5 M) No
Formaldehyde (30%) Yes Sodium hypochlorite (200 ppm) Yes
Formic acid (5%) Yes Sodium nitrate (1%) Yes
Glycerine (70%) Yes Sulfamic acid (5%) Yes
Guanidine HCl (6 M) Yes Tetrahydrofuran (5%) No
Hydrocarbons, aromatic No Toluene (1%) No
Hydrocarbons, chlorinated No Trifluoroacetic acid (10%) Yes
Hydrochloric acid (1 M) Yes Tween 20 (0.1%) Yes
Imidazole (300 mM) Yes Triton X-100 (0.1%) Yes
Isopropanol (70%) Yes Urea (8 M) Yes
Lactic acid (5%) Yes1 Yes indicates chemical compatibility and No indicates chemical incompatibility and that the solution is not recommended

28-9887-41 AA 105
Table A4.2. Maximum sample volumes for di�erent Vivaspin concentrators
Vivaspin Fixed angle Swing bucket
500 500 µl Do not use 2 2 ml 3 ml 6 6 ml 6 ml 20 14 ml 20 ml
Table A4.3. Recommended maximum centrifugation speed (× g) for di�erent Vivaspin concentrators
Vivaspin 500 Vivaspin 2 Vivaspin 6 Vivaspin 20Fixed angle 3 000-50 000 MWCO 15 000 12 000 10 000 8 000 100 000 MWCO 15 000 9 000 6 000 6 000
Swing bucket 3 000-50 000 MWCO N.A. 4 000 4 000 5 000 100 000 MWCO N.A. 4 000 4 000 3 000
Table A4.4. Performance characteristics of Vivaspin 500
Protein/filter Up to 30× sample Recovery concentration1
Aprotinin 0.25 mg/ml (6500 MW) 3 000 MWCO 30 min 96%
BSA 1.0 mg/ml (66 000 MW) 5 000 MWCO 15 min 96% 10 000 MWCO 5 min 96% 30 000 MWCO 5 min 95%
IgG 0.25 mg/ml (160 000 MW) 30 000 MWCO 10 min 96% 50 000 MWCO 10 min 96% 100 000 MWCO 10 min 96%1 Centrifugation time to achieve an up to 30× sample concentration with a start volume of 500 µl at 20°C.
Table A4.5. Performance characteristics of Vivaspin 2
Protein/filter Up to 30× sample Recovery concentration1
Aprotinin 0.25 mg/ml (6500 MW) 3 000 MWCO 50 min 96%
BSA 1.0 mg/ml (66 000 MW) 5 000 MWCO 12 min 98% 10 000 MWCO 8 min 98% 30 000 MWCO 8 min 97%
IgG 0.25 mg/ml (160 000 MW) 30 000 MWCO 10 min 96% 50 000 MWCO 10 min 96% 100 000 MWCO 8 min 95%1 Centrifugation time to achieve an up to 30× sample concentration with a start volume of 2 ml at 20°C.

106 28-9887-41 AA
Table A4.6. Performance characteristics of Vivaspin 6
Protein/filter Up to 30× sample concentration1 Swing Recovery 25º Fixed Recovery bucket angleCytochrome C 0.25 mg/ml (12 400 MW) 3 000 MWCO - - 90 min 97%
BSA 1.0 mg/ml (66 000 MW) 5 000 MWCO 20 min 98% 12 min 98% 10 000 MWCO 13 min 98% 10 min 98% 30 000 MWCO 12 min 98% 9 min 97%
IgG 0.25 mg/ml (160 000 MW) 30 000 MWCO 18 min 96% 15 min 95% 50 000 MWCO 17 min 96% 14 min 95% 100 000 MWCO 15 min 91% 12 min 91%1 Centrifugation time to achieve an up to 30× sample concentration with a start volume of 6 ml at 20°C.
Table A4.7. Performance characteristics of Vivaspin 20
Protein/filter Up to 30× sample concentration1 Swing Recovery 25º Fixed Recovery bucket angleCytochrome C 0.25 mg/ml (12 400 MW) 3 000 MWCO 110 min 97% 180 min 96%
BSA 1.0 mg/ml (66 000 MW) 5 000 MWCO 23 min 99% 29 min 99% 10 000 MWCO 16 min 98% 17 min 98% 30 000 MWCO 13 min 98% 15 min 98%
IgG 0.25 mg/ml (160 000 MW) 30 000 MWCO 27 min 97% 20 min 95% 50 000 MWCO 27 min 96% 22 min 95% 100 000 MWCO 25 min 91% 20 min 90%1 Centrifugation time to achieve an up to 30× sample concentration with a start volume of 20 ml (swing bucket rotor)
or 14 ml (fixed angle 25° rotor) at 20°C.

28-9887-41 AA 107
Appendix 5 Characteristics of PD products prepacked with Sephadex G-25
Table A5.1. Characteristics of PD products prepacked with Sephadex G-25
PD MultiTrap G-25
PD SpinTrap G-25
PD MiniTrap G-25
PD MidiTrap G-25
PD-10 Desalting Columns
Volume of prepacked medium
500 µl/well 700 µl 2.1 ml 3.45 ml 8.3 ml
Packed bed dimensions
0.97 × 2.8 cm 1.3 × 2.6 cm 1.45 × 5.0 cm
Well/column volume
800 µl 1000 µl 5 ml 8.5 ml 13. 5 ml
Void volume ~ 150 µl ~ 200 µl ~ 0.5 ml ~ 1.0 ml 2.5 ml
Maximum sample volume
130 µl 180 µl 0.5 ml 1.0 ml 2.5 ml
Volume of eluted sample (gravity)
1.0 ml 1.5 ml 3.5 ml
Volume of eluted sample (spin)1
130 µl 180 µl 0.5 ml 1.0 ml 2.5 ml
Recovery2 70% to 90% 70% to 90% 70% to 95% 70% to 95% 70% to > 95%
Desalting capacity
> 85% > 85% > 90% > 90% > 90%
Plate/column material
polypropyleneand
polyethylene
polypropyleneand
polyethylene
polypropyleneand
polyethylene
polypropyleneand
polyethylene
polypropyleneand
polyethylene
Storage solution 20% ethanol 0.05% KathonTM 0.15% Kathon 0.15% Kathon 0.15% Kathon
Storage temperature
4°C to 30°C 4°C to 30°C 4°C to 30°C 4°C to 30°C 4°C to 30°C
1 Applied volume = eluted volume2 Biomolecule dependent
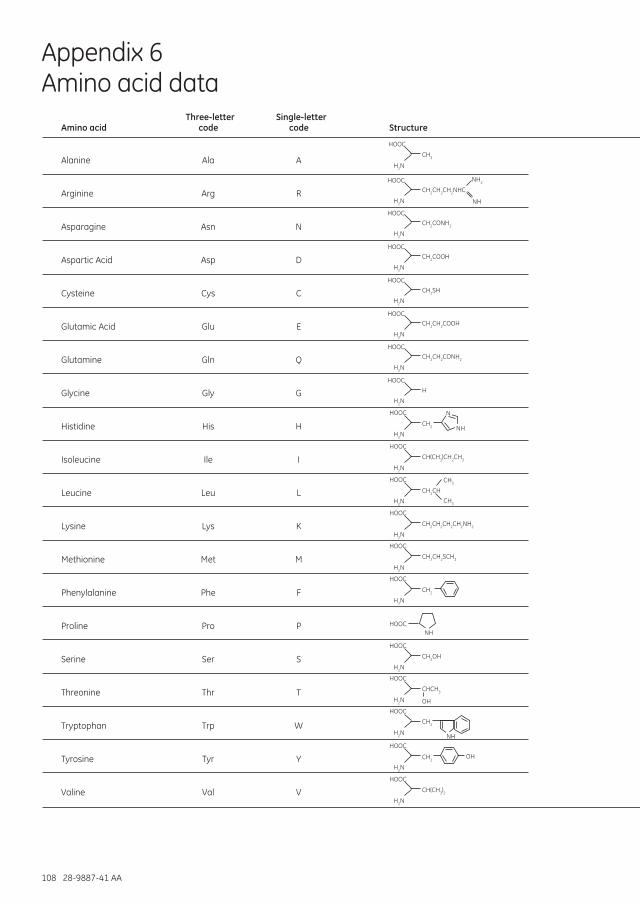
108 28-9887-41 AA
Appendix 6 Amino acid data
Three-letter Single-letter Amino acid code code Structure
Alanine Ala A
Arginine Arg R
Asparagine Asn N
Aspartic Acid Asp D
Cysteine Cys C
Glutamic Acid Glu E
Glutamine Gln Q
Glycine Gly G
Histidine His H
Isoleucine Ile I
Leucine Leu L
Lysine Lys K
Methionine Met M
Phenylalanine Phe F
Proline Pro P
Serine Ser S
Threonine Thr T
Tryptophan Trp W
Tyrosine Tyr Y
Valine Val V
CH3
HOOC
H2N
HOOC
H2N
HOOC
H2N
HOOC
H2N
HOOC
H2N
HOOC
H2N
HOOC
H2N
HOOC
H2N
HOOC
H2N
HOOC
H2N
HOOC
H2N
HOOC
H2N
HOOC
H2N
HOOC
H2N
HOOC
HOOC
H2N
CH2CH2CH2NHC
NH2
NH
CH2CONH2
CH2COOH
CH2SH
CH2CH2COOH
CH2CH2CONH2
H
CH2
CH(CH3)CH2CH3
CH2CH
CH3
CH3
CH2CH2CH2CH2NH2
CH2CH2SCH3
CH2
HOOC
H2N
HOOC
H2N
HOOC
H2N
CH2OH
CHCH3
OH
CH2
CH(CH3)2
HOOC
H2N
OHCH2
NH
NH
N
NH
Middle unit residue (-H20) Charge at Hydrophobic Uncharged Hydrophilic
Formula Mr Formula Mr pH 6.0–7.0 (nonpolar) (polar) (polar)
C3H7NO2 89.1 C3H5NO 71.1 Neutral
C6H14N4O2 174.2 C6H12N4O 156.2 Basic (+ve)
C4H8N2O3 132.1 C4H6N2O2 114.1 Neutral
C4H7NO4 133.1 C4H5NO3 115.1 Acidic (-ve)
C3H7NO2S 121.2 C3H5NOS 103.2 Neutral
C5H9NO4 147.1 C5H7NO3 129.1 Acidic (-ve)
C5H10N2O3 146.1 C5H8N2O2 128.1 Neutral
C2H5NO2 75.1 C2H3NO 57.1 Neutral
C6H9N3O2 155.2 C6H7N3O 137.2 Basic (+ve)
C6H13NO2 131.2 C6H11NO 113.2 Neutral
C6H13NO2 131.2 C6H11NO 113.2 Neutral
C6H14N2O2 146.2 C6H12N2O 128.2 Basic (+ve)
C5H11NO2S 149.2 C5H9NOS 131.2 Neutral
C9H11NO2 165.2 C9H9NO 147.2 Neutral
C5H9NO2 115.1 C5H7NO 97.1 Neutral
C3H7NO3 105.1 C3H5NO2 87.1 Neutral
C4H9NO3 119.1 C4H7NO2 101.1 Neutral
C11H12N2O2 204.2 C11H10N2O 186.2 Neutral
C9H11NO3 181.2 C9H9NO2 163.2 Neutral
C5H11NO2 117.1 C5H9NO 99.1 Neutral

28-9887-41 AA 109
Appendix 6 Amino acid data
Three-letter Single-letter Amino acid code code Structure
Alanine Ala A
Arginine Arg R
Asparagine Asn N
Aspartic Acid Asp D
Cysteine Cys C
Glutamic Acid Glu E
Glutamine Gln Q
Glycine Gly G
Histidine His H
Isoleucine Ile I
Leucine Leu L
Lysine Lys K
Methionine Met M
Phenylalanine Phe F
Proline Pro P
Serine Ser S
Threonine Thr T
Tryptophan Trp W
Tyrosine Tyr Y
Valine Val V
CH3
HOOC
H2N
HOOC
H2N
HOOC
H2N
HOOC
H2N
HOOC
H2N
HOOC
H2N
HOOC
H2N
HOOC
H2N
HOOC
H2N
HOOC
H2N
HOOC
H2N
HOOC
H2N
HOOC
H2N
HOOC
H2N
HOOC
HOOC
H2N
CH2CH2CH2NHC
NH2
NH
CH2CONH2
CH2COOH
CH2SH
CH2CH2COOH
CH2CH2CONH2
H
CH2
CH(CH3)CH2CH3
CH2CH
CH3
CH3
CH2CH2CH2CH2NH2
CH2CH2SCH3
CH2
HOOC
H2N
HOOC
H2N
HOOC
H2N
CH2OH
CHCH3
OH
CH2
CH(CH3)2
HOOC
H2N
OHCH2
NH
NH
N
NH
Middle unit residue (-H20) Charge at Hydrophobic Uncharged Hydrophilic
Formula Mr Formula Mr pH 6.0–7.0 (nonpolar) (polar) (polar)
C3H7NO2 89.1 C3H5NO 71.1 Neutral
C6H14N4O2 174.2 C6H12N4O 156.2 Basic (+ve)
C4H8N2O3 132.1 C4H6N2O2 114.1 Neutral
C4H7NO4 133.1 C4H5NO3 115.1 Acidic (-ve)
C3H7NO2S 121.2 C3H5NOS 103.2 Neutral
C5H9NO4 147.1 C5H7NO3 129.1 Acidic (-ve)
C5H10N2O3 146.1 C5H8N2O2 128.1 Neutral
C2H5NO2 75.1 C2H3NO 57.1 Neutral
C6H9N3O2 155.2 C6H7N3O 137.2 Basic (+ve)
C6H13NO2 131.2 C6H11NO 113.2 Neutral
C6H13NO2 131.2 C6H11NO 113.2 Neutral
C6H14N2O2 146.2 C6H12N2O 128.2 Basic (+ve)
C5H11NO2S 149.2 C5H9NOS 131.2 Neutral
C9H11NO2 165.2 C9H9NO 147.2 Neutral
C5H9NO2 115.1 C5H7NO 97.1 Neutral
C3H7NO3 105.1 C3H5NO2 87.1 Neutral
C4H9NO3 119.1 C4H7NO2 101.1 Neutral
C11H12N2O2 204.2 C11H10N2O 186.2 Neutral
C9H11NO3 181.2 C9H9NO2 163.2 Neutral
C5H11NO2 117.1 C5H9NO 99.1 Neutral

110 28-9887-41 AA
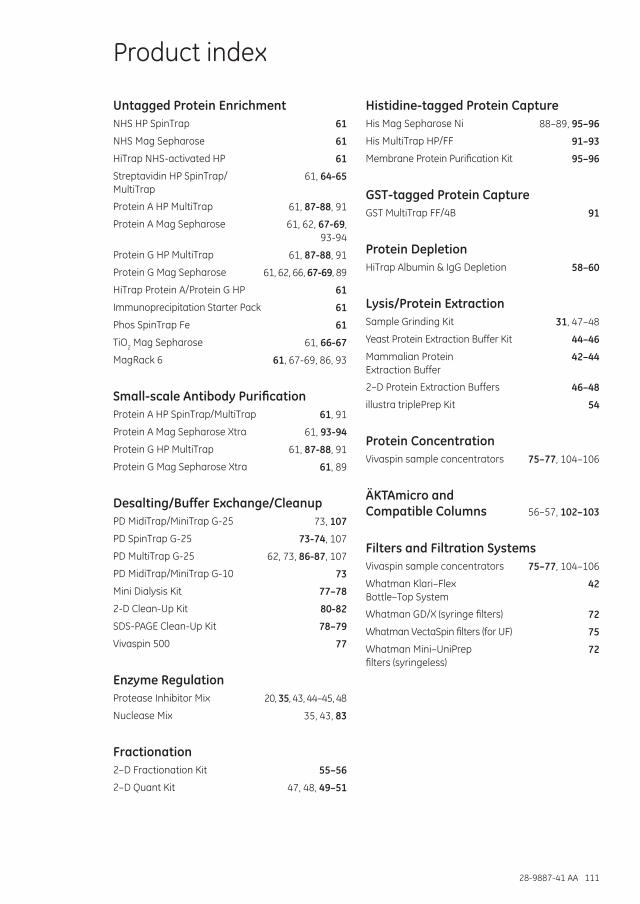
28-9887-41 AA 111
Product index
Untagged Protein EnrichmentNHS HP SpinTrap 61
NHS Mag Sepharose 61
HiTrap NHS-activated HP 61
Streptavidin HP SpinTrap/MultiTrap
61, 64-65
Protein A HP MultiTrap 61, 87-88, 91
Protein A Mag Sepharose 61, 62, 67-69, 93-94
Protein G HP MultiTrap 61, 87-88, 91
Protein G Mag Sepharose 61, 62, 66, 67-69, 89
HiTrap Protein A/Protein G HP 61
Immunoprecipitation Starter Pack 61
Phos SpinTrap Fe 61
TiO2 Mag Sepharose 61, 66-67
MagRack 6 61, 67-69, 86, 93
Small-scale Antibody PurificationProtein A HP SpinTrap/MultiTrap 61, 91
Protein A Mag Sepharose Xtra 61, 93-94
Protein G HP MultiTrap 61, 87-88, 91
Protein G Mag Sepharose Xtra 61, 89
Desalting/Buffer Exchange/CleanupPD MidiTrap/MiniTrap G-25 73, 107
PD SpinTrap G-25 73-74, 107
PD MultiTrap G-25 62, 73, 86-87, 107
PD MidiTrap/MiniTrap G-10 73
Mini Dialysis Kit 77–78
2-D Clean-Up Kit 80-82
SDS-PAGE Clean-Up Kit 78–79
Vivaspin 500 77
Enzyme RegulationProtease Inhibitor Mix 20, 35, 43, 44–45, 48
Nuclease Mix 35, 43, 83
Fractionation2–D Fractionation Kit 55–56
2–D Quant Kit 47, 48, 49–51
Histidine-tagged Protein CaptureHis Mag Sepharose Ni 88–89, 95–96
His MultiTrap HP/FF 91–93
Membrane Protein Purification Kit 95–96
GST-tagged Protein CaptureGST MultiTrap FF/4B 91
Protein DepletionHiTrap Albumin & IgG Depletion 58–60
Lysis/Protein ExtractionSample Grinding Kit 31, 47–48
Yeast Protein Extraction Buffer Kit 44–46
Mammalian Protein Extraction Buffer
42–44
2–D Protein Extraction Buffers 46–48
illustra triplePrep Kit 54
Protein ConcentrationVivaspin sample concentrators 75–77, 104–106
ÄKTAmicro and Compatible Columns 56–57, 102–103
Filters and Filtration SystemsVivaspin sample concentrators 75–77, 104–106
Whatman Klari–Flex Bottle–Top System
42
Whatman GD/X (syringe filters) 72
Whatman VectaSpin filters (for UF) 75
Whatman Mini–UniPrep filters (syringeless)
72
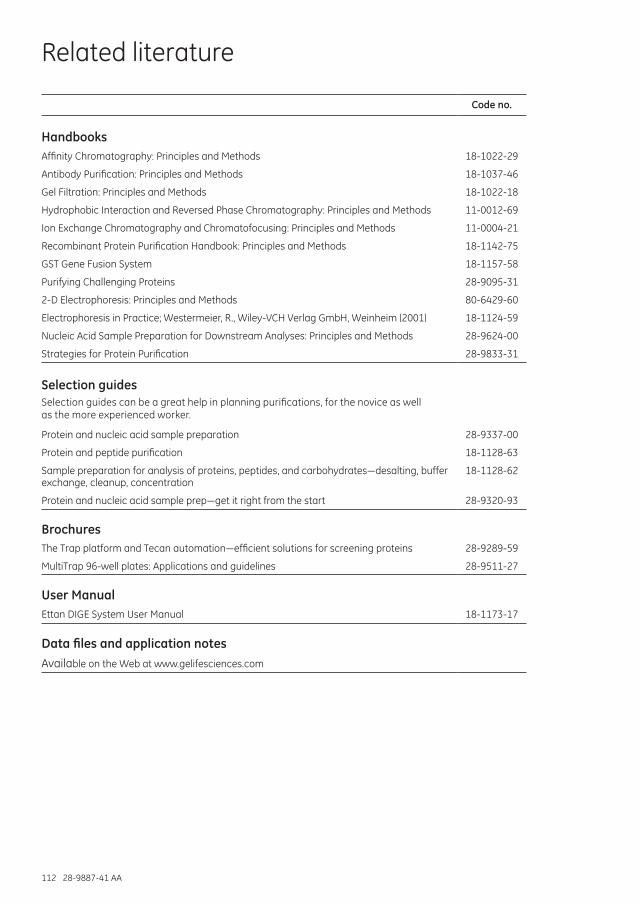
112 28-9887-41 AA
Related literature
Code no.
HandbooksAffinity Chromatography: Principles and Methods 18-1022-29
Antibody Purification: Principles and Methods 18-1037-46
Gel Filtration: Principles and Methods 18-1022-18
Hydrophobic Interaction and Reversed Phase Chromatography: Principles and Methods 11-0012-69
Ion Exchange Chromatography and Chromatofocusing: Principles and Methods 11-0004-21
Recombinant Protein Purification Handbook: Principles and Methods 18-1142-75
GST Gene Fusion System 18-1157-58
Purifying Challenging Proteins 28-9095-31
2-D Electrophoresis: Principles and Methods 80-6429-60
Electrophoresis in Practice; Westermeier, R., Wiley-VCH Verlag GmbH, Weinheim (2001) 18-1124-59
Nucleic Acid Sample Preparation for Downstream Analyses: Principles and Methods 28-9624-00
Strategies for Protein Purification 28-9833-31
Selection guidesSelection guides can be a great help in planning purifications, for the novice as well as the more experienced worker.
Protein and nucleic acid sample preparation 28-9337-00
Protein and peptide purification 18-1128-63
Sample preparation for analysis of proteins, peptides, and carbohydrates—desalting, buffer exchange, cleanup, concentration
18-1128-62
Protein and nucleic acid sample prep—get it right from the start 28-9320-93
BrochuresThe Trap platform and Tecan automation—efficient solutions for screening proteins 28-9289-59
MultiTrap 96-well plates: Applications and guidelines 28-9511-27
User ManualEttan DIGE System User Manual 18-1173-17
Data files and application notesAvailable on the Web at www.gelifesciences.com

28-9887-41 AA 113
Ordering information
Quantity Code no.
Untagged Protein EnrichmentNHS HP SpinTrap 5 ml bulk medium and 24 empty
SpinTrap columns28-9031-28
NHS Mag Sepharose 1 × 500 µl 4 × 500 µl
28-9440-09 28-9513-80
HiTrap NHS-activated HP 5 × 1 ml columns 17-0716-01
NHS HP SpinTrap Buffer Kit 1 28-9135-69
Streptavidin HP SpinTrap 16 × 100 µl columns 28-9031-30
Streptavidin HP SpinTrap Buffer Kit 1 28-9135-68
Streptavidin HP MultiTrap 4 × 96-well plates; 50 µl/well 28-9031-31
Protein A HP SpinTrap 16 × 100 µl columns 28-9031-32
Protein A HP MultiTrap 4 × 96-well plates; 50 µl/well 28-9031-33
Protein A Mag Sepharose 1 × 500 µl 4 × 500 µl
28-9440-06 28-9513-78
HiTrap Protein A HP 5 × 1 ml columns 17-0402-01
HiTrap rProtein A FF 5 × 1 ml columns 17-5079-01
Protein G HP SpinTrap 16 × 100 µl columns 28-9031-34
Protein A/G HP SpinTrap Buffer Kit 1 28-9135-67
Protein G HP MultiTrap 4 × 96-well plates; 50 µl/well 28-9031-35
Protein G Mag Sepharose 1 × 500 µl 4 × 500 µl
28-9440-08 28-9513-79
HiTrap Protein G HP 5 × 1 ml columns 17-0404-01
Ab SpinTrap 50 × 100 µl columns 28-4083-47
Immunoprecipitation Starter Pack 1 17-6002-35
Phos SpinTrap Fe 2,5 ml bulk medium and 24 empty SpinTrap column
28-9298-81
TiO2 Mag Sepharose 1 × 500 µl
4 × 500 µl28-9440-10 28-9513-77
MagRack 6 1 28-9489-64
Small-scale Antibody Purification Protein A HP SpinTrap 16 × 100 µl columns 28-9031-32
Protein A HP MultiTrap 4 × 96-well plates; 50 µl/well 28-9031-33
Protein A Mag Sepharose Xtra 2 × 1ml 5 × 1 ml
28-9670-56 28-9670-62
Protein G HP SpinTrap 16 × 100 µl columns 28-9031-34
Protein G HP MultiTrap 4 × 96-well plates; 50 µl/well 28-9031-35
Protein G Mag Sepharose Xtra 2 × 1ml 5 × 1 ml
28-9670-66 28-9670-70
Ab SpinTrap 50 × 100 µl columns 28-4083-47
Ab Buffer Kit 1 28-9030-59

114 28-9887-41 AA
Quantity Code no.
Desalting/Buffer Exchange/Cleanup Disposable PD-10 Desalting 30 × columns 17-0851-01
LabMate PD-10 Buffer Reservoir 10 18-3216-03
PD MidiTrap G-25 50 × columns 28-9180-08
PD MiniTrap G-25 50 × columns 28-9180-07
PD SpinTrap G-25 50 × columns 28-9180-04
PD MultiTrap G-25 4 × 96-well plates; 500µl/well 28-9180-06
PD MidiTrap G-10 50 × columns 28-9180-11
PD MiniTrap G-10 50 × columns 28-9180-10
HiTrap Desalting 5 × 5 ml columns 17-1408-01
HiPrep 26/10 Desalting 1 × 53 ml column 17-5087-01
Mini Dialysis Kit – 1 kDa cut-off 1 80-6483-75
Mini Dialysis Kit - 1 kDa cut-off 1 80-6483-94
Mini Dialysis Kit – 8 kDa cut-off 1 80-6484-13
Mini Dialysis Kit - 8 kDa cut-off 1 80-6484-32
2-D Clean-Up Kit 1 80-6484-51
SDS-PAGE Clean-Up Kit 1 80-6484-70
Enzyme Regulation Protease Inhibitor Mix 1 80-6501-23
Nuclease Mix 1 80-6501-42
Fractionation 2-D Fractionation Kit 1 80-6501-04
2-D Quant Kit 1 80-6483-56
NanoVue Plus 1 28-9569-65
Histidine-tagged Protein Capture His GraviTrap 10 × columns 11-0033-99
His Mag Sepharose Ni 2 × 1 ml 5 × 1 ml 10 × 1 ml
28-9673-88 28-9673-90 28-9799-17
His GraviTrap Kit 1 28-4013-51
His MultiTrap HP 4 × 96-well plates,; 50µl/well 28-4009-89
His MultiTrap FF 4 × 96-well plates,; 50µl/well 28-4009-90
His SpinTrap 50 × columns 28-4013-53
His SpinTrap Kit 1 28-9321-71
His Buffer Kit 1 11-0034-00
Anti-His antibody 170 µl 27-4710-01
HisTrap HP 5 × 1 ml columns 17-5247-01
HisTrap FF 5 × 1 ml columns 17-5319-01
HisTrap FF crude 5 × 1 ml columns 11-0004-58
HisTrap FF crude Kit 1 28-4014-77
HisPrep FF 16/10 1 × 20 ml column 28-9365-51
Membrane Protein Purification Kit 1 28-9805-82

28-9887-41 AA 115
Quantity Code no.
Maltose Binding Protein (MBP)-tagged Protein Capture MBPTrap HP 5 × 1 ml columns 28-9187-78
Strep(II)-tagged Protein Capture StrepTrap HP 5 × 1 ml columns 28-9075-46
GST-tagged Protein Capture GST Detection Module 50 detections 27-4590-01
GST 96-well Detection Module 5 plates 27-4592-01
GSTPrep FF 16/10 1 × 20 ml column 28-9365-50
GSTrap HP 5 × 1 ml columns 17-5281-01
GSTrap FF 5 × 1 ml columns 17-5130-01
GSTrap 4B 5 × 1 ml columns 28-4017-45
GST GraviTrap 10 × 1 ml columns 28-9523-60
GST MultiTrap FF 4 × 96-well plates,; 50µl/well 28-4055-01
GST MultiTrap 4B 4 × 96-well plates,; 50µl/well 28-4055-00
GST SpinTrap 50 × 50 µl columns 28-9523-59
GST Buffer Kit 1 28-9523-61
pGEX vectors 25 µl multiple
GST Vector primers for sequencing 0.05 A260 unit multiple
E. coli BL21 1 vial 27-1542-01
M13K07 Helper Phage 100 µl 27-1524-01
GST Bulk Kit 1 27-4570-01
PreScission Protease 500 units 27-0843-01
Thrombin 500 units 27-0846-01
Factor Xa 400 units 27-0849-01
Anti-GST Antibody 0.5 ml, 50 detections 27-4577-01
Protein Depletion HiTrap Albumin & IgG Depletion 2 × 1 ml 28-9466-03
Albumin & IgG Depletion SpinTrap 10 × columns 28-9480-20
Lysis/Protein Extraction Sample Grinding Kit 50 samples 80-6483-37
Yeast Protein Extraction Buffer Kit 1 28-9440-45
Mammalian Protein Extraction Buffer 1 × 500 ml 28-9412-79
2-D Protein Extraction Buffer Trial Kit 6 × 10 ml 28-9435-22
2-D Protein Extraction Buffer-I 1 × 50 ml 28-9435-23
2-D Protein Extraction Buffer-II 1 × 50 ml 28-9435-24
2-D Protein Extraction Buffer-III 1 × 50 ml 28-9435-25
2-D Protein Extraction Buffer-IV 1 × 50 ml 28-9435-26
2-D Protein Extraction Buffer-V 1 × 50 ml 28-9435-27
2-D Protein Extraction Buffer-VI 1 × 50 ml 28-9435-28
illustra triplePrep Kit 1 28-9425-44

116 28-9887-41 AA
Quantity Code no.
Protein Concentration Vivaspin 500, 3 kDa MWCO PES 25 28-9322-18
Vivaspin 500, 5 kDa MWCO PES 25 28-9322-23
Vivaspin 500, 10 kDa MWCO PES 25 28-9322-25
Vivaspin 500, 30 kDa MWCO PES 25 28-9322-35
Vivaspin 500, 50 kDa MWCO PES 25 28-9322-36
Vivaspin 500, 100 kDa MWCO PES 25 28-9322-37
Vivaspin 2, 3 kDa MWCO PES 25 28-9322-40
Vivaspin 2, 5 kDa MWCO PES 25 28-9322-45
Vivaspin 2, 10 kDa MWCO PES 25 28-9322-47
Vivaspin 2, 30 kDa MWCO PES 25 28-9322-48
Vivaspin 2, 50 kDa MWCO PES 25 28-9322-57
Vivaspin 2, 100 kDa MWCO PES 25 28-9322-58
Vivaspin 6, 3 kDa MWCO PES 25 28-9322-93
Vivaspin 6, 5 kDa MWCO PES 25 28-9322-94
Vivaspin 6, 10 kDa MWCO PES 25 28-9322-96
Vivaspin 6, 30 kDa MWCO PES 25 28-9323-17
Vivaspin 6, 50 kDa MWCO PES 25 28-9323-18
Vivaspin 6, 100 kDa MWCO PES 25 28-9323-19
Vivaspin 20, 3 kDa MWCO PES 25 28-9323-58
Vivaspin 20, 5 kDa MWCO PES 25 28-9323-59
Vivaspin 20, 10 kDa MWCO PES 25 28-9323-60
Vivaspin 20, 30 kDa MWCO PES 25 28-9323-61
Vivaspin 20, 50 kDa MWCO PES 25 28-9323-62
Vivaspin 20, 100 kDa MWCO PES 25 28-9323-63
IEX columnsMini Q PC 3.2/3 1 × 0.24 ml column 17-0686-01
Mini Q 4.6/50 PE 1 × 0.8 ml column 17-5177-01
Mini S PC 3.2/3 1 × 0.24 ml column 17-0687-01
Mini S 4.6/50 PE 1 × 0.8 ml column 17-5178-01
Mono Q PC 1.6/5 1 × 0.10 ml column 17-0671-01
Mono Q 5/50 GL 1 × 1 ml column 17-5166-01
Mono Q 4.6/100 PE 1 × 1.7 ml column 17-5179-01
Mono Q 10/100 GL 1 × 8 ml column 17-5167-01
Mono Q HR 16/10 1 × 20 ml column 17-0506-01
Mono S PC 1.6/5 1 × 0.10 ml column 17-0672-01
Mono S 5/50 GL 1 × 1 ml column 17-5168-01
Mono S 4.6/100 PE 1 × 1.7 ml column 17-5180-01
Mono S 10/100 GL 1 × 8 ml column 17-5169-01
Mono S HR 16/10 1 × 20 ml column 17-0507-01
Mono P 5/50 GL 1 × 1 ml column 17-5170-01
Mono P 5/200 GL 1 × 4 ml column 17-5171-01

28-9887-41 AA 117
Quantity Code no.
GF columnsSuperdex Peptide PC 3.2/30 1 × 2.4 ml column 17-1458-01
Superdex Peptide 10/300 GL 1 × 24 ml column 17-5176-01
Superdex 75 PC 3.2/30 1 × 2.4 ml column 17-0771-01
Superdex 75 5/150 GL 1 × 3 ml column 28-9205-04
Superdex 75 10/300 GL 1 × 24 ml column 17-5174-01
Superdex 200 PC 3.2/30 1 × 2.4 ml column 17-1089-01
Superdex 200 5/150 GL 1 × 3 ml column 28-9065-61
Superdex 200 10/300 GL 1 × 24 ml column 17-5175-01
Superose 6 PC 3.2/30 1 × 2.4 ml column 17-0673-01
Superose 6 10/300 GL 1 × 24 ml column 17-5172-01
Superose 12 PC 3.2/30 1 × 2.4 ml column 17-0674-01
Superose 12 10/300 GL 1 × 24 ml column 17-5173-01
RPC columnsSOURCE 15RPC ST 4.6/100 1 × 1.7 ml column 17-5068-01
RESOURCE RPC, 1 ml 1 × 1 ml column 17-1181-01
RESOURCE RPC, 3 ml 1 × 3 ml column 17-1182-01
ReagentsIodoacetamide 25 g RPN6302
Tris 500 g 17-1321-01
PlusOne EDTA, disodium salt 100 g 17-1324-01
Urea 500 g 17-1319-01
PlusOne Formamide 250 ml 17-1320-01
Dithiothreitol 1 g 17-1318-01
PlusOne Mercaptoethanol 25 ml 17-1317-01
PlusOne Glycerol, 85% 1 l 17-1325-01
Sodium Dodecyl Sulfate 100 g 17-1313-01
Triton X-100 500 ml 17-1315-01
CHAPS 1 g 17-1314-01
PlusOne Tween 20 500 ml 17-1316-01
Bromophenol Blue 10 g 17-1329-01
Whatman Klari-Flex Bottle-Top System15 ml, 0.22 PES Klari-Flex Bottle-Top Filter, Sterile 24 6518-0152
50 ml, 0.22 PES Klari-Flex Bottle-Top Filter, Sterile 24 6518-0502
250 ml, 0.22 PES Klari-Flex Bottle-Top Filter, Sterile 12 6514-2502
500 ml, 0.22 PES Klari-Flex Bottle-Top Filter, Sterile 12 6514-5002
1000 ml, 0.22 PES Klari-Flex Bottle-Top Filter, Sterile 12 6514-1002
Klari-Flex Cradle ring 1 6517-0001
Klari-Flex Pedestal stand 1 6517-0002

118 28-9887-41 AA
Quantity Code no.
Whatman Syringe FiltersPuradisc 4 mm syringe filter, sterile 0.2 µm PVDF 50 6791-0402
Puradisc 13 mm syringe filter, sterile 0.2 µm PVDF 50 6791-1302
Puradisc FP 13 mm syringe filter, sterile 0.2 µm RC 50 10462945
Puradisc 25 mm syringe filter, sterile 0.2 µm PES 50 6780-2502
GD/X 25 mm Syringe filter, sterile, 0.2 µm PVDF 50 6900-2502
GD/X 25 mm Syringe filter, sterile, 0.2 µm PES 50 6896-2502
Whatman Centrifuge Filters—UltrafiltrationVectaSpin Micro (0.4 ml), Cellulose Acetate MWCO 12K 1 6834-1001
VectaSpin Micro (0.4 ml), Cellulose Acetate MWCO 20K 1 6834-2001
VectaSpin Micro (0.4 ml), Polysulfone MWCO 30K 1 6835-3001
VectaSpin Micro (0.4 ml), Polysulfone MWCO 100K 1 6835-1101
VectaSpin 3 (3 ml), Polysulfone MWCO 10K 1 6835-1005
VectaSpin 3 (3 ml), Polysulfone MWCO 30K 1 6835-3005
Whatman Syringeless FiltersMini-UniPrep Syringeless filter, 0.2 µm PVDF 100 UN203NPEAQU
Mini-UniPrep Syringeless filter, 0.2 µm RC 100 UN203NPERC
Autovial 12, sterile 0.2 PVDF 40 AV125SAQU
Other pack sizes and columns are available. Visit www.gelifesciences.com/protein-purification and www.gelifesciences.com/sampleprep for additional options.

28-9887-41 AA 119

120 28-9887-41 AA

Protein Sample Preparation – H
andbook
GE HealthcareLife Sciences
imagination at work imagination at work28-9887-41 AA 12/2010
GE, imagination at work, and GE monogram are trademarks of General Electric Company.
ÄKTAmicro, ÄKTA, Biacore, CyDye, Deep Purple, DeCyder, ECL Plex, Ettan, ExcelGel, Ficoll, HiTrap, illustra, ImageQuant, Immobiline, Klari-Flex, MidiTrap, Mini Q, Mini S, MiniTrap, Mono P, Mono Q, Mono S, MultiTrap, Percoll, Pharmalyte, RESOURCE, Sephadex, Sepharose, SOURCE, SpinTrap, Superdex, Superose, UNIFILTER, and Whatman are trademarks of GE Healthcare companies.
2-D Fluorescence Difference Gel Electrophoresis: 2-D Fluorescence Difference Gel Electrophoresis (2-D DIGE) technology is covered by US patent numbers 6,043,025, 6,127,134 and 6,426,190 and equivalent patents and patent applications in other countries and exclusively licensed from Carnegie Mellon University. CyDye: this product or portions thereof is manufactured under an exclusive license from Carnegie Mellon University under US patent numbers 5,569,587, 5,627,027 and equivalent patents in other countries. The purchase of CyDye DIGE Fluors includes a limited license to use the CyDye DIGE Fluors for internal research and development, but not for any commercial purposes. A license to use the CyDye DIGE Fluors for commercial purposes is subject to a separate license agreement with GE Healthcare.
CyDye: This product or portions thereof is manufactured under an exclusive license from Carnegie Mellon University under US patent number 5,268,486 and equivalent patents in the US and other countries.
The purchase of CyDye products includes a limited license to use the CyDye products for internal research and development but not for any commercial purposes. A license to use the CyDye products for commercial purposes is subject to a separate license agreement with GE Healthcare. Commercial use shall include:
1. Sale, lease, license or other transfer of the material or any material derived or produced from it.
2. Sale, lease, license or other grant of rights to use this material or any material derived or produced from it.
3. Use of this material to perform services for a fee for third parties, including contract research and drug screening.
If you require a commercial license to use this material and do not have one, return this material unopened to GE Healthcare Bio-Sciences AB, Bjorkgatan 30, SE-751 84 Uppsala, Sweden and any money paid for the material will be refunded.
DeCyder: This release of DeCyder software is provided by GE Healthcare to the customer under a non-exclusive license and is subject to terms and conditions set out in the 2-D Differential Gel Electrophoresis Technology Access Agreement. Customer has no rights to copy or duplicate or amend the Software without the prior written approval of GE Healthcare.
Deep Purple Total Protein Stain: Deep Purple Total Protein Stain is exclusively licensed to GE Healthcare from Fluorotechnics Pty Ltd. Deep Purple Total Protein Stain may only be used for applications in life science research. Deep Purple is covered under a granted patent in New Zealand entitled “Fluorescent Compounds”, patent number 522291 and equivalent patents and patent applications in other countries.
GST Gene Fusion Vectors: A license for commercial use of GST Gene Fusion Vectors under US patent 5,654,176 and equivalent patents and patent applications in other countries must be obtained from Millipore Corp (formerly Chemicon International Inc).
IMAC Sepharose products, Ni Sepharose products, and Fe Sepharose products: These products are covered by US patent number 6 623 655 and equivalent patents and patent applications in other countries.
IMAC Sepharose products and Ni Sepharose products (Histidine-tagged protein purification) Purification and preparation of fusion proteins and affinity peptides comprising at least two adjacent histidine residues may require a license under US patent numbers 5,284,933 and 5,310,663, and equivalent patents and patent applications in other countries (assignee: Hoffman La Roche, Inc).
StrepTrap HP and StrepTactin Sepharose High Performance: These products are covered by US patent number 6,103,493 and equivalent patents and patent applications in other countries. The purchase of StrepTrap HP and StrepTactin Sepharose High Performance includes a license under such patents for non-profit and in-house research only. Please contact IBA ([email protected]) for further information on licenses for commercial use of Strep-Tactin.
All third party trademarks are the property of their respective owners.
© 2010 General Electric Company—All rights reserved. First published Dec. 2010.
All goods and services are sold subject to the terms and conditions of sale of the company within GE Healthcare which supplies them. A copy of these terms and conditions is available on request. Contact your local GE Healthcare representative for the most current information.
GE Healthcare UK Limited Amersham Place Little Chalfont Buckinghamshire, HP7 9NA UK
GE Healthcare Europe, GmbH Munzinger Strasse 5 D-79111 Freiburg Germany
GE Healthcare Bio-Sciences Corp. 800 Centennial Avenue, P.O. Box 1327 Piscataway, NJ 08855-1327 USA
GE Healthcare Japan Corporation Sanken Bldg., 3-25-1, Hyakunincho Shinjuku-ku, Tokyo 169-0073 Japan
For local office contact information,please visit www.gelifesciences.com/contact
www.gelifesciences.com/sampleprep
GE Healthcare Bio-Sciences ABBjörkgatan 30751 84 UppsalaSweden
imagination at work
Protein Sample PreparationHandbook