protein-protein interaction network analysis of ... · analysis of this gene and pathway could...
TRANSCRIPT

©FUNPEC-RP www.funpecrp.com.brGenetics and Molecular Research 13 (4): 9343-9351 (2014)
Protein-protein interaction network analysis of osteoarthritis-related differentially expressed genes
Y.C. Zhu1*, B.Y. Deng1*, L.G. Zhang1, P. Xu3, X.P. Du3, Q.G. Zhang1 and B. Yang2
1Department of Orthopedics, Shanghai Tenth People’s Hospital, Tongji University School of Medicine, Shanghai, China2Shanghai Health Bureau of Health Supervision, Shanghai, China3Qidong Hospital of TCM, Jiangsu, China
*These authors contributed equally to this study.Corresponding authors: B. Yang / Q.G. ZhangE-mail: [email protected] / [email protected]
Genet. Mol. Res. 13 (4): 9343-9351 (2014)Received August 28, 2013Accepted January 10, 2014Published November 11, 2014DOI http://dx.doi.org/10.4238/2014.November.11.1
ABSTRACT. The purpose of this study was to identify genes and pathways for osteoarthritis (OA) diagnosis and therapy. We downloaded the gene expression profile of OA from Gene Expression Omnibus (GEO) database including 10 early OA, 9 late OA, and 5 normal control samples. Next, we screened differentially expressed genes (DEGs) between early- and late-stage OA samples comparing with healthy control samples. Then, the Search Tool for the Retrieval of Interacting Genes/Proteins (STRING) software was used to construct protein-protein interaction (PPI) network, which was to predict the proteins that may interact with DEGs. The Gene Ontology (GO)-enrichment method was used to analyze the function of genes in the PPI networks. Meanwhile network module analysis was performed using Cytoscape. A total of 24 and 29 DEGs were identified for the early and late OA, respectively. TAC1 showed the highest degree in the PPI network.
9344
©FUNPEC-RP www.funpecrp.com.brGenetics and Molecular Research 13 (4): 9343-9351 (2014)
Y.C. Zhu et al.
Functional annotation of the TAC1 network module indicated that this gene is associated with the G protein-coupled signal transduction pathway. In summary, TAC1, together with G protein-coupled receptors, appear to play a role in the biogenesis and progress of OA. Further analysis of this gene and pathway could therefore provide a potential target for the diagnosis and treatment of OA.
Key words: Osteoarthritis; Differentially expressed gene; Protein-protein interaction network
INTRODUCTION
Osteoarthritis (OA) is a well-known form of degenerative arthritis, degenerative joint disease, or osteoarthrosis, and leads to a series of mechanical abnormalities involving degradation of joints, including the articular cartilage and subchondral bone (Dorland, 1901, Goldring and Goldring, 2010). OA likely begins to occur in humans in their 20s, although most cases are asymptomatic at this stage, and the disease is rarely identified (Holden et al., 1988). The disease generally does not cause functional disability. Most symptoms are confined to be in the joint, and few patients experience oppression by the nerve root, resulting in corresponding physical nerve root pain or conduction paresthesia (NCCC, 2008). Most nerve symptoms can be improved after rest or treatment, while some individuals experience paralysis of neurons (McPhee et al., 2010). Rarely, patients may experience an oppressed vertebral artery (Chen et al., 2001). Because diagnosis during the early stage is difficult, so the disease is more likely to cause harm to the patient.
Gene therapy has been proposed to be a strategy. Interleukin-1 is a promising therapy target, which mediates the cartilage loss in OA (Evans et al., 2004). Gene expression profiling reveals that down-regulation of important oxidative defense genes such as glutathione per-oxidase 3 and superoxide dismutases 2 and 3 were prominent (Aigner et al., 2006). Another study also performed global gene expression in OA, which focus on early OA demonstrating that Reln, Phex, Ltbp2, Cxcr4, Ccl2, and growth factor signaling pathway may be potential targets for OA therapy (Appleton et al., 2007). Wang et al. (2011) demonstrated that comple-ment played an important role in the pathogenesis of OA. However, the pathology of OA is not fully elucidated.
In this study, we analyzed early OA, late OA, and healthy subjects through a com-parative analysis. The early, late OA samples, and healthy samples were obtained to identify gene expression differences and construct a network module, which may facilitate OA early detection and treatment.
MATERIAL AND METHODS
Dataset
We downloaded the gene dataset GSE32317 (Wang et al., 2011) from the Gene Ex-pression Omnibus (GEO; web site: http://www.ncbi.nlm.nih.gov/geo/) database. The gene ex-pression profile contained 24 samples from 10 patients with early-stage knee OA who were

9345
©FUNPEC-RP www.funpecrp.com.brGenetics and Molecular Research 13 (4): 9343-9351 (2014)
PPI analysis of genes in osteoarthritis
undergoing arthroscopic procedures for degenerative meniscal tears, 9 patients with late-stage knee OA who were undergoing total knee joint replacement, and 5 samples of healthy synovial membranes, which were run on the same platform and array as our OA samples. These data were downloaded from National Center for Biotechnology Information (NCBI) GEO database (accession No. GSE12021) and used for analysis.
Data preprocessing
The dataset was first used to fill in missing data using the K-nearest neighbors method in R language (Troyanskaya et al., 2001), and then the data were normalized using the robust multi-array average (Fujita et al., 2006) algorithm. All expression values were then converted to fold-changes (FC) with log2 base. Probe sets were mapped to NCBI Entrez genes. If there were multiple probe sets corresponding to the same gene, the expression values of the probe sets were averaged. As a result, a total of 19,803 genes were identified from this dataset.
Screening differentially expressed genes (DEGs)
Three statistical test methods were used, including the Student t-test, the Wilcox test, and the Fisher exact test in the multi-test package in the R platform (Ihaka and Gentleman, 1996), which was used to perform strict expression analysis of the data between the early and the late OA group comparing with the healthy group, respectively. P values were calculated us-ing multiple testing correction, and the logFC of each gene expression value was investigated. Through multiple testing and screening methods, we identified abnormal genes in different stages of OA samples and significantly DEGs between the two OA stages (P < 0.05; logFC > 1). These genes were then used for further analysis.
Construction of protein-protein interaction (PPI) network
The Search Tool for the Retrieval of Interacting Genes/Proteins (STRING) (von Mer-ing et al., 2007) is a database containing all known and predicted protein interactions. The interactions include direct (physical) and indirect (functional) associations derived from 4 sources, including genome, high-throughput experiments, co-expression, and prior knowl-edge. We employed STRING to identify pairwise relationships among the DEGs.
Module network analysis
Gene products in the same module often have the same or similar functions; they work together to carry out one biological function. Therefore, we used the Cytoscape soft-ware (Smoot et al., 2011) to perform module network analysis. We used Mcode plugin (Kohl et al., 2011) to create modules including 3 target genes (module division parameters: degree cutoff ≥ 2; score of each node in the module must be more than 0.2; neighbors of each node in the module must be more than 2; and the depth must be at least 100), and then another plugin of Cytoscape, Bingo (Maere et al., 2005), was used to annotate module function.
9346
©FUNPEC-RP www.funpecrp.com.brGenetics and Molecular Research 13 (4): 9343-9351 (2014)
Y.C. Zhu et al.
RESULTS
Data preprocessing
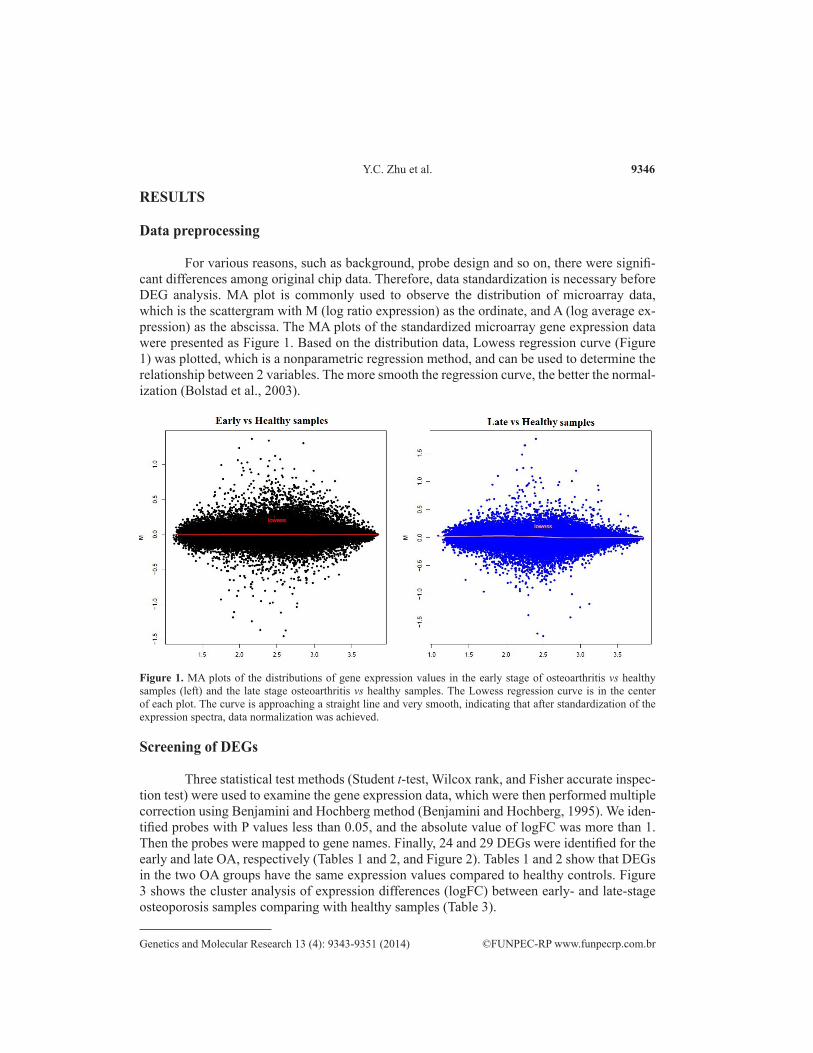
For various reasons, such as background, probe design and so on, there were signifi-cant differences among original chip data. Therefore, data standardization is necessary before DEG analysis. MA plot is commonly used to observe the distribution of microarray data, which is the scattergram with M (log ratio expression) as the ordinate, and A (log average ex-pression) as the abscissa. The MA plots of the standardized microarray gene expression data were presented as Figure 1. Based on the distribution data, Lowess regression curve (Figure 1) was plotted, which is a nonparametric regression method, and can be used to determine the relationship between 2 variables. The more smooth the regression curve, the better the normal-ization (Bolstad et al., 2003).
Figure 1. MA plots of the distributions of gene expression values in the early stage of osteoarthritis vs healthy samples (left) and the late stage osteoarthritis vs healthy samples. The Lowess regression curve is in the center of each plot. The curve is approaching a straight line and very smooth, indicating that after standardization of the expression spectra, data normalization was achieved.
Screening of DEGs
Three statistical test methods (Student t-test, Wilcox rank, and Fisher accurate inspec-tion test) were used to examine the gene expression data, which were then performed multiple correction using Benjamini and Hochberg method (Benjamini and Hochberg, 1995). We iden-tified probes with P values less than 0.05, and the absolute value of logFC was more than 1. Then the probes were mapped to gene names. Finally, 24 and 29 DEGs were identified for the early and late OA, respectively (Tables 1 and 2, and Figure 2). Tables 1 and 2 show that DEGs in the two OA groups have the same expression values compared to healthy controls. Figure 3 shows the cluster analysis of expression differences (logFC) between early- and late-stage osteoporosis samples comparing with healthy samples (Table 3).

9347
©FUNPEC-RP www.funpecrp.com.brGenetics and Molecular Research 13 (4): 9343-9351 (2014)
PPI analysis of genes in osteoarthritis
PPI network construction
We used the STRING database to predict interactions of 5 significantly DEGs with the proteins. Finally, 4228 possible interactions were obtained but only IGJ, TAC1, and LRP1B were predicted to be interacted with other proteins. Cytoscape was used to construct a PPI network diagram, which is shown as Figure 4. Table 4 presents the degree of nodes IGJ, TAC1, and LRP1B; TAC1 had the highest node degree at 99. Therefore, the TAC1 gene was selected for further analysis.
Gene P value Adjusted P value (Wilcox test) Adjusted P value Exact P value Adjusted P value logFC (Student t-test) P value
DH10B 0.0007 0.0017 0.1088 0.1520 0.0001 0.3163 1.2804MMP1 6.92E-05 0.0003 0.0002 0.0007 1.43E-05 0.0391 -1.3110GJB6 0.0016 0.0037 0.0020 0.0047 0.0007 1 -1.0500jojG 2.12E-24 1.16E-19 0.0001 0.0004 2.44E-11 4.45E-07 -1.8945dapB 9.06E-16 2.36E-12 0.0001 0.0004 0.0001 0.3163 -1.1516
Table 1. Differentially expressed genes between early-stage osteoarthritis and healthy control samples.
Gene P value Adjusted P value (Wilcox test) Adjusted P value Exact P value Adjusted P value logFC (Student t-test) P value
DH10B 0.0043 0.0090 0.1416 0.1913 0.0013 1 1.0518MMP1 1.50E-05 8.39E-05 0.0004 0.0011 6.22E-06 0.0213 -1.3700EPYC 9.67E-07 1.05E-05 0.0002 0.0007 0.0008 1 -1.1317TAC1 0.0002 0.0008 0.0012 0.0032 0.0011 1 -1.0733
Table 2. Differentially expressed genes between late-stage osteoarthritis and healthy control samples.
Figure 2. Distribution of gene expression logFC values in early- and late-stage osteoarthritis groups. Points liedaround diagonal line, and the base line is a linear regression curve that was fitted according to the logFC data.

9348
©FUNPEC-RP www.funpecrp.com.brGenetics and Molecular Research 13 (4): 9343-9351 (2014)
Y.C. Zhu et al.
Figure 3. Cluster analysis of expression differences (logFC) between early- and late-stage osteoporosis samples comparing with healthy samples. Blue dots indicate down-regulated genes; the deeper the blue, the greater the expression level of gene. Yellow dots indicate up-regulated gene; the darker the yellow, the greater the expression level of gene.
Gene early_logFC late_logFC
DH10B 1.2804 1.0518MMP1 -1.3110 -1.3700EPYC -0.7722 -1.1317TAC1 -0.35989 -1.0733IGJ -0.4581 -1.0904LRP1B -0.7647 -1.0684GPR88 -0.7682 -1.0611GJB6 -1.0500 -1.1449jojG -1.8945 -1.8897
Table 3. Expression level (logFC) of differentially expressed genes in early- and late-stage osteoarthritis.
Analysis of modules in the network
The interaction network can be divided into several relatively independent sub-net-works, in which the protein typically has similar function. This type of close relationship is known as a function module. Identifying such modules is very important for understanding the biological system structure. Thus, the Cytoscape network analysis software was used for the module analysis of the network. Using the Mcode plugin, the module, which three target genes (IGJ, TAC1, and LRP1B) lied in, was identified. Figure 5 shows the network module which TAC1 lied in. Module function annotation by Bingo plugin showed that the module was mainly enriched in the G protein-coupled receptor protein signal transduction pathway.

9349
©FUNPEC-RP www.funpecrp.com.brGenetics and Molecular Research 13 (4): 9343-9351 (2014)
PPI analysis of genes in osteoarthritis
Figure 5. Module, which TAC1 lied in, was constructed by STRING. The orange hexagon indicates the TAC1, and others are interaction proteins.
Gene Degree
TAC1 99LRP1B 1IGJ 3
Table 4. Degree of genes in the STRING-predicted protein-protein interaction network.
Figure 4. Protein-protein interaction network construction by Cytoscape. Orange hexagons indicate target gene, and others are interaction proteins.

9350
©FUNPEC-RP www.funpecrp.com.brGenetics and Molecular Research 13 (4): 9343-9351 (2014)
Y.C. Zhu et al.
DISCUSSION
OA is one of the most common chronic and progressive joint diseases, and is caused by an imbalance between the degradation and synthesis of cartilage cells, the extracellular matrix, and subchondral bone (Sandell and Aigner, 2001; Hayami et al., 2004). Several risk factors, including biological factors and mechanical injury factors, may lead to OA.
By analyzing gene expression levels, we found that the TAC1 was significantly differ-entially expressed between different stages of OA (early and late). The module, which TAC1 lied in, was involved in the G protein-coupled receptor signal transduction pathway. We can, therefore, infer that the TAC1 is closely related to OA development. TAC1 encodes tachykinin NK2, a protein belonging to the tachykinin (TK) family, which includes substance P (SP), neurokinin A, and its elongated forms neuropeptide-gamma and neuropeptide-kappa, neuro-kinin B, hemokinin-1, and endokinin A and B, which belong to a family of peptides that act through the stimulation of tachykinin NK1, NK2, or NK3 receptors (Patacchini et al., 2004). Recent studies have shown that TAC1 plays an important role in the estrous cycle and during pregnancy (Patak et al., 2005). In addition, TKs and TK receptors are expressed throughout the male reproductive tract and have been reported to be involved in the regulation of human sperm motility (Ravina et al., 2007). Interestingly, the reproductive system is related to bone formation, implying that TAC1 acts as a bridge between OA and the reproductive system (Clarke and Khosla, 2010).
Signal transduction of G protein-coupled receptors is a common target in drug dis-covery research. G protein-coupled receptors mainly regulate macrophage function and play a role in some OA pathology pathways and in biological functions (Lattin et al., 2007). We found that TAC1 together with G protein-coupled receptors play a role in the biogenesis and progress of OA. Further analysis of this pathway could, therefore, provide a potential target for the treatment of OA.
Currently, the biogenesis and progress of OA syndrome can be examined at the ge-netic level by using microarray technology. The biological function of a gene can be predicted by the expression level of its encoded protein in cells, and the pathological process can be elucidated by examining changes in the gene expression profile between OA and normal cells. Therefore, in this study, information collected regarding the gene expression profile and the biogenesis and progress of OA may facilitate the development of treatment options for OA and various other diseases. Additional OA-related genes can also be identified through further examination of this network.
In conclusion, we analyzed the gene expression profiles of different stages of OA using bioinformatic analysis and found that the identified DEGs and several associated path-ways, particularly the TAC1 and the G protein-coupled receptor pathway, may play impor-tant roles in the progression of the early and late stages of OA. These may become specific therapeutic molecular targets for OA treatment. However, further experiments are necessary to confirm our results.
Conflicts of interest
The authors declare no conflict of interest.

9351
©FUNPEC-RP www.funpecrp.com.brGenetics and Molecular Research 13 (4): 9343-9351 (2014)
PPI analysis of genes in osteoarthritis
REFERENCES
Aigner T, Fundel K, Saas J, Gebhard PM, et al. (2006). Large-scale gene expression profiling reveals major pathogenetic pathways of cartilage degeneration in osteoarthritis. Arthritis Rheum. 54: 3533-3544.
Appleton CT, Pitelka V, Henry J and Beier F (2007). Global analyses of gene expression in early experimental osteoarthritis. Arthritis Rheum. 56: 1854-1868.
Benjamini Y and Hochberg Y (1995). Controlling the false discovery rate: a practical and powerful approach to multiple testing. J. R. Statist. Soc. B 57: 289-300.
Bolstad BM, Irizarry RA, Astrand M and Speed TP (2003). A comparison of normalization methods for high density oligonucleotide array data based on variance and bias. Bioinformatics 19: 185-193.
Chen J, Li Y, Wang L, Zhang Z, et al. (2001). Therapeutic benefit of intravenous administration of bone marrow stromal cells after cerebral ischemia in rats. Stroke 32: 1005-1011.
Clarke BL and Khosla S (2010). Female reproductive system and bone. Arch. Biochem. Biophys. 503: 118-128.Dorland W (1901). The American Illustrated Medical Dictionary: A New and Completed Dictionary of the Terms Used in
Medicine, Surgery, Dentistry, Pharmacy, Chemistry, and the Kindred Branches with their Pronunciation, Derivation, and Definition. Nabu Press, Charleston.
Evans CH, Gouze JN, Gouze E, Robbins PD, et al. (2004). Osteoarthritis gene therapy. Gene Ther. 11: 379-389.Fujita A, Sato JR, Rodrigues LO, Ferreira CE, et al. (2006). Evaluating different methods of microarray data normalization.
BMC Bioinformatics 7: 469.Goldring MB and Goldring SR (2010). Articular cartilage and subchondral bone in the pathogenesis of osteoarthritis. Ann.
N. Y. Acad. Sci. 1192: 230-237.Hayami T, Pickarski M, Wesolowski GA, McLane J, et al. (2004). The role of subchondral bone remodeling in
osteoarthritis: reduction of cartilage degeneration and prevention of osteophyte formation by alendronate in the rat anterior cruciate ligament transection model. Arthritis Rheum. 50: 1193-1206.
Holden DL, James SL, Larson RL and Slocum DB (1988). Proximal tibial osteotomy in patients who are fifty years old or less. A long-term follow-up study. J. Bone Joint Surg. Am. 70: 977-982.
Ihaka R and Gentleman R (1996). R: A language for data analysis and graphics. J. Comput. Graph. Stat. 5: 299-314.Kohl M, Wiese S and Warscheid B (2011). Cytoscape: software for visualization and analysis of biological networks.
Methods Mol. Biol. 696: 291-303.Lattin J, Zidar DA, Schroder K, Kellie S, et al. (2007). G-protein-coupled receptor expression, function, and signaling in
macrophages. J. Leukoc. Biol. 82: 16-32.Maere S, Heymans K and Kuiper M (2005). BiNGO: a Cytoscape plugin to assess overrepresentation of gene ontology
categories in biological networks. Bioinformatics 21: 3448-3449.McPhee SJ, Papadakis MA and Rabow MW (2010). Current Medical Diagnosis & Treatment 2010. McGraw-Hill Medical,
New York.National Collaborating Centre for Chronic Conditions (NCCC) (2008). Osteoarthritis: National Clinical Guideline for
Care and Management in Adults. Royal College of Physicians, London.Patacchini R, Lecci A, Holzer P and Maggi CA (2004). Newly discovered tachykinins raise new questions about their
peripheral roles and the tachykinin nomenclature. Trends Pharmacol. Sci. 25: 1-3.Patak E, Pinto FM, Story ME, Pintado CO, et al. (2005). Functional and molecular characterization of tachykinins and
tachykinin receptors in the mouse uterus. Biol. Reprod. 72: 1125-1133.Ravina CG, Seda M, Pinto FM, Orea A, et al. (2007). A role for tachykinins in the regulation of human sperm motility.
Hum. Reprod. 22: 1617-1625.Sandell LJ and Aigner T (2001). Articular cartilage and changes in arthritis. An introduction: cell biology of osteoarthritis.
Arthritis Res. 3: 107-113.Smoot ME, Ono K, Ruscheinski J, Wang PL, et al. (2011). Cytoscape 2.8: new features for data integration and network
visualization. Bioinformatics 27: 431-432.Troyanskaya O, Cantor M, Sherlock G, Brown P, et al. (2001). Missing value estimation methods for DNA microarrays.
Bioinformatics 17: 520-525.von Mering C, Jensen LJ, Kuhn M, Chaffron S, et al. (2007). STRING 7 - recent developments in the integration and
prediction of protein interactions. Nucleic Acids Res. 35: D358-D362.Wang Q, Rozelle AL, Lepus CM, Scanzello CR, et al. (2011). Identification of a central role for complement in
osteoarthritis. Nat. Med. 17: 1674-1679.