protein extraction method for the proteomic study of ... and molecular research 14 (4): 14406-14421...
TRANSCRIPT

©FUNPEC-RP www.funpecrp.com.brGenetics and Molecular Research 14 (4): 14406-14421 (2015)
Protein extraction method for the proteomic study of Zymomonas mobilis during production of ethanol and levans
D.R. Cavalcanti, C.B. Malafaia, T.D. Silva, B.S. Santos, G.M.T. Calazans and M.V. Silva
Laboratório de Biologia Molecular, Departamento de Bioquímica, Centro de Ciências Biológicas, Universidade Federal de Pernambuco, Recife, PE, Brasil
Corresponding author: D.R. CavalcantiE-mail: [email protected]
Genet. Mol. Res. 14 (4): 14406-14421 (2015)Received September 4, 2014Accepted April 8, 2015Published November 18, 2015DOI http://dx.doi.org/10.4238/2015.November.18.4
ABSTRACT. Zymomonas mobilis has aroused considerable interest owing to its rapid metabolism and efficiency in producing ethanol and by-products such as levans, sorbitol, and gluconic acid from simple sugars. We performed a proteomic analysis of Z. mobilis UFPEDA241 to provide a global profile of regulatory proteins. The choice of the methods of extraction and cell lysis are fundamental steps and of great importance for the detection and identification of intra- and extracellular proteins of a proteome. Strains were subjected to protein extraction methods using three different reagents: TRIzol, lysis buffer, and phenol. The optimum method was taken to be the one that produced the greatest quantity and quality of proteins in one dimension for further analysis in two dimensions during the production of ethanol and levans over 72 h. The results showed that the greatest amount of protein was obtained by the phenol method (1.44 ± 0.07 mg/mL), which was significantly different (P < 0.05) to the TRIzol (1.11 ± 0.01 mg/mL), and lysis buffer

14407
©FUNPEC-RP www.funpecrp.com.brGenetics and Molecular Research 14 (4): 14406-14421 (2015)
Protein extraction method for the proteomic study of Zymomonas
(0.93 ± 0.01 mg/mL) methods (both with P > 0.05). Fermentation at 20°C produced the highest level of levans, and using two-dimensional electrophoresis and mass spectrometry it was possible to identify 34 differentially expressed spots.
Key words: Fermentation; Protein; Proteomics; Zymomonas mobilis
INTRODUCTION
The use of biotechnological processes for the production of a wide variety of com-pounds has aroused growing interest, especially in recent decades. Many advances have been made and new tools have been employed in this area. Such interest may be justified by bet-ter biosynthesis techniques, which reduce energy consumption and increase the safety of the process. Highly specific enzymes that minimize the formation of by-products and have a low environmental impact are now being used (Yang et al., 2009).
In this context, Zymomonas mobilis has aroused considerable interest owing to its rapid metabolism and efficiency in producing ethanol and by-products, such as levans, sorbitol, and gluconic acid, from simple sugars. In addition, it presents other advantages such as lower biomass production, no need for controlled oxygen addition, and high suitability for genetic manipulations (Calazans, 1987; Najafpour, 2007; Ranzan, 2010). Z. mobilis is a Gram-negative, aero-tolerant, an-aerobic bacterium that appears as short, thick rods measuring approximately 2.0-6.0 µm long and 1.0-1.4 µm wide. They may appear alone or in pairs, are generally mobile, and possess one to four polar flagella. Concerning nutrition, they are not very demanding chemoorganotrophic organisms. With regards to cultivation conditions, they can tolerate low pH values of around 4.0 in most cases (Swings and De Ley, 1977; Yang et al., 2009). As a result of the use of this route, the energy ef-ficiency of Z. mobilis is half that of Saccharomyces cerevisiae, which uses the Embden-Meyerhof-Parnas pathway (McGill and Dawes, 1971; Swings and De Ley, 1977; de Morais, 1993). These metabolic pathways are simpler than those used by other microorganisms. Z. mobilis catabolizes substrates with high specific contents of carbon, since a larger portion of the substrate is incorpo-rated in the catabolism of the final product (Toma et al., 2003). Owing to these characteristics, ge-netic studies on this bacterium have been included in research programs. Studies have involved the improvement of mutant strains (Zaldivar et al., 2001) as well as the application of metabolic flow analysis, directed mutagenesis, insertion and/or deletion of specific genes, and metabolic engineer-ing for the development of strains (Hatzimanikatis et al., 1998; Cornish-Bowden and Cárdenas, 2000). A physical map of the genome of Z. mobilis and its transcriptional ribosomal unit (Kang and Kang, 1998; Lee et al., 2001) has contributed to the discovery of the first complete genome of this microorganism (Seo et al., 2005). Thus, the development of studies on strains of this species at the transcriptomic, metabolomic (Yang et al., 2009), and proteomic levels continues.
Industrial interest in microbial polysaccharides lies in the fact that they have simple properties, guarantee a supply of material of constant quality and stable price, and their pro-duction is not subject to weather variations. Microbial polysaccharides are useful for the syn-thesis of pharmacologically active polymers used in the development of drug release materials (Calazans et al., 1997, 2000). In the food industry, these polysaccharides have many functional properties, acting as cryoprotectants, stabilizers, gelling agents, and thickeners, and are often the principal agents responsible for the texture (body, viscosity, and consistency) of processed foods. Levans are considered a good source of fructose; these polymers have been employed

14408
©FUNPEC-RP www.funpecrp.com.brGenetics and Molecular Research 14 (4): 14406-14421 (2015)
D.R. Cavalcanti et al.
in the fixing of colors and flavors, as thickeners and stabilizers in gels for desserts, ice cream, and milk derivatives, in seasonings for salads, in drinks, toppings for confectionery products, and even as an embedded casing (Ernandes and Garcia-Cruz, 2005).
The characterization of microorganisms using proteomic methods, as well as other biological system approaches, such as genomics, transcriptomics, and metabolomics, will im-prove our understanding of their biology (Mehmeti et al., 2011). The identification of genes has contributed to the understanding of the mechanism of modulation of microorganisms un-der different abiotic conditions (Amaral et al., 2008). However, transcriptional changes do not reflect the expression of proteins (Gygi et al., 1999) since post-transcriptional processes, which change the amount of active protein derived from synthesis, modification, and degrada-tion of the protein, are not taken into consideration. These processes can produce a dramatic increase in the proteome without a concomitant increase in gene expression. Thus, comple-mentary approaches such as proteomic studies may help identify the proteins involved in the response of microorganisms to environmental conditions (Chen and Harmon, 2006).
While the genome of an organism remains relatively stable throughout its life, the proteome is extremely dynamic and variable. Proteomic analysis determines if a gene is being expressed, that is, the relative concentration of the product, and ultimately the changes that may occur in the proteins after translation. It can also show how these metabolic, regulatory, and signaling processes become dysfunctional in disease states, and how they can be manipu-lated through, for example, the administration of drugs or gene therapy. Protein extraction is a challenging and inconsistent process that has been a problem for scientists (Galdos, 2009).
There are several protocols reported in the literature for the extraction of proteins. These are related to the purpose of the extraction, that is, measurement of concentration or enzymatic activity, separation by chromatographic or electrophoretic techniques, establish-ment of the sequence of amino acids, or determination of the three-dimensional structure of a protein. However, the extraction steps should be simple to ensure reproducibility of the results and minimize structural changes in the proteins, and to avoid chemical modifications during determination. Cell disruption, removal of interfering substances, and solubilization are the three basic steps in the preparation of protein samples (Rabilloud et al., 2010).
An efficient methodology for protein extraction is important for sample preparation, two-dimensional polyacrylamide gel electrophoresis (2-D-PAGE), and subsequent mass spec-trometry (MS). Yet there are few studies offering comparison of these methods of protein ex-traction (Natarajan et al., 2005). These techniques can vary widely in reproducibility and in the representation of the total proteome. Despite this, many methods have been developed and re-ported. However, these have to be adapted, and sometimes combined, to obtain the best possible yield and purity for different species of organisms, for the type of sample to be analyzed, and for the proteins of interest. Therefore, the method of protein extraction for the accurate analysis of proteins remains a challenge for scientists (Natarajan et al., 2005). Thus, the objective of this study was to identify differentially expressed proteins in the production of levans and ethanol by Z. mobilis using sodium dodecyl sulfate (SDS)-PAGE for further 2-D analysis.
MATERIAL AND METHODS
Microorganism and culture media
The strain of Z. mobilis used was ZAG-12 (UFPEDA241), a result of the merger of the

14409
©FUNPEC-RP www.funpecrp.com.brGenetics and Molecular Research 14 (4): 14406-14421 (2015)
Protein extraction method for the proteomic study of Zymomonas
spheroplast strains Ag11 (UFPEDA198) and ZAP (UFPEDA205), belonging to the Culture Col-lection of the Department of Antibiotics at the Federal University of Pernambuco. Microorgan-isms were grown in SSDL liquid medium, comprising 20.0 g/L glucose and 5.0 g/L yeast extract, at pH 6.5 in a microbiological greenhouse at 30°C for 24 h (Swings and De Ley, 1977). After growth, the cultures were transferred to Erlenmeyer flasks containing an inoculum preparation medium comprising 100.0 g/L sucrose; 5.0 g/L yeast extract; 2.0 g/L KH2PO4; 0.5 g/L MgSO4•7 H2O; and 1.0 g/L (NH4)2SO4. The pH of this medium was adjusted to 6.0. The bottles were then placed in an oven at 30°C for 24 h. The medium used in the production of levans was prepared with the same composition, doubling the concentration of each component, with the pH adjusted to 6.0. The experiment was conducted in triplicate (Calazans, 1987).
Fermentation processes
Effect of temperature on the production of levans
The experiments were conducted with the lineage Z. mobilis ZAG-12 in 500 mL Py-rex bottles containing 300 mL fermentation medium. For the inoculum, a 10% volume of the culture was used, grown at 30° ± 1°C for 24 h of pre-fermentation. The fermentations were carried out at temperatures of 20°, 30°, and 40° ± 1°C for 72 h, without agitation. Fermentation bottles subjected to a temperature of 20°C were placed in a refrigerated incubator. Samples for measurements of biomass, sucrose, pH, and levans produced were harvested at 0, 24, 48, and 72 h. The fermented mash was sown on agar medium to investigate the presence of possible contaminants in the fermentation at the times previously mentioned (Silva, 1996). There was no growth of Z. mobilis on this medium owing to the absence of certain essential factors for this bacterium. The appearance of colonies implies the presence of contaminants.
Quantitative determinations to accompany the fermentation processes
Levans dosage
The levans from the fermented liquid were precipitated with absolute ethanol, by ad-justing the water-alcohol mixture to 70% (v/v) in ethanol. An addition of 15 mL ethanol at -20°C was made to 5 mL fermented liquid, which had previously been filtered through a porous 0.22-µm membrane by a vacuum filtration system (Millipore). After adding 15 mL ab-solute ethanol to 5 mL filtrate, the samples were centrifuged at 4200 g for 10 min. The super-natant was discarded and 5 mL distilled water was added to remove levans from the sides of the Falcon tube. This process was carried out twice. The concentrations of precipitated levans were measured in g/L by dry weight in previously dried and tared weighing filters, which were placed in an oven at 110°C for 24 h (Reiss and Hartmeier, 1990).
Determination of carbohydrates and ethanol by high-performance liquid chromatography
The quantification of sucrose, glucose, fructose, and ethanol produced by the Z. mo-bilis ZAG-12 was achieved using high-performance liquid chromatography with refractive index detection (Agilent, 1100 Series - Agilent Technologies, Waldbronn, Germany). For this
14410
©FUNPEC-RP www.funpecrp.com.brGenetics and Molecular Research 14 (4): 14406-14421 (2015)
D.R. Cavalcanti et al.
analysis, an Aminex HPX-87H column was used, with 5 µM sulfuric acid as the mobile phase, at a flow rate of 0.6 mL/min and a temperature of 60°C. The mobile phase was prepared with ultrapure water and subsequently filtered through a 0.22-µm micropore filter. The quantifica-tion used the external standard method, with a calibration curve made simultaneously with the analysis of data obtained during fermentation to prevent errors in the analysis. Since this method is sensitive to errors in the preparation of the samples and standards, as well as the injection of the sample and standard solutions, this procedure was necessary for each analysis (Ribani et al., 2004). The samples and standards were diluted in the mobile phase, filtered, and injected automatically in a 5-µL volume.
Protein extraction methods
TRIzol
TRIzol reagent was used (Invitrogen®) following the manufacturer protocol.
Lysis buffer
Lysis buffer (1.0 mL) comprising: 420.0 g/L 7 M urea; 152.0 g/L 2 M thiourea; 40.0 g/L 4% 3-[(3-cholamidopropyl)dimethylammonio]-1-propanesulfonate; and 10.0 g/L 1% dithiothreitol (DDT) was added to the samples kept on ice. They were then centrifuged at 14,000 g and 4°C for 30 min, and the supernatant was transferred to another microtube and stored at -20°C (Lee and Lo, 2008).
Phenol
The cells were collected by centrifugation and the pellets were washed in phosphate-buffered solution comprising 1.24 g/L K2HPO4; 0.39 g/L KH2PO4; and 8.8 g/L NaCl, with the pH adjusted to 7.2. The pellets were suspended in 0.75 mL extraction buffer comprising 0.7 M sucrose; 0.5 M Tris-HCl; 30 mM HCl; 50 mM ethylenediaminetetraacetic acid; 0.1 M KCl; and 40 mM DDT, with the pH adjusted to 7.0, and incubated for 15 min at room temperature. The same volume of phenol was added to the pellets and after 15 min of agitation, the suspen-sion was centrifuged at 10,000 g and 4°C for 3 min. The supernatant was discarded. This step was repeated twice. Proteins were precipitated with five volumes of 0.1 M ammonium acetate in methanol and centrifuged at 14,000 g and 4°C for 30 min. The precipitate was washed once with 1.0 mL 80% acetone and centrifuged at 8000 g and 4°C for 5 min. The supernatant of the samples was discarded and the pellet was dried at room temperature for 5 min. Then, 100 µL 1% sodium dodecyl sulfate and phosphate-buffered saline was added to dissolve the pro-teins. The pellet was broken and placed in a water bath at 50°C for 15 min. Subsequently, the samples were stored at -20°C (Mehta and Rosato, 2001).
Total protein quantification
Proteins were quantified according to the methodology of Lowry et al. (1951). A Pierce® BCA Protein Assay Thermo Scientific kit was used, following the manufacturer protocol.

14411
©FUNPEC-RP www.funpecrp.com.brGenetics and Molecular Research 14 (4): 14406-14421 (2015)
Protein extraction method for the proteomic study of Zymomonas
2D electrophoresis and analysis of images
The equivalent of 200 µg protein was precipitated with trichloroacetic acid and redis-solved in rehydration buffer. Focusing was done using an immobilized pH gradient. Immobilized pH gradient strips were rehydrated in an IPGphor 3 isoelectric focusing apparatus (GE Health-care, Piscataway, NJ, USA) for 16-20 h at 20°C. The isoelectric focusing was performed in the following steps: 500, 800, 2900, and 11,300 Vh. After focusing, the strips were washed with ultrapure water, stored at -80°C, and balanced in two disulfide bridge-reducing solutions (Görg et al., 2004). The second dimension of the electrophoresis was performed in six vertical homo-geneous 15% acrylamide gels, three for the samples of 0 h and three for the samples of 72 h, as described by Laemmli (1970). The first step consisted of 50 mg DDT for each 5 mL equilibrium solution (composition: 6 M urea; 75 mM Tris-HCl, pH 8.8; 29.3% glycerol; 2% sodium dodecyl sulfate; and 0.002% bromophenol blue of a 1% solution). The separation of proteins was made at 10°C in a Hoefer SE600 Ruby cube (Amersham Bioscience). The images of the gels were acquired with a resolution of 300 dpi, then analyzed with the ImageMaster 2-D Platinum 6.0 software (GE Healthcare), in accordance with the manufacturer protocols. The quantity of each spot was normalized by the total intensity of valid spots.
Analysis of proteins by matrix-assisted laser desorption/ionization time-of-flight/ time-of-flight MS (MALDI-TOF/TOF MS)
The digestion of proteins on the gels was performed as described by Shevchenko et al. (2006), with some changes. Peptides were dissolved in 10 μL 0.1% trifluoroacetic acid. The satu-rated solution of 4 mg/mL alpha-cyano-4-hydroxycinnamic in 50% acetonitrile and 0.3% trifluo-roacetic acid was mixed with an equal amount of sample and placed in an AnchorChip 800/384 plate (Bruker Daltonik GmbH) and dried in a laminar airflow for recrystallization. The samples were analyzed in a MALDI TOF/TOF MS (Ultraflex, Bruker Daltonik GmbH) in reflectron mode. Peptides with a signal-to-noise ratio above 100 had their MS/MS analyzed using the LIFT technol-ogy that is embedded in the Ultraflex MS; on average, five MS/MS spectra were measured for each protein digested using two to five identified peptides. The data processing was carried out using flexAnalysis and BioTools software packages (Bruker Daltonik GmbH).
MS/MS data analysis
Data analysis was performed using the BioTools 3.0 software and the MASCOT search tool (Matrix Science, MK). The searches were conducted using the following param-eters: mass tolerance was set to 0.7 Da for ion fragments; trypsin was defined as a proteolytic enzyme with two missing cleavages; peptide loading of +1 was used; the carbamidomethyl-ation of cysteine residues was defined as fixed modification; and the oxidation of methionine residues was defined as variable modification.
RESULTS
Protein extraction methods
The concentrations of proteins extracted using the three methods are shown in Table 1.
14412
©FUNPEC-RP www.funpecrp.com.brGenetics and Molecular Research 14 (4): 14406-14421 (2015)
D.R. Cavalcanti et al.
The results showed that the greatest amount of protein was obtained by the phenol method, which proved to be significantly different (P < 0.05) from the TRIzol and lysis buffer methods (both with P > 0.05).
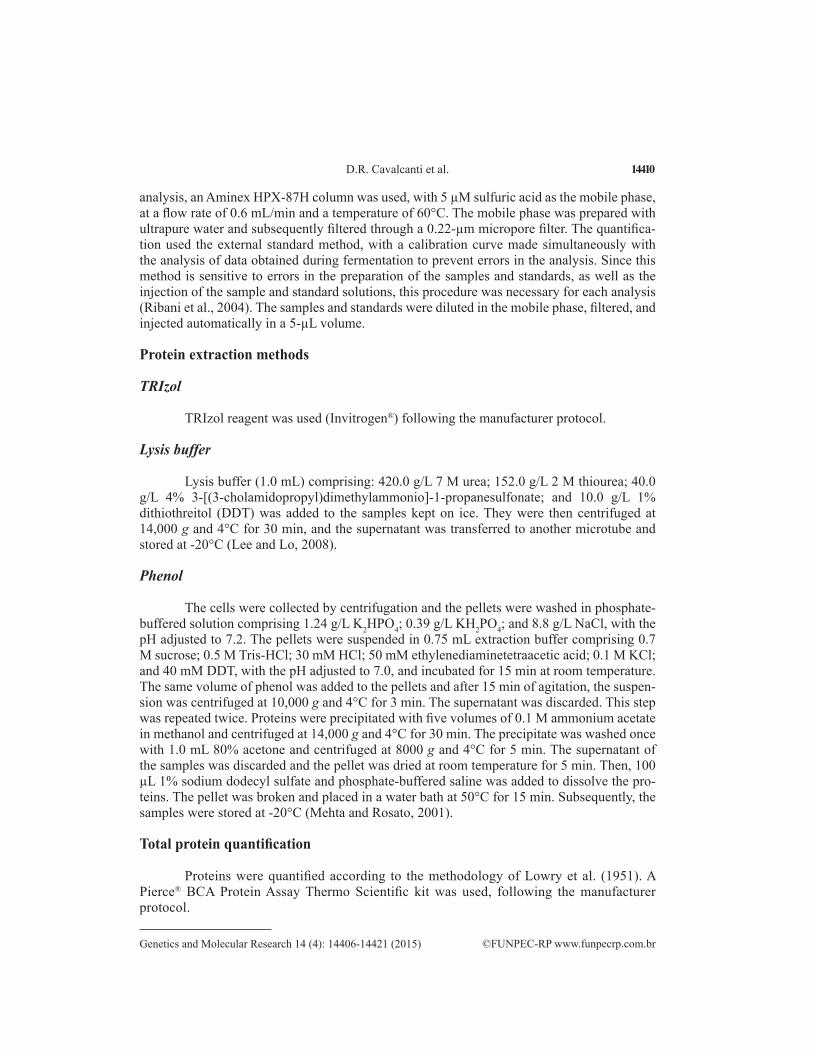
Figure 1. Representation of the protein profiles on 2-D gels of Zymomonas mobilis ZAG-12 using (A) TRIzol, (B) lysis buffer, and (C) phenol.
Microorganism TRIzol Lysis buffer Phenol
Zymomonas mobilis ZAG-12 1.11 ± 0.01 0.93 ± 0.01 1.44 ± 0.07
Values are reported as means ± SD for results of three experiments.
Table 1. Protein concentration (mg/mL) obtained by three different methods of protein extraction.
The samples were later subjected to 2-D electrophoresis and staining with Coomassie Brilliant Blue, whereupon it was noticed that the three methods detected an ample amount of acidic proteins at pH values ranging from around 3 to 6.5. However, the TRIzol method proved to be efficient in detecting a greater number of proteins in a pH range between neutral and alkaline, compared with the lysis buffer and phenol methods (Figure 1).

14413
©FUNPEC-RP www.funpecrp.com.brGenetics and Molecular Research 14 (4): 14406-14421 (2015)
Protein extraction method for the proteomic study of Zymomonas
Levans and ethanol production by Z. mobilis ZAG-12
The largest production of levans (3.90 g/L) was observed at 20°C, followed by 1.79 g/L at 30°C and 0.31 g/L at 40°C (Figure 2). With respect to ethanol production over 72 h of fermentation, the highest production (approximately 9.36 g/L) occurred at 30°C, followed by 6.86 g/L at 20°C and 3.36 g/L at 40°C (Figures 3, 4, and 5). The highest consumption of sub-strate occurred at 30°C (approximately 157.13 g/L sucrose consumed) (Figure 4), followed by 143.22 g/L at 40°C (Figure 5) and 142.88 g/L at 20°C (Figure 3). At temperatures of 20 and 40°C, a higher concentration of residual substrate was registered, corresponding to 11% of the initial substrate, whereas at 30°C, the residual substrate corresponded to 7% of the initial substrate. Figures 3, 4, and 5 show that after 72 h of fermentation, the substrate was not fully consumed. The continuation of the process for a longer period could result in higher yields of levans and consequently a reduction of the residual substrate.
Figure 2. Production of levan by Zymomonas mobilis ZAG-12 in 72 h of fermentation.
Figure 3. Consumption of sucrose and concentration of glucose, fructose and ethanol in 72 h of fermentation by Zymomonas mobilis ZAG-12, at 20°C.
Although the greatest consumption of substrate occurred at 30°C (Figure 4), the high-est conversion rate of product into substrate (YP/S) occurred at 20°C. At this temperature, the conversion factor of sucrose into levans was about twice that of the YP/S at 30°C and thirteen times greater than the YP/S at 40°C (Table 2). At the same temperature, it can also be noted that the YP/S for ethanol was greater (Table 3).

14414
©FUNPEC-RP www.funpecrp.com.brGenetics and Molecular Research 14 (4): 14406-14421 (2015)
D.R. Cavalcanti et al.
Figure 4. Consumption of sucrose and concentration of glucose, fructose and ethanol in 72 h of fermentation by Zymomonas mobilis ZAG-12, at 30°C.
Figure 5. Consumption of sucrose and concentration of glucose, fructose and ethanol in 72 h of fermentation by Zymomonas mobilis ZAG-12, at 40°C.
Table 2. Yield of levan by Zymomonas mobilis ZAG-12, in 72 h of fermentation.
Temperature (ºC) YP/S (g/g)
20° 0.02730° 0.01140° 0.002
Temperature (ºC) YP/S (g/g)
20° 0.06530° 0.04340° 0.023
Table 3. Yield of ethanol by Zymomonas mobilis ZAG-12, in 72 h of fermentation.

14415
©FUNPEC-RP www.funpecrp.com.brGenetics and Molecular Research 14 (4): 14406-14421 (2015)
Protein extraction method for the proteomic study of Zymomonas
Protein analysis
Approximately 1.1 mg/mL protein was obtained from 6 mL fermented substrate. The reso-lution of approximately 200 µg proteins loaded on each gel showed an average of 500 spots with an isoelectric point (pI) of 4-7 and a molecular mass of 10-220 kDa (Figures 6 and 7). The magnified image of 2-D gels can be seen in Figure 8. 2-D comparative analysis was conducted between the treatments (0 and 72 h), where the proteins found at time 0 h refer to proteins from the inoculum found at 30°C at a concentration of 100 g/L. The differentially expressed proteins, which were identified by MALDI-TOF/TOF (MS/MS), had an identification rate of 77.27% (34 of 44 spots).
Figure 6. Overview of the proteome of Zymomonas mobilis ZAG-12 at 0 h of fermentation for the production of levan, separated by bidimensional electrophoresis. The 2-D resolution of the proteome with IEF/SDS-PAGE showed pI of 4-7 linear and molecular mass of 10-220 kDa.
Figure 7. Overview of the proteome of Zymomonas mobilis ZAG-12 at 72 h of fermentation for the production of levan, separated by bidimensional electrophoresis. The 2-D resolution of the proteome with IEF/SDS-PAGE showed pI of 4-7 linear and molecular mass of 10-220 kDa.

14416
©FUNPEC-RP www.funpecrp.com.brGenetics and Molecular Research 14 (4): 14406-14421 (2015)
D.R. Cavalcanti et al.
Figure 8. Close-up of the areas of the bidimensional gels showing spots of differentially expressed proteins at 0 and 72 h. The indicated numbers are in accordance with those cited in Table 4.
Protein regulation in the process of levans and ethanol production
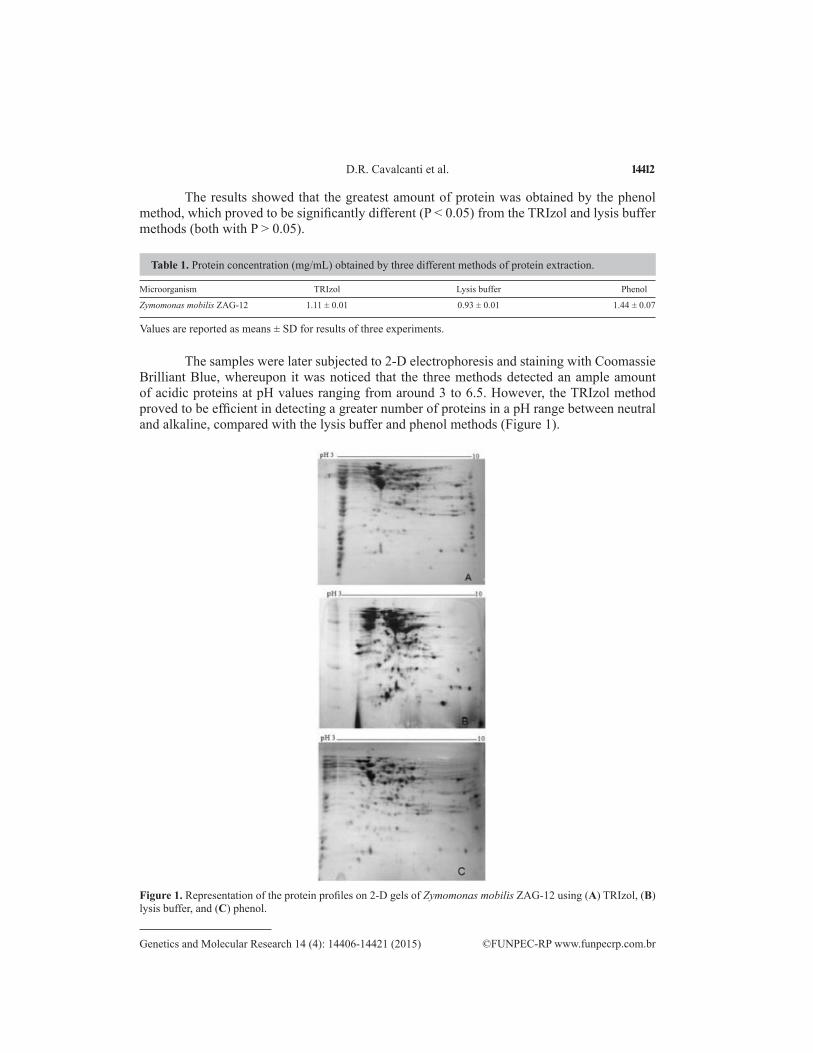
Protein reactions in the production of levans and ethanol were evaluated by compar-ing the gels in triplicate at both the initial and final time. Using the 2-D-PAGE approach, it was possible to identify 34 differentially expressed spots (Table 4). Among these, 19 showed increased expression at 0 h of fermentation (proteins from the inoculum) and 15 showed in-creased expression at 72 h of fermentation.
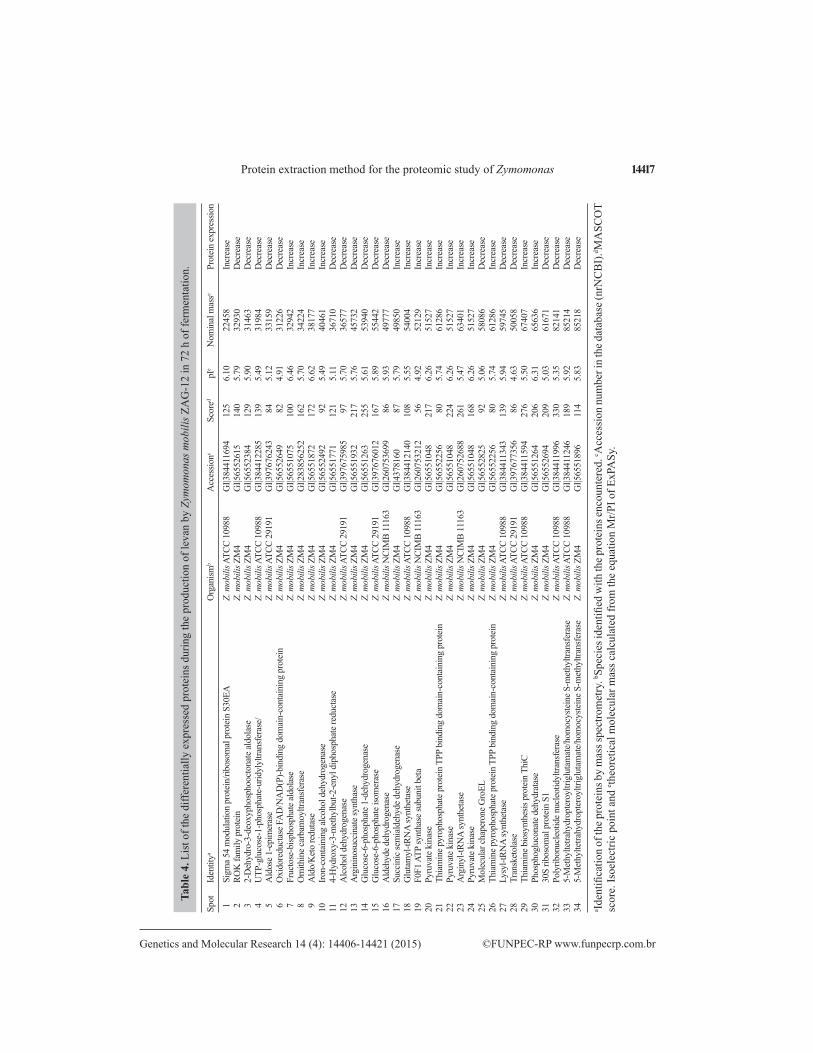
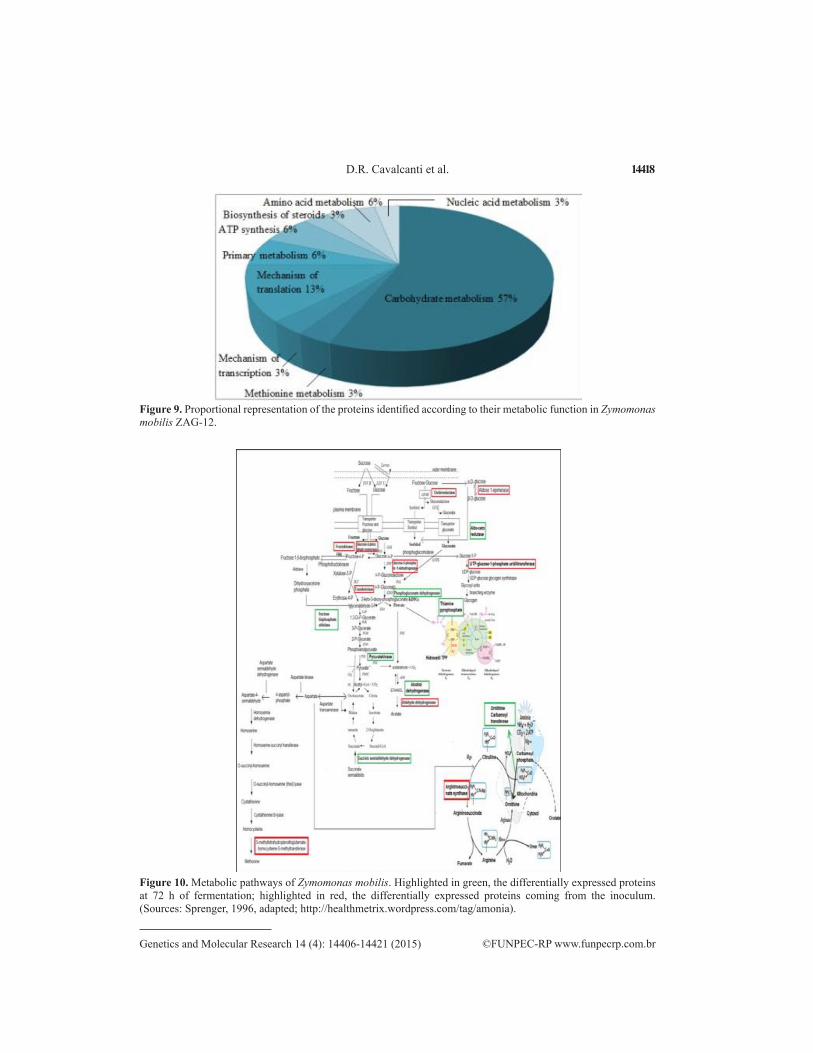
Most of the proteins identified are involved in the metabolism of carbohydrates (57%); others in mechanisms of translation and transcription (Figure 9). These act as enzymes cata-lyzing important reactions in several metabolic pathways for the production of ethanol, levans, and other products (Figure 10).
14417
©FUNPEC-RP www.funpecrp.com.brGenetics and Molecular Research 14 (4): 14406-14421 (2015)
Protein extraction method for the proteomic study of ZymomonasTa
ble
4. L
ist o
f the
diff
eren
tially
exp
ress
ed p
rote
ins d
urin
g th
e pr
oduc
tion
of le
van
by Z
ymom
onas
mob
ilis Z
AG
-12
in 7
2 h
of fe
rmen
tatio
n.
Spot
Id
entit
ya O
rgan
ismb
Acc
essio
nc Sc
ored
pIe
Nom
inal
mas
se Pr
otei
n ex
pres
sion
1
Sigm
a 54
mod
ulat
ion
prot
ein/
ribos
omal
pro
tein
S30
EA
Z. m
obili
s ATC
C 10
988
GI|3
8441
1694
12
5 6.
10
2245
8 In
crea
se 2
RO
K fa
mily
pro
tein
Z.
mob
ilis Z
M4
GI|5
6552
615
140
5.79
32
930
Dec
reas
e 3
2-
Deh
ydro
-3-d
eoxy
phos
phoo
cton
ate a
ldol
ase
Z. m
obili
s ZM
4 G
I|565
5238
4 12
9 5.
90
3146
3 D
ecre
ase
4
UTP
-glu
cose
-1-p
hosp
hate
-urid
ylyl
trans
fera
se/
Z. m
obili
s ATC
C 10
988
GI|3
8441
2285
13
9 5.
49
3198
4 D
ecre
ase
5
Ald
ose 1
-epi
mer
ase
Z. m
obili
s ATC
C 29
191
GI|3
9767
6243
8
4 5.
12
3315
9 D
ecre
ase
6
Oxi
dore
duct
ase F
AD
/NA
D(P
)-bin
ding
dom
ain-
cont
aini
ng p
rote
in
Z. m
obili
s ZM
4 G
I|565
5264
9 8
2 4.
91
3122
6 D
ecre
ase
7
Fruc
tose
-bisp
hosp
hate
aldo
lase
Z.
mob
ilis Z
M4
GI|5
6551
075
100
6.46
32
942
Incr
ease
8
Orn
ithin
e car
bam
oyltr
ansf
eras
e Z.
mob
ilis Z
M4
GI|2
8385
6252
16
2 5.
70
3422
4 In
crea
se 9
A
ldo/
Ket
o re
duta
se
Z. m
obili
s ZM
4 G
I|565
5187
2 17
2 6.
62
3817
7 In
crea
se10
Iro
n-co
ntai
ning
alco
hol d
ehyd
roge
nase
Z.
mob
ilis Z
M4
GI|5
6552
492
92
5.49
40
461
Incr
ease
11
4-H
ydro
xy-3
-met
hylb
ut-2
-eny
l dip
hosp
hate
redu
ctas
e Z.
mob
ilis Z
M4
GI|5
6551
771
121
5.11
36
710
Dec
reas
e12
A
lcoh
ol d
ehyd
roge
nase
Z.
mob
ilis A
TCC
2919
1 G
I|397
6759
85
97
5.70
36
577
Dec
reas
e13
A
rgin
inos
ucci
nate
synt
hase
Z.
mob
ilis Z
M4
GI|5
6551
932
217
5.76
45
732
Dec
reas
e14
G
luco
se-6
-pho
spha
te 1
-deh
ydro
gena
se
Z. m
obili
s ZM
4 G
I|565
5126
3 25
5 5.
61
5394
0 D
ecre
ase
15
Glu
cose
-6-p
hosp
hate
isom
eras
e Z.
mob
ilis A
TCC
2919
1 G
I|397
6760
12
167
5.89
55
442
Dec
reas
e16
A
ldeh
yde d
ehyd
roge
nase
Z.
mob
ilis N
CIM
B 11
163
GI|2
6075
3699
8
6 5.
93
4977
7 D
ecre
ase
17
Succ
inic
sem
iald
ehyd
e deh
ydro
gena
se
Z. m
obili
s ZM
4 G
I|437
8160
8
7 5.
79
4985
0 In
crea
se18
G
luta
myl
-tRN
A sy
nthe
tase
Z.
mob
ilis A
TCC
1098
8 G
I|384
4121
40
108
5.55
54
004
Incr
ease
19
F0F1
ATP
synt
hase
subu
nit b
eta
Z. m
obili
s NCI
MB
1116
3 G
I|260
7532
12
56
4.92
52
129
Incr
ease
20
Pyru
vate
kin
ase
Z. m
obili
s ZM
4 G
I|565
5104
8 21
7 6.
26
5152
7 In
crea
se21
Th
iam
ine p
yrop
hosp
hate
pro
tein
TPP
bin
ding
dom
ain-
cont
aini
ng p
rote
in
Z. m
obili
s ZM
4 G
I|565
5225
6 8
0 5.
74
6128
6 In
crea
se22
Py
ruva
te k
inas
e Z.
mob
ilis Z
M4
GI|5
6551
048
224
6.26
51
527
Incr
ease
23
Arg
inyl
-tRN
A sy
nthe
tase
Z.
mob
ilis N
CIM
B 11
163
GI|2
6075
2688
26
1 5.
47
6340
1 In
crea
se24
Py
ruva
te k
inas
e Z.
mob
ilis Z
M4
GI|5
6551
048
168
6.26
51
527
Incr
ease
25
Mol
ecul
ar ch
aper
one G
roEL
Z.
mob
ilis Z
M4
GI|5
6552
825
92
5.06
58
086
Dec
reas
e26
Th
iam
ine p
yrop
hosp
hate
pro
tein
TPP
bin
ding
dom
ain-
cont
aini
ng p
rote
in
Z. m
obili
s ZM
4 G
I|565
5225
6 8
0 5.
74
6128
6 In
crea
se27
Ly
syl-t
RNA
synt
heta
se
Z. m
obili
s ATC
C 10
988
GI|3
8441
1343
13
9 5.
94
5974
5 D
ecre
ase
28
Tran
sket
olas
e Z.
mob
ilis A
TCC
2919
1 G
I|397
6773
56
86
4.63
50
058
Dec
reas
e29
Th
iam
ine b
iosy
nthe
sis p
rote
in T
hiC
Z. m
obili
s ATC
C 10
988
GI|3
8441
1594
27
6 5.
50
6740
7 In
crea
se30
Ph
osph
oglu
cona
te d
ehyd
rata
se
Z. m
obili
s ZM
4 G
I|565
5126
4 20
6 6.
31
6563
6 In
crea
se31
30
S rib
osom
al p
rote
in S
1 Z.
mob
ilis Z
M4
GI|5
6552
694
209
5.03
61
671
Dec
reas
e32
Po
lyrib
onuc
leot
ide n
ucle
otid
yltra
nsfe
rase
Z.
mob
ilis A
TCC
1098
8 G
I|384
4119
96
330
5.35
82
141
Dec
reas
e33
5-
Met
hylte
trahy
drop
tero
yltri
glut
amat
e/ho
moc
yste
ine S
-met
hyltr
ansf
eras
e Z.
mob
ilis A
TCC
1098
8 G
I|384
4112
46
189
5.92
85
214
Dec
reas
e34
5-
Met
hylte
trahy
drop
tero
yltri
glut
amat
e/ho
moc
yste
ine S
-met
hyltr
ansf
eras
e Z.
mob
ilis Z
M4
GI|5
6551
896
114
5.83
85
218
Dec
reas
e
a Iden
tifica
tion
of th
e pro
tein
s by
mas
s spe
ctro
met
ry. b S
peci
es id
entifi
ed w
ith th
e pro
tein
s enc
ount
ered
. c Acc
essi
on n
umbe
r in
the d
atab
ase (
nrN
CB
I).d M
ASC
OT
scor
e. Is
oele
ctric
poi
nt a
nd e th
eore
tical
mol
ecul
ar m
ass c
alcu
late
d fr
om th
e eq
uatio
n M
r/PI o
f ExP
ASy
.
14418
©FUNPEC-RP www.funpecrp.com.brGenetics and Molecular Research 14 (4): 14406-14421 (2015)
D.R. Cavalcanti et al.
Figure 9. Proportional representation of the proteins identified according to their metabolic function in Zymomonas mobilis ZAG-12.
Figure 10. Metabolic pathways of Zymomonas mobilis. Highlighted in green, the differentially expressed proteins at 72 h of fermentation; highlighted in red, the differentially expressed proteins coming from the inoculum. (Sources: Sprenger, 1996, adapted; http://healthmetrix.wordpress.com/tag/amonia).
14419
©FUNPEC-RP www.funpecrp.com.brGenetics and Molecular Research 14 (4): 14406-14421 (2015)
Protein extraction method for the proteomic study of Zymomonas
DISCUSSION
Sample preparation and high-quality resolution are the most important factors in the analysis and quantification of high- and low-protein expression in 2-D electrophoresis. It is quite relevant to select a standard test for the appropriate choice of a sample, as proteins have different chemical and physical properties, based on the fact that certain extraction protocols can favor different types of sample proteins (Mehmeti et al., 2011). Obtaining good-quality results on 2-D electrophoresis gels depends on the way the sample is treated prior to pI focus-ing (Lee and Lo, 2008).
In proteomics, evaluation, selection, and standardization of efficient methods are required for the analysis of proteins, since the presence of non-protein impurities can severely affect the quality of 2-D-PAGE separation by the formation of stains or artifacts (Mehmeti et al., 2011). Z. mobilis bacteria contain a large quantity of substances that can affect the quality of electrophoreto-grams, such as salts and polysaccharides, among others, which if not properly treated will produce a poor-quality result. Amphoteric compounds in samples dramatically affect the pI gradient, result-ing in narrow vertical areas without protein stains. For this reason, the reagents used must be of low salt content and high purity. Time is also a factor to be taken into consideration to reduce the possibility of protein loss and modification (Lee and Lo, 2008).
Of the three protein extraction procedures, TRIzol extraction resulted in a lower concen-tration of proteins than did phenol extraction. However, the TRIzol method presented good resolu-tion of items stained with a light background (Figure 1A). The lysis buffer extraction method was the simplest and fastest of the three methods tested; however, the amount of proteins extracted was much lower than in the other methods. Lee and Lo (2008) compared the TRIzol method with the ly-sis buffer and acetone precipitation methods in dinoflagellates. Of these, the TRIzol method proved to be superior, in terms of both protein concentration and image resolution. Excessive streaking, spots, and agglomerations within a single region in the pH range of 3-10 make it difficult to deter-mine the number of spots, as in the lysis buffer method (Figure 1B). In this case, it was necessary to use strips with a pH of 4-7, as the majority of the proteins are acidophilic.
Samples treated with TRIzol provided the best results among the methods examined, showing smaller steaks. In short, with regards to 2-D profiles in the studies, TRIzol is better for the extraction of proteins from chemically resistant samples with thick cell walls in the presence of interfering compounds, such as DNA, RNA, carbohydrates, and proteolytic and oxidative enzymes (Lee and Lo, 2008).
The greatest consumption of substrate occurred at 30°C; the low rate of conversion of sucrose to levans can be explained by the fact that higher temperatures, around 30°-35°C, favor ethanol production, as well as the production of gluconic acid and sorbitol by-products, which contribute to the decrease in the conversion of the substrate to levans (Viikari and Gisler, 1986; Doelle et al., 1993; Calazans, 1997).
The results obtained for the YP/S of levans were corroborated by those described in a similar study, confirming that at temperatures below 30°C there is greater polymerization of fructose into levans. Temperatures below 30°C favor polymerization of fructose into levans, at the expense of ethanol production, which simultaneously inhibits the activity of certain enzymes that are involved in substrate conversion to ethanol, gluconic acid, and sorbitol at temperatures up to 25°C (Calazans, 1997). The conversion factors for both levans and ethanol were greater at 20°C. Based on the results obtained, 20°C was chosen as the optimum temperature for proteomic analysis, at which levans were favored in comparison with the other temperatures tested.

14420
©FUNPEC-RP www.funpecrp.com.brGenetics and Molecular Research 14 (4): 14406-14421 (2015)
D.R. Cavalcanti et al.
Conflicts of interest
The authors declare no conflict of interest.
ACKNOWLEDGMENTS
The authors declare their gratitude for research grants supplied by the following Bra-zilian agencies: Conselho Nacional de Desenvolvimento Científico e Tecnológico (CNPq), Coordenação de Aperfeiçoamento de Pessoal de Nível Superior (CAPES), and Fundação de Amparo à Ciência e Tecnologia do Estado de Pernambuco (CAPES).
REFERENCES
Amaral DOJ, Lima MMA, Resende LV and Silva MV (2008). Differential gene expression in tomato induced by salicylic acid and Fusarium oxysporum f. sp. lycopersici. Pesq. Agropec. Bras. 43: 1017-1023.
Calazans GMT (1987). Fermentação etanólica por Zymomonas mobilis (cepa ZAP). Dissertation, Federal University of Pernambuco, Recife.
Calazans GMT (1997). Produção de levansa para uso clínico. Dissertation, Federal University of Rio de Janeiro, Rio de Janeiro.
Calazans GMT, Lopes CE, Lima RMOC and França FP (1997). Antitumour activities of levans produced by Zymomonas mobilis strains. Biotechnol. Lett. 19: 19-21.
Calazans GMT, Lima RC, de França FP and Lopes CE (2000). Molecular weight and antitumour activity of Zymomonas mobilis levans. Int. J. Biol. Macromol. 27: 245-247.
Chen S and Harmon AC (2006). Advances in plant proteomics. Proteomics 6: 5504-5516.Cornish-Bowden A and Cárdenas ML (2000). From genome to cellular phenotype - a role for metabolic flux analysis?
Nat. Biotechnol. 18: 267-268.de Morais JO, Rios EM, Calazans GM and Lopes CE (1993). Zymomonas mobilis research in the Pernambuco Federal
University. J. Biotechnol. 31: 75-91.Doelle HW, Kirk L, Crittenden R, Toh H, et al. (1993). Zymomonas mobilis - science and industrial application. Crit. Rev.
Biotechnol. 13: 57-98.Ernandes FMPG and Garcia-Cruz CH (2005). Levansa bacteriana: aspectos tecnológicos, características e produção.
Semina: Cienc. Agrárias 26: 71-82.Galdos ACR (2009). Análise proteômica do saco vitelino de bovinos. Dissertation, University of São Paulo, São Paulo.Görg A, Weiss W and Dunn MJ (2004). Current two-dimensional electrophoresis technology for proteomics. Proteomics
4: 3665-3685.Gygi SP, Rist B, Gerber SA, Turecek F, et al. (1999). Quantitative analysis of complex protein mixtures using isotope-
coded affinity tags. Nat. Biotechnol. 17: 994-999.Hatzimanikatis V, Emmerling M, Sauer U and Bailey JE (1998). Application of mathematical tools form metabolic design
of microbial ethanol production. Biotechnol. Bioeng. 58: 154-161.Kang HL and Kang HS (1998). A physical map of the genome of ethanol fermentative bacterium Zymomonas mobilis ZM4
and localization of genes on the map. Gene 206: 223-228.Laemmli UK (1970). Cleavage of structural proteins during the assembly of the head of bacteriophage T4. Nature 227:
680-685.Lee FW and Lo SC (2008). The use of Trizol reagent (phenol/guanidine isothiocyanate) for producing high quality two-
dimensional gel electrophoretograms (2-DE) of dinoflagellates. J. Microbiol. Methods 73: 26-32.Lee JS, Jin SJ and Kang HS (2001). Molecular organization of the ribosomal RNA transcription unit and the phylogenetic
study of Zymomonas mobilis ZM4. Mol. Cells 11: 68-74.Lowry OH, Rosebrough NJ, Farr AL and Randall RJ (1951). Protein measurement with the Folin phenol reagent. J. Biol.
Chem. 193: 265-275.McGill DJ and Dawes EA (1971). Glucose and fructose metabolism in Zymomonas anaerobia. Biochem. J. 125: 1059-1068.Mehmeti I, Kiran F and Osmanagaoglu O (2011). Comparison of three methods for determination of protein concentration
in lactic acid bacteria for proteomics studies. Afr. J. Biotechnol. 10: 2178-2185.Mehta A and RosatoYB (2001). Differentially expressed proteins in the interaction of Xanthomonas axonopodis pv. citri

14421
©FUNPEC-RP www.funpecrp.com.brGenetics and Molecular Research 14 (4): 14406-14421 (2015)
Protein extraction method for the proteomic study of Zymomonas
with leaf extract of the host plant. Proteomics 1: 1111-1118.Najafpour GD (2007). Biochemical engineering and biotechnology. Elsevier, Amsterdam.Natarajan S, Xu C, Caperna TJ and Garrett WM (2005). Comparison of protein solubilization methods suitable for
proteomic analysis of soybean seed proteins. Anal. Biochem. 342: 214-220.Rabilloud T, Chevallet M, Luche S and Lelong C (2010). Two-dimensional gel electrophoresis in proteomics: Past,
present and future. J. Proteomics 73: 2064-2077.Ranzan C (2010). Fermentação contínua de Z. mobilis: modelagem, ajuste de parâmetros e inferências a partir do consumo
de hidróxido de sódio. Dissertation, Federal University of Rio Grande do Sul, Porto Alegre.Redmond E (2010). Sobrecarga da amonia. Healthmetrix. Available at [ttps://healthmetrix.wordpress.com/2010/08/11/
sobrecarga-da-amonia/]. Accessed April 3, 2015.Reiss M and Hartmeier W (1990). Levans Production with a flocculent strain of Zymomonas mobilis. Food Biotechnol.
4: 69-75.Ribani M, Bottoli CBG, Collins CH, Jardim ICSF, et al. (2004). Validação em métodos cromatográficos e eletroforéticos.
Quim. Nova 27: 771-780.Seo JS, Chong H, Park HS, Yoon KO, et al. (2005). The genome sequence of the ethanologenic bacterium Zymomonas
mobilis ZM4. Nat. Biotechnol. 23: 63-68.Shevchenko A, Tomas H, Havlis J, Olsen JV, et al. (2006). In-gel digestion for mass spectrometric characterization of
proteins and proteomes. Nat. Protoc. 1: 2856-2860.Silva MCP (1996). Influência do controle do pH sobre a produção de levansa pela Zymomonas mobilis ZAG-12 em meio
à base de sacarose. Dissertation, Federal University of Pernambuco, Recife.Sprenger GA (1996). Carbohydrate metabolism in Zymomonas mobilis: a catabolic highway with some scenic routes.
FEMS Microbiol. Lett. 145: 301-307.Swings J and De Ley J (1977). The Biology of Zymomonas. Bacteriol. Rev. 41: 1-46.Toma MM, Kalnenieks U, Berzins A, Vigants A, et al. (2003). The effect of mixing on glucose fermentation by Zymomonas
mobilis continuous culture. Process Biochem. 38: 1347-1350.Viikari L and Gisler R (1986). By-products in the fermentation of sucrose by different Zymomonas-strains. Appl.
Microbiol. Biotechnol. 23: 240-244.Yang S, Tschaplinski TJ, Engle NL, Carroll SL, et al. (2009). Transcriptomic and metabolomic profiling of Zymomonas
mobilis during aerobic and anaerobic fermentations. BMC Genomics 10: 34.Zaldivar J, Nielsen J and Olsson L (2001). Fuel ethanol production from lignocellulose: a challenge for metabolic
engineering and process integration. Appl. Microbiol. Biotechnol. 56: 17-34.