protective or counter-productive? labour market
TRANSCRIPT
PROTECTIVE OR COUNTER-PRODUCTIVE? LABOURMARKET INSTITUTIONS AND THE EFFECT OF
IMMIGRATION ON EU NATIVES*
Joshua D. Angrist and Adriana D. Kugler
Reduced labour market flexibility may protect some native workers from immigrant competi-tion but can increase negative effects on equilibrium employment. This motivates an analysis ofimmigration effects interacted with institutions. OLS estimates for European countries showsmall, mostly negative immigration effects while an IV strategy based on immigrants fromformer Yugoslavia generates larger though mostly insignificant negative estimates. Specifica-tions allowing interactions between immigration and measures of labour and product marketrigidity are consistent with the view that reduced flexibility increases negative immigrationeffects. The estimates typically imply more native job losses in countries with restrictive insti-tutions, especially restricted product markets.
The European immigration policy debate is fuelled by the fact that immigrationnow accounts for the bulk of population growth in the European Union (EU)(OECD, 1999a). Many observers also note that increased immigration is likely tobe part of any strategy to keep European social security systems solvent. At thesame time, the rise in immigration has been associated with high levels of anti-foreigner sentiment, and the view that immigrants take jobs from natives is wide-spread (Bauer et al., 2000). The evidence on the employment consequences ofimmigration in Europe is more fragmentary and harder to assess than the USevidence, which generally shows few effects (Friedberg and Hunt, 1995). In arecent survey, however, Bauer and Zimmermann (1999) conclude that, popularsentiment notwithstanding, the employment consequences of immigration forEuropean natives have probably been modest.1
This paper takes a fresh look at the employment consequences of immigrationin Western Europe, motivated by two considerations. First, we use the Balkan Warsas a Mariel-Boatlift style immigration experiment along the lines of Card’s (1990).Second, we focus on institutional aspects of the immigration question. Many ob-servers have argued that persistent high unemployment in Europe is due to in-stitutions that increase turnover and employment costs, e.g. OECD (1994).
* Special thanks go to Alberto Martin at Eurostat Madrid and Ana Franco at Eurostat Luxembourgfor providing the data and to Chris Hansen for outstanding research assistance. For helpful discussionsand comments, we are grateful to Daron Acemoglu, Manolo Arellano, Samuel Bentolila, GiuseppeBertola, David Card, Antonio Ciccone, Gabriel Felbermayr, Dan Hamermesh, Andrea Ichino, LarryKenny, Francis Kramarz, Dan Olof-Rooth, Patrick Puhani, Gilles Saint-Paul, Klaus Zimmermann, theeditor, an anonymous referee, and seminar participants at the Atlanta Fed, CEMFI, CEPR, EUI, Mac-Master University, MIT, Sloan, SOLE, Toulouse, Tilburg, Universitat Autonoma de Barcelona, Uni-versitat Pompeu Fabra, and the University of Florida.
1 European studies include Pischke and Velling (1997) for Germany; Winter-Ebmer and Zweimuller(1997) for Austria, and Dolado et al. (1996) for Spain. Similar to Card’ (1990) Mariel Boatlift researchdesign, Hunt (1994) compares regions in France after Algerian independence and Carrington anddeLima (1996) compare Portugal and Spain after an influx of Portuguese returnees. Hunt’s (1992)results show more evidence of disemployment effects than the American studies while Carrington anddeLima’s (1996) results are inconclusive.
The Economic Journal, 113 (June), F302–F331. � Royal Economic Society 2003. Published by BlackwellPublishing, 9600 Garsington Road, Oxford OX4 2DQ, UK and 350 Main Street, Malden, MA 02148, USA.
[ F302 ]

Recently, Blanchard and Wolfers (2000) extended this inquiry by suggesting thatthe negative employment consequences of a rigid labour market are felt not somuch in good times, but rather in the labour market’s response to adverse de-mand shocks. Here, we integrate the institutions debate with an analysis of shocksthat occur on the labour-supply side. In particular, we ask whether institutionalcharacteristics, such as employment protection, high replacement rates, rigid wa-ges, and high business entry costs, affect the employment consequences of im-migration-induced increases in the work force.
While economic institutions play a number of roles, one rationale for institu-tions that reduce flexibility is to protect natives and especially incumbent workersfrom competition in the labour and product markets. In fact, Rodrik (1997) hasargued that the demand for social insurance is in part a response to the pressuresof global economic integration, including increased migration. However, theequilibrium consequences of protective regulations and institutions are unclear.We therefore begin with a theoretical discussion of immigration interactions withinstitutions. Although employment protection and entry barriers may reduce jobloss in the short run, our theoretical discussion shows why reduced flexibility maybe counter-productive, possibly amplifying any negative employment conse-quences of immigration for natives.2
The empirical relationship of interest in this study is the effect of immigrantshares on native employment rates, where this effect is allowed to vary with insti-tutional characteristics. The estimates use a panel data set for European EconomicArea (EEA) countries for 1983–99.3 At our request, the European Commission’sstatistical agency (Eurostat) produced consistent time series of immigrationmeasures and labour market variables by age, sex, education, and nationality ornativity. This data set allows us to conduct analyses much like previous immigrationresearch for the US and individual European countries using micro data, whileallowing consistent cross-country comparisons. In addition to exploring interac-tions with institutions, our cross-country analysis may address some of the meth-odological questions raised in the previous literature on immigration effects. First,cross-country data may be less affected by endogenous mobility than data on USstates or cities. Second, bias from endogenous mobility may be mitigated by use ofthe two 1990s’ Balkan Wars (in Bosnia and Kosovo) as a source of exogenousvariation providing shocks to immigrant flows in Europe.
1. Theoretical Framework
A competitive model with two types of labour and exogenous separations illustratesstandard predictions regarding the impact of immigrants on natives, and showshow the effect of immigrants on native employment might be modified by
[ J U N E 2003] F303I N S T I T U T I O N S A N D T H E . . .
2 Previous theoretical studies of interactions between immigration effects and labour market flexi-bility include Schmidt et al. (1994) and Razin and Sadka (1996). Kugler and Saint-Paul (2003) look atthe interaction between employment protection and the re-employment prospects of workers subject toindividual shocks.
3 Our sample is not exactly the EEA. It includes the EU 15 plus Iceland and Norway, omits Liech-tenstein but includes Switzerland, which opted out of the EEA.
� Royal Economic Society 2003

institutions such as firing costs. Although our theoretical framework does not leadto a detailed structural specification, it serves to motivate the empirical work. Thesetup is similar to that appearing in earlier analyses of immigration questions,augmented with elements used by Acemoglu and Angrist (2001) and Saint-Paul(1996) to study the effects of labour market regulation and employment protec-tion. The main predictions are that immigration tends to reduce native employ-ment if natives and immigrants are at least moderately substitutable in production;labour market institutions that reduce the employment of natives but not immi-grants may exacerbate the short-run negative impact of immigration; and finallythat barriers to firm entry slow the rate at which employment returns to pre-immigration levels.
To make these points, firm output is assumed to be produced by immigrants andnatives with production function,
f ½hg ðNt ; ItÞ�;
g ðNt ; ItÞ ¼ ðN qt þ cI q
t Þ1=q;
where Nt is the number of natives (or nationals) and It is the number ofimmigrants (or non-nationals). The function g(Nt, It) is a CES-type labouraggregate as in Card (2001) and h is a location-specific shifter as in Lalonde andTopel (1991). The first derivative of the production function is positive and thesecond derivative is negative, reflecting the presence of inputs other than thelabour aggregate. Our approach differs modestly from others in the literature inthat we specify CES interaction between immigrants and natives as a group. Incontrast, immigrant-native complementarity in Altonji and Card (1991) isgenerated by differences in skill or education, with groups at the same skill levelbeing perfect substitutes. Language differences make this harder to motivate inthe European context, while at the same time immigrants to the EU are notdramatically less educated than natives.
An important feature of many European labour markets is high firing costs.These come in the form of bureaucratic limitations on dismissals, requirements forseverance pay, and restrictive collective bargaining agreements. Immigrants areprobably less likely than natives to be covered by these provisions, however, sinceimmigrants are more likely to work in non-union jobs, on fixed-term contracts(e.g., if they have only temporary work permits), or illegally. We therefore intro-duce positive firing costs in the amount CN for natives, with no firing costs forimmigrants. Firing costs are paid when, every period, a proportion k of the labourforce becomes unproductive in the current job, and is therefore laid off.4 Immi-grants and natives are paid real wages, wNt and wIt, with the price of output asnumeraire.
4 As in Acemoglu and Angrist (2001), productivity declines are assumed to be large enough andfiring costs low enough that laying off unproductive workers is indeed worthwhile. In practice, pro-ductivity may be endogenous and determined in part by employment protection; see Ichino andRiphahn (2000), for evidence. We ignore hiring costs since adjustment costs are linear in our model, asin Saint-Paul (1996).
F304 [ J U N ET H E E C O N O M I C J O U R N A L
� Royal Economic Society 2003

Immigration effects are derived in a simple dynamic setup where price-takingfirms act to maximise the present value of profits, with discount factor u. Inparticular, firms’ objective functions can be written,
P ¼X1
t¼0
utff ½hg ðNt ; ItÞ� wNtNt wItIt kCN Nt1g:
Adjustment costs are linear and there is no aggregate uncertainty, so timesubscripts can be dropped and the objective simplified to be:
P ¼ ð1 uÞ1½f ðhg Þ wN N wI I ukCN N �: ð1Þ
Employment levels are chosen to satisfy the first order conditions
f 0ðhg ÞhgN ¼ wN þ ukCN ¼ wN ð1 þ ukcN Þ ð2aÞ
and
f 0ðhg ÞhgI ¼ wI ; ð2bÞ
where gN and gI are derivatives of g(N, I). Equation (2a), which implicitly definesthe demand function for native labour, equates the flow cost of native workers withtheir marginal product. The flow cost of employing immigrants is just theimmigrant wage. Note that firing costs, cN, are now defined as a proportional to thenative wage, in line with the specification of firing costs in many countries. InSpain, for example, unjust dismissal costs are set at about 12% of annual earnings.
The labour supply of immigrants is assumed to be perfectly inelastic, at least forthe range of wage levels observed in the host country. The immigrant population isdenoted by M, employed in equal numbers at each of m identical firms, so thatI ¼ M/m. In contrast, native labour supply is elastic and determined by a secondinstitutional characteristic, unemployment insurance replacement rates, as well asby wages. The distinction between immigrant and native labour supply seemsreasonable since natives are more likely than immigrants to have access to socialinsurance. The native labour supply function is
N � ¼ mN ¼ ½wN ð1 rÞ�eP ; ð3Þ
where P is the native population, r is the unemployment insurance replacementrate, and e is the native labour supply elasticity, assumed to be positive. Forwhat follows, it is useful to define the inverse labour supply function,wN(N, e) ” (mN/P)1/e(1 ) r))1.
The short-run analysis of this model takes the number of firms, m, to be fixed,while the long-run response is obtained by allowing m to be endogenous anddetermined by the condition that profits are equal to entry costs. In the short run,(2a), (2b), and (3) determine the two endogenous wage levels and the number ofemployed natives. Since immigrant labour supply is exogenous, the key equilib-rium condition can be written as follows
ln f 0½hg ðN ; I Þ� þ ln h þ ln gN ðN ; I Þ ¼ lnwN þ lnð1 þ ukcN Þ
ð1=eÞ lnðN =PÞ þ ð1=eÞ ln m þ ukcN þ r : ð4Þ
2003] F305I N S T I T U T I O N S A N D T H E E F F E C T O F I M M I G R A T I O N
� Royal Economic Society 2003

This equation determines native employment, which can then be substituted backinto the labour supply equation to find native wages.
Equation (4) provides the basis for our empirical work, which relates the log ofnative employment to the log of the immigrant share in the labour force. Fol-lowing Lalonde and Topel (1991), we think of the estimates as approximating (4)to first order in logs. The estimating equation is assumed to hold at the countrylevel since firms are taken to be identical except for an additive random error andfactors that can be absorbed by country and year effects. Before turning to theempirical results, the theoretical framework is used to highlight possible interac-tions between institutional characteristics and immigration effects. We start withthe short-run impact of immigration on total native employment, N * ” mN, andthe question of whether ¶N */¶M changes with firing costs, cN; replacement rates,r; and the degree of native wage flexibility. We then consider long-run impacts andthe interaction between immigration and product market restrictions.
The short-run employment impact of immigration can be written in elasticityterms as follows,
dln N �=dln M ¼ ð@N =@I ÞðI=N Þ ¼ nNI ðe1 nNN Þ1 � eðN ; eÞ; ð5Þ
where nNI and nNN are the elasticities of factor price for native wage rates withrespect to immigrant and native employment. That is, nNI ¼ (¶wN/¶I)(I/wN) andnNN ¼ (¶wN/¶N)(N/wN), as determined by the demand curve for native labour.The notation e(N, e) is used as shorthand for dlnN*/dlnM to emphasise the factthat parameters other than the labour supply elasticity modify the immigrantimpact only through native employment levels. This expression, derived in ourworking paper (Angrist and Kugler, 2001), is similar to the corresponding relationin Johnson’s (1980) static model, though here immigration has an ambiguouseffect on native employment. The own-wage term nNN is negative, so thedenominator is positive, but nNI in the numerator can be positive or negativedepending on the extent of immigrant-native complementarity.
Immigration is predicted to reduce native wage rates for most plausible pa-rameter values in this sort of model, so that e(N, e) is negative (Altonji and Card,1991; Ichino, 1993). Of course, if immigrants and natives are perfect substitutes(q ¼ 1), then nNI and e(N, e) are necessarily negative. More generally, immigrantsdisplace natives as long as the elasticity of substitution between immigrants andnatives, 1/(1 ) q), is above the Cobb–Douglass benchmark of 1 (or even less than1 if demand for natives is less than unit elastic). Assuming technological param-eters are in this range, immigration reduces native employment, with larger effectswhen native labour supply is more elastic.
To see how the employment effects of immigration are modified by changes infiring costs, note that cN does not appear directly in the derivative e(N, e). Thus, anychange in the size of the employment response is due to the impact of firing costson employment levels. In other words,
@e=@cN ¼ ð@e=@N Þð@N =@cN Þ:
F306 [ J U N ET H E E C O N O M I C J O U R N A L
� Royal Economic Society 2003

It is clear from the equilibrium condition, (4), that firing costs reduce employmentin this model. In particular,
@N =@cN ¼ uk=D; < 0;
where D is (1/N) times the denominator in (5).5 The scale effect, ¶e/¶N, is likely tobe positive, i.e., there is less native job loss due to immigration when N is larger. Tosee this, expand ¶e/¶N as follows:
@e=@N ¼ ð@nNI =@N Þðe1 nNN Þ1 þ nNI ðe1 nNN Þ2ð@nNN =@N Þ:
The wage decline for natives from a given percentage increase in immigrants islikely to be smaller (in absolute value) the more natives there are, so the first termon the right hand side is typically positive. The second term is also positive if ¶nNN/¶N is negative. Standard results from demand theory suggest this is a reasonablepresumption: in a constant-returns, two-factor model, aggregate labour demandbecomes less elastic as the labour share increases, so nNN becomes more negative asN grows (Hamermesh, 1986).
The analysis of changing r parallels the discussion of firing costs since replace-ment rates do not appear directly in (5). Note that
@e=@r ¼ ð@e=@N Þð@N =@r Þ:
As with firing costs, higher replacement rates reduce native employment levels.In particular,
@N =@r ¼ ð1 r Þ1=D < 0:
Higher replacement rates therefore increase any job loss due to immigration ifscale effects are positive. The intuition for this result is the same as for theinteraction with firing costs: high replacement rates reduce native employmentlevels, and reduced employment makes the negative employment consequences ofimmigration worse.
In practice, scale effects are likely to be hard to detect unless the overall effect ofrestrictive institutions is substantial. Suppose, for example, as suggested by Lazear’s(1990) estimates, that employment protection at the level found in Spain reducesemployment levels by 6%. If scale effects are such that a 10% reduction in em-ployment increases the job loss from immigrant competition by 20% (and thisseems like a large effect), then employment protection at the Spanish level in-creases immigration-related job losses by 12%. Although not trivial, this is smallrelative to the precision with which we typically expect to be able to measureimmigration effects.
5 In particular, D ¼ [(1/e)N )1 ) (f ¢¢/f ¢)hgN ) gNN/gN] > 0. Firing costs reduce employment in ourmodel with cross-sectional heterogeneity in productivity, but have an ambiguous effect in partial-equilibrium models with cyclical productivity shocks, as in Bentolila and Bertola (1990). In a general-equilibrium setting, firing costs also reduce profitability and investment, with consequent job losses(Hopenhayn and Rogerson, 1993).
2003] F307I N S T I T U T I O N S A N D T H E E F F E C T O F I M M I G R A T I O N
� Royal Economic Society 2003

A second and probably more important channel for institutional interactions inthe European context is wage rigidity. We omit a detailed analysis of the impact ofunion wage setting or minimum wages, but look briefly at a stylised characterisa-tion of inflexible wages. Suppose that native wages are fixed at a binding minimumor contract wage, �wwN. Then the effect of immigration on native employment can beshown to be
ð@N �=@M ÞðM=N �Þ ¼ nNI n1NN ;
which is e(N, e) with e ¼ 1, and is clearly more negative than e(N, e) with eunrestricted. This is potentially a large effect. For example, if nNN ¼ )1 and e ¼ 1
2in the absence of restrictions, immigration-induced job losses are three timesgreater with rigid wages. Moreover a higher wN reduces employment even withoutimmigration, leading to the same sort of scale effect discussed earlier for firingcosts and replacement rates. We should note, however that our brief analysis ofwage rigidity omits any off-setting feedback effects whereby union wage demandsare moderated as a consequence of competition from immigrants, a possibilitydiscussed by Schmidt et al. (1994).
1.1. Long-run Effects
Suppose now that the number of firms, m, is an endogenous variable eventuallydetermined by the requirement that profits equal entry costs. To see the conse-quences of endogenous m for immigration effects, we first analyse the effect ofimmigration on profits. Using the envelope theorem, the effect of an increase in Mon profits with a fixed number of firms is approximately
@P=@M ¼ ð1 uÞ1½N ð@wN =@M Þ I ð@wI =@M Þ�;
where N is the equilibrium employment level of natives. In the short run, increasedimmigration clearly increases profits in this model because immigrant wages mustfall and native wages have been presumed to fall in our previous discussion. AsBorjas (1995) notes, the increase in profits due to immigration is generatedbecause, while the last worker hired is paid his or her value of marginal product,infra-marginal workers are paid less.6
Assuming profits were equal to entry costs before immigration and there arediminishing returns to labour inputs, the increase in profits after immigrationinduces the entry of new firms. Because the entering firms employ additionalworkers, both immigrant and native, the possibility of endogenous entry reducesand may even eliminate any negative impact of immigration on native employ-ment. More formally, the effect of immigration on aggregate employment is shownin our working paper to be
6 The exception is if there are constant returns for labour inputs alone, i.e., f ¢(Æ) ¼ 0, in which caseprofits are always zero and there is no entry. Even if native wages rise due to immigrant-native com-plementarity, profits increase as long as the production function exhibits diminishing returns.
F308 [ J U N ET H E E C O N O M I C J O U R N A L
� Royal Economic Society 2003

ð@N �=@M ÞðM=N �Þ ¼ eðN ; eÞð1 @ ln m=@ ln M Þ nNN ðe1 nNN Þ1ð@ ln m=@ ln M Þ;ð6Þ
where e(N, e) is the short-run employment response defined in (5). Since nNN < 0and ¶lnm/¶lnM £ 1, the response with entry is less negative than in the fixed-number-of-firms case and can even be positive. With perfect substitution, i.e.,q ¼ 1, the short-run impact of immigration on native employment must benegative, but the long-run impact is zero.
Although entry may eventually raise employment back to pre-immigration levels,in the theoretical medium-run, immigrants will have a diminished though stillnegative effect on native employment. So factors that inhibit entry are likely toincrease or prolong the displacement of natives by immigrants. Moreover, entrycosts probably interact with other wage rigidities, such as firing costs and stickywages, to further aggravate job losses from immigration. This is because factorsthat increase labour costs will also tend to reduce or slow new firms’ entry inresponse to low-cost immigrant labour. Finally, entry costs that reduce nativeemployment levels will interact negatively with other rigidities because of the short-run scale effect noted above.7
Overall, the theoretical discussion suggests that the relationship between im-migration and native employment is likely to vary across countries according toemployment laws, replacement rates, wage-setting institutions and business entrycosts. The impact of unions is hard to measure since most Western Europeans arecovered by collective bargaining agreements whether or not they are unionmembers. We therefore focus on interactions with measures of labour marketflexibility, replacement rates and barriers to entrepreneurship. To establish abaseline, however, the empirical discussion begins with a reduced-form analysis ofimmigration effects that omits interactions with institutional characteristics.
2. Background and Data
2.1. Descriptive Statistics
In recent years, the European countries with the largest proportion of labour forcefrom non-EU countries have been Austria, France, Germany, Sweden, Switzerland,and the UK. This can be seen in Table 1, which reports descriptive statistics fromthe Eurostat labour force surveys for 18 EU and other EEA countries.8 France andthe UK absorb many immigrants from former colonies, while Germany and Austriaaccept large numbers of migrants from Turkey and Eastern Europe, especiallyPoland. Sweden has a large foreign population, many of whom come from MiddleEastern countries. Another important supply factor in some countries is the ab-sorption of ethnically similar migrants. Germany, for example, accepts large
7 See Bertrand and Kramarz (2001) for recent evidence on the employment consequences of entrycosts in the retail industry in France. Layard and Nickell (1999) emphasise the interaction betweenrestricted product market entry and union bargaining power.
8 Additional information on data sources and extracts is provided in the Data Appendix.
2003] F309I N S T I T U T I O N S A N D T H E E F F E C T O F I M M I G R A T I O N
� Royal Economic Society 2003
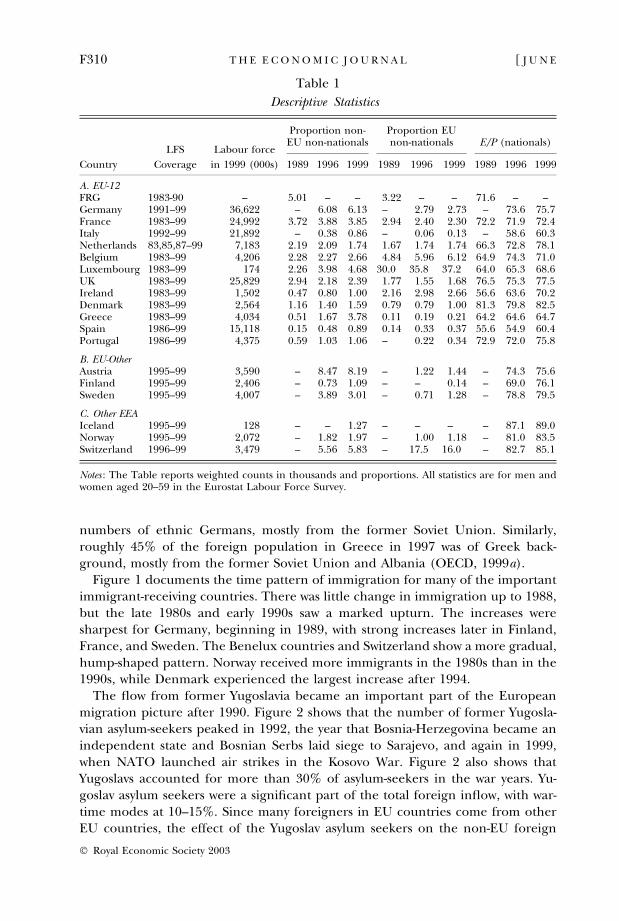
numbers of ethnic Germans, mostly from the former Soviet Union. Similarly,roughly 45% of the foreign population in Greece in 1997 was of Greek back-ground, mostly from the former Soviet Union and Albania (OECD, 1999a).
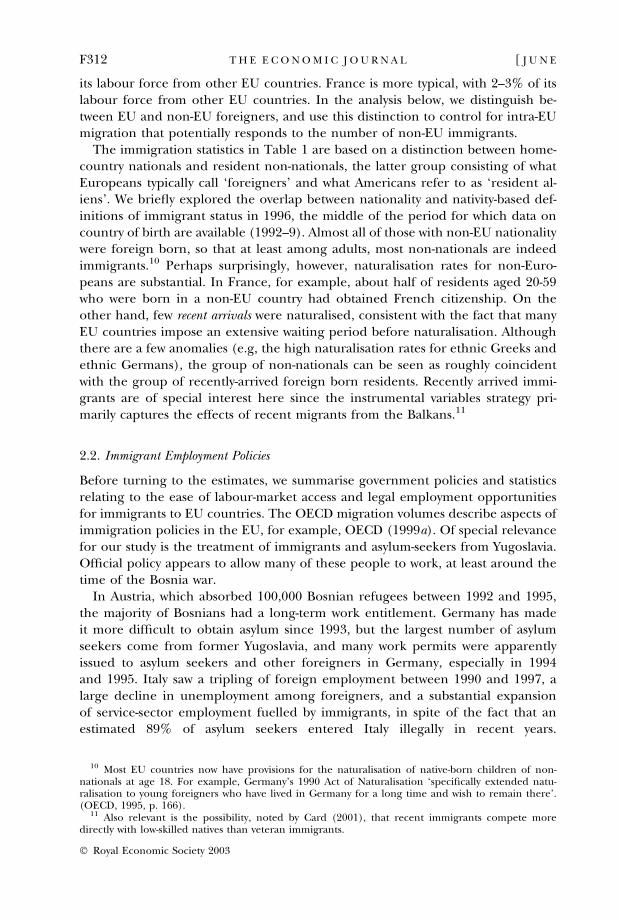
Figure 1 documents the time pattern of immigration for many of the importantimmigrant-receiving countries. There was little change in immigration up to 1988,but the late 1980s and early 1990s saw a marked upturn. The increases weresharpest for Germany, beginning in 1989, with strong increases later in Finland,France, and Sweden. The Benelux countries and Switzerland show a more gradual,hump-shaped pattern. Norway received more immigrants in the 1980s than in the1990s, while Denmark experienced the largest increase after 1994.
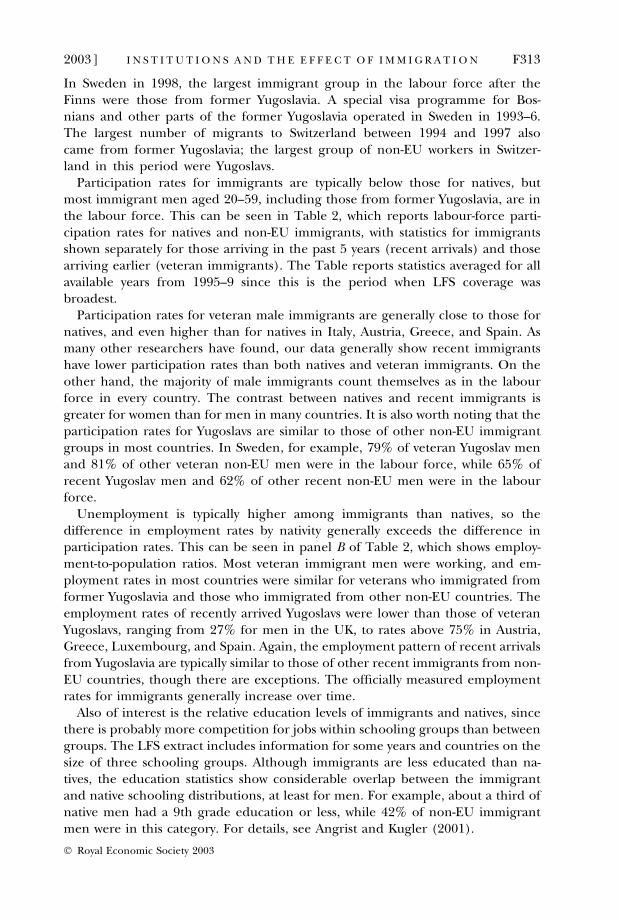
The flow from former Yugoslavia became an important part of the Europeanmigration picture after 1990. Figure 2 shows that the number of former Yugosla-vian asylum-seekers peaked in 1992, the year that Bosnia-Herzegovina became anindependent state and Bosnian Serbs laid siege to Sarajevo, and again in 1999,when NATO launched air strikes in the Kosovo War. Figure 2 also shows thatYugoslavs accounted for more than 30% of asylum-seekers in the war years. Yu-goslav asylum seekers were a significant part of the total foreign inflow, with war-time modes at 10–15%. Since many foreigners in EU countries come from otherEU countries, the effect of the Yugoslav asylum seekers on the non-EU foreign
Table 1
Descriptive Statistics
LFS Labour force
Proportion non-EU non-nationals
Proportion EUnon-nationals E/P (nationals)
Country Coverage in 1999 (000s) 1989 1996 1999 1989 1996 1999 1989 1996 1999
A. EU-12FRG 1983-90 – 5.01 – – 3.22 – – 71.6 – –Germany 1991–99 36,622 – 6.08 6.13 – 2.79 2.73 – 73.6 75.7France 1983–99 24,992 3.72 3.88 3.85 2.94 2.40 2.30 72.2 71.9 72.4Italy 1992–99 21,892 – 0.38 0.86 – 0.06 0.13 – 58.6 60.3Netherlands 83,85,87–99 7,183 2.19 2.09 1.74 1.67 1.74 1.74 66.3 72.8 78.1Belgium 1983–99 4,206 2.28 2.27 2.66 4.84 5.96 6.12 64.9 74.3 71.0Luxembourg 1983–99 174 2.26 3.98 4.68 30.0 35.8 37.2 64.0 65.3 68.6UK 1983–99 25,829 2.94 2.18 2.39 1.77 1.55 1.68 76.5 75.3 77.5Ireland 1983–99 1,502 0.47 0.80 1.00 2.16 2.98 2.66 56.6 63.6 70.2Denmark 1983–99 2,564 1.16 1.40 1.59 0.79 0.79 1.00 81.3 79.8 82.5Greece 1983–99 4,034 0.51 1.67 3.78 0.11 0.19 0.21 64.2 64.6 64.7Spain 1986–99 15,118 0.15 0.48 0.89 0.14 0.33 0.37 55.6 54.9 60.4Portugal 1986–99 4,375 0.59 1.03 1.06 – 0.22 0.34 72.9 72.0 75.8
B. EU-OtherAustria 1995–99 3,590 – 8.47 8.19 – 1.22 1.44 – 74.3 75.6Finland 1995–99 2,406 – 0.73 1.09 – – 0.14 – 69.0 76.1Sweden 1995–99 4,007 – 3.89 3.01 – 0.71 1.28 – 78.8 79.5
C. Other EEAIceland 1995–99 128 – – 1.27 – – – – 87.1 89.0Norway 1995–99 2,072 – 1.82 1.97 – 1.00 1.18 – 81.0 83.5Switzerland 1996–99 3,479 – 5.56 5.83 – 17.5 16.0 – 82.7 85.1
Notes : The Table reports weighted counts in thousands and proportions. All statistics are for men andwomen aged 20–59 in the Eurostat Labour Force Survey.
F310 [ J U N ET H E E C O N O M I C J O U R N A L
� Royal Economic Society 2003

share is considerably larger than indicated by the Figure. Our data suggest that inthe 1995–9 period, roughly one-third of male immigrants aged 20–59 from non-EU countries were from former Yugoslavia.9
The importance of migration within the EU is also documented in Table 1. Insome countries, many non-national residents in the labour force are from otherdeveloped European nations. Luxembourg is a clear outlier, with over one-third of
–0.3
–0.2
–0.1
0
0.1
0.2
0.3
0.4
0.5
0.6
0.7
1984 1985 1986 1987 1988 1989 1990 1991 1992 1993 1994 1995 1996 1997 1998
Year
log
flow
– b
ase Denmark
FinlandGermanyNorwaySwedenSwitzerlandFranceBenelux
FRA
DEN
GER
FIN
NOR
SWE
SWI
BEN
Fig. 1. Foreign Inflows 1984–98. The figure shows log counts minus a 1983 base. Data arefrom population registers except for France. Data sources are given in the Appendix.
0
50
100
150
200
250
1983 1984 1985 1986 1987 1988 1989 1990 1991 1992 1993 1994 1995 1996 1997 1998 1999
Year
Num
ber
of A
pplic
ants
000
s
0
0.05
0.1
0.15
0.2
0.25
0.3
0.35
0.4
Prop
ortio
n of
Tot
al
Number of asylum seekers
Proportion of asylum seekers
Proportion of EU inflows
Fig. 2. Number of Yugoslav asylum applicants in Europe, Yugoslav proportion of totalapplicants, and Yugoslavs as a proportion of total foreign inflows to selected EU coun-tries. Data for 1992–99 include asylum applicants from both Yugoslavia and Bosnia. Datasources are given in the Appendix.
9 See also Table I.2 in OECD (2001), which shows Yugoslavia to be among the top 5 immigrantsource countries for the immigrant stock in a number of OECD states in 1998.
2003] F311I N S T I T U T I O N S A N D T H E E F F E C T O F I M M I G R A T I O N
� Royal Economic Society 2003
its labour force from other EU countries. France is more typical, with 2–3% of itslabour force from other EU countries. In the analysis below, we distinguish be-tween EU and non-EU foreigners, and use this distinction to control for intra-EUmigration that potentially responds to the number of non-EU immigrants.
The immigration statistics in Table 1 are based on a distinction between home-country nationals and resident non-nationals, the latter group consisting of whatEuropeans typically call ‘foreigners’ and what Americans refer to as ‘resident al-iens’. We briefly explored the overlap between nationality and nativity-based def-initions of immigrant status in 1996, the middle of the period for which data oncountry of birth are available (1992–9). Almost all of those with non-EU nationalitywere foreign born, so that at least among adults, most non-nationals are indeedimmigrants.10 Perhaps surprisingly, however, naturalisation rates for non-Euro-peans are substantial. In France, for example, about half of residents aged 20-59who were born in a non-EU country had obtained French citizenship. On theother hand, few recent arrivals were naturalised, consistent with the fact that manyEU countries impose an extensive waiting period before naturalisation. Althoughthere are a few anomalies (e.g, the high naturalisation rates for ethnic Greeks andethnic Germans), the group of non-nationals can be seen as roughly coincidentwith the group of recently-arrived foreign born residents. Recently arrived immi-grants are of special interest here since the instrumental variables strategy pri-marily captures the effects of recent migrants from the Balkans.11
2.2. Immigrant Employment Policies
Before turning to the estimates, we summarise government policies and statisticsrelating to the ease of labour-market access and legal employment opportunitiesfor immigrants to EU countries. The OECD migration volumes describe aspects ofimmigration policies in the EU, for example, OECD (1999a). Of special relevancefor our study is the treatment of immigrants and asylum-seekers from Yugoslavia.Official policy appears to allow many of these people to work, at least around thetime of the Bosnia war.
In Austria, which absorbed 100,000 Bosnian refugees between 1992 and 1995,the majority of Bosnians had a long-term work entitlement. Germany has madeit more difficult to obtain asylum since 1993, but the largest number of asylumseekers come from former Yugoslavia, and many work permits were apparentlyissued to asylum seekers and other foreigners in Germany, especially in 1994and 1995. Italy saw a tripling of foreign employment between 1990 and 1997, alarge decline in unemployment among foreigners, and a substantial expansionof service-sector employment fuelled by immigrants, in spite of the fact that anestimated 89% of asylum seekers entered Italy illegally in recent years.
10 Most EU countries now have provisions for the naturalisation of native-born children of non-nationals at age 18. For example, Germany’s 1990 Act of Naturalisation ‘specifically extended natu-ralisation to young foreigners who have lived in Germany for a long time and wish to remain there’.(OECD, 1995, p. 166).
11 Also relevant is the possibility, noted by Card (2001), that recent immigrants compete moredirectly with low-skilled natives than veteran immigrants.
F312 [ J U N ET H E E C O N O M I C J O U R N A L
� Royal Economic Society 2003
In Sweden in 1998, the largest immigrant group in the labour force after theFinns were those from former Yugoslavia. A special visa programme for Bos-nians and other parts of the former Yugoslavia operated in Sweden in 1993–6.The largest number of migrants to Switzerland between 1994 and 1997 alsocame from former Yugoslavia; the largest group of non-EU workers in Switzer-land in this period were Yugoslavs.
Participation rates for immigrants are typically below those for natives, butmost immigrant men aged 20–59, including those from former Yugoslavia, are inthe labour force. This can be seen in Table 2, which reports labour-force parti-cipation rates for natives and non-EU immigrants, with statistics for immigrantsshown separately for those arriving in the past 5 years (recent arrivals) and thosearriving earlier (veteran immigrants). The Table reports statistics averaged for allavailable years from 1995–9 since this is the period when LFS coverage wasbroadest.
Participation rates for veteran male immigrants are generally close to those fornatives, and even higher than for natives in Italy, Austria, Greece, and Spain. Asmany other researchers have found, our data generally show recent immigrantshave lower participation rates than both natives and veteran immigrants. On theother hand, the majority of male immigrants count themselves as in the labourforce in every country. The contrast between natives and recent immigrants isgreater for women than for men in many countries. It is also worth noting that theparticipation rates for Yugoslavs are similar to those of other non-EU immigrantgroups in most countries. In Sweden, for example, 79% of veteran Yugoslav menand 81% of other veteran non-EU men were in the labour force, while 65% ofrecent Yugoslav men and 62% of other recent non-EU men were in the labourforce.
Unemployment is typically higher among immigrants than natives, so thedifference in employment rates by nativity generally exceeds the difference inparticipation rates. This can be seen in panel B of Table 2, which shows employ-ment-to-population ratios. Most veteran immigrant men were working, and em-ployment rates in most countries were similar for veterans who immigrated fromformer Yugoslavia and those who immigrated from other non-EU countries. Theemployment rates of recently arrived Yugoslavs were lower than those of veteranYugoslavs, ranging from 27% for men in the UK, to rates above 75% in Austria,Greece, Luxembourg, and Spain. Again, the employment pattern of recent arrivalsfrom Yugoslavia are typically similar to those of other recent immigrants from non-EU countries, though there are exceptions. The officially measured employmentrates for immigrants generally increase over time.
Also of interest is the relative education levels of immigrants and natives, sincethere is probably more competition for jobs within schooling groups than betweengroups. The LFS extract includes information for some years and countries on thesize of three schooling groups. Although immigrants are less educated than na-tives, the education statistics show considerable overlap between the immigrantand native schooling distributions, at least for men. For example, about a third ofnative men had a 9th grade education or less, while 42% of non-EU immigrantmen were in this category. For details, see Angrist and Kugler (2001).
2003] F313I N S T I T U T I O N S A N D T H E E F F E C T O F I M M I G R A T I O N
� Royal Economic Society 2003

Table 2
Characteristics of Immigrants and Natives
Men Women
Non-EU Yugoslavs Non-EU Yugoslavs
CountryNatives
(1)Recent
(2)Veteran
(3)Recent
(4)Veteran
(5)Natives
(6)Recent
(7)Veteran
(8)Recent
(9)Veteran
(10)
A. Labour Force Participation RateGermany 90.3 77.5 88.8 – – 75.4 50.4 68.7 – –France 88.2 67.7 87.5 72.2 86.1 73.9 33.4 57.8 69.6 72.1Italy 82.8 93.5 90.4 75.2 69.0 51.0 51.9 57.3 39.4 –Netherlands 90.2 55.8 78.3 50.4 75.5 68.1 37.7 53.9 32.3 60.0Belgium 85.3 72.2 76.1 78.1 79.1 65.3 33.1 43.7 21.7 52.2Luxembourg 85.1 86.7 84.8 88.3 84.7 51.4 42.0 53.9 45.1 44.4UK 90.0 71.1 86.7 59.6 80.7 73.6 45.1 61.7 52.6 58.5Ireland 87.7 57.4 84.7 – – 57.6 34.8 61.0 – –Denmark 91.0 68.0 76.1 64.7 90.0 80.6 34.1 65.0 21.0 71.9Greece 89.0 93.3 92.4 93.7 97.5 53.8 67.7 60.3 71.1 54.8Spain 86.3 94.1 90.1 – 81.0 54.2 62.7 61.5 – 56.6Portugal 89.2 89.6 74.5 – – 71.4 68.8 59.6 – –Austria 88.2 86.8 90.9 90.9 92.2 69.7 52.8 69.6 56.5 78.7Finland 84.8 76.6 80.5 – 61.3 79.5 53.4 69.1 – –Sweden 88.7 61.9 81.1 65.2 79.2 84.4 41.7 68.1 49.6 63.9Norway 89.8 75.5 76.3 46.7 80.4 80.8 46.9 64.4 34.0 69.1
B. Employment/PopulationGermany 83.3 62.2 80.4 – – 68.7 39.5 61.5 – –France 80.0 42.1 69.8 45.4 67.5 64.0 20.8 43.1 66.1 55.6Italy 75.3 87.0 85.4 58.7 69.0 42.9 39.6 50.0 20.8 –Netherlands 87.4 37.3 68.1 32.7 65.9 64.2 26.9 48.1 19.1 52.8Belgium 80.0 51.6 58.7 27.4 64.1 58.3 21.0 32.2 21.7 35.3Luxembourg 83.8 80.5 80.0 79.3 79.8 50.0 37.9 49.4 39.3 37.5UK 83.1 60.2 76.8 28.3 56.1 69.7 37.7 56.2 41.1 55.5Ireland 78.9 48.9 77.7 – – 52.2 29.1 55.8 – –Denmark 87.2 52.8 64.4 45.7 74.9 75.3 27.5 54.0 21.0 61.8Greece 83.5 82.3 83.4 83.6 86.6 45.7 51.6 49.0 48.8 49.6
F314
[J
UN
ET
HE
EC
ON
OM
IC
JO
UR
NA
L
�R
oyal
Eco
no
mic
Society
2003
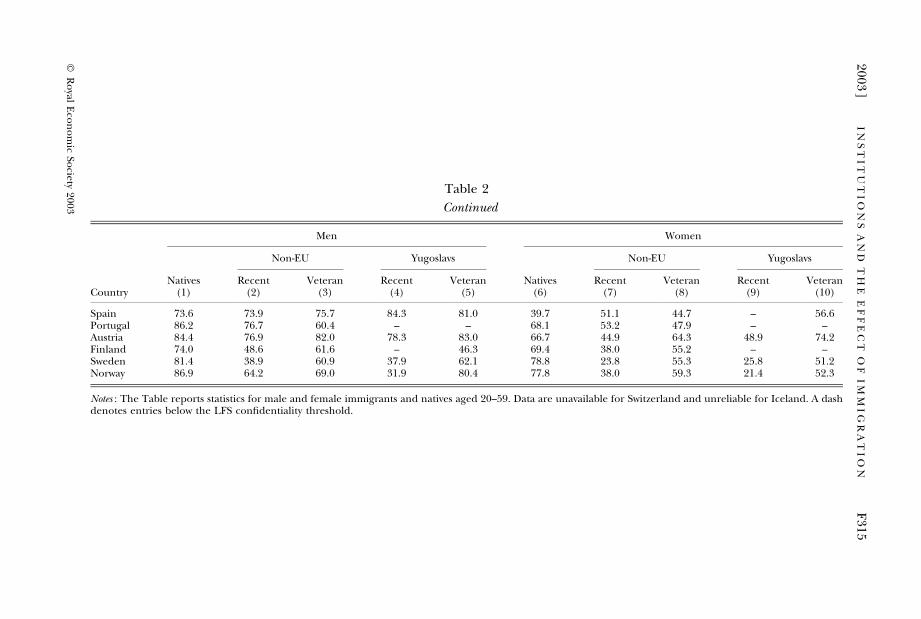
Table 2
Continued
Men Women
Non-EU Yugoslavs Non-EU Yugoslavs
CountryNatives
(1)Recent
(2)Veteran
(3)Recent
(4)Veteran
(5)Natives
(6)Recent
(7)Veteran
(8)Recent
(9)Veteran
(10)
Spain 73.6 73.9 75.7 84.3 81.0 39.7 51.1 44.7 – 56.6Portugal 86.2 76.7 60.4 – – 68.1 53.2 47.9 – –Austria 84.4 76.9 82.0 78.3 83.0 66.7 44.9 64.3 48.9 74.2Finland 74.0 48.6 61.6 – 46.3 69.4 38.0 55.2 – –Sweden 81.4 38.9 60.9 37.9 62.1 78.8 23.8 55.3 25.8 51.2Norway 86.9 64.2 69.0 31.9 80.4 77.8 38.0 59.3 21.4 52.3
Notes : The Table reports statistics for male and female immigrants and natives aged 20–59. Data are unavailable for Switzerland and unreliable for Iceland. A dashdenotes entries below the LFS confidentiality threshold.
2003]
F315
IN
ST
IT
UT
IO
NS
AN
DT
HE
EF
FE
CT
OF
IM
MI
GR
AT
IO
N
�R
oyal
Eco
no
mic
Society
2003

3. Estimates of Immigration Effects
3.1. OLS Estimates
We begin with models allowing a single immigration effect for all countries,turning afterwards to models that incorporate interactions with institutions. Thefirst equation estimated is
lnðyijtÞ ¼ li þ dt þ bj þ ai lnðsjtÞ þ eijt ð7Þ
for demographic group i, country j, and year t. The model includes country andyear effects, bj and dt, with group main effects included when demographic groupsare pooled. The regressor ln(sjt) is the log of the immigrant share and thedependent variable is the log of the employment-to-population ratio for natives.The immigrant share is defined as the immigrant (non-national) proportion of thelabour force. Measuring the immigrant share by proportion of the labour forceinstead of proportion of population partly adjusts for composition effects not fullycaptured by demographic controls and for the fact that employment rates forimmigrants may be understated.
Equation (7) can be interpreted as approximating the first-order conditiondetermining native employment or as a general reduced-form relationship be-tween native employment and the immigrant share. In either case, the most im-portant omitted variables are time-varying productivity or labour demand shockscorrelated with both immigrant shares and native employment. We therefore ex-perimented with models that include controls for the log of the foreign share withEU nationality, denoted ln(ujt). This provides a partial though potentially en-dogenous control for local demand factors that may increase overall immigration.Including ln(ujt) also addresses the point, raised in earlier immigration studies,that internal migration flows act to offset the impact of immigrants; see Card(2001) for a discussion of this possibility in the US context. Internal EU migrantsare probably similar in many respects to US internal migrants, in that they aredrawn to host countries by job assignments and employment opportunities.Moreover, the fact that ln(ujt) is a potentially endogenous control should not biasthe IV estimates since the instruments are uncorrelated with migration from otherEU countries.
OLS estimates of models for native men that omit the EU share, reported inPanel A of Table 3, show no significant effect of non-EU immigrants overall,though there is a small and significant effect of )0.021 when the sample is limitedto young natives. Including the EU share as a control variable leads to an evenlarger negative effect of )0.037 for young native men, and a significant effect of)0.021 overall. These results are reported in Panel B of Table 3, cols. 1–3. Thelarger estimates generated by models that include the EU share are due to the factthat the EU and non-EU foreign shares are positively correlated. In practice,therefore, while migration within the EU is positively correlated with native em-ployment, internal EU migration does not act to ‘undo’ the effects of non-EUmigrants. Taking the pooled significant estimate from the model with EU share asrepresentative of the impact on men, the magnitudes are such that 100 immigrants
F316 [ J U N ET H E E C O N O M I C J O U R N A L
� Royal Economic Society 2003

Table 3
OLS Estimates
No trends With trends
By age group By age group
Non-national share Sex Pooled (1) Under 40 (2) Over 40 (3) Pooled (4) Under 40 (5) Over 40 (6)
A. Without share of Non-Nationals from EUNon-EU Men )0.010 (0.007) )0.021 (0.007) 0.002 (0.004) )0.009 (0.013) )0.011 (0.013) )0.007 (0.006)Non-EU Women 0.0002 (0.021) 0.002 (0.013) )0.001 (0.022) )0.012 (0.034) )0.022 (0.013) )0.003 (0.012)N 420 210 210 420 210 210
B. With share of Non-Nationals from EUNon-EU Men )0.021 (0.008) )0.037 (0.008) )0.004 (0.005) )0.011 (0.015) )0.012 (0.012) )0.010 (0.007)EU 0.036 (0.016) 0.053 (0.014) 0.018 (0.010) 0.022 (0.019) 0.028 (0.009) 0.016 (0.006)Non-EU Women )0.026 (0.026) )0.026 (0.016) )0.026 (0.026) )0.012 (0.048) )0.023 (0.012) )0.002 (0.015)EU 0.086 (0.041) 0.092 (0.026) 0.081 (0.031) 0.008 (0.049) 0.018 (0.011) )0.002 (0.013)N 402 201 201 402 201 201
Notes: The Table reports OLS estimates of (7) in the text. Robust standard errors are reported in parentheses. Estimates in cols. 4–6 are from models that includecountry specific trends.
2003]
F317
IN
ST
IT
UT
IO
NS
AN
DT
HE
EF
FE
CT
OF
IM
MI
GR
AT
IO
N
�R
oyal
Eco
no
mic
Society
2003
in the labour force cost about 35 native jobs in a country where 5% of the labourforce is non-EU foreign (as Table 1 indicates for Germany in 1989). In contrastwith the results for men, none of the estimates for women in cols. 1–3 of Table 3are significant.
Equation (7) relies on time-invariant country effects and/or ln(ujt) to control foromitted variables correlated with immigration rates. OLS estimates of the param-eters in this equation are biased if immigration is correlated with country-specifictrends, a problem made more likely by the long time-series sample. We thereforealso report results in cols. 4–6 from models replacing the country effect, bj, with acountry-specific linear trend, b0j + b1jt. It should be noted, however, that robustnessto the inclusion of country-specific trends is a stringent test, since any local trend ornear-trend component in immigration is removed in this specification.
The negative employment effects for younger women become slightly larger andborderline significant in models with country trends but the results for youngermen, while still negative, are smaller, less precise and no longer significantly dif-ferent from zero. The estimates pooling age groups are negative but insignificantfor both men and women in models with country trends. Of course, the inclusionof country trends does not necessarily eliminate bias from endogenous migrationand it makes any immigration effects harder to detect since the resulting estimatesare typically less precise.
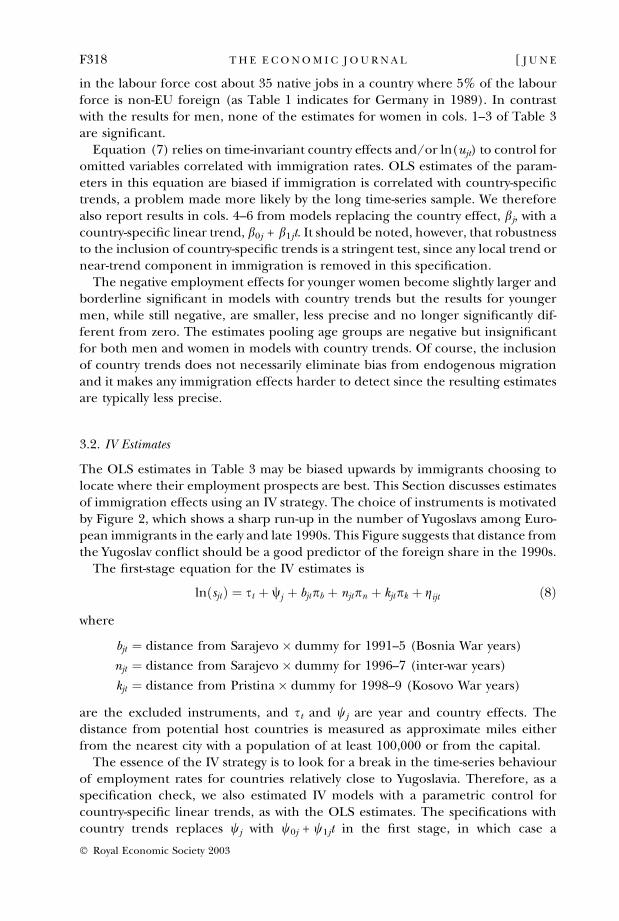
3.2. IV Estimates
The OLS estimates in Table 3 may be biased upwards by immigrants choosing tolocate where their employment prospects are best. This Section discusses estimatesof immigration effects using an IV strategy. The choice of instruments is motivatedby Figure 2, which shows a sharp run-up in the number of Yugoslavs among Euro-pean immigrants in the early and late 1990s. This Figure suggests that distance fromthe Yugoslav conflict should be a good predictor of the foreign share in the 1990s.
The first-stage equation for the IV estimates is
lnðsjtÞ ¼ st þ wj þ bjtpb þ njtpn þ kjtpk þ gijt ð8Þ
where
bjt ¼ distance from Sarajevo � dummy for 1991--5 (Bosnia War years)
njt ¼ distance from Sarajevo � dummy for 1996--7 (inter-war years)
kjt ¼ distance from Pristina � dummy for 1998--9 (Kosovo War years)
are the excluded instruments, and st and wj are year and country effects. Thedistance from potential host countries is measured as approximate miles eitherfrom the nearest city with a population of at least 100,000 or from the capital.
The essence of the IV strategy is to look for a break in the time-series behaviourof employment rates for countries relatively close to Yugoslavia. Therefore, as aspecification check, we also estimated IV models with a parametric control forcountry-specific linear trends, as with the OLS estimates. The specifications withcountry trends replaces wj with w0j + w1jt in the first stage, in which case a
F318 [ J U N ET H E E C O N O M I C J O U R N A L
� Royal Economic Society 2003

corresponding term is also included in the second stage (b0j + b1jt) as an addi-tional exogenous covariate. As before, some specifications include the EU foreignshare, i.e. ln(ujt), as a covariate. As we show below, however, this has little effect onthe IV estimates because the EU share is largely uncorrelated with the instruments.
Conditional on country and year effects, distance from the former Yugoslavrepublics is associated with a sharply lower immigrant share in the war years. Thiscan be seen in panel A of Table 4, which reports the coefficients on bjt, njt, and kjt,plus a pre-war interaction term as a specification check. The coefficients are scaledso that they represent the effect of 1,000 miles. For example, the differential dis-tance from Graz, Austria to Liege, Belgium, about 500 miles, reduces the non-EUforeign share during the Bosnia War by 30–40% (see cols. 1–4 in the Table).
The pattern of estimates in models without trends is consistent with the notionthat immigration was highest during the war years, with a moderate decline in theinter-war years. Adding country trends changes the pattern somewhat but theestimates are not precise enough for the change to be statistically meaningful. It isperhaps to be expected that the inter-war reduction is not sharp since the inter-warand Kosovo war dummies are also correlated with the presence of Yugoslavs whostayed in their host countries. Importantly, however, the estimates in the last row inpanel A show that adding a dummy for pre-war years to the set of interactionsgenerates no evidence of a pre-existing immigration trend associated with distancefrom Sarajevo for either distance measure.
As an additional check on the first stage, panel B of Table 4 reports the results ofreplacing the non-EU foreign share with the EU foreign share as the dependentvariable in (8). That is, we replace ln(sjt) with ln(ujt). These estimates show norelationship between wartime interactions with distance to Sarajevo or Pristina andthe EU share. This is encouraging since it suggests the estimates in panel A indeedreflect the effect of immigrants from former Yugoslavia. Moreover, it means thatthe IV estimation strategy is unaffected by inclusion of the possibly endogenouscovariate, ln(ujt), since this is essentially uncorrelated with the instruments. Finally,note that the first-stage estimates are generally similar whether distance is meas-ured from capital cities or large cities. Because the first-stage relationship isstronger when distance is measured from large cities, we used this variable toconstruct the second-stage estimates.
The 2SLS estimates using bjt, njt, and kjt as instruments are reported in Table 5,separately for models that do and do not control for ln(ujt). For men, the esti-mated immigration effects without the EU share are on the order of )0.05 whenage groups are pooled and )0.08 for those under 40. IV estimates for men inmodels that include country trends are smaller, though still significant for thoseover 40. Adding the EU share as a control variable has little effect on the estimatesin models that do not include country trends. In models with country trends, someof the estimates including the EU share are larger, but this turns out to be due tothe fact that the estimates with country trends are sensitive to the change in sample(from 420 to 402 observations) when the EU share is included.
The IV estimates for men are consistently negative and at the upper end ofelasticity estimates reported by Borjas (1994). As in Card (2001), the IV estimatesare larger in magnitude than the corresponding OLS estimates. Taking )0.05 as
2003] F319I N S T I T U T I O N S A N D T H E E F F E C T O F I M M I G R A T I O N
� Royal Economic Society 2003

Table 4
First Stage Estimates
Distance to nearest big city Distance to capital
No trends With trends No trends With trends
Instruments (1) (2) (3) (4) (5) (6) (7) (8)
A. Non-Nationals from Non-EU countriesBosnia War (1991–5) · Distancefrom Sarajevo
)0.830 (0.182) )0.763 (0.224) )0.624 (0.234) )0.601 (0.228) )0.754 (0.256) )0.515 (0.336) )0.543 (0.273) )0.509 (0.261)
Inter War (1996–7) · Distancefrom Sarajevo
)0.712 (0.222) )0.647 (0.254) )0.743 (0.296) )0.686 (0.300) )0.556 (0.293) )0.320 (0.359) )0.654 (0.349) )0.577 (0.348)
Kosovo War (1998–9) · Distancefrom Pristina
)0.924 (0.266) )0.865 (0.300) )1.082 (0.296) )1.010 (0.306) )0.820 (0.369) )0.598 (0.436) )1.089 (0.352) )0.990 (0.355)
Pre-war (1988–90) · Distancefrom Sarajevo
)0.090 (0.186) 0.096 (0.159) )0.316 (0.209) 0.121 (0.158)
F-Statistic for excludedinstruments
6.96 3.97 6.67 5.39 3.18 1.25 5.98 4.79
B. Non-Nationals from EU countriesBosnia War · Distancefrom Sarajevo
)0.122 (0.103) )0.181 (0.136) )0.170 (0.181) )0.168 (0.182) )0.099 (0.137) )0.126 (0.180) )0.093 (0.041) )0.009 (0.193)
Inter War · Distancefrom Sarajevo
0.158 (0.149) 0.100 (0.170) )0.098 (0.267) )0.094 (0.284) 0.232 (0.186) 0.205 (0.218) 0.081 (0.323) 0.108 (0.336)
Kosovo War · Distancefrom Pristina
0.104 (0.120) 0.051 (0.143) )0.219 (0.290) )0.214 (0.322) 0.189 (0.150) 0.164 (0.184) )0.037 (0.316) )0.002 (0.340)
Pre-war · Distancefrom Sarajevo
0.081 (0.115) 0.007 (0.165) 0.035 (0.118) 0.042 (0.160)
F-Statistic for excludedinstruments
1.27 1.34 0.43 0.43 1.34 1.28 0.14 0.14
Notes: The Table reports the effect of the Balkan War periods interacted with the distance from Sarajevo or Pristina on the log share of non-nationals from non-EUand EU countries. All models include country and year effects. The sample size is 201 for non-nationals from non-EU countries and 202 for non-nationals from EUcountries.
F320
[J
UN
ET
HE
EC
ON
OM
IC
JO
UR
NA
L
�R
oyal
Eco
no
mic
Society
2003

Table 5
IV Estimates
No trends With trends
By age group By age group
Non-national share SexPooled
(1)Under 40
(2)Over 40
(3)Pooled
(4)Under 40
(5)Over 40
(6)
A. Without share of Non-Nationals from EU countriesNon-EU Men )0.050 (0.023) )0.082 (0.030) )0.018 (0.016) )0.034 (0.029) )0.028 (0.027) )0.040 (0.018)Non-EU Women )0.245 (0.093) )0.189 (0.070) )0.301 (0.102) )0.058 (0.112) )0.034 (0.030) )0.082 (0.046)N 420 210 210 420 210 210
B. With share of Non-Nationals from EU countriesNon-EU Men )0.050 (0.016) )0.089 (0.020) )0.011 (0.011) )0.043 (0.034) )0.042 (0.031) )0.045 (0.020)EU 0.059 (0.016) 0.094 (0.020) 0.024 (0.012) 0.032 (0.017) 0.037 (0.016) 0.027 (0.010)Non-EU Women )0.210 (0.064) )0.166 (0.043) )0.253 (0.062) )0.067 (0.132) )0.046 (0.033) )0.088 (0.053)EU 0.232 (0.066) 0.203 (0.044) 0.260 (0.064) 0.026 (0.067) 0.025 (0.017) 0.026 (0.027)N 402 201 201 402 201 201
Notes: The Table reports IV estimates of (7) in the text, with the non-EU share endogenous. The EU share variable in panel B is treated as exogenous.
2003]
F321
IN
ST
IT
UT
IO
NS
AN
DT
HE
EF
FE
CT
OF
IM
MI
GR
AT
IO
N
�R
oyal
Eco
no
mic
Society
2003

representative, the IV estimates for men predict that increasing the foreign shareby 10% would reduce employment by half of a percent in a country where 5% ofthe labour force is foreign. On a per-worker basis, this implies that 100 immigrantsin the labour force cost about 83 native jobs, a large effect in levels. Such signifi-cant displacement, especially when compared with results from natural experi-ments such as the Mariel Boatlift, could be due in part to the interactionsdescribed in the theoretical section. It may be that immigrants have a greaterdisplacement effect in Europe than in America because of differing institutions.Hunt (1992) also finds large effects in her study of repatriates from Algeria toFrance, a country with very restrictive labour and product market regulations. Itshould be noted, however, that the estimates with country trends are mostlysmaller than those without trends and not significant.
While many of the 2SLS estimates for men are imprecise, they suggest a patternof reasonably stable negative effects. The results for women are harder to interpret.On one hand, the 2SLS estimates for women show very large negative effects,clearly too large to be attributable to the effects of immigrants. On the other hand,the estimates are greatly reduced by controlling for country trends. The coefficienton the exogenous EU share also falls sharply when trends are added to the modelsfor women. In models with trends, the estimated effect of the non-EU share on theemployment of young women is similar to that for men, while the estimates forolder women are larger still. Note, however, that a given percentage effect forwomen translates into a smaller effect on levels than would do for men because oflower female labour force participation rates.
The marked sensitivity of the estimates for women to the inclusion of countrytrends suggests these estimates are probably driven by forces other than increasedimmigration. One problem with the IV strategy for women is that some countriessaw dramatic changes in female labour force participation (LFP) over this periodwhile female LFP in other countries was more stable. In Italy, for example, em-ployment to population ratios of prime-age women increased by only 3.3 per-centage points between 1990 and 1998. Similarly, in Greece, female employmentrates rose by just 4.5 percentage points. In Belgium, in contrast, which is muchfurther away from Yugoslavia, female employment rates rose by 8.4 points. Simi-larly, in distant Ireland, female employment rates rose by 17.5 points. This sort ofcontrast in female employment growth probably induces a spuriously large IVestimate of immigration effects, since the trend growth was typically larger incountries farther from Sarajevo and Pristina. For men, on the other hand, em-ployment rates have been more stable, with less evidence of trends that differsharply by country or region.12
4. Immigrants Interact with Institutions
Do institutions that make labour and product markets more rigid or lesscompetitive change the employment consequences of immigration for natives?
12 The female LFP statistics quoted in this paragraph are for women aged 25–54 from Table C inOECD (2000). Employment trends in our data are similar.
F322 [ J U N ET H E E C O N O M I C J O U R N A L
� Royal Economic Society 2003

The theoretical section suggests that restrictive labour standards that affectnatives more than immigrants are likely to aggravate any job losses from im-migration, though firing costs may protect incumbent native workers fromdismissal, at least in the short run. Higher replacement rates improve natives’non-work options, reducing employment levels and therefore increasing nativejob loss. Reduced wage flexibility may worsen the employment impact of im-migrants because of scale effects and especially because rigid wages make nativeworkers less competitive with immigrants. Higher entry costs are also predictedto amplify the negative effects of immigrants on natives since new firms createjobs that would otherwise tend to neutralise any displacement effects.Finally, entry costs that reduce employment levels also have an adverse scaleeffect.
The OLS estimates of immigration effects discussed in the previous Section maybe biased towards zero because of endogenous migration, while some of the IVestimates are probably too large to be due solely to immigration, especially forwomen. This may be a consequence of omitted variables correlated with the in-struments. We therefore continue to present results that control for linear countrytrends, as well as OLS estimates. It seems reasonable to think of the OLS and IVestimates as roughly bounding the effects of interest and to look for a consistentpattern of interaction terms in the two sets.
Our empirical strategy looks at OLS and IV estimates of interactions withmeasures of three of the institutional features discussed in the theory section.The first is a summary of labour standards that indexes the extent of employ-ment protection, restrictions on work hours and employment contracts, ad-ministrative or union oversight in hiring and firing decisions, and minimumwages. This measure therefore reflects both firing costs and wage rigidity. Thesecond is the average replacement rate. Both variables were taken from Table 4in Nickell (1997). Labour standards are captured by an index ranging from 0–7,with 7 denoting the most restrictive institutions in our sample. Replacementrates are measured in percent, ranging from 20–90 in our sample. Finally, weexplore interactions with a measure of entry costs taken from Nicoletti et al.(2000). This is an index of barriers to entrepreneurship ranging from 0.5 to2.75 in our sample.
4.1. Estimates of Interaction Effects
The equation used to estimate interactions between immigrants and labour mar-ket institutions is
lnðyijtÞ ¼ li þ dt þ bj þ ða0i þ a1i ~xxjÞ lnðsjtÞ þ vijt ; ð9Þ
where ~xxj is an institutional characteristic, measured as the deviation from themedian value in our sample. We also include the EU share since this increased theprecision of the IV estimates in Table 5 in models without country trends. Toincrease the comparability of estimated effects, institutional variables are scaled instandard deviation units. The parameter a0i therefore captures the effect of
2003] F323I N S T I T U T I O N S A N D T H E E F F E C T O F I M M I G R A T I O N
� Royal Economic Society 2003

immigration on demographic group i in countries with the median institutionvalue, while the interaction term, a1i, describes how this effect changes with a onestandard deviation change in ~xxj . We think of a1i as approximating the averagederivative of e(N, e) with respect to institutional variables. When ln(sjt) is treated asendogenous, the instrument list is augmented with interactions between ~xxj and theinstruments used to estimate (7). Note that this setup fails to identify the effects ofthe institutions themselves since ~xxj is time-invariant.13
The analysis of institutions is limited to the sample of men since the 2SLSestimates for women are considerably more sensitive to control for country trendsand the identification of interaction terms in models with country trends istenuous. As noted earlier, this sensitivity appears to be due to strong regionaltrends in female labour force participation. These trends vary across countries in amanner correlated with distance from former Yugoslavia.
The estimates of (9) are consistent with the hypothesis that immigration effectsare more negative in countries with less flexible labour markets, higher replace-ment rates, and higher entry costs. This can be seen in Panel A of Table 6, whichlabels estimates of a0i ‘Main Effect’ and estimates of a1i ‘Interaction’. The firstcolumn shows OLS results for men in both age groups. The interaction withlabour standards in this specification is estimated to be a statistically significant)0.015, indicating that increasing the severity of labour standards by one standarddeviation, about the difference between Denmark and Belgium, would increasethe negative effect of immigration from )0.027 at the median to about )0.042. Theinteraction terms are larger for young men than for men over 40. Similarly, thepooled interaction with replacement rates is )0.017, so a one standard deviationincrease in replacement rates would increase the negative effect of immigrationfrom )0.027 at the median to )0.044. The results including both labour marketinteractions are reported in Panel B of the Table. Including both interactionsgenerates OLS estimates that are similar to, though somewhat smaller than, theestimates generated by including the interactions one at a time. Again, the effectsare larger for younger men.
The 2SLS estimates for men, reported in cols. 4–6, differ from the OLS esti-mates in that both the main effects and interaction terms are less preciselyestimated. The OLS and 2SLS estimates of main effects are similar for modelsthat include interaction terms with labour standards. The 2SLS estimates of theinteraction terms for labour standards are much larger than the correspondingOLS estimates, however, and again negative and significant. The 2SLS estimatesof interaction terms with replacement rates are not significant, and the 2SLSestimates of main effects in models with replacement rate interactions are notsignificant. The 2SLS estimates of models incorporating interactions with both
13 Direct causal effects of labour market institutions are difficult to capture in a cross-country panelbecause of a lack of variation. An OECD (1999b, p. 50) report observes, ‘Between the 1980s and late1990s, there was considerable continuity in EPL practices in most countries.’ There have been a fewpolicy experiments, however. Kugler et al. (2002) find increased employment in response to a recentsharp decrease in firing costs and payroll taxes for some protected groups in Spain. For a dissenting viewon the importance of employment protection, see Layard and Nickell (1999), who draw conclusionsfrom a cross-sectional analysis.
F324 [ J U N ET H E E C O N O M I C J O U R N A L
� Royal Economic Society 2003

Table 6
Interactions with Institutions: Estimates for Men
OLS 2SLS
By age group By age group
Interaction RegressorPooled
(1)Under 40
(2)Over 40
(3)Pooled
(4)Under 40
(5)Over 40
(6)
A. Institutions one at a timeLabour standards Main effect )0.027 (0.010) )0.045 (0.012) )0.010 (0.008) )0.031 (0.025) )0.071 (0.034) 0.008 (0.021)
Interaction )0.015 (0.007) )0.019 (0.008) )0.011 (0.005) )0.070 (0.025) )0.091 (0.034) )0.050 (0.021)N 334 167 167 334 167 167Replacement rate Main effect )0.027 (0.010) )0.045 (0.012) )0.010 (0.007) 0.051 (0.056) 0.108 (0.089) )0.006 (0.040)
Interaction )0.017 (0.008) )0.019 (0.009) )0.014 (0.006) 0.007 (0.017) 0.0001 (0.027) 0.015 (0.012)N 334 167 167 334 167 167Barriers to entrepreneurship Main effect )0.027 (0.008) )0.044 (0.009) )0.010 (0.006) )0.061 (0.020) )0.117 (0.028) )0.005 (0.017)
Interaction )0.019 (0.009) )0.023 (0.011) )0.014 (0.007) )0.039 (0.022) )0.020 (0.031) )0.058 (0.019)N 368 184 184 368 184 184B. Institutions TogetherLabour standards and replacement rate Main effect )0.028 (0.010) )0.046 (0.012) )0.011 (0.007) )0.032 (0.029) )0.080 (0.042) 0.016 (0.021)
Labour standards )0.012 (0.007) )0.016 (0.008) )0.008 (0.005) )0.056 (0.020) )0.091 (0.030) )0.020 (0.015)Replacement rate )0.013 (0.008) )0.015 (0.009) )0.012 (0.006) )0.016 (0.017) )0.029 (0.026) )0.002 (0.013)
N 334 167 167 334 167 167Barriers, labour standards,and replacement rate
Main effect )0.035 (0.012) )0.053 (0.014) )0.017 (0.008) )0.055 (0.033) )0.102 (0.044) )0.008 (0.026)
Barriers )0.017 (0.015) )0.018 (0.018) )0.016 (0.011) )0.088 (0.032) )0.124 (0.043) )0.052 (0.025)Labour standards )0.002 (0.011) )0.006 (0.013) 0.001 (0.008) 0.024 (0.020) 0.029 (0.026) 0.020 (0.015)Replacement rate )0.016 (0.008) )0.017 (0.010) )0.014 (0.006) 0.006 (0.013) 0.006 (0.018) 0.007 (0.010)
N 334 167 167 334 167 167
Notes: The Table reports main effects and interaction terms in (9) in the text. Instruments for the foreign share are as in Table 5, plus interactions with institutionalmeasures. Main effects are evaluated at the median institution (5 for labour standards, 63 for replacement rate, 1.715 for barriers to entrepreneurship) andmeasured in standard deviation units. The EU share variable is included and treated as exogenous.
2003]
F325
IN
ST
IT
UT
IO
NS
AN
DT
HE
EF
FE
CT
OF
IM
MI
GR
AT
IO
N
�R
oyal
Eco
no
mic
Society
2003
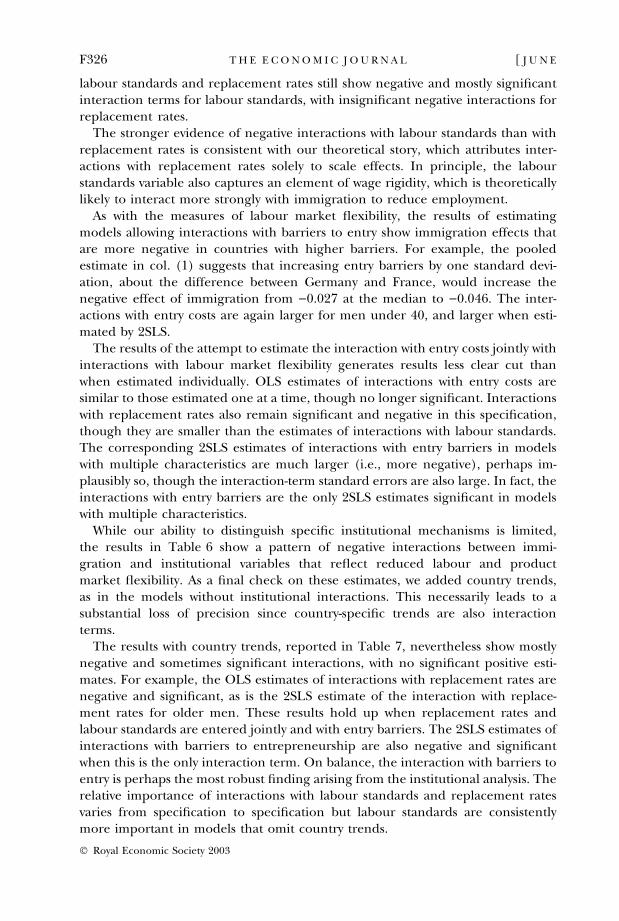
labour standards and replacement rates still show negative and mostly significantinteraction terms for labour standards, with insignificant negative interactions forreplacement rates.
The stronger evidence of negative interactions with labour standards than withreplacement rates is consistent with our theoretical story, which attributes inter-actions with replacement rates solely to scale effects. In principle, the labourstandards variable also captures an element of wage rigidity, which is theoreticallylikely to interact more strongly with immigration to reduce employment.
As with the measures of labour market flexibility, the results of estimatingmodels allowing interactions with barriers to entry show immigration effects thatare more negative in countries with higher barriers. For example, the pooledestimate in col. (1) suggests that increasing entry barriers by one standard devi-ation, about the difference between Germany and France, would increase thenegative effect of immigration from )0.027 at the median to )0.046. The inter-actions with entry costs are again larger for men under 40, and larger when esti-mated by 2SLS.
The results of the attempt to estimate the interaction with entry costs jointly withinteractions with labour market flexibility generates results less clear cut thanwhen estimated individually. OLS estimates of interactions with entry costs aresimilar to those estimated one at a time, though no longer significant. Interactionswith replacement rates also remain significant and negative in this specification,though they are smaller than the estimates of interactions with labour standards.The corresponding 2SLS estimates of interactions with entry barriers in modelswith multiple characteristics are much larger (i.e., more negative), perhaps im-plausibly so, though the interaction-term standard errors are also large. In fact, theinteractions with entry barriers are the only 2SLS estimates significant in modelswith multiple characteristics.
While our ability to distinguish specific institutional mechanisms is limited,the results in Table 6 show a pattern of negative interactions between immi-gration and institutional variables that reflect reduced labour and productmarket flexibility. As a final check on these estimates, we added country trends,as in the models without institutional interactions. This necessarily leads to asubstantial loss of precision since country-specific trends are also interactionterms.
The results with country trends, reported in Table 7, nevertheless show mostlynegative and sometimes significant interactions, with no significant positive esti-mates. For example, the OLS estimates of interactions with replacement rates arenegative and significant, as is the 2SLS estimate of the interaction with replace-ment rates for older men. These results hold up when replacement rates andlabour standards are entered jointly and with entry barriers. The 2SLS estimates ofinteractions with barriers to entrepreneurship are also negative and significantwhen this is the only interaction term. On balance, the interaction with barriers toentry is perhaps the most robust finding arising from the institutional analysis. Therelative importance of interactions with labour standards and replacement ratesvaries from specification to specification but labour standards are consistentlymore important in models that omit country trends.
F326 [ J U N ET H E E C O N O M I C J O U R N A L
� Royal Economic Society 2003

Table 7
Interactions with Institutions: Estimates for Men with Country Trends
OLS 2SLS
By age group By age group
Interaction Regressor Pooled (1) Under 40 (2) Over 40 (3) Pooled (4) Under 40 (5) Over 40 (6)
A. Institutions one at a timeLabor standards Main effect )0.014 (0.016) )0.019 (0.014) )0.010 (0.009) )0.050 (0.064) )0.067 (0.064) )0.032 (0.038)
Interaction )0.003 (0.011) )0.006 (0.010) )0.0002 (0.006) )0.034 (0.037) )0.051 (0.037) )0.018 (0.022)N 334 167 167 334 167 167Replacement rate Main effect )0.022 (0.016) )0.027 (0.014) )0.018 (0.009) )0.045 (0.066) )0.003 (0.062) )0.086 (0.044)
Interaction )0.026 (0.012) )0.029 (0.011) )0.023 (0.006) )0.015 (0.028) 0.008 (0.026) )0.038 (0.019)N 334 167 167 334 167 167Barriers to entrepreneurship Main effect )0.013 (0.013) )0.015 (0.012) )0.012 (0.007) )0.049 (0.037) )0.048 (0.040) )0.050 (0.0259)
Interaction )0.002 (0.012) )0.003 (0.011) )0.002 (0.007) )0.076 (0.033) )0.094 (0.035) )0.059 (0.0231)N 368 184 184 368 184 184
B. Institutions TogetherLabour standards Main effect )0.024 (0.016) )0.030 (0.015) )0.018 (0.009) )0.070 (0.067) )0.049 (0.062) )0.091 (0.048)and replacement rate Labour standards )0.007 (0.011) )0.010 (0.010) )0.003 (0.006) )0.035 (0.042) )0.038 (0.038) )0.033 (0.030)
Replacement rate )0.027 (0.012) )0.030 (0.011) )0.023 (0.006) )0.041 (0.035) )0.024 (0.032) )0.057 (0.025)N 334 167 167 334 167 167Barriers, labour standards, Main effect )0.024 (0.016) )0.030 (0.015) )0.018 (0.009) )0.046 (0.053) )0.019 (0.051) )0.073 (0.037)and replacement rate Barriers )0.007 (0.023) 0.002 (0.021) )0.015 (0.013) )0.093 (0.059) )0.088 (0.057) )0.097 (0.041)
Labour standards )0.002 (0.020) )0.011 (0.018) 0.008 (0.011) 0.056 (0.063) 0.051 (0.060) 0.062 (0.044)Replacement rate )0.028 (0.012) )0.030 (0.011) )0.026 (0.007) )0.035 (0.028) )0.021 (0.027) )0.049 (0.020)
N 334 167 167 334 167 167
Notes: The Table reports main effects and interaction terms in equation (9) in the text, with the addition of country trends. The instruments and covariates are thesame as in Table 6.
2003]
F327
IN
ST
IT
UT
IO
NS
AN
DT
HE
EF
FE
CT
OF
IM
MI
GR
AT
IO
N
�R
oyal
Eco
no
mic
Society
2003
5. Summary and Conclusions
This paper presents new evidence on the question of how immigration affectsnative employment, focusing on the extent to which displacement effects ofimmigration are mitigated or amplified by cross-country differences in institu-tions. The estimates typically show that an increase in the foreign share of 10%would reduce native employment rates by 0.2–0.7 of a percentage point. OLSestimates are at the low end of this scale, while the IV estimates using the BalkanWars are mostly larger than the corresponding OLS estimates, implying sub-stantial displacement of native workers by immigrants. Such large effects couldbe explained by the institutional mechanisms outlined in our theoretical dis-cussion and by the fact that there has been remarkably little employment cre-ation in most of Western Europe in the last two decades, while immigrantemployment has grown considerably. Since many immigrants work, their jobsmay well have come at the expense of natives. Of course, effects this size may alsosignal identification problems, and the IV estimates are not very precise. Ittherefore seems reasonable to interpret the OLS and IV estimates as bracketingthe true effect.
We are especially interested in the question of whether measures of labour andproduct-market flexibility change the impact of immigration on native employ-ment. This question has important policy ramifications since many Western Eu-ropean countries are considering institutional and immigration reforms, andworking to integrate previous immigrant cohorts more fully. Though restrictiveeconomic institutions can play a protective role for natives, our theoreticalframework suggests that institutions such as firing costs, high replacement rates,rigid wages and business entry costs, may ultimately aggravate the negative impactof immigration on equilibrium native employment. Part of this interaction is due toscale effects: institutions that reduce employment levels will tend to make the effectof a given number of immigrants worse. Higher entry barriers and reduced wageflexibility also have a direct and theoretically more substantial effect that increasesthe negative impact of immigrants on native employment.
Although not entirely clear cut, the empirical results offer some support for theview that reduced flexibility may make immigrant absorption more painful, at leastwhen viewed from the perspective of native employment. Models that allow theimpact of the foreign share on the employment of native men to vary with an indexof labour market flexibility, replacement rates, and entry costs tend to show largerimmigration effects when flexibility is reduced and replacement rates and entrycosts increased. These negative interactions are apparent in the OLS and many ofthe IV estimates, though the IV estimates of interaction terms are less precise,especially when country trends or more than one institutional characteristic isincluded in the model. While specific channels for interactions are difficult toidentify, the view that restrictive institutions have insulated native workers fromcompetition with immigrants does not get empirical support.
MIT and NBERUniversitat Pompeu Fabra and CEPR
F328 [ J U N ET H E E C O N O M I C J O U R N A L
� Royal Economic Society 2003

Data Appendix
Data for Figures 1 and 2
The data plotted in Figure 1 are from OECD (1999a) and earlier volumes in the same series.The data plotted in Figure 2 are from http://www.unhcr.ch/statist/99oview/toc.htm (Refugeesand Others of Concern to UNHCR 1999 Statistical Overview, published by the UnitedNations High Commissioner for Refugees, Geneva, July 2000).
The Eurostat Labour Force Survey
The Eurostat LFS data set is documented in Eurostat (1998) and in a variety of memosreleased with these data. The LFS surveys are carried out by national statistical agenciesaccording to guidelines issued by the European Community. The sampling frame in allcountries covers only private households and not group quarters. This is probably im-portant for the coverage of immigrants in some countries. Sampling rates, sample sizes,and interview methods (e.g., use of CATI/CAPI) vary from country to country. The LFSsamples are stratified in a variety of ways but the sample statistics we received fromEurostat were already weighted to population counts. We used these population weightsto aggregate cell statistics where necessary (e.g., to combine age groups). Our estimatestreat country statistics as population parameters, that is, we did not weight to adjust fordifferences in country size. We experimented with alternate weighting schemes andfound weighted-by-population estimates to be similar. Response rates vary from a low of55–60% in the Netherlands to 98% in Germany, with the median response rate at 87%.Labour force status is defined using a consistent definition based on ‘actual status inthe reference week’. We checked data quality and our processing by comparing statis-tics we constructed with those published in the OECD (2000) publication EmploymentOutlook.
Time-consistent Definition of Immigrants’ EU Status
The analysis here distinguishes non-natives and non-nationals (foreigners) according tohome country membership in the EU. This distinction is complicated in practice by the factthat the list of EU member countries changed a number of times over the sample. More-over, we cannot distinguish East from West Germany in the post-unification period. Ouranalysis uses a time-consistent definition of EU membership. where the EU is defined as theoriginal EU-12 plus Austria and Norway. All immigrants from Germany are also defined asbeing from the EU (the results are not sensitive to the classification of German immigrantsas being from a non-EU country).
Cell Statistics and Confidentiality Edit
At our request, Eurostat provided tabulations of LFS cell statistics by country, year, age,schooling group, nationality, and nativity. Research data provided by Eurostat are releasedwith the stipulation that cell statistics below country-specific thresholds not be released orused in statistical analyses. The results reported here use only those cells above the disclo-sure thresholds, as determined by a table provided by Eurostat. The restrictions we used arethose from ‘column A’ of the Eurostat Guidelines table, as described in the latest release ofthe ‘New Chronos’ data set.
2003] F329I N S T I T U T I O N S A N D T H E E F F E C T O F I M M I G R A T I O N
� Royal Economic Society 2003

References
Acemoglu, D. and Angrist, J. (2001). ‘Consequences of employment protection? The case of theAmericans with Disabilities Act’, Journal of Political Economy, vol. 109, (October), pp. 915–57.
Altonji, J. G. and Card, D. (1991). ‘The effects of immigration on the labor market outcomes of less-skilled natives’, in (J.M. Abowd and R.B. Freeman, eds.), Immigration, Trade and Labor, Chicago:University of Chicago Press.
Angrist, J. and Kugler, A. (2001). ‘Protective or counter-productive? Labor market institutions and theeffect of immigration on EU natives’, NBER Working Paper 8660, December.
Bauer, T. and Zimmermann, K. F. (1999). ‘Assessment of possible migration pressure and its labourmarket impact following EU enlargement to Central and Eastern Europe’, IZA Research Report 3,July.
Bauer, T., Lofstrom, M. and Zimmermann, K. F. (2000). ‘Immigration policy assimilation of immigrantsand native’s sentiment towards immigrants: evidence from 12 OECD countries’, IZA DiscussionPaper No. 187, August.
Bentolila, S. and Bertola, G. (1990). ‘Firing costs and labour demand: how bad is eurosclerosis?’, Reviewof Economic Studies, vol. 57, (July), pp. 81–402.
Bertrand, M. and Kramarz, F. (2001). ‘Does entry regulation hinder job creation? Evidence from theFrench retail industry’, NBER Working Paper no. 8211, April.
Blanchard, O. and Wolfers, J. (2000). ‘The role of shocks and institutions in the rise of Europeanunemployment: the aggregate evidence’, Economic Journal, vol. 110, (March), pp. C1–33.
Borjas, G. J. (1994). ‘The economics of immigration’, Journal of Economic Literature, vol. 32, (December),pp. 1667–717.
Borjas, G. J. (1995). ‘The economic benefits from immigration’, Journal of Economic Perspectives, vol. 9,(Spring), pp. 3–22.
Card, D. E. (1990). ‘The impact of the Mariel Boatlift on the Miami labor market’, Industrial and LaborRelations Review, vol. 43, (January), pp. 245–57.
Card, D. E. (2001). ‘Immigrant inflows, native outflows, and the local labor market impacts of higherimmigration’, Journal of Labor Economics, vol. 19, (January), pp. 22–64.
Carrington, W. and deLima, P. (1996). ‘The impact of 1970s repatriates from Africa on the Portugueselabor market’, Industrial and Labor Relations Review, vol. 49, (January), pp. 330–47.
Dolado, J. J., Duce, R. and Jimeno, J. F. (1996). ‘The effects of migration on the relative demand ofskilled versus unskilled labour: evidence from Spain’, CEPR Discussion Paper no. 1476, September.
Eurostat (1998). Labor Force Survey: Methods and Definition. Brussels: The European Commission.Friedberg, R. M., and Hunt, J. (1995). ‘The impact of immigrants on host country wages, employment,
and growth’, Journal of Economic Perspectives, vol. 9, (Spring), pp. 23–44.Hamermesh, D. F. (1986). ‘The demand for labor in the long run’, ch. 8 in (O. Ashenfelter and
R. Layard, eds.), The Handbook of Labor Economics, Amsterdam: North-Holland.Hopenhayn, H. and Rogerson, R. (1993). ‘Job turnover and policy evaluation: a general equilibrium
analysis’, Journal of Political Economy, vol. 101, (October), pp. 915–38.Hunt, J. (1992). ‘The impact of the 1962 repatriates from Algeria on the French labor market’, Industrial
and Labor Relations Review, vol. 45, (April), pp. 556–72.Ichino, A. (1993). ‘The economic impact of immigration on the host country’, in (G. Luciani, ed.),
Migration Policies in Europe and the United States, Dordrecht: Kluwer.Ichino, A. and Riphahn, R. (2000). ‘Measuring the effect of employment protection on shirking’,
Florence: European University Institute, mimeo, November.Johnson, G. (1980). ‘The labor market effects of immigration’, Industrial and Labor Relations Review,
vol. 33, (April), pp. 331–41.Kugler, A. and Saint-Paul, G. (2003). ‘How do firing costs affect worker flows in a world with adverse
selection?’, Journal of Labor Economics, forthcoming.Kugler, A., Jimeno, J. F. and Hernanz, V. (2002). ‘The labor market consequences of restrictive permanent
contracts: evidence from Spanish labour market reforms’, Universitat Pompeu Fabra, mimeo, June.Lalonde, R. J. and Topel, R. H. (1991). ‘Labor market adjustments to increased immigration’, in (J.M.
Abowd and R.B. Freeman, eds.), Immigration, Trade and Labor, Chicago: University of Chicago Press.Layard, R. and Nickell, S. (1999). ‘Labor market institutions and economic performance’, ch. 46 in
(O. Ashenfelter and D. Card, eds.), The Handbook of Labor Economics, Volume 3, Amsterdam:Elsevier.
Lazear, E. (1990). ‘Job security provisions and employment’, Quarterly Journal of Economics, vol. 105,(August), pp. 699–726.
Nicoletti, G., Scarpetta, S. and Boylaud, O. (2000). ‘Summary indicators of product market regulationwith an extension to employment protection legislation’, OECD Economics Department WorkingPaper no. 226, Paris: OECD.
F330 [ J U N ET H E E C O N O M I C J O U R N A L
� Royal Economic Society 2003

Nickell, S. (1997). ‘Unemployment and labor market rigidities: Europe versus North America’, Journal ofEconomic Perspectives, vol. 11, (Summer), pp. 55–74.
OECD. (1994). The OECD Jobs Study: Facts, Analysis, Strategies, Paris: OECD.OECD. (1995). Trends in International Migration, Annual Report 1994, 1995 Edition, Paris: OECD.OECD. (1999a). Trends in International Migration, Annual Report, 1999 Edition, Paris: OECD.OECD. (1999b). OECD Employment Outlook, 1999, Paris: OECD, June.OECD. (2000). OECD Employment Outlook, 2000, Paris: OECD, June.OECD. (2001). Trends in International Migration, Annual Report, 2000 Edition, Paris: OECD.Pischke, J. S. and Velling, J. (1997). ‘Employment effects of immigration to Germany: an analysis based
on local labor markets’, Review of Economics and Statistics, vol. 79, (November), pp. 594–604.Razin, A. and Sadka, E. (1996). ‘Suppressing resistance to low-skill migration’, International Tax and
Public Finance, vol. 3, (July), pp. 413–24.Rodrik, D. (1997). Has Globalization Gone Too Far?, Washington, DC: The Institute for International
Economics.Saint-Paul, G. (1996). Dual Labor Markets: A Macroeconomic Perspective, Cambridge: MIT Press.Schmidt, C. M., Stilz, A. and Zimmermann, K. F. (1994). ‘Mass migration, unions, and government
intervention’, Journal of Public Economics, vol. 55, (October), pp. 185–201.Winter-Ebmer, R. and Zweimuller, J. (1997). ‘Immigration, trade, and Austrian unemployment’, in
(M. Landesmann and E. Streissler, eds.), Unemployment in Europe, London: MacMillan.
2003] F331I N S T I T U T I O N S A N D T H E E F F E C T O F I M M I G R A T I O N
� Royal Economic Society 2003