protecting value in the face of mass fatality events · protecting value in the face of mass...
TRANSCRIPT

Protecting Value in the Face of Mass Fatality Events


Contents Page
Foreword 2
Executive Summary 4 1 Extreme Events 5 2 Aviation Disasters 9 3 Fires & Explosions 13 4 Terrorist Attacks 16 5 Natural Catastrophes 19
Conclusions 23 All data underlying this study are publicly available and were obtained from a variety of online sources including, but not limited to, various corporate websites and Dow Jones Reuters Business Interactive, the international newspaper and newswire archive. Whilst every effort has been made to ensure the accuracy and integrity of these data, Oxford Metrica accepts no liability for any inaccuracies contained herein.

2
Foreword I am delighted to introduce Oxford Metrica’s third briefing on the value impact of crises. Our first report in 1996 focussed on corporate catastrophes and their impact on shareholder value; the results highlighted the critical contribution to value recovery of the leadership demonstrated by senior management in times of crisis. The second report in 2001 updated the previous research, and introduced the notion of reputation and value; the results illustrated the interaction between reputation and value, and measured the increase or decrease in reputation equity from selected crises. The current briefing updates and further extends this body of work. Since the publication of the last briefing, the world has endured a number of major crises involving mass fatalities, including the 9-11 attack on the World Trade Center in New York and, more recently, the Tsunami tragedy in South East Asia. As this briefing is going to print, the Gulf Coast of the United States is still recovering from the devastation of Hurricane Katrina. We consider it appropriate, therefore, to focus the current briefing on mass fatality events. The results demonstrate that the mass fatality feature of a crisis amplifies considerably the reputation effects, as reflected in the impact on value. We hope that this briefing will provide corporations around the world with some insights on managing effectively such tragic events and better enable firms to protect value. It is demonstrably clear that doing the right thing is not only an essential part of a corporation’s ethical responsibility, it is also the best way to protect shareholders’ interests. We are grateful especially to all of those who shared their views on such tragic events and, in particular, to Robert Jensen and his colleagues at Kenyon International who generously supported our work.
Dr Rory F Knight Chairman Oxford Metrica

3
In Memoriam
To the 234,339 people who lost their lives in the tragic events reported herein.

4
Executive Summary The aim of this briefing is to measure the shareholder value impact of mass fatality events and to identify the key determinants of value protection and recovery. Mass fatality events are defined generally as those which produce more fatalities than can be handled using local resources. In this study, we include also those events which had the potential to result in mass fatality but, thankfully, did not. Events emanating from four prominent perils over the last five years are evaluated: Aviation disasters Fires and explosions Terrorist attacks Natural catastrophes
The tragic nature of mass fatality events brings a number of managerial behaviours into painfully sharp focus and there is much to learn from the different ways in which firms respond. A firm’s share price reflects the consensus view of investors as to how management has performed under such pressure. For the research presented herein, these share price reactions are analysed extensively to reveal some core policy implications for senior management. The key conclusions are listed below. Key Conclusions 1 Mass fatality events have double the impact on shareholder value than corporate
catastrophes in general; Figures 1 and 2. 2 The market makes a rapid judgement on whether it expects reputation to be
damaged or enhanced by a crisis. However, shocking news takes time to be digested and, in the case of mass fatality events, the multiplier effect on value takes, on average, 100 trading days to emerge prominently.
3 As with non-fatal reputation crises for firms, the key determinant of value recovery
relates to the ability of senior management to demonstrate strong leadership and to communicate at all times with honesty and transparency.
4 For mass fatality events particularly, the sensitivity and compassion with which the
Chief Executive responds to victims’ families, and the logistical care and efficiency with which response teams carry out their work, become paramount. There is a 40% value premium associated with the engagement of such specialist services; Figure 6.
5 Irrespective of whose responsibility is the cause of a mass fatality event, a sensitive
managerial response is critical to the sustaining and creation of shareholder value. The empirical evidence on the value impact of mass fatality events is compelling. Beyond the obvious moral rationale for good behaviour by management, it is clear that the markets respond positively to firms which demonstrate essential human qualities; sensitivity, compassion, honesty and courage. The managerial awareness of what is required, and the courage to act accordingly, sends a strong signal of skill to investors.

5
1 Extreme Events The research results presented in this briefing build upon over a decade’s research into the effects of extreme, negative events on firms’ share prices and the varying abilities of management to recover from such events. The first study1 measures the impact of corporate catastrophes on shareholder value and identifies the drivers of value recovery. It was found that the way in which senior management, and the Chief Executive in particular, handles a disaster is a much stronger determinant of recovery than are the direct financial consequences of a loss. The second study2 centres on reputation crises, irrespective of any underlying physical loss, and their relationship with shareholder value performance. The results support those of the first study and, further, reveal the considerable power of signalling in markets as investors make major re-adjustments (up or down) to their views of management and to their expectations of future cash flow emanating from crisis-struck firms. It was found that firms tend to fall into one of two relatively distinct groups - Recoverers and Non-recoverers - depending largely on the ability of senior management to deal effectively with the aftermath of the crisis. These value patterns are illustrated in Figure 1.
Figure 1: Value Reaction to Reputation Crises in general
The x-axis in the graph represents one calendar year following the crises (261 trading days) where the date of each crisis has been aligned on event day 0. The y-axis calibrates a modelled share price reaction where market-wide influences have been stripped out and returns have been risk-adjusted. The ValueReactionTM modelling procedure thereby captures a very clean measurement of share price impact following a sudden and
1 The Impact of Catastrophes on Shareholder Value, (1996), by Rory F Knight & Deborah J Pretty, Templeton College, University of Oxford, commissioned by Sedgwick. 2 Reputation and Value: the case of corporate catastrophes, (2001), by Rory F Knight & Deborah J Pretty, Oxford Metrica.
!"#$
!%&$
!%#$
!&$
#
&
%#
%&
"#
# "# '# (# )# %## %"# %'# %(# %)# "## ""# "'# "(#
*+,-.$/0123-4$516
7189,:,1;.3<-/
=$>?@
:,;<+,0,0A B<-!0,;<+,0,0A

6
unexpected event. It should be noted that the two groups depicted in Figure 1 exhibit the statistical characteristic of two separate distributions. The new research presented in this briefing focuses on mass fatality events - incidents which produce more fatalities than can be handled using local resources - and incidents which had the potential to become such events. The results bring into sharp focus the managerial behaviours that are required for value recovery to be efficient and sustained following corporate tragedy. Shown in Table 1 are the number of events with the associated number of firms affected and fatalities (confirmed dead and missing) included in the study.
Table 1: Mass Fatality Events Analysed
!"#$%& '()"& *+",)-& .$#/-& .()(%$)$"-&
!"#$%#&'()#*$*%+,*( -(.$'(/000(1(2-(3+4(/005(
//( //( -6778(
9#,+*(:(+;<=&*#&'*( -(.$'(/000(1(2-(3+4(/005(
/>( /7( ?0@(
A+,,&,#*%($%%$4B(&'(%C+(DAE($')(F+'%$G&'(
--(H+<(/00-( -((
-/( 260/?(
!*#$'(%*I'$J#( /8(3+4(/005((
-( -/( //76@-@2!
01)(%& 23& 45& 6758779&
The list of events included is not exhaustive sadly but reflects practical issues of data identification and availability. Depicted in Figure 2 are the shareholder value reactions to mass fatality events, where the reactions are analogous to those of the general reputation crises shown in Figure 1.
3 Latest estimate at 5 May 2005, Reuters News.

7
Figure 2: Value Reaction to Mass Fatality Events
When comparing Figures 1 and 2, it becomes clear that the value impact of mass fatality events is much greater than for reputation crises in general. In fact, whereas the value differential between Recoverers and Non-recoverers by the end of the post-event year is 25% for general reputation crises, the differential between the two groups is a striking 50% for mass fatality events; Figure 2a.
Figure 2a: Comparative Value Reactions
!"#$
!%#$
!&#$
#
&#
%#
"#
'#
# %# '# (# )# &## &%# &'# &(# &)# %## %%# %'# %(#
*+,-.$/0123-4$5167
819:,
;,1
<.3=->
$?@A
;,<=+,0,07 B=-!0,<=+,0,07
!"#$
!%#$
!&#$
#
&#
%#
"#
'#
# %# '# (# )# &## &%# &'# &(# &)# %## %%# %'# %(#*+,-.$/0123-4$5167
819:,
;,1
<.3=->
$?@A
C177$D1.193.6$;,<=+,0,07 C177$D1.193.6$B=-!0,<=+,0,07E,-,019$;,<=+,0,07 E,-,019$B=-!0,<=+,0,07

8
This result implies that the ability to manage well a mass fatality event is even more impressive to investors, and the inability to manage such events is even more disappointing, than in less tragic corporate crises. The presence of mass fatality, therefore, acts as a multiplier on the re-estimation process by investors of the future cash flow expected from a firm. It becomes even more critical to manage these events well. It is also noticeable that the discrepancy in performance between the two groups - Recoverers and Non-recoverers - emerges more gradually in mass fatality events than in general reputation crises. Shocking information takes a while to sink in. The Recoverers (of mass fatality events and reputation crises in general) are on approximately the same trajectory to Day 100. Thereafter, the Recoverers of mass fatality events continue to increase in value. The Non-recoverers of mass fatality events do not appear to drop as sharply initially but, by the end of the post-event year, these firms have under-performed the Non-recoverers of general crises. The amplified value impact may be due also to issues of responsibility, where it is not always clear immediately in mass fatality events whether the company is ultimately responsible for the cause of the event; acts of terrorism and natural catastrophes being two obvious examples where the company is not responsible for the peril itself. Verdicts on managerial responsibility and opinions on pre- and post-event responsible behaviour, therefore, may be made much later than for general reputation crises. Trading volume activity reflects the speed and intensity with which information about a firm is disseminated, digested and acted upon by investors. The Trading Volume Multiplier is defined as the multiple of the previous year’s average daily trading volume in ordinary shares. Thus a Trading Volume Multiplier of one indicates normal trading volumes and no significant impact on liquidity.
Figure 3: Increased Trading following Mass Fatality Events
Figure 3 shows abnormally high trading volume (above 1) by firms throughout the month following a mass fatality event. This is particularly so for the Non-recoverers, and reflects uncertainty in the market and the difficulty of evaluating complex information.
!"!
!"#
$"!
$"#
%"!
%"#
&"!
&"#
'"!
($ ! $ % & ' # ) * + , $! $$ $% $& $' $# $) $* $+ $, %!
-./0123456708295:;
345
670
82<
=>?@
/2A
?>17B>/
C/D=./4/4; E=0(4/D=./4/4;

9
2 Aviation Disasters Analysed in this section are twenty-two aviation disasters from the last five years; listed in Table 2. A total of 1,886 people died in these air crashes.
Table 2: Aviation Disasters from 1 Jan 2000 - 31 Dec 2004 !"#$% &'()"*+% ,-*$./01)% 2"#"31#1$/% !$/4.1)#1'*%
!"#$%&#'!##
()*+,-./#(,+0,/*1##2(34#5%+67##
6890,-##
":;##
<0,=>?#;@AB#(,+981#(CD''B#E<FG#":'#.9%.+H#I#;#%/#=+%8/H#H,*H#
";#3.J#'"##
5>,/.#(,+0,/*1##
6890,-##
"";##
<0,=>?#5K:!!B#L%*,/=#AMAC"''B#N.,O./#P?+.,?#
D'#E./#''##
F*/J.#(,+0,/*1##
/.?,%/.0##
!:Q##
<0,=>?#MD!B#(,+981#D!'B#K&%+J#5%.1?G#!'#18+&,&%+1#
D!#E./#''##
(0.1R.#(,+0,/*1##2(0.1R.#(,+#S+%867#
6890,-##
!MD##
<0,=>?#":!B#3TC@DB#5.0,U%+/,.G#.00#H,*H#
"D#(8=#''##
S80U#(,+##
/.?,%/.0##
!MD##
<0,=>?#''A"B#(,+981D"'B#L.>+.,/G#.00#H,*H#
!Q#(6+#''##
(,+#V>,0,66,/*1##
/.?,%/.0##
!D!##
<0,=>?#;M!B#L%*,/=#ADAC"''B#P.).0#K10./HG#.00#H,*H#
!M#(6+#'"##
(,+#5>,/.##
/.?,%/.0##
!"Q##
<0,=>?#5(!"QB#L%*,/=#A:AC"''B#V81./#P#F%+*.G#DA#,/W8+*H#
@#X-?#'!##
P-./H,/.&,./##(,+0,/*1#PJ1?*)#
6890,-##
!!@##
<0,=>?#PF#:@:B#3TC@AB#3,0./B#K?.0J#
";#E80#''##
(,+#<+./-*##
6890,-##
!!D##
<0,=>?#(<M;Q'B#5%/-%+H*B#S%/*11*B#/*.+#V.+,1#
A#3.J#'"##
5>,/.#$%+?>*+/#(,+0,/*1#
6+,&.?*##
!!"##
<0,=>?#:!D:B#3TC@"B#T.0,./##
D!#X-?#''##
P,/=.6%+*#(,+0,/*1##
6890,-##
@"##
<0,=>?#PY'':B#L%*,/=#AMACM''B#N.,O./G#QA#,/W8+*H#
@#E./#'D##
N8+R,1>#(,+0,/*1##
/.?,%/.0##
A;##
L(*#(&+%#4E!''B#T,J.+9.R,+G#;#,/W8+*H#
!#E80#'"###
TZ[#2T*8?1->*#V%1?7###
6890,-###
A!###
N86%0*&#!;M#W*?#24811,%/#L.1>R,+,./#(,+0,/*17#./H#TZ[#L%*,/=#A;AB#\9*+0,/=/B#S*+)./J#
!A#E80#''##
(00,./-*#(,+##
6+,&.?*##
;;##
L%*,/=#ADAB#V.?/.B#K/H,.G#;!#.9%.+H#I#M#%/#=+%8/H#H,*HG#A#.9%.+H#18+&,&*H#
@#E./#'D##
(,+#3,HO*1?##23*1.#(,+#S+%867#
6890,-##
"!##
<0,=>?#;M@!B#(,+#3,HO*1?#L**->#!Q''TB#5>.+0%??*B#$5#
!:#E80#'"##
P>*00#\F##2P>*00#NIN7#
6890,-##
!!##
P,R%+1RJ#PCA:(#>*0,-%6?*+B#$%+?>#P*.#
!'#E./#''##
P(,+#S+%86##
9./R+86?##
!'##
5+%11.,+#<0,=>?#[]MQ@B#P..9#DM'LG#^8+,->G#.00#A#6.11*/=*+1#I#D#-+*O#H,*H#
10
!"#$%&#'(##
)&%#*+,%-,./##01.2%/#3.45%/,678#
59:;,<##
='##>,?.&7?@#>ABC*#D6;,<.5-6&E#F9;G#.G#$6H,<.#
!B#I6:#'=##
J.K%/#*,&##
5&,+%-6##
!##LM#I;,KD-#J3CB'A*E#)N,/:9&KD#
"#$%&#'=##
OD%,#*,&2%@7##
/%-,./%;##
=##
I;,KD-#OF==(E#P.6,/K#B"BA(''E#P%/K?.?Q#=(R#%:.%&NE#B#,/S9&6N#
!C#T9;#'!##
I6N6&%;#)H5&677##
59:;,<##
'##I;,KD-#=(BUE#P.6,/K#B!BA!''E#O%;;%D%7766Q#"#,/S9&6N#
=U#V6<#'"# I6N6&%;#)H5&677# 59:;,<# '# I6N)H#$VA='#$645D,7#
!"#$%& '())*# #
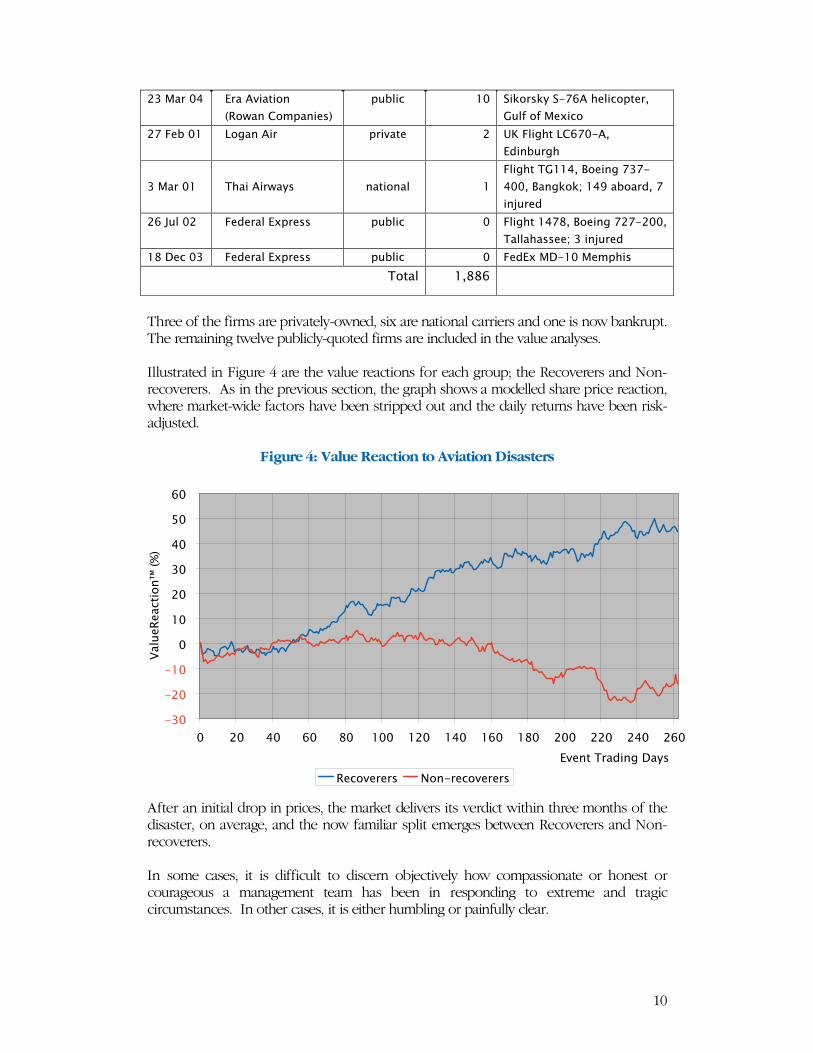
Three of the firms are privately-owned, six are national carriers and one is now bankrupt. The remaining twelve publicly-quoted firms are included in the value analyses. Illustrated in Figure 4 are the value reactions for each group; the Recoverers and Non-recoverers. As in the previous section, the graph shows a modelled share price reaction, where market-wide factors have been stripped out and the daily returns have been risk-adjusted.
Figure 4: Value Reaction to Aviation Disasters
After an initial drop in prices, the market delivers its verdict within three months of the disaster, on average, and the now familiar split emerges between Recoverers and Non-recoverers. In some cases, it is difficult to discern objectively how compassionate or honest or courageous a management team has been in responding to extreme and tragic circumstances. In other cases, it is either humbling or painfully clear.
A"'#
A!'#
A='#
'
='
!'
"'
('
W'
C'
' !' (' C' U' ='' =!' =(' =C' =U' !'' !!' !(' !C'
)+6/-#O&%N,/K#V%@7
X%;9616%<-,./Y
#0Z8
16<.+6&6&7 [./A&6<.+6&6&7

11
The Impact of Specialist Service Firms Since by its definition, mass fatality events require external assistance, it is interesting to investigate whether there is any discernable difference in market response associated with the engagement of a specialist service firm. Our analysis showed that 50% of the disasters were handled with the assistance of Kenyon International Emergency Services, a company which specialises in mass fatality disaster management. Since there is a clear market leader, the sample of aviation disasters was partitioned into a Kenyon and a non-Kenyon group to allow for a valid statistical comparison. The results are presented in Figure 5. Kenyon differs from its competition in that it is the longest established and it offers a full range of services including; contingency planning, disaster management response and recovery, identification of human remains and personal effects, training, family assistance, call centres, memorials and humanitarian services. Kenyon has been responding to aviation disasters since 1929.
Figure 5: The Value Premium for Specialist Care
By the end of the post-event year, those firms with the specialist services from Kenyon were outperforming their peers by 40%. The enlisting of specialist care enables experts in disaster response and recovery, and humanitarian services to carry out their work efficiently and sensitively. This is consistent with the anecdotal evidence that suggests firms are more likely to experience efficient value recovery if they demonstrate strong leadership, honesty and compassion. It is important to note that the engagement of specialist services does not suggest a delegation of responsibility. Mass fatality events are extreme and profoundly shocking. It is unrealistic to expect a corporate management team to be able to cope effectively with the consequences of such a disaster without help. The patterns of trading volume in Figure 6 indicate that those firms which recover well from the disaster - the Recoverers - very soon settle down to normal levels of trading
!"#$
!%#$
#
%#
"#
&#
'#
(#
# "# '# )# *# %## %"# %'# %)# %*# "## ""# "'# ")#
+,-./$01234.5$6278
92:
;-<-2
=/4>
.?$@AB
C-.7>. D>.!C-.7>.
12
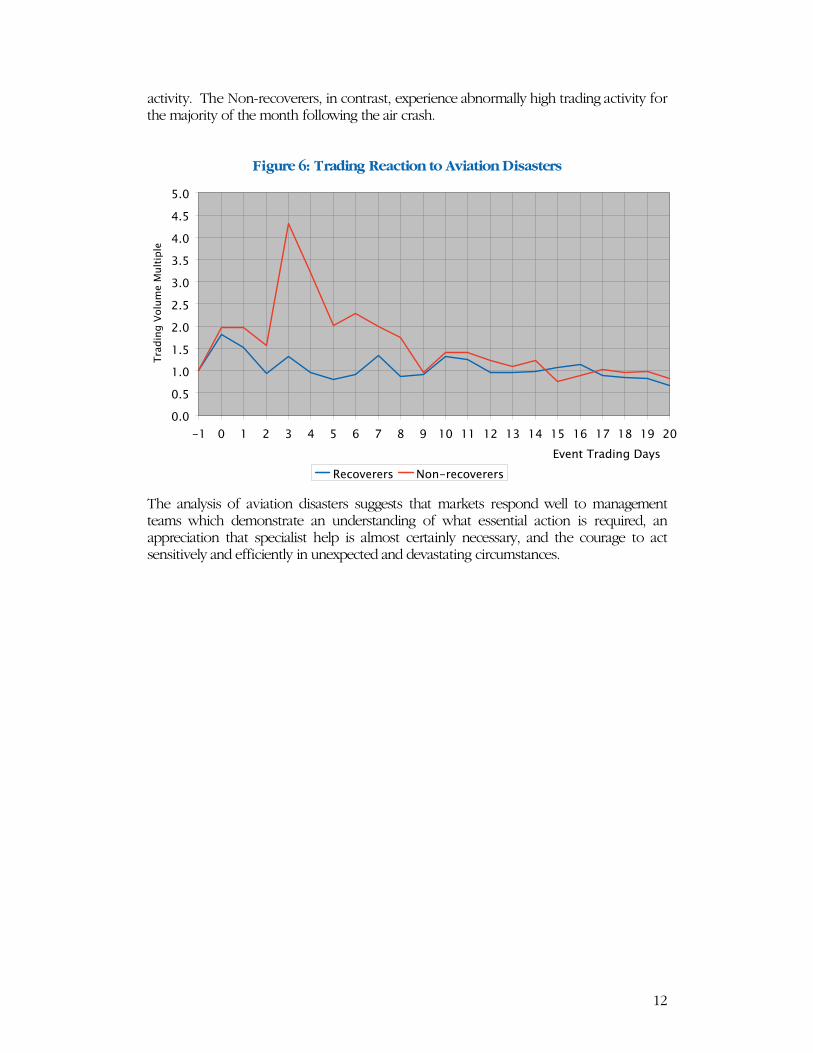
activity. The Non-recoverers, in contrast, experience abnormally high trading activity for the majority of the month following the air crash.
Figure 6: Trading Reaction to Aviation Disasters
The analysis of aviation disasters suggests that markets respond well to management teams which demonstrate an understanding of what essential action is required, an appreciation that specialist help is almost certainly necessary, and the courage to act sensitively and efficiently in unexpected and devastating circumstances.
!"!
!"#
$"!
$"#
%"!
%"#
&"!
&"#
'"!
'"#
#"!
($ ! $ % & ' # ) * + , $! $$ $% $& $' $# $) $* $+ $, %!
-./0123456708295:;
345
670
82<
=>?@
/2A
?>17B>/
C/D=./4/4; E=0(4/D=./4/4;

13
3 Fires and Explosions Twenty-seven fires and explosions over the last five years have been researched in this study. In these events, 509 people died. An additional 14, 072 people were injured, of whom 13,387 were injured from three events: China National Petroleum Corporation’s well blowout on 23 December 2003 (10,000 injured), TotalFina’s fire on 21 September 2001 (2,442 injured) and SE Fireworks’ explosion on 13 May 2000 (945 injured). While this research was being conducted, the worst refinery explosion for over ten years occurred at BP’s Texas facility on 23 March 2005. Fifteen people died and a further 170 were injured.
Table 3: Fires & Explosions from 1 Jan 2000 - 31 Dec 2004
!"#$% &'()"*+% ,-*$./01)% 2"#"31#1$/% !$/4.1)#1'*%
!"#$%&#'"##
##()*+,#-,.*/+,0####1%.2/0%34#(/25##
+,.*/+,0##
!6"##
7%00#80/9/3.#,+:#;,<#0%,=>#1%.2/()*+,#?3/@*,A),*#-/B#CD#9%00>#E,*#(/3+.F>#()/+;G*+;#
!H#I&.#'!####
JKL####
5380*&####
C''####
M,*;/+#K+.N0#O3<*+%<<#(%+.2%>#P*2%#P2/4#9%0:*+;#,&&*:%+.>#Q/#()*#R*+)#(*.F>#S*%.+,4T#!!#JKL#%450/F%%<#:*%:#
!C#M%5#'C###
U/.,0V*+,###
5380*&###
!H###
JWV#&)%4*&,0#P%2.*0*<%2#50,+.>#U/30/3<%T#H'X#/9+%:#8F#U/.,0V*+,#
"'#Y30#'6##
V03ZFZT#M)%00[M3%A##
5380*&##
!"##L,<#5*5%0*+%#%Z50/<*/+>#J.)#+%,2#J+.9%25>#O%0;*34#
C"#R,F#''###
M\#V*2%9/2=<###
52*],.%###
!C###
\+<&)%:%>#-%.)%20,+:<T#L2/0<&)#,:@,&%+.#82%9%2FT#C^#:*%:#:*2%&.0F#*+#80,<.>#C#:*%:#0,.%2#*+#)/<5*.,0>#"#4*<<*+;#
!_#V%8#'6###
I:P@%00###
5380*&###
!C###
()%4*&,0#.,+=%2#O/9#R,2*+%2#%Z50/:%<#,+:#<*+=<>#`'#4*0%<#%,<.#/P#()*+&/.%,;3%#/PP#S*2;*+*,a<#\,<.%2+#M)/2%#
C#M%5#'6##
M,</0##
5380*&##
CD##
\.)F0%+%#50,+.#*+#2%P*+%2F>#M%&3+:,>#M#JP2*&,T#^#:*%:>#H#4*<<*+;#
_#R,F#'C##
L/0:#V*%0:<##
5380*&##
C!##O%,.2*Z#;/0:#4*+%>#S*2;*+*,>#V2%%#M.,.%>#M/3.)#JP2*&,#
CC#R,F#'6##
K(?#10,<.*&<##
52*],.%##
H##\Z50/<*/+#,.#50,<.*&<#P,&./2F>#L0,<;/9>#M&/.0,+:#
!`#R,F#'"##
-/29%;*,+#(23*<%###?*+%#
52*],.%##
_##O/*0%2#%Z50/<*/+#,+:#P*2%#/+#8/,2:#MM#-/29,F>#R*,4*#
C`#R,F#''##
L/0:#V*%0:<##
5380*&##
^##O%,.2*Z#;/0:#4*+%>#S*2;*+*,>#V2%%#M.,.%>#M/3.)#JP2*&,#
!H#Y,+#'"##
7%<.###1),24,&%3.*&,0#
5380*&##
D##\Z50/<*/+#,.#4%:*&,0#<3550F#50,+.>#E*+<./+>#-#(,2/0*+,#

14
!"#$%&"'(
)(*+#(,-((
.+/0(1//(((1/2"#/+2%3/+4(
5#%$+2"((
6((
7%#"(+2(832"49(&"/2#+4(:38+//"';<#=9(!3<28(>?#%&+(
@(A3$(,B((
C3#<'((
5<;4%&((
-((
DE543'%3/(%/(;4+'2(?<#/+&"(+2(!2""4F3#G'9(H3#2(I+4;32(
J-(K&2(,,((
((L#3/"'(D<#35"(((ML#3/"'(>NO(
5<;4%&((
J((
N8"/2(&843#%/"(=+'("E543'%3/((
JB(7";(,-(((
DEE3/*3;%4(((
5<;4%&(((
J(((
DE543'%3/(3/(;+#="(F8%4"(</43+0%/=(+2(H3#2(*3;%4(?<"4(0%'2#%;<2%3/(2"#P%/+49(/"+#(!2+2"/(1'4+/09(A"F(Q3#G(
BR(:<4(,B(((
C8"$#3/I"E+&3(((
5<;4%&(((
B((
(
I+/G(-S-(+2(T"4+F+#"(3%4(#"?%/"#U(&344+5'"0(&+<'%/=(?%#";+449(/"+#(V%4P%/=23/(
B@(*+#(,,((
H8%4%5'((
5<;4%&((
,((
7%#"(+2('"P%&3/0<&23#(54+/29(>4;<W<"#W<"9(A"F(*"E%&3(
B6(>5#(,B((
C3/3&3((
5<;4%&((
,((
K%4(#"?%/"#U(;4+'29(L%44%/=834P"9(D/=4+/0(
J(:</(,J((
>''3&%+2"0(X#%2%'8(((7330'(
5<;4%&((
,((
7%#"(+2(I%5(I35(X+G"#%"'9(7+%#?%"40(A!V9(><'2#+4%+(
B6(><=(,J((
XH((
5<;4%&((
,((
>YJJ(F"44("E543'%3/9(H#<083"(X+U9(>4+'G+(
BR(K&2(,J((
.344'(.3U&"Z(V330(N#3<5(
5<;4%&((
,((
7%#"(?#3P("4"&2#%&+4(?+<42(+2(F+#"83<'"9(TU&"9(>;"#0""/(
6(:+/(,-((
!8"44(C+/+0+((
5<;4%&((
,((
DE543'%3/(+2(*<'G"=(.%$"#(P%/"9(>28+;+'&+(
-(!"5(,-((
A%553/(!2""4((
5<;4%&((
,((
N+'(2+/G("E543'%3/9(A+=3U+('2""4F3#G'(
@(!"5(,-((
X#%0="'23/"((
5<;4%&((
,((
L<#3%'3(54+/29(I3&8%=%[(()9,,,(5"354"("$+&<+2"0(
)(*+#(,\((
7"0"#+4(*3=<4((
5<;4%&((
,((
T%'2#%;<2%3/(?+&%4%2U9(!P%28$%44"9(I"//"''""(
-,(*+U(,\((
X%34+;(MN#"+2(]+G"'(((C8"P%&+4O(
5<;4%&((
,((
C8"P%&+4(F+#"83<'"9(C3/U"#'9(N"3#=%+9(^!>(
!"#$%& '()& (
Figure 7 illustrates the stock market reaction to firms following a major fire or explosion. The value reactions, both for Recoverers and Non-recoverers are substantial but less severe than for the aviation disasters examined in the previous section. This makes sense for three reasons. First, there are usually fewer fatalities. Second, and related, there is usually less (and more localised) media exposure for fires than for air crashes. Finally, exposure to the public is usually less direct for the types of firm that are exposed to the risk of fires and explosions than for airlines seeking fare-paying passengers. It can be seen also that the market makes its judgement of future cash flow potential sooner following fires and explosions than following air crashes. This also makes sense; the window for information digestion by the markets is usually shorter in the case of fires for the reasons outlined above.

15
Figure 7: Value Reaction to Fires & Explosions
Shown in Figure 8 are the trading activity patterns following fires and explosions. The results are consistent with the value reactions. The post-event levels of trading experienced generally are higher than normal but not extreme.
Figure 8: Trading Reaction to Fires & Explosions
Fires and explosions can have devastating effects. The industries involved historically have not been accustomed to enlisting specialist services for mass fatality events, unlike for example, the major airlines. However, as family demands increase for the best care and attention available, this situation may change.
!"#$
!%#$
!&#$
#
&#
%#
"#
'#
& %& '& (& )& &#& &%& &'& &(& &)& %#& %%& %'& %(&
*+,-.$/0123-4$5167
819:,;,1<.3=->
$?@A
;,<=+,0,07 B=-!0,<=+,0,07
#C#
#CD
&C#
&CD
%C#
%CD
!& # & % " ' D ( E ) F &# && &% &" &' &D &( &E &) &F %#
*+,-.$/0123-4$5167
/0123-4$8=9:G
,$H:9.3I9,
;,<=+,0,07 B=-!0,<=+,0,07

16
4 Terrorist Attacks
The acts of terrorism on 11 September 2001 against the World Trade Center in New York and the Pentagon in Washington were unprecedented. 3,025 people were killed. This represents a change in the order of magnitude of terrorist impact; Table 44.
Table 4: The Ten Most Deadly Terrorist Attacks
!"#$% !$&'()*#)+,% -"#".)#)$&%
!!"#$%"&''!" ())*+,"*-*./0)"1234"5$/)*-6/"*/7"6)8$9":;.<7./-0=">$?"@69,"A"1*08./-)6/4"B#("
C4'&D"
!"#$%"&''E" F60)*-$G)*,./-"./"0+866<"*)":$-.//./-"6H"/$?")$9I=">69)8"J00$).*4"K;00.*"
CCL"
&C"J+)"!MLC" N6I:./-"6H"B#"O*9./$":*99*+,0"A"P9$/+8"%*9*)966%$9":*0$=""N$.9;)4"Q$:*/6/"
C''"
!&"O*9"!MMC" #$9.$0"6H"!C":6I:"*))*+,0="O;I:*.4"R/7.*""
C''"
&!"S$+"!MLL" 5*/(I"N6$./-"TET":6I:"$U%<60.6/"A"+9*08="Q6+,$9:.$4"#+6)<*/7"
&T'"
T"(;-"!MML" 2?6"0.I;<)*/$6;0":6I:"*))*+,0"6/"B#"VI:*00W"+6I%<$U=">*.96:.4"X$/W*"
&DC"
!!"O*9"&''E" N6I:"*))*+,"6/")9*./0="O*79.74"#%*./""
!M!"
!&"J+)"&''&" 3*9":6I:"7$)6/*)$7"6;)0.7$"/.-8)+<;:="N*<.4"R/76/$0.*""
!M'"
&C"J+)"&''&" F60)*-$G)*,./-"*)")8$*)9$="O60+6?4"K;00.*""
!YM"
!M"(%9"!MMD" N6I:"*))*+,"6/"-6Z$9/I$/)":;.<7./-="J,<*86I*"3.)W4"B#(""
!YY"
/+#".% 01232%
This section of the report will focus specifically on the co-ordinated terrorist attack of 11 September 2001. Here is a mass fatality event that affected whole industries. One industry particularly affected - directly and indirectly - was the insurance industry.
Hundreds of people from the insurance industry died in the event. Significant insurance claims were made against the industry across all major
classes of loss. Insurers themselves were making reinsurance claims, and reinsurers were making
retrocession claims, against reinsurers. Insurers and reinsurers hold substantial equity investments, affected by the
downturn in markets and, in a few cases, affecting the insurer’s ability to pay claims.
A wave of downward rating action crossed the industry from the rating agencies.
However, some (re)insurers would benefit from the increase in premium rates as the commercial insurance markets hardened in the wake of the disaster. Presented in Table 4 Compiled from Swiss Re sigma publications: Nos. 1/2002, 2/2003, 1/2004 and 1/2005.

17
5 are the largest ten estimated total claims associated with the event incurred by quoted (re)insurers, as reported in their 2001 annual financial statements. The claims estimates presented are all net of reinsurance or retrocession and after tax, and amount to over US$10 billion. The Lloyd’s of London insurance market incurred a combined net loss of US$3.1 billion, pre-tax. Since any tax charged is paid by individual members, it is not possible to assign a tax rate to this loss figure. However, applying an average rate of 30% would suggest a combined loss for Lloyd’s of US$2.2 billion which would lead Table 5.
Table 5: Top 10 Estimated Claims Against (Re)insurers
!"#$%&'()#)* +,-%.'*#'/%.-/#*!012.$*
!"##$%&'()#*+# !,-.-#
/"##01'22#*+# !,333#
4"##5+672)'6+#89:)919;# !,.<<#
="##>??'9&@# !,44.#
."##AB#C9D':9?# 3-E#
E"##F%6'()#G'&9&('9?# 3<E#
3"##H)+#0:"#I9%?#CJKD9&'+2# E!/#
L"##>CM# ..-#
-"##>NO# .44#
!<"##>A># .<<#
34/-,* 567899*
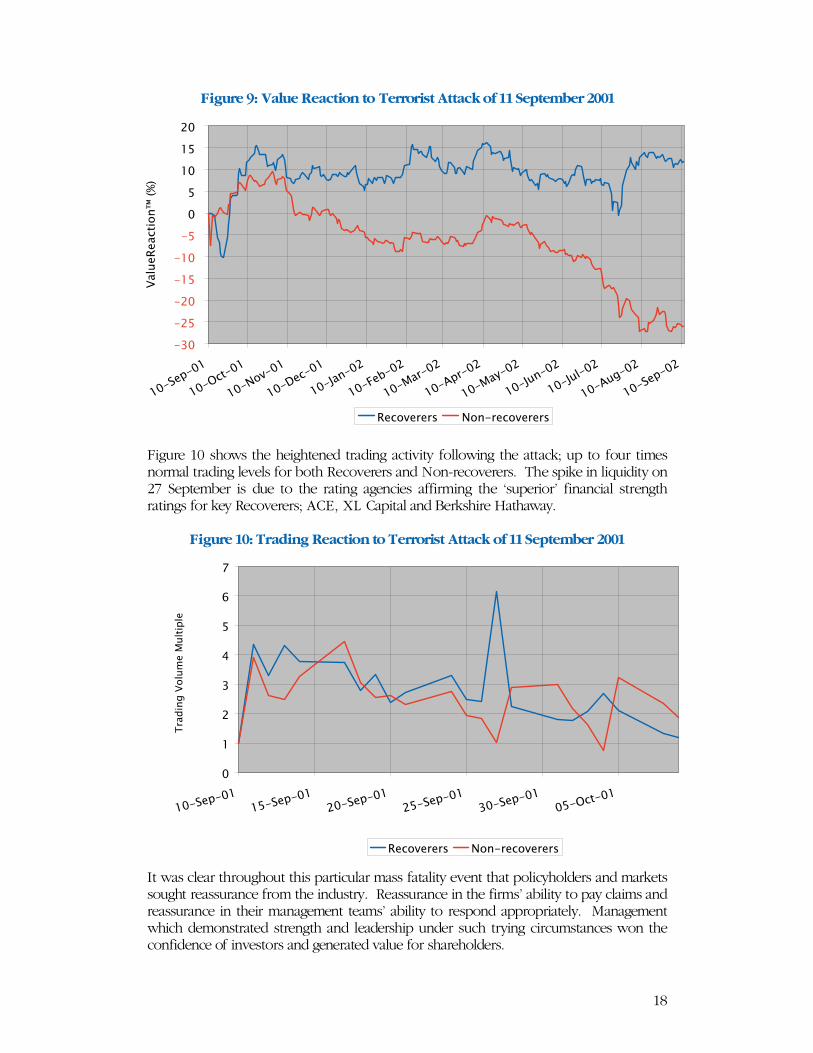
Also affected significantly in value terms and profoundly in human terms were the two major insurance brokers in the US; Marsh & McLennan Companies and Aon Corporation. 295 Marsh employees and 175 Aon employees lost their lives in the tragedy. Illustrated in Figure 9 are the recovery patterns of the insurers and reinsurers from Table 5, and of the two major brokers. Dominating the Recoverers are the (re)insurers assigned top ratings for long-term financial strength by the main rating agencies and the Bermudian companies. Dominating the Non-recoverers are the European carriers. In part, the result reflects European firms’ traditionally higher exposure to the equity markets; regulatory requirements deter US (re)insurers from holding large equity positions. More significant as a driver, however, is the ‘flight to quality’ as insureds sought out security amidst the market uncertainty.
18
Figure 9: Value Reaction to Terrorist Attack of 11 September 2001
Figure 10 shows the heightened trading activity following the attack; up to four times normal trading levels for both Recoverers and Non-recoverers. The spike in liquidity on 27 September is due to the rating agencies affirming the ‘superior’ financial strength ratings for key Recoverers; ACE, XL Capital and Berkshire Hathaway.
Figure 10: Trading Reaction to Terrorist Attack of 11 September 2001
It was clear throughout this particular mass fatality event that policyholders and markets sought reassurance from the industry. Reassurance in the firms’ ability to pay claims and reassurance in their management teams’ ability to respond appropriately. Management which demonstrated strength and leadership under such trying circumstances won the confidence of investors and generated value for shareholders.
!"#$
!%&$
!%#$
!'&$
!'#$
!&$
#
&
'#
'&
%#
'#!()*!#'
'#!+,-!#'
'#!./0!#'
'#!1),!#'
'#!234!#%
'#!5)6!#%
'#!738!#%
'#!9*8!#%
'#!73:!#%
'#!2;4!#%
'#!2;<!#%
'#!9;=!#%
'#!()*!#%
>3<
;)?
)3,-
@/4A
$BC
D
?),/0)8)8E ./4!8),/0)8)8E
#
'
%
"
F
&
G
H
'#!()*!#''&!()*!#'
%#!()*!#'%&!()*!#'
"#!()*!#'#&!+,-!#'
I83
J@4
=$>
/<;K
)$7
;<-@
*<)
?),/0)8)8E ./4!8),/0)8)8E

19
5 Natural Catastrophes Natural catastrophes are defined as those caused by natural forces such as storms, floods, hurricanes, earthquakes, volcanoes and droughts. On 26 December 2004, an earthquake (or ‘seaquake’) off the coast of Sumatra triggered a tsunami of staggering proportions. The seabed rose by 10-20 metres, ruptured by the collision of two tectonic plates, and the fault line extended 1,200 kilometres. Densely populated coastal cities and villages were destroyed. The exact number of fatalities may never be known. The latest official figures5 report that 228,919 people have died. This represents the third most devastating natural catastrophe since 1970; Table 66. Against the earthquakes and seaquakes is given their magnitude on the Richter scale.
Table 6: The Ten Most Deadly Natural Catastrophes
!"#$% !$&'()*#)+,% -"#".)#)$&%
!"#$%&#!'()# *+%,-#./0#12%%03#4./52.0678# 9)):)))#
;<#=>2?#!'(@# A.,+8B>.C6#DE#(FGH3#I./578./:#J8K/.# ;GG:)))#
;@#L6M#;))"# *6.B>.C6#DEN#'F!H#+7>/.-K3#O/0K./#PM6./# ;;<:'!'#
;'#QR,#!''!# I,%RKM.2#M?M2%/6#S%,C?3#4./52.0678# !9<:)))#
9!#E.?#!'()# A.,+8B>.C6#DE(F(H:#,%MC#72K0673#T6,># @@:)))#
;!#=>/#!'')# A.,+8B>.C6#DE(F(H:#2./072K0673#SK2./:#O,./# G):)))#
;@#L6M#;))9# A.,+8B>.C6#DE@FGH3#4.-:#O,./# ;@:;(!#
!@#*6R#!'(<# A.,+8B>.C6#DE(F(H3#I.U.7:#O,./# ;G:)))#
(#L6M#!'<<# A.,+8B>.C6#DE@F'H3#Q,-6/K.# ;G:)))#
!9#$%&#!'<G# V%2M./KM#6,>R+K%/#%/#$6&.0%#062#W>KX3#J%2%-UK.# ;9:)))#
/+#".% 010231045% This section of the report will focus on the impact of the Asian tsunami of 26 December 2004. Listed in Table 7 are the countries directly affected, with the latest fatality estimates.
Table 7: Fatalities from Asian Tsunami - 26 December 2004
6+7,#()$&% !$"8% 9)&&),:% /+#".%
O/0%/67K.# !;@:'!G# 9(:)@9# !@9:'(<#
*,K#Y./C.# 9):'G(# G:@9(# 9@:G'"#
O/0K.# !):("'# G:@")# !@:9<'#
I8.K2./0# G:9'G# ;:'9;# <:9;(#
Q/0.-./#Z#$KM%U.,#K72./07# "9@# ;:@"!# 9:)((#
*%-.2K.# ;'<# )# ;'<#
E.20K&67# <;# ;@# !)<#
E.2.?7K.# @<# @# ("#
E?./-.,# @!# )# @!#
I./X./K.# !)# )# !)#
4./52.0678# ;# )# ;#
5 5 May 2005 6 Source: Swiss Re sigma publication: No. 1/2005.
20
!"#$%& '& (& '&
!"#$%& '()*+()& ,-*+),& ../*+'+&
0"12345&6373#"17&358%9:2:&35&;349127&$<"62&)*"+"#& ,--& .((& /--&
0"12%#$& 3('& ./4& ,//&
5!& 6,& /-& '46&
71%#8"& 6,& (& 6,&
9:;<1=%& -6& ,-& '(3&
)*=<>"1?%#+& 36& @/& '.4&
A"#2%1B& 34& '(& -4&
CD"&E"<D"1?%#+;& .,& ',& -(&
FG#H&!G#H& .'& '6& -(&
9:;<1%?=%& .'& 4& ./&
I%#%+%& ',& /& ..&
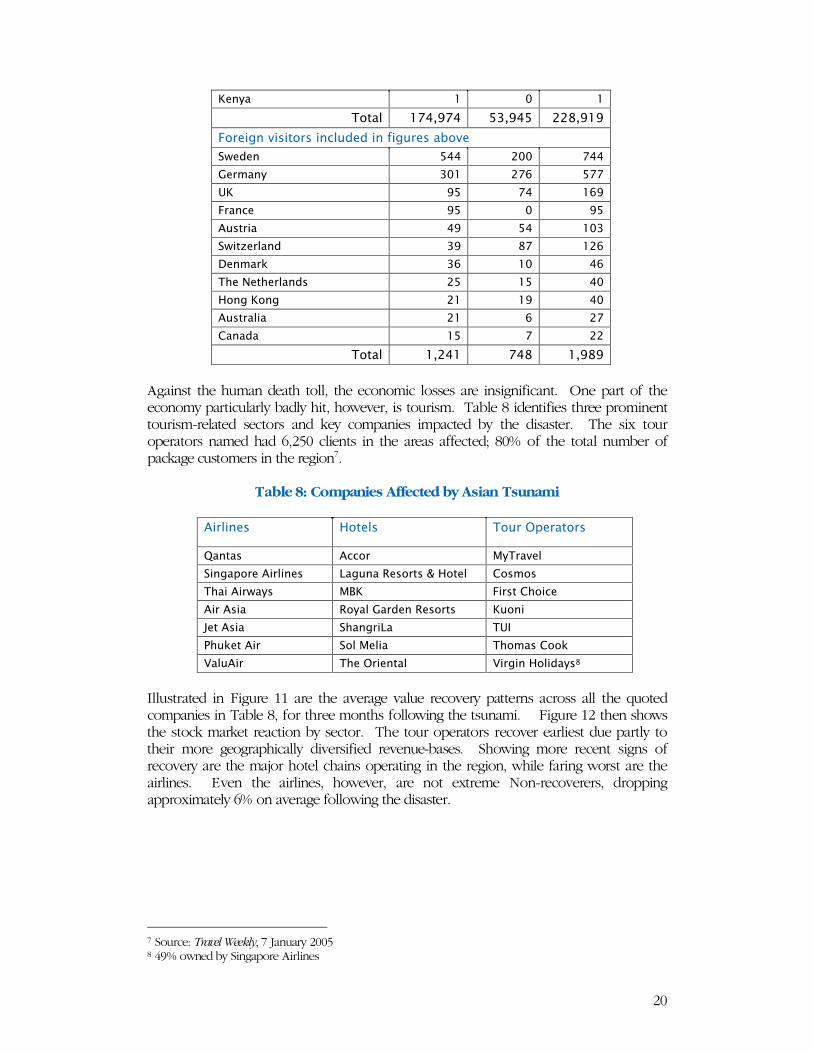
!"#$%& '*.)'& ()/& '*+/+& Against the human death toll, the economic losses are insignificant. One part of the economy particularly badly hit, however, is tourism. Table 8 identifies three prominent tourism-related sectors and key companies impacted by the disaster. The six tour operators named had 6,250 clients in the areas affected; 80% of the total number of package customers in the region7.
Table 8: Companies Affected by Asian Tsunami
=31%3527& >"#2%7& !"91&?@21$#"17&
J%#<%;& 988G1& K$C1%L"?&
)=#H%MG1"&9=1?=#";& N%H:#%&O";G1<;&P&FG<"?& IG;2G;&
CD%=&9=1*%$;& KQ!& 7=1;<&IDG=8"&
9=1&9;=%& OG$%?&0%1+"#&O";G1<;& !:G#=&
R"<&9;=%& )D%#H1=N%& C5S&
TD:B"<&9=1& )G?&K"?=%& CDG2%;&IGGB&
U%?:9=1& CD"&V1="#<%?& U=1H=#&FG?=+%$;@&
Illustrated in Figure 11 are the average value recovery patterns across all the quoted companies in Table 8, for three months following the tsunami. Figure 12 then shows the stock market reaction by sector. The tour operators recover earliest due partly to their more geographically diversified revenue-bases. Showing more recent signs of recovery are the major hotel chains operating in the region, while faring worst are the airlines. Even the airlines, however, are not extreme Non-recoverers, dropping approximately 6% on average following the disaster.
7 Source: Travel Weekly, 7 January 2005 8 49% owned by Singapore Airlines

21
Figure 11: Value Reaction to Asian Tsunami of 26 December 2004
Figure 12: Value Reaction to Asian Tsunami by Industry
Shown in Figure 13 is the impact of the tsunami on firms’ trading levels. The Non-recoverers drive the increase in liquidity, experiencing over six times normal trading activity as markets attempt to digest the complex information.
!"#$
!%$
#
%
"#
"%
&'!()*!
#'
+!,-.!
#%
&"!,-
.!#%
'!/)0!
#%
"1!/)
0!#%
'!2-3!
#%
"1!2
-3!#%
"!453!
#%
6-78)9)-*:;<.=
$>?@
9)*<A)3)3B C<.!3)*<A)3)3B
!"#$
!1$
!D$
!'$
!&$
#
&
'
D
1
"#
&'!()*!
#'
+!,-.!
#%
&"!,-
.!#%
'!/)0!
#%
"1!/)
0!#%
'!2-3!
#%
"1!2
-3!#%
"!453!
#%
6-78)9)-*:;<.=
$>?@
4;37;.)B E<:)7B F<83$G5)3-:<3B

22
Figure 13: Trading Reaction to Asian Tsunami of 26 December 2004
In some respects, natural catastrophe risk resembles that of terrorist attack. Both involve sudden, exogenous shocks to the corporate system, and management is responsible not for the cause itself but for the firm’s response to it. In addition, these particular mass fatality events can affect whole economies including many industries. However, even in these cases, managerial responsibility is key to restoring confidence in the markets. The way in which Chief Executives respond to these extreme events is critical; critical primarily to the victims and families concerned, but critical also for the sustained recovery of shareholder value.
!
"
#
$
%
&
'
(
#%)*+,)
!%
$")*+,)
!%
()-./)
!&
"%)-.
/)!&
#")-.
/)!&
01.23/456789:
+5;98<3=8+
>+,7?+1+1@ A7/)1+,7?+1+1@

23
Conclusions Extreme events provide an opportunity for investors to review their opinions about a firm and, more pertinently, about its management. Additional corporate information is forthcoming around such events that would not be available in more normal circumstances. This new information is received and digested by markets which form new estimates of future cash flow performance expected from these firms. The share price rises or falls, suddenly and significantly, in the light of the new information and the new expectations. These sudden shifts in share price tend to be sustained; until the next extreme event. Mass fatality events are as extreme as they get. The circumstances are, by their nature, a gruelling ordeal for the management of any firm. It is precisely under such circumstances, however, that senior management can demonstrate the stuff of which they are made. These situations are not only logistically challenging but also profoundly emotionally traumatic. Mass fatality events demand strong leadership, honest communication and compassion. The awareness of what managerial decisions and behaviour are required, and the courage to act accordingly, reveals qualities in managers appreciated by the markets. The research results presented herein support our earlier findings and demonstrate that the care, honesty and sensitivity with which management responds to mass fatality events inspire confidence in investors and add substantial value. Furthermore, the results suggest that the presence of mass fatality in an extreme corporate event has a multiplicative effect on the value impact. The market judgement of managerial ability is decisive, considerable and sustained.

24
The Authors Rory F Knight, MA (Oxon), MCom, PhD, CA Chairman, Oxford Metrica
Dr Rory Knight has extensive experience of working and consulting in the financial and corporate sectors. For five years, he was Dean of Templeton College, University of Oxford, where he was responsible for Templeton’s overall strategy and direction. Dr Knight is Dean Emeritus at Templeton and Fellow in Finance, and is co-author of Financial Performance (Butterworth-Heinemann, 2000). Previously a Deputy Director in the Swiss National Bank (SNB), his role included providing policy advice on international financial matters, and he retains significant links with central banks around the world. Deborah J Pretty, BA (Hons), DPhil (Oxon), AIRM, ARM Principal, Oxford Metrica
Dr Deborah Pretty has worked for several years in finance and corporate risk management, establishing integrative frameworks and connections between risk and value for many global firms. For three years, she was Marsh Research Fellow at Templeton, University of Oxford, where she undertook extensive empirical research in strategic risk and finance. Dr Pretty is author of Risk Financing Strategies – The Impact on Shareholder Value (RIRG, 1999). Previously, she was an Assistant Director in Sedgwick Energy and a risk finance analyst with Tillinghast-Towers Perrin in London and the United States. Oxford Metrica
Oxford Metrica is an independent strategic advisor. The firm addresses the CEO agenda and focuses on risk, value, reputation and governance - the strategic aspects of financial performance. The firm connects financial and risk theory with real data to provide empirical, quantitative and practical analysis for financial and corporate clients worldwide. Oxford Metrica is about ideas with impact. The firm’s Principals are privileged to have worked with many of the world’s leading firms.

25
For further details, please contact: www.oxfordmetrica.com

www.oxfordmetrica.com