prospects of wave power grid integration - home | …kmh511/prospects of wave power grid...the...
TRANSCRIPT
Prospects of Wave Power Grid Integration
Parth Pradhan, Kostas Hatalis, Shalinee Kishore and Rick S. BlumDepartment of Electrical and Computer Engineering
Lehigh UniversityBethlehem, PA 18015
Email: [email protected]
Alberto J. LamadridDepartment of Economics
Lehigh UniversityBethlehem, PA 18015
Email: [email protected]
Abstract—Wave energy extraction technologies are rapidlymaturing, leading to increased expectations that they will soonbe integrated into the electrical grid.This paper reviews thestate of the art technologies along with system level modelingwhile providing an initial study of the impacts of integrationon a typical electrical grid network as compared to the closestrelated technology, wind energy extraction. In particular, wavepower is computed from high resolution measured raw wavedata to evaluate the effects of integrating wave generation intoa 5-bus PJM inspired system. The system with no renewableenergy sources and the system with comparable wind generationhave been used as a reference for evaluation. Simulations showthat wave power integration has good prospects in reducing therequirements of capacity and ramp reserves, thus bringing theoverall cost of generation down.
I. INTRODUCTION
The abundance of ocean wave energy resources and theirfree availability have long brought interest into exploring newways to harness their energy efficiently and profitably. Thedevelopment of wave energy production towards its commer-cialization, however, is still in its infancy. In the seventies,key theoretical studies on wave power extraction were con-ducted and efforts were initiated to design and improve waveenergy converter devices. Development suffered a decelerationafter a few years when other means of energy became morelucrative for investment. Wind and solar technologies had asignificant lead from the beginning over ocean wave energytechnologies and their market grew over the years. Theirlevelized capital cost also dropped because of improvement inconversion efficiency. In recent years, wave energy converters(WECs), although still lagging far behind solar and wind in thescale of power production, are gaining attention and renewedconfidence globally on their role to meet ever increasingdemands while also complying to stringent environmentalnorms. Wave power extraction, now a third generation renew-able, is rapidly maturing to compete with some of the costlyenergy alternatives like diesel while establishing itself as avaluable member of many renewable portfolios. It also fits thedistributed generation model which stresses local consumptionof electricity whereby reducing some of the inefficiencies ofthe T&D system. Several utility scale WEC projects are atvarious stages of development in the U.S., Coastal Europe andAustralia.
The objective of this paper is to propose a methodologyto study wave power extraction and analyze its potentialfor integration into electricity markets. A major drawbackof integrating renewable resources into the grid lies in their
inherent variability. Current literature on wave energy is un-clear on what is the inherent variability of wave power andwhat this variability means to integrating WECs and arraysof WECs to the grid. In this work, we develop a preliminarymodel and results to close this knowledge gap. Specifically,we demonstrate that wave power integration may in fact beeconomically promising based on certain performance criteria.This article is organized as follows. Section II reviews the stateof the art of wave energy converters and some of the underlyingprinciples of wave power extraction. In section III, we explainthe calibration and data processing for the model. Section IVdescribes the electrical bus network system employed for theintegration study, and analyzes the system level impacts forwave power penetration close to 10%. A comparison to asimilar deployment with wind power is also provided. SectionV concludes the paper.
II. BACKGROUND
A. Current status of wave power generation technologies
There are different techniques proposed for on-shore, near-shore and off-shore wave energy extraction. The process ofenergy generation goes through a series of steps which includesabsorption of energy from ocean waves by different types ofenergy capture mechanisms, transmission of mechanical powerto the electrical generator by power take off mechanisms, andcontrol of the output power with suitable power electronics[1]. The conditioning of power to make it appropriate for anelectrical grid using battery storage has also been proposed,along with systems employing arrays of WECs.
A closer look at the recent developments of wave energytechnologies gives a very promising picture. The leadingenergy capture designs, based on their operating principles,are broadly classified into Oscillating water column (OWC)type, Oscillating body and Overtopping device. AlthoughOWC technology was initially developed to work onshore,the feasibility of offshore deployment is also being explored.The changing ocean water level inside a chamber causes thetrapped air above it to contract or expand thus driving theturbine. LIMPET, with a total installed capacity of 500kW wasone of the first successful projects built on OWC technologyat the Scottish Island of Islay, UK [2]. The OCEANLINXproject is another effort with a cluster of offshore OWCsoperated as a single unit by the Australian Renewable EnergyAgency (ARENA) and is expected to generate 91,000 terawatt-hours of electricity annually [3]. Oscillating Body, as the namesuggests, makes use of translational and/or rotational motion ofa shaft as the first step of the wave energy conversion process.

The PowerBuoy by Ocean Power Technologies (OPT), andPelamis, by Pelamis Wave Power, are two projects based onthe principle of the oscillating body technique which haveshown good prospects to move from lab scale devices toutility scale plants. Six commercial wave farm projects ofPelamis P2 devices are at various stages of development inEurope with installed capacities ranging from 10 to 50 MW[4]. The PowerBuoy has already been tested in Scotland, Spainand Hawaii, and future large-scale projects are underway forPortland (Australia), Cornwall (UK), and Coos Bay (Oregon,US) [5]. Overtopping devices are a third type of energy capturemechanism which harness energy from the incoming waves bycapturing them in a central reservoir and releasing them backto the sea through a number of hydroelectric turbines. Themulti MW Wave Dragon projects is an example of this typedeveloped in Denmark and Portugal [6].
The power take off (PTO) unit is an internal system con-necting the energy capture device to the electrical generator.Based on the medium of energy transfer, it can be broadlyclassified as having OWC PTO, Hydraulic PTO, or direct drivePTO mechanisms. The air turbine in OWC operates as its PTOsystem while employing an active control strategy to match theturbine speed with the air velocities driving it. The hydraulicPTO makes use of a combination of two accumulators anda piston with check valves which functions as a half-waverectifier allowing the oil to only flow in one direction, eitherto the motor or turbine. It is a complicated system with manymoving parts that can cause regular wear-and-tear and oilleakage. Pelamis devices employ this kind of PTO inside eachone of the segments in their long structure. Direct drive PTOs,as the name suggests, have a single shaft or a shaft coupledwith rotating gears to generate electrical energy through itsmovement in between two permanent magnets. Most of thepoint-absorber-based WECs including Power Buoys and AWS,have adopted direct drive PTO mechanisms [1]. These areactive and passive control mechanisms proposed for both thehydraulic type and direct drive PTOs.
The development of efficient power conditioning makes useof most of available technologies. Optimizing the output powerfrom a number of wave energy converters under a stochasticocean environment before injecting it to the grid, generallyinvolves more challenging issues.
B. Variability Studies of wave
Significant wave height and average wave period contributeto wave power variability [1]. [8] argues that there is seasonalvariability of wave power and that the capacity value ofwind and wave power is comparable. On the other hand, thevariability of the wave power was compared to wind power in[9] and it was shown that there is a significant difference inthe variability of wind and wave power outputs based on thewave data collected from different locations around the globe.The capacity value for wind power is also reported to be lowerthan that for wave power in that paper. It seems that the studiesso far have conflicting rather than concrete findings regardingthe relative variability of wave and wind. [10] demonstratesthat a judicious mix of different renewable power resources(which includes wind, solar, and wave) instead of a singledominant power source can lower the reserve requirements onthe transmission network. In this kind of set-up, net generation
Fig. 1. Interpolated power matrix
becomes more stable because the various variabilities tend toaverage out as these variabilities are unrelated.
C. Need for short term variability assessment
While hourly wind and wave data can effectively assess an-nual power production and help one decide on site selection forwind and wave farm installation, it may prove insufficient forintra-hour operation and planning such as frequency regulation,power dispatch scheduling, providing price signals to generatorowners for bidding, and making short-term prediction of poweroutputs necessary for electricity markets. These opportunitiesmay receive serious consideration once this renewable power isviewed as a dispatchable generation. Active studies are beingcarried out to understand the effect of increased penetration ofthese renewable resources in European Electricity market on ashort-term, medium-term, and long-term scales [11].
III. METHODOLOGY
A. Data Description, Wave Data
This study focuses on quantifying the short-term variabilityof wave power by using high resolution measured data of oceanwaves. The wave data is obtained from Belmullet Berth B (Lat54.23, Long -10.14), a high wave energy potential region inthe northwest coast of Ireland. The energy density in this areais estimated to be around 76kW [7].
The two months of sampled raw wave data include signifi-cant wave height and average period reported three times everyten minutes. We pre-processed this data to eliminate missingvalues and irregularities, and obtain data for every ten-minuteinterval compatible with available wind data. The reason forchoosing ten minutes as data resolution is explained later.
Instead of solving for the potential wave analytically, weobtain wave power outputs using the Pelamis P2 device withrated capacity of 750kW power matrix of the wave energyconverter [13]. The power matrix provides the average powerwith significant wave height and wave period as inputs. Thepower matrix was originally designed to estimate the changein power production corresponding to changes larger than 0.5meters and 0.5 seconds in significant wave height and waveperiod, respectively. As this study aims to capture smallervariability of wave power, a bilinear interpolation method isemployed to extend the power matrix to such cases. Figure 1shows the interpolated power matrix.

Fig. 2. Time series of wind power (top) and wave power (bottom)
Fig. 3. Wave height and wave power comparison
B. Data Description, Wind Data
The wind speed is obtained from the NREL-EWITS dataset [15] of wind speed reported in ten minute intervals. Thewind data is coherent with the wave data in terms of numberof samples and time during which it is collected. The windspeeds are then applied to power curve of a commercial windturbine [16].
Figure 2 shows the output power obtained from wind andwave.
Figure 3 shows an example time series plot of wave heightand wave power. The wave power depends on both the meanwave height and the average wave period, with wave heightdominating the relation over time. This observation allowsus to simplify the state transitions over time, assuming thatthe wave period plays no role in the wave power variability.Thus, potential wave power is approximated using only theinformation on wave height, and state transition probabilitymatrices are calculated using this parameter for the clustering.In future work we will use both wave height and wavefrequency to determine the clustering for the determinationof the transition probability matrices.
Wind power, on the other hand, depends only on the windspeed.
C. Time Transitions of simulation inputs
The wave height and wind speed of the renewable resourcesare modeled using Markov chains for the quantification ofshort-term variability. To characterize the variability of windspeed and wave height, the wind speed and the wave heightare partitioned into four groups using a k-means clusteringmethodology [17]. The number of clusters, corresponding toa number of expected states of the system, is chosen to befour for simplification of the stochastic optimization problemdiscussed in Section IV. For the transition probability matrix,the entire data is divided into blocks of 24 hours and each dayis divided into 144 time horizons (24 hours × 6 10-minuteintervals). This kind of multi-period approach helps to capturethe similarity in the nature of variability at a particular timeperiod every day [14]. Therefore, 144 transition probabilitymatrices are required for every the transitions which are thenused for scheduling day-ahead power dispatch and provisionof ancillary services. The values of the available power for10-minute intervals belong to one of these states, namely highpower availability, low power availability, and two intermediatescenarios.
The 144 standardized vectors of maximum power availabil-ity in each state are also created for each one of the 10-minutesintervals in a day. Thus, two sets of the above two inputs arecreated, one each for the wind and wave. This kind of modelallows tractability of the problem.
We assume nameplate capacity levels of 100 MW forboth wave and wind power. This penetration level, slightlyover 10%, provides observable effects. We simulated singlewave and wind generators, as opposed to farms of devices.There is little to no study on the variability of the powerfrom several wave devices. Therefore, the maximum poweravailability from wave generators is linearly scaled. Althoughthere are methodologies to estimate wind farm output froma single representative time series of wind power, we scaledlinearly the power availabilities for wind, to ensure a levelplaying field.
Two standard load profiles are used, one for the summerand one for the winter, to study the effect of renewable powerin the electrical grid in two different seasons. The summerload profile has a prominent peak at the middle of the daywhereas in the winter profile, there are two peaks one occurringduring the late morning hours and second one is a large peakoccurring during late evening hours There is no uncertainty inthe load profile considered in the simulation. The variabilitycomes from the wave and wind inputs only.
IV. SIMULATION AND ANALYSIS
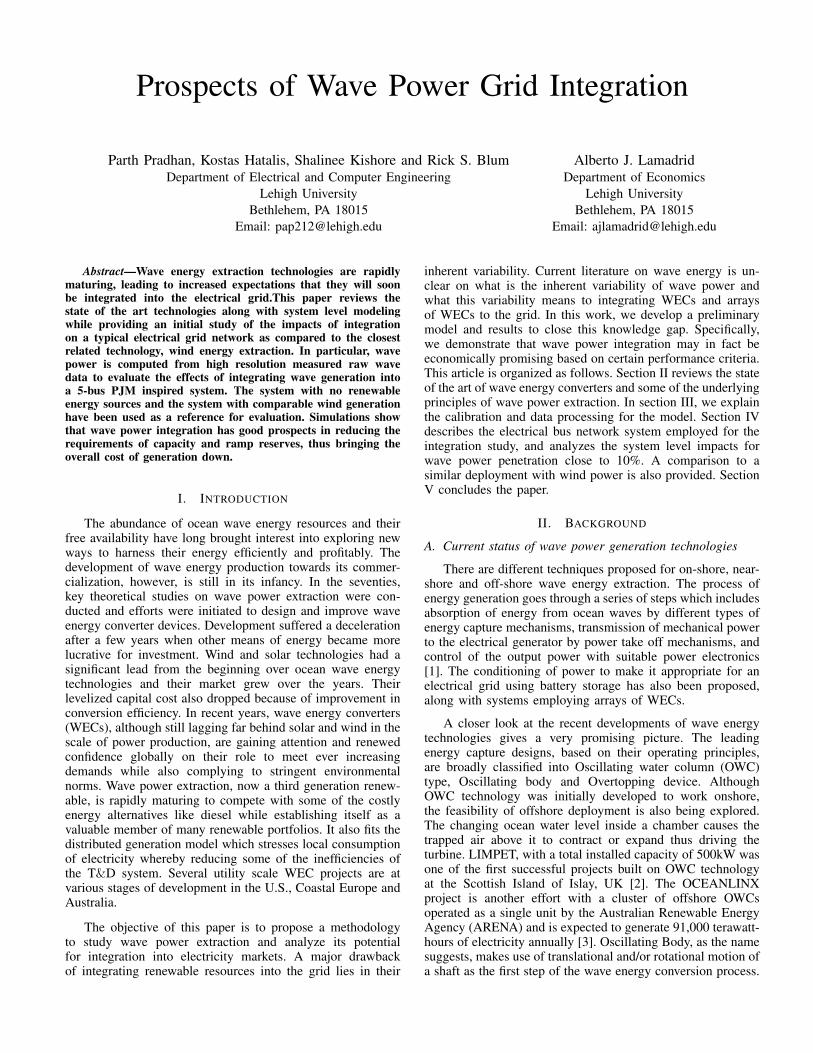
The results in this section assume that the market isderegulated. Figure 4 shows the power network used, a highlystylized version of the PJM system, with 5-buses used toassess the planning and operation of the electrical system undermarket conditions [18].
We used MATPOWER 4.1 [19] as the software tool for thesimulation. The simulation compares the difference in the re-sponse of the system when each of the two renewable resourcesare available as part of the total generation portfolio, using aSecurity Constrained, Optimal Power Flow with EndogenousReserves [20]. Three cases are formulated as follows:
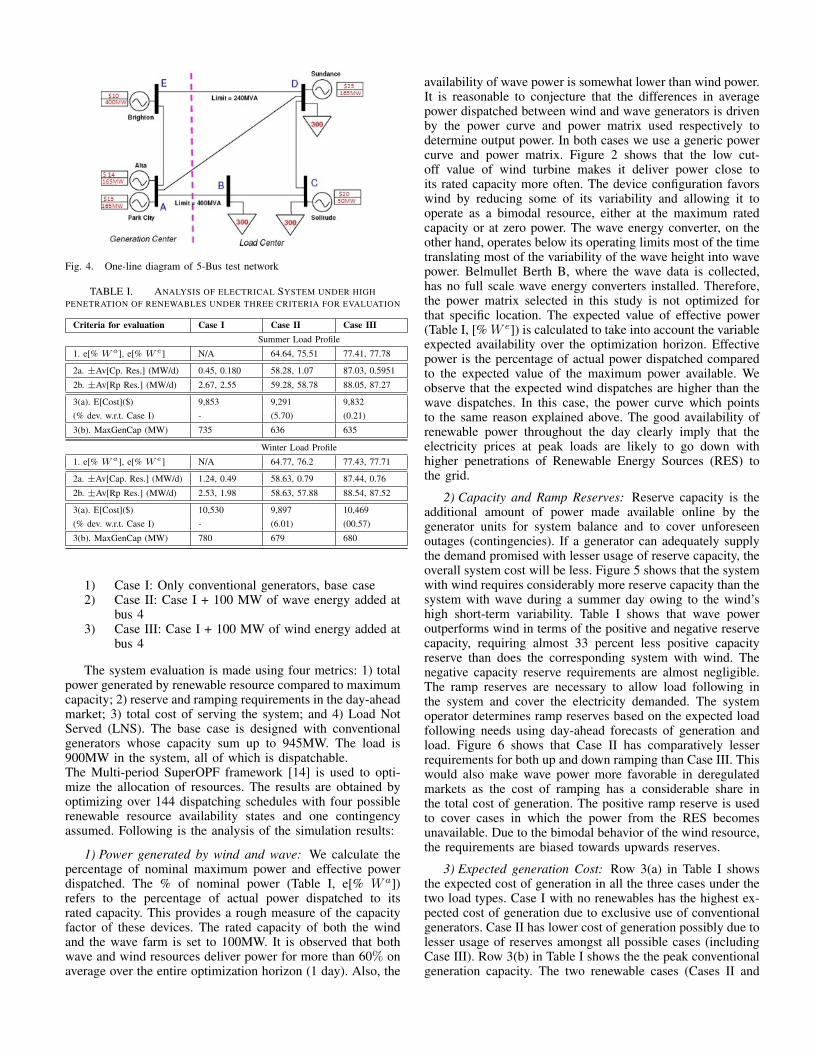
Fig. 4. One-line diagram of 5-Bus test network
TABLE I. ANALYSIS OF ELECTRICAL SYSTEM UNDER HIGHPENETRATION OF RENEWABLES UNDER THREE CRITERIA FOR EVALUATION
Criteria for evaluation Case I Case II Case IIISummer Load Profile
1. e[% Wa], e[% W e] N/A 64.64, 75.51 77.41, 77.78
2a. ±Av[Cp. Res.] (MW/d) 0.45, 0.180 58.28, 1.07 87.03, 0.5951
2b. ±Av[Rp Res.] (MW/d) 2.67, 2.55 59.28, 58.78 88.05, 87.27
3(a). E[Cost]($) 9,853 9,291 9,832(% dev. w.r.t. Case I) - (5.70) (0.21)
3(b). MaxGenCap (MW) 735 636 635
Winter Load Profile
1. e[% Wa], e[% W e] N/A 64.77, 76.2 77.43, 77.71
2a. ±Av[Cap. Res.] (MW/d) 1.24, 0.49 58.63, 0.79 87.44, 0.76
2b. ±Av[Rp Res.] (MW/d) 2.53, 1.98 58.63, 57.88 88.54, 87.52
3(a). E[Cost]($) 10,530 9,897 10,469(% dev. w.r.t. Case I) - (6.01) (00.57)
3(b). MaxGenCap (MW) 780 679 680
1) Case I: Only conventional generators, base case2) Case II: Case I + 100 MW of wave energy added at
bus 43) Case III: Case I + 100 MW of wind energy added at
bus 4
The system evaluation is made using four metrics: 1) totalpower generated by renewable resource compared to maximumcapacity; 2) reserve and ramping requirements in the day-aheadmarket; 3) total cost of serving the system; and 4) Load NotServed (LNS). The base case is designed with conventionalgenerators whose capacity sum up to 945MW. The load is900MW in the system, all of which is dispatchable.The Multi-period SuperOPF framework [14] is used to opti-mize the allocation of resources. The results are obtained byoptimizing over 144 dispatching schedules with four possiblerenewable resource availability states and one contingencyassumed. Following is the analysis of the simulation results:
1) Power generated by wind and wave: We calculate thepercentage of nominal maximum power and effective powerdispatched. The % of nominal power (Table I, e[% W a])refers to the percentage of actual power dispatched to itsrated capacity. This provides a rough measure of the capacityfactor of these devices. The rated capacity of both the windand the wave farm is set to 100MW. It is observed that bothwave and wind resources deliver power for more than 60% onaverage over the entire optimization horizon (1 day). Also, the
availability of wave power is somewhat lower than wind power.It is reasonable to conjecture that the differences in averagepower dispatched between wind and wave generators is drivenby the power curve and power matrix used respectively todetermine output power. In both cases we use a generic powercurve and power matrix. Figure 2 shows that the low cut-off value of wind turbine makes it deliver power close toits rated capacity more often. The device configuration favorswind by reducing some of its variability and allowing it tooperate as a bimodal resource, either at the maximum ratedcapacity or at zero power. The wave energy converter, on theother hand, operates below its operating limits most of the timetranslating most of the variability of the wave height into wavepower. Belmullet Berth B, where the wave data is collected,has no full scale wave energy converters installed. Therefore,the power matrix selected in this study is not optimized forthat specific location. The expected value of effective power(Table I, [% W e]) is calculated to take into account the variableexpected availability over the optimization horizon. Effectivepower is the percentage of actual power dispatched comparedto the expected value of the maximum power available. Weobserve that the expected wind dispatches are higher than thewave dispatches. In this case, the power curve which pointsto the same reason explained above. The good availability ofrenewable power throughout the day clearly imply that theelectricity prices at peak loads are likely to go down withhigher penetrations of Renewable Energy Sources (RES) tothe grid.
2) Capacity and Ramp Reserves: Reserve capacity is theadditional amount of power made available online by thegenerator units for system balance and to cover unforeseenoutages (contingencies). If a generator can adequately supplythe demand promised with lesser usage of reserve capacity, theoverall system cost will be less. Figure 5 shows that the systemwith wind requires considerably more reserve capacity than thesystem with wave during a summer day owing to the wind’shigh short-term variability. Table I shows that wave poweroutperforms wind in terms of the positive and negative reservecapacity, requiring almost 33 percent less positive capacityreserve than does the corresponding system with wind. Thenegative capacity reserve requirements are almost negligible.The ramp reserves are necessary to allow load following inthe system and cover the electricity demanded. The systemoperator determines ramp reserves based on the expected loadfollowing needs using day-ahead forecasts of generation andload. Figure 6 shows that Case II has comparatively lesserrequirements for both up and down ramping than Case III. Thiswould also make wave power more favorable in deregulatedmarkets as the cost of ramping has a considerable share inthe total cost of generation. The positive ramp reserve is usedto cover cases in which the power from the RES becomesunavailable. Due to the bimodal behavior of the wind resource,the requirements are biased towards upwards reserves.
3) Expected generation Cost: Row 3(a) in Table I showsthe expected cost of generation in all the three cases under thetwo load types. Case I with no renewables has the highest ex-pected cost of generation due to exclusive use of conventionalgenerators. Case II has lower cost of generation possibly due tolesser usage of reserves amongst all possible cases (includingCase III). Row 3(b) in Table I shows the the peak conventionalgeneration capacity. The two renewable cases (Cases II and

Fig. 5. Capacity reserves in a typical summer day
Fig. 6. Ramp reserves in a typical summer day
III) have significant lower capacity, displaced by either waveor wind. This simulations then support some capacity valueprovided by both resources in short time scales.
4) Value of LNS: All system demand is modeled as dis-patchable load, with the value of lost load set to $10,000/MWh[21]. Because the system trades off the cost of providingenergy and ramping the generators to follow the load, with thepenalty for load not served, the optimization allows sheddingloads in cases with low probability of occurrence, thereforeminimizing expected system cost. From the simulation, weobserve that there is not much load shedding in any of thethree cases, i.e., LNS is almost always close to zero.
V. CONCLUSION
Wave energy is an abundant resource along the coastlinesof the US, Europe and Australia. The efficiency of wave energyconverters is improving and their low cost of production hasscope for increased participations in the generation fleets. Inthis simulation study, wave power integration looks economi-cally promising with the proposed set of evaluation criteria.Our results show that the effects of short term variabilityof wave is less pronounced compared to wind which makeswave energy a promising choice for grid operation. Fromthe operational point of view, the variability of power fromWEC is lower, lowering the requirement for ancillary servicesto compensate their variability. The expected operation costsincluding the procurement of ancillary services (ramp reserves)
are therefore lower, and the impact on capacity requirementsfor reliability purposes is similar to those of a wind turbine.Our future work includes analysis of WEC’s arrays comparedto wind farms.
ACKNOWLEDGMENT
The authors would like to thank Irish Marine Institute,Ireland and NREL for providing the wave and wind data,respectively.
REFERENCES
[1] Cruz, J.,”Ocean Wave Energy: Current Status and Future Perspec-tives,”.Berlin: Springer, 2008
[2] Boake, Cuan B., Trevor JT Whittaker, Matt Folley, and Hamish Ellen.”Overview and initial operational experience of the LIMPET wave energyplant.” In Proceedings of The Twelfth, pp. 586-594. 2002.
[3] Adee,S., (2009, Oct 20). IEEE Spectrum [Online]. Available:spectrum.ieee.org/energy/renewables/this-renewable-energy-source-is-swell
[4] Available: http://www.pelamiswave.com/pelamis-technology[5] Available: http://acore.org/wp-content/uploads/2012/01/Ocean-Power-
Technologies-Case-Study.pdf[6] Parmeggiani, S., et al. ”Performance Assessment of the Wave Dragon
Wave Energy Converter Based on the EquiMar Methodology.”[7] Available:http://www.seai.ie/Publications/Renewables-Publications-
/Ocean/Tidal -Current-Energy-Resources-in-Ireland-Report.pdf[8] Kavanagh, D.; Keane, A.; Flynn, D., ”Capacity Value of Wave Power,”
Power Systems, IEEE Transactions on , vol.28, no.1, pp.412,420, Feb.2013
[9] Denniss, T., ”Comparing the variability of wind speed and wave heightdata.” Energetech Australia, 2005.
[10] Halamay, D.A.; Brekken, T.K.A.; Simmons, A.; McArthur, S., ”Reserverequirement impacts of large-scale integration of wind, solar, and oceanwave power generation,” Power and Energy Society General Meeting,2010 IEEE , vol., no., pp.1,7, 25-29 July 2010
[11] Available: https://www.gov.uk/government/uploads/system/uploads/attac--hmentdata/file/48128/2167-uk-renewable-energy-roadmap.pdf
[12] Available: http://www.marine.ie/home/publicationsdata/data/IMOS/Wav--eBuoys.htm
[13] Liliana, R.;Soares,C.G.,”Wave energy assessments in the Azores is-lands”, Renewable Energy, Vol. 45,, pp. 183,196, Sep. 2012
[14] Lamadrid, A.;Surin, M.;Timothy, D. M.;Carlos, M.;Robert J.T.;Zimmerman,R., ”A SuperOPF Framework.” CERTS Report, 2008.
[15] NREL, “Eastern wind integration and transmission study,” EnerNexCorporation, The National Renewable Energy Laboratory, 1617 ColeBoulevard, Golden, Colorado 80401, Tech. Rep., January 2010.
[16] P. Norgaard and H. Hottlinen, “A multi-turbine power curve approach,”in Nordic Wind Power Conference, 2004, pp. 1–5.
[17] J. W. Guojun Gan, Chaoqun Ma, Data Clustering: Theory, Algorithms,and Applications. Society for Industrial and Applied Mathematics, 2007.
[18] R. Bo and F. Li, “Comparison of lmp simulation using two dcopfalgorithms and the acopf algorithm,” in Electric Utility Deregulationand Restructuring and Power Technologies, 2008. DRPT 2008. ThirdInternational Conference on, 2008, pp. 30–35.
[19] R. D. Zimmerman, C. E. Murillo-Sanchez, and R. J. Thomas, “Mat-power: Steady-state operations, planning, and analysis tools for powersystems research and education,” Power Systems, IEEE Transactions on,vol. 26, no. 1, pp. 12 –19, 2011.
[20] A. Lamadrid, T. Mount, R. Zimmerman, C. Murillo-Sanchez, andL. Anderson, “Alternate mechanisms for integrating renewable sourcesof energy into electricity markets,” in Power and Energy Society GeneralMeeting, 2012 IEEE, 2012, pp. 1–8.
[21] L. Lawton, M. Sullivan, K. Van Liere, A. Katz, and J. Eto, “Aframework and review of customer outage costs: Integration and analysisof electric utility outage cost surveys,” U.S. Department of Energy,Washington DC, Tech. Rep., 2003.