proprietary and confidential | robert sanchez chairman & ceo ryder system, inc. jefferies global...
TRANSCRIPT

1 Proprietary and Confidential |
Robert SanchezChairman & CEO
RYDER SYSTEM, INC.Jefferies Global Industrials ConferenceAugust 13, 2013

Proprietary and Confidential | 2
Certain statements and information included in this presentation are "forward-looking statements" under the Federal Private Securities Litigation Reform Act of 1995, including our expectations for market trends impacting our business, future earnings and other financial performance. Accordingly, these forward-looking statements should be evaluated with consideration given to the many risks and uncertainties inherent in our business that could cause actual results and events to differ materially from those in the forward-looking statements. Important factors that could cause such differences include, among others, increases or decreases in market demand in the commercial rental market, lower than expected lease sales, fluctuations in market demand on the sale of used vehicles impacting inventory levels, pricing and our anticipated proportion of retail versus wholesale sales, higher than expected maintenance costs, lower than expected benefits from maintenance initiatives, a slowdown of the economic recovery and decreases in freight demand or volumes, our ability to obtain adequate profit margins for our services, our inability to maintain current pricing levels due to soft economic conditions, uncertainty or decline in economic and market conditions in the U.K., competition from other service providers, customer retention levels, unexpected volume declines, loss of key customers in the Supply Chain Solutions (SCS) business segment, unexpected reserves or write-offs due to the deterioration of the credit worthiness or bankruptcy of customers, changes in customers’ business environments that will limit their ability to commit to long-term vehicle leases, a decrease in credit ratings, increased debt costs, adequacy of accounting estimates, reserves and accruals particularly with respect to pension, taxes, insurance and revenue, sudden or unusual changes in fuel prices, our ability to manage our cost structure, and the risks described in our filings with the Securities and Exchange Commission. The risks included here are not exhaustive. New risks emerge from time to time and it is not possible for management to predict all such risk factors or to assess the impact of such risks on our business. Accordingly, we undertake no obligation to publicly update or revise any forward-looking statements, whether as a result of new information, future events, or otherwise.
This presentation includes certain non-GAAP financial measures as defined under SEC rules, including operating revenue, comparable earnings, comparable earnings before income tax, comparable tax rate, adjusted return on capital, total cash generated, free cash flow, total obligations and the ratios based on these financial measures. Refer to Appendix – Non-GAAP Financial Measures for more information about the non-GAAP financial measures contained in this presentation. Additional information as required by Regulation G regarding non-GAAP financial measures can be found in our most recent Form 10-K, Form 10-Q and our Form 8-K filed as of the date of this presentation with the SEC, which are available at http://investors.ryder.com.
Beginning in 2013, comparable earnings and the other financial measures and ratios derived from comparable earnings will exclude non-operating pension costs. For more information on our new calculation method, see the Appendix.
Safe Harbor and Non-GAAP Financial Measures
Proprietary and Confidential | 3
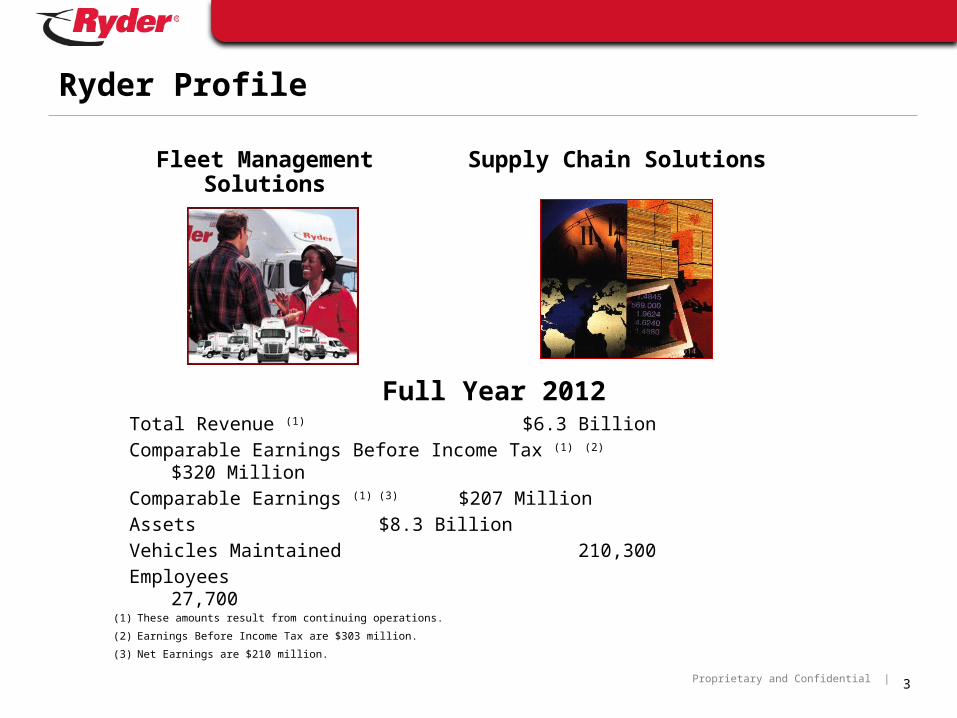
Ryder Profile
Total Revenue (1) $6.3 Billion
Comparable Earnings Before Income Tax (1) (2) $320 Million
Comparable Earnings (1) (3) $207 Million
Assets $8.3 Billion
Vehicles Maintained 210,300
Employees 27,700
Full Year 2012
Fleet Management Solutions
Supply Chain Solutions
(1) These amounts result from continuing operations.
(2) Earnings Before Income Tax are $303 million.
(3) Net Earnings are $210 million.

Proprietary and Confidential |
Comprehensive, preventive maintenance services
Vehicles are owned by our clients or under third-party finance lease contracts
4
Fleet Management Solutions:Product and Services Overview
Fleet Management Solutions
Commercial vehicles for short-term customer needs
Used by both lease and non-lease customers
CommercialRental
(23% FMS revenue)
Contract Maintenance(6% FMS revenue)
Ancillary maintenance work on Ryder or customer owned vehicles not included in base contract
On-demand maintenance for large customer owned fleets
Contract-Related Maintenance(6% FMS revenue)
Fuel Insurance Safety Regulatory reporting Technology
Fleet Support Services
(2% FMS revenue)
Long-term contractual agreement
Includes vehicle procurement, maintenance services and used vehicle disposition
Comprehensive package of fleet support services available
Full Service Lease
(63% FMS revenue)
Supply Chain Solutions
13,500 Lease/Maintenance Customers (U.S., Canada, U.K.)
Note: Revenue percents based on segment operating revenue (excludes fuel).

Proprietary and Confidential |
Supply Chain Solutions
Strategic consulting &decision support
Solutions engineering Network modeling &
optimization Total landed cost Lean Six Sigma
Professional Services(4% SCS revenue)
Order fulfillment Warehouse and distribution
center operations Inbound materials management Outbound product support Reverse logistics Vendor managed inventory Kitting, packaging & assembly
Distribution Management(30% SCS revenue)
Freight procurement & contract management
Shipment planning and execution
Freight brokerage Freight bill audit and payment Origin/destination services
Transportation Management(9% SCS revenue)
Supported by: IT Solutions
Transportation & warehouse management systems Network optimization tools
Inventory & shipment visibility tools
5
Supply Chain Solutions:Product and Services Overview
600+ Customers (North America & Asia)
:
Dedicated(57% SCS revenue)
Turnkey transportation service
Drivers Vehicles Routing & scheduling Management &
administrative support
Note: Revenue percents based on segment operating revenue (excludes subcontracted transportation).

Proprietary and Confidential | 6
Market Overview
The transportation and logistics markets present significant growth opportunities. Current estimated market sizes are as follows:
Note: Vehicle market shown is class 3-8; Supply chain logistics market represents Ryder’s targeted countries within North America and Asia.Sources: Truck Rental and Leasing Association, R.L. Polk, Monitor Group, A.T. Kearney
Market Segment Market Size
Lease and rental market (outsourced) – U.S., Canada, U.K. 0.9 million vehicles
Private fleet market (addressable, non-outsourced) – U.S., Canada 4.2 million vehicles
Dedicated contract carriage market (outsourced) – U.S. $15 billion
Supply chain logistics market (outsourced) – North America and Asia $250 billion

Proprietary and Confidential |
Increased complexity, cost and regulations create opportunities for Ryder to further penetrate the private fleet and logistics markets
7
Higher equipment costs
Increased engine complexity
CSA requirements
Driver shortages
Residual value risks
Rising fuel
costsAging fleet
Supply chain disruptions
EPA emissions
standards
Macro Trends Support Outsourcing Decision
Nearshoring
Proprietary and Confidential | 8
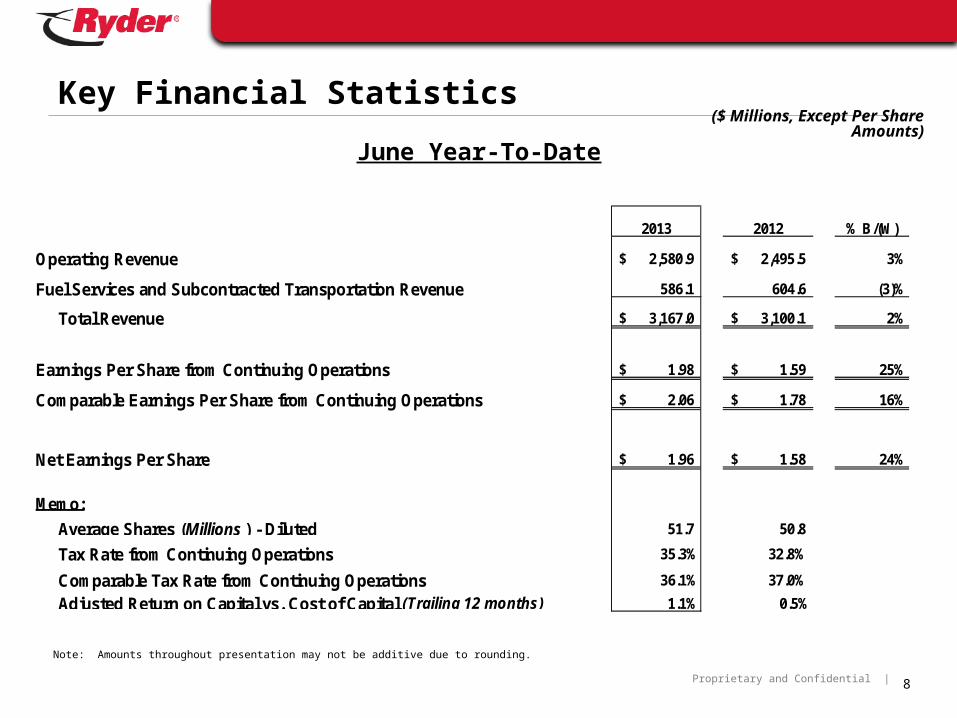
Key Financial Statistics
June Year-To-Date($ Millions, Except Per Share Amounts)
2013 2012 % B/(W)
Operating Revenue 2,580.9$ 2,495.5$ 3%
Fuel Services and Subcontracted Transportation Revenue 586.1 604.6 (3)%
Total Revenue 3,167.0$ 3,100.1$ 2%
Earnings Per Share from Continuing Operations 1.98$ 1.59$ 25%
Comparable Earnings Per Share from Continuing Operations 2.06$ 1.78$ 16%
Net Earnings Per Share 1.96$ 1.58$ 24%
Memo:
Average Shares (Millions ) - Diluted 51.7 50.8
Tax Rate from Continuing Operations 35.3% 32.8%
Comparable Tax Rate from Continuing Operations 36.1% 37.0%
Adjusted Return on Capital vs. Cost of Capital (Trailing 12 months) 1.1% 0.5%
Note: Amounts throughout presentation may not be additive due to rounding.

Proprietary and Confidential | 9
Key Leading Indicators
Second quarter results for Ryder’s key leading indicators included:
(a) Global power units(b) U.S. power units(c) U.S.
Commercial Rental:
Utilization (a) 80.5%, up 550 bps from prior year
Pricing (a) up 2% from prior year
Fleet Count (Average) down 10% from prior year
Used Vehicle Pricing:
Tractors down 1% from prior year; down 3% from 1Q13
Trucks up 2% from prior year; up 1% from 1Q13
Lease:
Miles per Unit (b) up 2% from prior year
Early Lease Terminations (c) 29% below 6-year average
Supply Chain Solutions:
Volumes overall volumes up

Proprietary and Confidential |
2000 2001 2002 2003 2004 2005 2006 2007 2008 2009 2010 2011 2012 2013 Forecast Midpoint
Long Term Target
Midpoint
10
Financial Indicators Forecast (1)
(1) Total Obligations to Equity includes acquisitions. Free Cash Flow and Gross Capital Expenditures exclude acquisitions.(2) 2000-2004 not restated for operations discontinued in 2009. (3) Includes $176 million payment to the IRS related to full resolution of 1998 - 2000 tax period matters.(4) Illustrates impact of accumulated net pension related equity charge on leverage.(5) Forecast issued on 7/23/13 and has not been subsequently confirmed or revised.(6) Represents long term obligations to equity target of 225-275% while maintaining a strong investment grade credit rating.
Series1
Gross Capital Expenditures (2) ($ Millions)
$1,289
$600$725
$1,165
$657
$1,399$1,182
2000 2001 2002 2003 2004 2005
Memo: Free Cash Flow (2)
$1,757
2006 2007 2008
$1,265
2010 2009
$611
131 367 357 289 (208)(3) 380(242) (439) 341 614
$1,088
(384)
2013Forecast
Midpoint (5)
258
$1,760
Full Service Lease
PP&E/OtherCommercial Rental
$2,161
2011
(257)
2012
Total Obligations to Equity
Pension Impact (4)
2000 2001 2002 2003 2004 2005 2006 2007 2008 2009 2010
275%
146%129%
234%
151%157%168%
225%183%
203%201%
270%
Long Term
Target Midpoint (6)
2011
261%
ForecastMidpoint (5)
2012
250%
2013
Total Obligations to Equity
243%
$1,815
Memo: Balance Sheet Debt to Equity
161% 139% 140% 135% 118% 143% 164% 147% 213% 175% 196% 257% 260% 237%
(160)

Proprietary and Confidential | 11
Adjusted Return on Capital History
AdjustedReturn on Capital (ROC)
6.8% 6.7% 6.6% 6.5%
6.3% 6.1%
5.5%4.8% 4.7%
7.8% 7.9%7.4% 7.3%
4.1% 4.8%
5.7%5.6% 5.8%
2005 2006 2007 2008 2009 2010 2011 2012 2013 Forecast
Cost of Capital (COC)
Return on Equity 14.6% 15.5%
14.2% 11.2% 4.4% 8.4% 11.9% 14.9% 15.2%
Adjusted Total Capital (2) $3,846 $4,184 $4,789 $4,841 $4,244 $4,030 $4,588 $5,237 $5,620
ROC O/(U) COC 1.0% 1.2% 0.8% 0.8% (2.2)% (1.3)% 0.2% 0.8% 1.1%
(1) Forecast provided on 7/23/13 and has not subsequently been confirmed or revised.
(2) Adjusted Total Capital represents Adjusted Average Total Capital in millions.
2013Forecast (1)
150 bp spread
targeted

12
Proprietary and Confidential |
Questions & Answers
Robert SanchezChairman & CEO

13
Proprietary and Confidential |
Contact Information
Bob BrunnVP – Corporate Strategy & Investor [email protected]
Calene CandelaGroup Director – Investor [email protected]

14
Proprietary and Confidential |
Non-GAAP Financial Measures

Proprietary and Confidential |
► This presentation includes “non-GAAP financial measures” as defined by SEC rules. As required by SEC rules, we provide a reconciliation of each non-GAAP financial measure to the most comparable GAAP. Non-GAAP financial measures should be considered in addition to, but not as a substitute for or superior to, other measures of financial performance prepared in accordance with GAAP.
► Specifically, the following non-GAAP financial measures are included in this presentation:
Non-GAAP Financial Measure Comparable GAAP MeasureReconciliation & Additional Information Presented on Slide Titled
Operating Revenue Total Revenue Key Financial Statistics
Comparable Earnings /Comparable Earnings Before Tax / Comparable EPS from Continuing Operations
Earnings /Earnings Before Tax / EPS from Continuing Operations
Appendix - Earnings and EPS from Contijuing Operations Reconciliation and Appendix - EBT and Tax Rate from Continuing Operations Reconciliation
Adjusted Return on Capital / Adjusted Total Capital Net Earnings / Total Capital Appendix - Adjusted Return on Capital Reconciliation
Total Cash Generated / Free Cash Flow Cash Provided by Operating Activities Appendix - Cash Flow Reconciliation
Total Obligations / Total Obligations to Equity Balance Sheet Debt / Debt to Equity Key Leverage StatisticsAppendix - Debt to Equity Reconciliation
Comparable Tax Rate Tax Rate Appendix - EBT and Tax Rate from Continuing Operations
15
Appendix: Non-GAAP Financial Measures

Proprietary and Confidential | 16
Appendix: Non-GAAP Financial Measures($ Millions or $ Earnings Per Share)
(1) The company uses Comparable Earnings and Comparable Earnings per Share (EPS) from Continuing Operations, both non-GAAP financial measures, which provide useful information to investors and allow for better year over year comparison of operating performance because they exclude from Earnings and EPS from Continuing Operations non-operating pension costs, as we consider non-operating pension costs to be those impacted by the financial market performance and outside of the operational performance of the business and can significantly change from year to year. Comparable Earnings and Comparable EPS also exclude other significant items that are not representative of our ongoing business operations and allow for better year over year comparison.
Earnings and EPS from Continuing Operations Reconciliation
YTD13 - YTD13 - YTD12 - YTD12 -Earnings EPS Earnings EPS
Reported 103.4$ 1.98$ 81.6$ 1.59$ Non-Operating Pension Costs 6.0 0.12 9.7 0.19 Tax Benefits - - (5.0) (0.10) Restructuring Charges (1.9) (0.04) 5.2 0.10
Comparable (1) 107.5$ 2.06$ 91.5$ 1.78$
FY12 - FY12 - FY11 - FY11 -Earnings EPS Earnings EPS
Reported 200.9$ 3.91$ 171.4$ 3.31$ Non-Operating Pension Costs 19.4 0.37 11.1 0.22 Superstorm Sandy Vehicle-Related Losses 5.1 0.10 - - Tax (Benefits)/Law Changes (4.1) (0.08) 4.8 0.09 Restructuring Charges 5.3 0.11 2.5 0.05 Acquisition Related Transaction Costs 0.3 - 1.9 0.04
Comparable (1) 226.8$ 4.41$ 191.7$ 3.71$

Proprietary and Confidential | 17
Appendix: Non-GAAP Financial Measures($ Millions or $ Earnings Per Share)
(1) The company uses Comparable Earnings Before Income Tax (EBT) and Comparable Tax Rate from Continuing Operations, both non-GAAP financial measures, which provide useful information to investors and allow for better year over year comparison of operating performance because they exclude from EBT and Tax Rate from Continuing Operations non-operating pension costs, as we consider non-operating pension costs to be those impacted by financial market performance and outside of the operational performance of the business and can significantly change from year to year. Comparable Earnings and Comparable EPS also exclude other significant items that are not representative of our ongoing business operations and allow for better year over year comparison.
EBT and Tax Rate from Continuing Operations Reconciliation
YTD13 - YTD13 - YTD13 - YTD12 - YTD12 - YTD12 -
EBT Tax Tax Rate EBT Tax Tax Rate
Reported 159.9$ 56.5$ 35.3% 121.5$ 39.8$ 32.8%
Tax Benefits - - - 5.0
Non-Operating Pension Costs 10.2 4.2 15.7 6.0 Income from foreign currency translations (1.9) (0.01) - -
Restructuring Charges - - 8.0 2.8 Comparable (1)
168.2$ 60.7$ 36.1% 145.2$ 53.7$ 37.0%
FY12 - FY12 - FY12 - FY11 - FY11 - FY11 -EBT Tax Tax Rate EBT Tax Tax Rate
Reported 303.1$ 102.2$ 33.7% 279.4$ 108.0$ 38.7%Non-Operating Pension Costs 31.4 12.0 18.7 7.6 Superstorm Sandy Vehicle-
Related Losses 8.2 3.1 - - Tax Law Changes/Benefits - 4.1 - (4.8) Restructuring Charges 8.1 2.8 3.7 1.2
Acquisition Related Transaction Costs 0.4 0.1 2.1 0.1
Comparable (1)351.2$ 124.4$ 35.4% 303.8$ 112.1$ 36.9%

Proprietary and Confidential | 18
Appendix: Non-GAAP Financial Measures
2004 2005 2006 2007 2008 2009
Net earnings (1) 216$ 227$ 249$ 254$ 200$ 62$ Cumulative effect of change in accounting principle - 2 - - - - Restructuring and other charges, net and other items (24) (2) - 1 70 30 Income taxes 115 129 144 152 150 54 Adjusted earnings before income taxes 307 357 393 407 420 146
Adjusted interest expense (2) 106 127 149 169 165 150
Adjusted income taxes (3) (156) (186) (207) (220) (230) (122) Adjusted net earnings 257$ 298$ 332$ 356$ 355$ 174$
Average total debt(4) 1,811$ 2,148$ 2,480$ 2,848$ 2,882$ 2,692$
Average off-balance sheet debt(4) 152 148 99 150 171 142 Average total shareholders'
equity(4) 1,412 1,555 1,610 1,791 1,778 1,396 Average adjustments to
shareholders' equity (5) (16) (5) (5) 1 10 16 Adjusted average total capital 3,359$ 3,846$ 4,184$ 4,789$ 4,841$ 4,245$
Adjusted return on capital 7.7% 7.8% 7.9% 7.4% 7.3% 4.1%
($ Millions)
(1) Earnings calculated based on a 12-month rolling period.(2) Interest expense includes interest for on and off-balance sheet vehicle obligations.(3) Income taxes were calculated by excluding taxes related to comparable earnings items and interest expense.(4) The average is calculated based on the average GAAP balances.(5) Represents comparable earnings items for those periods.
Adjusted Return on Capital Reconciliation

Proprietary and Confidential | 19
Appendix: Non-GAAP Financial Measures
2010 2011 2012 6/30/13 6/30/12
Net Earnings (1) 118$ 170$ 210$ 231$ 186$
Restructuring and Other Charges, Net and Other Items 6 6 17 7 11
Income Taxes 61 108 91 108 97
Adjusted Earnings Before Income Taxes 185 284 318 345 294
Adjusted Interest Expense (2) 133 135 143 142 138
Adjusted Income Taxes (3) (124) (157) (167) (175) (158)
Adjusted Net Earnings 194$ 262$ 294$ 313$ 274$
Average Total Debt(4) 2,512$ 3,079$ 3,707$ 3,846$ 3,417$
Average Off-Balance Sheet Debt(4) 114 78 126 152 81
Average Total Shareholders' Equity (4) 1,402 1,428 1,407 1,476 1,391
Average Adjustments to Shareholders' Equity (5) 2 4 (3) (4) 4
Adjusted Average Total Capital 4,030$ 4,588$ 5,237$ 5,469$ 4,893$
Adjusted Return on Capital 4.8% 5.7% 5.6% 5.7% 5.6%
($ Millions)
(1) Earnings calculated based on a 12-month rolling period.(2) Interest expense includes interest for on and off-balance sheet vehicle obligations.(3) Income taxes were calculated by excluding taxes related to comparable earnings items and interest expense.(4) The average is calculated based on the average GAAP balances.(5) Represents comparable earnings items for those periods.
Adjusted Return on Capital Reconciliation

Proprietary and Confidential |
12/31/91 12/31/92 12/31/93 12/31/94 12/31/95 12/31/96 12/31/97 12/31/98 12/31/99
Cash Provided by Operating Activities 647$ 847$ 771$ 831$ 720$ 494$ 569$ 890$ 270$
Less: Changes in Bal. of Trade Rec. Sold - (115) - - (30) - - (125) 125
Collections on Direct Finance Leases 31 32 38 45 48 53 63 63 78
Proceeds from Sale (Prim. Rev. Earn. Equip.) 208 220 225 265 337 345 339 322 402
Proceeds from Sale and Leaseback of Assets 114 200 - 400 300 150 - 239 300
Other Investing, Net (10) 8 6 (4) (7) (21) (24) (38) (39)
Total Cash Generated 990 1,192 1,040 1,538 1,368 1,021 947 1,351 1,136
Capital Expenditures (1) (598) (1,070) (1,237) (1,769) (2,049) (1,210) (990) (1,333) (1,734)
Free Cash Flow (2) 392$ 122$ (198)$ (231)$ (680)$ (190)$ (42)$ 18$ (598)$
Memo:
Depreciation 542$ 537$ 557$ 629$ 716$ 741$ 609$ 626$ 623$
Gains on Vehicle Sales, Net 11$ 34$ 54$ 73$ 90$ 66$ 50$ 57$ 56$
Appendix: Non-GAAP Financial Measures
($ Millions)Cash Flow Reconciliation (3)
(1) Capital expenditures presented net of changes in accounts payable related to purchases of revenue earning equipment.
(2) Free Cash Flow excludes acquisitions and changes in restricted cash.
(3) Amounts have not been restated for operations discontinued in 2009.
20

Proprietary and Confidential |
Cash Flow Reconciliation
21
Appendix: Non-GAAP Financial Measures
(1) Capital expenditures presented net of changes in accounts payable related to purchases of revenue earning equipment.
(2) Free Cash Flow excludes acquisitions and changes in restricted cash.
(3) Amounts have not been restated for operations discontinued in 2009.
12/31/00 (3) 12/31/01 (3) 12/31/02 (3) 12/31/03 (3) 12/31/04 (3) 12/31/05 12/31/06 12/31/07 12/31/08 12/31/09
Cash Provided by Operating Activities 1,023$ 365$ 617$ 803$ 867$ 776$ 852$ 1,097$ 1,248$ 985$
Less: Changes in Bal. of Trade Rec. Sold (270) 235 110 - - - - - - -
Collections of Direct Finance Leases 67 66 66 61 64 69 65 62 61 65
Proceeds from Sale (Prim. Rev. Earn. Equip.) 230 173 152 210 331 333 332 373 262 216
Proceeds from Sale & Leaseback of Assets - - - 13 118 - - 150 - -
Other Investing, Net 4 (4) 4 4 1 - 2 2 - -
Total Cash Generated 1,054 835 949 1,091 1,381 1,179 1,252 1,684 1,571 1,266
Capital Expenditures (1) (1,296) (704) (582) (734) (1,092) (1,387) (1,691) (1,304) (1,230) (652)
Free Cash Flow (2) (242)$ 131$ 367$ 357$ 289$ (208)$ (439)$ 380$ 341$ 614$
Memo:
Depreciation Expense 580$ 545$ 552$ 625$ 706$ 735$ 739$ 811$ 836$ 881$
Gains on Vehicle Sales, Net 19$ 12$ 14$ 16$ 35$ 47$ 51$ 44$ 39$ 12$
($ Millions)

Proprietary and Confidential | 22
Appendix: Non-GAAP Financial Measures
12/31/10 12/31/11 12/31/12
Cash Provided by Operating Activities from Continuing Operations 1,028$ 1,042$ 1,134$
Proceeds from Sales (Primarily Revenue Earning Equipment) 235 300 413
Proceeds from Sale and Leaseback of Assets - 37 130
Collections of Direct Finance Leases 62 62 72
Other, net 3 - -
Total Cash Generated 1,328 1,442 1,749
Capital Expenditures (1) (1,070) (1,699) (2,133)
Free Cash Flow (2) 258$ (257)$ (384)$
Memo:
Depreciation Expense 834$ 872$ 940$
Gains on Vehicle Sales, Net 29$ 63$ 89$
($ Millions)
(1) Capital expenditures presented net of changes in accounts payable related to purchases of revenue earning equipment.
(2) Free Cash Flow excludes acquisitions and changes in restricted cash.
Cash Flow Reconciliation

Proprietary and Confidential |
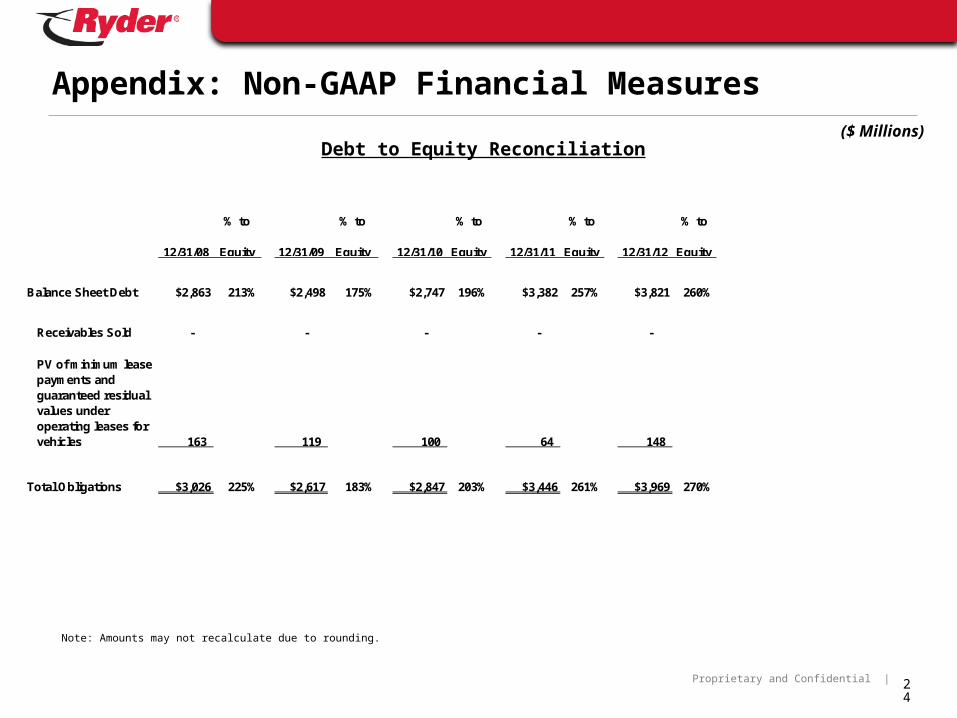
Debt to Equity Reconciliation
23
Appendix: Non-GAAP Financial Measures
% to % to % to % to % to % to % to % to12/31/00 Equity 12/31/01 Equity 12/31/02 Equity 12/31/03 Equity 12/31/04 Equity 12/31/05 Equity 12/31/06 Equity 12/31/07 Equity
Balance Sheet Debt $2,017 161% $1,709 139% $1,552 140% $1,816 135% $1,783 118% $2,185 143% $2,817 164% $2,776 147%
Receivables Sold 345 110 - - - - - -
PV of minimum lease payments and guaranteed residual values under operating leases for vehicles 879 625 370 153 161 117 78 178
PV of contingent rentals under securitizations 209 441 311 - - - - -
Total Obligations $3,450 275% $2,885 234% $2,233 201% $1,969 146% $1,944 129% $2,302 151% $2,895 168% $2,954 157%
Note: In connection with adopting FIN 46 effective July 1, 2003, the Company consolidated the vehicle securitization trusts previously disclosed as off-balance sheet debt.
($ Millions)
Proprietary and Confidential | 24
Debt to Equity Reconciliation($ Millions)
Note: Amounts may not recalculate due to rounding.
% to % to % to % to % to
12/31/08 Equity
12/31/09 Equity 12/31/10 Equity 12/31/11 Equity 12/31/12 Equity
Balance Sheet Debt $2,863 213% $2,498 175% $2,747 196% $3,382 257% $3,821 260%
Receivables Sold - - - - -
PV of minimum lease payments and guaranteed residual values under operating leases for vehicles 163 119 100 64 148
Total Obligations $3,026 225% $2,617 183% $2,847 203% $3,446 261% $3,969 270%
Appendix: Non-GAAP Financial Measures

Proprietary and Confidential |