proposition 39: clean energy jobs act of 2012 california
TRANSCRIPT

Proposition 39: Clean Energy Jobs Act of 2012
California Community Colleges Energy Project Guidance
Prepared for the Administration by the
California Community Colleges Chancellor’s Office
MAY 29, 2013


CCC Energy Project Guidance i
PROPOSITION 39: CLEAN ENERGY JOBS ACT OF 2012
ACKNOWLEDGEMENTS The California Community Colleges Chancellor’s Office wishes to acknowledge the California Department of Education, the California Energy Commission, the California Public Utilities Commission, the California Community Colleges/Investor Owned Utilities Energy Efficiency Partnership, and the four Partnership participating utilities (Pacific Gas & Electric, Southern California Edison, Southern California Gas, and San Diego Gas & Electric) for their assistance in preparing this document.

CCC Energy Project Guidance ii
PROPOSITION 39: CLEAN ENERGY JOBS ACT OF 2012
TABLE OF CONTENTS
SECTION 1. BACKGROUND ............................................................................................... 1
SECTION 2. FUNDING ....................................................................................................... 4
SECTION 3. PROJECT IDENTIFICATION ............................................................................. 5
SECTION 4. PROJECT COST-EFFECTIVENESS CRITERIA ................................................... 14
SECTION 5. JOB TRAINING AND WORKFORCE DEVELOPMENT ..................................... 19
SECTION 6. TRACKING AND REPORTING ........................................................................ 21
SECTION 7. PROGRAM EVALUATION, MEASUREMENT, AND VERIFICATION ................ 22
APPENDICES APPENDIX A – 2013-14 PROJECT ALLOCATIONS BY DISTRICT APPENDIX B – SUSTAINABILITY TEMPLATE – ENERGY PROJECT EXCERPT APPENDIX C – CAMPUS PROJECT IDENTIFICATION AND PRIORITIZATION WORKSHEET APPENDIX D – FUNCTIONAL SPECIFICATIONS FOR SYSTEM-WIDE ENTERPRISE ENERGY
INFORMATION SYSTEMS APPENDIX E – FUNCTIONAL GUIDELINES FOR BUILDING MANAGEMENT SYSTEMS APPENDIX F – MBCX GUIDELINES APPENDIX G – RCX GUIDELINES APPENDIX H – PROJECT PROPOSAL FORM APPENDIX I – SUSTAINABILITY TEMPLATE – ECONOMIC EXCERPT APPENDIX J – CCC GUIDANCE PROCESS FLOWCHART APPENDIX K – RESOURCES LIST APPENDIX L – ANNUAL EXPENDITURE REPORT

SECTION 1: BACKGROUND 1
PROPOSITION 39: CLEAN ENERGY JOBS ACT OF 2012
SECTION 1. BACKGROUND The California Clean Energy Jobs Act (Proposition 39) was approved on November 6, 2012, by the voters of California. The initiative makes changes to corporate income taxes and provides for the transfer of funds annually from the General Fund to the Clean Energy Job Creation Fund for five fiscal years, beginning with 2013-2014. The 2013-14 budget proposes to allocate $464 million of Proposition 39 revenue to school districts, charter schools, county offices of education (collectively local educational agencies [LEA]), and community colleges (of that amount, $51 million will go to community colleges in 2013-14) to support energy efficiency projects and workforce development training. In the four years to follow, LEAs and community colleges will receive an estimated $550 million annually. Monies in the fund are available, upon appropriation by the Legislature, for purposes of funding eligible projects that create jobs in California while improving energy efficiency and expanding clean energy generation. The California Community Colleges Chancellor’s Office will be responsible for distributing funding to individual Community College Districts. These funds may be used by Districts for energy efficiency and alternative energy projects, along with related improvements and repairs that contribute to reduced operating costs and improved health and safety conditions in the community college system. These funds may also be used by the community colleges for job training and workforce development in the energy efficiency and renewable energy industry sectors. The Chancellor’s Office has developed this guidance to assist Community College Districts to implement projects to meet Proposition 39 requirements. Projects must be consistent with the state’s energy loading order, which guides the state’s energy policies and decisions according to the following priority order: 1) decreasing electricity demand by increasing energy efficiency and reducing energy usage in periods of high demand or cost; 2) meeting new energy supply needs with renewable resources; and 3) meeting new energy generation needs with clean fossil-fuel generation. California Community Colleges (CCCs) educate 2.4 million students annually at 112 campuses within 72 Districts. As a system, they use approximately 706 million kWh of electricity annually, 26 million therms of natural gas, with a total annual energy cost of $162 million and $6.9 billion annually in total operating costs. The CCCs will utilize the Proposition 39 funding to achieve ambitious goals for energy efficiency and demand reduction with more efficient, clean energy systems. Savings on energy costs would then be put back into the community colleges system in the form of increased student access and class sections, which have been slashed by over $800 million in state funding reductions over the last 4 years. This additional funding will allow campuses to increase their efforts as incubators for clean energy and energy efficiency, as well as benefit the campuses’ students. Community colleges are the leaders in workforce training for the type of projects envisioned by Proposition 39. The funding and resulting projects will generate thousands of highly paid public and private sector direct, indirect, and induced jobs. In this way, the California Community Colleges will fulfill the goals of Proposition 39

2 CCC Energy Project Guidance
PROPOSITION 39: CLEAN ENERGY JOBS ACT OF 2012
to create green energy jobs, advance the clean energy economy, and reduce energy use and greenhouse gas emissions. This CCC Energy Project Guidance has been created specifically to address the opportunities, challenges, and past successes in energy project implementation at California Community Colleges. The program will supplement, compliment, and leverage existing energy efficiency programs such as the California Public Utilities Commission administered California Community Colleges/Investor Owned Utilities Energy Efficiency Partnership (CCC/IOU Partnership). This public-private partnership has been working on behalf of the Community College system since 2006 and has delivered 81 million kWh and 2.6 million therms in annual energy usage reduction, and over $12 million in cost savings to the system. Utility incentive programs will also help increase the impact of the use of Proposition 39 funds at the CCCs by providing matching project funds to campuses, as well as providing financial assistance through other utility funding mechanisms like On-Bill Financing. This CCC Energy Project Guidance will ensure a transparent, fully publicly accountable and auditable procurement process that will maximize the program’s overall value and return on investment. As required by the initiative language, all approved projects will be cost effective, and total benefits shall be greater than project costs over time. All projects shall require contracts that identify the project specifications, costs, and projected energy savings. Finally, all completed projects will be subject to a Measurement & Verification process leveraged through the existing California Public Utilities Commission (CPUC) requirements for all energy efficiency projects to ensure program integrity and accountability. According to the Budget Trailer Bill language, the funding provided in this program is subject to annual audits as required by California Education Code (EC) Section 41020. Districts will need to maintain documentation on project specifications and costs, which may also include costs associated with technical assistance and projected energy savings, in order to complete the expenditure report due annually on October 1 to the Chancellor’s Office. This CCC Energy Project Guidance takes a slightly different approach to project identification and prioritization than the California Department of Education K-12 Guidance. This is due to the fact that the CCCs have been aggressively pursuing and implementing energy efficiency and renewable energy projects for many years with significant success. Because of this, the Community Colleges are in a position to employ more sophisticated processes and tools to build on existing progress. Key elements of the CCC Guidance program include:
• Leveraging existing successful energy efficiency, renewable energy, and workforce development programs to the fullest extent possible to streamline processes and capitalize on existing, proven program delivery infrastructure.
• Implementation of the over $86 million of existing energy efficiency project backlog identified to support CCC Proposition 39 activities.
• Employing the California Community Colleges Sustainability Template http://CCC Sustainability Template to identify, screen, prioritize, and implement projects. This would result in deeper and more comprehensive projects as most colleges have already “picked the low-hanging fruit”. In addition, a Campus Project Identification and Prioritization Worksheet has been developed to assist Districts and will be employed for this purpose.
• Evaluate project cost effectiveness against the Proposition language using the analysis tools and methodologies provided in the Sustainability Template.

SECTION 1: BACKGROUND 3
PROPOSITION 39: CLEAN ENERGY JOBS ACT OF 2012
• While adhering to the State Loading Order, support Community Colleges to move forward rapidly with renewable energy projects by allowing past energy efficiency efforts to demonstrate compliance.
• Incorporate existing guidelines and standards for Monitoring-Based Commissioning and Retro-commissioning to assist with project identification and development
• Employ the Functional Specifications for a System-wide Enterprise Energy Information System and campus-level Building Management Systems developed in response to Proposition. Use the results of a system wide survey conducted by the Chancellor’s Office to determine the condition of existing systems and campus plans for upgrade or replacements of systems.
• Utilize the existing CPUC Evaluation, Measurement, and Verification process that are already being employed for projects implemented under utility programs to streamline and simplify this effort for colleges.
The following pages describe the Project Guidance to be used by individual Districts and campuses for the identification, qualification, implementation, and reporting of projects utilizing Proposition 39 funds, and the tools, specifications, and process aids to facilitate the execution of projects that improve energy efficiency, expand clean energy generation, and create jobs in California.

4 CCC Energy Project Guidance
PROPOSITION 39: CLEAN ENERGY JOBS ACT OF 2012
SECTION 2. FUNDING Commencing with the 2013-14 fiscal year and concluding with the 2017-18 fiscal year, 11% of the funds deposited annually in the Clean Energy Job Creation Fund shall be provided to community college districts by the Chancellor of the California Community Colleges on the basis of Full-Time Equivalent Students for energy efficiency, renewable self-generation projects and clean energy related workforce training. According to the Governor’s proposal, the allocation for each Community College District annually and over the five year total is shown in Appendix A for energy efficiency and renewable self-generation projects.

SECTION 3: PROJECT IDENTIFICATION 5
PROPOSITION 39: CLEAN ENERGY JOBS ACT OF 2012
SECTION 3. PROJECT IDENTIFICATION The Community College Project Guidance employs a broad and comprehensive process to assist Districts with identifying potential projects. This is due to the fact that the CCCs have been aggressively pursuing and implementing energy efficiency and renewable energy projects for many years with significant success. This places the Community Colleges in a position to employ more sophisticated processes and tools to build on existing progress. Appendix J provides a Process Flowchart that describes the step-by-step process for project identification and implementation at Community Colleges. The Chart shows the existing process steps from the CCC/IOU Partnership illustrated with light gray boxes. The Proposition 39 steps are overlaid and illustrated with light green boxes. This Flowchart demonstrates the synergies of the Community College Proposition 39 implementation program with the existing CCC/IOU Partnership infrastructure, and will be used with all utilities throughout the state.
3.1 ENERGY EFFICIENCY PROJECT ELIGIBILITY Proposition 39 establishes the following criteria for project eligibility:
• Projects must be cost-effective • Projects must focus on energy efficiency and demand reductions first • All projects shall require contracts that identify the project specification, costs, and project energy
savings • Recipients agree to submit to financial audits, to make necessary facilities and information available to
program evaluators, and to provide information as required by the annual expenditure report Alternative energy generation projects and other innovative energy projects may only be considered if the Community College District can demonstrate that cost-effective energy efficiency projects are already installed or are committed through their utility incentive program. 3.1.1 Energy Efficiency Projects First California’s “loading order” of energy resources was established in 2003 in the state’s first Energy Action Plan. This established a prioritization of energy strategies to address the state’s growing energy needs. Energy efficiency and demand response projects are the first approach, followed by renewable energy generation, distributed generation, combined heat and power applications, and clean and efficient fossil-fired generation. This loading order has been well recognized and adopted in the implementation of the ongoing programs the Community College Districts have utilized to complete energy projects. This includes the California Solar Initiative program which requires implementation of cost effective energy efficiency measures before installation of solar photovoltaic systems.
6 CCC Energy Project Guidance
PROPOSITION 39: CLEAN ENERGY JOBS ACT OF 2012
Following this loading order, prioritization should be given to energy efficiency and demand response projects first. Only after a facility has implemented cost-effective energy efficiency options should funding for alternative energy generation projects (e.g., solar) be considered. Districts that have previously completed energy efficiency projects through existing programs will immediately be qualified to pursue renewable energy projects. Outlined below is the hierarchy of project eligibility:
I. Implement energy efficiency and/or peak demand reduction projects first. (Peak demand reduction or “load management” targets limiting or shifting electric demand away from high-cost, peak demand periods e.g., installing daylighting or energy management systems).
II. Then consider renewable on-site energy generation (i.e., solar, photovoltaic [PV] water heating,
wind).
III. Finally, consider non-renewable projects (i.e., efficient gas fuel cell or co-generation). 3.2 PROJECT IDENTIFICATION AND PRIORITIZATION METHODOLOGY The California Community Colleges will employ several strategies to identify and prioritize projects to be implemented using Proposition 39 funds. These are listed below. 3.2.1 Prioritize Existing Project Backlog and Partnership Program Infrastructure As previously noted, the California Community College Districts have identified a significant backlog of projects that are ready for implementation. These projects meet the proposed eligibility requirements established by Proposition 39 and meet the established loading order. These “shovel-ready” projects exemplify how the CCCs will maximize use of their Proposition 39 funds from the very start of this five year program. Taken together the backlog and more recent submittals of identified projects are substantial, with energy savings of almost 43 million kWh and 980,000 therms with a construction cost of $86 million in identified measures. These submittals are identified in two lists: the first being a list that was developed recently by the Chancellor’s Office in early 2013 from a ”Call for Projects” to all Community College Districts, and the second represents the pre-existing project backlog established in 2012. There are 64 Districts out of a total of 72 statewide represented on these two lists that have projects ready for implementation. By utilizing this established framework, the Proposition 39 implementation can achieve significant benefits with all utilities statewide, including:
• Leveraging of existing technical resources, program infrastructure, and utility incentives, all previously funded by public dollars
• Streamlining the ease and speed of project implementation, resulting in substantially faster realization of cost and energy savings

SECTION 3: PROJECT IDENTIFICATION 7
PROPOSITION 39: CLEAN ENERGY JOBS ACT OF 2012
• Assuring the technical quality and consistency of projects, as well as the persistence of ongoing energy and cost savings
• Optimizing existing program reporting and project verification processes to ensure transparency and accountability
• Minimizing program administrative costs by avoiding the creation of redundant project identification, delivery, and verification processes
3.2.2 Identify Projects using the California Community College Sustainability Template The California Community College Sustainability Template was developed in 2012 by the Chancellors Office as a “roadmap” and “toolkit” to help Districts with energy and sustainability planning. Districts can employ the Template as a “checklist” of project examples and possibilities for implementation. The Implementation Programs and Plans chapter (Section 7) of the Template Guidebook outlines the different programs and projects that can be implemented to achieve the District’s sustainability goals. This list is intended to be a starting point for planning, and individual Districts are encouraged to select those elements that meet established goals and priorities. The list is not all-inclusive, and Districts are also encouraged to think innovatively to identify projects that may not have been addressed here but suit the District’s unique circumstances and needs. This would result in deeper and more comprehensive projects as most colleges have already “picked the low-hanging fruit”. However, Districts should filter, prioritize, and select programs and projects for implementation that best meet their goals while taking into account the budget and resource constraints of the campus. While the Sustainability Template is comprehensive and includes project examples for energy, solid waste, transportation, and water, an excerpt has been created to address energy efficiency, efficient operations of facilities, sustainable building practices, and renewable generation that can be utilized by Districts as project examples for Proposition 39. The Template Energy Excerpt is included in Appendix B of this Guidance Document. 3.2.3 Campus Project Identification and Prioritization Worksheet A Campus Project Identification and Prioritization Worksheet have been developed to assist Districts in identifying and prioritizing potential energy efficiency projects. This worksheet is included in Appendix C and contains features to analyze campus energy usage, lists potential project examples, provides a weighted ranking formula to help prioritize projects, and calculates rough energy savings from implementing selected projects. This Worksheet should be used by Districts and campuses in conjunction with the Sustainability Template. 3.2.4 Energy Information and Building Management Functional Specifications In an effort to improve energy efficiency in facilities operations at the campus level and to provide better system-wide energy usage information and benchmarking, Functional Specifications for a System-wide Enterprise Energy Information System (EEIS) and campus-level Building Management Systems (BMS) have been developed. These documents are intended to be a resource to the community college system for the implementation of these types of projects utilizing Proposition 39 funding, and are included as Appendix D and E, respectively. In addition, the Chancellor’s Office is conducting a survey of all 72 CCC Districts to determine the condition of existing EEIS/BMS systems and campus plans for upgrade or replacements of systems. This information will be very helpful to all Districts in helping to plan projects and will be disseminated in early June 2013.

8 CCC Energy Project Guidance
PROPOSITION 39: CLEAN ENERGY JOBS ACT OF 2012
3.2.5 Commissioning Guidelines Guidelines for Districts to implement Monitoring Based Commissioning (MBCx) and Retro-commissioning (RCx) at college campuses have been established to assist campuses with project identification, approval, implementation, and EM&V for building and energy system commissioning projects. These projects qualify for CPUC incentives and meet all eligibility requirements for Proposition 39 funding. MBCx and RCx represent a significant untapped source of new projects in the Community College footprint, and the injection of project funding from Proposition 39 should help jump-start many projects. The MBCx and RCx Guidelines can be found in Appendix F and G, respectively. 3.2.6 Project Proposals and Approvals After the District identifies a project to be implemented using Proposition 39 funds, they will submit it to the Chancellor’s Office using the “Call for Projects” Project Proposal Form included in Appendix H. This Project Proposal Form will identify the project and indicate estimated project cost, energy savings, and completion date. The Chancellor’s Office will perform a brief review of each Form submitted and will release funding through the state apportionment process immediately after the state budget is enacted to the District if the Form contains the necessary information. This review from the Chancellors Office will ensure compliance with Proposition 39 criteria & these Guidelines and will facilitate successful year-end reporting to the Citizens Oversight Board. The Chancellor’s Office review will not result in project delays if the Project Proposal form is completed fully. Each of the projects in the current backlog has already been submitted using this form. Based on the Chancellor’s Office review of all the projects in the current backlog in 2012 and the recent submittals in 2013, a high percentage of projects have already been deemed eligible to receive 2013-14 Proposition 39 funds. Efforts will now be focused on providing technical assistance to the remaining districts to help them complete and submit their project proposals. 3.3 TECHNICAL ASSISTANCE FOR PROJECT IDENTIFICATION AND
IMPLEMENTATION Proposition 39 requires validation of cost-effective projects which requires project identifications and analysis to determine feasibility, cost effectiveness, and project prioritization. This may require technical assistance activities as outlined below, working closely with District staff and in-house resources, to be funded through Proposition 39 distributions. Technical assistance for project identification can include activities that move energy efficiency projects from identification and planning through implementation, using all types of available resources. Technical assistance activities include:
• Benchmarking – provide information about campus energy usage and compare the energy performance of similar buildings and/or campuses
• Definition / Scoping – conduct site/equipment energy survey, “investment grade audits”, no-touch audits, and/or baseline modeling; collect whole building data
SECTION 3: PROJECT IDENTIFICATION 9
PROPOSITION 39: CLEAN ENERGY JOBS ACT OF 2012
• Review – reviewing energy conservation measures, project/improvement “design” (engineering specifications), and/or incentive applications
• Design and Implementation – assist with procurement and construction management as well as other implementation requirements such as project financing
• Verification and Reporting – provide post-project verification and reporting per program guidelines These activities are well under way in many Community College Districts through the infrastructure provided by the CCC/IOU Partnership, as demonstrated by the significant project backlog identified. Additional outreach by the Chancellor’s Office in cooperation with each Utility will make this technical assistance comprehensive, and can be efficiently accomplished through the Proposition 39 program. To expand and deepen available technical resources to Districts, the Chancellor’s Office will establish a centralized resource for technical assistance that can be utilized on an “as-needed” basis by colleges and districts that require these services but are unable to use their own contacting processes to engage engineering services. Significant advantages will exist through utilizing the engineering and project management resources provided through the Chancellor’s Office. Participating districts will contribute a portion of their Proposition 39 revenues for this purpose. This cost effective approach will permit districts to focus on Proposition 39 implementation and the process will be conversant with the requirements and documentation needed to fulfill program requirements. Districts choosing to engage resources individually will need to ensure that their consultants understand and meet these requirements, which may be a burden they are not willing to undertake.
3.4 ENERGY AUDIT AND PROJECT IDENTIFICATION GUIDELINES Energy Audits in varying depth are proposed for implementation in K-12 Districts which is a reasonable and necessary step to identify and prioritize the best use of Proposition 39 funding. This is typically not the case for most Community College Districts, however, many of which have benefitted from audits and project identification services through other past and ongoing energy programs. The recommended approach outlined below leverages this previous work and the more centralized nature of the Community College system, compared to K-12. For each District, this customized approach is recommended:
a) Benchmarking – Energy and sustainability benchmarking has been adopted by the CCC Board of Governors as a key goal for the Community College system. Many Districts employ the Association of Physical Plant Administrators Facilities Performance Indicators system to benchmark facilities condition and operations against their peers in the higher education field across the United States. While not focused specifically on energy, this is a means of using benchmarking to identify potential projects.
b) Review existing project backlog – As discussed, there is a significant backlog of previously identified
projects, many of which have already received the technical services and analysis necessary to be quickly and efficiently implemented with the help of Proposition 39 funding.

10 CCC Energy Project Guidance
PROPOSITION 39: CLEAN ENERGY JOBS ACT OF 2012
c) Evaluate needs for implementation of System-Wide Enterprise Energy Information System (EEIS) – The full deployment of the EEIS described above will serve as a critical tool to benchmark facilities’ energy use across buildings on campus as well as provide campus-to-campus comparisons at the Chancellor’s Office level. Each campus will be screened to determine the needed upgrades to accomplish the goals of this initiative based on a consistent data platform.
d) Perform additional auditing where needed, determined on a case-by-case basis; These would typically
be targeted, ASHRAE Level 2 audits which include project scoping and screening with detailed energy calculations and financial analysis of proposed energy efficiency measures.
3.5 ENERGY EFFICIENCY PROJECT COMPLIANCE REQUIREMENTS
– THE DIVISION OF THE STATE ARCHITECT The Division of the State Architect (DSA) must review and approve public school construction for compliance with the California Code of Regulations, Title 24, (24 CCR), the California Building Standards Code (CBC) when alterations or additions are made to existing buildings to ensure that buildings are safe. The CBC specifies the following three triggers that require a structural building upgrade. These are as follows:
• The alteration project cost exceeds 50 percent of building replacement value (excluding structural work).
• The building seismic mass is increased by more than 10 percent. • The building seismic load capacity is reduced by more than 5 percent.
DSA review and approval is not required for alteration or reconstruction projects:
• With an estimated construction cost of $39,324.38, or less, for 2013; or • With an estimated construction cost of between $39,324.38 and $157,297.53, for 2013 when certain
conditions are met. See the DSA Interpretation of Regulations A-10 at the following Web page for more information:
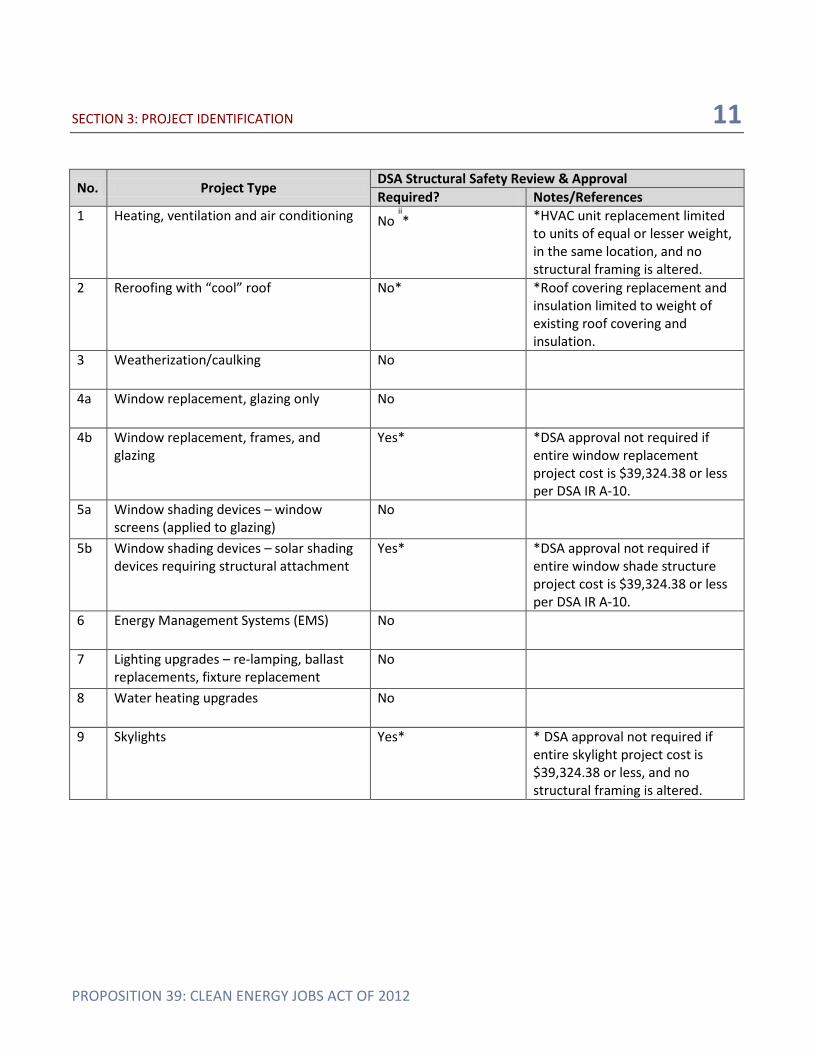
http://www.documents.dgs.ca.gov/dsa/pubs/IR_A-10_rev02-22-13.pdf In addition to these cost threshold exceptions, under the current 24 CCR, Part 1 and 24 CCR, Part 2, and CBC provisions certain energy conservation and efficiency projects may be exempted from DSA structural safety and fire and life safety review and approval. The following table lists potential project types and the related requirements for DSA structural safety and fire and life safety review and approval.
SECTION 3: PROJECT IDENTIFICATION 11
PROPOSITION 39: CLEAN ENERGY JOBS ACT OF 2012
No. Project Type DSA Structural Safety Review & Approval Required? Notes/References
1 Heating, ventilation and air conditioning No ii* *HVAC unit replacement limited
to units of equal or lesser weight, in the same location, and no structural framing is altered.
2 Reroofing with “cool” roof No* *Roof covering replacement and insulation limited to weight of existing roof covering and insulation.
3 Weatherization/caulking No
4a Window replacement, glazing only No
4b Window replacement, frames, and glazing
Yes* *DSA approval not required if entire window replacement project cost is $39,324.38 or less per DSA IR A-10.
5a Window shading devices – window screens (applied to glazing)
No
5b Window shading devices – solar shading devices requiring structural attachment
Yes* *DSA approval not required if entire window shade structure project cost is $39,324.38 or less per DSA IR A-10.
6 Energy Management Systems (EMS) No
7 Lighting upgrades – re-lamping, ballast replacements, fixture replacement
No
8 Water heating upgrades No
9 Skylights Yes* * DSA approval not required if entire skylight project cost is $39,324.38 or less, and no structural framing is altered.

12 CCC Energy Project Guidance
PROPOSITION 39: CLEAN ENERGY JOBS ACT OF 2012
3.6 ACCESSIBILITY REQUIREMENTS FOR ENERGY CONSERVATION AND EFFICIENCY PROJECTS
The Division of the State Architect must review and approve public school construction for compliance with accessibility standards given in the California Code of Regulations, Title 24, Part 2, of the CBC when alterations or additions are made to existing buildings. If the existing “path of travel” elements do not comply with current code provisions, upgrades are required to the area of the work and designated elements serving the area being altered. Upgrades to the current “path of travel” are required as follows:
• If the cost of the project is below $139,934, then the cost of compliance is limited to 20 percent of the adjusted construction cost.
• If the cost is $139,934 or higher, there is no limit to the cost of compliance unless the enforcing agency determines the cost of compliance is an unreasonable hardship.
• If unreasonable hardship is determined, there must be compliance by equivalent facilitation or to the greatest extent possible. However, the cost of compliance shall not be less than 20 percent of the adjusted construction cost.
Under the current proposed CBC accessibility provisions for certain energy conservation and efficiency projects may trigger accessibility upgrades outside the area of the project work. The following table lists potential project types and the related requirements for accessibility upgrades.

SECTION 3: PROJECT IDENTIFICATION 13
PROPOSITION 39: CLEAN ENERGY JOBS ACT OF 2012
No. Project Type Path of Travel Access Upgrades
Required? Applicable 2013 Code Sections 1 Heating, ventilation and air
conditioning No 11B-202.4 Exceptions: 7
2 Reroofing with “cool” roof No 11B-202.4 Exceptions: 7 3 Weatherization/caulking No 2-202 Definitions “Alterations” and
11B-202.4 Exceptions: 7 4a Window replacement, glazing
only No 2-202 Definitions “Alterations” and 11B-202.4 Exceptions: 7
4b Window replacement, frames, and glazing Yes 2-202 Definitions “Alterations” and
11B-202.4 5a Window shading devices –
window screens No 2-202 Definitions “Alterations” and 11B-202.4
5b Window shading devices – solar shading devices requiring structural attachment
Yes 2-202 Definitions “Alterations” and 11B-202.4
6 Energy Management Systems (EMS) No 2-202 Definitions “Alterations” and
11B-202.4 Exceptions: 7 7 Lighting upgrades – re-lamping,
ballast replacements, fixture replacement
No 2-202 Definitions “Alterations” and 11B-202.4 Exceptions: 7
8 Water heating upgrades No 2-202 Definitions “Alterations” and 11B-202.4 Exceptions: 7
9 Skylights Yes 2-202 Definitions “Alterations” and 11B-202.4

14 CCC Energy Project Guidance
PROPOSITION 39: CLEAN ENERGY JOBS ACT OF 2012
SECTION 4. PROJECT COST-EFFECTIVENESS CRITERIA Proposition 39 requires that all energy projects be cost-effective, meaning that total benefits shall be greater than project costs over time. When determining project cost-effectiveness, benefits beyond energy savings can be included. For example, non-energy benefits, such as health and safety, can be considered when calculating the total project benefits. Below are a few terms and approaches to consider. 4.1 HOW TO DEFINE THE “PROJECT”? It is recommended that projects be defined consistent with ongoing utility-sponsored energy programs. This allows flexibility in defining the project scope and can include the following. 4.1.1 Single measure A single energy efficiency measure includes a singular activity (e.g., replace fluorescent lamps with LED lighting) that meets the cost-effectiveness criteria. 4.1.2 Bundled measures An eligible project may be a package of energy efficiency technologies. For example, a project may include lighting fixture and lamp replacement, additional lighting and space conditioning controls, and the addition of solar light tubes in some classrooms. 4.1.3 Add-on or upgrade to a building renovation or new construction project In some cases, a college may have a major renovation already planned, such as the upgrade of heating and cooling systems or replacement of lighting systems. An energy efficiency project could provide incremental change or meet higher efficiency specifications that upgrade the renovation over and above the minimum building code or design requirements.
4.2 HOW TO DETERMINE WHAT IS “COST-EFFECTIVE”? The following provides guidance to Districts to determine if a proposed project is cost effective as defined by Proposition 39. Paragraphs 4.2.1 through 4.2.5, below, provide a baseline for understanding and calculating project cost effectiveness and are similar to the Guidance provided to the K-12 system by the California Department of Education. Paragraphs 4.2.6 and 4.2.7 provide additional information and tools regarding cost-effectiveness to assist Districts in calculating project costs that are specific to the Community Colleges.

SECTION 4: PROJECT COST EFFECTIVENESS CRITERIA 15
PROPOSITION 39: CLEAN ENERGY JOBS ACT OF 2012
4.2.1 Perspective Project costs and benefits should be identified from the perspective of the Community College District. This means thinking in terms of expenditures and savings, but not using the broader economic perspective of an energy utility (the value of avoided energy supply) or “society” (e.g., the secondary benefits of savings re-spent in the California economy). 4.2.2 Costs For a totally discretionary project, the “cost” is the total installed expense of the measure or project, such as hardware or equipment, materials, installation, engineering, or design. In the case of an already planned renovation, the cost for the “energy improvement project” would be the incremental or upgrade costs (but not the basic costs). 4.2.3 Benefits Proposition 39 requires the following benefits for qualified projects. 4.2.3.1 Energy Savings Savings are typically based on the estimated reduction in the electricity and gas utility bills. In the case of an already planned renovation, the savings for the “energy improvement project” would be the estimated higher savings value over and above the projected energy use for the minimum design of the basic project. 4.2.3.2 Non-Energy Benefits (NEBs) Proposition 39 allows for NEBs to be considered in determining cost-effectiveness, although it is not easy to quantify NEBs nor translate them into economic values. From a Community College District perspective, NEBs typically would include:
• Labor savings: reduced operations and maintenance costs from better-performing or long-lived energy systems (e.g., less time replacing burned out lighting, less time on HVAC maintenance)
• Water savings: reduced water usage or wastewater utility bill savings • Health effects: indoor and campus air quality, which may improve student/teacher health and result in
reduced absenteeism • Comfort effects: from better lighting, temperature, ventilation, noise reduction, etc., which may affect
student/teacher well-being, reduced absenteeism, and/or improved student performance • Safety effects: decreased fire and combustion hazards; structural improvements to building; improved
security due to improved lighting which could reduce property losses • Educational effects: student involvement with projects provided marketable learning experience • Because quantifying NEBs is challenging, there are several options for including NEBs in a Proposition 39
cost-effectiveness framework: - Quantify the easily estimated savings, such as reduced operations and maintenance costs (labor,
supplies) and include these as monetary “benefits”.

16 CCC Energy Project Guidance
PROPOSITION 39: CLEAN ENERGY JOBS ACT OF 2012
- Use either a standard “adder”, such as assuming an additional 10 percent NEBs value for the other harder-to quantify (this is a rule of thumb used in some energy evaluation practices), or take a qualitative approach and simply list the specific non-energy benefits expected from the energy improvement project.
4.2.3.3 Persistence of Savings The persistence of any energy savings should be considered in the evaluation of project benefits. For example, Monitoring-based Commissioning (MBCx) projects provides the ability through permanent metering installed as part of the project to monitor and adjust building energy use over time to ensure savings continue into the future. The same can be said for the Enterprise Energy Information System (EEIS) initiative being led by the Chancellor’s Office. The system-wide metering and benchmarking will allow ongoing campus-to-campus energy usage comparison and will ensure that improvements will be maintained over time. 4.2.4 Time frame for analysis In determining the total value of benefits, both energy and non-energy, it is important to estimate the period of time over which the benefits are expected to continue. For example, the lighting improvements should last 10-12 years. This is referred to as the “expected useful life” of the measures or project. For bundled or more comprehensive projects with measures of varying lives, a District can calculate a weighted life for the whole project. For example:
Item % of Project Cost Expected life HVAC filters 5 2 years High efficiency fans 20 7 years Lighting fixture 25 15 years Daylighting 50 30 years
Weighted life = 20.25 years (.05*2 plus .20*7 plus .25*15 plus .50*30) 4.2.5 Cost Effectiveness Metrics Project cost-effectiveness typically will call upon one of three financial metrics depending upon the size and complexity of the project. These are: 4.2.5.1 Simple Payback
• Metric: The simple payback (in years) does not exceed the useful life of the proposed equipment.
• Divides project total cost by expected annual savings, to indicate in how many years the investment will pay back the initial outlay. (e.g., spend $50,000 and save $10,000 per year for a 5-year payback)
• Simple payback (yrs) = Project Cost($) / Anticipated Annual Energy Cost Savings ($/yr)
o Example: Lighting fixture replacement will last 15 years, simple payback is five years, so a five-year payback easily produces economic return within the 15-year expected life.

SECTION 4: PROJECT COST EFFECTIVENESS CRITERIA 17
PROPOSITION 39: CLEAN ENERGY JOBS ACT OF 2012
• The downside to this approach is that it does not compare the expected life-cycle of alternative measures or projects that have different life expectancies. For example, if one project lasts only seven years, and another of equal cost and annual savings will last 15 years but has the same “simple payback” of five years, the second project may be a better choice because it will produce savings for an extra eight years.
4.2.5.2 “Biggest Bang for the Buck” This approach can be used when an energy audit or analysis suggests there are many improvements possible for a facility.
• Metric: Each measure could have a “cost of energy saved” metric, such as $.03 per kWh saved, $.05 per kWh saved, or $.015 per kWh saved.
• Example: These could be rank-ordered, with the college selecting the lowest cost savings items in succession until reaching a budget limit.
4.2.5.3 Net Present Value (NPV) Adds the life-time expected cost savings from each measure or the bundled project, subtracts any up-front capital costs or increased operating costs, and applies a discount rate to acknowledge that savings will occur in future dollars. This approach is helpful when comparing alternative projects with different cost and saving profiles that could be undertaken with a given investment budget. NPV enables the decision-maker to select the project(s) that will produce the greatest total financial benefit. 4.2.5.4 Other considerations While not all measures have similar costs and savings, their combination in a bundled project may produce an overall set of benefits for the total cost that ensures the overall project is cost-effective. A whole-building approach may help to maximize the savings and still be cost-effective.
4.2.6 Project Economics – CCC Sustainability Template The California Community Colleges Sustainability Template provides tools and resources to assist Districts in analyzing project costs and benefits. The Template parallels the basic Proposition 39 cost benefit criteria described above and expands the methodologies to better meet the needs of Community Colleges. In an environment of budget cuts and limited funding, Districts need to carefully evaluate the economics of sustainability in the decision making process. This will mean balancing the different costs and benefits of each project, including those that are difficult to quantify. Often, energy projects that have an initial capital cost will result in annual operating cost savings that translate to reduced General Fund expenditures.

18 CCC Energy Project Guidance
PROPOSITION 39: CLEAN ENERGY JOBS ACT OF 2012
It is strongly recommended that colleges consult the Template and employ the strategies and tools to evaluate cost-effective projects. Ares covered in the Template include:
• What is the District or campus investment criterion for sustainability projects? • How much is the project capital or up-front cost, how much total capital is available, and when is it
available? • How much savings will the project generate compared to its cost? • Are there economies of scale with certain project types? • Can sustainability project capital expenditures translate to campus General Fund and annual operating
budget savings? • What are the project’s lifecycle costs and benefits? • Consider “the cost of doing nothing”. • The Cost of “Going Green” • Cost Estimating Tools
An excerpt of the Sustainability Template that examines these issues can be found in Appendix I.

SECTION 5: JOB TRAINING AND WORKFORCE DEVELOPMENT 19
PROPOSITION 39: CLEAN ENERGY JOBS ACT OF 2012
SECTION 5. JOB TRAINING AND WORKFORCE DEVELOPMENT The Chancellor’s Office proposes to authorize the use of Proposition 39 funds to support energy efficiency and clean energy related workforce training in the California Community Colleges. The rational and approach for the program is described below. 5.1 RATIONALE Existing workforce shortages in critical occupations slow the state’s ability to effectively invest Proposition 39 funds to achieve meaningful improvements in energy efficiency. This plan would build a workforce in each region that links training with Proposition 39 investment and supports a viable workforce beyond the sunset of Proposition 39 funds. Key components and advantages of this plan include: 5.1.1 Build On Successful Statewide Initiatives Community colleges are the state’s largest workforce training provider. The Chancellor’s Office has targeted investment at sectors important to regional economies under the Doing What MATTERS for Jobs and Economy framework (http://doingwhatmatters.cccco.edu/). ‘Energy Efficiency and Utility’ is one of these sectors.
5.1.2 Leverage Existing Assets and Practices That Work These include:
• Recruiting and Placement Job Portal: The Chancellor’s Office just announced a Job Portal partnership with the California Employment Development Department (EDD), leveraging a multi-million dollar investment by EDD in a system to help people find work. This recruiting and placement Job Portal is available to all community colleges via CACareerCafe.com and can be used at no extra cost to help employers post job and internship openings and for students and community members to find jobs.
• Sector Navigator: The Chancellor’s Office has put in place a “Sector Navigator” to act as the first point of contact for the Energy & Utility sector statewide. Our Sector Navigators work with employers, labor unions, and colleges to help them establish relationships and take advantage of the scale of the 112 community colleges and their respective expertise.
• Curriculum Models: Where curriculum is similar across multiple regions, Sector Navigators facilitate the adoption of common curriculum models rather than have each college build its own model, a practice that frustrates employers and lowers success in job placement.
• Apprenticeship: Community colleges administer state Apprenticeship funds. Working through this network will leverage the pre-existing coordination with the labor community.
• RFA process and data collection: The Chancellor’s Office has pre-existing processes for issuing RFAs and collecting performance data.
• Existing programs of study: Employers will need a range of skills – from architects and engineers to entry-level energy raters. By coordinating the training capacity of a region, braiding Proposition 39 with

20 CCC Energy Efficiency Project Guidance
PROPOSITION 39: CLEAN ENERGY JOBS ACT OF 2012
existing Chancellor’s Office programming, a region will be better positioned to provide the skilled workforce needed by employers.
5.1.3 Role of the Chancellor’s Office
• Establish standards and guidelines for Proposition 39 workforce projects, including the use of curriculum
models mapped to industry-recognized credentials. • Encourage preference to proposals where the California Conservation Corps is a signed partner or where
training graduates receive first source consideration from union Project Labor Agreements. • Oversee data collection and reporting into existing Chancellor’s Office accountability systems. • Facilitate use of the CACareerCafe.com Jobs Portal and other pre-established assets rather than making
duplicative investment.

SECTION 6: TRACKING AND REPORTING 21
PROPOSITION 39: CLEAN ENERGY JOBS ACT OF 2012
SECTION 6. TRACKING AND REPORTING As required by the Clean Energy Jobs Act of 2012, Proposition 39, all approved projects must be cost-effective and have total benefits greater than project costs over time. All projects require contracts that identify the project specifications, costs including technical assistance, and projected energy savings. Districts will need to maintain documentation in order to complete the expenditure report due annually on October 1 to the Chancellor’s Office. All projects will be subject to financial audit. According to the 2013-14 Budget Act trailer bill, the Chancellor’s Office compiles and transmits this information to the Citizens Oversight Board (Board) by November 1 of each year for their review and evaluation. The Board annually reviews all expenditures from the Job Creation Fund and also commissions and reviews a selection of projects completed, to assess the effectiveness of the expenditures in meeting the objectives of the California Clean Energy Jobs Act. The Chancellors Office has created a template for Districts to use for the expenditure report due on October 1. (See Appendix L). (Note: This form is under development).

22 CCC Energy Efficiency Project Guidance
PROPOSITION 39: CLEAN ENERGY JOBS ACT OF 2012
SECTION 7. PROGRAM EVALUATION, MEASUREMENT, AND VERIFICATION Evaluation, Measurement, and Verification (EM&V) is a standard protocol when assessing the impact of an energy efficiency project. Evaluation helps determine whether the energy savings that were projected for an energy efficiency retrofit project were realized, and if installed energy conservation measures are performing post-project. EM&V will enable Community College Districts to assess the impact and effectiveness of retrofit activities related to Proposition 39 funds. Districts should choose an EM&V approach that is practical for the nature and scope of a project and consider the personnel skills or software tools to support this. The preferred approach for Districts employment of EM&V activities is for Districts to take advantage of Investor Owned Utility, local municipal utility, Energy Commission, or other sponsored programs that offer EM&V services as part of the incentive and rebate processes. These programs are already developed, documented and in place to safeguard the interests of public funds which provide incentives. The validation processes are robust and account adequately for the complexity and variables of a variety of energy retrofits. It is anticipated that most work associated with the Community Colleges under Proposition 39 will simultaneously move through the Utilities’ incentive program processes, and will be subject to the technical scrutiny of these regulated programs. These established processes require pre- and post-project field verification and thorough technical third-party review of all associated savings claims and cost documentation. This review must meet CPUC established guidelines for savings claims which are typically based on Federal Energy Management Program International Performance Measurement and Verification Protocol Options A, B, or D according to project size and scope. Smaller projects are more efficiently verified using savings claims according to the Database for Energy Efficiency Resources which is a well-established, industry-standard source and its use is required by regulation in CCC/IOU Partnership funded programs. This review process ensures that all calculations and assumptions are transparent and repeatable, and that overall estimates are conservative. The process also ensures that free ridership is minimized and that steps are taken to ensure persistence of savings. For projects that are not eligible for, or are otherwise not participating in incentives programs, Districts should use an independent technical resource to verify the savings utilizing International Performance Measurement and Verification Protocol appropriate for the retrofit type, complexity and size. Districts are encouraged to align their process closely to the CCC/IOU Partnership verification processes, which can be found in the 2013-14 Statewide Customized Offering Procedures Manual for Business, available at www.pge.com, www.sce.com, or www.sdge.com.

APPENDICES 23
PROPOSITION 39: CLEAN ENERGY JOBS ACT OF 2012
APPENDICES
APPENDIX A – 2013-14 PROJECT ALLOCATIONS BY DISTRICT
APPENDIX B – SUSTAINABILITY TEMPLATE – ENERGY PROJECT EXCERPT
APPENDIX C – CAMPUS PROJECT IDENTIFICATION AND PRIORITIZATION
WORKSHEET
APPENDIX D – FUNCTIONAL SPECIFICATIONS FOR SYSTEM-WIDE ENTERPRISE
ENERGY INFORMATION SYSTEMS
APPENDIX E – FUNCTIONAL GUIDELINES FOR BUILDING MANAGEMENT
SYSTEMS
APPENDIX F – MBCX GUIDELINES
APPENDIX G – RCX GUIDELINES
APPENDIX H – PROJECT PROPOSAL FORM
APPENDIX I – SUSTAINABILITY TEMPLATE – ECONOMIC EXCERPT
APPENDIX J – CCC GUIDANCE PROCESS FLOWCHART
APPENDIX K – RESOURCES LIST
APPENDIX L – ANNUAL EXPENDITURE REPORT

APPENDICES A-1
PROPOSITION 39: CLEAN ENERGY JOBS ACT OF 2012
APPENDIX A 2013-14 PROJECT ALLOCATIONS BY DISTRICT

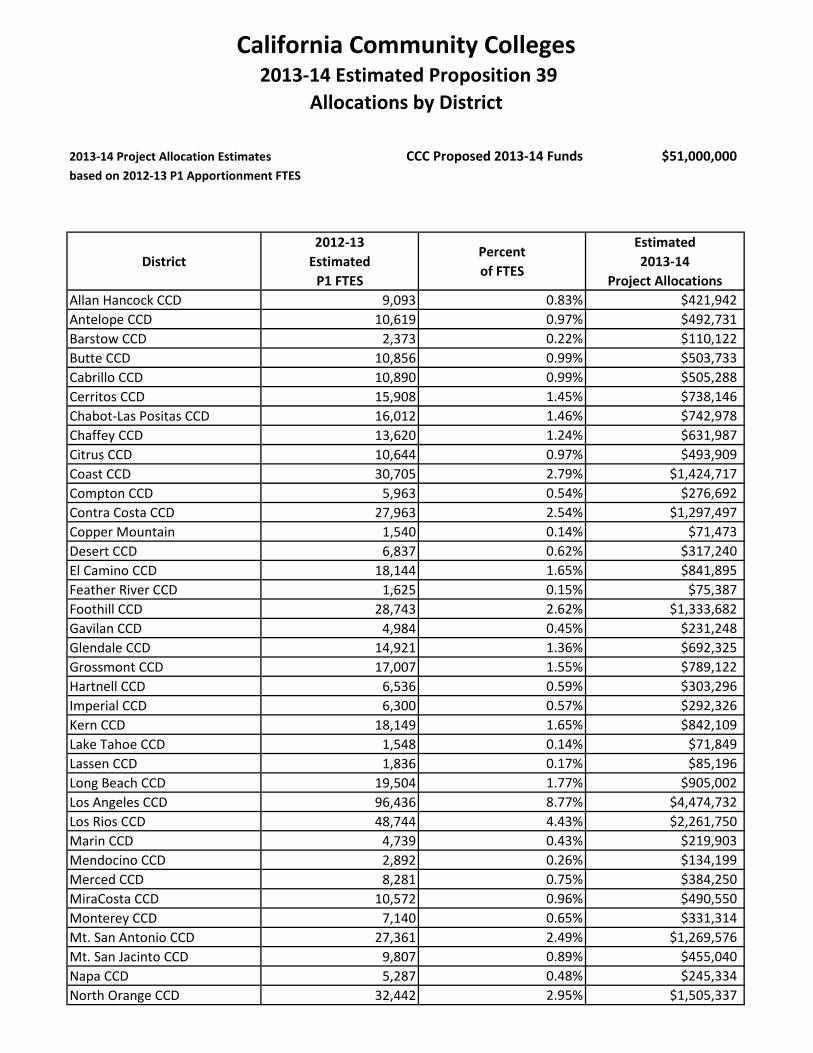
California Community Colleges 2013-14 Estimated Proposition 39
Allocations by District
2013-14 Project Allocation Estimates CCC Proposed 2013-14 Funds $51,000,000based on 2012-13 P1 Apportionment FTES
District2012-13
EstimatedP1 FTES
Percentof FTES
Estimated2013-14
Project AllocationsAllan Hancock CCD 9,093 0.83% $421,942Antelope CCD 10,619 0.97% $492,731Barstow CCD 2,373 0.22% $110,122Butte CCD 10,856 0.99% $503,733Cabrillo CCD 10,890 0.99% $505,288Cerritos CCD 15,908 1.45% $738,146Chabot-Las Positas CCD 16,012 1.46% $742,978Chaffey CCD 13,620 1.24% $631,987Citrus CCD 10,644 0.97% $493,909Coast CCD 30,705 2.79% $1,424,717Compton CCD 5,963 0.54% $276,692Contra Costa CCD 27,963 2.54% $1,297,497Copper Mountain 1,540 0.14% $71,473Desert CCD 6,837 0.62% $317,240El Camino CCD 18,144 1.65% $841,895Feather River CCD 1,625 0.15% $75,387Foothill CCD 28,743 2.62% $1,333,682Gavilan CCD 4,984 0.45% $231,248Glendale CCD 14,921 1.36% $692,325Grossmont CCD 17,007 1.55% $789,122Hartnell CCD 6,536 0.59% $303,296Imperial CCD 6,300 0.57% $292,326Kern CCD 18,149 1.65% $842,109Lake Tahoe CCD 1,548 0.14% $71,849Lassen CCD 1,836 0.17% $85,196Long Beach CCD 19,504 1.77% $905,002Los Angeles CCD 96,436 8.77% $4,474,732Los Rios CCD 48,744 4.43% $2,261,750Marin CCD 4,739 0.43% $219,903Mendocino CCD 2,892 0.26% $134,199Merced CCD 8,281 0.75% $384,250MiraCosta CCD 10,572 0.96% $490,550Monterey CCD 7,140 0.65% $331,314Mt. San Antonio CCD 27,361 2.49% $1,269,576Mt. San Jacinto CCD 9,807 0.89% $455,040Napa CCD 5,287 0.48% $245,334North Orange CCD 32,442 2.95% $1,505,337

California Community Colleges 2013-14 Estimated Proposition 39
Allocations by District
2013-14 Project Allocation Estimates CCC Proposed 2013-14 Funds $51,000,000based on 2012-13 P1 Apportionment FTES
District2012-13
EstimatedP1 FTES
Percentof FTES
Estimated2013-14
Project AllocationsOhlone CCD 7,743 0.70% $359,265Palo Verde CCD 1,620 0.15% $75,172Palomar CCD 18,486 1.68% $857,750Pasadena CCD 17,980 1.64% $834,285Peralta CCD 18,220 1.66% $845,425Rancho Santiago CCD 28,495 2.59% $1,322,177Redwoods CCD 4,313 0.39% $200,104Rio Hondo CCD 12,218 1.11% $566,931Riverside CCD 25,071 2.28% $1,163,306San Bernardino CCD 13,183 1.20% $611,704San Diego CCD 38,609 3.51% $1,791,486San Francisco CCD 32,618 2.97% $1,513,496San Joaquin Delta CCD 14,870 1.35% $689,989San Jose CCD 14,063 1.28% $652,537San Luis Obispo CCD 8,692 0.79% $403,328San Mateo CCD 19,871 1.81% $922,021Santa Barbara CCD 14,021 1.28% $650,565Santa Clarita CCD 14,109 1.28% $654,673Santa Monica CCD 20,605 1.87% $956,113Sequoias CCD 8,365 0.76% $388,128Shasta Tehama CCD 7,231 0.66% $335,542Sierra CCD 14,551 1.32% $675,171Siskiyous CCD 2,161 0.20% $100,290Solano CCD 8,541 0.78% $396,326Sonoma CCD 18,583 1.69% $862,271South Orange County CCD 27,818 2.53% $1,290,760Southwestern CCD 14,731 1.34% $683,554State Center CCD 25,540 2.32% $1,185,073Ventura CCD 24,686 2.25% $1,145,467Victor Valley CCD 8,977 0.82% $416,555West Hills CCD 4,615 0.42% $214,124West Kern CCD 2,580 0.23% $119,724West Valley CCD 16,266 1.48% $754,764Yosemite CCD 16,124 1.47% $748,178Yuba CCD 7,540 0.69% $349,868TOTALS 1,099,117 100.00% $51,000,000

APPENDICES B-1
PROPOSITION 39: CLEAN ENERGY JOBS ACT OF 2012
APPENDIX B SUSTAINABILITY TEMPLATE – ENERGY PROJECT EXCERPT


California Community Colleges
Sustainability Plan Guidebook Energy Programs Excerpt
for
Proposition 39 Implementation
Prepared by: Newcomb | Anderson | McCormick
March 2013

2
CCC SUSTANABILITY TEMPLATE IMPLEMENTATION PROGRAMS AND PROJECTS ENERGY EXCERPT FOR PROPOSITION 39 IMPLEMENTATION This document is an excerpt of the California Community Colleges Sustainability Template and describes the different programs and projects that can be implemented in the areas of Energy Efficiency, Facilities Operation, Sustainable Building Practices, and On‐site Generation and Renewable Energy. This excerpt is intended to be a resource to CCC Districts in identifying qualified projects for Proposition 39 funding. It is also intended to be an element of the Proposition 39 Guidance for Qualified Projects currently under development by the Chancellor’s Office. This list should be a starting point for planning, and individual Districts are encouraged to select those elements that meet the goals and priorities of their District. This list is not all‐inclusive, and Districts are encouraged to think innovatively to identify projects that may not have been addressed here but suit the District’s unique circumstances and needs. However, Districts should filter, prioritize, and select programs and projects for implementation that best meet their goals while taking into account the budget and resource constraints of the campus. The programs and projects listed in this section are grouped into the subsections indicated below:
7.1 Energy Efficiency 7.2 Facilities Operation 7.3 Sustainable Building Practices 7.4 On‐Site Generation and Renewable Energy
The details of each category are described in the following pages. In addition, a listing of external resources is provided that could be helpful to Districts for the implementation of energy projects.

3
1.1 ENERGY EFFICIENCY
1.1.1 PROGRAM GOALS Energy efficiency is one of the most cost effective ways to reduce District energy use and its carbon footprint. When implemented properly, efficiency measures can decrease energy use without compromising comfort and can improve indoor air quality and enhance student, faculty, and staff performance. Energy efficiency should be a higher priority than renewable energy due to more favorable economics and to avoid over‐sizing renewable energy systems. The chart below illustrates a comparison of the cost effectiveness of energy efficiency to power generation.
These costs do not account for externalities, such as health costs, pollution costs, and costs incurred from environmental damage and cleanup.

4
1.1.2 IMPLEMENTATION PROGRAMS AND PROJECTS The following Energy Efficiency Implementation Programs and Projects should be considered by the District. 1.1.2.1 Set Energy Efficiency Goals
Establish energy use reduction goals for the District or campus. These goals should be to reduce energy use above and beyond what is required by the California Title 24 Energy Code and can be set by each campus based on their desires and capabilities. For example, goals could be set to exceed Title 24 by at least 20% for new construction projects. All major renovation projects could strive to reduce existing energy use by at least 10% or to exceed Title 24 Standards by at least 10%. See Section 5 for more details about setting appropriate goals.
1.1.2.2 Evaluate Mechanisms for the Implementation of Energy Efficiency Projects
Evaluate various mechanisms for the identification and implementation of energy efficiency projects and programs, including the use of in‐house staff, engineering consultants, contractors, and performance contracting vehicles through Energy Service Companies (ESCOs).
1.1.2.3 Conduct a Facility Prioritization Survey
Conduct a prioritization survey of all facilities managed by the District. The surveys can be used to establish priorities for conducting comprehensive facility energy audits. Buildings should be prioritized based on energy use intensity (EUI) (i.e. electricity and natural gas use per gross square foot per year), with buildings with the highest energy use intensity given highest priority. Where metered data does not exist, those buildings that are believed to be high energy users by District staff should be targeted first. Complex buildings such as those with laboratory fume hoods are often good candidates for energy savings. The surveys should include leased facilities to the extent practicable and to the extent that the recommendations of such surveys and audits can be implemented under the terms of the lease.
1.1.2.4 Conduct Comprehensive Facility Energy Audits
An Energy Efficiency auditing plan should consist of the following elements: 1. The District should develop and begin implementing a long term plan to conduct or obtain
comprehensive facility energy audits, which can be based on prioritization surveys. 2. The District should conduct energy audits for approximately 20% of their facilities each
year, beginning within 6 months of the establishment of the District’s Sustainability Plan. This can be carried out either independently using public agency resources, through Energy Savings Performance Contracts, state programs such as the California Energy Commission Technical Assistance program, or utility energy‐efficiency service contracts.
5
3. Comprehensive audits of facilities performed within the last 3 years may be considered current for the purposes of implementation.
4. “No‐cost” audits should be utilized to the extent practicable. 5. The level of details and energy savings calculations should be that of an ASHRAE Level II
audit. An ASHRAE Level II audit includes an analysis of energy use at a facility and identifies no‐cost, low‐cost and capital improvement energy efficiency measures with detailed energy and financial calculations.
1.1.2.5 Implement New and Existing Audit Recommendations
Within 90 days of the completion of the comprehensive facility audit of each facility, the District should begin implementing cost‐effective recommendations for installation of energy efficiency and renewable energy technologies. The District should also do the same for energy audits of facilities performed within the past 3 years. In making decisions about investments in energy efficiency and renewable energy projects, the District should use life‐cycle cost analyses, targeting projects with low and no additional life cycle costs first. Savings from low and no‐cost measures can be used to support projects requiring more capital investment. Where appropriate, the District should consider the life‐cycle costs of combinations of projects, particularly to encourage the bundling of energy efficiency projects with renewable energy projects.
1.1.2.6 Implement Ongoing Energy Monitoring
For campus facilities believed to be major energy users, which are likely to be the larger buildings on campus or those with technical areas like laboratories and shops, the District should install permanent meters on all energy inputs (e.g. electricity, natural gas, chilled water, hot water) to allow for continuous energy monitoring and evaluation of the impact of efficiency projects. If a central plant system is installed at the campus, the District should include metering and monitoring of hot and chilled water circulation from the plant as appropriate. Metering should be connected to energy management systems (EMS) to aid in the monitoring and analysis of energy use.
1.1.2.7 Participate in Demand Response (DR) Programs
Participate in all utility offered Demand Response (DR) programs and pursue incentives offered by these programs, where appropriate. For more information on utility demand response programs go to: http://www.cpuc.ca.gov/PUC/energy/Demand+Response/ or contact your utility Account Manager.
1.1.2.8 Identify and Take Advantage of Grant and Incentive Programs
Identify and take advantage of all grant and incentive programs available for energy efficiency and conservation projects, including the Community College Energy and Sustainability Policy incentive of 2% for new construction and 3% for modernization projects. The District should strive to be an active participant in the CCC/IOU Energy Efficiency Partnership program, which

6
offers monetary incentives for energy savings. See Section 6 for more details on funding opportunities.
1.1.2.9 Energy Efficient Equipment Purchase and utilize energy efficient equipment whenever possible. Employ the following strategies to accomplish this goal.
1.1.2.9.1 Establish an Energy Efficiency Purchasing Policy
Establish a District‐wide policy for all purchases of energy‐using equipment, stipulating where life‐cycle cost‐effective, energy efficient products will be selected. Products with an ENERGY STAR® label are certified to not only be energy efficient but to also have a reasonable payback period, and ENERGY STAR® labeled equipment should be purchased whenever available. For product groups where ENERGY STAR® labels are not yet available, the District should select products that are in the upper 25% of energy efficiency for their respective product categories. The District should incorporate energy efficient criteria consistent with ENERGY STAR® and other designated energy efficiency levels into all guide specifications and project specifications developed for new construction and renovation, as well as into product specification language developed for Basic Ordering Agreements, Blanket Purchasing Agreements, and all other purchasing procedures.
1.1.2.9.2 Efficient Lighting and Lighting Controls
Install current generation of energy efficient lighting and lighting controls for interior and exterior applications. Energy efficient lighting technologies include low‐wattage linear fluorescent lights, compact fluorescent lights, LEDs, and induction lighting. Examples of lighting controls include occupancy sensors, photocell installations for turning off lights when there is enough daylight, and time clocks for scheduling lights on and off automatically.
1.1.2.9.3 Install Energy Efficient HVAC Systems
In addition to buying energy efficient air conditioners, chillers, and boilers, the District should further increase the energy efficiency of their HVAC systems by pursuing the following measures. Install Economizers Air‐side economizers can be added to allow the use of “free cooling”, which is to use outside air to ventilate the building when outside air temperatures are favorable. Air‐side economizers can be installed on both package units and buildings with central plants. While most Districts do not have central plants, those that do can install waterside economizers to further reduce chiller use.

7
Enhance Control of Equipment Installing variable frequency drives (VFDs), also known as variable speed drives (VSDs), on HVAC fans and pumps can save a significant amount of energy, as fans and pumps use more energy at higher speeds. VFDs are most effective when incorporated into an EMS for better control but can also be locally controlled if needed. Managing Plug Loads “Plug Loads” are energy consuming equipment that draws electricity from a wall socket. Examples of plug loads include computers, printers, refrigerators, and space heaters. Manage plug loads by activating any energy saving features on your plug load equipment and by using occupancy sensor plug load shut‐off devices, such as occupancy sensed power strips. Appropriately Size Equipment Oversized equipment can waste energy by using more power than needed to meet the need. Ensure that all equipment is sized appropriately for its load or has the ability to ramp down through controls instead of cycling on and off repeatedly when loads are low. Reduce Unnecessary Heat Gain and Loss
Avoid unnecessary cooling and heating by reducing unwanted heat gain or loss. Examples of unwanted heat gains in buildings can be prevented by shading south and west facing windows or by “cool roofing” strategies and painting roofs white. Prevent unwanted heat loss in pools by using pool covers to reduce heat loss from pools, thereby reducing boiler usage. Perform Regular Maintenance on Equipment Effective preventive and regular maintenance programs keep equipment and systems operating optimally and reduce excess energy use. Set up a routine maintenance schedule to ensure proper maintenance is performed. Replace equipment with energy efficient models As old equipment is taken offline, replace it with energy efficient models.

8
1.2 FACILITIES OPERATION
1.2.1 PROGRAM GOALS In addition to installing energy efficient equipment, Districts should strive to operate high‐performing facilities, buildings, and energy infrastructure systems that are optimized for inhabitant comfort, productivity, and energy and resource efficiency.
1.2.2 IMPLEMENTATION PROGRAMS AND PROJECTS The following implementation programs should be considered by the District to meet this goal: 1.2.2.1 Encourage and Support Energy Efficiency Training of Staff
Districts should encourage campus staff to become trained in energy efficiency and offer support by paying for certification and class fees. Staff can take classes at the IOU energy centers or go through Building Operator certification, a nationally recognized program. For more information, visit: http://www.theboc.info
1.2.2.2 Install Energy Management Systems
Maximize use of computerized EMS to provide centralized reporting and control of campus energy related activities. The campus staff should strive to achieve optimum efficiency in the use of natural gas, electricity, or other energy resources to meet the heating, cooling, and lighting needs of the buildings and/or facilities. Except for areas requiring special operating conditions, such as electronic data processing facilities, or other scientifically critical areas, where rigid temperature controls are required, building and/or facility temperatures should be controlled to fluctuate between the limits stated below.
1.2.2.3 Adjust Temperature Set Points and Schedule Operating Times
Avoid overcooling and overheating by raising cooling temperature set points and lowering heating temperature set points. If there is a central plant on campus to meet the heating and cooling needs, implementing supply air temperature resets, chilled water and hot water resets, and chilled water and hot water set point changes can help avoid wasting energy during milder weather. Districts should heat buildings at or below 68°F and cool facilities at or above 78°F in order to avoid excess heating and cooling. In order to avoid unnecessary heat loss, domestic hot water temperatures should not be set above 120°F. These limits will not apply in areas where other temperature settings are required by law or by specialized needs of equipment or scientific experimentation.

9
1.2.2.4 Optimize Building Occupancy Scheduling
Scheduling of building and/or facility usage should be optimized consistent with the approved academic and non‐academic programs to reduce the number of buildings operating at partial or low occupancy. To the extent possible, academic and non‐academic programs should be consolidated in a manner to achieve the highest building utilization. Furthermore, the scheduling of buildings should be implemented in a manner to promote individual building air conditioning system shutdown to the greatest extent possible during the weekend and other holiday periods. If possible, four day workweeks and class schedules can also be utilized to reduce energy use in buildings. Campus staff should make all attempts to change or update building operating schedules to match the changes in the academic programs on a continuing basis.
1.2.2.5 Optimize HVAC Equipment Scheduling
All air conditioning equipment, including supply and return air fans, should be shut off on weekends, holidays, and for varying periods each night, except where it would adversely affect instruction, electronic data processing installations, or other scientifically‐critical or 24‐hour operations. Avoid cooling and heating spaces when unnecessary. This can be done by scheduling HVAC systems off during unoccupied times while implementing a pre‐cooling strategy to cool the building in the early hours of the morning before outside temperatures heat up. If there is a central plant on campus, scheduling lockouts for chillers and boilers can be used to avoid running this equipment when unneeded.
1.2.2.6 Activate Energy‐saving Features for Appliances and Computers
Activate energy‐saving features on all appliances and computer equipment, for example, power‐saving modes on PCs, copiers, printers, and other office equipment. Install server and desktop virtualization and PC power management systems to reduce computer energy use.
1.2.2.7 Pursue Monitoring‐Based Commissioning (MBCx)/Retro‐commissioning (RCx)
For buildings or central plant systems that are determined to be high energy users, the District should install whole‐building energy metering and a Monitoring‐based Commissioning (MBCx) process should be implemented. Monitoring‐based Commissioning is a process that optimizes building performance for comfort and energy use. Retrocommissioning (RCx) is a process that identifies individual energy efficiency projects to improve the control of the system to reduce energy use. For more information about MBCx and RCx go to: http://www.cccutilitypartnership.com

10
1.3 SUSTAINABLE BUILDING PRACTICES
1.3.1 PROGRAM GOALS Construction and renovation of new and existing facilities provides a significant opportunity to reduce the environmental impacts of the built environment through sustainable building practices. The District should incorporate energy and resource efficient “Green Building” practices in the design and construction of all new and renovated facilities.
1.3.2 IMPLEMENTATION PROGRAMS AND PROJECTS The following implementation programs should be considered by the District to meet this goal: 1.3.2.1 Establish a Green Building Standard
Green Building Standards for new construction and renovation projects should be adopted based on Best Practices, industry standards, professional organizations, or other institutions of higher learning (UC, CSU, or CCC). All new construction and major remodeling projects should be designed to achieve at least a U.S. Green Building Council Leadership in Energy and Environmental Design (LEED) Silver rating or equivalent performance. For more information about LEED ratings, visit http://www.usgbc.org/DisplayPage.aspx?CMSPageID=222
1.3.2.2 Implement Sustainable Design Practices
All District new construction, renovation, maintenance, and repair projects should be designed with consideration of optimum energy utilization, low life cycle operating costs, and compliance with the District’s goals and all applicable energy codes and regulations. Energy efficient and sustainable design should be addressed early in the project planning and design phases to maximize cost effectiveness and should be considered in balance with the academic program needs of the project. The following elements should be considered in the design of all buildings for the District:
Siting and design considerations that optimize local geographic features to improve sustainability of the project, such as proximity to public transportation, consideration of microclimates, and passive or active solar energy opportunities
Durable systems and finishes with long life cycles that minimize maintenance and replacement
Optimization of layout and design of spaces to accommodate reconfiguration, with the expectation that the facility should be renovated and re‐used (versus demolished)
Systems designed for optimization of energy, water, and other natural resources
Designed to maximize natural daylighting and ventilation
Optimization of indoor environmental quality for occupants
Utilization of environmentally preferable products and processes, such as recycled content materials and recyclable materials
Procedures that monitor, trend, and report operational performance

11
Space should be provided in each building to support an active program for recycling and reuse of materials
Design outdoor spaces to minimize parking lots, use permeable pavement, and avoid blacktopping pavement and plant trees to shade parking lots to prevent the heat island effect. Utilize sustainable landscaping practices
Any energy‐using equipment acquired for the furnishing of new and renovated buildings should be ENERGY STAR® rated or equivalent in accordance with the purchasing policy adopted by the District
For more green building resources, visit http://campusgreenbuilder.org
1.3.2.3 Use an Integrated Systems Approach in Building Design
Sustainable building goals should be evaluated in a cost effective manner by identifying economic and environmental performance criteria, evaluating life cycle savings, and adopting an integrated systems approach. Such an approach treats the entire building as one system and recognizes that individual building features, such as lighting, windows, heating and cooling systems, should be evaluated and designed as interactive systems.
1.3.2.4 Hire Sustainable Building Design Professionals
The District should consider utilizing architectural firms, consultants, and energy engineers experienced in all phases of the sustainable building design process to assist in constructing energy and resource efficient buildings. The District should take advantage of the IOU‐provided energy efficiency new construction design programs, such as Savings by Design.
1.3.2.5 Commission New Buildings
All new buildings should be commissioned after construction to ensure that systems were installed and operating as designed. Individual systems should also be commissioned to ensure that they run as efficiently as possible.
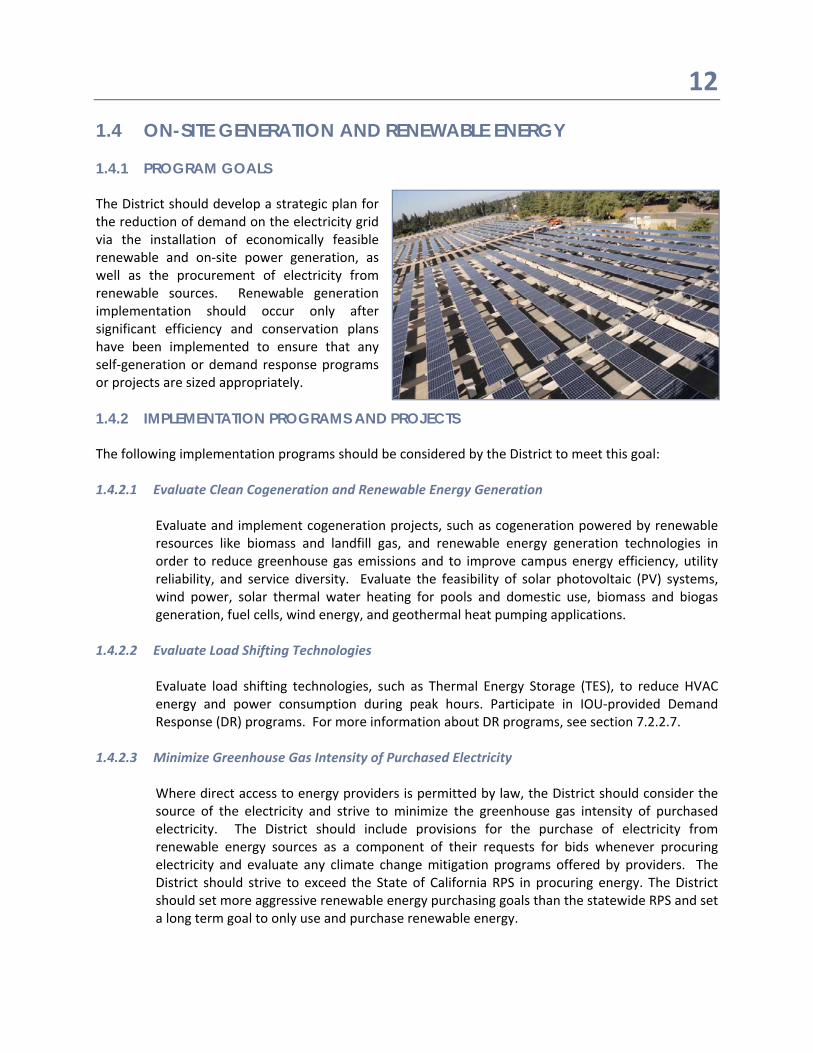
12
1.4 ON-SITE GENERATION AND RENEWABLE ENERGY
1.4.1 PROGRAM GOALS The District should develop a strategic plan for the reduction of demand on the electricity grid via the installation of economically feasible renewable and on‐site power generation, as well as the procurement of electricity from renewable sources. Renewable generation implementation should occur only after significant efficiency and conservation plans have been implemented to ensure that any self‐generation or demand response programs or projects are sized appropriately.
1.4.2 IMPLEMENTATION PROGRAMS AND PROJECTS The following implementation programs should be considered by the District to meet this goal: 1.4.2.1 Evaluate Clean Cogeneration and Renewable Energy Generation
Evaluate and implement cogeneration projects, such as cogeneration powered by renewable resources like biomass and landfill gas, and renewable energy generation technologies in order to reduce greenhouse gas emissions and to improve campus energy efficiency, utility reliability, and service diversity. Evaluate the feasibility of solar photovoltaic (PV) systems, wind power, solar thermal water heating for pools and domestic use, biomass and biogas generation, fuel cells, wind energy, and geothermal heat pumping applications.
1.4.2.2 Evaluate Load Shifting Technologies
Evaluate load shifting technologies, such as Thermal Energy Storage (TES), to reduce HVAC energy and power consumption during peak hours. Participate in IOU‐provided Demand Response (DR) programs. For more information about DR programs, see section 7.2.2.7.
1.4.2.3 Minimize Greenhouse Gas Intensity of Purchased Electricity
Where direct access to energy providers is permitted by law, the District should consider the source of the electricity and strive to minimize the greenhouse gas intensity of purchased electricity. The District should include provisions for the purchase of electricity from renewable energy sources as a component of their requests for bids whenever procuring electricity and evaluate any climate change mitigation programs offered by providers. The District should strive to exceed the State of California RPS in procuring energy. The District should set more aggressive renewable energy purchasing goals than the statewide RPS and set a long term goal to only use and purchase renewable energy.

13
1.4.2.4 Evaluate Participation in Community Choice Aggregation
Evaluate participation in Community Choice Aggregation (CCA) efforts if available with the District’s local city and/or county. CCA permits public agencies to aggregate the electric loads of residents, businesses, and facilities to facilitate the purchase and sale of electrical energy. CCA Programs usually have higher RPS than the investor owned utilities. For example, CleanPowerSF, the San Francisco CCA Program, aims to be 51% renewable energy by 2017, which is almost double the statewide RPS of 33% renewable energy generation. For the CCA Programs currently available, visit: http://www.cpuc.ca.gov/PUC/energy/Retail+Electric+Markets+and+Finance/070430_ccaggregation.htm Many other cities and counties are currently evaluating the feasibility of a CCA program.
1.4.2.5 Identify and Take Advantage of Grant and Incentive Programs
Identify and take advantage of all grant and incentive programs available for self generation or renewable energy through the local utilities. See Section 6: Economics of Sustainability for more details.
APPENDICES C‐1
PROPOSITION 39: CLEAN ENERGY JOBS ACT OF 2012
APPENDIX C CAMPUS PROJECT IDENTIFICATION AND PRIORITIZATION WORKSHEET


5/10/2013 Page 1 of 1
Possible Points Campus Score
15 #DIV/0!
15 #DIV/0!
Possible Points Campus Score
155
105555555555
10
101515
Max Possible Campus Score
160 #DIV/0!
MBCx Screening Audit
Central Plant Audit
- kWh/yr 9%Avoided Annual Cost
-$
- th/yr 7%Avoided Annual Cost
-$
CCC/IOU Energy Efficiency Partnership Screening Audit and Prioritization for EE Services
Please provide basic campus information in grey boxes below, select applicable IOU from drop down boxes. Please fill in green shaded boxes according to information obtained from campus site visits and interviews with site personnel, white boxes auto-populate.
Customer InformationDistrict:Campus:Facility Address:City: Zip:Primary Facility Contact: Office:
IOU Representative: Office:Email: Cell:
Email: Cell:
IOU Territory Elec: IOU Territory Gas:
Year ConstructedYears Since Last Major Renovation
Annual Electricity Use (kWh)
Campus Energy Usage HistoryScreening Audit DateCampus SF
Site Gas Use Index (th/yr-sf) #DIV/0!NAM CCC Utility Data Average (th/yr-sf) 0.37
Campus Screening
Active New Construction / Rehab Bond Program Please Select From Drop-Down
Annual Natural Gas Use (Therms)
Site Electricity Use Index (kWh/yr-sf) #DIV/0!NAM CCC Utility Data Average (kWh/yr-sf) 11.33
IT Project Opportunities Please Select From Drop-DownEmerging Technologies Opportunities Please Select From Drop-DownHVAC Upgrade Opportunities Please Select From Drop-Down
Active New Construction Projects Currently in SBD / NCP Please Select From Drop-DownFunded Active Scheduled Maintenance Program Please Select From Drop-DownCentral Plant Opportunities Please Select From Drop-Down
Any Previous Commissioning on Campus Please Select From Drop-DownKnown Campus / Building Energy Problems Please Select From Drop-DownRelationship with Engineers / Arch / Contractors Please Select From Drop-Down
Lighting Upgrade Opportunities Please Select From Drop-DownEMS/DDC Controls or Upgrade Opportunities Please Select From Drop-DownMBCx Candidate Buildings Please Select From Drop-Down
Campus Commitment to Energy Efficiency Please Select From Drop-Down
Score Results
Notes:Please use this section to provide additional details regarding the campus and/or potential EE projects:
Potential Project Development Strategies
Strategic Energy Plan Completed Please Select From Drop-Down
Comprehensive Energy Audit / Green House Gas Reduction Strategy Completed Please Select From Drop-DownEnergy Efficiency Funding Source Please Select From Drop-Down
Forecasted Potential Savings
Electricity Forecasted Potential Savings are estimated using IOU territory specific forecasted potential energy savings from previous CCC-IOU analysis. These estimates are only rough figures of potential savings and should
not be used for any other purpose.Natural Gas
Drop down boxes above have not been selected, please revise
Bond Program EE Project DevelopmentSavings by Design / New
ConstructionStrategic Energy Plan
Targeted Energy Audit / Application
SDG&E SDG&E
Prioritization Tool.xlsm, CCC Review Newcomb | Anderson | McCormick

APPENDICES D‐1
PROPOSITION 39: CLEAN ENERGY JOBS ACT OF 2012
APPENDIX D FUNCTIONAL SPECIFICATIONS FOR SYSTEM-WIDE ENTERPRISE ENERGY INFORMATION SYSTEMS


CCC EIS FS DRAFT v2.docx Page 1 of 4 Newcomb | Anderson | McCormick
California Community Colleges
Enterprise Energy Information System
DRAFT Functional Specification
April 9, 2013
The California Community Colleges (CCC) have a continual need to operate with higher energy efficiency
and lower energy costs. The Chancellor’s Office is advocating a facility energy strategy that employs
technology to reduce system‐wide costs. One building block of such a strategy is comprehensive,
accurate data on facility energy use and cost. This requires a standard information structure for use in
measuring, managing and reporting campus energy use and energy program performance. This data
structure, known as the Enterprise Energy Information System, will ensure that timely, accurate energy
data is available to energy managers at every level in the college system.
Today’s relative ease of automatically collecting and manipulating large streams of accurate energy use
data will shed a whole new light on campus energy efficiency throughout the state. This will highlight
the most and least efficient campuses and track the performance metrics accurately over the years as
the campuses drive energy use down and renewable production up.
The CCC’s Enterprise Energy Information System (EEIS) will be web based, with each district or campus
having access to only its energy use, while the Chancellor’s Office will have access to data for each
district. The database will contain standardized data for each campus, such as the square footage of
buildings served by each meter and the student population. The website will also collect weather data
monthly to allow calibration of energy use records against historical weather data, as well as changes in
physical plant or student use.
The EEIS for the CCC’s will provide the following capabilities:
Level One: Campus Utility Meter Monthly Energy Use
Capture monthly energy use and expenses for all purchased utilities. This includes purchased electricity
and natural gas at all main utility meters. This also includes renewable energy generated by the campus
as well as renewable energy purchased through Power Purchase Agreements. The energy use will be
rolled into an Energy Use Index for each campus, combining purchased electricity and gas, with
generated renewable energy to show how many site and source Btu’s the campus uses per square foot
each year, the standard efficiency metric.
Each campus will be able to track its own energy use over time on a meter by meter basis with a reliable,
long term standardized method. The energy use will be calibrated against the area of buildings served,
the student population, and the local weather. Energy use trends will be clearly displayed, as well as a
record of energy costs over time.
This allows the basic benchmarking of the campus energy use against published metrics, such as the
California Commercial End Use Survey (CEUS) and the federal Commercial Building Energy Consumption

CCC EIS FS DRAFT v2.docx Page 2 of 4 Newcomb | Anderson | McCormick
Survey (CBECS). Energy use data will be automatically uploaded every month to Energy Star Portfolio
Manager for ongoing tracking of each campus.
The website will also to display the portion of its energy use which is generated by renewable resources
at each campus, as well as the portion of cogenerated electricity and heat. The website will track
accurate monthly data on CO2 emissions based on energy purchase records. The campus can present
this performance in a dashboard feature that automatically updates performance metrics monthly.
Each district will be able to see this data for each college as well as a roll up for the district of the total
utility bill spend and CO2 emissions each month. The district will be able to compare the relative
performance of each of its campuses in achieving energy and emissions goals.
The Chancellor’s Office will have access to all of the data to create an accurate and timely measure of
energy use by all of the campuses throughout the system every month. Each district and campus can be
tracked against its own historical performance, adjusted for growth and weather differences, as well as
compared with the performance of all other districts and campuses.
Level Two: Building Meter Monthly Energy Use
In addition to the campus energy use the EEIS will capture monthly building submetered energy use for
the largest and most energy intensive buildings on campus. This will be done through the use of existing
submeters, or the addition of energy meters as needed, typically electricity and natural gas. If there are
significant users of chilled water or hot water from central plants, these will be metered as well, along
with the inputs and outputs of the central plants. This will allow a direct calculation of the central plant
efficiency and the campus distribution system losses.
This energy monitoring represents a subset of the energy use already being reported for the campus as
a whole. Meters will be added until approximately 90% of each energy stream is submetered. This
energy use will also be calibrated against actual weather conditions and building use to give a valid year
to year comparison.
Each campus will be able to track the energy use of its main buildings with these submeters and
automated data collection. This monthly data will be used to track the performance of individual
buildings over months and years. This will be particularly helpful to measure the impact of energy
efficiency projects within a building and the persistence of the energy savings over time. Campuses can
choose to install whole building sub metering as a part of a Monitoring Based Commissioning (MBCx)
project for that building and qualify for Partnership incentives based on measured savings. The MBCx
application must be submitted before the meters are purchased to qualify for an incentive.
The campuses and districts will compare the energy use of different buildings with the same functions
against each other, as well as against national building performance data, such as the Energy Star
Portfolio Manager for specific types of buildings.

CCC EIS FS DRAFT v2.docx Page 3 of 4 Newcomb | Anderson | McCormick
Information which is collected on a building by building basis can assist the campus in understanding the
energy use characteristics of different buildings and departments, allowing cost allocation as desired.
Energy Information Systems typically also include processes for reviewing and paying utility bills.
The Chancellor’s Office will have access to all of the building submeter data, allowing comparison of
building energy intensity across the full spectrum of CCC buildings in the state. This data can be shared
with the Districts and Campuses as performance metrics for direct apples to apples comparisons, either
through direct access to all data, or through a process which keeps the identity of individual buildings
hidden.
Level Three: Hourly Energy Use Monitoring
The expansion from monthly energy use data to hourly energy use data collection will significantly
increase the functionality of the energy use profiles and the capacities of the campuses to manage
energy use more effectively. Hourly data will be used to evaluate building load profiles to identify how
the buildings contribute to the campus peak demand, how effectively the buildings are shut down nights
and weekends, and how the morning and evening shoulders are programmed.
The availability of real time electric load profile information at the buildings will also allow the campus
to make immediate adjustments to peak demand load profiles and demand response requests.
Ultimately multiple electrical meters will be employed on subsystems within the building to meet LEED
and other program requirements. This will allow the energy use to be more accurately allocated to the
plug loads vs. building HVAC and lighting loads. The campuses will identify where load growth is
occurring and be able to focus directly on the problem areas.
Keys to this system include the following:
Automated Data Collection
Manual data collection and input is time consuming and susceptible to human error. Dealing with the
hundreds of energy meters monthly can only be done efficiently through an automated data collection
process. This information is typically available from the utility in an electronic format that can be
automatically imported. This collection and management of billing data can also be used to record and
pay bills for the campus.
Structured Energy Data Requirements
Each utility and campus uses a different IT solution to collect facility energy data and there is no method
to correlate standard information. One of the most essential functions of the EEIS capability is to
structure standard data collected from different sources. This allows the data to be collected once and
be subsequently used many times in multiple locations, without diminished quality or additional work
load.
Advance Analytic Capability

CCC EIS FS DRAFT v2.docx Page 4 of 4 Newcomb | Anderson | McCormick
Because the EEIS will house comprehensive, verified, standard energy data, end users will be able to
generate highly customized and dynamic queries based on information updated monthly or hourly. This
advanced analytic capability allows energy professionals to understand facility energy use, to pinpoint
anomalies, to track trends, to benchmark buildings and campuses, measure savings from implemented
projects and to identify additional savings opportunities.
System Architecture
The Enterprise Energy Information System will be a web based database with access through password
by all campuses, districts and the Chancellor’s Office. The database will both produce standard reports
and allow queries of all information a user has access to.
Information about metered energy use at the campuses and buildings will enter the database through a
number of paths:
Direct upload from Utility billing system monthly
Direct upload from Utility load profile tracking (next day)
Manual input from Utility bills monthly
Direct upload from campus Energy Information System or Energy Management System in real
time
Manual input from campus meter readings monthly
Direct upload from Utility load profile tracking in real time (future)
The contracts will be structured so that the CCC will always own the data collected in the data base so
should a change of operator occur in the future, the energy use records will be secure.
Incentives
The metering and data collection portions of this project can be part of MBCx projects, which qualify for
Partnership incentives. Other portions of the project may be closer to RCx projects, which are being
piloted now with the CCCs.
In some cases in the past whole campus metering has been used to determine MBCx energy savings
from campus wide controls projects. The EEIS project may coincide with campus wide projects in the
future, raising the possibility of using it to measure campus wide savings.

APPENDICES E‐1
PROPOSITION 39: CLEAN ENERGY JOBS ACT OF 2012
APPENDIX E FUNCTIONAL GUIDELINES FOR BUILDING MANAGEMENT SYSTEMS

CCC BMS FG DRAFT v2.docx Page 1 of 3 Newcomb | Anderson | McCormick
California Community Colleges
Building Management System Standard Procurement
DRAFT Functional Guideline
April 9, 2013
The California Community Colleges (CCC) have a continual need to operate with higher efficiency and
lower energy costs. The Chancellor’s Office is pursuing an aggressive facility energy strategy to reduce
energy use and costs at campuses throughout the state. The Building Management Systems that
schedule and control HVAC and lighting systems at each campus are a key tool in this effort. Their first
purpose is to control temperature, air flow and light levels to meet code requirements and keep the
building occupants comfortable and safe, but the BMSs play a major role in controlling energy use at the
campus. Meeting the building requirements while using the least amount of energy is a complex and
ongoing effort made possible through today’s powerful control systems.
Standard Guideline Benefits
The CCC Standard BMS Guideline will cover the basics of an open architecture control system to bring
new building or retrofit control systems into compliance with industry standards for interoperability.
This will help prevent colleges from committing to proprietary control systems, locking themselves into
years of sole source maintenance, programming and parts, while creating silos of different control
systems in different campus buildings that cannot communicate with each other.
The open architecture systems installed in new buildings or retrofit projects will be tied to new front
ends that can also communicate with the legacy control systems through standard protocols or product
specific gateways. Over time as control systems are replaced, new systems will operate with open
protocols, allowing conversion of the campus to one integrated control system without proprietary
system limitations. The new BMSs will have full DDC capability for control, energy use optimization ,
reporting, communications, monitoring and trending.
Background
Some campus buildings have state of the art, direct digital control systems from the air handlers and
plant down to the zone controller. These systems are intelligent and flexible, and communicate with the
plant personnel over fast networks. Others buildings have older controls with less functionality,
communications bandwidth, and effectiveness. Still other buildings have standalone electronic and
pneumatic controllers which require significant hands on operation and provide little capacity for energy
efficient operations.
Building Management Systems have often been installed through a low bid process over a number of
years so that many different manufacturers and generations of equipment may be represented on a
single campus. These control systems are historically proprietary so that they do not talk to each other
or to common front ends. Campuses often have multiple PC front ends to talk to different sets of
buildings, assuming they are lucky enough to have control systems they can talk to remotely.

CCC BMS FG DRAFT v2.docx Page 2 of 3 Newcomb | Anderson | McCormick
Open Protocol Communications
Beginning in the 1990’s much of the controls industry has converted to open protocol BMS utilizing
BACnet , LonWorks and Modbus as communications standards at different levels of control. The
benefits of open communication protocols are significant:
Competitive Bids – Proprietary controls have locked a building or campus into a single vendor so
for service, add ons, expansion to the next building, or a new front end the campus is no longer
at the mercy of one vendor.
Consistent Installation – Open systems that follow standard guidelines will create a uniform
network throughout the campus.
Consistent Maintenance – Maintainers will only have to be trained on one set of diagnostic,
network management and programming tools.
System Integration and operability – Each individual building can be accessed through a single
operator workstation.
Data Acquisition – An open system solution will result in significant data flow which can be used
to evaluate building operation, energy use, occupancy level and other factors to minimize
energy use while meeting campus requirements.
Product Interchangeability – Devices will have consistent network interface, allowing
competition when procuring and programming controls.
Energy Savings
New direct digital BMSs offer a wide spectrum of control sequences designed to meet building
requirements while minimizing energy use. Providing direct digital control down to the zone level
provides significant benefits in optimizing energy use while maintaining comfort. When the controls at
the air handlers understand exactly what the zones need, and when the controls at the central plant
understand exactly what the building air handlers need, optimization of the whole campus mechanical
system becomes feasible.
Demand Response
The implementation of Demand Response strategies at a college campus require a real time
understanding of the campus electrical load (provided by the Energy Information System) and a
understanding of the operation of all of the major buildings at the time the peak load is to be shed. The
installation of direct digital control on zones, air handlers and plant equipment offers the best way to
shed demand and still maintain even comfort conditions throughout the campus. The more extensively
the direct digital BMS reaches into the campus buildings, the more load can be shed for Demand
Response.
Trending
The Guideline will define the type of points to be able to trend, frequency of trending, diagnostics to be
used on the data, and alarming protocols.

CCC BMS FG DRAFT v2.docx Page 3 of 3 Newcomb | Anderson | McCormick
Control Sequences
Control sequences will be recommended for different types of applications to allow global optimization
of processes. These include trim and respond sequences, optimal economizer control, variable primary
chilled water flow, occupancy based operations, and others.
Energy Use Monitoring
Energy use data may be trended by the BMS or by a separate Energy Information System. In either case
it will be integrated into the building operation sequences to provide direct feedback on system
performance.
Training
Recommendations will also include the level of training appropriate for the construction and
commissioning of new control systems which should be required from the vendors.

APPENDICES F‐1
PROPOSITION 39: CLEAN ENERGY JOBS ACT OF 2012
APPENDIX F MBCX GUIDELINES


MBCx Project Guidelines and Minimum Requirements May 2012 v2.docx Page 1 of 24
MBCx Project Guidelines and Minimum Requirements
Monitoring Based Commissioning (MBCx) Program 2010‐2012 Higher Education / Investor Owned Utility (IOU) Partnership Programs
DRAFT May 2012
The Higher Education / IOU Partnership offers incentives for implementing MBCx projects at buildings or central plants at UC, CSU, and CCC campuses. MBCx is a unique combination of whole‐building monitoring and retro‐commissioning. The monitoring supports the retro‐commissioning effort by providing a diagnostic tool, as well as by documenting energy savings in the near term and increasing savings persistence over the long term. Below is an outline of the general MBCx process, with additional details and program requirements listed in subsequent sections. Planning Phase
Hire a Cx agent and/or designate an internal team to identify and implement MBCx projects.
Benchmark campus buildings and identify the best candidates for the MBCx program.
Submit a project application to the Partnership for each project to be implemented.
Investigation Phase
Install all metering, EMS, and EIS components necessary to trend whole‐building energy use.
Collect baseline energy use data (typically 3 months) and calculate annual energy use.
Evaluate building and trend operating points through EMS to identify operational deficiencies and energy efficiency opportunities.
Submit a Baseline Report to the Partnership detailing baseline energy use.
Implementation Phase
Implement identified energy efficiency measures.
Verify proper measure installation and building systems operation through trending.
Collect post‐project energy use data (typically 3 months) and calculate annual energy use.
Reporting Phase
Submit a Final Report to the Partnership detailing which EEMs were implemented, post‐project annual energy use, and annual energy savings (see below for additional requirements).
Train campus staff in the revised operating sequences and functionality of building systems.
Receive an incentive payment based on the amount of energy saved. To participate in the Partnership’s MBCx program, the campus must take either electricity or natural gas service from an IOU (though commodity electricity or gas may be purchased from a supplier other than the IOU). The campus must also commit to implementing all no‐cost and low‐cost measures identified during the MBCx project that it agrees are feasible. Incentives for the MBCx program are one‐time payments of $0.24/ annual kWh and $1.00/annual therm saved, capped at 80% of verified project costs. Although no incentive is paid for peak demand (kW) savings, the Partnership requires that an analysis of peak demand savings be submitted.

MBCx Project Guidelines and Minimum Requirements May 2012 v2.docx Page 2 of 24
Figure 1 ‐ MBCx Process Schedule and Deliverables
Process Step Deliverable
Planning Phase
Hire Cx Agent and/or designate internal MBCx team
Benchmarking / project selection Form C‐1 (mandatory for UC only)
Submit project application Form C
Partnership reviews and approves application
Campus signs Campus Payment (UC/CSU) or Project Agreement (CCC) form
Campus Payment (UC/CSU) or Project Agreement (CCC) form
Investigation Phase
Install whole‐building metering, connect meters to building/campus EMS/EIS
Collect whole‐building trend data (typically 3 months)
Perform building evaluation
Determine baseline annual energy use based on whole‐building energy trends
Submit Baseline Report to Partnership Baseline Report, baseline energy analysis
Partnership reviews and approves baseline analysis
Implementation Phase
Implement identified EEMs
Verify proper EEM implementation
Collect whole‐building trend data (typically 3 months)
Reporting Phase
Determine post‐implementation annual energy use based on whole‐building energy trends
Submit Form E, verifying project completion Form E
Submit Final Report and associated documentation to Partnership
Final Report, post‐MBCx energy analysis, Form D, Cost Documentation, Systems Manual (if applicable)
Perform staff training
Receive incentive payment
Planning Phase Hire a Cx Agent Campuses do not have to hire a Commissioning (Cx) Agent (projects can be performed by in‐house staff), but the Partnership recommends doing so, as Cx Agents will have experience and expertise that most campus staffs do not. Campuses can choose to hire a Cx Agent either before or after the benchmarking process. If the campus has enough information available to them through existing metering or knowledge of current building operations, they may be able to identify good candidates for the MBCx program on their own. Alternatively, a Cx Agent can survey campus buildings and help to identify these candidates.

MBCx Project Guidelines and Minimum Requirements May 2012 v2.docx Page 3 of 24
In most cases, if the campus is planning to hire a Cx Agent, the Partnership will not accept project applications before a contract is in place. This demonstrates a commitment to the project by the campus and helps to ensure project continuity. Benchmarking/Project Selection UC campuses are required to submit the program’s Form C‐1, which identifies the largest campus buildings and their energy use. This benchmarking tool helps to determine priorities for MBCx project implementation. CSU and CCC campuses are not required to submit this form, but are encouraged to use it, or complete some type of formal benchmarking process. Additional guidance for selecting MBCx projects can be found in Attachment 1. A recommended “Project Scoping” approach for CCC campuses is also described in Attachment 1. Project Application The Cx Agent or campus must fill out and submit a project application, also referred to as the Form C. The Form C will contain information on the building’s HVAC systems, current and proposed metering/Energy Management System (EMS)/Energy Information System (EIS), project budget, and estimates of baseline annual energy use. The Form C estimates of baseline energy use can be based on existing building metering, prorated campus energy use, or generic Energy Use Intensity (EUI) values (e.g. California End‐Use Survey (CEUS)). UC and CSU campuses will submit and periodically update a project schedule through the Partnership’s P6 tracking tool. CCC campuses will submit a project schedule within the Form C and should notify the Partnership of changes in project schedules. The Form C is then submitted to the Partnership for approval by the Management Team. It is important that the campus not implement any Energy Efficiency Measures (EEMs) or purchase any equipment prior to Management Team approval. EEMs implemented prior to approval may result in decreased incentives and equipment purchased prior to approval may result in disallowed project costs, which may ultimately lead to a lower incentive, if cost‐capped. Campus Payment/Project Agreement Form Once the Partnership reviews and approves the project application, the campus will sign a project‐specific agreement in which the utility agrees to pay the campus an incentive based on their delivered energy savings. For UC and CSU campuses this form is called the Campus Payment form. For CCC campuses, this form is called the MBCx Project Agreement. Investigation Phase Metering The program requires whole‐building energy use metering. This means that all energy sources (excluding small energy flows, such as gas service only for Bunsen burners or Domestic Hot Water (DHW)) entering and leaving a building or central plant (CP) must be metered. The program’s primary requirement for meters is that actual interval energy use (hourly or smaller) be automatically transmitted to a front‐end EMS or EIS where real‐time energy use can be monitored and stored. Metered energy use includes electricity and other utilities the building receives, such as chilled water, hot water, steam or natural gas.

MBCx Project Guidelines and Minimum Requirements May 2012 v2.docx Page 4 of 24
Existing meters which are not tied into the building’s EMS/EIS may fulfill the metering requirement if they are calibrated and connected to the EMS/EIS using new pulse outputs. Proper calibration of existing meters should be confirmed at the very beginning of a project so that no data is lost. Installation of sub‐meters within a building may be desired by the campus in order to isolate lighting or plug loads or to break out particular equipment energy use. Sub‐metering of cogeneration systems within a central plant may be necessary to determine individual system efficiencies. Campuses should also consider metering domestic water use for comprehensiveness, though this is not required by the program1. For additional information on metering best practices, see Attachment 2. Whole‐building energy trends will be used to calculate baseline and post‐MBCx annual energy use. See the Measurement and Verification (M&V) section below and Attachment 3 for more details. Energy Management System (EMS) / Energy Information System (EIS) The building (or campus) should have a functioning EMS which is, at a minimum, capable of controlling, monitoring and trending building equipment. Ideally the EMS will have much greater granularity in its control capabilities and will also be capable of triggering alarms as systems drift from their designed operating conditions. The campus must also utilize an EIS specifically designed for the tracking and evaluation of energy use meters and EMS points. The EIS should have the ultimate capability to log, store, and manipulate energy use information for every major building on campus for at least 10 years. It is possible that an advanced EMS could provide the energy use tracking functionality that normally requires an EIS. Building Evaluation While baseline energy trends are being collected (see M&V section for trending duration information), the Cx Agent should be performing a building evaluation to identify operational deficiencies and energy efficiency opportunities. Evaluation typically includes trending critical parameters, reviewing operations with plant engineers, investigating operating schedules and sequences of operations, and physically observing building operations. Any points trended for analysis should be calibrated to ensure proper results. The operation of any critical valves, dampers, VFDs, etc. should be verified through trending or functional testing. Additional information on typical systems evaluated under MBCx and measures identified for implementation can be found in Attachments 4 and 5, respectively. Measurement and Verification (M&V) The MBCx program is based on measuring whole‐building energy use. Accordingly, the program requires the use of an IPMVP2 Option C‐type energy analysis to determine baseline and post‐MBCx
1 The CPUC and IOUs are conducting pilot water‐energy programs. Eligibility of water‐energy savings for Partnership incentives is subject to the guidance provided by CPUC. 2 International Performance Measurement and Verification Protocol

MBCx Project Guidelines and Minimum Requirements May 2012 v2.docx Page 5 of 24
annual energy use. The program does not, however, require strict adherence to IPMVP protocols due to the long (12 months or greater) trending periods required. In order to create accurate energy models, at least three consecutive months (not including January or July) of baseline and post‐implementation whole‐building energy trends are requested. The purpose of this requirement is to ensure that energy use is trended over a period which captures a range of independent variables (typically outside air temperature) representative of most of the annual operating conditions. More than three months of data may be required to create acceptable model correlations. (Note that January and July data can and should be used in the energy analyses if available; those months just do not count toward the three consecutive months requirement.) M&V approaches other than IPMVP Option C (i.e. Options A, B, or D) will only be considered if circumstances preclude the use of Option C. Such circumstances may include low expected energy savings (<10%) or the loss of either baseline or post‐MBCx energy trends. The use of alternative M&V methods must be approved by the Partnership. Additional M&V information and requirements can be found in Attachment 3. Baseline Report A Baseline Report should be submitted to the Partnership which includes, at a minimum, the baseline energy analysis. The Baseline Report will also include a description of the facility, HVAC equipment, controls, operating schedules, operational deficiencies and energy efficiency opportunities (commonly referred to as a Findings Log), and a verbal and visual description of the analysis approach. All raw energy trend data used should be submitted along with live versions of any spreadsheet or other analyses. The Partnership may request additional information if it is deemed necessary to fully evaluate baseline conditions. At this stage the Implementer should also comment on revised energy savings estimates due either to differences between the original baseline estimate and the measured baseline energy use or to revised percentage savings estimates based on new information gained from the building investigation. Although no incentive is paid for peak demand (kW) savings, the Partnership requires that an analysis of peak demand savings be submitted in accordance with the DEER Peak Demand definition used by the MBCx program (Attachment 6). A determination of baseline peak demand should be made at this point. A sample Baseline Report outline can be found in Section 1 of Attachment 7. Partnership Approval of Baseline Energy Use The Partnership will review and approve the submitted baseline annual energy use. The campus should wait for Partnership approval before beginning EEM implementation in case the collection of additional trend data is deemed necessary. Savings and incentive estimates may be revised at this stage to be consistent with the approved baseline should it differ from the estimated baseline provided in the project application. Failure to wait for Partnership approval could result in reduced energy savings and incentive. Implementation Phase

MBCx Project Guidelines and Minimum Requirements May 2012 v2.docx Page 6 of 24
Implement Identified EEMs Either the campus, Cx Agent, or another company implements the identified EEMs. No other projects which will receive a utility energy incentive should be implemented in the building during the MBCx project. This includes the period from the beginning of baseline trending to the completion of post‐MBCx trending. If other projects are implemented at the same time, their calculated savings will be subtracted from the measured MBCx savings to determine the net effect of the MBCx project. Verify Proper EEM Implementation The campus or Cx Agent should verify that all chosen EEMs have been implemented properly. This can be done by evaluating whole‐building or sub‐system energy use trends, or through EMS trending. Post‐Implementation Data Collection Once all measures have been verified as implemented, the post‐implementation energy use trending period begins. Reporting Phase Post‐Implementation Measurement and Verification The determination of post‐implementation annual energy use is subject to the same requirements listed above in the Measurement and Verification section. Form E Once the project has been completed, all measures have been verified as being properly implemented, and a final determination of energy savings has been made, a Form E is submitted to the Partnership. Final Report A Final Report must be submitted to the Partnership which includes include a description of the facility, HVAC equipment, controls, operating schedules, operational deficiencies and energy efficiency opportunities (commonly referred to as a Findings Log), changes in project scope, an analysis of baseline and post‐MBCx energy use and the resulting energy savings along with a verbal and visual description of the analysis approach, and any other issues encountered which are relevant to a comprehensive understanding of the project. The Final Report should also describe the staff training program which will be offered and when it will take place. A sample Final Report outline can be found in Section 2 of Attachment 7. Form D The Form D is a spreadsheet campuses must submit to the Partnership along with the Final Report which summarizes building systems, baseline and post‐MBCx energy use and savings, and project costs. Cost Documentation Project cost documentation must be submitted by the campus and/or the Cx Agent. All contractor costs must be verified with copies of paid invoices. In‐house labor and materials can be included in the total project cost and should be verified using campus accounting software. Equipment purchased prior to receiving application approval from the Partnership Management Team cannot be included in the project cost.

MBCx Project Guidelines and Minimum Requirements May 2012 v2.docx Page 7 of 24
Incentive payments are cost‐capped based on 80% of verified project costs, so it is important to properly document as much of the project cost as possible. Systems Manual The Systems Manual is a comprehensive compilation of documents which fully describe, among other items, the building’s operating systems, controls sequences, maintenance schedules, and diagnostic protocols. It is recommended that the campus contract with their Cx Agent to provide this documentation, however it is not a program requirement. If the cost of creating a Systems Manual is included in the project costs, a digital copy of the Systems Manual must be submitted to the Partnership. A sample Systems Manual outline can be found in Section 3 of Attachment 7. Staff Training All campus staff responsible for maintaining the building should be trained in the current (post‐MBCx) operating sequences. Staff should also be trained to utilize the EMS and EIS to recognize equipment and system failures and be able to diagnose the cause of the problem. Partnership Approval and Incentive Payment Upon receipt of all required final documentation (Final Report, post‐MBCx energy use analysis, Form E, Form D, and cost documentation), the Partnership will perform a review of the energy savings calculations. If it is found that the analysis has errors or that the energy trends collected are insufficient to support the claimed savings, corrections and/or the collection of additional trend data may be requested. Once energy savings have been approved, they will be submitted to the IOU for processing of an incentive payment. Other Considerations Concurrent Energy Efficiency Projects The campus should not implement other energy efficiency projects which will overlap with the MBCx project. Because the energy savings from an MBCx project are based on actual trended whole‐building energy use, any other projects implemented within the bounds of baseline and post‐MBCx trending will be captured by the MBCx project. This is only of concern for energy efficiency projects which will attempt to claim an incentive outside of the MBCx project. End‐of‐the‐Year Protocol Because campuses and IOUs commit to achieving certain energy savings goals each year, there is usually a rush to complete projects at the end of the year. Unless otherwise notified, the deadline for submitting all documentation necessary for a final review will be November 15th. The desire to complete a project in a given year does not alone justify the use of less than three months of pre‐ and post‐project trend data. Each project will be considered individually and in accordance with the guidelines in the Measurement and Verification section above and in Attachment 3 as to whether or not this requirement can be waived. Alternative Approaches for Small Buildings

MBCx Project Guidelines and Minimum Requirements May 2012 v2.docx Page 8 of 24
The MBCx process is ideally suited for buildings over 25K ft2. Because meter costs do not scale proportionally with building size, the cost to add multiple meters to some smaller buildings can be prohibitive. The following alternative approaches will be considered on a case‐by‐case basis by the Partnership for small buildings. Option 1: Electrical Meter Only Buildings smaller than 25K ft2 which do not use significant amounts of CHW, HHW, steam, or gas may only be required to install an electric meter in order to participate in the MBCx Program. This option should be discussed with the Partnership to determine eligibility. Option 2: Grouping of Buildings A collection of buildings smaller than 25K ft2 which share CHW, HHW, steam, or gas distribution lines may qualify to be metered and claim energy savings as a group. Each building is required to have its own electric meter. This option should be discussed with the Partnership to determine eligibility. Option 3: Central Plant and Connected Buildings A traditional central plant (CP) MBCx project only claims energy savings from efficiency improvements made at the CP. If a CP serves a group of buildings smaller than 25K ft2, you may be able to claim both efficiency and load reduction energy savings through CP metering. Under this option, the CP would need to have all energy sources entering and leaving metered, but the connected buildings would only need to have electric meters installed. The CP and connected buildings all need to undergo a retrocommissioning process. This option should be discussed with the Partnership to determine eligibility.

MBCx Project Guidelines and Minimum Requirements May 2012 v2.docx Page 9 of 24
List of Attachments Attachment 1 ‐ Selection Guidelines for MBCx Sites Attachment 2 ‐ Metering Guidelines Attachment 3 ‐ Measurement and Verification Guidelines Attachment 4 ‐ General Types of Building Systems to be Investigated Attachment 5 ‐ Typical MBCx Measures Attachment 6 ‐ DEER (Database for Energy Efficient Resources) Demand Definition Attachment 7 ‐ Sample MBCx Report Components

MBCx Project Guidelines and Minimum Requirements May 2012 v2.docx Page 10 of 24
Attachment 1 – Selection Guidelines for MBCx Sites
The following criteria should be used when selecting good candidate sites for MBCx projects:
Buildings should have 25,000 square feet of conditioned space or larger. Clusters of multiple, similar buildings located near each other may be considered in order to increase the footprint impacted by MBCx.
Buildings should have some type of mechanical air‐conditioning; either served by DX units, dedicated chillers, or chilled water from a central plant.
Select buildings with high suspected baseline energy use. o Buildings with laboratories using fume‐hoods, or other spaces requiring elevated
ventilation o Buildings with data centers o Buildings with extended operating hours and/or dense occupancy o Where pre‐existing metering exists, any building shown to exhibit above average use
per square foot
The MBCx process can be applied to central plants, when there are suspected energy savings opportunities there. Monitoring will need to be applied to the central plant’s energy outputs (chilled water, hot water, steam) as well as its inputs.
Buildings should have functioning control systems such that energy conservation measures can be implemented and expected to persist.
Conversely, the following types of sites make poor candidates for MBCx projects:
Small buildings
Buildings with limited annual operating hours
Buildings with low occupancy
Buildings that are only served by heating and ventilation (or evaporative cooling), with no mechanical air conditioning
Buildings with non‐functioning control systems
Buildings already operating efficiently, with low energy use intensities (kWh/yr/sf, th/yr/sf)
Buildings with strict operating requirements, that would prevent modifications being made for efficiency purposes
Buildings with upcoming major renovations
Buildings with pneumatic controls
Project Scoping Process for CCC Campuses
The Community College system has found it to beneficial to take a more detailed and comprehensive
project screening and “scoping” approach to MBCx. With this approach, the MBCx provider shall work
as a team member with District and campus staff, the Partnership IOU and technical review team, and
EMS/Controls representative to develop an MBCx project scope and strategy for the campus. The MBCx
Scoping Approach will consist of the following steps:
1. Review list of buildings provided by each campus for suitability to conduct MBCx.

MBCx Project Guidelines and Minimum Requirements May 2012 v2.docx Page 11 of 24
2. Meet with team members described above to discuss potential buildings, systems, and central
plant opportunities for MBCx at each campus. Identify known energy problems and campus
strategies for improved building performance. Identify metering needs for each considered
building and system. Determine existing EMS system capabilities and improvements needed.
Discuss the relationship and phasing of potential other known retrofit projects with MBCx. Walk
down site and buildings as required to evaluate opportunities.
3. Working with the team described above, narrow the focus of MBCx candidate buildings and
systems that provide the best opportunity for cost effective MBCx projects within the campus
budget.
4. Working with the IOU project reviewer, develop implementation strategies and scope for MBCx
projects that consider the following: adherence to CCC/IOU Partnership MBCx guidelines;
opportunities to group buildings into common projects; metering strategies to minimize costs;
improvements necessary for EMS trending and storage capabilities; phasing of retrofit projects;
prioritization of cost effective projects, and; overall schedule requirements of the campus.
5. Based on the scoping project described above, the MBCx provider shall prepare and submit an
MBCx project scope and budget proposal to the District for consideration.

MBCx Project Guidelines and Minimum Requirements May 2012 v2.docx Page 12 of 24
Attachment 2 – Metering Guidelines The following information is presented to outline metering best practices. These do not represent program requirements. A robust guide for selection of appropriate metering and data storage devices and analysis tools for use under the MBCx Program can be found in the United States Federal Energy Management Program (FEMP) document, Metering Best Practices: A Guide to Achieving Utility Resource Efficiency, October 2007. The most relevant information can be found in Chapter 5 “Metering Technologies”, Chapter 6 “Metering Communications and Data Storage”, and Chapter 7 “Data Analysis and Use”. This document can be found online at http://www1.eere.energy.gov/femp/pdfs/mbpg.pdf. Below are some relevant highlights from the FEMP metering guide. Campuses should discuss their particular circumstances with a vendor to determine which metering solutions will best meet their needs. Campuses should also bear in mind that installation costs for any given meter can vary greatly depending on size and other physical constraints, and can often cost more than the metering equipment itself. Electricity Metering There are two basic types of electrical meters, mechanical and digital meters. Mechanical meters are an older technology and represent the majority of the installed base. Mechanical meters may or may not have electronic pulse outputs to automatically transmit energy use data to an EMS or EIS. Digital (advanced) meters are the new standard in electrical metering and provide many additional features over mechanical meters. Some of these features include increased accuracy, on‐board data storage, variable data reporting intervals, alarming capabilities, multiple communication modes, and various energy‐use statistics. Equipment costs for mechanical meters with pulse outputs range from $200 to $400. Equipment costs for digital meters range from $1,000 to $3,000. Flow Metering for Natural Gas, Steam, CHW, and HHW Flow metering applications use three main types of meters: positive displacement, differential pressure, and velocity. Within each of these categories there are several different metering options, each with pros and cons. Campuses should pay particular attention to the turndown ratio (range of operation) of a meter and whether or not it will meet the full range of their metering needs. Natural Gas Metering Special considerations for the metering of natural gas include whether or not the meter will also measure gas temperature and pressure along with flow. If temperature and pressure are not directly measured, alternative options include placing a pressure regulator upstream of the meter and calibrating the meter to a particular pressure, and possibly just assuming gas temperature. Natural gas meters can range from $150 for a diaphragm positive displacement meter (medium turndown ratio, medium pressure losses) to $6,000 for a vortex shedding velocity meter (high turndown ratio, low pressure losses). Steam Metering

MBCx Project Guidelines and Minimum Requirements May 2012 v2.docx Page 13 of 24
The measurement of steam energy usage is accomplished with either a steam meter (measuring steam flow into a building) or a steam condensate meter (measuring the flow of condensed steam leaving the building). The cost for steam meters is higher than for condensate meters, but a steam meter will capture the total steam energy use of a building, including vented steam, condensate leaks, and direct steam uses. Steam meters can range in cost from $500 for a turbine velocity meter (medium turndown ratio, medium pressure losses) to $6,000 for a vortex shedding velocity meter (high turndown ratio, low pressure losses). Condensate meters can range from $4,000 to $7,000, depending on type, size, communication capability, and accuracy.

MBCx Project Guidelines and Minimum Requirements May 2012 v2.docx Page 14 of 24
Attachment 3 – Measurement and Verification Guidelines
As mentioned in the Measurement and Verification section of the main document, IPMVP Option C is the preferred M&V method for MBCx projects and should be used whenever possible and appropriate. Using alternative M&V approaches requires approval from the Partnership. Option C – Whole Facility Length of Trend Periods IPMVP Option C entails creating energy use models for each metered utility entering a building using whole‐building interval trend data. The program does not require “adherence” to IPMVP guidelines, as the IPMVP baseline and post‐implementation trending periods are generally longer than is practical for the purposes of the MBCx program (12 or more months). Instead, the program nominally requires that a minimum of three consecutive months of baseline and post‐MBCx trend data, not to include January or July, be collected for each utility. January and July trend data should be included in the analysis, however they do not count towards the three‐consecutive‐months requirement. The spirit of the three‐consecutive‐months requirement is to ensure that energy trends are captured over a full range of the independent variables (IVs) to which they are correlated. If there is a distinct need to shorten the trending period and it can be shown that sufficient data points have been collected over a representative span of IVs prior to three months, the three‐consecutive‐months requirement may be waived by the program. If whole‐building monthly or annual energy use is available in the baseline period (prior to installing whole‐building interval meters), one month of interval trend data may be able to be used to create an energy model if the model’s annual energy use is shown to be in‐line with the historical energy use. Energy Use Correlation An Option C analysis involves correlating energy use (usually at either hourly or daily intervals) to one or more IVs and then extrapolating to annual energy use based on typical or normalized IV values over an entire year. The most common IV used is outside air temperature (OAT). Other IVs include, but are not limited to, building occupancy, daily operating hours, and Time‐of‐Day. There are three metrics identified in the IPMVP and ASHRAE Guideline 14‐2002 for use in evaluating the correlation between energy use and an IV which should be reported for all regression analyses: The coefficient of determination (R2), the coefficient of variation of the root mean square error (CV‐RMSE), and the t‐statistic. All three metrics should be reported as part of an analysis whenever applicable. Regression models will not be strictly held to the acceptance criteria/guidelines given below, but attempts should be made to optimize their values where possible. Additional information on these metrics can be found in Appendix B of the IPMVP (EVO 10000 – 1:2010) and Section 5.2.11 of ASHRAE Guideline 14‐2002. R2: The coefficient of determination (R2) is the most commonly used metric for determining whether or not a regression correlates to an IV, however a model should not be accepted nor rejected based on this metric alone. High R2 values indicate that energy use is very dependent on an IV. A low R2 means that energy use is not very dependent on an IV, but does not necessarily mean that a model is bad or should not be used. For example, CHW or HHW use plotted against OAT will usually show a “knee” in the data. Energy use on either side of the knee is typically modeled with separate linear regressions. The

MBCx Project Guidelines and Minimum Requirements May 2012 v2.docx Page 15 of 24
regression representing the “baseline” usage and having a flatter slope will usually show a very poor R2, even if the actual energy use is visually very close to the regression line. ASHRAE‐14 gives no general acceptance criteria based on R2 values. The IPMVP states that “though there is no universal standard for a minimum acceptable R2 value, 0.75 is often considered a reasonable indicator of a good” correlation. R2 is a standard output of all regression analyses. In Excel, it can be shown on a chart alongside the regression formula for a data set or calculated using the Regression analysis tool in the Data Analysis Tool Pack. CV‐RMSE: The coefficient of variation of the root mean square error (CV‐RMSE) gives a sense for how accurate a model is, but not the degree of dependency of energy use on the IV. ASHRAE‐14 gives acceptance criteria for the CV‐RMSE of ≤20% for energy use and ≤30% for demand. Using the Regression analysis tool in the Data Analysis Tool Pack in Excel, the CV‐RMSE can be calculated by dividing the Standard Error (in the Regression Statistics section of the output) by the average of the Predicted Y values (in the Residual Output section). t‐statistic: The t‐statistic is a statistical test to determine whether or not an estimated regression model coefficient has statistical significance (whether energy use is related to the IV). A t‐statistic value of 2 indicates that some relationship exists, though only with a precision of about ±100%. A t‐statistic of about 10 indicates that a much better relationship exists with a precision of about ±10%. The t‐statistic is also reported in the Regression analysis tool in the Data Analysis Tool Pack. Options A and B – Retrofit Isolation Options A or B can be used if energy savings are expected to be very small compared to whole‐building energy use (<5%) and discrete measures are being implemented which can easily be calculated and supported by baseline and post‐MBCx sub‐metered or spot measured data. Measurement periods for these Options should attempt to follow the requirements detailed in the Option C section, however shorter trending periods may be warranted depending on the equipment and measures being modeled. These approaches will likely only be used when EEMs which were scheduled for implementation have not been able to be implemented and the originally expected savings levels will not be reached. Approval must be given from the Partnership to utilize either of these approaches. Whole‐building metering is still required if Options A or B are used. Option D – Calibrated Simulation Option D should be used only if either baseline or post‐MBCx whole‐building trend data is unavailable. Use of Option D entails creating a whole‐building energy use model and calibrating it to either baseline or post‐MBCx energy use. Depending on which data set the model is calibrated to, EEMs will then be implemented or un‐implemented in the model to represent the actual project scope. Length of Trend Periods

MBCx Project Guidelines and Minimum Requirements May 2012 v2.docx Page 16 of 24
Whether trending occurs in the baseline or post‐MBCx phase, the trending requirements detailed in the Option C section are to be followed. Additional sub‐metering/trending will also be necessary to verify the assumptions used in the calibrated simulation which result in energy savings. Energy Balance If the simulation is truly a whole‐building simulation, then an energy balance will be inherent in the model and the entire model will be compared to whole‐building trend data for calibration. If the simulation only includes HVAC energy (or some portion thereof), then an energy balance needs to be performed to verify the portion of whole‐building energy represented by the model. Typical EUI values for various end‐uses in various building types can be found in the California End‐Use Survey (CEUS) for use in an energy balance. Calibration If baseline trend data is available for an entire year prior to the MBCx project, the whole‐building simulation should be calibrated to that annual use. (The trend data may need adjustments to make it more similar to a typical (TMY) year.) It is more often the case, however, that much less than a year’s worth of either baseline or post‐MBCx trend data is available. In that case, Option C‐type energy models will need to be created in order to determine annual energy use to calibrate to. ASHRAE Guideline 14‐2002 references the Normalized Mean Bias Error (NMBE) and the CV‐RMSE as the two metrics used for determining the degree of calibration of a whole‐building calibrated simulation. (Reference sections 5.2.11.3 and 5.3.2.4,f of ASHRAE Guideline 14‐2002.) Though calibrated simulation models will not be held to the acceptance criteria listed in ASHRAE, these metrics should be reported for all analyses.

MBCx Project Guidelines and Minimum Requirements May 2012 v2.docx Page 17 of 24
Attachment 4 ‐ General Types of Building Systems to be Investigated Central Plant(s) including the following general types of equipment:
Chillers
Cooling Towers
Boilers
Pumps
Control Systems including VFDs and sequences of control
Waterside Economizers
Central Air Handler(s)
Fans
Chilled water coils and valves
Hot water coils and valves
Dampers
Control Systems, including VFDs, Outside Air Economizer and other sequences of control Zonal HVAC
Depending upon the number of zones, zonal equipment may initially be evaluated by Provider by sampling, and the extent of problems will determine whether all zones need to be evaluated and whether any discovered problems are assumed to be global, and that solutions may be applied globally (“Global” as used here means similar units serving similar types of zones)
HVAC delivery to the Space (air and/or water distribution, whether dual duct, VAV terminals with re‐heat, hydronic, etc.)
Control Systems and sequences of control for HVAC delivery and zonal temperature control Major Unitary Systems
Rooftop Package Units (15 Tons or over)
Controls
Lighting Systems
Interior Lighting Controls
Exterior Lighting Controls
Refrigeration Systems
Controls Domestic Hot Water Systems
Heaters/Boilers
Controls Process Controls

MBCx Project Guidelines and Minimum Requirements May 2012 v2.docx Page 18 of 24
Attachment 5 ‐ Typical MBCx Measures
A wide range of energy efficiency measures may be implemented under the Program. Most commonly, energy efficiency measures will apply to the following system components: air handlers, chillers, cooling towers, economizers, boilers, lighting, and controls. While measures will be determined on a site‐by‐site basis, the Program's common MBCx measures include:
Scheduled Loads o Equipment Scheduling: Time of Day o Equipment Scheduling: Optimum Start‐Stop o Equipment Scheduling: Lighting Controls
Economizer/Outside Air Loads o Economizer Operation: Inadequate Free Cooling o Over‐Ventilation o Demand Controlled Ventilation
Control Problems o Simultaneous Heating and Cooling o Sensor/Thermostat Calibration and/or Optimal Relocation o Hunting and Loop Tuning o Damper/Valve Actuator Calibration o Zone Rebalancing
Controls: Setpoint Changes o Duct Static Pressure Setpoint o Piping Differential Pressure Setpoint o Reduction of VAV Box Minimum Setpoint o Implementation/Adjustment of Heating/Cooling, and Occupied/Unoccupied Space
Temperature Setpoints
Controls: Reset Schedules o HW Supply Temperature Reset or HW Plant Scheduling o CHW Supply Temperature Reset o CW Supply Reset for Chiller Efficiency Optimization (for Newer VFD Chillers) o Supply Air Temperature Reset: Cooling and Heating o Duct Static Pressure Reset
Equipment Efficiency Improvements / Load Reduction o De‐Lamping of Over‐Lit Spaces o Pump Discharge Throttled, Over‐Pumping and Low Delta T–Trim Impeller
Variable Frequency Drives (VFDs) o VFD Retrofit ‐ Fans o VFD Retrofit ‐ Pumps
Equipment Maintenance o Leaking Valves (hot water or chilled water valves) o Actuator / Damper Operation
The goal of the MBCx program is to implement the following types of measures:
Fix problems with existing controls
Enhance the control and operation of existing equipment
Make limited repairs/upgrades to existing equipment to make it run more efficiently

MBCx Project Guidelines and Minimum Requirements May 2012 v2.docx Page 19 of 24
Recommendations to improve the facility performance, such as indoor air quality issues, should be noted in the MBCx Baseline Report, even if there are no energy savings associated with them. Minimum ventilation requirements must be maintained per code.

MBCx Project Guidelines and Minimum Requirements May 2012 v2.docx Page 20 of 24
Attachment 6 – DEER (Database for Energy Efficient Resources) Demand Definition
2010-2012 UC-CSU-IOU Energy Efficiency Partnership Program
A list of CCZs and their associated cities can be found at: http://www.energy.ca.gov/maps/Climate_Zones_by_City.pdf
Avg. Avg. Avg. Avg.
HourWB (°F)
DB (°F)
WB (°F)
DB (°F)
WB (°F)
DB (°F)
WB (°F)
DB (°F) Hour
WB (°F)
DB (°F)
WB (°F)
DB (°F)
WB (°F)
DB (°F)
WB (°F)
DB (°F)
15 61 67 62 74 57 60 15 76 94 74 95 72 9316 62 69 61 71 55 56 16 72 89 74 94 71 8717 61 67 59 66 56 56 17 71 84 75 94 68 81
Avg. Avg. Avg. Avg.
HourWB (°F)
DB (°F)
WB (°F)
DB (°F)
WB (°F)
DB (°F)
WB (°F)
DB (°F) Hour
WB (°F)
DB (°F)
WB (°F)
DB (°F)
WB (°F)
DB (°F)
WB (°F)
DB (°F)
15 65 98 69 99 65 92 15 65 100 62 102 67 10116 64 95 69 97 65 91 16 65 100 68 101 65 9917 63 93 69 94 64 83 17 63 98 68 98 65 97
Avg. Avg. Avg. Avg.
HourWB (°F)
DB (°F)
WB (°F)
DB (°F)
WB (°F)
DB (°F)
WB (°F)
DB (°F) Hour
WB (°F)
DB (°F)
WB (°F)
DB (°F)
WB (°F)
DB (°F)
WB (°F)
DB (°F)
15 67 80 67 84 68 78 15 63 95 71 100 70 10316 66 79 66 82 68 78 16 64 96 71 101 69 10417 64 75 64 79 65 74 17 63 94 70 98 69 101
Climate Zone 0130-Sep 1-Oct 2-Oct
59 65
Climate Zone 0222-Jul 23-Jul 24-Jul
66 94
Climate Zone 0317-Jul 18-Jul 19-Jul
66 79
Climate Zone 108-Jul
Climate Zone 096-Aug 7-Aug 8-Aug
73 90
31-Jul 1-Aug 2-Aug
9-Jul 10-Jul
65 100
Climate Zone 11
65 99
Peak Demand DefinitionThis program has adopted the peak demand definition used in the 2008 Database for Energy Efficiency Resources (DEER) update, which defines peak demand as the average demand over the nine hours from 2pm-5pm on the three consecutive days identified below for each California Climate Zone (CCZ). (The three-day span for each CCZ was chosen because the middle day contained the hottest hour of the year based on WYEC2 normalized weather data.) For the purposes of this program, the dates and associated WYEC2 weather bin data are summarized below.
Modeling ApproachesIf performing an analysis based on energy use correlated to outside air temperature (OAT), the average dry bulb temperatures (and wet bulb, if applicable) can be used to determine demand reduction. If the peak temperatures listed below are outside the range of OAT temperatures used to create the energy models, justification should be given as to why extrapolating outside of this range is appropriate.
If it is determined that energy use is correlated to occupancy, and not OAT, peak demand can be calculated as the average demand from 2pm to 5pm on occupied day-types during the dates identified. Note that for many educational facilities, the peak demand dates may be during out-of-session periods.
If using eQuest or other DOE-2.2 software, these definitions may already be incorporated.

MBCx Project Guidelines and Minimum Requirements May 2012 v2.docx Page 21 of 24
Avg. Avg. Avg. Avg.
HourWB (°F)
DB (°F)
WB (°F)
DB (°F)
WB (°F)
DB (°F)
WB (°F)
DB (°F) Hour
WB (°F)
DB (°F)
WB (°F)
DB (°F)
WB (°F)
DB (°F)
WB (°F)
DB (°F)
15 73 87 73 94 75 86 15 67 99 69 103 69 10316 74 86 73 90 75 86 16 69 101 68 102 69 10317 72 83 71 86 75 82 17 69 100 67 99 68 100
Avg. Avg. Avg. Avg.
HourWB (°F)
DB (°F)
WB (°F)
DB (°F)
WB (°F)
DB (°F)
WB (°F)
DB (°F) Hour
WB (°F)
DB (°F)
WB (°F)
DB (°F)
WB (°F)
DB (°F)
WB (°F)
DB (°F)
15 65 84 58 84 60 77 15 75 104 75 105 66 10216 63 82 55 82 59 71 16 75 105 75 106 65 10417 62 81 55 80 58 71 17 74 102 72 103 64 100
Avg. Avg. Avg. Avg.
HourWB (°F)
DB (°F)
WB (°F)
DB (°F)
WB (°F)
DB (°F)
WB (°F)
DB (°F) Hour
WB (°F)
DB (°F)
WB (°F)
DB (°F)
WB (°F)
DB (°F)
WB (°F)
DB (°F)
15 67 78 68 85 65 75 15 63 101 64 103 64 10616 65 75 67 85 64 74 16 64 103 65 104 63 10517 64 75 67 81 63 70 17 63 101 64 104 62 104
Avg. Avg. Avg. Avg.
HourWB (°F)
DB (°F)
WB (°F)
DB (°F)
WB (°F)
DB (°F)
WB (°F)
DB (°F) Hour
WB (°F)
DB (°F)
WB (°F)
DB (°F)
WB (°F)
DB (°F)
WB (°F)
DB (°F)
15 72 81 69 80 64 84 15 74 114 75 112 69 10316 70 78 70 82 58 70 16 74 114 75 112 67 10517 71 78 69 79 58 67 17 74 110 75 109 67 103
Avg. Avg. Avg. Avg.
HourWB (°F)
DB (°F)
WB (°F)
DB (°F)
WB (°F)
DB (°F)
WB (°F)
DB (°F) Hour
WB (°F)
DB (°F)
WB (°F)
DB (°F)
WB (°F)
DB (°F)
WB (°F)
DB (°F)
15 61 90 63 93 62 92 15 63 95 61 93 61 9016 58 84 62 92 63 90 16 63 96 61 93 61 9117 58 83 62 88 62 87 17 62 89 58 85 60 87
5-Sep
Climate Zone 0417-Jul 18-Jul 19-Jul
23-Sep 24-Sep 25-Sep
66 78
Climate Zone 079-Sep 10-Sep 11-Sep
67 78
Climate Zone 08
59 79
Climate Zone 069-Jul 10-Jul 11-Jul
73 87
Climate Zone 053-Sep 4-Sep
61 89
Climate Zone 125-Aug 6-Aug 7-Aug
68 101
Climate Zone 1314-Aug 15-Aug 16-Aug
103
Climate Zone 149-Jul 10-Jul 11-Jul
61 91
72 109
Climate Zone 166-Aug 7-Aug 8-Aug
64 103
Climate Zone 1530-Jul 31-Jul 1-Aug
71

MBCx Project Guidelines and Minimum Requirements May 2012 v2.docx Page 22 of 24
Attachment 7 – Sample MBCx Report Components 1. MBCx Baseline Report
1.1. Introduction Include summary of all projected costs, savings, and incentives. Campus benchmark ranking and bar chart of actual data compared to other campuses; building benchmark data if available
1.2. Facility Description Area, age, function, schedule, contacts, operational requirements (schedules, occupancy, etc.) Available and missing documentation identified
1.3. Scope of Services Basic MBCx scope and systems being evaluated Description of existing controls and trending capacities Description of new monitoring capabilities and/or control points to be added
1.4. Known issues, improvement opportunities, and potential MBCx measures identified at this stage. Include projected costs and savings, anticipated incentive. Summary Table of Proposed Measures, including projected savings, costs, expected incentives Discussion of Analysis of the Potential MBCx Measures and Savings Projections
1.5. Historical Energy Use Annual Energy Use and Costs to Campus
1.6. MBCx Plan / Measurement and Verification Plan 1.6.1. Monitoring objectives and requirements 1.6.2. Identify measurement points and planned duration of data collection 1.6.3. MBCx Process 1.6.4. Roles and Responsibilities 1.6.5. Project Schedule 1.6.6. Pre‐Functional Test Plan 1.6.7. Functional Test Plan 1.6.8. Operator Training Plan 1.6.9. (Optional Section) Other, non‐whole‐building M&V methods to be utilized 1.6.10. Plans for M&V Data Analysis (e.g., extrapolation, normalization, adjustment)
1.7. Baseline Report 1.7.1. Baseline system/equipment meter data gathering plan and data summary for each
measure. Include the revenue meter numbers that savings will accrue to. 1.7.2. Discussion of baseline system/equipment data analysis 1.7.3. Assessment and proposed solutions 1.7.4. Assessment and analysis of whole‐building metering data, if not included in 1.7.2. Appendices MBCx Kickoff Meeting Minutes
Initial Project Deficiency and Resolution Log Name of System or Equipment Description of Finding, Deficiency or Problem Date Noted Recommended Solution Estimated Cost of Correction Status of Implementation Actual Cost of Correction
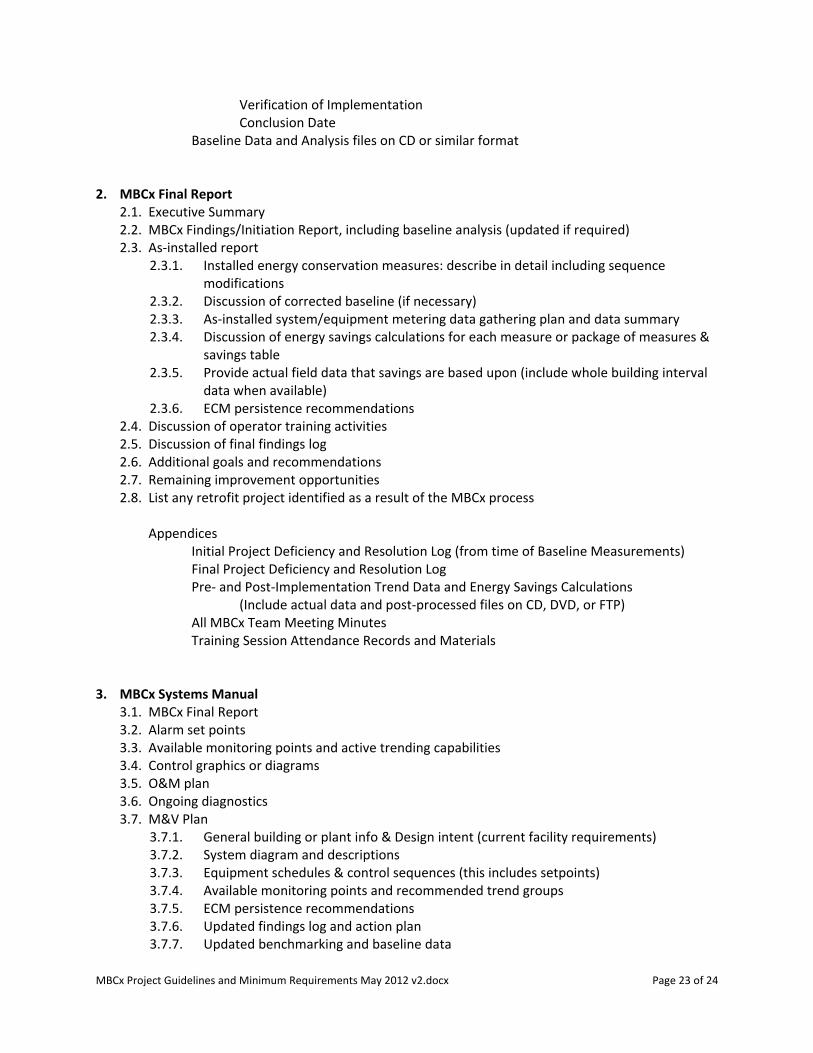
MBCx Project Guidelines and Minimum Requirements May 2012 v2.docx Page 23 of 24
Verification of Implementation Conclusion Date Baseline Data and Analysis files on CD or similar format
2. MBCx Final Report 2.1. Executive Summary 2.2. MBCx Findings/Initiation Report, including baseline analysis (updated if required) 2.3. As‐installed report
2.3.1. Installed energy conservation measures: describe in detail including sequence modifications
2.3.2. Discussion of corrected baseline (if necessary) 2.3.3. As‐installed system/equipment metering data gathering plan and data summary 2.3.4. Discussion of energy savings calculations for each measure or package of measures &
savings table 2.3.5. Provide actual field data that savings are based upon (include whole building interval
data when available) 2.3.6. ECM persistence recommendations
2.4. Discussion of operator training activities 2.5. Discussion of final findings log 2.6. Additional goals and recommendations 2.7. Remaining improvement opportunities 2.8. List any retrofit project identified as a result of the MBCx process
Appendices Initial Project Deficiency and Resolution Log (from time of Baseline Measurements)
Final Project Deficiency and Resolution Log Pre‐ and Post‐Implementation Trend Data and Energy Savings Calculations (Include actual data and post‐processed files on CD, DVD, or FTP) All MBCx Team Meeting Minutes Training Session Attendance Records and Materials
3. MBCx Systems Manual
3.1. MBCx Final Report 3.2. Alarm set points 3.3. Available monitoring points and active trending capabilities 3.4. Control graphics or diagrams 3.5. O&M plan 3.6. Ongoing diagnostics 3.7. M&V Plan
3.7.1. General building or plant info & Design intent (current facility requirements) 3.7.2. System diagram and descriptions 3.7.3. Equipment schedules & control sequences (this includes setpoints) 3.7.4. Available monitoring points and recommended trend groups 3.7.5. ECM persistence recommendations 3.7.6. Updated findings log and action plan 3.7.7. Updated benchmarking and baseline data

MBCx Project Guidelines and Minimum Requirements May 2012 v2.docx Page 24 of 24
3.7.8. Operator training plans and records 3.7.9. Plans for Recommissioning to maintain persistence (15 years). 3.7.10. Summary of available as‐built records & documentation

APPENDICES G‐1
PROPOSITION 39: CLEAN ENERGY JOBS ACT OF 2012
APPENDIX G RCX GUIDELINES Currently in development


APPENDICES H‐1
PROPOSITION 39: CLEAN ENERGY JOBS ACT OF 2012
APPENDIX H PROJECT PROPOSAL FORM


Introduction and Directions:
Contact Information:Please provide one key contact for all energy projects.
Contact Name:
Title:
Office Phone Number:
Cell Phone Number:
Email:
Gas Utility:
California Community Colleges Prop 39 PROJECT PROPOSAL FORM
Funding for California Community College Energy Projects under Proposition 39 is anticipated to be $50M per year for the next five years. The CCC Chancellor's Office is issuing a "Call for Projects" to identify, consolidate, and prioritze projects to receive Proposition 39 funding for project implementation. Districts are requested to complete this form to provide preliminary energy project information. This form can be completed with information for all college campuses within a District or individually by colleges, whichever is preferred. Use the "EE Projects" and "Solar Projects" tabs to list all potential energy efficiency projects and Solar PV projects, providing as much information as available to identify and quantify the project.
District:
College:
Electric Utility:
CCC Prop 39 Projects Proposal Form 051413 v1.xlsx Directions
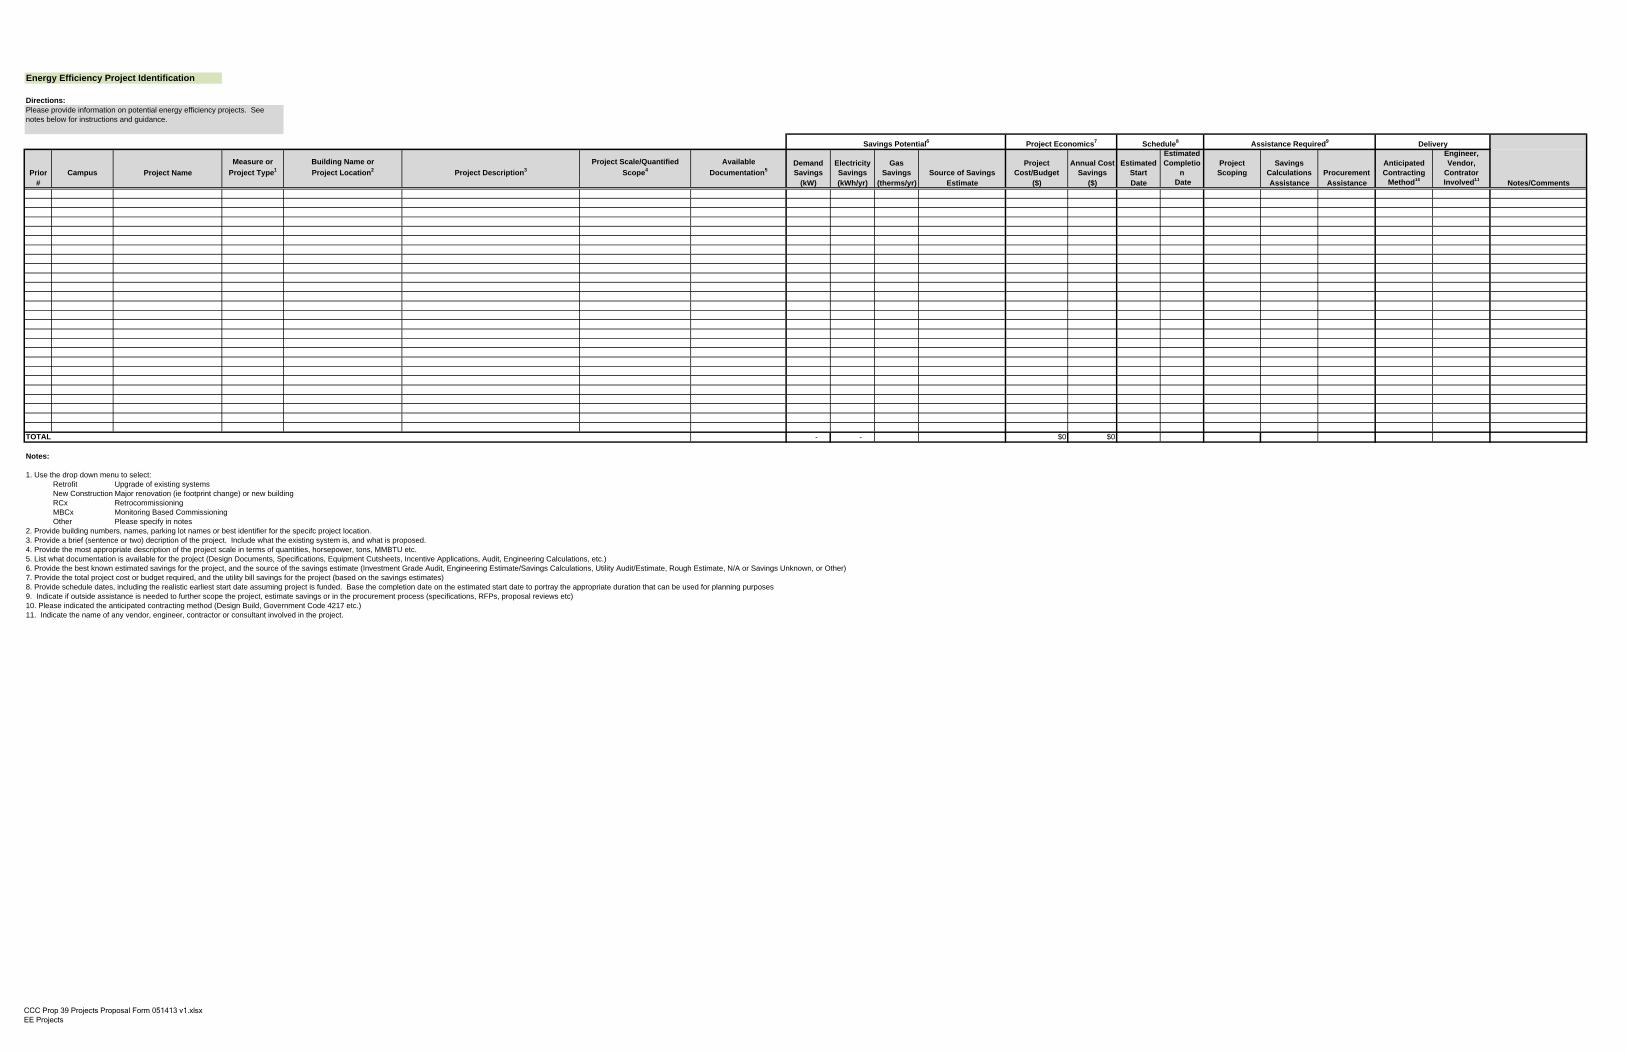
Energy Efficiency Project Identification
Directions:
Prior Campus Project Name
Measure or
Project Type1
Building Name or
Project Location2 Project Description3
Project Scale/Quantified
Scope4
Available
Documentation5Demand Savings
Electricity Savings
Gas Savings Source of Savings
Project Cost/Budget
Annual Cost Savings
Estimated Start
Estimated Completio
nProject Scoping
Savings Calculations Procurement
Anticipated Contracting
Engineer, Vendor,
Contrator # (kW) (kWh/yr) (therms/yr) Estimate ($) ($) Date Date Assistance Assistance Method10 Involved11
TOTAL - - $0 $0
Notes:
1. Use the drop down menu to select: Retrofit Upgrade of existing systemsNew Construction Major renovation (ie footprint change) or new buildingRCx RetrocommissioningMBCx Monitoring Based CommissioningOther Please specify in notes
2. Provide building numbers, names, parking lot names or best identifier for the specifc project location.3. Provide a brief (sentence or two) decription of the project. Include what the existing system is, and what is proposed.4. Provide the most appropriate description of the project scale in terms of quantities, horsepower, tons, MMBTU etc.5. List what documentation is available for the project (Design Documents, Specifications, Equipment Cutsheets, Incentive Applications, Audit, Engineering Calculations, etc.)6. Provide the best known estimated savings for the project, and the source of the savings estimate (Investment Grade Audit, Engineering Estimate/Savings Calculations, Utility Audit/Estimate, Rough Estimate, N/A or Savings Unknown, or Other)7. Provide the total project cost or budget required, and the utility bill savings for the project (based on the savings estimates)8. Provide schedule dates, including the realistic earliest start date assuming project is funded. Base the completion date on the estimated start date to portray the appropriate duration that can be used for planning purposes9. Indicate if outside assistance is needed to further scope the project, estimate savings or in the procurement process (specifications, RFPs, proposal reviews etc)10. Please indicated the anticipated contracting method (Design Build, Government Code 4217 etc.)11. Indicate the name of any vendor, engineer, contractor or consultant involved in the project.
Please provide information on potential energy efficiency projects. See notes below for instructions and guidance.
Schedule8 Assistance Required9
Notes/Comments
Savings Potential6 Project Economics7 Delivery
CCC Prop 39 Projects Proposal Form 051413 v1.xlsxEE Projects
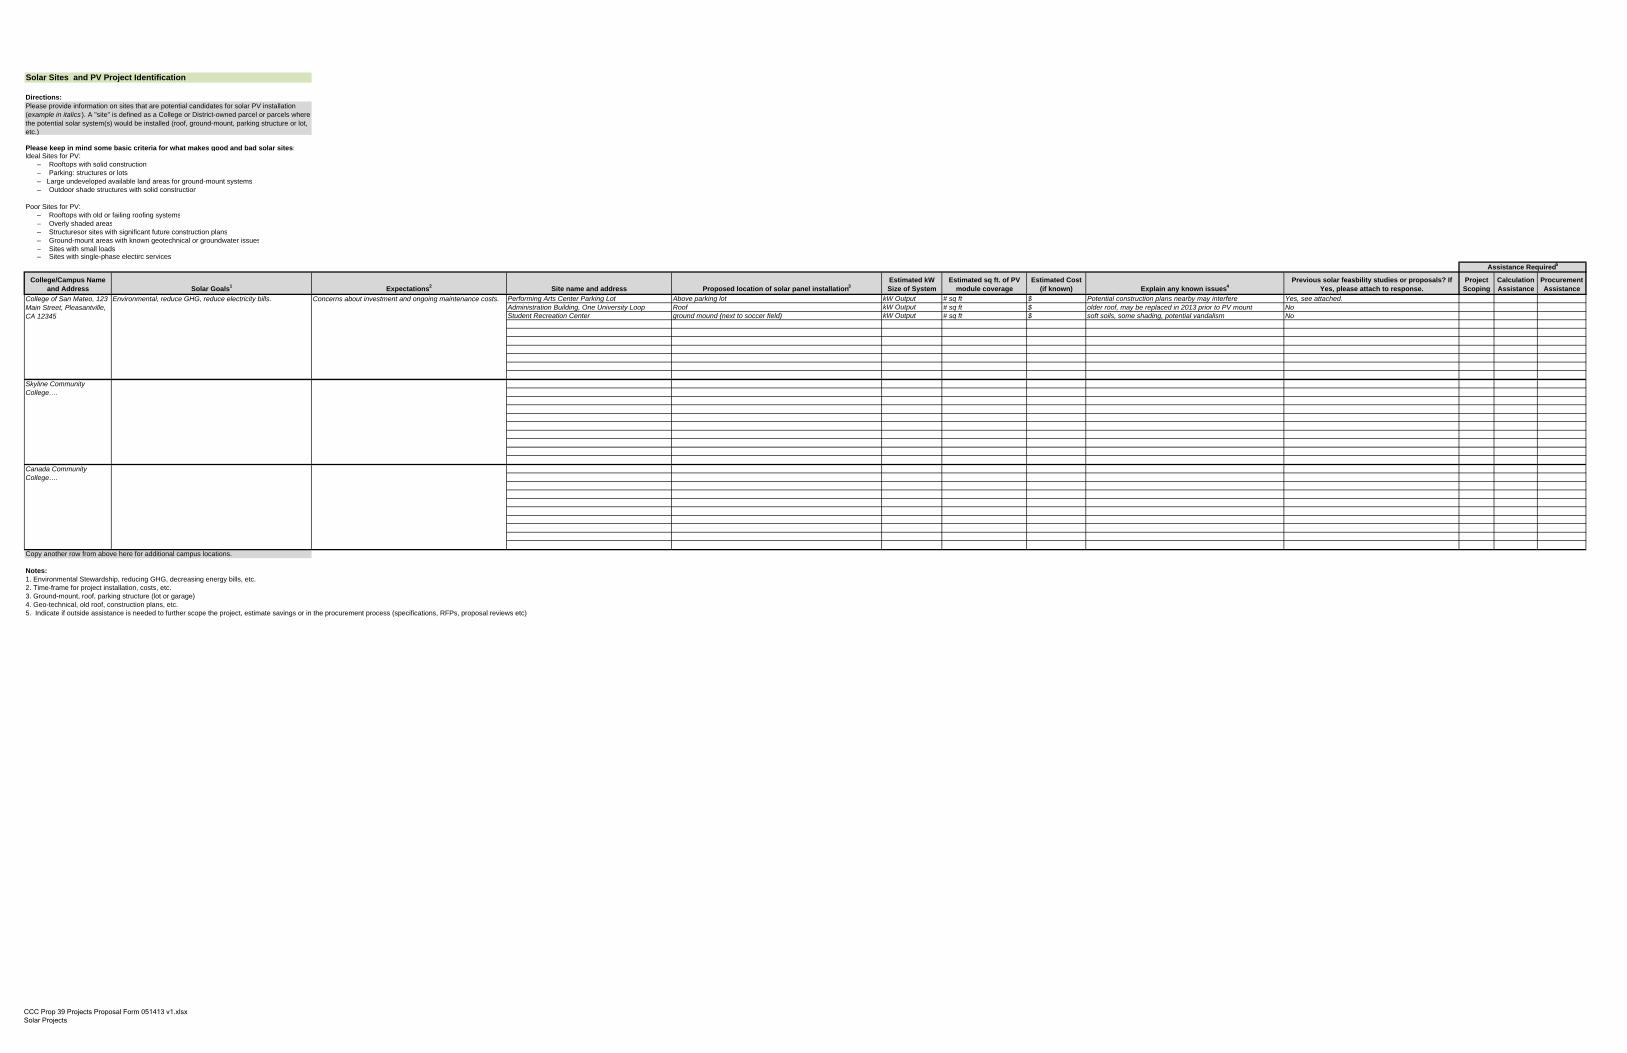
Solar Sites and PV Project Identification
Directions:
ldeal Sites for PV:– Rooftops with solid construction– Parking: structures or lots– Large undeveloped available land areas for ground-mount systems – Outdoor shade structures with solid construction
Poor Sites for PV:– Rooftops with old or failing roofing systems– Overly shaded areas– Structuresor sites with significant future construction plans– Ground-mount areas with known geotechnical or groundwater issues– Sites with small loads– Sites with single-phase electirc services
College/Campus Name and Address Solar Goals1 Expectations2 Site name and address Proposed location of solar panel installation3
Estimated kW Size of System
Estimated sq ft. of PV module coverage
Estimated Cost (if known) Explain any known issues4
Previous solar feasbility studies or proposals? If Yes, please attach to response.
Project Scoping
Calculation Assistance
Procurement Assistance
Performing Arts Center Parking Lot Above parking lot kW Output # sq ft $ Potential construction plans nearby may interfere Yes, see attached.Administration Building, One University Loop Roof kW Output # sq ft $ older roof, may be replaced in 2013 prior to PV mount NoStudent Recreation Center ground mound (next to soccer field) kW Output # sq ft $ soft soils, some shading, potential vandalism No
Copy another row from above here for additional campus locations.
Notes:1. Environmental Stewardship, reducing GHG, decreasing energy bills, etc.2. Time-frame for project installation, costs, etc.3. Ground-mount, roof, parking structure (lot or garage)4. Geo-technical, old roof, construction plans, etc.5. Indicate if outside assistance is needed to further scope the project, estimate savings or in the procurement process (specifications, RFPs, proposal reviews etc)
Canada Community College….
Assistance Required5
Please keep in mind some basic criteria for what makes good and bad solar sites:
Please provide information on sites that are potential candidates for solar PV installation (example in italics ). A "site" is defined as a College or District-owned parcel or parcels where the potential solar system(s) would be installed (roof, ground-mount, parking structure or lot, etc.)
College of San Mateo, 123 Main Street, Pleasantville, CA 12345
Environmental, reduce GHG, reduce electricity bills. Concerns about investment and ongoing maintenance costs.
Skyline Community College….
CCC Prop 39 Projects Proposal Form 051413 v1.xlsxSolar Projects

APPENDICES I‐1
PROPOSITION 39: CLEAN ENERGY JOBS ACT OF 2012
APPENDIX I SUSTAINABILITY TEMPLATE – ECONOMIC EXCERPT


California Community Colleges
Sustainability Plan Guidebook Economic Programs Excerpt
for
Proposition 39 Implementation
Prepared by: Newcomb | Anderson | McCormick
May 2013
SECTION 6. ECONOMICS OF SUSTAINABILITY 15
Economics of Sustainability
What are the Costs and Benefits of Sustainability?
What are the Campus Investment Criteria for programs and projects?
How to estimate the costs of sustainability projects
Consider the “cost of doing of nothing”
Resources for funding projects
Effects difficult to quantify
Risk management and mitigation
SECTION 6. ECONOMICS OF SUSTAINABILITY In an environment of budget cuts and limited funding, Districts will need to carefully evaluate the economics of sustainability in the decision making process. This will mean balancing the different costs and benefits of each project, including those that are difficult to quantify. Often, sustainability projects that have an initial capital cost will result in annual operating cost savings that translate to reduced General Fund expenditures. This section will describe approaches for analyzing the economic benefits of sustainability projects and to help identify funding sources. Other helpful resources for the execution of the projects, such as technical and program assistance, are addressed in Section 11 of the Template.
6.1 PROJECT ECONOMICS There are several economic factors to consider when evaluating which programs or projects to pursue. Several of these factors are listed below. Consider the costs to develop and implement the Sustainability Plan. The campus will incur costs to both initially develop the Sustainability Plan and to implement its programs and projects. If the planning process is undertaken by means of a Campus Committee consisting of internal resources and student participation, the development costs could be minimal or already accounted for. If a consultant is used for plan development these costs would need to be budgeted. However, the expertise and efficiencies provided by a consultant could result in a more effective plan and additional cost savings that may offset consultant charges. What is the District or campus investment criterion for sustainability projects? Investment criteria should be developed to help evaluate proposed projects. This could be a simple payback criterion, Return on Investment (ROI), or a life‐cycle analysis utilizing a Net Present Value (NPV) calculation. Most Districts should have investment criteria and policies in place, and these may need to be reevaluated to account for the unique benefits of sustainability measures. How much is the project capital or up‐front cost, how much total capital is available, and when is it available? A District’s ability to implement sustainability projects will be first limited by the amount of funding available and when it becomes available. It may be possible to enhance the amount of capital available by using a combination of internal and external funding resources (see Section 6.2).

16 SECTION 6. ECONOMICS OF SUSTAINABILITY
$80
$90
$100
$110
$120
$130
$140
2009 2010 2011 2012 2013 2014 2015 2016 2017 2018
An
nu
al E
ne
rgy
Co
sts
(Mil
lio
ns)
Year
10 Year Effects of 3‐Year Program ImplementationStatewide CCC Campus Energy Costs (IOU Served Campuses Only)
Business as Usual Targeted Portfolio Implementation, 2009‐2011
How much savings will the project generate compared to its cost? For example, this could be annual energy or water cost savings, or could be revenue generated from an on‐campus recycling program. This can be evaluated by performing a simple cost‐benefits analysis to compare first cost to annual savings over a project’s life time. Are there economies of scale with certain project types? Easily scalable projects, such as lighting upgrades, may be more cost‐effective than more complex or stand‐alone projects that are difficult to scale. Districts should also consider the ability to replicate or spread the projects to other campuses or to the local community. Can sustainability project capital expenditures translate to campus General Fund and annual operating budget savings? Projects that result in annual cost savings (for example energy or water efficiency) can reduce operating budget expenditures and add to the General Fund to finance ongoing costs for teachers, supplies, or other educational needs. This could be especially attractive if a District has a capital improvement budget and is trying to evaluate the “best bang for its buck”. What are the project’s lifecycle costs and benefits? In order to get an accurate picture of the impacts of a sustainability project, the District should quantify the lifecycle costs and benefits of a project. While performing a lifecycle cost analysis of a project requires more time and effort than a simple payback calculation, calculating lifecycle costs can have the added benefit of capturing maintenance costs and savings, reductions in operational and resource costs, increases in staff and student productivity, and impacts on the safety, health, and comfort of the campus. It can also take into account avoided costs of future capital improvements that may have been otherwise required and potential fluctuations in the price of energy, water, and other necessary resources. For example, establishing a network for carpooling may carry an initial cost to the District, but the reduction in vehicles driven to the campus can help the District avoid the costly process of constructing new parking spaces or reduce air district fines. Lifecycle analysis should include an NPV analysis to evaluate the ability of the project to meet District financial criteria. The adjacent graph illustrates the life‐cycle benefits of energy efficiency projects for the 2009‐2011 CCC/IOU Energy Efficiency Partnership portfolio of projects. In addition to achieving 10‐year cumulative savings of over 725 million kWh and 23 million therms, the graph also illustrates how on average $1 worth of investment in sustainable facilities yields $2 in energy savings. The result is that capital outlay investments now can provide continuing relief to District support budgets.

SECTION 6. ECONOMICS OF SUSTAINABILITY 17
$0.07
$0.09
$0.11
$0.13
$0.15
$0.17
$0.19
1980 1985 1990 1995 2000 2005 2010
Co
st ($
/kW
h)
Retail Price of Electricity in California
Source: California Energy Commission
$4.00
$5.00
$6.00
$7.00
$8.00
$9.00
$10.00
$11.00
$12.00
1980 1985 1990 1995 2000 2005
Co
st ($
/Th
ou
san
d C
F)
Retail Price of Natural Gas in California
Source: U.S. Energy Information Administration
Consider “the cost of doing nothing”. The cost of energy, water, sewage, waste disposal, and other services will continue to increase while college budgets stagnate or are cut. Many sustainability projects will save money for the campus over the project’s life‐cycle and can serve as a hedge against increasing utility or other costs. The adjacent graphs indicate the increases in electricity and natural gas prices since 1980, and clearly illustrate “the cost of doing nothing”. Most importantly, they reinforce the fact that dollars spent on energy are dollars taken out of the classroom. When energy or resource efficiency measures result in a reduction in capital cost expenditures it is often referred to as tunneling through the cost barrier1. For example, reductions in cooling loads through energy efficiency projects can reduce costs if HVAC equipment is able to be downsized. Such avoided capital costs and opportunities to “tunnel through the cost barrier” should not be overlooked and should be considered in the decision making process.
6.1.1 ESTIMATING COSTS All sustainability projects will incur some cost, either in time, money, or both. Apart from the cost of any equipment purchased, successful execution of sustainability projects will require a certain amount of staff time to oversee the implementation and the ongoing operation and maintenance (O&M) costs. Some projects will be more time intensive and require the attention of campus staff than others. Districts should consider their capacity to successfully undertake and continually manage sustainability projects before pursuing them. Districts can begin their cost estimating process by using industry aggregate data, such as RSMeans. While final costs will depend on the specific needs of the project, industry averages can provide a reasonable ballpark estimate for District decision making.
1 “Natural Capitalism”, by Paul Hawken, Amory B. Lovins, L. Hunter Lovins

18 SECTION 6. ECONOMICS OF SUSTAINABILITY
In certain cases, it may be necessary to hire specialists or consultants to assist in parts of or all of a sustainability project. Districts are recommended to hire specialists for projects that fall outside of the existing expertise of the staff in order to ensure systems are designed to fit District needs and are up to industry standards. In addition, the efficiencies and expertise provided by consultants could result in additional savings that may offset consultant charges. Cost estimates should be confirmed by issuing Requests for Proposals (RFPs) and receiving vendor or contractor quotes for equipment and services.
6.1.2 THE COST OF “GOING GREEN” There is a perception that green building practices are too cost prohibitive to pursue. There have been several studies and demonstration projects that have shown these concerns to be unfounded. The seminal work on this subject is The Costs and Financial Benefits of Green Buildings, written for the California Green Building Task Force in 2003, found that minimal upfront investments of about two percent of construction costs typically yields life cycle savings of over ten times the initial investment. Since then, green technology costs have steadily decreased and green building practices have become more widespread, making the financial analyses of green projects increasingly attractive. The Costs and Financial Benefits of Green Buildings report can be found on the US Green Building Council website at http://www.usgbc.org/Docs/News/News477.pdf
6.1.3 LIFE CYCLE COST ANALYSIS TOOLS A good resource for estimating and evaluating the costs and benefits of sustainability activities is the Accelerating Campus Climate Initiatives guide by the Rocky Mountain Institute. It also contains a Decision Making Matrix tool to assist campuses with the process of selecting and prioritizing projects. The guide can be found at: http://www.aashe.org/files/documents/resources/RMI_AcceleratingCampusClimateInitiatives.pdf Below are three of the many different tools and resources that are available to assist Districts for conducting a Life Cycle Cost Assessment of projects: California’s Green Building Initiative has created a Life Cycle Cost Assessment spreadsheet tool, available online at http://www.green.ca.gov/LCCA/default.htm The Building Life‐Cycle Cost (BLCC) Program is an economic analysis tool developed by the National Institute of Standards and Technology for the U.S. Department of Energy Federal Energy Management Program (FEMP). The program can be downloaded for free at: http://www.eere.energy.gov/femp/information/download_blcc.html The U.S. Army Corps of Engineers has developed the ECONPACK for Windows program, which is an economic analysis tool that has been developed in support of DOD funding requests. The ECONPACK program can be downloaded at http://www.hnd.usace.army.mil/paxspt/econ/features.aspx

SECTION 6. ECONOMICS OF SUSTAINABILITY 19
6.2 RESOURCES FOR FUNDING PROJECTS The following is a list of examples and resources for project funding. The list is broken into two general categories: funds that can be raised by the District and funds that come from external grants and incentives. Successful financing of a large sustainability project may require a combination of these different funding mechanisms.
6.2.1 FUNDING THROUGH DISTRICT ACTION There are several opportunities and approaches that Districts and campuses can use to fund projects from internal sources. Some of these are listed below. 6.2.1.1 District Capital Improvement Programs
Some Districts and campuses may have an existing Capital Improvement Program with budgets available for infrastructure projects. Many times the funds are earmarked for specific projects such as building renovations or utility upgrades. Planned and budgeted projects should be evaluated to determine if efficiency upgrades can be incorporated in the design phase of the project. Funding that is discretionary should be considered for unfunded sustainability projects.
6.2.1.2 District Bond Election
Districts can raise funds through issuing bonds by holding a District Bond Election. The ability to issue bonds and the availability of these funds will be contingent on voter approval. Projects that raise capital through this method need to begin planning early on, possibly years before the bond election is held. Bond funding for infrastructure projects is a widespread practice in the community college system.
6.2.1.3 Green Revolving Fund
A Green Revolving Fund is a revolving loan program operated by the District which issues loans to individual campuses, departments, or groups. These loans help fund projects that reduce resource use or provide other “green” benefits. When combined with projects that have significant cost savings a Green Revolving Fund can help support innovative or outreach projects that have less attractive or no financial payback.
Green Revolving Funds are gaining favor among academic institutions. In a survey conducted by the Sustainable Endowments Institute in 2011, fifty‐two institutions have a combined $66 million invested through Green Revolving Funds to support the development of sustainable practices on campuses. For more information on Green Revolving Funds, see Greening the Bottom Line by the Sustainable Endowments Institute at: http://www.greeningthebottomline.org/
20 SECTION 6. ECONOMICS OF SUSTAINABILITY
6.2.1.4 Energy Performance Contracts (EPCs)
Energy Performance Contracts (EPCs) are structured so that energy efficiency projects can be installed with little or no up‐front costs to the customer. A portion of the revenue from energy savings go directly to an Energy Service Company (ESCO), who finances and constructs the project. ESCOs can take on the debt associated with the projects done through the EPC, allowing Districts to keep the debt off of their books.
The American College and University’s Climate Commitment and the Clinton Foundation’s Climate Initiative have created a Best Practices Toolkit for energy performance contracting. The toolkit can be found at: http://www.presidentsclimatecommitment.org/resources/eebrp/toolkit
6.2.1.5 Power Purchase Agreements (PPA)
A Power Purchase Agreement (PPA) is a mechanism for an end‐use customer to purchase clean energy from a power producer for on‐site projects. In the case of solar photovoltaic electricity, Districts can opt to purchase solar energy from a system installed on‐site through a PPA at a negotiated rate instead of purchasing, installing, and maintaining the operations of solar photovoltaic panels themselves. In addition, while California Community Colleges are nonprofit entities, Districts can still take advantage of tax benefits by entering into a PPA. These benefits can be reflected in the contract pricing structure. While the solar panels may be installed on the campus, a District will not own the system. However, ownership of any renewable energy certificates (RECs) and carbon offset credits generated will need to be negotiated as part of the PPA. A major advantage of a PPA is that no up‐front investment or ongoing maintenance costs are required from the college while the solar PV energy is often guaranteed by the PV provider. However, the risk of the negotiated electricity rate is usually placed on the buyer.
6.2.1.6 Recycling Revenue Districts can take advantage of the value of recyclable items to create a revenue stream to support recycling operations, which could include the scrap value of the paper, cardboard, metal, plastic, glass, or other recyclables, or the California Redemption Value (CRV) for bottles and cans. Orange Coast College’s recycling program is an example of how this has successfully worked. See Section 10: Best Practice Case Studies for a description of Orange Coast College’s recycling program. Visit http://recyclemania.com or http://stopwaste.org for helpful tips on recycling.

SECTION 6. ECONOMICS OF SUSTAINABILITY 21
6.2.1.7 Renewable Energy Certificates (RECs)
Renewable Energy Certificates (RECs), also known as Renewable Energy Credits, Green Tags, or Tradable Renewable Certificates (TRCs), represent the environmental benefits of one megawatt‐hour electricity generated from renewable sources. The credits should not be confused with tax credits for renewable energy projects. A REC is a tradable commodity and can be sold as a source of revenue to the District. RECs can also be retained so that the owner has claim to the renewable attributes of the electricity. California’s Renewable Portfolio Standard (RPS) mandates that utilities provide 33% of their generation portfolio with renewable energy by 2020, and created a compliance market in California where utilities can purchase RECs in order to meet the RPS goal. There is currently a price cap of $50/megawatt‐hour for RECs, and the market value can fluctuate below this level. While the above describes the state of the REC market at the time of this Guidebook’s publication, this is constantly evolving and Districts should perform their own due‐diligence before making decisions on REC transactions. For more information about RECs in California, see the California Public Utilities Commission REC website at: http://www.cpuc.ca.gov/PUC/energy/Renewables/FAQs/05REcertificates.htm
6.2.1.8 Carbon Offset Credits
Projects that offset or reduce greenhouse gas emissions can be certified by the Climate Action Reserve and traded as a Climate Reserve Tonne (CRT) credit, which is the equivalent of one metric ton of carbon dioxide equivalent emissions reduced. At the time of the publication of this Guidebook, the CARB has adopted the California Carbon Cap‐and‐Trade program regulations. However, the Cap‐and‐Trade program still faces legal challenges raised by parties who believe that the program will not result in sufficient GHG reductions. The regulation of emissions is expected to become enforceable in 2012. In addition to the cap‐and‐trade market, there are other marketplaces where CRTs can be purchased and sold, though similar to RECs, Districts that sell CRTs lose the GHG “offset” attributes and cannot count the reductions towards their goals. CRTs are not applicable for on‐site energy efficiency projects as the benefits occur at the power generation facility where the environmental and carbon reductions are already accounted for in Renewable Energy Credits. For more information about CRTs and the CRT marketplace, see the Climate Action Reserve website at: http://www.climateactionreserve.org/ For more information about the Cap‐and‐Trade program, see the California Air Resource Board website at: http://arb.ca.gov/cc/capandtrade/capandtrade.htm

22 SECTION 6. ECONOMICS OF SUSTAINABILITY
6.2.2 EXTERNAL GRANTS AND INCENTIVES 6.2.2.1 CCC Board of Governors Energy and Sustainability Policy
The California Community Colleges Board of Governors has adopted an Energy and Sustainability Policy which encourages local Districts to be more energy efficient. The policy has set goals for campuses to reduce energy consumption from its 2001‐02 baseline consumption by 15% by the end of fiscal year 2011‐12. To assist Districts in achieving the goals, the Community College Chancellor’s Office will provide an incentive of 2% of construction costs for new construction and 3% for modernization projects. To learn more about the CCC Board of Governors Energy and Sustainability Policy, visit http://extranet.cccco.edu/Portals/1/CFFP/Facilities/Cap_Outlay_Docs/3‐1_energy_sustainability.pdf
6.2.2.2 Electric and Gas Utility Incentives Districts can give their energy efficiency project economics a boost by applying for incentives through the California Community College/Investor Owned Utility (CCC/IOU) Energy Efficiency Partnership. For the 2010‐2012 program cycle, Districts receive incentives for reducing annual energy use and are paid $0.24 per kWh and $1.00 per therm saved and can recover up to 80% of the project capital cost. Qualifying projects include energy efficiency retrofits, Monitoring Based Commissioning (MBCx), and energy efficient new construction (formerly known as Savings by Design). However, these incentive rates are only good for the current program cycle, which is scheduled to finish at the end of 2012 at the time of this Guidebook’s publication. The CPUC and the utilities are currently evaluating the renewal of these incentive rates in the next program cycle planned for 2013‐2014. Outside of the CCC‐IOU Partnership the IOUs also offer incentives through their “core” programs, and commercial and institutional customers can receive $0.09/kWh, $1/therm, and $100/peak kW reduced for up to 50% of the project cost of energy efficiency measures. Learn more about the CCC/IOU Partnership at: http://cccutilitypartnership.com/ or contact the District’s PG&E, SCE, SDG&E, or SCG Account Manager for more information.
6.2.2.3 On‐Bill Financing (OBF)
On‐Bill Financing is an IOU mechanism that enables colleges to finance energy efficiency projects with loans that are repaid through their utility bill. On‐Bill Financing availability and terms vary between utilities, and colleges interested in On‐Bill Financing should contact their IOU Account Manager to learn more.

SECTION 6. ECONOMICS OF SUSTAINABILITY 23
6.2.2.4 Local Government Energy Efficiency Partnership
If an energy efficiency project reaches beyond the boundaries of the campus, Districts may be able to partner with local government to receive incentives through a Local Government Energy Efficiency Partnership with the IOUs, which are similar to the CCC/IOU Partnership.
6.2.2.5 Sustainable Communities Program The IOUs also offer a Sustainable Communities program that provides technical services and other resources to assist local governments with the preparation of Climate Action Plans and GHG reduction efforts. In addition, the Statewide Energy Efficiency Collaborative (SEEC) is a partnership between the IOUs, the Local Government Commission (LGC), the Institute for Local Government (ILG), and ICLEI‐Local Governments for Sustainability that also provides technical training and other resources for local governments to improve energy efficiency, reduce costs, and reduce GHG emissions. More information on the SEEC program can be found here: http://californiaseec.org/
6.2.2.6 Water and Wastewater Utility Incentives Districts may be able to receive monetary incentives or other assistance for reducing water use and waste water disposal through their local water utility and waste water district. Districts should contact the appropriate agencies to find more information about the incentives and other resources locally available to them.
6.2.2.7 Municipal Solid Waste Agency and CalRecycle The local municipal solid waste agency or franchise waste hauler may be able to provide resources to assist in waste management, such as free composting, recycling collection bins, or other financial support. CalRecycle, the statewide Department of Resources Recycling and Recovery, provides free recycling starter kits with recycling bins to collect CRV beverage containers. To learn more about CalRecycle, see http://www.calrecycle.ca.gov/
6.2.2.8 Municipal Transit Agency Where available, the local Municipal Transit Agency (MTA) may be able to provide financial or implementation assistance for programs that reduce single passenger vehicle ridership and reduce Vehicle Miles Traveled (VMTs) through public transportation, alternative transportation, and carpooling. Districts should contact their local MTA to find more information about resources locally available to them.
6.2.2.9 Government Grants
The availability of government grants is constantly changing. Districts can find more about federal and state grants available through the following websites, which consolidate the available grants from all government departments:
24 SECTION 6. ECONOMICS OF SUSTAINABILITY
Federal Grants: http://grants.gov/ California State Grants: http://www.ca.gov/Grants.html Districts may find it easier to handle grant paperwork when partnering with local governments or nearby colleges and universities.
6.2.2.10 State Energy Efficiency Loans
Colleges can also apply for other state and federal loans, such as the loans available through the California Energy Commission. At the time of this Guidebook’s publication, the California Energy Commission was accepting applications for their 3% interest loan for energy efficiency and renewable energy projects. The repayment schedule is up to 15 years and will be based on the annual projected energy cost savings from the aggregated projects. Colleges are eligible to apply for this loan, and more information can be found on their website at: http://www.energy.ca.gov/efficiency/financing/index.html Colleges can also explore options like Energy $mart, which is a financial marketplace opened by the California Department of General Services designed to make financing energy transactions easier. Through Energy $mart, participating lenders can offer financing options that meets all the requirements of a competitively bid process. At the time of publication, however, no lenders are participating due to the state budgetary crisis, though this may change in the future. To learn more about Energy $mart, visit the California Department of General Services website at: http://www.dgs.ca.gov/pd/Programs/StateFinancialMarketplace/Energy.aspx
6.2.2.11 Certificate of Participation (COP)
Instead of issuing a bond, colleges can fund projects via Certificates of Participation (COPs), which allow would‐be bond buyers to instead purchase a share of the ownership in the construction or capital improvement. The college would then lease the investor’s ownership and may installment payments to the lease. When construction is finished, the college assumes full ownership of the completed project. This mechanism is mostly used by municipal governments or other government entities when there is a debt ceiling, though community colleges are also able to use COPs to fund large projects.
6.2.2.12 Student Fees or Financing In some cases, the student body may wish to finance sustainability projects through fees imposed on students or through fundraising efforts. These would generally be smaller programs or projects but may be well suited to recycling efforts, on‐campus food growing, or carpooling efforts, or other projects that directly benefit the student body.

SECTION 6. ECONOMICS OF SUSTAINABILITY 25
6.2.2.13 Foundation for California Community Colleges (FCCC)
The Foundation for California Community Colleges (FCCC) supports the CCCs by developing programs and services available to all of the Districts. An example of the services provided by the FCCC is the system‐wide FUSION database, which tracks information gathered from facilities assessment, scheduled maintenance, and new construction projects and is used for planning, reporting, and tracking. Current efforts are underway to combine the FUSION database, sophisticated Building Integrated Management (BIM) tools, and energy efficiency evaluations in a way to help Districts better plan for sustainability. For more information about the FCCC, visit http://www.foundationccc.org/
6.3 EFFECTS DIFFICULT TO QUANTIFY In addition to the financial costs and benefits, Districts should evaluate the effects of sustainability projects that are difficult to quantify but can have significant benefits and make a difference in the desirability of a project. Sustainability measures can improve the local, regional, or global environment. Certain actions, such as reducing vehicle idling, can help improve the air and water quality close to the campus, while carpooling and energy efficiency can improve the air and water quality on a regional scale by reducing highway traffic and power plant emissions, respectively. A District’s actions can have global impacts when, for example, the campus reduces consumption from unsustainably harvested and manufactured materials, or sources materials and supplies locally rather than internationally to reduce transportation greenhouse gas emissions. Improving air quality has positive health effects on the larger population. Ozone in the local environment is detrimental to human health, has been tied to increased asthma rates, and is created from tailpipe pollutants and power plants. More information on the health impacts of ozone and asthma can be found on the US EPA website here: http://www.epa.gov/apti/ozonehealth/effects.html Sustainable practices can create green jobs by directly creating a need for skilled labor and specialists in the industry. As the green economy grows, costs for green technology will continue to decrease and further contribute to the growth of the industry and creation of additional green jobs. Community Colleges are natural incubators for skilled employees for the green economy and can create curriculum to fill this vital need. Sustainability projects can often bring good publicity to the campus and can increase a District’s attractiveness to potential students, new staff, and the surrounding community. Districts known for success in sustainability may also find it easier to secure external funding for future projects. Finally, as an academic institution, Districts should consider the impacts on classroom and research activities while the projects are being implemented and explore any possible synergies with curriculum development. Additionally, improvements in the energy systems of a building, which can reduce noise and indoor air pollutants and increase thermal comfort, and increased daylight in a building can improve comfort and productivity of students and employees. More details on the impacts of green buildings on

26 SECTION 6. ECONOMICS OF SUSTAINABILITY
productivity can be found in a report published by the National Academic Press and available at http://www.nap.edu/catalog.php?record_id=11756
6.4 RISK MANAGEMENT AND MITIGATION Implementing sustainability projects can also be an effective risk management strategy. For example, by taking early action on GHG reductions a District can reduce litigation risk associated with California Environmental Quality Act (CEQA) challenges to Master Planning activities and will be better poised to meet any future AB‐32 regulatory requirements that arise. Several local governments have already experienced CEQA challenges from the State of California resulting from inadequate GHG reduction strategies associated with city General Plans. Reducing energy consumption reduces campus exposure to fluctuating electricity and natural gas prices, which can be seen from the historical electricity and natural gas prices shown at the beginning of this section. Districts in areas that experience droughts and water shortages will be able to more easily adapt to mandated conservation requirements and reduce or avoid penalties imposed for excessive water use. Finally, improved health and safety from sustainability projects may reduce litigation risk from student and faculty exposure to dangerous or unhealthy conditions.

APPENDICES J‐1
PROPOSITION 39: CLEAN ENERGY JOBS ACT OF 2012
APPENDIX J CCC GUIDANCE PROCESS FLOWCHART

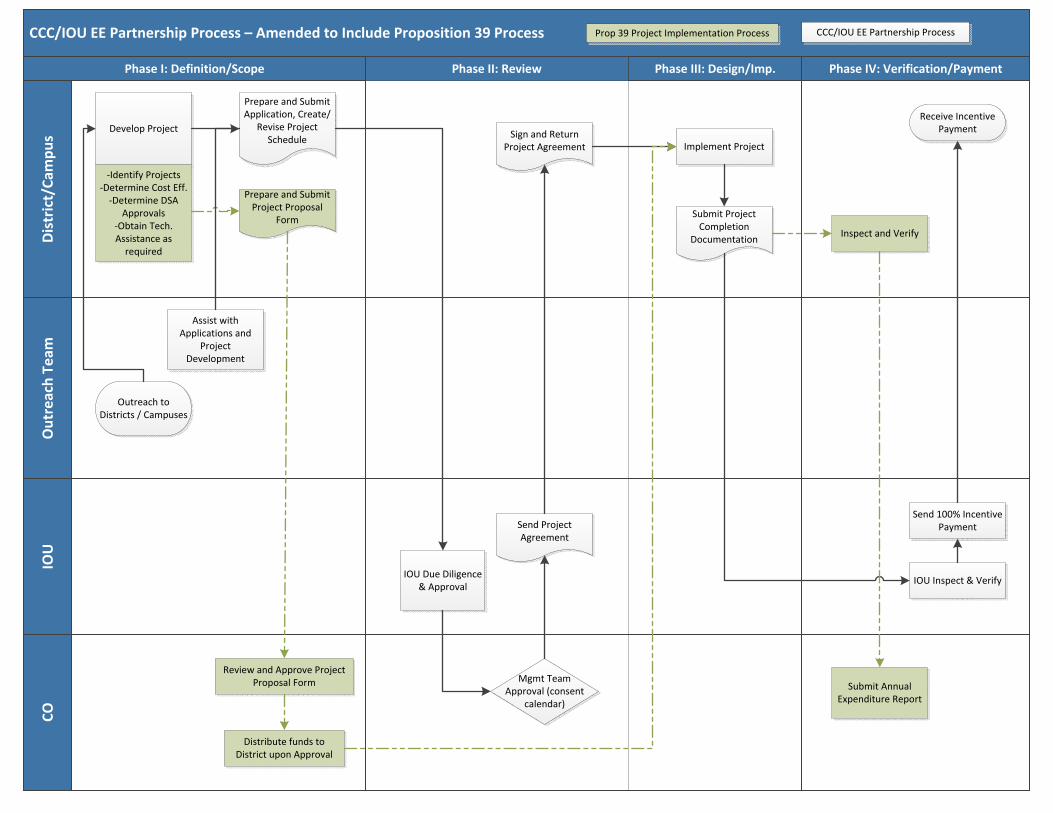
CCC/IOU EE Partnership Process – Amended to Include Proposition 39 ProcessO
utr
eac
h T
eam
Dis
tric
t/C
amp
us
IOU
CO
Phase IV: Verification/PaymentPhase III: Design/Imp.Phase II: ReviewPhase I: Definition/Scope
IOU Due Diligence & Approval
Develop Project
Send Project Agreement
Prepare and Submit Application, Create/
Revise Project Schedule
Outreach to Districts / Campuses
Assist with Applications and
Project Development
Review and Approve Project Proposal Form Mgmt Team
Approval (consent calendar)
Prepare and Submit Project Proposal
Form
-Identify Projects-Determine Cost Eff.
-Determine DSA Approvals
-Obtain Tech. Assistance as
required
Sign and Return Project Agreement Implement Project
Submit Project Completion
Documentation
Receive Incentive Payment
Send 100% Incentive Payment
IOU Inspect & Verify
Inspect and Verify
Submit Annual Expenditure Report
Distribute funds to District upon Approval
Prop 39 Project Implementation Process CCC/IOU EE Partnership Process
APPENDICES K‐1
PROPOSITION 39: CLEAN ENERGY JOBS ACT OF 2012
APPENDIX K RESOURCES LIST The following is a compilation of resources organized by the topics in sustainability listed below. Energy Efficiency California Community Colleges/Investor Owned Utilities (CCC/IOU) Energy Efficiency Partnership PG&E, SCG, SDG&E, and SCE http://cccutilitypartnership.com/ Demand Response Information on Demand Response and Links to IOU Demand Response Programs California Public Utilities Commission http://www.cpuc.ca.gov/PUC/energy/Demand+Response/ Monitoring Based Commissioning (MBCx) Project Requirements A document that describes the basic steps necessary for the implementation of MBCx projects at CCC’s, CSU’s, and UC’s http://cccutilitypartnership.com/seminars/2009MBCxProjectRequirementsFINAL.pdf Measure and Report Performance American Public Power Association (APPA)‐ Facilities Performance Indicators (FPI) An online platform that provides data, statistical references, and reporting tools needed to measure operations and performance and identify capital asset realities http://www.appa.org/benchmarking.cfm Energy Star Portfolio Manager for Benchmarking An online platform that rates energy performance on a scale of 1‐100 relative to similar facilities nationwide https://www.energystar.gov/index.cfm?c=higher_ed.bus_highereducation Sustainability Tracking, Assessment, and Rating System (STARS) Campus Sustainability Self‐Rating System Association for the Advancement of Sustainability in Higher Education (AASHE) https://stars.aashe.org/ The College Sustainability Report Card Campus Sustainability Rating System Sustainable Endowments Institute http://www.greenreportcard.org/

K‐2 CCC Energy Efficiency Project Guidance
PROPOSITION 39: CLEAN ENERGY JOBS ACT OF 2012
Sierra Club Cool Schools Campus Sustainability Ranking System Sierra Club http://www.sierraclub.org/sierra/201009/coolschools/default.aspx Princeton Review Green Rating Campus Sustainability Rating System http://www.princetonreview.com/green‐honor‐roll.aspx Policy and Regulatory Drivers CCC Board of Governors Energy and Sustainability Policy http://extranet.cccco.edu/Portals/1/CFFP/Facilities/Cap_Outlay_Docs/3‐1_energy_sustainability.pdf Economics and Financing of Sustainability Projects Accelerating Campus Climate Initiatives Rocky Mountain Institute & Association for the Advancement of Sustainability in Higher Education http://www.aashe.org/files/documents/resources/RMI_AcceleratingCampusClimateInitiatives.pdf Best Practices Toolkit: Energy Performance Contracting for Higher Education The American College & University’s Climate Commitment; The Clinton Foundation’s Climate Initiative http://www.presidentsclimatecommitment.org/resources/eebrp/toolkit Building Life‐Cycle Cost (BLCC) Program National Institute of Standards and Technology http://www1.eere.energy.gov/femp/information/download_blcc.html California Cap‐and‐Trade Program California Air Resources Board http://arb.ca.gov/cc/capandtrade/capandtrade.htm California Community Colleges/Investor Owned Utilities (CCC/IOU) Energy Efficiency Partnership PG&E, SCG, SDG&E, and SCE http://cccutilitypartnership.com/ California State Grants An Online Database of California State Grants Available http://www.ca.gov/Grants.html CalRecycle California Department of Resources Recycling and Recovery http://www.calrecycle.ca.gov/

APPENDICES K‐3
PROPOSITION 39: CLEAN ENERGY JOBS ACT OF 2012
Climate Reserve Tonnes Certified Carbon Reduction Credits Climate Action Reserve http://www.climateactionreserve.org/ ECONPACK Economic Analysis Tool U.S. Army Corps of Engineers http://www1.eere.energy.gov/femp/information/download_blcc.html Federal Grants An Online Database of Federal Grants Available http://grants.gov/ Energy Efficiency Financing California State Loans for Energy Efficiency and Renewable Energy Projects California Energy Commission http://www.energy.ca.gov/efficiency/financing/index.html Energy $mart Financing for Energy Efficiency and Renewable Energy Projects California Department of General Services http://www.dgs.ca.gov/pd/Programs/StateFinancialMarketplace/Energy.aspx Foundation for the California Community Colleges http://www.foundationccc.org/ Green Schools: Attributes for Health and Learning A Review of the Quality of Indoor Environments and their Impact on Productivity Committee to Review and Assess the Health and Productivity Benefits of Green Schools, National Research Council http://www.nap.edu/catalog.php?record_id=11756 Greening the Bottom Line Green Revolving Funds Sustainable Endowments Institute http://www.greeningthebottomline.org/ Health Effects of Ozone in Patients with Asthma US EPA http://www.epa.gov/apti/ozonehealth/effects.html Life Cycle Cost Assessment Model California Green Building Initiative http://www.green.ca.gov/LCCA/default.htm
K‐4 CCC Energy Efficiency Project Guidance
PROPOSITION 39: CLEAN ENERGY JOBS ACT OF 2012
Recycle Mania Resources for Reducing Waste on College Campuses http://recyclemania.com/ Renewable Energy Certificates California Public Utilities Commission http://www.cpuc.ca.gov/PUC/energy/Renewables/FAQs/05REcertificates.htm StopWaste.Org Resources for Waste Reduction Alameda County Waste Management Authority http://stopwaste.org/ Sustainable Communities Program Statewide Energy Efficiency Collaborative http://californiaseec.org/ The Costs and Financial Benefits of Green Buildings A Report to California’s Sustainable Building Task Force http://www.usgbc.org/Docs/News/News477.pdf Sustainable Building Practices Campus Green Builder A Portal to Green Building Information for Higher Education Institutions http://www.campusgreenbuilder.org LEED Rating Systems US Green Building Council http://www.usgbc.org/DisplayPage.aspx?CMSPageID=222 On‐Site Generation and Renewable Energy Community Choice Aggregation Resources and Information about Community Choice Aggregation California Public Utilities Commission http://www.cpuc.ca.gov/PUC/energy/Retail+Electric+Markets+and+Finance/070430_ccaggregation.htm

APPENDICES L-1
PROPOSITION 39: CLEAN ENERGY JOBS ACT OF 2012
APPENDIX L ANNUAL EXPENDITURE REPORT (Under Development)