proposed health professionals council of · pdf filesouth african colorectal society ... 2.8...
TRANSCRIPT

Unit 16, Northcliff Office Park 203 Beyers Naude Drive Northcliff, 2115
Tel: (+27)(11) 340 9000, Fax: (+27)(11) 782 0270 Email: [email protected]
P.O. Box 2127, Cresta, Johannesburg, 2118
Directors: J Mook (Chair), S Grobler, P Matley, S Pillay, M Wellsted; Company Secretary: Healthman
The General Manager: Professional Boards 21st February 2013
Health Professions Council of South Africa
P.O. Box 205, Pretoria, 0001;
Emailing to:
Bertha Peters-Scheepers, Senior Manager: Public Relations and Service Delivery, HPCSA
[email protected]; Tel: 012 338 9481/ 079 510 4186
Note: Hard copy by courier delivery for your attention.
PROPOSED HEALTH PROFESSIONALS COUNCIL OF SOUTH AFRICA
GUIDELINE TARIFFS: REQUEST FOR COMMENTS
SUBMISSION BY SURGICOM ON BEHALF OF SPECIALIST SURGEONS
Dear Sir / Madam / Colleague
Please find enclosed our submission in respect of your request for comments on the
proposed HPCSA Guideline Tariffs.
Yours Truly
Dr Stephen Grobler
MMed (Chir) (Gastroenterol)
Surgicom Director

SUBMISSION BY SURGICOM FOR SPECIALIST SURGEONS
REQUEST FOR COMMENTS:
PROPOSED HEALTH PROFESSIONALS COUNCIL OF SOUTH AFRICA
GUIDELINE TARIFFS
Contact details: Stephen Grobler, Casper Venter, Surgicom
Unit 16, Northcliff Office Park 203 Beyers Naude Drive Northcliff, 2115
Tel: (+27)(11) 340 9000, Fax: (+27)(11) 782 0270 Email: [email protected]; [email protected]
P.O. Box 2127, Cresta, Johannesburg, 2118

REQUEST FOR COMMENTS: PROPOSED HEALTH PROFESSIONALS
COUNCIL OF SOUTH AFRICA GUIDELINE TARIFFS:
SUBMISSION BY SURGICOM FOR SPECIALIST SURGEONS
Table of Contents
1 Surgicom Representation and Scope of Practice
2 Introduction
3 The Association of Surgeons of South Africa: Comparative Study into the Remuneration and Working Conditions of General Surgeons in South Africa
4 What constitutes an appropriate ethical standard or tariff when assessing the conduct of health professionals?
5 Coding and Tariffs
5.1 Procedural Coding – scope of practice and terminology
5.2 Procedural Coding – unit values
5.3 Procedural Coding – billing rules
6 Procedural Coding, rcfs and Tariffs
7 Practice Cost Studies
8 After the Practice Cost Studies
Conclusions
Appendix 1. Briefs by Surgical Societies
Appendix 2. Colleges of Medicine of SA (CMSA) President's Survey of numbers of practicing Specialists
Appendix 3. The Association of Surgeons of South Africa: Comparative Study into the Remuneration and Working Conditions of General Surgeons in South Africa. 2007
Appendix 4. Articles: Kahn D, et al. South African Journal of Surgery Volume 44(3) August 2006:
a. General surgery in crisis – the critical shortage. b. General surgery in crisis – comparatively low levels
of remuneration. c. General surgery in crisis – factors that impact on a
career in general surgery

Unit 16, Northcliff Office Park 203 Beyers Naude Drive Northcliff, 2115
Tel: (+27)(11) 340 9000, Fax: (+27)(11) 782 0270 Email: [email protected]
P.O. Box 2127, Cresta, Johannesburg, 2118
Directors: J Mook (Chair), S Grobler, P Matley, S Pillay, M Wellsted; Company Secretary: Healthman 1/25
The General Manager: Professional Boards 21st February 2013
Health Professions Council of South Africa
P.O. Box 205, Pretoria, 0001;
Emailing to:
Bertha Peters-Scheepers, Senior Manager: Public Relations and Service Delivery, HPCSA
[email protected]; Tel: 012 338 9481/ 079 510 4186
Note: Hard copy by courier delivery to 553 Madiba (previously Vermeulen) Street,
Arcadia, Pretoria, 0002 for your attention.
REQUEST FOR COMMENTS: PROPOSED HEALTH
PROFESSIONALS COUNCIL OF SOUTH AFRICA
GUIDELINE TARIFFS:
SUBMISSION BY SURGICOM FOR SPECIALIST SURGEONS
1 Surgicom Representation and Scope of Practice
1.1 Surgicom hereby places a separate submission before HPCSA on the proposed
“guideline tariffs”. This submission will emphasise some of the issues pertaining to
specialist surgeons in private practice in South Africa. This submission must be read
in conjunction with the prior and later submissions by the Profession, particularly
the detailed submissions by the South African Private Practitioners Forum
(“SAPPF”), Healthman, Webber Wentzel Attorneys, Genesis Analytics and others.

Surgicom for Specialist Surgeons to HPCSA on Proposed Tariff Guideline 2013 2/25
1.2 Surgicom was established as the business arm of the Association of Surgeons of
South Africa (ASSA) in 1996 to manage strategic private practice matters for General
Surgeons. Surgicom is a public company owned and managed by General Surgeons.
1.3 Surgicom herein also acts on behalf of The Federation of South African Surgeons
(FoSAS). FoSAS was recently established to represent multiple surgical societies,
other surgical organisations and interest groups in South Africa. FoSAS comprises
the Association of Surgeons of South Africa (ASSA), the College of Surgeons of South
Africa (CSSA), the South Africa Association of Paediatric Surgeons (SAAPS), the
South African Colorectal Society (SACRS), the Hepato Pancreatico Biliary Association
of South Africa (HPBASA), the Surgical Research Society of Southern Africa (SRSSA),
the South African Society of Endoscopic Surgeons (SASES), the South African Society
of Surgeons in Training (SASSiT), the South African Transplantation Society (SATS),
the Trauma Society of South Africa (TSSA) and the Vascular Society of Southern
Africa (VASSA). FoSAS has enjoined the Society of Neurosurgeons of South Africa
(SNSA) and the South African Society of Anaesthesiologists (SASA) in its consultative
framework. Letters of support for this submission are enclosed as Appendix 1.
1.4 We represent approximately 350 general surgeons in full time or limited private
practice. There are some 800 registered general surgeons in South Africa, of whom
about 635 are active surgeons.1
2 Introduction
2.1 On 7th December 2012 the Medical and Dental Board (MDB) gave notice of its
intention to embark on a new process to determine and publish a tariff of fees as
contemplated in section 53(3)(d) of the Health Professions Act, 56 of 1974 (“the
Act”). This notice followed an unsuccessful attempt by HPCSA a few months earlier
to implement a new “ethical tariff” guideline for medical and dental practitioners.
The averred purpose of the new guideline was to direct practitioners in billing and
1. College of Medicine of South Africa (CMSA) President’s survey in 2011 indicated a total of 635 Specialist
General Surgeons in South Africa, of whom 332 are in private practice (Practice Number prefix -042). See Appendix 2. for further details.

Surgicom for Specialist Surgeons to HPCSA on Proposed Tariff Guideline 2013 3/25
rendering of accounts to patients, and to enable the HPCSA to adjudicate on
complaints of overcharging. 2
2.2 It is averred by most of our associates and advisors that directing of practitioners in
billing and rendering of accounts to patients falls outside of the statutory mandate
of the HPCSA and that the only authorised purpose of a guideline tariff as mandated
by section 53 was to enable the HPCSA to adjudicate on complaints of overcharging.
2.3 We have noted the revised terms of reference and methodology proposed by
HPCSA for the proposed tariff guideline for medical practitioners and dentists.
2.4 Any person or entity wishing to effectively and successfully develop and implement
a normative guideline to serve as a professional standard must ensure that the
guideline adheres to the principles of legality, rationality, consistency, openness and
impartiality. Such an entity must have the legal authority to do so, i.e. an explicit
and clear legislative framework for doing so. This is even more important where
the guideline aims to establish a norm that will be used in the assessment of what
constitutes unacceptable professional conduct on the part of a practitioner, such as
instances of overcharging.
2.5 It is our contention that the HPCSA foray into tariff last year was ill-advised,
reactionary and a waste of resources. Whilst HPCSA may be able to justify their
actions on political grounds, we respectfully submit that HPCSA neither has the legal
mandate nor the resources to perform this assumed task without the assistance of
the professional service providers (doctors, dentists and allied professions),
hospitals, pharma and the supply industry. A project of this magnitude has already,
in the ill-fated RPL process, run into difficulties due to the complexities in such a
process and the perceived objective of price setting (as opposed to price
benchmarking).
2. Mandate of HPCSA as per the Health Professions Act 56 of 1974 Section 53: fees charged by registered
persons - Section 53(3)(d) empowers the professional boards to determine and publish Guideline Tariffs. The purpose of such Tariff is to assess complaints by members of the public on overcharging by registered professionals. An advisory opinion was obtained from the Competition Commission which confirmed the HPCSA’s mandate and proposed process for formulating a new tariff. The initial process of determining a tariff was renewed afresh due to many complaints by professional associations regarding participation and the base tariff to be used (Presentation by Dr BN Mjamba-Matshoba, HPCSA Registrar/CEO).
Surgicom for Specialist Surgeons to HPCSA on Proposed Tariff Guideline 2013 4/25
2.6 We recognise that the modernisation of coding and setting of tariffs has been
stalled by a multitude of complex interdependencies. The perception exists that
there has been a general market failure.
2.7 We believe that emphasis must be directed to the real issues, viz. urgent
intervention to establish a multi-party coding and tariff forum that has the legal
framework (including the blessing of the Competition Authorities) to forge
transparent consultative processes on coding and tariffs. This entails either utilising
the existing provisions in the National health Act or establishing a new legislative
framework. The processes must support the common goals of promoting access to
and quality of care for all in South Africa and the requirements of an NHI.
2.8 An HPCSA guideline tariff is an option that is ostensibly an immediate solution (in
the opinions of Council for Medical schemes-CMS and HPCSA). Other processes
that are in the offing are a health sector Competition Commission market enquiry
and a statutory pricing authority.3
2.9 We advise HPCSA against an internal project to develop a reference tariff. If HPCSA
were to continue this project unilaterally, we predict concerted legal challenge. Our
recommendation is that we embark on a broad, collaborative process to develop a
coding and tariff structure that would be robust, yet adaptable, but foremost, a
proud, endorsed and legal product. We would welcome, approve and heartily
support the HPCSA, as one of the role players, to develop, maintain and govern a
modern, appropriate coding structure and cost-based tariffs on these premises.
2.10 HPCSA must continue its governance mandate in general practice affairs, such as
informed consent (including financial disclosure and agreements), elimination of
“kick-backs”, dishonest billing (e.g. split billing, unbundling, cosmetic surgery under
the guise of clinical necessity) and other perverse or irregular business practices, as
is permitted by its legislative framework.
2.11 Most of the coding and tariff complaints should have been prevented by adequate
communication to ensure and counsel upon medical necessity and appropriateness,
befitting ethical financial conduct, an honest advisory process, including
3. Monwabisi Gantsho, CMS Registrar and CEO before Health Portfolio Committee 31st October 2012.

Surgicom for Specialist Surgeons to HPCSA on Proposed Tariff Guideline 2013 5/25
confirmation of benefits with Schemes, particularly in cases of expensive or unusual
treatment plans. This is why we are called to be and deemed as professionals and
specialists and doctors!
2.12 Surgicom, ASSA and FoSAS welcome referrals of cases for peer review and audit and
would propose that the HPCSA utilise this mechanism to address section 53
complaints.
3 The Association of Surgeons of South Africa: Comparative Study
into the Remuneration and Working Conditions of General
Surgeons in South Africa4
3.1 The Association of Surgeons in South Africa (ASSA) commissioned an independent
study, carried out by P-E Corporate Services, into the remuneration and working
conditions of General Surgeons in South Africa. The study was prompted by
3.1.1 Growing concerns within ASSA about the diminishing number of applicants
that were presenting themselves for General Surgery training in South Africa;
and
3.1.2 The consequent increase in the number of General Surgery posts that were
vacant in the State sector.
Terms of reference for the study focussed particularly on remuneration and working
conditions of General Surgeons and covered those employed in both the State and
Private Sectors.
3.2 ASSA’s concerns were well founded. A progressive and serious decline was noted in
both the earnings and working conditions of General Surgeons – and particularly
those employed within the State sector. A significant and meaningful disparity
existed between earnings of General Surgeons and other professionals working
within the State sector, and the earning potential of General Surgeons who choose
to emigrate from South Africa. State sector shortages (vacancies) had reached
alarming proportions and the profession was in crisis. Extreme shortages of
qualified personnel had led to a situation in which many General Surgeons and
4. See Appendix 3 for the complete report and related articles published in peer reviewed journals.
Surgicom for Specialist Surgeons to HPCSA on Proposed Tariff Guideline 2013 6/25
Registrars were working dangerously long hours and often in inadequately equipped
and poorly managed hospital environments.
An analysis and comparison of remuneration earned by General Surgeons in State
sector employ indicated that earnings lagged those of other professionals in State
and Public Sector employ by significant margins. Differentials of 30 to 40 percent
existed between earnings of recently qualified General Surgeons and professionals
such as legal practitioners, engineers, municipal managers and airline pilots, at
comparable levels of seniority and responsibility. General Surgeons in State employ
were also relatively poorly remunerated in relation to their international
counterparts. Low, uncompetitive levels of remuneration coupled with long
working hours and sub-standard facilities inevitably impacted the lifestyle of
General Surgeons who choose to remain in State sector employ.
3.3 To the extent that these conditions had been allowed to deteriorate and continued
to do so, they provided a growing incentive for General Surgeons to seek alternative
work opportunities internationally.
3.4 The data appeared to strongly support the contention that General Surgeons in
private practice were poorly remunerated relative to their peers in other
specialities. An analysis of movements in fee rates for defined General Surgery
procedures indicated that fee rate increases had slipped during the period of high
inflation between the mid 1980’s and early 1990’s. A “common currency”
comparison of South African fee rates (for the same defined procedures) with those
in Australia and the U.K. revealed that Australian rates were, on average, 2 to 3
times those in South Africa, and U.K. rates between 4 and 9 times South African
rates. To the extent that such rates could be taken as indicative of earnings
differentials, they would suggest that General Surgeons in private practice in these
countries enjoyed considerably better earnings and living conditions than those in
South Africa.
3.5 Perceptions among recently qualified specialists interviewed about their choice of
General Surgery as a career were that the profession continued to enjoy high status
in South African society – but largely as a result of its intellectual standing. There
was widely held belief that poor and declining earnings levels had adversely

Surgicom for Specialist Surgeons to HPCSA on Proposed Tariff Guideline 2013 7/25
impacted the profession’s status in recent years. The concern was expressed that
factors such as declining earnings potential, changes in work environment and
standards, community service requirements, etc., would place even further pressure
on already critical shortages in South Africa.
4 What constitutes an appropriate ethical standard or tariff when
assessing the conduct of health professionals?
4.1 The determination of fair and reasonable professional ethical standards or norms is
challenging due to different (sometimes conflicting) values found in our society with
its troubled history and immense social challenges, great socioeconomic disparity,
diverse customs, beliefs, religions and cultures.
4.2 It is critically important that any proposed guideline tariffs intended to serve as a
norm for the determination of an amount that a practitioner should have charged
for a service (viz. “ethical tariff”) be clearly distinguished from a “reimbursement
tariff”. A reimbursement tariff is defined as a particular tariff or price that forms
the basis for or guides reimbursement by a third party payer or guarantor (e.g.
medical scheme, insurance company, WCA, RAF, civil claims) for a particular service
or product rendered by a practitioner.
4.3 In South Africa a reimbursement tariff is closely linked with the reference price
list(s) envisaged under section 90(v) of the National Health Act, 61 of 2003.
4.4 Following the consent orders issued by the Competition Commission in 2004 / 2005
against the Board of Healthcare Funders (BHF), the South African Medical
Association (SAMA) and the Hospital Association of South Africa, healthcare
providers and funders were no longer allowed to negotiate and agree on a
reimbursement tariff as this was seen as collusion and price fixing in contravention
of the Competition Act, 89 of 1998. In the absence of a negotiated tariff, CMS and
subsequently the Department of Health (under section 90(v) of the National Health
Act) embarked on a process to determine and implement a reference pricing system
in the private health care sector.

Surgicom for Specialist Surgeons to HPCSA on Proposed Tariff Guideline 2013 8/25
4.5 The introduction of a National Health Reference Price List (“NHRPL”) determined by
CMS in 2006 and the Reference Price List (“RPL”) determined by the Department of
Health in 2007 onwards, led to a decision by the HPCSA in 2008 to scrap its
published ethical tariff which had served as the standard used to evaluate
complaints of alleged overcharging by practitioners. Instead it was proposed that
ethical conduct in respect of the charging of fees by practitioners should be
assessed in accordance with the principles of informed consent having regard to the
RPL (in the case of uninsured patients) or the relevant medical scheme rate (in the
case of insured patients). The medical scheme rate as determined by the individual
medical schemes was at the time also based on the RPL.
4.6 In 2010 the RPL (and all its previous versions), as determined and implemented by
the Department of Health (“DoH”), was declared null and void by the North
Gauteng High Court. The Court found that the process followed by the DoH as well
as the content of the various guidelines published by the DoH in determining the
RPL, was unlawful and not in accordance with established law. In particular, the
Court found that any person or entity acting in accordance with a provision in law
must always adhere to the purpose of the specific law. It must be stressed that the
court did not find section 90(v) or the principle of benchmarked price lists unlawful
or unconstitutional, but rather the manner in which the process had been
implemented.
4.7 In the absence of a RPL and with no ethical tariff in place, MDB of HPCSA has no
clear criteria, standard or norm against which to consider complaints of
overcharging by practitioners.
4.8 The only way to consider allegations of unprofessional conduct is therefore to rely
on the principle of informed consent (as prescribed by the National Health Act and
as required by the ethical rules of conduct). It should also be noted that, apart from
the National Health Act, the Consumer Protection Act and the Competition Act also
provide patients with remedies against unfair, unreasonable and/or exploitative
pricing.

Surgicom for Specialist Surgeons to HPCSA on Proposed Tariff Guideline 2013 9/25
4.9 The benchmark of what is “ethical” (i.e. distinguishes acceptable from unacceptable
conduct) is an objective assessment of the fairness and reasonableness of the fees
charged, having regard to all relevant factors, such as the complexity of the services
rendered and the seniority and skill of the practitioner involved.
4.10 The former ethical tariff published by the HPCSA was calculated by using the fees
recommended by SAMA plus 20%. It is within this 20% that weights according to
relevant factors such as complexity of the service, skill and level of training,
seniority and experience, geographic location and practice costs and difficulty of
service could be apportioned. It is respectfully submitted that such a guideline is
more appropriate as it observes what is fair and sensible.
5 Coding and Tariffs
5.1 The differences between coding and tariffs must be appreciated, although complex
interdependence exists.
5.2 Procedural Coding – scope of practice and terminology
5.2.1 It is important to note and understand that the scope of practice, naming,
description and coding of procedures is the right and responsibility of the
profession and its subgroupings. These codes have been formally maintained
in a responsible, peer-reviewed and transparent process by specialist societies,
SAMA and SAPPF.
5.2.2 Any contemplation of scope of practice, naming, description and coding of the
procedures must be a valid, current, authorised derivative of the prevailing
codes, currently the 2013 version of the SAMA Doctors’ Billing Manual (DBM).
5.3 Procedural Coding – unit values
5.3.1 Unit values are assigned by the profession to procedural codes to reflect the
relative values linked to time, effort, complexity, risk, costs and utilisation.
These are called relative value units (RVUs). In the SAMA DBM all codes and
unit values have been harmonised for inter-disciplinary relativity, inter alia by
referencing according to the RVUs from the Complete CPT® for South Africa
(CCSA) based on the American Medical Association (AMA) Current Procedural

Surgicom for Specialist Surgeons to HPCSA on Proposed Tariff Guideline 2013 10/25
Terminology (CPT®). All codes and unit values are under annual scrutiny by
coding and tariff committees and peer review processes; adjustments may be
required to reflect changes in practice, procedural components, costs,
interdisciplinary relativities and utilisation.
5.3.2 General surgeons have been using CPT-based billing with validated ICD-10
codes since 1998 in contractual arrangements with selected Schemes.
Hospitals and Medical Schemes commonly utilise CPT as descriptors in billing
and contractual interactions and in management software. General Surgeons
have amassed a large database and experience with CPT. We have satisfied
ourselves that CPT represents a valuable tool to express the wide range of
surgical procedures and the relative values and costs of procedures. The
RBRVS system includes many subcomponents that should form an integral
basis of our coding and billing.
5.4 Procedural Coding – billing rules
5.4.1 Services provided by a surgeon to any patient, by their very nature, are
variable. The codes that represent a readily identifiable surgical procedure
thereby include a variety of services. In defining the specific services
"included" in a given surgical code, the following services are usually included
in addition to the operation per se: local or topical anaesthesia, one related
consultation encounter on the date immediately prior to or on the date of
procedure, immediate peri-operative care, including making operative notes,
talking to family and other surgeons, writing orders, evaluating the patient in
the post-anaesthesia recovery area and typical, uncomplicated postoperative
follow-up care for a defined global period of care (usually one to three
months, less for smaller procedure and none for purely diagnostic
procedures).
5.4.2 Rule C in SAMA DBM: “comparable services”: a service may be rendered that is
not listed in the coding structure. The fee that may be charged for the
rendering of a service not listed shall be based on the fee of a comparable
service. For these procedure(s) / service(s), the use of the item must be
supported by a motivation, including adequate definition or description of the

Surgicom for Specialist Surgeons to HPCSA on Proposed Tariff Guideline 2013 11/25
nature of the procedure / service and final diagnosis supported by appropriate
ICD-10 codes.
5.4.3 Deviant billing practices, such as “unbundling” of codes are unethical. This
nefarious practice of “unbundling” ( also referred to as “code farming” or
“basket coding”) attempts to invoke a variable number of separate codes that
are added to a distinct stand-alone procedural code (thereby attempting to
increase the unit value of the main procedure by adding codes for the steps of
the procedure). “Unbundling” has been exploited by various disciplines and
practitioners in an attempt to increase the value of procedures.5
5.4.3.1 Schemes have compounded the problem by acceding to pressure from the
professional societies and authorising payments in the face of obvious
coding malpractice. Their reliance on the erstwhile BHF and CMS “RPL” lists
without the declaratory information in the SAMA DBM is another reason for
falling prey to inventive billing on the one hand or denial of payments in
other instances.
5.4.3.2 Deviant billing practices, such as the “unbundling” conundrum, are an
abusive distortion of the definitions and intended unit values and application
of codes.
5.4.3.3 The unbundling conundrum has seriously distorted interdisciplinary
relativities and harmed interdisciplinary professional relations.6
5.4.3.4 These billing peculiarities are leading criticisms of the current SAMA DBM,
and related coding and tariffs committees. This is unfair denigration of
processes dear to us. We have been careful to maintain our fiduciary and
professional responsibilities towards coding and tariffs despite constrictive
Laws and Regulations, exorbitant costs (time, manpower and intellectual
contributions) and unfair condemnations.
5. This deviant practice pressurises the guarantor into paying more than was intended by the coding and
tariff guide. Insured benefits, including in the setting of PMBs, are extorted from the entrusted Scheme benefits to increase pay-out by the Scheme and /or to diminish co-payments by the clients, as well as to circumvent unusually high fees from being exposed as unethical.
6. A scenario of specialist anaesthetist complaining that GP assistant at procedure earns way more than anaesthetist is testament of a skewed billing application. In this scenario, the general surgeon would earn the LEAST of all of the doctors in theatre‼!
Surgicom for Specialist Surgeons to HPCSA on Proposed Tariff Guideline 2013 12/25
5.4.3.5 The denunciations must be directed to:
5.4.3.5.1 The specialists and their Societies as some of them are individually and
collectively guilty of abusive billing practices.
5.4.3.5.2 The Schemes, CMS, BHF and DOH for persisting with remuneration that
is well below practice costs in most cases, yet publicly making repeated
libellous and discourteous allegations against Specialists and the
Profession.
5.4.3.5.3 The market failure that has forced some professionals to resort to up-
coding by unbundling, inappropriate utilisation of procedures and
technology and even fraud.
6 Procedural Coding, rcfs and Tariffs
6.1 Procedural unit values are translated into monetary values by using a rand
conversion factor (rcf).
6.2 2006 NHRPL does not fulfil the basic requirements of a coding and billing system in
that it has become outdated with respect to interdisciplinary relativities and lacks
many codes and relative value units for procedures that are currently in use.
6.3 The history of the development of the 2006 NHRPL needs to be understood, and
this understanding will demonstrate that it is entirely unsuitable for the task of
giving a solid and valid basis for a guideline tariff.
6.4 The early SAMA Guide to Fees was based on benchmarking studies that had
considered time and activity costs. Thus, even from early days, there was a
scientific practice cost benchmark.
6.5 A differential discounted “contracted-in” fee was later negotiated in exchange for
direct payment of the service provider by “contracted” Medical Scheme.
6.6 The origin of the 2006 NHRPL lies in the Billing Manual developed in the mid 1900’s
by the Medical Association (originally MASA, later SAMA) with codes, descriptors,
rules and unit values for each Health Intervention. An rcf was then negotiated by
SAMA, the funding industry and the Minister of Health. This rcf allowed a monetary
Surgicom for Specialist Surgeons to HPCSA on Proposed Tariff Guideline 2013 13/25
value to be allocated to each health intervention by multiplying the unit value
allocated to each code by the rcf.
6.7 The SAMA published two major rcf’s:
6.7.1 Scale of Benefits (SOB) was the monetary value that the funding industry
agreed to pay per unit (see above) for the services offered to their clients.
6.7.2 SAMA (Private Tariff) was calculated from the initial studies by the Medical
Association in the 1960’s.
6.7.2.1 This Private Tariff was used for many years by the HPCSA as a determinant in
deciding whether medical practitioners had overcharged, or not.
6.8 The SAMA Guide to Fees and later Doctors’ Billing Manual (DBM) is updated
annually by the SAMA Private Practice Committees (PPC - Specialist PPC and GP PPC)
under SAMA Private Practice Unit (PPU). Radiology left the SAMA PPC arena many
years ago and produced an independent Integrated Radiology and Imaging coding
and tariff guide. Some Specialist groups work outside of SAMA SPPC via SAPPF.
Considerable overlap and collaboration exists between SAMA SPPC And SAPPF. The
processes are public, transparent, peer-reviewed and associated with expert
technical, legal and professional governance. New codes, obsolete codes, changes
to codes or descriptors and interpretations, including interdisciplinary relativities,
equipment costs and many other issues are debated and agreed by consensus and
accompanied by comprehensive documentation.
6.9 Proposed amendments were serially negotiated with the funding industry at an
annual forum; many other market and practical issues were traded. Emanating
from this exhaustive and time-consuming process was the declaration by the
authorities (DOH, later BHF, and later CMS) of the magical rcf’s for various sections
of the tariff.7 The rcf was supposed to be the product of calculations of inflation,
e.g. Consumer Price Index (CPI) and other financial factors. Benefit designs and
actual benefits offered by the Medical Schemes were calculated, overseen by CMS.
7. Differing rcf for Consultative Services, Psychiatrists, Anaesthesiologists, Radiology, Radiation Oncology,
Ultrasound, Computed Tomography, Clinical Pathology, Anatomical Pathology – Cytology, Anatomical Pathology – Histology, Human Genetics, etc.

Surgicom for Specialist Surgeons to HPCSA on Proposed Tariff Guideline 2013 14/25
6.10 We all held our breaths each year, awaiting the 1st January declarations of the
benefits for the New Year, publication of various schedules and the invariable
moaning and legal battles that ensued.
6.10.1 Important aberrations in the negotiation and pricing process were
documented over the years since the 1960’s, mainly due to the fact that the
funding industry granted increases in the Scale of Benefit tariff that were, on
average, well below CPI, whereas the SAMA Private Tariff was tagged to CPI.
This relationship between CPI, SOB and SAMA tariffs is demonstrated in
figure 1.
Figure 1. Comparison of Private and Scale of Benefit Tariffs against CPI as cumulative percentage increase (CPI data from Stats SA and tariff from SAMA historical data). The Private Tariff increased in parallel with the CPI, remaining below CPI until 2003. The SOB increased at a rate well below CPI. In 1980 the Scale of Benefit tariff (SOB) was 73% of the Private Tariff and in 1994 it was 43% of the Private Tariff (Read CPI). In 1994, a unilateral decision by the funding industry established two levels of the SOB tariff, differentiating between the RCF for consultations and procedures/operations, the tariff for consultation being higher than for procedures. This has been maintained since the as can be seen in the graph. The consultation SOB tariff in 2003 was 42.5% of the Private tariff (read CPI), down from 73% in 1980. The Procedural SOB tariff was 32.17% of the Private tariff (read CPI), down from 73% in 1980.
6.10.2 Different rcf for consultations and procedures: BHF and later CMS erred and
seriously disadvantaged specialist surgeons by deflating the rcf for procedures,
0
50
100
150
200
250
300
CPI Cumulative%
SAMA Cumulative %
SOB Consultation Cumulative%
Proc SOB Cumulative %

Surgicom for Specialist Surgeons to HPCSA on Proposed Tariff Guideline 2013 15/25
creating an rcf for consultations significantly higher than procedures. Almost
all surgical procedure code includs perioperative and postoperative
consultative services within the defined global period of care. The effect has
been to underrate procedures as a whole and underrate their inherent
consultative services and the surgeon that supplies these services.
6.10.3 No other tariff structure differentiates consultation and procedural fees8. The
2006 NHRPL entrenches pretence where specialist surgeons are paid less for
their skilled operating time than for consulting time. Furthermore, the surgeon
is paid less for his / her consulting services compared to other non-operating
specialists.
6.10.4 This discrepancy widens each year as the same CPIX related inflator is used for
both fees. In 2010 the Discovery procedural tariff was 48% less than the
consultative tariff.
6.11 Consultative Services have been a bone of contention for many years.
6.11.1 We have advocated a tiered consultation framework to allow factors such
place (office vs. hospital vs. emergency department) and / or type of service
(initial, follow up, consultation) and the content of the service to be defined
viz. nature of the presenting problem(s), history & examination level and the
time typically spent providing the service, face-to-face, but also on the floor, or
in consultation e.g. family, professional conferences, tracing information and
writing of notes, referrals, scripts, forms. As an example we have offered the
CPT approach to consultative services. See Table 1.
No. of Diagnoses or Management Options
Amount &/or Complexity of Data
Reviewed
Risk of Complications, Morbidity/Mortality
Type of Decision Making
Minimal minimal or none Minimal Straightforward
Limited Limited Low low complexity
Multiple Moderate Moderate moderate complexity
Extensive Extensive High high complexity
Table 1. Complexity of Medical Decision Making
6.11.2 Medical Schemes have refused to invocate tiered consultations, despite an
8. Even WCA / COIDA uses parity for consultative services and clinical procedures, and have applied tiered
consultations.

Surgicom for Specialist Surgeons to HPCSA on Proposed Tariff Guideline 2013 16/25
earlier agreement to introduce tiered consultations based on time and
complexity. It is noteworthy that the tiered consultations have been iterated
in the SAMA DBM since the combined industry decision endorsed tiered
consultations.
6.11.3 Even the ailing WCA (COIDA) has incorporated tiered consultations.9
6.11.4 It is of seminal importance to note that Psychiatry have succeeded in having
their cost studies benchmarking their purely consultative services as per the
DOH and CMS RPL process accepted into the “RPL” realm, endorsed in Law,
and now successfully applied for many years, to their significant financial
advantage. Other groups that had their studies accepted have not enjoyed the
same success e.g. Anaesthesiologists.
6.11.5 Why this crazy discrimination by DOH? These anomalies were pointed out in
the scathing judgement that was handed down with costs! DOH paid heavily
for their impropriety. Their downfall was mainly due to lack of capacity,
refusal to allow a broad consultative process and political interference (our
results ostensibly did not “fit” the political agenda). HPCSA be warned!
6.11.5.1 Psychiatry serves as a straightforward model as their services are all
consultative.
6.11.5.2 Psychiatry is a pivotal benchmark that all disciplines may use as a reference
point in determining discipline specific relative values.
6.11.6 Instead of introducing tiered consultations, the tariffs now refer to an arbitrary
goulash of Consultative Services, where different fees are allowed for
Physicians, Psychiatrists, Paediatrics and Paediatric Cardiologists,
Anaesthesiologists, Cardiology, Ophthalmology, Orthopaedics,
Otorhinolaryngology, GPs, etc. The lowly general surgeon has to make do with
one of the lowest fees for consultations.
6.11.7 No deference is paid for subspecialty qualifications.
6.11.8 General surgeons are deeply aggrieved at the low esteem they have been
9. Even WCA / COIDA uses parity for consultative services and clinical procedures, and have applied tiered
consultations.

Surgicom for Specialist Surgeons to HPCSA on Proposed Tariff Guideline 2013 17/25
dealt for consultative services.
6.11.9 Most Schemes make small allowances for consultative services out-of-hospital
and these so-called “day-to-day benefits’ are invariably and quickly depleted.
6.11.10 Most specialists charge a private rate for consultative services and expect
same to be paid on the day of the service. These out-of-pocket expenses add
considerable hardships to the client.
6.12 The 2006 NHRPL is the result of years of manipulation. Various economic,
technical and obscure reasons, introduced mainly by the funding industry, have
tarnished and tainted its value. It in no way represents the original and updated
versions of the SAMA balanced manual. The frequent iteration and copies of the
tariff guides infringe on the copyright and intellectual property that should be paid
to SAMA.
6.13 The 2006 NHRPL is a deceptive construct that unfairly prejudices remuneration
of specialists, particularly specialist surgeons.
6.14 As a result of the below-CPI tariff increases over many years, the discriminatory
low rcf for procedures and the lower rating of general surgeon consultations, the
net effect is a significant deterioration of the real income of surgeons.
6.15 Administrative practice costs for all medical professional, including surgeons,
have soared since the introduction of so-called managed health care and clients that
seek to be more informed of their health and diseases. Rampant increases have
been experienced in the time, effort and costs of administrative services
(motivations, chronic medicines, registration of PMBs, coding issues, billing
rejections, short payments, etc.), data, billing and collection services. Increasing
attention to and compliance with the rigours of informed consent, financial
agreements, the National Credit Act, Consumer Protection Act, Promotion of Access
to Information Act, the envisaged Protection of Personal Information Bill, data
integrity and increasing levels of medico-legal litigation and indemnity insurance
costs have increased the complexity of running of medical practice, as well as
greatly enhanced administrative- and compliance costs far in excess of the CPIX-
related increases.

Surgicom for Specialist Surgeons to HPCSA on Proposed Tariff Guideline 2013 18/25
6.16 Standard and specialised equipment costs, and staff numbers and costs have
increased way above CPIX. The extraordinary levels of increases in administered
prices, such as electricity and fuel are well-known and highlighted in publications of,
amongst others, the SA Reserve Bank.
6.17 It is commonly agreed that specialist surgeon fees are too low for the work and
responsibility they carry.
6.18 On average, general surgeons charge 108% for non-PMBS and 112% for PMBS to
clients with scheme benefit options at the fees guaranteed at basic historic “CMS-
RPL” levels.10
6.19 Most schemes have entertained payment arrangements, paying between 4% and
300% above “base” rates, depending on scheme options and costs. In many
instances the majority of surgeons have signed one or more of these payment
arrangements. Surgicom plays an important role in brokering bilaterally acceptable
terms for these agreements. We insist on exhaustive attempts to reduce the time
and costs of administrations for all parties.
6.20 The majority of our patients are thus protected against excessive charges. We
pride ourselves in the services we offer. We often serve as coordinators and
managers of the larger, complex issues – administration, informed clinical and
financial consent and facilitation of financials for the team and point of service,
hospital costs and selection of cost-effective, appropriate pathways, continuity of
care, and many related and extraneous issues.
6.21 When we talk fees and tariffs, we place too much emphasis on the cost of a
procedure or intervention. An important financial principle in any business is that:
6.22 We must research and control global and down-stream costs and adverse
outcomes. Training, teaching, streamlining, exception management, risk-sharing
and many more, are the vernacular of the managed health care we should be
applying, rather than obstructive haranguing about tariffs.
10. From CMS studies published during the time of the PMB Review process, 2010; corroborated by data
shared by a large medical scheme administrator.

Surgicom for Specialist Surgeons to HPCSA on Proposed Tariff Guideline 2013 19/25
6.23 Our social contract keeps us intimately involved, often without proper
recompense.
7 Practice Cost Studies
7.12 Surgeons were compliant with and repeatedly studied and reported their
practice costs as per the CMS and DOH directives during the NHRPL and RPL-phases
of the tariff-history.
7.13 These studies were costly and time-consuming.
7.14 The studies were performed by independent auditors and management groups.
7.15 General Surgery reached similar results from two independent initial studies by
different auditors; our findings were corroborated when the studies were repeated
two years in a row! Sub-subspecialty Vascular surgeons (VASSA) performed a highly
detailed time-activity cost study. Many smaller surgical disciplines pooled their data
to derive a measure of specialist surgeons as a group.
7.16 It is important to note that at least 60% of specialist overhead costs are fixed and
similar for all specialists and specialists: staff, offices, basic and specialised
equipment, billing, collection and taxes, indemnity insurance, societies and studies.
7.17 Despite conservative estimates of time-volumes, target income, practice costs,
and punitive statistical corrections for “small sample sizes”, the results of the time
and activity-based practice for general surgeons, vascular surgeons, other surgical
disciplines and all surgical disciplines together produced a similar result, viz. the
prevailing medical scheme base remuneration was estimated to be 2 to 3 times
lower than what the studies predicted.
7.18 In the meantime, significantly influenced by the ASSA Comparative Study into
the Remuneration and Working Conditions of General Surgeons in South Africa
(para 6 above), State salaries were partly lifted out. This has the result of
significantly increasing the level 13/14 target salary that was used in the CMS / DOH
practice costs studies. This further vindicates the need for an upwards adjustment
of specialist and surgeon fees by a factor of at least 2 to 3 times current base
remuneration levels.
Surgicom for Specialist Surgeons to HPCSA on Proposed Tariff Guideline 2013 20/25
7.19 DOH never published or revealed the results of their audits of the practice cost
studies. The legal challenge showed DOH up as incoherent and having failed the
profession.
8 After the Practice Cost Studies
8.12 DoH and CMS issued a Discussion Document on “the Determination of Health
Prices in the Private Sector” during October 2010. This appeared to be a further
attempt by the DoH and CMS to introduce Price Control in the Private sector
following the setting aside of the RPL by the Gauteng North High-Court. The
deadline for commentary on this proposed voluntary process was 15th January 2011.
SAPPF and SAMA provided detailed responses to this document during December
2010 and further supplementary comments on 15th January 2011. To date neither
the DoH nor the CMS have responded on any of the submissions received, nor are
they willing to discuss them. They have also not published any of the submissions
received.
8.13 On 30th December 2011 the Competition Commission announced that it
intended to launch a full enquiry into Private Sector Healthcare pricing during 2012.
We do not believe that this will be a threat to the Healthcare Professions market as
costs and tariffs have been a transparent process, as was echoed by Acting Judge
Piet Ebersohn in the 2010 judgement against the DoH RPL process. We do not
however believe that the same can be said of Medical Scheme Administrators who
unilaterally impose fixed tariff increases across all schemes administered by them
and across all disciplines, irrespective of the specific scheme’s risk profile and
affordability levels. Medical Scheme Trustees do not appear to apply their minds
and are blindly led by the Administrators in this regard. The recent spate of cases
against trustees, schemes and Principal Officers, as published on the CMS website in
December and January bears testimony to this.
8.14 In the meantime a joint delegation, initiated by SAPPF, met with the Minister of
Health in December 2012 to discuss, amongst other, the whole issue of pricing. The
meeting was positive and is to be followed up in 2013. The delegation included

Surgicom for Specialist Surgeons to HPCSA on Proposed Tariff Guideline 2013 21/25
South African Dental Association (SADA), IPA Foundation of South Africa (IPAF), BHF,
Discovery Health and Medscheme.
8.15 Legally there is no longer a RPL, nor a National Benchmark of tariffs (although the
legal framework for it is still in existence and could be implemented without the
requirement of an exemption from the Competition Act). In the absence of any
guidance to schemes as to what tariffs to apply in 2013, Schemes must
independently set their tariffs. The reality is that this process is not happening and
that Administrators are setting tariffs on behalf of the Schemes they are
administering. If one then compares various Scheme rates it is obvious that
Schemes also do not really differ from each other and that they are jointly setting a
National Benchmark Tariff. This is ample fuel for the Competition Commission.
8.16 We aver that most Schemes and Administrators do not have capacity or insight
into coding structures; they merely default to follow the illegally published RPL.
Tariff increases are essentially still based on NHRPL 2006 and therefore do not
contain all changes to codes, descriptors, rules and modifiers approved by SAMA,
SAPPF and other Associations for 2006 to 2012. It is also inconsistent in many
respects. Disputes between Practitioners and Schemes will increase and ultimately
Scheme members will be worse off.
8.17 The coding and tariff process has been seriously derailed. No mechanism exists
to ensure a fair, transparent and efficient method of assigning tariffs. Collective
negotiation is prohibited by competition law. Individuals, fearful of the Competition
Commissioner, are left impotent and weak in their direct approaches to powerful
Medical Schemes and their administrators.
8.18 Specialists are trampled upon and invariably have their every move questioned
(often by clerks, “computers”, “Scheme rules”, nurses, administrators and lesser
qualified or even retired-from-practice doctors). Increasing interference with
specialist-directed care is being experienced, including denial of payment of
ancillary services e.g. anaesthetic, radiology, pathology, physiotherapy, dietetics and
enterostomal and wound care. The Scheme and their medical advisors are at dire
risk and may be liable for adverse consequences (e.g. interference with doctor–
patient relationship, unprofessional behaviour, supersession, not examined patient,
questioning treatment and/or tests when not similarly qualified).

Surgicom for Specialist Surgeons to HPCSA on Proposed Tariff Guideline 2013 22/25
8.19 Schemes, hospital groups, professionals and suppliers, negotiate in a disjointed
manner, lacking in transparency. It is common practice for suppliers, hospitals and
Schemes to collude on pricing, discounts, selective formularies, and many other
dubious issues. Specialists are seldom allowed access to these parleys and are
infrequently consulted from a clinical or governance point of view. The Competition
Tribunal will hopefully sort them out!
8.20 The net effect has been compromise of quality, accountability and affordability
of specialist services.
8.21 Current practice costs and management tools in individual practices and for
groups consistently corroborate our initial work. We continue to collect data on
practice and equipment costs. Many groups, disciplines and individual practices
formally keep audited records of their own costs. Some of our latest applications
can track practice costs on a daily basis (in “real-time”) and can provide
independent audited management data. We have assisted and are indebted to
Healthman and SAMA that have continued to refine the practice cost assessment
tools so that we can invoke them as proof of our plight of low fees, tariff and
remuneration.
8.22 The predicted increases in tariffs should be managed on the supply and demand
sides of the chain. Less administrative hassle by Schemes and their Administrators
could reduce “our” and “their” costs exponentially.
8.23 Professional indemnity costs must be fought by improving education, training,
risk management and more realistic medico legal processing and costs.
8.24 Alternate reimbursement models, including risks-sharing, further complicate
Private and State billing practices. Alternate reimbursement tariffs (fixed fees,
global fees, per diems, pay for performance, capitation, etc.) are issues that need
research and wider implementation in an effort to share risk and manage costs.
8.25 Improved preventive services, health and wellness strategies, and management
of the burden of diseases are all hamstrung by the wasted efforts in coding and
billing of skewed ”fee-for-service” therapeutic services.

Surgicom for Specialist Surgeons to HPCSA on Proposed Tariff Guideline 2013 23/25
8.26 Conclusions
We welcome a cost and activities based reimbursement system that fulfils the
requirements of all parties. It must be an inclusive and transparent process. Tiered
consultations are long overdue. Parity of rcf between consultations and procedures is
non-negotiable.
We implore HPCSA and MDB to lobby to develop, maintain and govern a modern,
appropriate coding structure and cost-based tariffs in a multi-party, transparent
structure.
Specialist Surgeons are willing to work shoulder-to-shoulder on these projects, believing
that administrative justice and workable, enduring coding and remuneration structures
can be established in support of improved access and quality of health care in South
Africa.
However, we do not believe that section 53 of the Health professions Act is the right legal
home for this, neither do we believe that the HPCSA is the correct body to set guidelines
relating to the commercial and professional realities faced by our profession.
The HPCSA should stick to its mandate of enforcing professional and ethical behaviour,
and dealing with complaints relating to those, and in which our societies will gladly assist.
All of these issues are at play as NHI is rolled out. Specialist services are complex issues
that have not really been aired for NHI. Nevertheless, we will assist with coordination
and management from a clinical and process side.

Unit 16, Northcliff Office Park 203 Beyers Naude Drive Northcliff, 2115
Tel: (+27)(11) 340 9000, Fax: (+27)(11) 782 0270 Email: [email protected]
P.O. Box 2127, Cresta, Johannesburg, 2118
Directors: J Mook (Chair), S Grobler, P Matley, S Pillay, M Wellsted; Company Secretary: Healthman 24/25
We respectfully submit these matters and request confirmation of receipt as well as
cognisance of our availability to assist in clarification, research, discussion, negotiation
and implementation
Our rights are reserved.
Yours Truly
SURGICOM for ASSA and FoSAS
These documents were collated by:
Dr Stephen Grobler 4207033; MP 0245968
MMed (Chir) (Gastroenterol)
Surgicom Director
[email protected]; fax: 051-4440267
Surgicom for Specialist Surgeons to HPCSA on Proposed Tariff Guideline 2013 25/25
REQUEST FOR COMMENTS: PROPOSED HEALTH PROFESSIONALS
COUNCIL OF SOUTH AFRICA GUIDELINE TARIFFS:
SUBMISSION BY SURGICOM FOR SPECIALIST SURGEONS
Table of Contents: Appendices
Appendix 1. Briefs by Surgical Societies
Appendix 2. Colleges of Medicine of SA (CMSA) President's Survey of
numbers of practicing Specialists
Appendix 3. The Association of Surgeons of South Africa: Comparative
Study into the Remuneration and Working Conditions of
General Surgeons in South Africa. 2007
Appendix 4. Articles: Kahn D, et al. South African Journal of Surgery
Volume 44(3) August 2006:
a. General surgery in crisis – the critical shortage
b. General surgery in crisis – comparatively low levels of
remuneration
c. General surgery in crisis – factors that impact on a
career in general surgery

Federation of South African Surgeons
Secretariat: Wits Donald Gordon Medical Centre, 18 Eton Road, Parktown. Johannesburg. 2193;
Postnet Suite 199. Private Bag X 2600 , Houghton 2041. South Africa
Telephone: + 27 11 482-2034 Facsimile: +27 (0) 86 556 2232 Email: [email protected]
16 February 2013
The Registrar Health Professions Council of South Africa Per e-mail Dear Madam Re: PROPOSED HEALTH PROFESSIONALS COUNCIL OF SOUTH AFRICA GUIDELINE TARIFFS: REQUEST FOR COMMENTS - SUBMISSION BY FoSAS ON BEHALF OF GENERAL SURGEONS The Federation of Surgeons of South Africa (FoSAS) is the unifying forum for all General Surgical associations and societies. Its EXCO consists of the presidents and other senior office bearers of these societies. FoSAS aims to speak on behalf of all these organisations on matters common to us all. The HPCSA guideline tariff is just such a matter. The organisations represented by FoSAS are represented at the bottom of the letterhead, and include vascular, laparoscopic, colorectal, trauma and paediatric surgeons. FoSAS also represents the College of Surgeons of South Africa (our academic and examining body), as well as the national General Surgical trainee association and their research association. This is by far the largest grouping of surgeons in the country. It is our contention that the HPCSA's foray into tariff setting is ill-advised. FoSAS respectfully submits that HPCSA has neither the relevant intellectual resources nor the experience to perform this task, without the assistance of the relevant professional service providers (doctors, dentists, and allied professions), hospitals, pharma and the supply industry. We believe HPCSA should urgently intervene to
Appendix A.

Federation of South African Surgeons
establish a multiparty coding and tariff forum that adheres to the principles of legality, rationality, consistency, openness and impartiality. In this way, you, our regulatory body, will serve the interests of both patients and surgeons by promoting improved access to healthcare and improved quality of care in South Africa. FoSAS supports the attached submission from Surgicom, made on behalf of the the general surgical community, on the proposed HPCSA guideline tariffs. Yours sincerely Robert Baigrie, Chairman
Appendix A.

ASSA Suite (c/o SAMA Office) Postal Address: Wits Donald Gordon Medical Centre Postnet Suite 199 18 Eton Road Private Bag x2600 Parktown Houghton 2041 Administration Contact: Alison McLean: Tuesday – Thursday (011) 482 2034 083 536 6806 Susan Parkes: Mondays and Fridays (011) 717 2080 [email protected]
The Association of Surgeons of South Africa
affiliated to The South African Medical Association. Incorporated Association not for gain. Reg No. 05100136108
15 February 2013
To: The Registrar
Health Professions Council of South Africa Per e-mail
Dear Madam, Re: PROPOSED HEALTH PROFESSIONALS COUNCIL OF SOUTH AFRICA
GUIDELINE TARIFFS: REQUEST FOR COMMENTS – SUBMISSION BY SURGICOM ON BEHALF OF GENERAL SURGEONS
The Association of Surgeons of South Africa agrees with, endorses and fully supports the submission made on behalf of the general surgical community by Surgicom on the proposed Health Professions Council of South Africa guideline tariffs. It is our contention that any entity wishing to effectively and successfully develop and implement a normative guideline to serve as a professional standard must ensure that the guideline adheres to the principles of legality, rationality, consistency, openness and impartiality. We believe that this is only possible if a multiparty coding and tariff forum is established that has the legal framework to embark on transparent consultative processes with the goal of promoting access to and quality of care in South Africa. Yours sincerely, Martin Veller, Chairman
Appendix A.

SASES EXECUTIVE COMMITTEE 2012/2013
PRESIDENT: Dr D Fölscher PAST PRESIDENT: Prof R Baigrie VICE PRESIDENT: Dr M Naidoo SECRETARY: Dr D Brombacher TREASURER: Dr R de Beer
MEMBERS: Dr M Brand, Dr C Jann-Krüger, Prof A Numanoglu, Prof E Panieri CO-OPTED MEMBERS: Dr S Grobler, Prof Z Koto, Dr JA Potgieter
SASES
The South African Society of Endoscopic Surgeons From the Office of the President General Enquiries: Susan Parkes Tel: 011 717 2080 Fax: 086-553-3685 [email protected] Postnet Suite 199, P/Bag X2600 Houghton 2041 Website: www.sases.org
17 February 2013 To: The Registrar
Health Professions Council of South Africa
By email
Dear Madam
Re: Proposed HPCSA Guideline Tariffs: Submission by Surgicom on behalf of General
Surgeons
The South African Society of Endoscopic Surgeons (SASES) is the largest surgical
special interest society in South Africa, with more than 250 active and paid-up members.
We agree fully with the submission made on behalf of general surgeons by Surgicom
regarding the proposed Health Professions Council of South Africa guideline tariffs, and
support it completely. We firmly believe that any attempt to develop a tariff that will be
used as a professional standard, should adhere to the principles of legality, rationality,
consistency, openness and impartiality as clearly elucidated in the above-mentioned
document.
Furthermore, as far as a tariff for remuneration is concerned: we believe this can only be
set through a transparent consultative process involving all interested parties in a coding
and tariff forum, with the necessary legal framework in place. Only by this process can
we ensure accessible and quality surgical care in South Africa.
Sincerely
Danie Folscher
President
Appendix A.

January 21, 2013
To Healthman / Surgicom
We hereby pledge our full support to you, with regard to your dealings with the HPCSA on pricing matters.
We feel that the their proposed system is both flawed and outdated and we believe that it will be a future deterrent for prospective surgical registrars, in a already short staffed healthcare system.
Sincerely yours,
Abri Bezuidenhout
SASSiT chairperson
PHONE +27 82 413 2710
EMAIL [email protected]
WEB www.sassit.co.za
SASSiT
Appendix A.
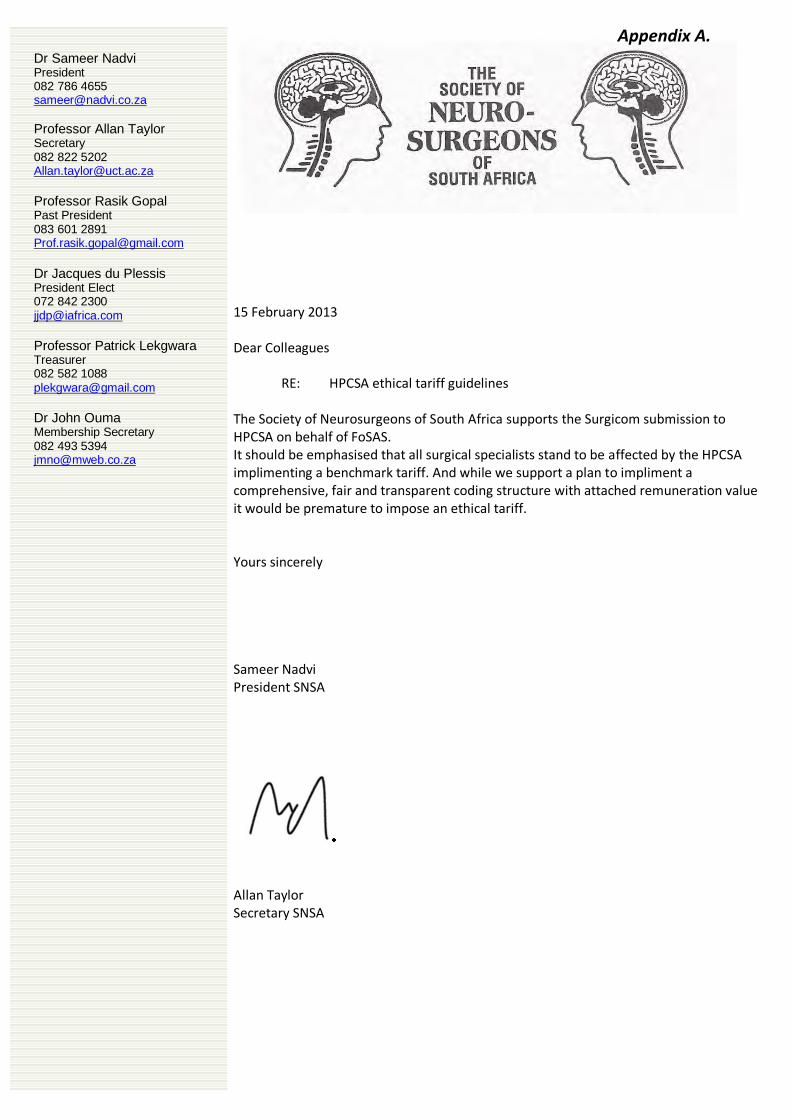
15 February 2013 Dear Colleagues RE: HPCSA ethical tariff guidelines The Society of Neurosurgeons of South Africa supports the Surgicom submission to HPCSA on behalf of FoSAS. It should be emphasised that all surgical specialists stand to be affected by the HPCSA implimenting a benchmark tariff. And while we support a plan to impliment a comprehensive, fair and transparent coding structure with attached remuneration value it would be premature to impose an ethical tariff. Yours sincerely Sameer Nadvi President SNSA
Allan Taylor Secretary SNSA
Dr Sameer Nadvi President 082 786 4655 [email protected]
Professor Allan Taylor Secretary 082 822 5202 [email protected]
Professor Rasik Gopal Past President 083 601 2891 [email protected] Dr Jacques du Plessis President Elect 072 842 2300 [email protected]
Professor Patrick Lekgwara Treasurer 082 582 1088 [email protected]
Dr John Ouma Membership Secretary 082 493 5394 [email protected]
Appendix A.

College of Medicine of South Africa (CMSA) President's Survery 2011 Appendix B.
Results 2CMSA President's SurveyCurrent numbers of SpecialistsSpeciality Current Speciality Current
Anaesthetics 1199 Anaesthetics Oral Path 14Cardio Thoracic Surgery 120 Cardio Thoracic Surgery Periodontics 54Dermatology 186 Dermatology Prosthodontics 72Emergency Medicine 34 Emergency Medicine Orthodontists 128Family Physicians 790 Family Physicians Maxillo‐Facial 111Forensic Pathology 45 Forensic Pathology Total 379Neurology 123 NeurologyNeurosurgeons 135 NeurosurgeonsNuclear Physicians 45 Nuclear Physicians GRAND TOTAL 9618Obstetrics and Gynae 888 Obstetrics and GynaeOpthalmology 273 OpthalmologyOrthopaedics 605 OrthopaedicsENT 292 ENTPaediatricians 680 PaediatriciansPathologists 537 PathologistsPhysicians 641 PhysiciansPlastic Surgeons 157 Plastic SurgeonsPsychiatrists 641 PsychiatristsPublic Health Medicine 103 Public Health MedicineOccupational Medicine 22 Occupational MedicineRadiation Oncologists 153 Radiation OncologistsRadiologists 713 RadiologistsSurgeons 635 SurgeonsUrologists 222 UrologistsOral Path 14 Oral PathPeriodontics 54 PeriodonticsProsthodontics 72 ProsthodonticsOrthodontists 128 OrthodontistsMaxillo‐Facial 111 Maxillo‐FacialTOTAL 9239 TOTAL
$

College of Medicine of South Africa (CMSA) President's Survery 2011 Appendix B.
EC FS GA KZ LI MP NC NW WC TOTALSAnaesthetists 56 66 499 177 13 22 8 28 330 1199 1 1199 AnaestheticsPublic 23 39 132 60 6 3 1 3 138 405 0 #N/APrivate 33 27 367 117 7 19 7 25 192 794 0 #N/ACardio Thoracic Surgeons 7 9 55 18 0 1 1 1 28 120 1 120 Cardio Thoracic SurgeryPublic 2 6 21 12 0 0 1 1 13 56 0 #N/APrivate 5 3 34 6 0 1 0 0 15 64 0 #N/ADermatologists 10 8 73 24 1 3 2 3 39 186 1 186 DermatologyPublic 2 4 17 6 0 0 0 0 6 55 0 #N/A
Private 8 4 56 18 0 2 2 2 39 131 0 #N/A
Emergency Medicine 0 0 15 5 1 2 0 0 11 34 1 34 Emergency MedicinePublic 0 0 4 2 1 3 0 0 7 17 0 #N/A
Private 0 0 11 3 0 0 0 0 4 18 0 #N/A
Family Physicians 82 56 246 123 30 51 16 32 154 790 1 790 Family PhysiciansPublic 68 40 150 78 26 30 12 21 96 521 0 #N/A
Private 14 16 96 45 4 21 4 11 58 269 0 #N/A
Forensic Pathologists 3 6 14 5 2 0 1 1 13 45 1 45 Forensic PathologyPublic 3 5 14 4 2 0 1 1 12 42 0 #N/A
Private 0 1 0 1 0 0 0 0 1 3 0 #N/A
Maxillo Facial & Oral Surgeons 4 3 57 14 2 1 1 2 27 111 1 111 Maxillo-FacialPublic 0 2 21 0 1 0 0 1 8 33 0 #N/A
Private 5 2 40 14 0 1 1 1 21 85 0 #N/A
Neurologists 4 8 61 17 1 0 0 0 32 123 1 123 NeurologyPublic 1 4 22 7 0 0 0 0 13 47 0 #N/A
Private 3 4 39 10 1 0 0 0 19 76 0 #N/A
Neurosurgeons 7 8 63 17 1 3 1 4 31 135 1 135 NeurosurgeonsPublic 3 1 11 3 1 1 0 1 10 31 0 #N/A
Private 4 8 52 14 0 2 1 3 21 105 0 #N/A
Nuclear Physicians 2 3 26 1 2 0 0 0 11 45 1 45 Forensic PathologyPublic 1 1 10 1 2 0 0 0 6 21 0 #N/A
Private 1 2 16 0 0 0 0 0 5 24 0 #N/A
Obstetricians and Gynaecologists 56 38 350 170 21 23 5 24 201 888 1 888 Obstetrics and GynaePublic 23 14 75 75 5 5 1 0 65 263 0 #N/A
Private 33 24 275 95 16 18 4 24 136 625 0 #N/A
Opthalmologists 22 12 110 33 4 7 6 10 69 273 1 273 OpthalmologyPublic 8 5 22 9 3 5 1 4 12 69 0 #N/A
Private 14 7 88 24 1 2 5 6 57 204 0 #N/A
Oral Pathologists 0 0 6 0 0 0 0 2 6 14 1 14 Oral PathPublic 0 0 5 0 0 0 0 2 6 13 0 #N/A
Private 0 0 1 0 0 0 0 0 0 1 0 #N/A
Orthodontists 6 4 69 13 0 3 0 3 30 128 1 128 OrthodontistsPublic 0 0 35 0 0 0 0 2 8 45 0 #N/A
Private 6 4 34 13 0 3 0 1 22 83 0 #N/A
Orthopaedics 33 33 261 83 10 13 5 13 154 605 1 605 OrthopaedicsPublic 12 18 80 13 4 2 0 1 54 184 0 #N/A
Private 21 15 181 70 6 11 5 12 100 421 0 #N/A
ENT 14 14 121 51 5 6 2 6 73 292 1 292 ENTPublic 3 8 30 18 2 1 1 1 27 91 0 #N/A
Private 11 6 91 33 3 5 1 5 46 201 0 #N/A
Paediatricians 41 32 274 106 14 13 4 15 181 680 1 680 PaediatriciansPublic 21 17 119 49 8 1 1 0 106 322 0 #N/A
Private 20 15 155 57 6 12 3 15 75 358 0 #N/A
Pathologists 1 0 #N/APublic #N/A
Private #N/A
Periodontics 2 1 32 6 1 1 1 2 8 54 1 54 PeriodonticsPublic 0 1 15 2 1 0 1 1 2 23 0 #N/A
Private 2 0 17 4 0 1 0 1 6 31 0 #N/A
Physicians 38 41 259 89 9 11 6 19 169 641 1 641 PhysiciansPublic 15 25 111 48 5 1 3 3 91 302 0 #N/A
Private 23 16 148 41 4 10 3 16 78 339 0 #N/A
Plastic Surgeons 8 6 68 18 1 2 0 0 54 157 1 157 Plastic SurgeonsPublic 2 4 17 6 1 1 0 0 19 50 0 #N/A
Private 6 2 51 12 0 1 0 0 35 107 0 #N/A
Prosthodontists 1 1 51 3 0 0 0 0 16 72 1 72 ProsthodonticsPublic 0 0 26 0 0 0 0 0 6 32 0 #N/A
Private 1 1 25 3 0 0 0 0 10 40 0 #N/A
Psychiatrists 38 41 259 89 9 11 6 19 169 641 1 641 PhysiciansPublic 15 25 111 48 5 1 3 3 91 302 0 #N/A
Private 23 16 148 41 4 10 3 16 78 339 0 #N/A
Public Health Medicine 7 6 36 23 1 1 0 3 26 103 1 103 Public Health MedicinePublic 3 4 23 13 1 0 0 0 16 60 0 #N/A
Private 4 2 13 10 0 1 0 3 10 43 0 #N/A
Occupational Medicine 0 0 9 2 0 0 0 0 11 22 1 22 Occupational MedicinePublic 0 0 5 2 0 0 0 0 5 12 0 #N/A
Private 0 0 4 0 0 0 0 0 6 10 0 #N/A
Radiation Oncologists 12 13 40 24 4 2 2 3 53 153 1 153 Radiation OncologistsPublic 3 9 21 7 3 0 1 0 27 71 0 #N/A
Private 9 4 19 17 1 2 1 3 26 82 0 #N/A
Radiologists 37 26 329 110 7 10 2 15 177 713 1 713 RadiologistsPublic 12 13 139 53 3 0 1 4 95 320 0 #N/A
Private 25 13 190 57 4 10 1 11 82 393 0 #N/A
Surgeons 45 29 221 132 12 18 3 15 160 635 1 635 SurgeonsPublic 24 14 88 76 7 6 0 1 87 303 0 #N/A
Private 21 15 133 56 5 12 3 14 73 332 0 #N/A
Urologists 11 11 95 40 2 2 2 8 51 222 1 222 UrologistsPublic 5 6 46 14 0 0 0 2 19 92 0 #N/A
Private 6 5 49 26 2 2 2 6 32 130 0 #N/A
GRAND TOTAL 546 475 3 699 1 393 153 206 74 228 2 284 9 081 TRUE 9081 #N/A
THE ASSOCIATION OF SURGEONS OF SOUTH AFRICA
Comparative Benchmarking :
Remuneration of Surgeons Employed in the State Sector
December 2007
P-E Corporate Services Management Consultants
Appendix 3.
P-E Corporate Services SA (Pty) Limited
STRICTLY PRIVATE & CONFIDENTIAL
THE ASSOCIATION OF SURGEONS OF
SOUTH AFRICA
Comparative Benchmarking : Remuneration of Surgeons Employed in the State Sector
1. INTRODUCTION AND BACKGROUND
P-E Corporate services (“P-ECS”) was commissioned during 2004 by The Association of
Surgeons of South Africa (“ASSA”) to carry out a comparative study into the remuneration
and working conditions of General Surgeons in South Africa.
The study was prompted by growing concerns within the Association at that time about :
the diminishing number of applicants presenting themselves for general surgery training;
and
the increasing number of general surgery posts that were vacant in the State sector,
Our final report, which was submitted to ASSA in September 2005 confirmed that the concerns
expressed by ASSA were both valid and relevant in that :
shortages of qualified General Surgeons in the State sector had reached critical levels;
major contributory factors included low levels of remuneration, extremely long working hours,
excessive levels of stress and an inadequately resourced working environment;
General Surgeons employed within the State sector were also poorly remunerated in related
to other professionals at comparable levels of responsibility employed elsewhere within this
sector.
Appendix 3.

The Association of Surgeons of South Africa Comparative Benchmarking : Remuneration of Surgeons Employed in the State Sector Page 2
P-E Corporate Services SA (Pty) Limited
ASSA has now requested P-ECS to update the aspect of our research dealing with comparative
differentials between remuneration of General Surgeons in the Public Sector with that of other
professionals employed in the same sector.
Our brief in this regard was confirmed during a meeting between Professor Martin Veller,
representing ASSA, and Martin Westcott and Adele Slotar of P-ECS on 02 October, 2007.
2. RESEARCH OBJECTIVE AND TERMS OF REFERENCE
One of the primary objectives of the study undertaken on behalf of ASSA in 2004/05 was to
evaluate the relative equity of remuneration earned by General Surgeons working in the State or
Public Sector in South Africa. Relative equity in this context refers to the extent to which
remuneration earned by General Surgeons could be considered as equitable in relation to factors
such as responsibility, working hours and conditions, and professional risk.
A reasonable basis for making this assessment is to compare remuneration earned by General
Surgeons with that of other professionals at comparable levels of responsibility and also employed
within the Public Sector.
While comparisons of this type are never precise, robust job evaluation methodologies are
available which provide an acceptably accurate basis for comparison. The use of such
methodologies is common practice within commerce and industry and within the Public Sector.
This approach was adopted in our 2004/05 study and by following a similar and consistent
approach and methodology it is possible to compare differentials in remuneration measured at
that time with current market data.
With this in mind our terms of reference for this study were confirmed in our letter dated 10
October, 2007, as follows :
Appendix 3.

The Association of Surgeons of South Africa Comparative Benchmarking : Remuneration of Surgeons Employed in the State Sector Page 3
P-E Corporate Services SA (Pty) Limited
“The scope of work covered in terms of this request is reported in section 3.2.4.2 (pages 35 to 42 inclusive) of our report dated 15 September, 2005. This section of the report deals with remuneration of general surgeons employed within the State sector and compares this with earnings of other professionals employed within the public sector. As a basis for comparison, the selected positions were graded, remuneration data researched and comparative ratios developed reflecting differentials between earnings of general surgeons and the other professionals. Differentials are then analysed and reported by grade.
The activities we would need to carry out to update this research would be as follows:
prepare an initial list of the professional positions to be used as a basis for
comparison, and agree this with ASSA. We do not anticipate that this list would vary materially from that used in the 2004/05 study. As much similarity as possible is also desirable in view of the need for consistency. However, comparative studies are always influenced by factors such as availability of current and accurate data. There may also be an opportunity to cover certain additional professional positions;
confirm job grades (in line with our previous work) and/or re-grade new
positions or positions where job responsibility has changed;
research current remuneration data for all positions;
analyse and present results together with comparative ratios and appropriate comment.
The deliverable would thus be a report with updated data and comment in much the same layout and format as that in section 3.2.4.2 of our previous report.”
3. METHODOLOGY
The methodology adopted for this (updated) study may be summarised as follows :
(i) a list of professional categories to be used as a basis for comparison was selected. The
list of categories used for the 2004/05 study was necessarily based on the availability of
accurate, current market data. To ensure consistency, the same job categories were
selected for the update study. However, the list for this study was increased to include
accountants employed within the public sector.
Appendix 3.

The Association of Surgeons of South Africa Comparative Benchmarking : Remuneration of Surgeons Employed in the State Sector Page 4
P-E Corporate Services SA (Pty) Limited
The full list of professional categories used for pay comparison purposes was thus :
judges/magistrates in state sector employ;
engineers employed within the public sector (state, local authority or parastatal);
accountants employed within the public sector (state, local authority or parastatal);
municipal managers employed within local authorities (the position of executive mayor
was added to this category as well);
airline pilots employed in state owned airlines (SAA, SA Express, SA Airlink);
(ii) representative benchmark job titles/descriptions were selected within each professional
category as a basis for the market comparisons with the seven medical job titles used as
the research basis in the 2004/05 study. The selection of job titles was made so as to
obtain positions of comparable responsibility across the different professions;
(iii) positions were graded (or previously applied grades checked) using the Paterson system
of job evaluation. (Positions, grades and a brief description of the Paterson system is
included in the next section of this report);
(iv) current market remuneration data was researched for each benchmark job description
within each professional category. Research involved a combination of desk and phone
research using both our extensive national remuneration data base as well as
remuneration data available in the public domain. Our remuneration database contains
current market data on some 600 – 700 different benchmark job titles / descriptions
sourced from our national, regional and industry sector surveys encompassing all sectors
of the South African economy. Over 850 organisations employing over 1,5 million staff
participate in these surveys;
(v) market data collected in this fashion was analysed and collated and forms the basis of the
market comparisons presented in subsequent sections of this report.
Appendix 3.
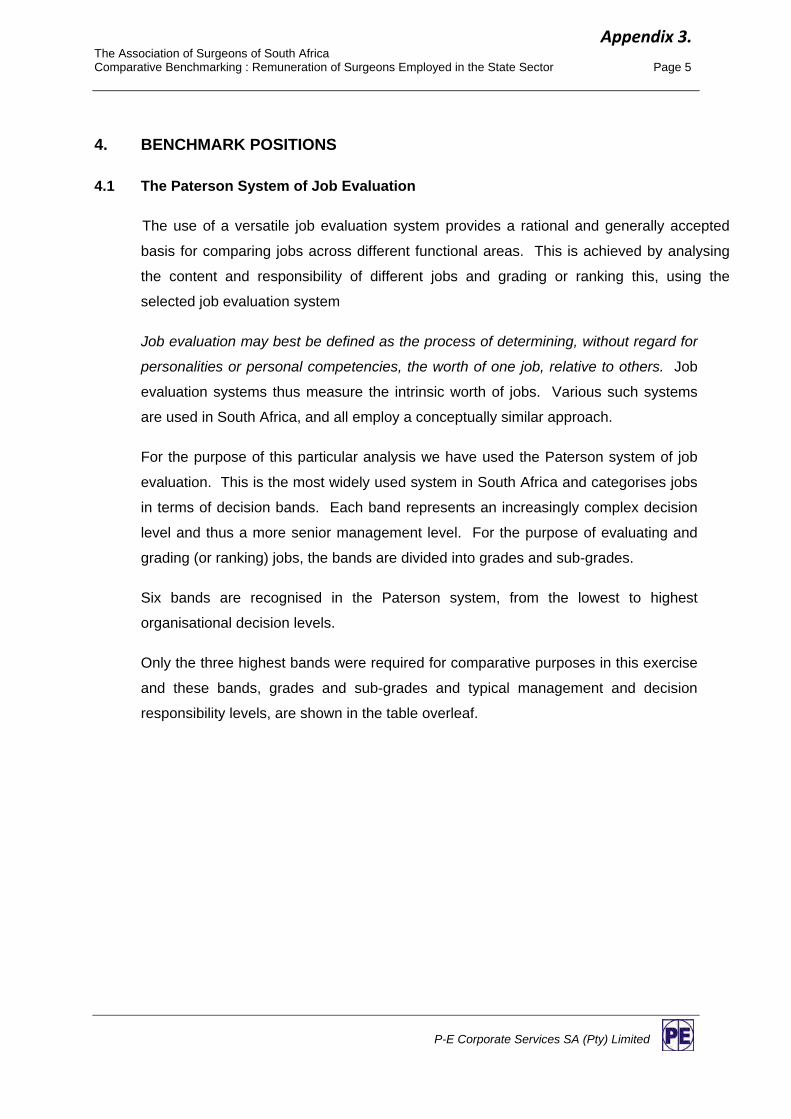
The Association of Surgeons of South Africa Comparative Benchmarking : Remuneration of Surgeons Employed in the State Sector Page 5
P-E Corporate Services SA (Pty) Limited
4. BENCHMARK POSITIONS
4.1 The Paterson System of Job Evaluation
The use of a versatile job evaluation system provides a rational and generally accepted
basis for comparing jobs across different functional areas. This is achieved by analysing
the content and responsibility of different jobs and grading or ranking this, using the
selected job evaluation system
Job evaluation may best be defined as the process of determining, without regard for
personalities or personal competencies, the worth of one job, relative to others. Job
evaluation systems thus measure the intrinsic worth of jobs. Various such systems
are used in South Africa, and all employ a conceptually similar approach.
For the purpose of this particular analysis we have used the Paterson system of job
evaluation. This is the most widely used system in South Africa and categorises jobs
in terms of decision bands. Each band represents an increasingly complex decision
level and thus a more senior management level. For the purpose of evaluating and
grading (or ranking) jobs, the bands are divided into grades and sub-grades.
Six bands are recognised in the Paterson system, from the lowest to highest
organisational decision levels.
Only the three highest bands were required for comparative purposes in this exercise
and these bands, grades and sub-grades and typical management and decision
responsibility levels, are shown in the table overleaf.
Appendix 3.

The Association of Surgeons of South Africa Comparative Benchmarking : Remuneration of Surgeons Employed in the State Sector Page 6
P-E Corporate Services SA (Pty) Limited
Paterson Band Management Level Broadband
Grades Sub
Grades Decision Type
F Top management / executives in large companies
F upper
F lower
F2
F1
Policy making or strategic decisions usually made at top management / board level
E Senior executives reporting to the CEO. Holding or subsidiary / single unit company
E upper
E lower
E3 / E4
E1 /E2
Programming decision usually made by senior managers or heads of major functions / business units
D Middle managers and professionally qualified, experienced specialists, e.g. in finance, IT, etc.
D upper
D lower
D4 / D5
D1 / D2 / D3
Interpretive or probabilistic decisions usually made by middle management and professional staff based on overall corporate strategy
Note : The classic approach adopted in applying the Paterson system is to grade jobs into sub-grades (F2, F1, E4, E3, etc.). In recent years, however, many organisations have adopted a “broadband” approach, grading positions according to the lesser number of broadband grades (F upper, F lower, E upper, E lower, etc.). This allows greater flexibility and simplifies the application. For the purpose of the comparative analysis which follows, however, we have used both broadband sub-grades to provide as accurate a basis, as possible.
4.2 Benchmark Positions
The professions and job titles / descriptions used for benchmarking comparison purposes
are set out in the table overleaf. Positions are as identified for the 2004/05 study with the
addition of accounting positions. A review of the grades used in 2004/05 confirmed that no
changes were required to previously assigned grades.
Appendix 3.

The Association of Surgeons of South Africa Comparative Benchmarking : Remuneration of Surgeons Employed in the State Sector Page 7
P-E Corporate Services SA (Pty) Limited
Profession Job Title / Benchmark Job Paterson Grade / Broadband
Medical Practitioner in State sector employ
Intern
Registrar (Leg 1)
Community Services Doctor
Medical Officer
D2
D3
D3
D3
Junior Specialist (Working under Supervision)
Senior Medical Officer
D5
D5
D lower
D lower
D lower
D lower
D upper
D upper
Specialist
Principal Medical Officer
E 2
E2
E lower
E Lower
Chief Medical Officer
Senior Specialist
E3
E3
E upper
E Upper
Judge / Magistrate in State sector employ
Magistrate
Senior Magistrate
Regional / Chief Magistrate
Regional Court President / Special Grade Chief Magistrate
Judge e.g. High Court, Labour Court
D3
D4
D5
E2
E3
D lower
D upper
D upper
E lower
E upper
Engineer employed in the Public sector (State, Local Authority or Parastatal)
Qualified professional engineer (5 –10 years experience)
Qualified professional engineer (over 10 years experience)
Engineering manager in intermediate-sized organisation
D3
D5
E2 / E3
D lower
D upper
E lower / E upper
Qualified accountant (B.Comm. or CIS; up to 5 years experience)
D1 D lower
Qualified accountant (CA; 5 – 10 years experience)
D2 D lower
Qualified accountant (CA; over 10 years experience)
D3 D lower
Chief Accountant (B.Comm/CMA or CA; 10 years + experience)
D4 D upper
Financial Manager (B.Comm/CMA in intermediate sized organisation)
E1 E lower
Accountant employed in the Public Sector (State, Local Authority or Parastatal)
Financial Manager (qualified CA in intermediate sized organisation)
E2 E lower
Municipal Manager : Local Authority
Small local authority
Medium sized local authority
Intermediate sized local authority e.g. Kimberley, East London
Large local authority (Metro) e.g. Johannesburg, Cape Town
D3
D4
E1
E3
D lower
D upper
E lower
E upper
Executive Mayor Medium sized local authority D4 D Upper
Appendix 3.

The Association of Surgeons of South Africa Comparative Benchmarking : Remuneration of Surgeons Employed in the State Sector Page 8
P-E Corporate Services SA (Pty) Limited
Profession Job Title / Benchmark Job Paterson Grade / Broadband
Airline Pilot in State owned airline, i.e. SAA, SA Express, SA Airlink
First Officer : Narrow Bodied Aircraft
Senior First Officer : Wide Bodied Aircraft
Captain : Narrow Bodied Aircraft
Captain : Wide Bodied Aircraft
D1
D3
E1
E2 / E3
D lower
D lower
E lower
E lower / E upper
5. MARKET DATA
Comparative, current market remuneration data is presented in this section. As noted previously,
pay data was researched using both our database and desk / internet research of published data
such as gazetted reports of government departmental pay scales, benefits and conditions of
service. In the case of medical personnel, updated salary data was sourced by the Department of
Surgery at the University of Witwatersrand.
The market data should be read in conjunction with the following notes :
comparisons have been made on the basis of total employment cost, i.e. basic salary
plus cash allowances (e.g. car allowances, annual non-performance related bonus, etc.)
plus value of company / state contributions paid on behalf of the employee (e.g.
retirement funding, insurances, medical aid, etc.);
where employees in selected benchmark positions are eligible for short-term incentive
pay (i.e. a payment, typically annual, for achieving pre-agreed performance criteria) the
amount for achieving budget or expected performance has been included. (This
amounts, most typically to 10 – 20 percent of basic salary);
data is shown either as average remuneration or the calculated mid-point of the pay
range at the grade concerned. Where appropriate, pay ranges are also reflected. Since
more than one benchmark job may be incorporated into a pay range, data in the table
may not correlate exactly with published pay scales (where these are applicable);
the most current available pay data has been used. In the case of State employees, in
most cases these are the most recently published pay scales, effective April 2007; in
the case of professions such as engineers and accountants we have used data current
at July 2007;
Appendix 3.

The Association of Surgeons of South Africa Comparative Benchmarking : Remuneration of Surgeons Employed in the State Sector Page 9
P-E Corporate Services SA (Pty) Limited
in the case of medical practitioners, rates are based on Department of Health salary
scales and include commuted overtime (16 hours per week) and the 15 percent scarce
skills allowance. The rural allowance which is only applicable in certain circumstances
has not been included. Pay scale mid-points have been reported, consistent with the
comparative data.
Comparative pay data is set out in Table 1 below. For reference we have also included, as
Table 2, the comparison included in our September 2004 report.
The final column in the table shows the relationship (comparative ratio) between the remuneration
of medical practitioners and the average of remuneration paid to the “basket” of selected
benchmark, comparator positions.
Table 1 : Comparative Remuneration : Professionals Employed in the Public Sector : 2007 Data
Annual Total Cost of Remuneration (Rands)
Average Salary / Grade Mid Point (Range Reflected in Brackets Where Applicable)
Comparative Ratio
Paterson Grade
Medical Practitioners
in State Sector
Judges / Magistrates in State sector
Engineers in Public Sector
Accountants in Public Sector
Municipal Managers:
Local Authorities
Airline Pilots:
State Owned Airlines
Medical Practitioners
vs Average of Benchmark Positions
D1 411 000
(342 000 – 485 000)
554 000
(416 000 – 692 000)
D2 224 000 503 000
(411 000 – 588 000)
D3 347 000 443 000
410 000
(351 000 – 497 000)
547 000 (449 000 – 667 000)
506 000 (400 000 – 641 000)
757 000 (594 000 – 946 000)
0,65
D4 485 000 603 000
(502 000 – 781 000)
613 500 (491 000 – 767 000)
D5 417 000 550 000 606 000
(514 000 – 740 000)
649 000
(523 500 – 805 000)
0,69
E1 751 000
(624 000 – 939 000)
860 000 (727 000 – 1 026 000)
E2 466 000 675 000 936 000
(783 000 – 1 298 000)
1 285 000 (964 000 – 1 606 000)
0,52
E3 559 000 1 004 000
844 000
(716 000 – 1 030 000)
1352 000
(1 206 000 – 1 557 000)
0,50
Appendix 3.

The Association of Surgeons of South Africa Comparative Benchmarking : Remuneration of Surgeons Employed in the State Sector Page 10
P-E Corporate Services SA (Pty) Limited
Table 2 : Comparative Remuneration : Professionals Employed in the Public Sector : 2004 Data
Annual Total Cost of Remuneration (Rands)
Average Salary / Grade Mid Point (Range Reflected in Brackets Where Applicable)
Comparative Ratio
Paterson Grade
Medical Practitioners
in State Sector
Judges / Magistrates
in State sector
Engineers in Public Sector
Municipal Managers:
Local Authorities
Airline Pilots:
State Owned Airlines
Medical Practitioners
vs Average of Benchmark Positions
D1
420 000
(315 000 – 525 000)
D2 179 000
D3 278 000 362 000
315 000
(262 000 – 384 000)
415 000
(328 000 – 525 000)
560 000
(440 000 – 700 000) 0,67
D4 398 000
D5 343 000 440 000
467 000
(393 000 – 569 000)
532 000
(429 000 – 660 000) 0,72
E1
705 000
(596 000 – 841 000)
E2 397 000 545 000
990 000
(740 000 – 1 250 000) 0,56
E3 475 000 861 000
607 000
(511 000 – 753 000) 1 108 000
(988 000 – 1 276 000 0,55
6. COMMENT
Remuneration offered to medical practitioners within the State Sector has increased by 20 to 25
percent at lower levels and by approximately 18 percent at the more senior levels, over the past
three years. By comparison :
remuneration of both engineers and airline pilots has increased within a 30 to 40 percent
range; and
remuneration of judges and magistrates, and officials within local authorities, has
increased within a 20 to 25 percent range.
Remuneration across all job categories and all sectors of the South African economy as
measured by our national survey (950 organisations, 1,5 million employees) has increased by :
Appendix 3.

The Association of Surgeons of South Africa Comparative Benchmarking : Remuneration of Surgeons Employed in the State Sector Page 11
26 percent at executive level; and
23 percent across all levels, over the corresponding period.
Increases awarded to medical practitioners over the past three years lag increases awarded to
other professionals surveyed by a slight margin. The result is that the calculated comparative
ratios in Table 1 have weakened in relation to those in Table 2 (representing the 2004 data).
Differentials between the earnings of medical practitioners and those of other professionals employed within the State sector thus remain very substantial. Registrars and medical officers earn only 65 percent – 70 percent of the total remuneration paid to their peers; at senior management levels (senior specialists, principal medical officers, etc.,) remuneration is only 50 percent – 52 percent of that paid to the selected comparator group.
Pay curves illustrating this shortfall are shown in Figure 1 below (2007 data) and Figure 2
(2004 data) overleaf.
Figure 1 : Comparative Pay Data : 2007
0100000200000300000400000500000600000700000800000900000
100000011000001200000130000014000001500000
D1 D2 D3 D4 D5 E1 E2 E3Paterson Grade
Airline Pilots Judges Magistrates Medical PractitionersEngineers Municipal Managers Accountants
P-E Corporate Services SA (Pty) Limited
Appendix 3.
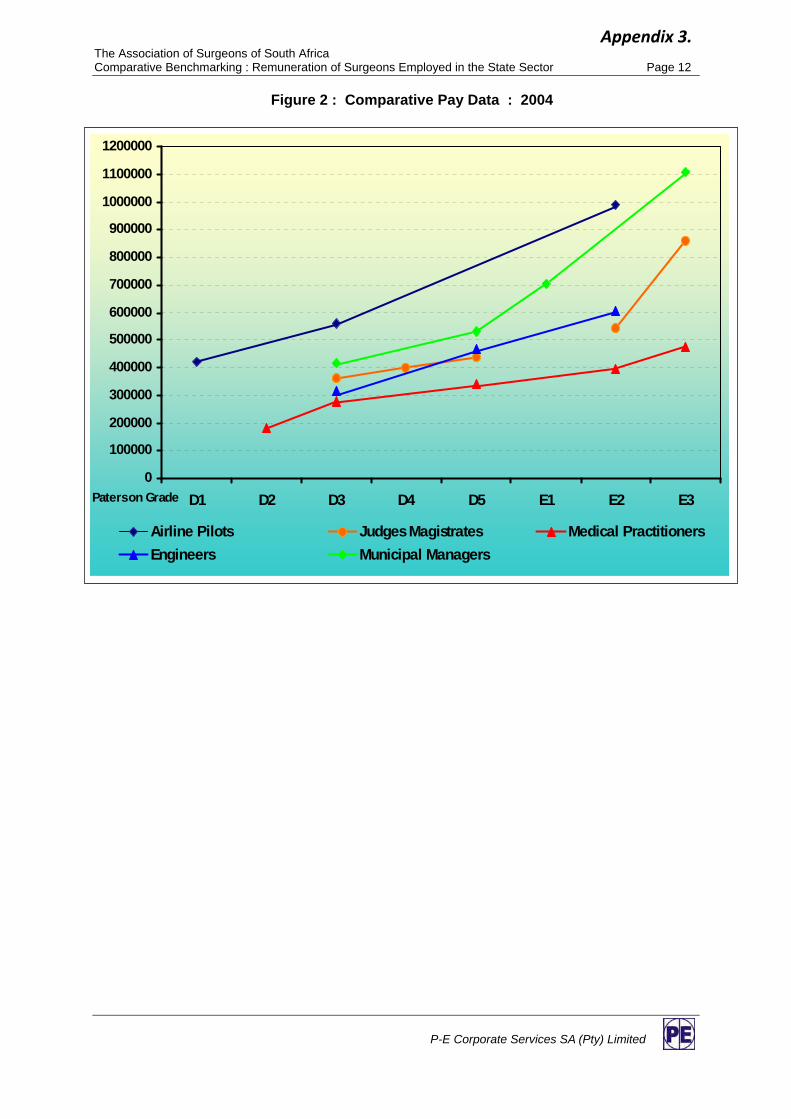
The Association of Surgeons of South Africa Comparative Benchmarking : Remuneration of Surgeons Employed in the State Sector Page 12
Figure 2 : Comparative Pay Data : 2004
0
100000
200000
300000
400000
500000
600000
700000
800000
900000
1000000
1100000
1200000
D1 D2 D3 D4 D5 E1 E2 E3Paterson Grade
Airline Pilots Judges Magistrates Medical PractitionersEngineers Municipal Managers
P-E Corporate Services SA (Pty) Limited
Appendix 3.

The Association of Surgeons of South Africa Comparative Benchmarking : Remuneration of Surgeons Employed in the State Sector Page 13
5. CONCLUSION
We trust this report will be helpful and look forward to discussing it with you.
Submitted on behalf of P-E Corporate Services by – D WILSON Senior Consultant ADELE SLOTAR Principal Consultant
M J R WESTCOTT Managing Director
/ub
P-E Corporate Services SA (Pty) Limited
Appendix 3.

88
General surgery is facing a serious crisis. In the past general surgery was an extremely popular career choice for newly qualified medical graduates. There was a healthy competi-tive demand for registrar posts at all local medical schools and these posts were always oversubscribed. However, there has been a dramatic decline in the number of applicants for registrar posts at all of the academic centres.1-3 Some of the
departments have had as many as 25% of the posts unfilled.A further concern has been the inability to attract and retain general surgical specialists in the state sector. Although it would appear that we have been training adequate numbers of general surgeons over the years, very few of them continue to practise in the state sector. Consequently many of the specialist posts in the non-academic centres, especially in the periphery, remain unfilled.
The Association of Surgeons in South Africa (ASSA) has been concerned about both the diminishing number of applicants presenting for general surgery training and the increasing number of general surgery posts that are vacant in the state sector in South Africa. As a result, ASSA took a decision in May 2004 to initiate a study to determine the extent and the cause of the problem.
The primary objective in commissioning this study was to collect and analyse comparative data that would enable ASSA to evaluate the factors which impact on a career in general surgery, in particular, the working conditions and the relative equity of the remuneration of general surgeons in South Africa. The relative equity not only referred to a comparison with other fields of medical specialisation, but also extended to other professions in general. ASSA would also like to use the study findings as a basis for developing strategies to correct the current inequities between surgeons and other medical specialists as well as other professionals, and to enhance the attractiveness of general surgery as a profession.
There were four aspects to the study, including an assessment of the shortage of general surgeons, an assessment of the factors that impact on the choice of general surgery as a career option, a report on the level of remuneration of specialists in the state sector, and a report on the level of remuneration of specialists in the private sector. In this paper we report on the critical shortage of medical practitioners and specialists in the state sector.
MethodsP-E Corporate Services (P-ECS) were contracted to undertake this study on behalf of ASSA. The terms of reference were to report on the work environment, conditions
General surgery in crisis – the critical shortageD. Kahn, Ch.m., f.C.s. (s.a.)
s. Pillay, f.C.s. (s.a.)
m. G. Veller, f.C.s. (s.a.), m.meD.
e. Panieri, f.C.s. (s.a.)
m. J. r. WestCott, B.sC. (Chem. enG.), m.B.l
association of surgeons of south africa and Departments of surgery, Universities of Cape town and the Witwatersrand
General SurgerySAJS
Summaryintroduction. General surgery is facing a serious crisis. there has been a significant decline in the number of applicants for registrar posts and an inability to attract and retain general surgical specialists in the state sector. the association of surgeons of south africa (assa) undertook this study to determine the extent and cause of the problem.
methods. the study involved a combination of desk research and structured interviews. in addition, the health Professions Council of south africa (hPCsa) database was reviewed and compared with the south african medical association (sama) and assa databases. the medical schools provided information about student numbers and demographics, and the national Department of health pro vided information about the status of medical practitioner and specialist posts in the state sector.
results. overall, 26.1% of the specialist posts were vacant. the situation was particularly critical in mpumalanga and the eastern Cape, where 84% and 58% of the specialist posts were vacant. Using a predictive model, a conservative estimate of the need for general surgeons was found to be at least 50 per year. Currently the eight medical schools graduate about 25 general surgeons per year. the changing demographics of medical students may be partly responsible for the decline in registrar applicants.
Conclusion. The findings from this study have revealed that the shortage of general surgeons in the state sector has reached critical levels.
VOL 44, NO. 3, august 2006 SAJS
general surgery-critical shortag88 88 7/25/06 3:49:16 PM
Appendix 4.

SAJS
89
of service and remuneration for general surgeons, both in the state and the private sector.
The approach to this assignment was based on a combination of desk research and structured interviews. The desk research included an in-depth study of relevant data in professional medical publications, other studies and the Internet. P-ECS also utilised their own extensive database of remuneration levels and employment policies across most sectors of the South African economy.
The structured interviews were undertaken with general surgeons in the state sector and in private practice, heads of departments, registrars, and other medical specialists. The surgeons interviewed were from Gauteng, the Free State, the Western Cape and KwaZulu-Natal. A structured questionnaire was developed to research the perceptions of recently qualified specialists and registrars about their choice of general surgery as a career option, and about the current state of the profession in general.
The Health Professions Council of South Africa (HPCSA) database was reviewed to determine the number of medical practitioners, both general practitioners and medical specialists, in practice. These data were compared with the South African Medical Association (SAMA) and the Association of Surgeons of South Africa (ASSA) databases.The medical schools also provided data with regard to the number of applications, the number of students registered, and the number of students graduating.
The National Department of Health provided data with regard to the total number of medical practitioner and specialist posts available in the various provinces, and whether the posts were filled or vacant.
Results
Populations of medical practitionersThe most recent statistics available from the HPCSA indicated that 19 195 general practitioners were registered with the Council and this, plus some 2 000 community service doctors, yielded a national total supply statistic of approximately 21 200 general practitioners (Table I). At the same time there were 9 025 specialists registered with the HPCSA, of whom 954 (10.5%) were categorised as surgeons.
ASSA is the official representative body for all general surgeons in South Africa and includes subspecialists such as vascular, trauma and gastrointestinal surgeons. The current ASSA membership totalled approximately 550. The general surgeons who were not ASSA members were assumed to be
no longer practising in South Africa, retired, or not members of the Association out of choice, since membership was voluntary.
SAMA claimed that approximately 70% of all specialists belonged to the Association. In fact the SAMA database included 6 954 specialists. The number of surgeons included in this SAMA database was 540, approximately 8% of the population of specialists.
Public and private sector breakdownThe breakdown of the medical professionals into those employed in the public and private sectors, according to the HPCSA and the SAMA statistics, are shown in Table I. There was excellent correlation between the statistics obtained from the HPCSA and the SAMA databases. Both databases indicate that approximately one-third of the specialists were employed in the public sector compared with two-thirds employed in the private sector.
The SAMA statistics also revealed that 27% of the population of specialists on the database had graduated/qualified during the past 10 years (1994 - 2004). Similarly, 23% of the population of surgeons on their database had graduated/qualified during the past 10 years. A review of the ASSA membership database showed that of the 161 members for whom identity numbers were available, 22% were over 60 years of age, 40% over 55 years and 63% over 50 years.
The ASSA database also indicated that 43% of the general surgeons worked exclusively in the private sector. Of the 30% of general surgeons who worked for the state, 67% (or 20% of the total sample) participated in remunerated work outside of the public sector (RWOPS). The remaining 27% of general surgeons in the ASSA database worked in both the state and private sectors.
Vacant posts in the state sectorThe Department of Health statistics as of August 2004 indicating the shortages of medical practitioners and medical specialists in each of the provinces are shown in Table II. The number of posts, number of posts filled and number of vacant posts are shown for each category of staff. The national data for medical practitioners and specialists indicated that of the 10 881 general practitioner posts available in the state sector, 26.6% were vacant and of the 4 464 specialist posts available, 26.1% were vacant. The situation was particularly critical in Mpumalanga, the Northern Cape and the Eastern Cape, where shortages exceeded 40%. More specifically, 84% of the specialist posts in Mpumalanga, 58% in the Eastern
aRtICLEs
TABLE I. HPCSA And SAMA STATISTICS of GEnERAL PRACTITIonERS And SPECIALISTS In THE STATE And PRIvATE SECToRS
HPCsa statistics saMa database
Public sector Private sector total Public sector Private sector total
General 7 987 (42%) 11 208 (58%) 19 195 (100%) practitioners
Specialists 3 298 (37%) 5 727 (63%) 9 025 (100%) 2 154 (32%) 4 573 (68%) 6 954 (100%)
Surgeons n/a n/a 954 188 (36%) 335 (64%) 540 (100%)(includedunder specialists)
SAJS VOL 44, NO. 3, august 2006
general surgery-critical shortag89 89 7/25/06 3:49:19 PM
Appendix 4.

SAJS
90
aRtICLEs
Cape and over 40% in Limpopo and North-West province were vacant. In contrast, in the Western Cape only 4.7% of the specialist posts in the state sector were unfilled.
Predictive model of the needIt is difficult to determine the actual demand for general surgeons in both the state and private sectors. A predictive model could be used to estimate the number of general surgeons that need to graduate annually to meet the demand for surgical services in South Africa. Thus, for example, the following assumptions and calculations could be made. It can be assumed that South Africa’s population of 40 million people will require 720 000 general surgery admissions per year and that a general surgeon may typically handle 5 - 10 admissions and/or consultations of varying complexity per day. General surgeons, after allowing for leave, conferences and development time, etc. may be expected to have 200 - 220 working days available. A general surgeon would therefore have the capacity to handle some 1 500 admissions/consultations per year.
A 5 - 10% attrition rate should be applied to allow for normal retirements, deaths and those who leave the profession for other reasons. The theoretical need, calculated on the basis of the above assumptions, would therefore be approximately 500 general surgeons to meet current demands. However, considering the nature of the assumptions, this need could range from 350 to 700, i.e. between 1 surgeon per 115 000 population and 1 surgeon per 57 000 population.
Based on the above attrition rate, the calculations suggest that the number of surgeons that need to be graduated annually to meet the demand would be in the 40 - 50 range. It should, however, be borne in mind that the above theoretical calculation assumes that the full population of general surgeons is engaged in providing full-time service. This is obviously a simplification, particularly in the state sector, where surgeons have additional academic and administrative responsibilities. Furthermore these figures do not take into account the high net rates of emigration of medical graduates from South Africa.
TABLE II. THE dEPARTMEnT of HEALTH STATISTICS IndICATInG THE nuMBER of fILLEd And unfILLEd MEdICAL PRACTITIonER And SPECIALIST PoSTS In EACH PRovInCE
Province Occupational classification total filled total vacant total posts % vacant
Eastern Cape Medical practitioners 823 489 1 312 37.3 Medical specialists 153 208 361 57.6 976 697 1 673 41.7free State Medical practitioners 570 212 782 27.1 Medical specialists 244 101 345 29.3 814 313 1 127 27.8Gauteng Medical practitioners 1 557 570 2 127 26.8 Medical specialists 1 168 370 1 538 24.1 2 725 940 3 665 25.6KwaZulu-natal Medical practitioners 1 943 494 2 437 20.3 Medical specialists 546 263 809 32.5 2 489 757 3 246 23.3Limpopo Medical practitioners 718 185 903 20.5 Medical specialists 66 49 115 42.6 784 234 1 018 23.0Mpumalanga Medical practitioners 555 398 953 41.6 Medical specialists 13 67 80 83.8 568 465 1 033 45.0north West Medical practitioners 429 173 602 28.7 Medical specialists 54 42 96 43.8 483 215 698 30.8northern Cape Medical practitioners 231 250 481 52.0 Medical specialists 20 10 30 33.3 251 260 511 50.9Western Cape Medical practitioners 1 154 113 1 267 8.9 Medical specialists 1 027 51 1 078 4.7 2 181 164 2 345 7.0national depts Medical practitioners 7 10 17 58.8 Medical specialists 7 5 12 41.7 14 15 29 51.7Total Medical practitioners 7 987 2 894 10 881 26.6South Africa Medical specialists 3 298 1 168 4 464 26.1 11 285 4 060 15 345 26.5
VOL 44, NO. 3, august 2006 SAJS
general surgery-critical shortag90 90 7/25/06 3:49:19 PM
Appendix 4.

SAJS
91
Currently the eight medical schools graduate approximately 25 general surgeons per year. This therefore represents only half of the most conservative estimate of numbers required to maintain the country’s current service levels.
Trends in university/medical school applications
Collectively, South African university medical schools have received an average of 10 251 applications for admission to medicine, per annum, for the past 4 years (Table III). About 9% of these applications were successful and admitted to the first year. It should be noted, however, that this understated the actual percentages of successful applications as many students applied to more than one medical school. It was evident that there was a steady supply of school leavers eager to enter the medical profession each year.
Of the numbers of medical students graduating annually, medical school statistics indicate that approximately 40 doctors (3.5% of graduates) were applying to specialise in general surgery each year. This admission rate to surgery was approximately 30% lower than the numbers required to maintain the service levels.
The impact of transformation of the South African economy and socio-political structuresIt is common cause that the South African economy and socio-political structures are in transformation. The background and reasons for this are well established. Of relevance, however, is the Employment Equity Act, which has as its stated objective: ‘to eliminate unfair discrimination in employment practices and, at the same time create a diverse workforce which reflects the national and regional demographics of South Africa’s economically active population’. In the medical field the changes have impacted on diverse issues ranging from the racial and gender composition of university student admissions to how and where medical services are delivered.
University admissions
The racial and gender mix of students registered for first-year studies at the South African medical schools over the last 4 years are shown in Table IV. Sixty per cent of all student registrations were now females, with only 40% being males. The proportion of female students has increased from 10% in the 1960s to 17% in the 1970s, 22% in the 1980s, 46% in the 1990s, and the current 60%.
The proportion of black students increased from 35% in 2001 to 43% in 2004. Registration of white students has declined from 39% to 33% over the same period. The total proportion of students with historical ‘pdi’ status, i.e. black and female, has increased from 61% to 67%.
While the rationale on which these directives were based was fully understandable, there have also been certain unavoidable consequences. Many of the country’s most talented and ambitious school leavers, who might otherwise have considered a career in medicine, have elected to pursue other professions.
Furthermore, the gender mix trend in student intake has had an adverse impact on the availability of general surgery candidates in particular. The proportion of female doctors who elect to specialise in surgery has traditionally been lower than for male doctors. In addition, the perception among interviewees was that those females who did want to specialise tended to select specialties where practice hours were usually limited to normal working hours. Reluctance on the part of females to enter into general surgery was attributed both to ‘family’ reasons and to concerns about security associated with after-hours work.
At the University of KwaZulu-Natal Medical School only 16% of the current registrars were female, compared with a female student intake of over 50%. The University of the Free State only had 2 female registrars. A previous study from the University of the Witwatersrand noted that 9.9% of male graduates sampled have specialised in surgery and surgical specialties, compared with only 0.9% of female graduates.
TABLE III. unIvERSITy APPLICATIonS And AdMISSIonS To MEdICInE In SouTH AfRICA
Year No. of applicants No. of admissions % admitted
2001 10 184 921 9.02002 10 141 917 9.02003 10 203 892 8.72004 10 474 913 8.7Average 10 251 911 8.9
TABLE Iv. RACIAL And GEndER MIx of STudEnTS REGISTEREd foR fIRST yEAR AT THE SouTH AfRICAn MEdICAL SCHooLS
gender mix Racial mix total Male Female Black White Indian ColouredYear registrations No. % No. % No. % No. % No. % No. %
2001 921 366 40 555 60 319 35 360 39 170 18 72 82002 917 349 38 568 62 342 37 363 40 165 18 47 52003 892 365 41 527 59 359 40 331 37 142 16 60 72004 913 363 40 550 60 394 43 303 33 154 17 62 7
aRtICLEs
SAJS VOL 44, NO. 3, august 2006
general surgery-critical shortag91 91 7/25/06 3:49:20 PM
Appendix 4.

SAJS
92
aRtICLEs
Practice qualification requirements
Transformation within the medical profession has included changes in the way in which doctors qualify to practise, and are authorised to practise. Medical students are required to complete a year of community service, which is seen as being of potential benefit. However the lack of consultation about the location of postings, restraints on personal freedom of choice, and poor and inadequate facilities, expertise, supervision and administration at many hospitals, have all provided strong disincentives.
The pending legislation that will require doctors in the future to obtain a Certificate of Need dictating where they may practise was seen as impacting on personal freedom of choice and a further disincentive to specialise.
Immigration and emigrationAccording to official statistics (Statistics SA), emigration from South Africa has ranged between 8 000 and 16 000 people per annum, and has averaged 10 400 per annum over the past 10 years. Immigration, on the other hand, has ranged between 3 000 and 10 600 over the same period, averaging 6 400 per annum. The country has therefore suffered a net loss of some 4 000 people per annum over this period.
Medical practitioners have comprised 0.8 - 1.2% of total emigrants over the past 5 years. It is not known what proportion of this sample comprised specialists. However, data from Statistics SA for 1997/98 indicated that specialists accounted for 20 - 30% of medical practitioner emigrants at that time.
As a rough approximation medical practitioners may be estimated to account for some 1% of an average of 4 000 people per annum, i.e. 40 practitioners per annum. Specialists could account for 8 - 10 of these professionals. However, it is well acknowledged that many professionals leaving South Africa permanently do not necessarily follow official emigration procedures. Thus the ‘real’ brain drain statistic would have been approximately three times the official statistic. A crude deduction would suggest that South Africa was currently losing at least 100 - 200 medical practitioners, including 25 - 50 specialists, annually as a result of emigration.
South Africa apparently loses almost half of its qualified doctors to the UK, Canada and Australia. According to Departmental estimates from 2001, over 23 000 South African medical health professionals (all categories) were working overseas in English-speaking ‘First-World’ countries. The majority are in the UK (38%), the USA (30%), Australia (15%) and Canada (10%).
The impact of the exodus of medical professionals from developing countries has been enormous. Approximately 6% of all British and 10% of all Canadian hospital-based doctors are South African. Only 60 of 500 doctors trained in Zambia since independence still work in that country, and Mozambique has only 500 doctors to service a population of 18 million. Malawi has only one general surgeon and one orthopaedic surgeon in the government health service.
discussionThe Association of Surgeons, because of concern about both the decreasing number of applicants for general surgical registrar posts and the increasing number of unfilled specialist posts in the state sector, commissioned P-ECS to
undertake this study into the status of general surgery. This part of the study documents the shortage of general surgeons and some contributing factors.
The findings from this study have revealed that the shortage of qualified general surgeons (and other medical practitioners) in the state sector has reached critical levels, to the extent that this is receiving regular media attention. Where over 50% of specialist posts remain continuously vacant in certain provinces, it is difficult to understand what additional evidence is required for the situation to be acknowledged as a crisis. The situation is particularly critical in Mpumalanga, the Northern Cape and the Eastern Cape.
The extent to which the number of general surgeons practising in the private sector is in line with the demand for medical treatment is difficult to gauge with accuracy. Various sources, such as the SAMA and the medical aid associations, have suggested that in their opinion South Africa had an adequate supply and possibly an oversupply of medical professionals within the private sector. However, it should be remembered that the high-volume demand for medical treatment in South Africa is met through state sector institutions.
HPCSA statistics indicated that some 1 300 general practitioners were registering to practise each year. These numbers may be reconciled with annual demand for general practitioners by applying a 5 - 10% attrition rate to the current population of ±20 000 general practitioners, i.e. an annual requirement of between 1 000 and 2 000 general practitioners.
The fact that there is believed to be an oversupply within the private sector is counter-balanced by severe shortages in the state sector. In overall terms it is therefore very possible that the requirement for medical practitioners exceeds the current supply. The above sources also suggested that South Africa had an adequate supply of specialists in most medical specialties within the private sector. The population of specialists as noted above exceeds 50% of the number of general practitioners, indicating that there is one specialist for every two general practitioners. The population of surgeons may be estimated from the same statistics as 5% of the population of general practitioners, or one surgeon for every 20 GPs.
It has been estimated that South Africa needs to produce in excess of 50 general surgeons per year, based on the usual attrition rate. Currently the eight medical schools graduate less than 25 general surgeons per year on average. In other words, the numbers of general surgeons qualifying annually is substantially lower, and possibly no more than 50% of current estimates. Furthermore, a significant proportion of these recently qualified specialists emigrate, either temporarily or permanently, to practise abroad.
Further evidence of the critical shortage of surgeons is the fact that 63% of the general surgeons belonging to ASSA were over the age of 50 years. Not only are the numbers of general surgeons being trained inadequate, but many young surgeons elect to emigrate.
Various factors have been identified as being responsible for the decline in the number of applicants for general surgical training posts. Changes in the demographics of medical students, with an increase in the numbers of female and black students, appear to be partly responsible. Female and black students tend not to consider a career in surgery as an option, probably because of the lack of suitable role models.
VOL 44, NO. 3, august 2006 SAJS
general surgery-critical shortag92 92 7/25/06 3:49:20 PM
Appendix 4.

SAJS
94
aRtICLEs
Many black students also have financial responsibilities that preclude them from specialising after completing the internship and community service years.
Other factors contributing to the large number of unfilled specialist posts in the state sector, such as poor remuneration and poor working conditions, will be discussed in the subsequent reports.
In summary, therefore, the critical shortage of specialists in the state sector, which has reached crisis proportions, has been aggravated by the fact that the number of surgical graduates per year has been grossly inadequate. Transformation at medical schools may be partly responsible
for the decline in the number of applicants for surgical registrar posts.
Mr Brian Ruff, of Discovery Health, provided the predictive model to estimate the need for general surgeons.
REFERENCES
1. Marschall JG, Karimuddin AA. Decline in popularity of general surgery as a career choice in North America. World J Surg 2003; 27: 249-252.2. Podnos YD, Campbell B, Wilson SE, et al. Patterns of graduating medical student career selections from 1997 to 1998 and their effect on surgery as a career choice. Arch Surg 1999; 134: 876-880.3. Cofer JB, Biderman MD, Lewis PL, et al. Is the quality of surgical resi- dency applicants deteriorating? Am J Surg 2001; 181: 44-49.
VOL 44, NO. 3, august 2006 SAJS
PRICE: R380.00SAMA MEMBERS: R360.00
TO ORDER CONTACT:
South African Medical Association
Health & Medical Publishing Group
1-2 Lonsdale Building, Gardener Way,
Pinelands, 7405
Tel: (021) 530-6520/27
Fax: (021) 531-4126/3539
email: [email protected]
HMPG
clinical medicine ad 11/11/05 11:57 AM Page 1
South African Medical Association
Health & Medical Publishing Group
4th Floor, Sanclare Building, 21 Dreyer
Street, Claremont, 7700
Fax: (021) 683-4509
Tel: (021) 657-8200
general surgery-critical shortag94 94 7/25/06 3:49:24 PM
Appendix 4.

There is a serious concern about the diminishing interest in general surgery as a specialty.1,2 The last 5 - 10 years has seen a significant reduction in the number of applicants for surgical trainee positions at all local academic institutions. Furthermore, there are an increasing number of vacant posts in surgery in the state sector. As a result, the Association of Surgeons of South Africa (ASSA) undertook a study to determine the extent of the problem. ASSA has a membership of about 500 and is the official body representing general surgeons in both the state and the private sectors in South Africa.
The decline in applicants to general surgery has been noticed throughout the world.1-3 Several reasons may be responsible for this serious threat to the future of surgery, and include factors such as graduates placing a greater emphasis on a favourable lifestyle, the lure of private practice, the lure of overseas, and the comparatively low remuneration.4-7 In this study we compared the levels of remuneration of general surgeons employed in the state sector with both other professionals employed in the state sector, and general surgeons employed in selected English-speaking First-World countries, with the objective of assessing the degree of remuneration parity general surgeons currently enjoy.
MethodsP-E Corporate Services (P-ECS) were contracted by ASSA to undertake this comparative study into the remuneration and working conditions of general surgeons in South Africa. The study involved a combination of desk research, structured interviews, and a brief visit to an international destination that typically attracts South African doctors.
The desk research involved in-depth reviews of relevant data in professional medical publications, other studies, the internet, and P-ECS’s own extensive database of remuneration levels and employment policies across most sectors of the South African economy.
Structured interviews were undertaken with general surgeons, including heads of departments, recently qualified specialists, and registrars, other medical specialists, and professionals in other fields, such as law, accounting, engineering, etc. The interviews were spread through Gauteng, the Free State, KwaZulu-Natal, and the Western Cape. A structured questionnaire was developed to research the surgeons’ perceptions of their choice of general surgery as a career option, and of the current state of the profession in general.
The international field research was limited to two interviews in the UK plus fairly comprehensive desk research.
The levels of remuneration of general surgeons within the state sector were compared with other professionals in the state sector and general surgeons employed in selected English-speaking First-World countries with the objective of
General surgery in crisis – comparatively low levels of remunerationD. Kahn, Ch.M., F.C.S. (S.a.)
S. Pillay, F.C.S. (S.a.)
M. G. Veller, F.C.S. (S.a.), M.MeD.
e. Panieri, F.C.S. (S.a.)
M. j. r. WeStCott, B.SC. (CheM. enG.), M.B.l.
association of Surgeons of South africa and Departments of Surgery, Universities of Cape town and the Witwatersrand
General SurgerySAJS
SummaryIntroduction. Several factors, including comparatively low remuneration, may be responsible for the decline in applicants to general surgery. in this study, the levels of remuneration of general surgeons in the state sector were compared with other professionals in the state sector and general surgeons overseas.
Methods. the study involved a combination of desk research and structured interviews. the Paterson system of job evaluation was used to compare general surgeons with other professionals. the levels of remuneration of general surgeons in the state sector were compared with those of other professionals.
Results. There was a significant difference in the levels of remuneration between state-employed medical practitioners and other professional positions such as legal professionals, municipal managers and airline pilots. at senior levels (senior specialist) the remuneration was only ±55% of that paid to the selected comparator group. there was also a significant differential between the remuneration of state-employed general surgeons and their overseas counterparts.
Conclusion. levels of remuneration of state-employed medical practitioners continue to lag behind other professionals.
96 Vol 44, no. 3, aUGUSt 2006 SAJS
general surgery-comparatively lo96 96 7/25/06 4:10:05 PM
Appendix 4.

SAJS
98
artiCleS
assessing the degree of remuneration parity general surgeons currently enjoy.
Remunerat ion compar i sons be tween med ica l professionals and other professionals were necessarily ‘best approximations’. Job descriptions and content obviously varied from profession to profession and factors such as the nature of work carried out, working conditions, decision-making structures, consequences of error etc. also varied correspondingly. In the case of the international comparisons, job alignment was somewhat easier. However, factors such as differences in tax and social security structures, living standards and cost of living had to be taken into account. Nevertheless, methodologies to provide reasonably meaningful comparisons were employed.
Comparison of general surgeons with other professionals employed in the state sector
Comparisons of jobs across different functional areas were made by analysing job content, and grading or ranking this using a job evaluation system. Job evaluation may be defined as the process of determining, without regard for personalities or personal competencies, the worth of one job relative to others. Job evaluation systems therefore measure the intrinsic worth of jobs. Various such systems are used in South Africa, and all employ a conceptually similar approach.
For the purpose of this study the Paterson system of job evaluation was used. This is the most widely used system in South Africa and categorised jobs in terms of decision bands. Each band represents an increasingly complex decision level and thus a more senior management level. For the purpose of evaluating and grading (or ranking) jobs, the bands are divided into grades and sub-grades. Six bands are recognised in the Paterson system, from the lowest to highest organisational decision levels.
Only the three highest bands were required for comparative purposes in this exercise and these bands, grades and sub-grades, and typical management and decision responsibility levels are shown in Table I.
Pay scales applicable to general surgeons working in the state sector were analysed and compared with selected professions employed within the same sector. The selection of comparator professions was necessarily constrained by availability of comparative data. For example, single-state pay scales were not readily available for professions such as accounting and engineering where such skills may be located
in various job functions across various departments. In such cases overall public sector data were used.
Comparisons were made by grading jobs at different professional levels and computing total cost of employment figures.
The professions and benchmark jobs which were used for comparative purposes are shown in Table II.
General surgeons compared with their coun-terparts in English-speaking countries
The level of remuneration and net disposable income earned by medical practitioners in state employ in South Africa was compared with that in selected English-speaking countries. In order to provide meaningful comparisons of earnings in different international locations, it was necessary to take factors such as taxation, social security costs, costs of living and essential living expenditure into consideration, in addition to gross remuneration earned.
P-ECS had developed a robust methodology for this purpose, which involved computing the ‘net disposable income’ (NDI) associated with levels of remuneration earned for comparable jobs in different international locations. Application of the methodology in this particular situation involved the following steps:
1. The gross remuneration data (total cost of employment) for medical practitioners at different levels in different international locations was researched. The three countries selected for comparison with South Africa were the UK, Australia and New Zealand.
2. The deduction of taxation and social security (retirement funding, medical health insurance costs, etc.), based on normal market practice in the country concerned, from the gross remuneration yielded a net income figure.
3. The essential living costs applicable at the remuneration level and in the country concerned were determined. Essential living costs were defined as costs required to purchase non-luxury needs such as food, housing, transport, etc. in the country concerned.
4. Deduction of the essential living costs from the net income yielded the NDI. The NDI represented that portion of the gross remuneration available for discretionary spending or saving.
5. By dividing the NDI by the essential living costs we were able to develop a convenient index of the purchasing power of the net disposable income.
TABLE I. COMPARISONS OF JOBS ACROSS DIFFERENT FUNCTIONAL AREASPaterson band Management level Broadband grades Sub-grades Decision type
F Top management/executives F upper F2 Policy making or strategic in large companies F lower F1 decisions usually made at top management/board level
E Senior executives reporting to E upper E3/E4 Programming decision usually the CEO. Holding or subsidiary/single E lower E1/E2 made by senior managers or head unit company of major functions/business units
D Middle managers and professionally D upper D4/D5 Interpretive or probabilistic decisions qualified, experienced specialists, D lower D1/D2/D3 usually made by middle management e.g. in finance, IT, etc. and professional staff based on overall corporate strategy
Vol 44, no. 3, aUGUSt 2006 SAJS
general surgery-comparatively lo98 98 7/25/06 4:10:07 PM
Appendix 4.

SAJS
99
Salary increases
The salary increases awarded to state-employed medical practitioners over the past 5 years was analysed. The increases in basic salary and in total cost of employment were analysed separately. The increases were compared with the average increases awarded to all staff categories across all sectors of the South African economy, and with inflation.
All sector increases were extracted from P-ECS’s annual National Surveys of General Staff Remuneration in South Africa. The surveys report on a database of over 900 organisations across all sectors, employing between 1.5 and 2 million staff. They are regarded as highly authoritative and are used as benchmarks by numerous South African companies. Inflation data was based on Statistics S.S. data, and the CPIX indicator had been employed for this purpose.
Results
General surgeons compared with other medical professionals in state employ
Consultant general surgeons and registrars in state employ were paid on a comparable basis with other medical
professionals in state employ. The remuneration package included base pay for a 40-hour working week, 16 hours of overtime, a scarce skills allowance, and a rural allowance where applicable. A ‘standard’ bonus (thirteenth cheque) was paid in the birthday month. State benefits also included the pension fund, medical aid contributions, a housing allowance and education subsidy.
No provision was made for the provision or cost reimbursement of essential productivity tools such as cell phones or laptops, which have to be provided at the cost of the employee.
General surgeons compared with other professionals employed within the state sector
Comparative remuneration data for various professionals employed in the state sector are shown in Table III. Comparisons were made on the basis of total employment cost, i.e. basic salary plus cash allowance (e.g. car allowances, annual non-performance-related bonus, etc.) plus value of company (state) contributions paid on behalf of employee (e.g. retirement funding, insurances, medical aid, etc.). Where employees in selected benchmark positions were eligible for
TABLE II. PROFESSIONS AND BENCHMARK JOBS USED FOR COMPARATIVE PURPOSES
Profession job title/benchmark job Paterson grade/broadband
Medical practitioner in Intern D2 D lowerstate sector employ Registrar (Leg 1) D3 D lower Community service doctor D3 D lower Medical officer D3 D lower Junior specialist (working under D5 D upper supervision) Senior medical officer D5 D upper Specialist E2 E lower Principal medical officer E2 E lower Chief medical officer E3 E upper Senior specialist E3 E upper
Judge/magistrate in Magistrate D3 D lowerstate sector employ Senior magistrate D4 D upper Regional/chief magistrate D5 D upper Regional court president/special grade E2 E lower Chief magistrate Judge, e.g. High Court, Labour Court E3 E upper
Engineer employed in Qualified professional engineer D3 D lowerthe public sector (5 - 10 years’ experience)(state, local authority Qualified professional engineer D5 D upperor parastatal) (over 10 years’ experience) Engineering manager in intermediate-sized E2/E3 E lower/E upper organisation
Municipal manager: Small local authority D3 D lower Medium local authority D4 D upperLocal authority Intermediate-sized local authority, e.g. Kimberley, East London E1 E lower Large local authority (Metro), e.g. Johannesburg, Cape Town E3 E upper
Airline pilot in First Officer: Narrow-bodied aircraft D1 D lowerstate-owned airline, Senior First Officer: Wide-bodied aircraft D3 D loweri.e. SAA, SA Express, Captain: Narrow-bodied aircraft E1 E lowerSA Airlink Captain: Wide-bodied aircraft E2/E3 E lower/E upper
SAJS Vol 44, no. 3, aUGUSt 2006
artiCleS
general surgery-comparatively lo99 99 7/25/06 4:10:07 PM
Appendix 4.

SAJS
102
artiCleS
short-term incentive pay (i.e. a payment, typically annual, for achieving pre-agreed performance criteria), the amount for achieving budget or expected performance has been included. The data are shown as either the average remuneration or the calculated mid-point of the pay range at the grade concerned. When available, the pay ranges are also reflected. The most current available pay data have been used.
It is evident that significant differentials exist between the remuneration of state-employed medical practitioners and other professional positions. The registrar remuneration trailed that of state-employed legal professionals by 23%, municipal managers by 33%, and airline pilots in state-owned airlines by 50%. The remuneration of senior medical specialists in the state sector trailed that of their legal counterparts by 45%, and was less than half the remuneration for municipal managers and airline pilots.
The comparative ratios in Table III indicate the relationship between the remuneration of medical practitioners and the average remuneration paid to the ‘basket’ of selected benchmark, comparator positions. This highlighted the fact that registrars and medical officers receive only ± 70% of the remuneration paid to their peers. At more senior levels (senior specialists and principal medical officers) the remuneration was only ±55% of that paid to the selected comparator group.
It should also be noted that about 25% of the remuneration of medical specialists comprised non-pensionable allowances, which further disadvantaged them in relation to other state employees.
The differences in remuneration for the different professionals in state employ are illustrated graphically in Fig. 1.
General surgeons compared with their counterparts employed in selected English-speaking First-World countries
The gross remuneration by job level for each of the four countries is shown in Table IV. The remuneration data were reflected in a common currency (South African rands) converted at the following exchange rates: GB£1: R11.6, AU$1: R4.8, NZ$1: R4.5.
At each job level gross remuneration for South African medical practitioners was less than for their international counterparts. At specialist and senior specialist level the gross remuneration was only marginally less than in Australia, but approximately 30% less than in New Zealand and less than half of that in the UK. However, it should be borne in mind that medical practitioners in Australia work in private practice as well and this income is not reflected in their gross remuneration.
The net disposable income (NDI) calculations for specialists and senior specialists are shown in Tables V and VI. According to the calculations the NDI for South African specialists and senior specialists was greater than for their Australian counterparts, equivalent to those in New Zealand, but less than half of that in the UK. The NDI for senior specialists in South Africa was R113 000 compared with R260 000 for those in the UK, and R80 000 and R110 000 for those in Australia and New Zealand respectively.
The purchasing power ratios relative to South Africa (as base 100) averaged for specialists and senior specialists is shown in Fig. 2. Compared with the base of 100 for South African specialists and senior specialists, those in the UK, Australia and New Zealand had purchasing power ratios of
TABLE III. COMPARATIVE REMUNERATION FOR DIFFERENT PROFESSIONS
Annual total cost of remuneration (rands) – average salary/grade mid-point (range reflected in brackets where applicable)
Airline pilots: Paterson Medical Judges/magistrates Engineers in Municipal managers: state-owned Comparative grade practitioners in state sector public sector Local authorities airlines ratio D1 420 000 (315 000 - 525 000)D2 179 000 D3 278 000 362 000 315 000 415 000 560 000 (262 000 - (328 000 - (440 000 - 0.67 384 000) 525 000) 700 000)D4 398 000 D5 343 000 440 000 467 000 532 000 (393 000 - (429 000 - 0.72 569 000) 660 000)E1 705 000 (596 000 -
E2 397 000 545 000 990 000 (740 000 - 0.56 1 250 000)
E3 475 000 861 000 1 108 000 (988 000 - 0.55 1 276 000)
Vol 44, no. 3, aUGUSt 2006 SAJS
841 000)
607 000(511 000 -753 000)
general surgery-comparatively lo102 102 7/25/06 4:10:07 PM
Appendix 4.

SAJS
104
artiCleS
130, 56 and 76 respectively. In other words the standard of living of general surgeons employed in comparable positions in the UK was some 30% higher than in South Africa, whereas South Africans enjoyed higher living standards than their colleagues in Australia and New Zealand.
In order to make meaningful deductions from these statistics, however, it is important to reconcile this analysis with comparable statistics for business executives working in the commercial sector. Summary purchasing power ratios for South African executives compared with their counterparts in selected developed countries are shown in Fig. 3.
The most striking feature of the most recent commercial sector comparisons was that South African executives enjoyed purchasing power parity with American executives and exceeded those of counterparts in the UK and Australia.
Salary increases
The salary increases awarded to state-employed medical practitioners over the past 5 years are shown in Table IV.
The data in Table VII indicate that the basic salary increases awarded to state-employed medical practitioners
Vol 44, no. 3, aUGUSt 2006 SAJS
0
200000
400000
600000
800000
1000000
1200000
D1 D2 D3 D4 D5 E1 E2 E3
Airline pilots
Engineers
Judges,Magistrates
Municipal managers
Medical Practitioners
1 200 000
1 000 000
800 000
600 000
400 000
200 000
Airline pilots
Engineers
Judges, magistrates
Municipal managers
Medical practitioners
Fig. 1. Comparative remuneration for different professions.
TABLE IV. GROSS REMUNERATION BY JOB LEVEL FOR EACH COUNTRY
Total employment cost (rands per annum)
Benchmark job title South Africa UK Australia New Zealand
Intern 178 693 243 275 240 206 360 000Medical officer Registrar (1st leg) 278 191 367 233 264 197 455 587Senior medical officer Registrar (2nd leg) 342 996 509 298 331 200 562 500Principal medical officer Specialist 397 331 852 925 421 978 607 500Chief medical officer Senior specialist 474 753 1 053 720 513 931 684 000
TABLE V. PRINCIPAL MEDICAL OFFICER/SPECIALIST
South Africa UK Australia New Zealand
Total employment cost 397 000 850 000 430 000 610 000Tax and social security 94 000 290 000 140 000 200 000
Net income after tax/social 303 000 560 000 290 000 410 000security Essential living costs 240 000 430 000 260 000 340 000
Net disposable income 63 000 140 000 30 000 70 000NDI/ELC (purchasing power 0.26 0.33 0.12 0.21of NDI) ratioPurchasing power ratio relative 100 127 46 81to SA as base 100
020406080
100120
140
SouthAfrica
UK Australia NewZealand
Fig. 2. Purchasing power ratios relative to South Africa (as base 100).
general surgery-comparatively lo104 104 7/25/06 4:10:08 PM
Appendix 4.

SAJS
106
artiCleS
have trailed both all sector averages and rates of inflation by ±36% and ±24% respectively. The position improved if increases in the total package were considered, with medical practitioners trailing all sector increases by 13%.
Remunerated work outside of the public sector (RWOPS)
The low level of remuneration paid to state-employed surgeons over many years has led to the entrenchment of the practice of RWOPS. It has become accepted practice that general surgeons need to supplement their public sector-
based pay packages by carrying out private practice work. It is estimated that over 90% of medical professionals in the state sector now engage in this practice at least to some degree. Additional earnings potential can be attractive.
Discussion
In this part of the study, the levels of remuneration of general surgeons within the state sector were compared with other non-medical professionals in the state sector, and general surgeons employed in selected English-speaking First-World countries. The data showed that recently qualified general surgeons in state sector employ were remunerated at rates some 25 - 30% below the public sector positions used in the comparisons, including state-employed legal professionals, municipal managers, and airline pilots in state-owned airlines. These differentials increased up to 100% at higher levels of seniority. In addition, the level of gross remuneration for South African medical practitioners was also less than their international counterparts.
In the broadest sense, remuneration may be interpreted as the cost of labour. In developing remuneration policies, therefore, it is conventional within the private sector that higher levels of pay are required to attract and retain higher level skills and skills that are in short supply. The national remuneration survey statistics confirm that some 54% of South African organisations (across all sectors) currently pay premiums, over and above their established or ‘normal’ pay scales, to attract and retain scarce skills.
TABLE VI. CHIEF MEDICAL OFFICER/SENIOR SPECIALIST
South africa UK australia new Zealand
Total employment cost 475 000 1 050 000 510 000 680 000Tax and social security 122 000 370 000 170 000 230 000
Net income after tax/social security 353 000 680 000 340 000 450 000Essential living costs 240 000 420 000 260 000 340 000
Net disposable income 113 000 260 000 80 000 110 000NDI/ELC (purchasing power of NDI) ratio 0.47 0.62 0.31 0.33Purchasing power ratio relative to SA 100 132 66 70as base 100
TABLE VII. SALARY INCREASES AWARDED TO STATE-EMPLOYED MEDICAL PRACTITIONERS AND OTHER STAFF EMPLOYED ACROSS ALL SECTORS OF THE ECONOMY COMPARED WITH THE INFLATION RATE
State-employed General staff employed medical practitioners across all sectors of Period Basic salary (%) Total package (%) the economy (%) Inflation (CPIX) (%)
1999 - 2000 6.0 n/a 8.2 7.92000 - 2001 6.5 n/a 8.0 6.42001 - 2002 9.0 n/a 8.0 9.22002 - 2003 9.0 n/a 8.9 6.42003 - 2004 6.2 n/a 7.8 5.0Cumulative increase 30.7 41.8 48.2 40.1
n/a = no data available
Vol 44, no. 3, aUGUSt 2006 SAJS
0102030405060708090
100
SouthAfrica
USA UK Australia
Fig. 3. Purchasing power ratios for executives in South Africa relative to counterparts in selected developed countries.
general surgery-comparatively lo106 106 7/25/06 4:10:08 PM
Appendix 4.

SAJS
107
In recent years the public sector has in many areas begun to adopt pay policies that are more closely aligned with current best practice in remuneration. For example, municipal managers are now remunerated with reference to overall market rates and packages include incentive pay structured around performance criteria such as service delivery. In contrast, levels of pay of state-employed medical practitioners lag behind private sector rates by very substantial margins. In addition remuneration paid to medical practitioners is also low in relation to that paid to state and public sector employees in other professional and managerial categories, and in relation to job-related skill levels.
Many factors play a role in the choice of a career in medicine. Financial compensation is usually regarded as an important consideration in choosing a career option as a young medical graduate.7 The decline in physician income, and in particular, the declining reimbursement for surgical services, is universal and we would argue that this may one of the major reasons for the significant decline in the number of applicants for surgical registrar posts, both locally and overseas.
The performance of RWOPS has been critical in retaining general surgeons in the state sector. However, RWOPS practice has obvious implications that cause ongoing debate. The ethics and morality of carrying out what is in effect a second job while under an existing contract of employment are questionable. This is justified on the basis that the state system would collapse as a result of mass resignations if surgeons were not allowed to supplement their income in this way. In addition, this practice is not unique to South Africa and there are many similar examples throughout the world.
One of the problems with RWOPS is the lack of control on the amount of work carried out. The onus is placed on the individual to act responsibly. Conflicts inevitably do arise, particularly when cost of living pressures force surgeons to prioritise a certain number of RWOPS hours to the detriment of the state jobs.
Other s argue that i t would be unreasonable to condemn the practice of RWOPS as unethical and immoral given that it has become entrenched and accepted practice, and that it has become essential at this time to avoid further losses of already scarce medical skills from the state sector.
South African executives in most sectors of the economy were currently enjoying a period of unprecedented relative
prosperity in relation to their international counterparts. This was largely due to the recent good performance of the South African economy and in the case of the business/commercial sector, significant increases in executive pay flowing partly from globalisation of pay scales. Other factors included the low inflation and a stable rand, relatively low living costs in South Africa, and a weak US dollar.
The position of general surgeons in the state employ is in stark contrast to that of executives in other sectors. While South African business executives enjoyed living standards over 60% higher than their UK counterparts, general surgeons lagged behind comparable UK living standards by 30%. Differentials of this type obviously provide a strong inducement to doctors to emigrate. Comparative data for Australia indicated that relative living standards of both commercial sector executives and general surgeons were lower than in South Africa. This may, however, be attributed largely to flatter commercial sector wage structures. Also remember that greater use is made of regional incentive allowances, for example, in Australia.
The basic salary increases awarded to doctors employed in the state sector trailed both all sector averages and the rates of inflation. The increases in the total package were an improvement. However, the total package comparison is somewhat misleading in that it includes the benefit of adjustments in allowances such as overtime, which are only made occasionally, and the adjustments do not form part of the pensionable portion of the remuneration.
In summary, therefore, remuneration of general surgeons in state employ lagged behind their non-medical professionals in state employ, colleagues in the private sector, and general surgeons overseas.
REFERENCES
1. Marschall JG, Karimuddin AA. Decline in popularity of general surgery as a career choice in North America. World J Surg 2003; 27: 249-252.
2. Podnos YD, Campbell B, Wilson SE, et al. Patterns of graduating medical student career selections from 1997 to 1998 and their effect on surgery as a career choice. Arch Surg 1999; 134: 876-880.
3. Cofer JB, Biderman MD, Lewis PL, et al. Is the quality of surgical residency applicants deteriorating? Am J Surg 2001; 181: 44-49.
4. Schwartz RW, Simpson WG, Strodel WE, et al. Career change: in quest of a controllable lifestyle. J Surg Res 1989; 47: 189-192.
5. Woodworth PA, Chang FC, Helmer SD. Debt and other influences on career choices among surgical and primary care residents in a community-based hospital system. Am J Surg 2000; 180: 570-575.
6. Erzurum VZ, Obermeyer RJ, Fecher A, et al. What influences medical students’ choice of surgical careers. Surgery 2000; 128: 253-256.
7. Fakhry SM, Watts DD. What’s a trauma surgeon worth? A survey of the Eastern Association for the Surgery of Trauma. J Trauma 2000; 49: 833-838.
artiCleS
SAJS Vol 44, no. 3, aUGUSt 2006
general surgery-comparatively lo107 107 7/25/06 4:10:09 PM
Appendix 4.

108
Interest in general surgery as a career option has diminished worldwide in recent years.1-3 Similar trends have been noted in South Africa. The Association of Surgeons of South Africa (ASSA) has been particularly concerned about the decreasing number of applicants for registrar posts at the various medical schools, as well as the increasing number of vacant specialist posts in the state sector. Several factors could account for this trend. These include poor working conditions in the state sector as well as poor remuneration levels both in the state and private sectors.
In May 2004 ASSA took a decision to initiate a study to determine the extent of the problem. ASSA engaged P-E Corporate Services (P-ECS) to undertake a comparative
study into the working conditions, including factors that impact on the choice of general surgery as a career option, and remuneration of general surgeons in South Africa. The primary objective of the study was to collect and analyse comparative data that would enable ASSA to evaluate the relative equity of the working conditions and remuneration of general surgeons in South Africa. Relative equity in this context referred particularly to comparison with other fields of medical specialisation, but also included a comparison extended to other professions in general.
The study also included an assessment of the reasons why general surgeons chose medicine as a career option, why they decided to specialise in general surgery thereafter, their per-ceptions about the status of general surgery, and the various factors that impact on surgery as a career.
The findings from these studies would be used to develop strategies to correct the current inequities in working conditions and remuneration, and to enhance the attractiveness of general surgery as a profession to potential candidates.
In this study we present the factors that could either positively or adversely influence the choice of a career in general surgery.
MethodsASSA requested P-ECS to report on the work environment, conditions of service and remuneration for general surgeons in the state sector. In particular, attention was to be focused on the nature of the work done, the hours worked and the responsibility of specialists and registrars in training in the academic and non-academic centres. In addition the impact on and the quality of family life was to be assessed and compared with colleagues in other disciplines such as cardiology, orthopaedics, dermatology, ophthalmology and anaesthetics. The remuneration of general surgeons was also compared with those of other professions such as judges, advocates, accountants, engineers and actuaries. Furthermore, the remuneration of general gurgeons was compared with those in the UK, Australia, Canada and New Zealand, taking into account inflation, cost of living index and other relevant factors.
General surgery in crisis – factors that impact on a career in general surgeryD. Kahn, Ch.M., F.C.S. (S.a.)
S. Pillay, F.C.S. (S.a.)
M. G. Veller, F.C.S. (S.a.), M.MeD
e. Panieri, F.C.S. (S.a), M.MeD.
M. J. r. WeStCott, B.SC. (CheM. enG.), M.B.l.
association of Surgeons of South africa and Departments of Surgery, Universities of Cape town and the Witwatersrand
General SurgerySAJS
Summaryintroduction. the association of Surgeons of South africa (aSSa), because of a concern about the decline in the number of applicants for registrar posts, undertook this study into the various factors that may influence the choice of surgery as career option.
Methods. the study involved a combination of desk research and structured interviews with heads of departments, specialists, and registrars in general surgery.
results. the reasons for choosing general surgery as a career included the immediately visible results of a surgeon’s efforts and the practical and intellectual challenge of the specialty. General surgery continued to enjoy a high status in society. the greater focus on primary health care has affected facilities at tertiary and secondary institutions. General surgeons worked excessively long hours, which was associated with increased levels of stress and placed severe strains on family life. all respondents felt that their levels of remuneration were ‘poor’ in relation to other disciplines and professions.
Conclusion. In this study we identified various factors that impacted either positively or negatively on the choice of general surgery as a career option.
Vol 44, no. 3, aUGUSt 2006 SAJS
general surgery-factors that imp108 108 7/25/06 4:09:27 PM
Appendix 4.

SAJS
109
The study involved a combination of:1. Desk research, which included a
review of relevant data in professional medical publications, other studies, the Internet, and P-ECS’s own extensive database of remuneration levels and employment policies across most sectors of the South African economy.
2. Structured interviews and focus group sessions with general surgeons, including heads of departments, specialists, registrars, and other medical specialists, as well as professionals in other fields such as law, accounting, engineering, etc.
3. Brief visits to international destinations that typically attract South African doctors, such as the UK, Australia, Canada, and New Zealand.
A total of 77 interviews with heads of depar tments, special ists and registrars were carried out in Gauteng, the Western Cape, the Free State, and KwaZulu-Natal. A structured questionnaire was developed to research the perceptions of recently qualified specialists and registrars about their choice of general surgery as a career option, and about the current state of the profession in general.
Perceptions of recently qualified specialists regarding general surgery as a career option The opinions and perceptions of recently qualified specialists from both the state and private sectors regarding the choice of general surgery as a career option were researched. This was done using a structured questionnaire and supplemented by a follow-up phone call. Although the interview sample was relatively small (10 specialists, 6 of whom completed the detailed questionnaire), we believed that the responses provided a representative set of opinions. The responses received were in line with expectations and consistent with other interview findings.
The surgeons were asked about the reasons for choosing medicine as a profession, and in particular why they chose general surgery as a specialty. They were also asked about their perceptions of the status of doctors and specialists in South Africa and abroad, and whether the status has changed over the past 10 years. Further questions related to the
reasons why many doctors choose to emigrate, respondents’ perceptions of the selection process for university and the standards of training, and working conditions, remuneration and lifestyle issues.
Results
The decision to study medicine
Most respondents s tated that their decision to choose a career in medicine was a clear-cut one, based on an ‘overwhelming desire to become a doctor’ and a genuine ‘love for the profession’. Half of the respondents had actively considered alternative careers, with engineering, chemistry, and even architecture and music rating consideration. Few doctors had considered careers in business. Reasons stated for choosing medicine included: (i) the intellectual challenge, status and standing of the medical profession; (ii) a desire to work with people; (iii) the wide range of options available to one after completing a medical degree; and (iv) the potential security and fulfillment of ‘working for oneself ’.
Many doctors interviewed felt that they would have been highly dissatisfied ‘working in an office’, i.e. in a business environment.
The decision to specialise in general surgery
The reasons stated for choosing general surgery as a career included: (i) the results of a surgeon’s efforts were almost immediately visible and thus rewarding and satisfying to a surgeon; (ii) it was an extremely challenging specialty requiring comprehensive medical knowledge, immediate decision making, and considerable practical ability; it thus allowed a medical professional to ‘strive for perfection’; and (iii) it provided an opportunity to ‘work with your hands’ – a specific skill requirement but also a source of satisfaction to most surgeons.
In some cases surgeons had experienced some initial uncertainties about their choice of this specialty. All, however, were now pleased that they had made the decision to specialise in surgery. The reasons given ranged from finding other specialties ‘too narrow’ to ‘the time taken to see the results of your efforts’.
artiCleS
SAJS Vol 44, no. 3, aUGUSt 2006
general surgery-factors that imp109 109 7/25/06 4:09:30 PM
Appendix 4.

SAJS
110
artiCleS
Perceptions about the status of general surgeryHalf of the respondents believed that medical professionals continued to enjoy high levels of status in society. The collective view was that this status was earned primarily as a result of the intellectual standing of doctors rather than as a result of high incomes earned.
There was uncertainty about the relative status of general practitioners versus that of specialists. Some doctors believed that the public, particularly the more affluent, had less respect for general practitioners, and preferred to be treated by specialists. Others believed that there was little differentiation. One respondent expressed a view that general surgeons were not regarded as ‘true’ specialists in contrast to, for example, orthopaedic surgeons.
Half of the respondents believed that the status of doctors and specialists had declined significantly over the past 5 - 10 years. This decline was attributed to: (i) an erosion of public confidence and trust in the profession catalysed in particular by both the more litigious environment in which we live today, and the fact that the public were not disposed towards accepting any form of medical failure; (ii) the fact that the remuneration earned by medical professionals had declined considerably in recent years, in relative terms, in comparison with that earned by business executives and those employed in other non-medical professions; (iii) the poor image of the public health sector that had developed during the past 10 years (‘the government-run health system is in shambles’); and (iv) the fact that doctors themselves had not been proactive in promoting the status of the profession or in challenging government regulations that had been imposed on the profession, where relevant.
Working environmentThere was constant reference to the impact of the structural changes that have been made to the administration and delivery of medical services in South Africa. Government has placed stronger focus on primary health care and ‘family medicine’ with the primary objective of making affordable health care available to all South Africans. Implementation of this strategy has, however, had a variety of consequences, many of which have led to a deterioration in the quality of available medical facilities, services and standards.
To give effect to the policy of focusing on primary health care, significant government and provincial funding has been re-channelled from tertiary to secondary health care institutions. Facilities at most secondary institutions, however, remained very basic. In addition, such institutions suffered severe shortages of adequately trained and experienced practitioners. The lack of skills, experience, resources and capacity resulted in the institutions having little to offer to attract experienced medical practitioners. Young doctors allocated to these institutions were required to function with insufficient resources and without quality supervision at a key stage in their careers.
The problems noted above obviously impacted adversely on the training and skills development of young doctors. Registrars in general surgery were particularly vulnerable in this regard, given the fact that their work was particularly dependent on the use of hospital facilities and resources.
Factors noted by registrars as adversely impacting on their training and effectiveness included: (i) dirty, depressing and poorly resourced rest rooms, kitchens, sleeping quarters,
and offices, often lacking the most basic facilities; (ii) long working hours and sleep deprivation; (iii) unsympathetic and uninterested management; and (iv) lack of productivity tools such as cellphones and laptops, making it difficult to use ‘on call’ time effectively.
It should be noted that actual standards did vary from hospital to hospital. In addition, perceptions about the extent and seriousness of these problems also varied. For example, Groote Schuur Hospital was described by interviewees as ‘still a model training hospital’, and Universitas and Pretoria Academic hospitals as having excellent training standards.
The high work volumes and pressure under which registrars typically worked were also thought to have some real benefit – described as wide-ranging, ‘crash course’ experience gained at an early stage in one’s career. The Trauma Unit at Johannesburg General Hospital was one such example.
Working hours
Most of the professors in general surgery who were interviewed worked well in excess of the 40 ‘normal’ working hours required in terms of their employment contracts. Apart from their university commitments, they were ‘on call’ regularly, for which they were paid 16 hours of overtime. They also typically carried out 10 - 15 hours of private work, considered virtually essential to supplement the low levels of remuneration earned by state-employed medical professionals.
Registrars interviewed claimed to work between 80 and 100 hours per week. They were paid for only 56 hours based on the 40-hour normal working week and 16 hours of overtime. The situation was exacerbated by the fact that ‘on call’ arrangements often required long periods of continuous work. Examples were provided of registrars working continuously for 36 hours.
The tiredness and stress associated with the long working hours placed severe strains on family life at a time when many registrars would be establishing young families. It was also thought to be dangerous and risky when linked with trauma and the associated ‘life and death’ situations. There were also concerns about the possible risk of litigation.
Working hours were also considered to be excessive in relation to international practices. In the USA general surgeons currently work some 60 hours per week. In the UK estimates of average working hours ranged between 56 and 58 hours. However, the European Union regulations have introduced the European Work Time Directive, which prevents doctors from working more than 48 hours per week.
There was little doubt that long and irregular hours worked and the relationship between workload and reward had a material impact on the ability of the state to attract and retain general surgeons.
EmigrationRespondents were asked about work colleagues and associates and other medical professionals with whom they were acquainted, who had emigrated or who were considering emigrating. Respondents were asked to state what they thought the main reasons were for this decision.
Respondents were prompted with commonly cited reasons for emigrating, and the following responses were received:
1. Pay. There was a perception that the pay was better overseas, particularly in the state sector. However, doctors
Vol 44, no. 3, aUGUSt 2006 SAJS
general surgery-factors that imp110 110 7/25/06 4:09:31 PM
Appendix 4.

SAJS
111
were unsure about the impact of factors such as the exchange rates and the living costs.
2. Working hours. The opportunity to work a more ‘normal’ working week, i.e. less overtime as legislated in Europe, was seen as a big attraction at certain levels. However, it was recognised that this factor was situational.
3. Working conditions. Working conditions were generally perceived as being better, with ‘more access to state of the art medicine’, but not always so.
4. Career advancement opportunities. The opportunity to travel and gain international experience in the medical profession was seen as a plus, but opinions were divided on whether this benefited career advancement or not. Some respondents thought that South African conditions, i.e. the shortage of medical professionals, particularly in the state sector, the trauma load, etc. could provide unique opportunities for experience and career advancement.
5. Lifestyle issues. This factor was obviously influenced by personal perceptions and preferences. High crime levels and security fears were definite factors encouraging emigration. Educational standards were also of concern to certain people and groups. In contrast, the South African climate, standards of living and the lifestyle enjoyed by professionals were recognised as unique advantages of being South African. These were the reasons why many young doctors considered returning to South Africa.
6. Risk of HIV infection. The risk of HIV was another factor that could influence the decision to emigrate.
Training standardsInterviewees were asked to comment on issues such as selection of medical students for university admission, educat ional standards, and the requirement to do community service.
Half of the respondents believed that the current selection procedures were inappropriate, but offered little comment on how these should be changed or improved. Some thought that only academic criteria should be used, while others felt that ‘the choice of trainees based on marks obtained accounted for most of the problems within the profession today’.
Over 80% of the interviewees noted that the training methods and structures had changed, but necessarily so given South Africa’s history. A concern was expressed that South Africa had lost
many good teachers and mentors to private practice and through emigration. Young doctors were therefore forced to cope with problems for which they had not had sufficient training or experience. This was contributing to the erosion of public confidence and trust in the medical profession.
Over 80% of the interviewees felt that the 2 years of compulsory community service was not necessarily a deterrent to would-be doctors. It was noted that similar requirements existed in other parts of the world and had not adversely impacted on student application levels. However, there was a real concern about how the 2-year community service period was spent. Interviewees felt that the community service period should be designated differently and incorporated into the structured postgraduate training of newly qualified doctors. Some thought that community service for medical students was discriminatory since similar requirements did not exist in other professions.
Stress and its impact on lifestyleIt was difficult to develop a consistent set of views from respondents about the level of inherent stress in a general surgeon’s job and its impact on lifestyle issues. On the one hand there were obvious stresses associated with general surgery in that human lives were dependent on the skill of a surgeon. However, different individuals had different coping mechanisms, which allowed them to handle stress more easily, or less easily. It was clear that, as in the case of an airline pilot, a certain level of stress was an unavoidable component of every general surgeon’s daily work life. Work stress also resulted from the need to make complex decisions and from long working hours. However, working hours varied widely. Those interviewed experienced between 1 and 2, and between 5 and 10 call-outs per week.
Registrars often worked abnormally long hours. One respondent had noted that he had regularly worked 36-hour shifts as a surgical registrar. Another had noted that he had worked successive 12-hour night shifts for a week, every 9 - 10 weeks. This situation was contrasted with the position in Europe and the USA, where working hours had been regulated to reduce the risk of fatigue.
artiCleS
SAJS Vol 44, no. 3, aUGUSt 2006
general surgery-factors that imp111 111 7/25/06 4:09:31 PM
Appendix 4.

SAJS
112
artiCleS
All interviewees indicated that general surgeons had less control over working hours than was the case with other specialties.
The risk of legal action against general surgeons was not seen as a deterrent to prospective entrants to the profession.
RemunerationAll respondents had a common perception that their levels of remuneration were ‘poor’ in relation to other professions. The comparison was drawn with top business executives, who earned multiples of what surgeons earned, while surgeons were required to take what were perceived as equally complex and risky decisions. The fact that remuneration in the medical profession had not kept pace with increased pay levels in other professions was attributed as one of the factors causing the perceived decline in status of the medical profession in recent years.
The above concerns extended to perceptions about future earning potential as well, particularly in the state sector. All interviewees expressed reservations about their ability to provide for normal family commitments and comforts, i.e. housing in a good suburb, decent schooling and education for their children, in line with personal aspirations. Those in the state sector noted that the difficulty of surviving on a government salary would probably precipitate a future move into private practice.
DiscussionThe Association of Surgeons of South Africa has identified and was concerned about the decline in the number of applicants for registrar posts and the critical shortage of general surgeons in the state sector. ASSA commissioned P-ECS to undertake a comparative study into the remuneration and working conditions of general surgeons in South Africa, as well as an evaluation of the various factors that may impact on general surgery as a career option. The study involved desk research, structured interviews and focus group sessions with general surgeons.
Interviewees were asked about their reasons for choosing a career in medicine. The intellectual challenge and the standing and status of the medical profession, as well as a desire to work with people, were some reasons why doctors did medicine. Respondents chose a career in surgery because the results of the surgeon’s efforts were immediately visible, and it provided an opportunity to work with one’s hands. Surgery was also regarded as an extremely challenging specialty, requiring both theoretical knowledge and practical ability. All of the surgeons were pleased that they had made the decision to specialise in surgery.
The perception was that medical professionals continued to have high status in the community, and that this was related to their intellectual standing rather than a high income. However, many of the respondents believed that the status of doctors and specialists had declined in recent years, due to erosion of public confidence in the profession, the decline in the remuneration earned by medical professionals in
comparison with business executives, and the poor image of the public health sector.
It is well known and accepted that choice of a career in medicine requires a corresponding commitment to a lengthy period of study and practical training.4,5 The commitment is particularly onerous when a doctor goes on to qualify as a specialist. General surgeons are required to spend some 12 - 13 years undergoing various forms of training before they are able to begin to earn at levels comparable with other professionals and commercial sector executives. The career choice of medicine and general surgery is usually based on clear-cut desire to enter the profession. Medical students are therefore prepared to accept the lengthy training and qualification requirement in the knowledge that they will eventually qualify to do what they really want to do.
However, it would be naïve to assume that ‘lifestyle’ factors, such as work opportunities, conditions, compensation etc., do not also play a very significant part in influencing career choice decisions.6-8 In this regard opportunities for wealth accumulation play an obvious role. Young surgeons qualify to practise at a time when their professional peers are well advanced in their careers and are earning at highly competitive levels. Medical students are extremely ambitious and therefore likely to expect to earn competitively after qualification.
Unfortunately this is far from the case with state-employed specialists. The combination of low, uncompetitive levels of remuneration, coupled with long working hours and sub-standard facilities, provides an overwhelming disincentive for doctors and specialists, and general surgeons in particular, to remain in state employ. It is difficult to visualise any impact being made on current, critical shortages of skills in the state sector until at least some of these issues are addressed.
It is well known that a significant number of medical graduates choose to emigrate from South Africa. Reasons included the perceived better remuneration, more normal working hours, better working conditions, and better career advancement opportunities overseas. Lifestyle issues such as crime and educational standards were also factors. The impact of the HIV epidemic was also cited as a reason why doctors choose to emigrate.
REFERENCES
1. Marschall JG, Karimuddin AA. Decline in popularity of general surgery as a career choice in North America. World J Surg 2003; 27: 249-252.
2. Podnos YD, Campbell B, Wilson SE, et al. Patterns of graduating medical student career selections from 1997 to 1998 and their effect on surgery as a career choice. Arch Surg 1999; 134: 876-880.
3. Cofer JB, Biderman MD, Lewis PL, et al. Is the quality of surgical resi-dency applicants deteriorating? Am J Surg 2001; 181: 44-49.
4. Mayer KL, Perez RV, Ho HS. Factors affecting choice of surgical residency training programs. J Surg Res 2001; 98: 71-75.
5. Bergen PC, Turnage RH, Carrico CJ. Gender-related attrition in a general surgery training program. J Surg Res 1998; 77: 59-62.
6. Schwartz RW, Simpson WG, Strodel WE, et al. Career change: in quest of a controllable lifestyle. J Surg Res 1989; 47: 189-192.
7. Erzurum VZ, Obermeyer RJ, Fecher A, et al. What influences medical students’ choice of surgical careers. Surgery 2000; 128: 253-256.
8. Fakhry SM, Watts DD. What’s a trauma surgeon worth? A survey of the Eastern Association for the Surgery of Trauma. J Trauma 2000; 49: 833-838.
Vol 44, no. 3, aUGUSt 2006 SAJS
general surgery-factors that imp112 112 7/25/06 4:09:32 PM
Appendix 4.