proposed burnaby mountain gondola transit...
TRANSCRIPT
)
Proposed Burnaby Mountain Gondola Transit Project
Initial Feasibility StudyBy Bryce Tupper, P.EngApril 22, 2009
Prop
ose
d Bu
rna
by M
ou
nta
in G
on
do
la Tra
nsit Pro
jec
t Initial Feasibility Study By Bryc
e Tu
pp
er, P.En
g. A
pril 22, 2009
univercity.ca
BURNABY MOUNTAIN GONDOLA TRANSIT FEASIBILITY STUDY I
EXECUTIVE SUMMARY
Introduction
Simon Fraser University Community Trust (SFUCT) initiated and funded this report to assess the feasibility of an aerial passenger ropeway (gondola) transit system for Burnaby Mountain. The study considers whether such a system could connect the Millennium SkyTrain with the SFU Transit Loop to reduce the demand for the majority of bus transit serving the mountain and to reduce travel time for the students of SFU and residents of UniverCity. This report evaluates all relevant components of a passenger ropeway on Burnaby Mountain, from ridership and technical requirements to environmental, safety, social and economic considerations.
A Snapshot of Transit on Burnaby Mountain
Coast Mountain Bus Company (CMBC) a subsidiary of TransLink, the regional transportation authority for Metro Vancouver, serves Burnaby Mountain with four main routes carrying over 4 million person trips annually. Bus route 145, the main transit conduit for Burnaby Mountain, links the SFU Transit loop to the Production Way-University SkyTrain station on the Millennium Line and carries over half of the transit commuters to and from the mountain at 11,799 daily trips. Serviced with 10 buses leaving at frequent intervals during peak hours, route 145 has a travel time of 14 minutes, not including headway (loading/unloading time).
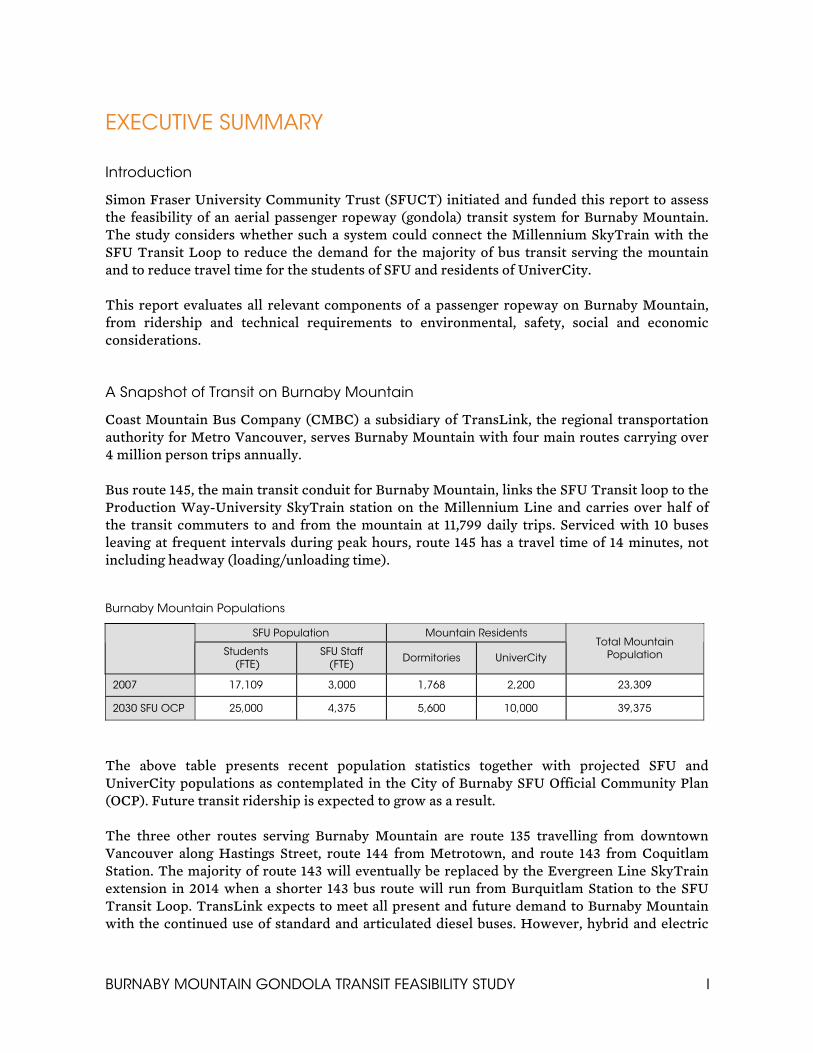
Burnaby Mountain Populations
SFU Population Mountain Residents
Students
(FTE) SFU Staff
(FTE) Dormitories UniverCity Total Mountain
Population
2007 17,109 3,000 1,768 2,200 23,309
2030 SFU OCP 25,000 4,375 5,600 10,000 39,375
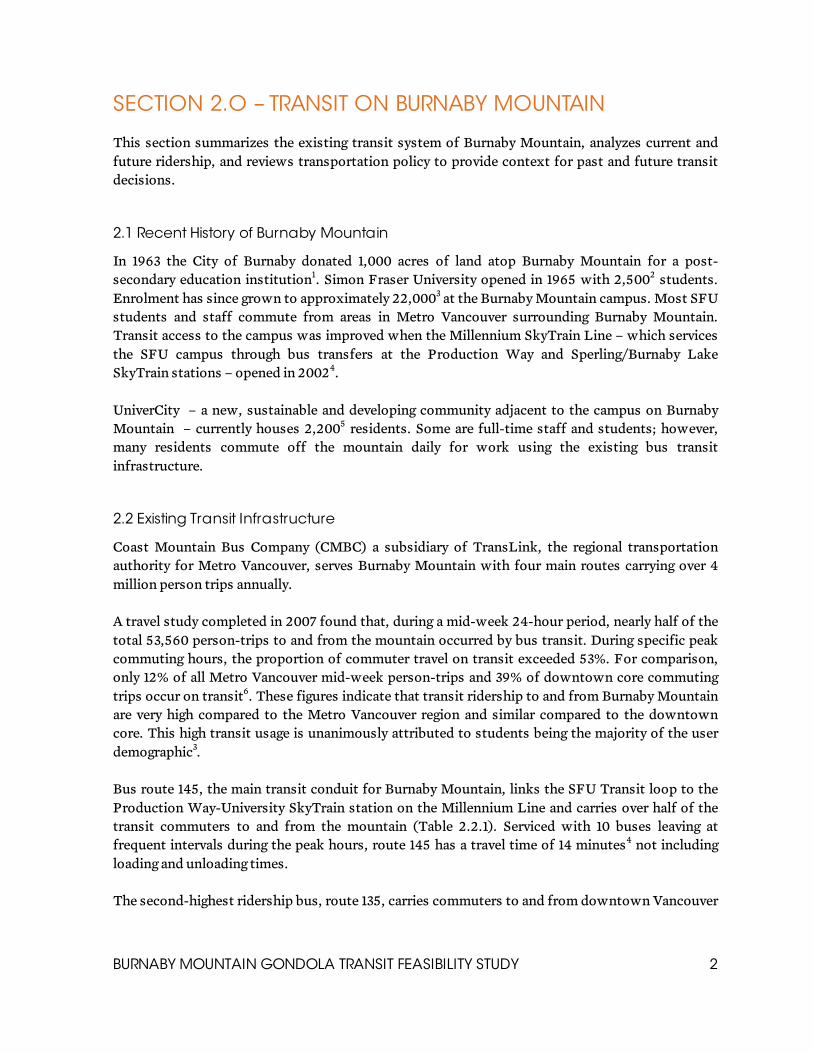
The above table presents recent population statistics together with projected SFU and UniverCity populations as contemplated in the City of Burnaby SFU Official Community Plan (OCP). Future transit ridership is expected to grow as a result. The three other routes serving Burnaby Mountain are route 135 travelling from downtown Vancouver along Hastings Street, route 144 from Metrotown, and route 143 from Coquitlam Station. The majority of route 143 will eventually be replaced by the Evergreen Line SkyTrain extension in 2014 when a shorter 143 bus route will run from Burquitlam Station to the SFU Transit Loop. TransLink expects to meet all present and future demand to Burnaby Mountain with the continued use of standard and articulated diesel buses. However, hybrid and electric

BURNABY MOUNTAIN GONDOLA TRANSIT FEASIBILITY STUDY II
trolley buses planned for other service areas in Metro Vancouver are not appropriate for the steep grades of Burnaby Mountain.
A Primer on Aerial Passenger Ropeway Transit
The term “aerial passenger ropeway” encompasses all technologies that transport people in carriages along cables that are suspended from towers. One of the earliest urban examples of such a system is the Roosevelt Island Tram located in New York City and constructed in 1976. More recently, an existing mass transit network in Medellin, Colombia was fully integrated with gondolas in a very densely populated area of the city, and the Portland Aerial Tram opened in 2007, demonstrating that aerial passenger ropeway technology is a feasible and flexible option when considering transit solutions. Aerial passenger ropeway technologies include chairlifts, gondolas and trams. For technical reasons, only gondolas are considered in the scope of this report. A gondola is a ropeway with numerous closed cabins spaced frequently along the cable spans, as opposed to a tram that has only two large cabins. Monocable, bicable, tricable and funitels are the main categories of gondola. With varying costs, passenger capacities, tower spacings and performances in windy conditions, among other things, these different gondola technologies provide a range of solutions for transit applications. Doppelmayr/Garaventa and Leitner-Poma are the two major manufacturers of aerial ropeway technology and have installed thousands of lifts of varied types around the world. Headquartered in Austria and France respectively, both companies have major offices and affiliates in Canada and the US.
Gondola Transit on Burnaby Mountain: Location is Key
Through preliminary planning and consultation with SFUCT, a number of alignments were contemplated for Burnaby Mountain. A gondola position following a 2.65 km straight alignment from Production Way-University SkyTrain Station to Town Square adjacent to the Transit Loop on the SFU campus was determined as a satisfactory “Case Study Gondola Alignment” to be studied in more detail. With the operation of a gondola in this location, it has been determined that the service of two of the four bus routes to Burnaby Mountain can be significantly reduced (#143 and #145), one shortened (#144) and one maintained (#135). A site visit and subsequent assessments of the site findings concluded that the tricable (3S) gondola technology provides the best combination of technical solutions for this application. Interference and constraints with existing infrastructure, a desire to limit disturbance in select green space, as well as a need to have excellent reliability in high winds were among the main technical considerations.

BURNABY MOUNTAIN GONDOLA TRANSIT FEASIBILITY STUDY III
Gondola Ridership Benefits: Shorter Wait and Travel Times
Analyses of ridership volumes indicate that at current ridership levels, the peak hourly demand for the gondola is 2,089 people per hour (pph). At minimum, this demand is expected to increase to 2,681 pph and at maximum to 3,762 pph (each figure is possible by the OPC horizon of 2030). It is suggested that an initial gondola capacity of 2,000 pph be provided with an option to increase capacity to 2,800 pph at a later date by adding additional cabins. The travel time from Production Way to the Transit Loop is estimated at 6 minutes. Together with the maximum projected wait time of 6 minutes during peak travel times, the overall gondola travel time would be less when compared to the 14 minutes (exclusive of waiting and loading times) travel time of the current bus route 145.
Case Study Terminal Locations
The Case Study Bottom Terminal location connects the gondola directly to the newly constructed bus loop at Production Way-University Station. Possibilities for a number of Bottom Terminal locations are feasible; however, a direct connection to the station would maintain a single fare paid zone and integrate well with the SkyTrain transit system The Case Study Top Terminal building is situated directly below Town Square adjacent to the existing SFU Transit Loop. A terminal station in this location would deliver gondola transit riders to the same vicinity of the current bus transit hub. With a location between the commercial space of the Cornerstone Building to the east and the campus to the west, this is an appropriate location to serve both the student population as well as the growing population of UniverCity.
Case Study Tower Locations and Spans
The Case Study gondola would likely consist of five towers carrying the 2.65 km gondola length. Ascending the mountain from Production Way Station, the cable would span to the first and second towers, crossing a number of roads and buildings that are all located on land used for industrial purposes. Between the second and third tower, the gondola alignment crosses over a ravine between two townhouse developments and then over or adjacent to residential townhouse structures. The fourth segment of the gondola, including towers 3 and 4, is located entirely in the Burnaby Mountain Conservation Area. The fifth and sixth spans of the gondola travel over SFU land planned for future residential and institutional development. SFU Community Trust is committed to a comprehensive program of stakeholder meetings and public consultation prior to any decision regarding the potential Burnaby Mountain Gondola Transit Project. Beyond conventional government permits required for the planning and construction, a number of rights-of-way, land-use entitlements, and likely land acquisitions are required from private land owners. Detailed due diligence is required for the gondola project to proceed.
BURNABY MOUNTAIN GONDOLA TRANSIT FEASIBILITY STUDY IV
Assessment of Gondola Transit on Burnaby Mountain
Policy Three main policy considerations are in play when contemplating gondola transit on Burnaby Mountain: transport and land use, reducing reliance on the automobile, and transportation hierarchy. First, a gondola on Burnaby Mountain can readily meet the anticipated demand for transit to and from SFU with comfort and convenience, making the gondola option a legitimate and attractive alternative to current modes of transit. Second, gondola service to and from Burnaby Mountain compares favourably to private automobiles and is consistent with policy to reduce reliance on the latter. Third, since public transit is preferred within the transportation hierarchy, the salient characteristics of a gondola lend it credence within the range of available transit technologies. Taking all three points into consideration, the policy analysis in this report demonstrates that a gondola should be supported in transportation planning, funding and infrastructure decisions.
Safety: As Good As It Gets
Over 10,000 aerial passenger ropeways have been built worldwide with an estimated 3.9 billion passengers transported annually. Gondolas, trams and chairlifts are considered to be a safe and secure technology for the transportation of people. Travellers are 20,000 times more likely to be involved in fatal accident in a car than they are in a gondola. In the unlikely event of a lift breakdown, an evacuation and rescue program specific to a Burnaby Mountain gondola would need to be in place. Though no such rescue has ever been required with a 3S gondola, teams train and practice regularly for such an occurrence. The North Shore Rescue (NSR) mountain search and rescue team based in Vancouver is the ideal type of organization for such a responsibility.
Security: Adopting the Proper Communication System
Only larger aerial trams have cabin operators and, as a result, there may be a perception that unmanned, automated gondola cabins have a greater security risk. To mitigate these concerns, other automated mass transit systems such as SkyTrain in Vancouver have voice intercoms and silent alarm strips in each car to notify attendants about security and/or health emergencies. Video surveillance may also be used to reduce perceived security risks in certain situations. In addition, gondola passengers may feel secure in the knowledge that operators are stationed in the terminal buildings.
BURNABY MOUNTAIN GONDOLA TRANSIT FEASIBILITY STUDY V
Performance: Adaptable to a Variety of Needs
An important element of transit performance is accessibility. Gondola cabins can be outfitted with flip seating to accommodate wheelchairs, strollers and bikes. The loading/unloading of the gondolas is also facilitated through very low speeds in the terminal buildings and a level threshold with no step. If required, the lift can also be stopped temporarily for loading or unloading. A gondola on Burnaby Mountain would operate on average 20.5 hours a day to match the SkyTrain operation hours. As a result, available times for maintenance operations are minimal. In the event of major maintenance activity, the gondola can be reduced to limited weekend hours to allow the completion of more time-intensive tasks. The tram in Portland operates very similarly and deems the small windows of time adequate for all necessary maintenance.
Environment: Meeting Climate Change Concerns and Mitigating Impacts
Climate change has taken hold as the pre-eminent global environmental issue of this generation, a fact reflected by dire predictions of dramatic environmental change with inevitable social and economic ramifications. Responding to this issue in February 2008, the BC government published the Climate Action Plan, which illustrates BC’s commitment to reduce greenhouse gas (GHG) emissions across the province by 33% by the year 2020. The transportation industry is expected to provide 15% of these total reductions, with much of the reduction expected from transit systems. A gondola on Burnaby Mountain is projected to reduce GHG emission by 1,870 tonnes per year with the reduction of over 50,000 hours of bus operation. Given that a gondola is operated with hydro power, the GHG emissions of the gondola will be less than 1 tonne per year. With the projected increase in transit ridership, it is possible for these GHG savings to double by the time SFU and UniverCity realize full growth.
Social Benefits and Possible Concerns
A gondola on Burnaby Mountain will affect both the transit riders and the communities surrounding the lift in primarily positive ways. For the transit rider, there are a number of social benefits to commuting in a gondola. Views and increased comfort along with reduced headway and travel time all contribute to an enjoyable experience. In fact, it is expected that these elements will likely account for additional mode shift and increased ridership. In addition, the gondola experience supports tourism and contributes to a growing recreation culture such as mountain biking, hiking and visiting the SFU campus. In concert, they offer great potential to capture a significant recreational ridership. Possible concerns from residents of homes under and adjacent to the gondola may include: noise, fear of falling objects, privacy, aesthetics and property value reduction. Residents are likely to be reassured by the quiet operation of a gondola and the ability to use screens in the cabin windows. Views of the townhouse complexes from the gondola will be possible; however, at approximately 30 metres above the buildings, there should be no close sightlines into residences. To mitigate aesthetic concerns, the gondola cabins and tower colours can be chosen appropriately and tower designs may be modified for a more pleasing appearance.
BURNABY MOUNTAIN GONDOLA TRANSIT FEASIBILITY STUDY VI
Financial Outlook
The major cost component of constructing a 3S gondola resides with the lift manufacturer at $38.2M. Beyond this scope, the construction of the terminal buildings, purchase of land and other related costs account for another $30.7M, bringing the total estimated capital cost of a 3S gondola on Burnaby Mountain to $68.9M. Five main costs constitute the operation budget of the gondola: energy, salaries, maintenance, insurance and capital reserve. With the gondola operating with the same schedule of the SkyTrain, BC Hydro commercial rates are expected to be approximately $405,000 per year. Four full-time employees, at $50 per hour, expected to staff the gondola terminals during the 20.5 hours of daily operation will cost approximately $1.5M per year in salary expenses. Maintenance is projected to be $85 per hour, yielding an annual cost of $636,000. For the purpose of this analysis, a $200,000 insurance cost has been included in the estimated yearly operating cost. It is estimated that over a 25-year period $10M will be required for the replacement or improvements of major gondola components, yielding a requirement for a 4% capital reserve accrual or $400,000 annually. In all, the total operation expenditures for a gondola on Burnaby Mountain are estimated at approximately $3.14M per year.
Cash Flow Analysis: Immediate Savings
To assess the economic feasibility of a gondola serving Burnaby Mountain, it is necessary to compare future cash flows of the existing bus transit with a potential new gondola. In both cases, the cash flow begins accruing costs in 2012, which assumes the gondola will be constructed in 2011. Various growth rates tied to historical trends, were applied to the different components of the operational budget (i.e., labour, maintenance, energy). The benchmark analysis indicates that with an escalating interest rate loan, the gondola option will have less annual costs than the bus option consistently from the first year of operation. Over a 30 year amortization period, the gondola shows a savings of $171M, or $54M in 2011 Net Present Value terms. Another possible economical impact that is not factored into this analysis is the positive effects on the revenue stream due to increased ridership. There are a number of social and community impacts that could increase ridership and revenue. There are also indirect savings from reduction in road maintenance that are not included in the cash flow analysis. In both cases, these effects would reduce the breakeven horizon.
Three Recommendations
First, a comprehensive community and stakeholder consultation should be undertaken prior to any decision regarding the proposed Burnaby Mountain Gondola Transit Project. Should the Project go ahead, further consultation should seek input from the community and stakeholders regarding the design and construction of the gondola. This consultation would be undertaken in addition to requirements for various approval processes. Second, engage an architect and planner to specifically study solutions for the Bottom Terminal. A Bottom Terminal adjacent to the Production Way SkyTrain Station may impede functions around the station. Further study could provide alternative solutions to solve functional issues
BURNABY MOUNTAIN GONDOLA TRANSIT FEASIBILITY STUDY VII
related to the terminal location. Lastly, lift manufacturers should be consulted regarding detailed technical requirements and potential financial arrangements. Further assessment of the technical aspects could provide more information about the cost assumptions and lead to a better understanding of the financial impacts. Discussions regarding Private-Public Partnership agreements would also provide a deeper understanding of the procurement and financing options.
BURNABY MOUNTAIN GONDOLA TRANSIT FEASIBILITY STUDY
TABLE OF CONTENTS
SECTION 1.0 – INTRODUCTION .....................................................................................................1 1.1 Purpose of the Feasability Study for Gondola Transit on Burnaby Mountain ............................. 1 1.2 Report Scope and Limitations .................................................................................................. 1
SECTION 2.O – TRANSIT ON BURNABY MOUNTAIN......................................................................2 2.1 Recent History of Burnaby Mountain .......................................................................................2 2.2 Existing Transit Infrastructure................................................................................................2 2.3 Future Transit Infrastructure................................................................................................... 3 2.4 Policy Review ..........................................................................................................................4
SECTION 3.0 – ASSESSMENT OF AERIAL PASSENGER ROPEWAY TRANSIT.................................7 3.1 Aerial Passenger Ropeway History and Case Studies ................................................................. 7 3.2 Aerial Passenger Ropeways in a Technical Context ..................................................................13 3.2.1 Lift Technology....................................................................................................................13 3.2.2 Aerial Passenger Ropeway Economics................................................................................. 16 3.2.3 Environmental Impact of Aerial Passenger Ropeways ...........................................................17 3.2.4 Aerial Passenger Ropeway Safety and Performance ..............................................................17 3.2.5 Aerial Passenger Ropeway Social Impact ............................................................................. 18
SECTION 4.0 – TECHNICAL EVALUATON OF PROPOSED GONDOLA TRANSIT
ON BURNABY MOUNTAIN.............................................................................................................20 4.1 Case Study Gondola Alignment...............................................................................................20 4.1.1 Ridership.............................................................................................................................20 4.1.2 Gondola Technology for Burnaby Mountain ........................................................................ 23 4.1.3 Case Study Terminal Locations............................................................................................24 4.1.4 Case Study Tower Locations and Alignment Sections ..........................................................25 4.2 Alternative Gondola Alignments ............................................................................................ 28
SECTION 5.0 – IMPACTS OF GONDOLA TRANSIT ON BURNABY MOUNTAIN...........................29 5.1 Policy Analysis .......................................................................................................................29 5.2 Land Use Partnerships and Approvals.....................................................................................31 5.3 Environmental Considerations for Gondola Transit on Burnaby Mountain............................. 32 5.3.1 Direct Physical Environmental Impacts ............................................................................... 32 5.3.2 Greenhouse Gas Emissions Comparison............................................................................. 33 5.4 Safety and Performance of Gondola Transit on Burnaby Mountain......................................... 34 5.5 Social Impacts of the Case Study Gondola Transit Alignment on Burnaby Mountain............... 34
SECTION 6.0 – FINANCIAL CONSIDERATION OF GONDOLA TRANSIT ON BURNABY
MOUNTAIN....................................................................................................................................37 6.1 Case Study Gondola Alignment Costs ..................................................................................... 37 6.2 Gondola/Bus Financial Comparison...................................................................................... 41 6.3 Public-Private Arrangements ................................................................................................. 47

BURNABY MOUNTAIN GONDOLA TRANSIT FEASIBILITY STUDY
SECTION 7.0 – CONCLUSIONS....................................................................................................48 7.1 Triple Bottom Line Assessment..............................................................................................48 7.2 Recommendations .................................................................................................................49 7.3 Schedule ................................................................................................................................49
REFERENCES
APPENDCIES
Appendix A Ridership Analysis ACKNOWLEDGEMENTS LIST OF FIGURES
Figure 2.4.1 Transportation Mode Hierarchy Figure 3.1.1 Whirlpool Aero Car, Niagara Falls, Ontario Figure 3.1.2 Roosevelt Island Tram, New York, NY Figure 3.1.3 Metrocable Gondola, Medellin, Colombia
Figure 3.1.4 Portland Aerial Tram, Portland, Oregon Figure 3.1.5 Telegondola, Piatra Neamt, Romania Figure 3.2.1 Gondola Tower Comparison Figure 4.0 Burnaby Mountain Study Area Figure 4.1.1 Burnaby Mountain Gondola Alignments Figure 4.1.5 Proposed Top Terminal Case Study Gondola Alignment Figure A-1 2007 Distribution of Inbound Transit Commuters Figure A-2 Metro Vancouver Temporal Distribution Transit Model LIST OF TABLES
Table 2.2.1 Current Transit Servicing SFU/Burnaby Mountain Table 2.3.1 Burnaby Mountain Populations Table 2.4.1 Policy Review Sources Table 3.1.1 Urban Aerial Ropeway Comparison Table 3.2.1 Gondola Comparison Table 6.1.1 Doppelmayr/Garaventa Budget Price Table 6.1.2 Estimated Gondola Capital Cost Table 6.2.1 Gondola Cash Flow Analysis Table 6.2.2 Bus Transit Cash Flow Savings Analysis Table 6.2.3 Sensitivity Analysis – Gondola Breakeven Horizon (Years) Table A-1 Inbound Commuter Projections Table A-2 Outbound Commuter Projections Table A-3 Minimum and Maximum Ridership Projections Table A-4 Peak Hour Ridership Projections
BURNABY MOUNTAIN GONDOLA TRANSIT FEASIBILITY STUDY 1
SECTION 1.0 – INTRODUCTION
1.1 Purpose of the Feasibility Study for Gondola Transit on Burnaby Mountain
This report was initiated and funded by Simon Fraser University Community Trust (SFUCT) to assess the feasibility of an aerial passenger ropeway (gondola) transit system for Burnaby Mountain. Specifically, the report considers whether such a system could connect the Millennium SkyTrain with the SFU Transit Loop, reducing the demand for the majority of bus transit serving the mountain, as well as reducing travel time for residents and students. SFUCT believes that gondola transit could deliver significant benefits to both the population of SFU and the residential community of UniverCity adjacent to the university on Burnaby Mountain. This report evaluates all relevant components of a passenger ropeway on Burnaby Mountain, from ridership and technical requirements to social, environmental and economic considerations.
1.2 Report Scope and Limitations
The study will: Review current and expected future demand for transit to and from Burnaby Mountain.
Review relevant policy documents. Provide practical examples of aerial passenger ropeway transit systems worldwide and
evaluate the available technologies for aerial passenger ropeways. Evaluate and report various options for aerial ropeway technologies serving Burnaby
Mountain. Identify and describe a Case Study Gondola Alignment and its technical requirements.
Analyze a gondola system based on existing transportation policy. Present environmental, land use and social considerations specific to a Case Study Gondola Alignment.
Estimate costs to construct and operate a gondola on Burnaby Mountain. Compare these costs with projected bus transit costs and comment on options for financing.
Provide conclusions and recommendations including a triple bottom line assessment and comments on schedule.
This report relies on:
Ridership, vehicle and population data provided by SFU Planning and Facilities Department, SFUCT and TransLink.
Information from TransLink regarding future transit planning associated with the Evergreen Line SkyTrain extension.
A lift technology assessment as provided by Doppelmayr/Garaventa, aerial ropeway lift manufacturers.
BURNABY MOUNTAIN GONDOLA TRANSIT FEASIBILITY STUDY 2
SECTION 2.O – TRANSIT ON BURNABY MOUNTAIN
This section summarizes the existing transit system of Burnaby Mountain, analyzes current and future ridership, and reviews transportation policy to provide context for past and future transit decisions.
2.1 Recent History of Burnaby Mountain
In 1963 the City of Burnaby donated 1,000 acres of land atop Burnaby Mountain for a post-secondary education institution1. Simon Fraser University opened in 1965 with 2,5002 students. Enrolment has since grown to approximately 22,0003 at the Burnaby Mountain campus. Most SFU students and staff commute from areas in Metro Vancouver surrounding Burnaby Mountain. Transit access to the campus was improved when the Millennium SkyTrain Line – which services the SFU campus through bus transfers at the Production Way and Sperling/Burnaby Lake SkyTrain stations – opened in 20024. UniverCity – a new, sustainable and developing community adjacent to the campus on Burnaby Mountain – currently houses 2,2005 residents. Some are full-time staff and students; however, many residents commute off the mountain daily for work using the existing bus transit infrastructure.
2.2 Existing Transit Infrastructure
Coast Mountain Bus Company (CMBC) a subsidiary of TransLink, the regional transportation authority for Metro Vancouver, serves Burnaby Mountain with four main routes carrying over 4 million person trips annually. A travel study completed in 2007 found that, during a mid-week 24-hour period, nearly half of the total 53,560 person-trips to and from the mountain occurred by bus transit. During specific peak commuting hours, the proportion of commuter travel on transit exceeded 53%. For comparison, only 12% of all Metro Vancouver mid-week person-trips and 39% of downtown core commuting trips occur on transit6. These figures indicate that transit ridership to and from Burnaby Mountain are very high compared to the Metro Vancouver region and similar compared to the downtown core. This high transit usage is unanimously attributed to students being the majority of the user demographic3. Bus route 145, the main transit conduit for Burnaby Mountain, links the SFU Transit loop to the Production Way-University SkyTrain station on the Millennium Line and carries over half of the transit commuters to and from the mountain (Table 2.2.1). Serviced with 10 buses leaving at frequent intervals during the peak hours, route 145 has a travel time of 14 minutes4 not including loading and unloading times. The second-highest ridership bus, route 135, carries commuters to and from downtown Vancouver

BURNABY MOUNTAIN GONDOLA TRANSIT FEASIBILITY STUDY 3
along Hastings Street. This route requires over twice as many buses as route 145 at peak hours due to the much longer travel time from downtown, even though ridership to SFU is half that of route 145. Table 2.2.1: Current Transit Servicing SFU/Burnaby Mountain
Bus Route Origin: To/From SFU Transit Loop Ridership Share7
Daily Ridership
Current Bus Allocation8
135 Burrard Station (along Hastings Street) 27% 6126 22
143 Coquitlam Station 12% 2723 6
144 Metrotown Station 9% 2042 10
145 Production Way SkyTrain Station 52% 11799 10
Bus route 144 from Metrotown travels to the Sperling-Burnaby Lake SkyTrain Station on the Millennium Line in 26 minutes and continues on to the SFU Transit Loop in an additional 19 minutes4. The low passenger loads of route 144, with less than one-tenth of the total ridership to and from Burnaby Mountain, can be explained by the fact that the commuting time from Metrotown to Production Way via SkyTrain and then by bus to the SFU Transit loop is a shorter duration. As a result, the route 144 ridership is likely limited to passengers accessing mid-route on a block-to-block basis away from a SkyTrain station. Route 143 from Coquitlam Station is the only direct transit service to and from Burnaby Mountain for the Tri-cities region (Coquitlam, Port Coquitlam and Port Moody). This route, a 35-minute4 bus trip at peak times, will eventually be replaced by the Evergreen Line extension, and a transfer to a new 143 bus route from Burquitlam Station to the SFU Transit Loop9. The Evergreen Line will connect Coquitlam Station to the existing SkyTrain network at Lougheed Station in 2014.
2.3 Future Transit Infrastructure
Existing ridership data indicates that there is significant transit use on Burnaby Mountain. This demand is expected to grow as both the SFU population and the UniverCity population increase. Table 2.3.1 shows recent population statistics together with projected SFU and UniverCity capacity populations as contemplated in the City of Burnaby SFU Official Community Plan (OCP). It is estimated that the University staff population increases proportionately to the student population. As shown below, the mountain population is expected to almost double from the 2007 values to the current OCP capacity. The specific effects to transit ridership cannot be understood by simple examination, given that there are significant land use changes with the population growths (specific effects are analyzed and predicted in Section 4). Nonetheless, transit ridership can generally be expected to grow and remain integral to Burnaby Mountain. Currently, TransLink is
BURNABY MOUNTAIN GONDOLA TRANSIT FEASIBILITY STUDY 4
expected to meet this future demand with the continued use of standard and articulated diesel buses. Hybrid and electric trolley buses are planned for other service areas in Metro Vancouver but are not appropriate for the steep and consistent grades of the mountain9. Table 2.3.1: Burnaby Mountain Populations
SFU Population Mountain Residents
Students (FTE)
SFU Staff (FTE)
Dormitories UniverCity
Total Mountain Population
2007 17,109 3,000 1,768 2,200 23,309
2030 SFU OCP 25,000 4,375 5,600 10,000 39,375
2.4 Policy Review
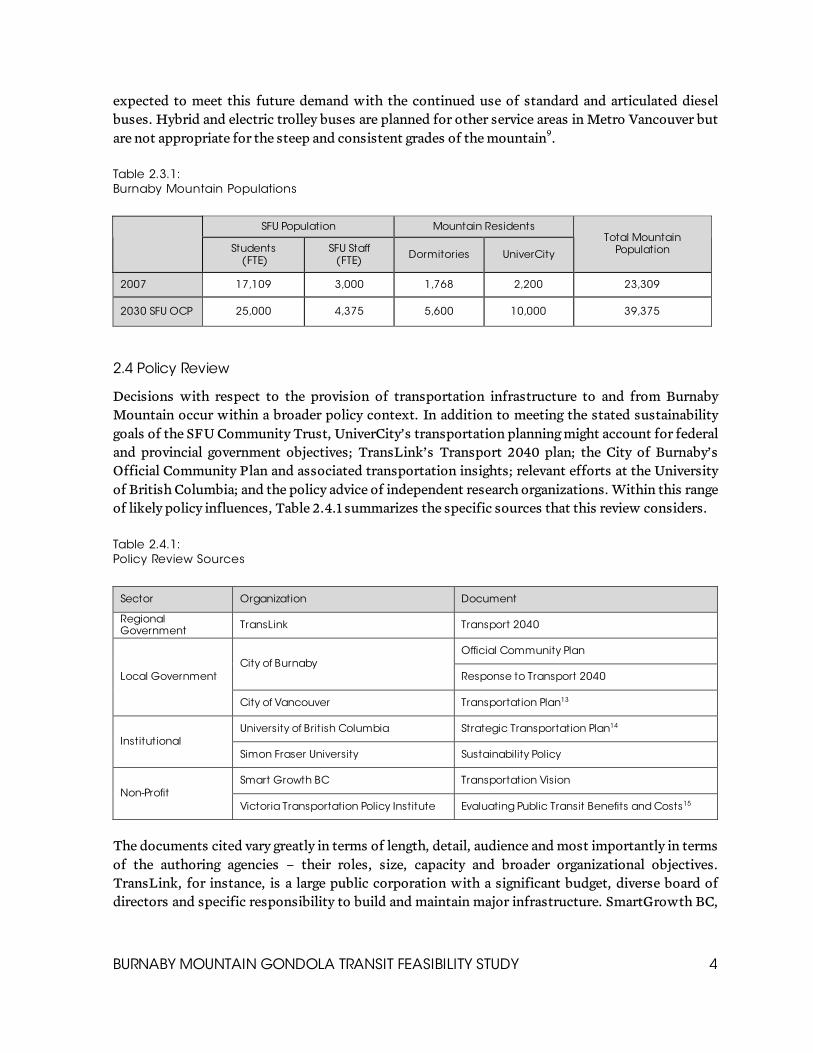
Decisions with respect to the provision of transportation infrastructure to and from Burnaby Mountain occur within a broader policy context. In addition to meeting the stated sustainability goals of the SFU Community Trust, UniverCity’s transportation planning might account for federal and provincial government objectives; TransLink’s Transport 2040 plan; the City of Burnaby’s Official Community Plan and associated transportation insights; relevant efforts at the University of British Columbia; and the policy advice of independent research organizations. Within this range of likely policy influences, Table 2.4.1 summarizes the specific sources that this review considers. Table 2.4.1: Policy Review Sources
Sector Organization Document
Regional Government
TransLink Transport 2040
Official Community Plan City of Burnaby
Response to Transport 2040 Local Government
City of Vancouver Transportation Plan13
University of British Columbia Strategic Transportation Plan14 Institutional
Simon Fraser University Sustainability Policy
Smart Growth BC Transportation Vision Non-Profit
Victoria Transportation Policy Institute Evaluating Public Transit Benefits and Costs15
The documents cited vary greatly in terms of length, detail, audience and most importantly in terms of the authoring agencies – their roles, size, capacity and broader organizational objectives. TransLink, for instance, is a large public corporation with a significant budget, diverse board of directors and specific responsibility to build and maintain major infrastructure. SmartGrowth BC,

BURNABY MOUNTAIN GONDOLA TRANSIT FEASIBILITY STUDY 5
on the other hand, is a small, independent non-profit organization engaged in a range of research, policy and outreach activities related to land use planning. Notwithstanding the diversity in these sources, their suggestions for transportation planning and policy are remarkably consistent. The three key themes that emerge are: connecting transportation to land use, reducing reliance on private automobiles, and supporting the transportation hierarchy. Connecting Transportation to Compact Land Use The efficient provision of public transportation infrastructure is possible only by adopting compact land use. Compact settlements include a diversity of residential, commercial, industrial, recreational and other uses within close proximity to one another. Proximity of diverse uses allows people to access many of their daily needs (shopping, work, recreation) by walking or cycling, thereby reducing the need for costly road and transit infrastructure. When longer distance travel is necessary, compact communities make public transportation a viable option by increasing demand. When potential passengers are concentrated within smaller geographic areas, transit service can be more frequent, convenient and comfortable. When transit exhibits these characteristics, ridership increases and economies of scale allow reinvestment to ensure continued provision of effective and attractive public transportation. Reducing Reliance on Private Automobiles Driven by mounting concerns about the environmental impacts of automobile use, such as reliance on fossil fuels linked to declining global oil reserves and vehicle emissions affecting air quality and climate, contemporary policy makers tend to discourage reliance on private automobiles for local and regional mobility. The automobile industry requires significant raw material and energy inputs, and generates solid, liquid and gaseous waste that in many cases is toxic and difficult to reuse or recycle. Cars are also economically dubious. For individuals, cars are expensive to purchase, own and maintain; for communities, the roads and parking areas required by motor vehicles are costly to build and maintain, and consume valuable land that might otherwise be available for houses, factories, shops, farms, forests or wetlands. These environmental and economic characteristics also make cars a poor choice from a social equity perspective. Communities (and economies) built for private automobiles do not accommodate young, elderly, poor and disabled citizens. Supporting the New Transportation Hierarchy In light of the first two themes described above, the policy documents under review for this study suggest, either implicitly or explicitly, a hierarchy to guide transportation planning, funding and infrastructure.

BURNABY MOUNTAIN GONDOLA TRANSIT FEASIBILITY STUDY 6
Figure 2.4.1 Transportation Mode Hierarchy
This hierarchy prioritizes inexpensive and environmentally benign modes of transport. The hierarchy’s role in policy is significant not only for establishing priority modes, but also for guiding public decisions (particularly funding decisions). Any review of transportation policy suggests that investment is required to support the hierarchy. This truism does not require more money to be spent on bike paths than buses, but it does imply that support for modes lower on the hierarchy should not come at the expense of the higher priorities.
WALKING / WHEELCHAIR
CYCLING
PUBLIC TRANSIT
COMMERCIAL VEHICLES
CARPOOL
PRIVATE AUTOMOBILES
BURNABY MOUNTAIN GONDOLA TRANSIT FEASIBILITY STUDY 7
SECTION 3.0 – ASSESSMENT OF AERIAL PASSENGER ROPEWAY TRANSIT
This section provides the historical background and examples of aerial passenger ropeways in urban settings along with impacts of such transit and a description of available technologies.
3.1 Aerial Passenger Ropeway History and Case Studies
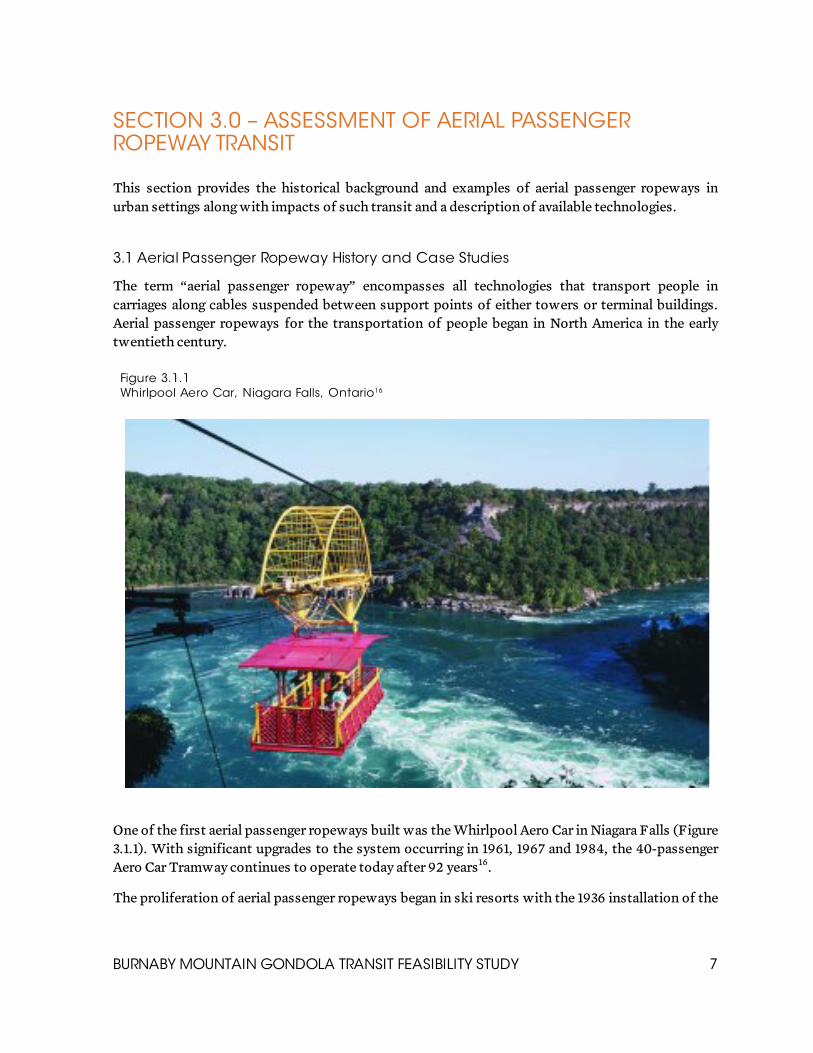
The term “aerial passenger ropeway” encompasses all technologies that transport people in carriages along cables suspended between support points of either towers or terminal buildings. Aerial passenger ropeways for the transportation of people began in North America in the early twentieth century.
Figure 3.1.1 Whirlpool Aero Car, Niagara Falls, Ontario16
One of the first aerial passenger ropeways built was the Whirlpool Aero Car in Niagara Falls (Figure 3.1.1). With significant upgrades to the system occurring in 1961, 1967 and 1984, the 40-passenger Aero Car Tramway continues to operate today after 92 years16. The proliferation of aerial passenger ropeways began in ski resorts with the 1936 installation of the
BURNABY MOUNTAIN GONDOLA TRANSIT FEASIBILITY STUDY 8
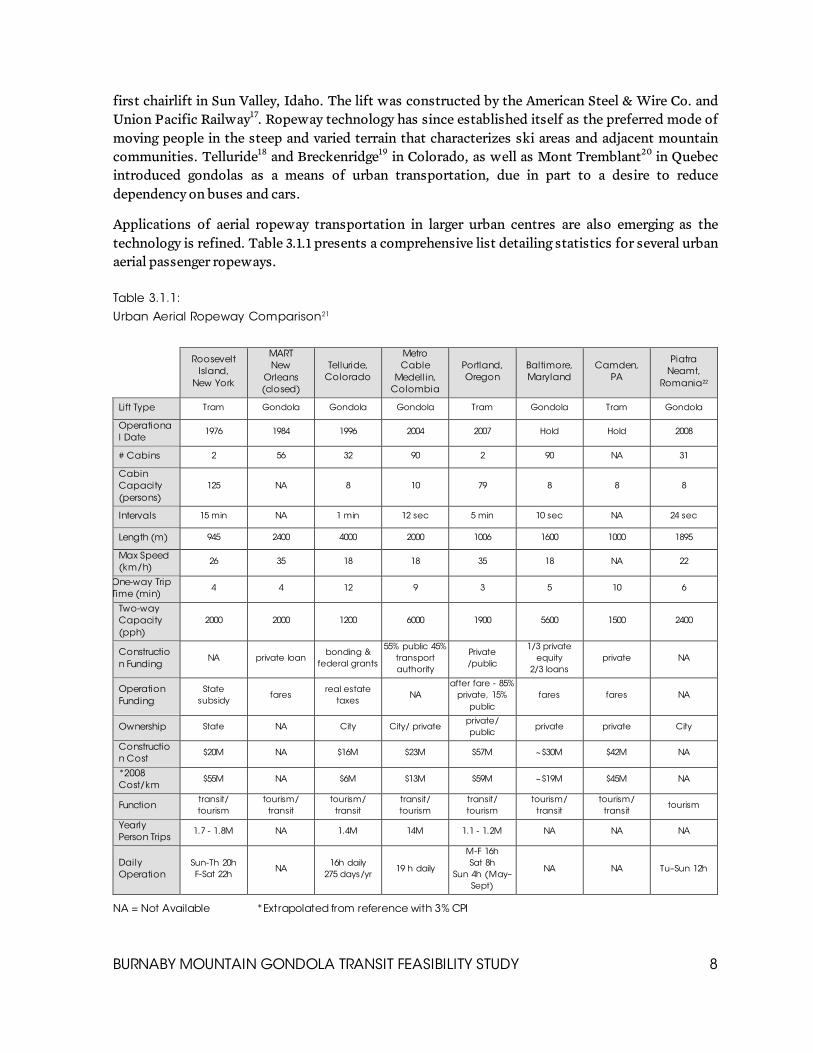
first chairlift in Sun Valley, Idaho. The lift was constructed by the American Steel & Wire Co. and Union Pacific Railway17. Ropeway technology has since established itself as the preferred mode of moving people in the steep and varied terrain that characterizes ski areas and adjacent mountain communities. Telluride18 and Breckenridge19 in Colorado, as well as Mont Tremblant20 in Quebec introduced gondolas as a means of urban transportation, due in part to a desire to reduce dependency on buses and cars. Applications of aerial ropeway transportation in larger urban centres are also emerging as the technology is refined. Table 3.1.1 presents a comprehensive list detailing statistics for several urban aerial passenger ropeways. Table 3.1.1:
Urban Aerial Ropeway Comparison21
Roosevelt
Island,
New York
MART
New
Orleans
(closed)
Telluride,
Colorado
Metro
Cable
Medellin,
Colombia
Portland,
Oregon
Baltimore,
Maryland
Camden,
PA
Piatra
Neamt,
Romania22
Lift Type Tram Gondola Gondola Gondola Tram Gondola Tram Gondola
Operationa
l Date 1976 1984 1996 2004 2007 Hold Hold 2008
# Cabins 2 56 32 90 2 90 NA 31
Cabin
Capacity
(persons)
125 NA 8 10 79 8 8 8
Intervals 15 min NA 1 min 12 sec 5 min 10 sec NA 24 sec
Length (m) 945 2400 4000 2000 1006 1600 1000 1895
Max Speed
(km/h) 26 35 18 18 35 18 NA 22
One-way Trip
Time (min) 4 4 12 9 3 5 10 6
Two-way
Capacity
(pph)
2000 2000 1200 6000 1900 5600 1500 2400
Constructio
n Funding NA private loan
bonding &
federal grants
55% public 45%
transport
authority
Private
/public
1/3 private
equity
2/3 loans
private NA
Operation
Funding
State
subsidy fares
real estate
taxes NA
after fare - 85%
private, 15%
public
fares fares NA
Ownership State NA City City/ private private/
public private private City
Constructio
n Cost $20M NA $16M $23M $57M ~$30M $42M NA
*2008
Cost/km $55M NA $6M $13M $59M ~$19M $45M NA
Function transit/
tourism
tourism/
transit
tourism/
transit
transit/
tourism
transit/
tourism
tourism/
transit
tourism/
transit tourism
Yearly
Person Trips 1.7 - 1.8M NA 1.4M 14M 1.1 - 1.2M NA NA NA
Daily
Operation
Sun-Th 20h
F-Sat 22h NA
16h daily
275 days/yr 19 h daily
M-F 16h
Sat 8h
Sun 4h (May–
Sept)
NA NA Tu–Sun 12h
NA = Not Available *Extrapolated from reference with 3% CPI
BURNABY MOUNTAIN GONDOLA TRANSIT FEASIBILITY STUDY 9
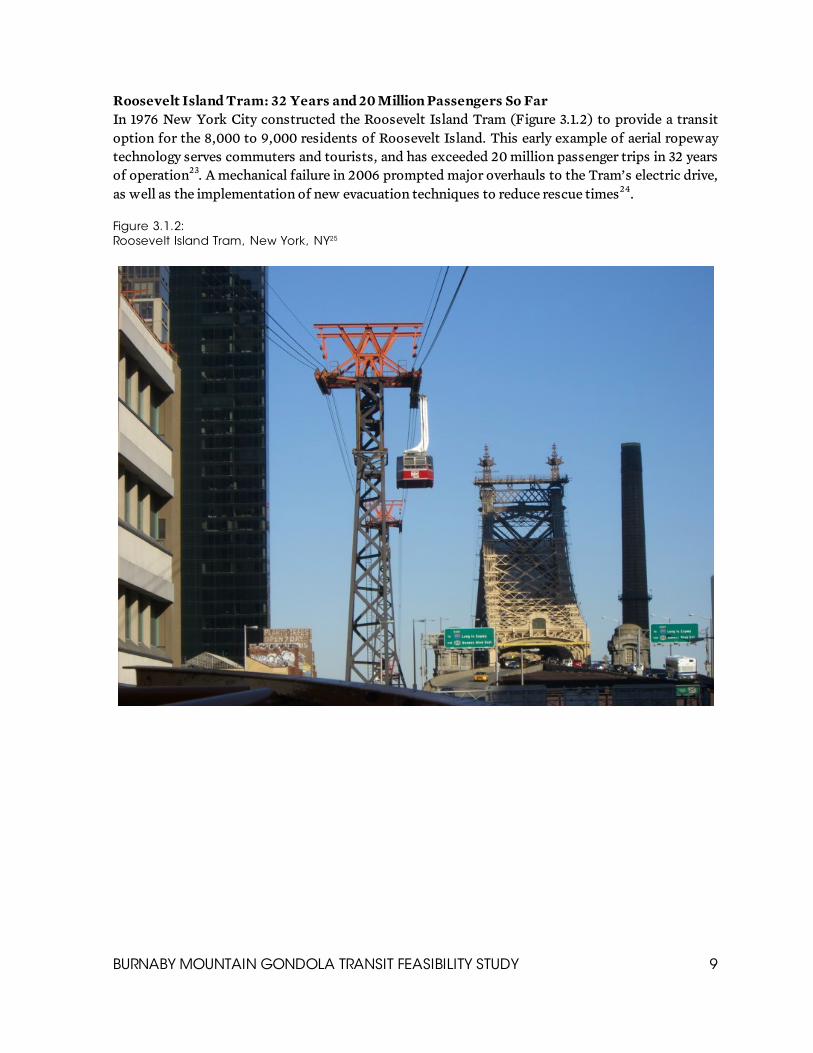
Roosevelt Island Tram: 32 Years and 20 Million Passengers So Far In 1976 New York City constructed the Roosevelt Island Tram (Figure 3.1.2) to provide a transit option for the 8,000 to 9,000 residents of Roosevelt Island. This early example of aerial ropeway technology serves commuters and tourists, and has exceeded 20 million passenger trips in 32 years of operation23. A mechanical failure in 2006 prompted major overhauls to the Tram’s electric drive, as well as the implementation of new evacuation techniques to reduce rescue times24. Figure 3.1.2: Roosevelt Island Tram, New York, NY25
BURNABY MOUNTAIN GONDOLA TRANSIT FEASIBILITY STUDY 10
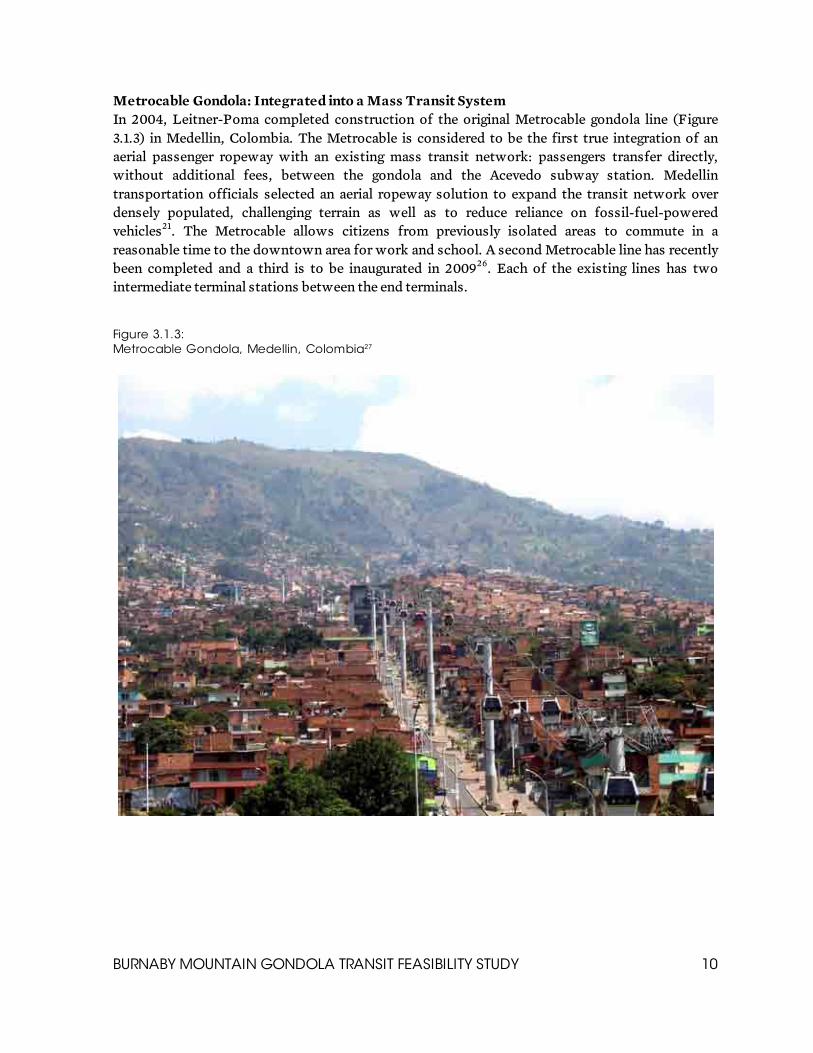
Metrocable Gondola: Integrated into a Mass Transit System In 2004, Leitner-Poma completed construction of the original Metrocable gondola line (Figure 3.1.3) in Medellin, Colombia. The Metrocable is considered to be the first true integration of an aerial passenger ropeway with an existing mass transit network: passengers transfer directly, without additional fees, between the gondola and the Acevedo subway station. Medellin transportation officials selected an aerial ropeway solution to expand the transit network over densely populated, challenging terrain as well as to reduce reliance on fossil-fuel-powered vehicles21. The Metrocable allows citizens from previously isolated areas to commute in a reasonable time to the downtown area for work and school. A second Metrocable line has recently been completed and a third is to be inaugurated in 200926. Each of the existing lines has two intermediate terminal stations between the end terminals. Figure 3.1.3: Metrocable Gondola, Medellin, Colombia27

BURNABY MOUNTAIN GONDOLA TRANSIT FEASIBILITY STUDY 11
Portland Aerial Tram: Innovation with Minimal Impact The Portland Aerial Tram (Figure 3.1.4) opened in 2007, linking the Marquam Hill campus of the Oregon Health and Science University (OHSU) to the South Waterfront lands of Portland. This Tram will also allow future residents of the South Waterfront to commute via aerial transit to Marquam Hill in a direct and efficient manner. The 1-kilometre Tram line, constructed by Doppelmayr/Garaventa, spans two major highways and rises above the Lair Hill neighbourhood supported by one intermediate tower between the terminals28. The Portland example illustrates the flexibility of aerial trams with dealing with physical encumbrances along an alignment. Figure 3.1.4: Portland Aerial Tram, Portland, Oregon29
BURNABY MOUNTAIN GONDOLA TRANSIT FEASIBILITY STUDY 12
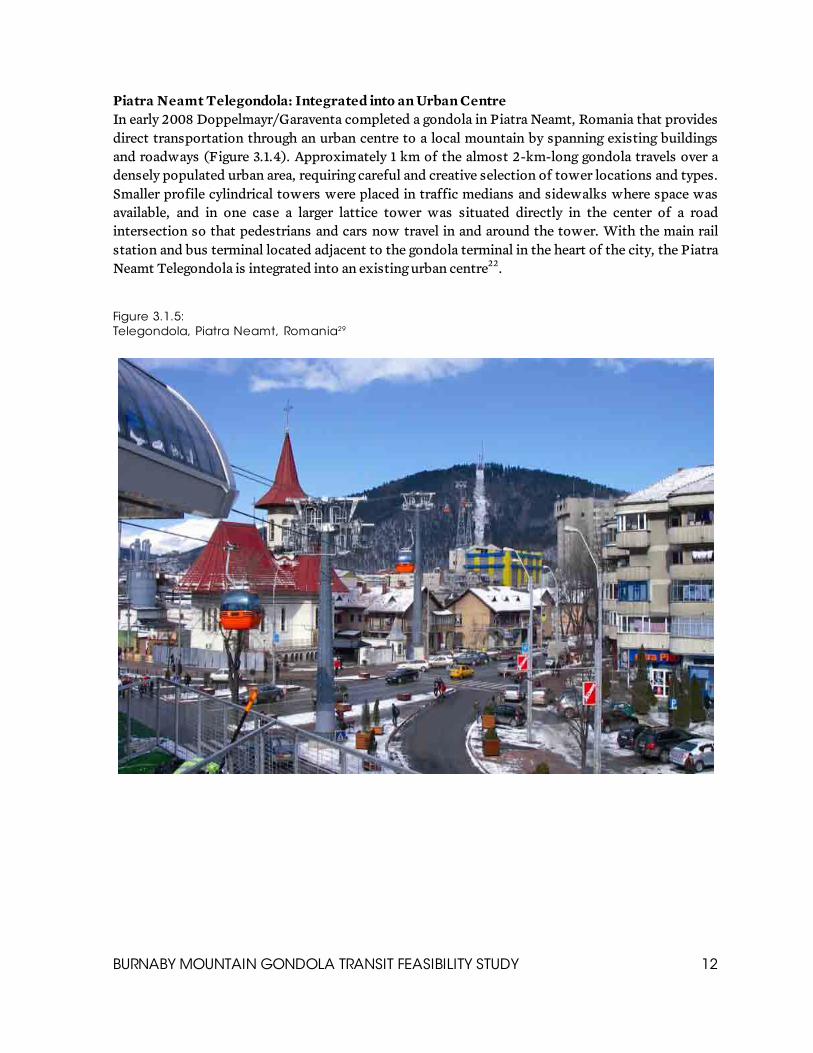
Piatra Neamt Telegondola: Integrated into an Urban Centre In early 2008 Doppelmayr/Garaventa completed a gondola in Piatra Neamt, Romania that provides direct transportation through an urban centre to a local mountain by spanning existing buildings and roadways (Figure 3.1.4). Approximately 1 km of the almost 2-km-long gondola travels over a densely populated urban area, requiring careful and creative selection of tower locations and types. Smaller profile cylindrical towers were placed in traffic medians and sidewalks where space was available, and in one case a larger lattice tower was situated directly in the center of a road intersection so that pedestrians and cars now travel in and around the tower. With the main rail station and bus terminal located adjacent to the gondola terminal in the heart of the city, the Piatra Neamt Telegondola is integrated into an existing urban centre22. Figure 3.1.5: Telegondola, Piatra Neamt, Romania29

BURNABY MOUNTAIN GONDOLA TRANSIT FEASIBILITY STUDY 13
3.2 Aerial Passenger Ropeways in a Technical Context
This section describes the technical components of aerial passenger ropeways, providing context for a discussion on specific solutions for a Burnaby Mountain lift. The lift technology scope is limited to gondolas given that aerial trams like Portland and Roosevelt Island have limited capacity and are not applicable for this report. Environmental, safety and social considerations for aerial passenger ropeways are also addressed.
3.2.1 Lift Technology
Doppelmayr/Garaventa and Leitner-Poma are the two major manufacturers of aerial ropeway technology. These two companies have installed thousands of lifts of varied types around the world. With headquarters in Austria and France respectively, both companies also have major offices and affiliates in Canada and the United States30. A gondola is defined as a lift with numerous closed cabins spaced frequently along the cable spans. This technology allows continuous loading and unloading, and thus can achieve a much higher overall capacity than other aerial ropeway systems. Each cabin can carry 4 to 30 people. With detachable lift technology, the speed of the gondola cabins moving through the terminal is reduced while the cabins along the spans continue to move quickly31. As it enters a terminal, the cabin’s support arms unclamp from the circulating cable, and reconnect once passengers are on board. Thus, the gondola’s high speed and capacity does not compromise comfortable loading and unloading. Current ropeway technology does not allow for gondolas to change direction at towers or anywhere in the mid-span of an alignment. If change of direction is desired, a mid-station terminal building along with all applicable machinery is required, effectively creating two gondolas connected together. Following is a summary of the available gondola technology:
Monocable Gondolas32: Monocable gondolas, the first generation of gondola systems, are aptly named because the cabins are supported and transported by a single cable running constantly in a circular pattern between terminals. The cabin support arm hangs from this single rope, which functions as both a track rope (supports vertical weight load) and a haul rope (supports horizontal pulling load). Monocable lifts have strict limitations on spans between towers due to the dual purpose of the cable. Because it supports the entire vertical weight of the cabins, only a limited tension (horizontal load) can be applied to the cable. As a result, the towers of monocable lifts are typically 100 to 300 metres apart, with some exceptions in particular loading cases. A benefit of frequent tower spacing is a relatively small tower footprint (0.6 m to 1.5 m diameter). Monocable gondola cabins carry 4 to 15 people, for a total maximum capacity of approximately 3,600 passengers per hour (pph).
BURNABY MOUNTAIN GONDOLA TRANSIT FEASIBILITY STUDY 14
A further limitation of monocables is their stability in wind. The single cable support typically loses reasonable stability and ability to properly operate in crosswinds of 60 km/h. Bi/Tricable (2S/3S) Gondolas31: The 2S and 3S gondolas combine monocable and tram technology. Bicable gondolas use one track rope and one haul rope for each direction travelled, while 3S refers to lifts with two track ropes and one haul rope in each direction. The track ropes are static, spanning from one terminal station, on top of intermediate towers, to another terminal station. The haul rope pulls the cabins along these track ropes with a carriage (system of rollers) connected at the top of the cabin supporting arm. The track ropes support only the vertical weight of the cabins, and the haul rope only the horizontal pulling. The heavy tensioning of the track ropes, and the distribution of vertical and horizontal loads to separate cables allow for longer spans and fewer towers for 2S and 3S lifts. With these greater spans come higher loads on the towers, resulting in much larger tower footprints. In the case of the towers for a 3S lift, single base cylindrical towers are replaced by lattice tower structures with four supports and a footprint base dimension of 25 by 25 metres. Cabins using the 2S system carry up to 15 people, for a maximum system capacity of approximately 3,500 pph. The larger 3S cabins that carry up to 35 passengers allow for a total system capacity of 6,000 pph to 8,000 pph. With careful and slower than normal operation speed, the 2S and 3S gondolas can operate with reasonable passenger comfort in winds of approximately 80 km/h and 110 km/h, respectively. Although a number of successful 2S projects have been completed by both Doppelmayr/Garaventa and Leitner-Poma, only Doppelmayr/Garaventa has completed gondolas using the 3S technology. There are currently only five 3S gondolas in the world; Whistler Blackcomb’s Peak 2 Peak Gondola, which opened in December 2008, is the most ambitious. Funitel Gondolas31,33: Funitel ropeways consist of a two-cable system in each direction, which both perform the function of the track rope and haul rope. The parallel cables are spaced wide at approximately 3.2 m apart, creating the need for two support arms on either side of the gondola cabins. The sharing of the vertical support loads and horizontal tensioning load between two cables allows for relatively large tower spacing when compared to a monocable gondola. The towers, in turn, are also slightly larger in profile, accounting for the larger loads implied by the larger spans. The Funitel cabins carry 24 passengers, resulting in a maximum lift capacity of 4,000 pph. One of the main benefits of the Funitel gondola is its exceptional stability in high wind conditions. With the two support cables spaced far apart, the resulting gondola system provides relative comfort in winds over 110 km/hour.

BURNABY MOUNTAIN GONDOLA TRANSIT FEASIBILITY STUDY 15
Gondola Lift Comparison: Table 3.2.1 compares key statistics of the various gondola technologies. All data is approximate and varies with site conditions and application of each lift. Table 3.2.1: Gondola Comparison31
Funitel Tricable (3S) Bicable (2S) Monocable32
Maximum Capacity (pph)
4,000 6,000+ 3,500 3,600
Cabin Capacity (passengers)
24 35 15 4 to 15
Maximum Wind Speed (km/h)
110 110 80 60
Lift Speed (km/h)
26 27 27 21
Tower Spacing (m)
500 to 1,000 3,000 (400m sag)
1500 100 to 300
Tower Type/ Maximum Size32
Steel Cylinder 2 to 3 m diam.
Steel Lattice 25 m square
Steel Cylinder 2 to 3 m diam.
Steel Cylinder 0.6 to 1.5 m diam.
Figure 3.2.1: Gondola Tower Comparison31
Funitel Tricable (3S) Bicable (2S)
BURNABY MOUNTAIN GONDOLA TRANSIT FEASIBILITY STUDY 16
3.2.2 Aerial Passenger Ropeway Economics
Site-Specific But Compelling Compared to SkyTrain
The construction costs of aerial ropeway systems vary widely. Key variables include ridership capacities, intermediate terminal requirements, wind loads and, of course, site characteristics. In urban applications, land use issues may also have highly variable effects on cost. Table 3.1.1 provides a rough cost per kilometre estimate, in 2008 dollars, for a number of aerial passenger ropeways. The Telluride and Metrocable gondolas cost $6M and $13M per kilometre, respectively. This cost difference was likely due to the greater capacity of the Metrocable and the many physical encumbrances to be overcome in the construction of towers and terminals. Furthermore, the Telluride Mountain Village Owners Association also invested an additional $6M in 2007 for upgrades34. The Baltimore Gondola, a similar monocable application with two intermediate stations, is projected to cost $19M/km. Again, variation in costs likely resides with specific technical challenges or encumbrances along the alignment. Costing between $45M and $59M per kilometre, the aerial trams from Figure 3.1.1 would perform much better in high winds then the monocables, but would have less maximum capacity at 2,000 pph or less. These Tram systems span distances of approximately 1 km, in some cases over rivers, with only two towers, or in Portland’s case, only one tower. The higher unit cost per kilometre of the tram is likely due to the typically shorter total span of the systems (i.e., the high costs of the terminal buildings are distributed over a smaller length). In Portland’s case, the use of a single tower further increased the cost because of a need to reinforce the upper terminal and a desire to improve the aesthetics of the single tower. Local Example at Whistler Mountain In many ways, the 2S and 3S gondolas are considered to be a hybrid of conventional monocable gondolas and aerial tram systems and this may also be an appropriate statement when considering their cost. An example is the Peak 2 Peak 3S Gondola in Whistler, BC. This installation, with two terminal stations and a total span of 4.4 km, will cost over $51M or $12M/km35. With a 3 km free-span between towers, this unit cost is likely low if applied to an urban setting where intermediate terminal stations would possibly be required. Adding two or three intermediate stations along the 4.4-km-long span would increase the unit cost to $24M/km to $36M/km, somewhere in-between a monocable and aerial tram system. SkyTrain Costs In conclusion, all assumptions taken in the economical assessment of these aerial ropeways are highly variable and any cost estimates should be dependent on specific site conditions and required performances. Nonetheless, with estimated SkyTrain construction costs of $100M/km, $125M/km and $230M/km for the Evergreen Line, Canada Line and Broadway Corridor Line36, respectively, the cost magnitudes of aerial passenger ropeways are compelling enough to consider.

BURNABY MOUNTAIN GONDOLA TRANSIT FEASIBILITY STUDY 17
Operation and maintenance costs for aerial ropeways also vary, mostly due to operation duration and capacities. For reference, the annual operating budget for the systems listed in Table 3.1.1 ranges from $1.5M to $3.5M34.
3.2.3 Environmental Impact of Aerial Passenger Ropeways
Minimal and Benign
Aerial passenger ropeways can have minimal environmental impacts to the surrounding ecology because of their isolated tower locations. A gondola’s greatest potential impacts are can typically be associated with construction rather than operation, and these can be minimized with careful management and mitigation measures. Construction of the Skyrail Rainforest Cableway in Australia, which spans 7.5 km with four terminal stations, preserved all of the UNESCO World Heritage tropical rainforest between the stations and towers by having the gondola cabins travel above the tree canopy. In such cases, helicopters are often used for the installation of the towers as a means to reduce the need for road construction30. Compared to other modes of transit, especially modes that are powered by fossil fuels, the operation of aerial ropeways are environmentally benign. In relation to Metro Vancouver transit, an aerial passenger ropeway would have comparable greenhouse gas (GHG) emissions to the electrically powered SkyTrain (see Section 5 for GHG calculation). In hilly terrain, the weight of the descending cabins can supplement the electric power required to drive the ascending cabins, resulting in excellent energy efficiency.
3.2.4 Aerial Passenger Ropeway Safety and Performance
Safety Features Ensure Minimal Risk Over 10,000 aerial passenger ropeways have been built and operate worldwide with an estimated 3.9 billion passengers transported annually. Gondolas, trams and chairlifts are considered to be a safe and secure technology for the transportation of people. Travellers are 20,000 times more likely to be involved in fatal accident in a car than they are in a gondola.37 In Canada, the safety of passenger ropeway lifts is governed by the Canadian Standards Association CAN/CSA-Z98-01 Passenger Ropeways code and standard. There are numerous redundancies and secondary systems designed and built into the construction and aerial passenger ropeway technologies to ensure reliability and safety. Specific safety features for a 3S lift include38:
Back-up Generators – In the event of a primary engine failure, secondary diesel generators are typically available to continue operation.
Secondary Bearing System – The main bull wheels in each terminal may have a secondary set of bearings in the event of primary bearing failure.
Tire Conveyor Redundancy – Both the accelerator and decelerator conveyors have secondary lines with separate power in the event of a primary failure.

BURNABY MOUNTAIN GONDOLA TRANSIT FEASIBILITY STUDY 18
If secondary power fails and on-line rescue is required, comprehensive evacuation guidelines are implemented and carried out by specially trained personnel. The form of the evacuation depends on lift type and site conditions. For example, in the case of the Peak 2 Peak Gondola in Whistler, the large 3 km mid-span, which is approximately 400 m above the valley floor at centre span, makes it impractical to evacuate the cabins into the forest below. As a solution, each cabin is winched back to the closest tower and passengers are lowered in a harness at a central evacuation location. This arrangement allows for the concentration of the evacuation personnel and first aid teams in specific locations32. Aircraft interference may also arise as a perceived concern of the public. In urban application, any possibility of an accident due to a plane or helicopter would be extremely unlikely due to flight level restrictions in urban areas. Furthermore, in many cases gondolas will not be higher than surrounding buildings and trees. In a case where large open spans are required, a state-of-the-art aircraft warning technology such OCAS (Obstacle Collision Avoidance System) is used. As with all modes of public transportation, security is also an issue to be considered with gondola transit. Only larger aerial trams have cabin operators and as a result, there may be a perception that unmanned, automated gondola cabins have a greater security risk. To mitigate these concerns, other automated mass transit systems such as SkyTrain in Vancouver have voice intercoms and silent alarm strips in each car to notify attendants about security and/or health emergencies. Video surveillance may also be used to reduce perceived security risks in certain situations. Two other circumstances unique to gondola transit that can help with security perception are the ability not to board a cabin if a person feels uncomfortable with the other passengers, and the understanding that operators are stationed at the completion of the ride in the terminal buildings39. Another important element of serviceability for public transit is accessibility. Many existing gondolas used for recreational application have small cabins and require passengers to step up into the cabins. Both of these conditions limit and often prevent access for people in wheelchairs or with other disabilities. In urban transit applications, where a much broader passenger basis is serviced, these issues can be easily remedied as current lift technology allows any gondola to be designed with a level “walk-in” or flush threshold, and larger cabins are available where wheelchair accessibility is desired40. Gondola cabins can also be outfitted with flip seating to comfortably accommodate wheelchairs, strollers and bikes. Safe loading and unloading of the cabins is facilitated by low cabin speeds (0.25 m/s) in the terminals and as required, the lifts can be halted for short periods.
3.2.5 Aerial Passenger Ropeway Social Impact
With communities surrounding new mass transit programs, varying concerns often arise regarding pollution, noise, privacy and aesthetics, among other things. Examples of aerial passenger ropeways have shown that limiting environmental impact is possible, and that noise in relation to other transit systems is less32. Conversely, privacy issues can sometimes prove to be challenging, as shown with the Portland Tram where a number of residents below the alignment opposed the
BURNABY MOUNTAIN GONDOLA TRANSIT FEASIBILITY STUDY 19
lift30. Views and sightlines may also be altered with an aerial transit system. Any perceived negative affect from a gondola may translate into a concern that a house or property has lost value. As with the Portland Tram, a program for purchasing homes at fair market value is an option to alleviate some of these concerns. For commuters using a gondola transit system, cabin comfort and extensive views have the possibility of improving the enjoyment of a passenger’s trip. These elements combined with direct and timely travel can often increase ridership through mode shift from other transportation types.

BURNABY MOUNTAIN GONDOLA TRANSIT FEASIBILITY STUDY 20
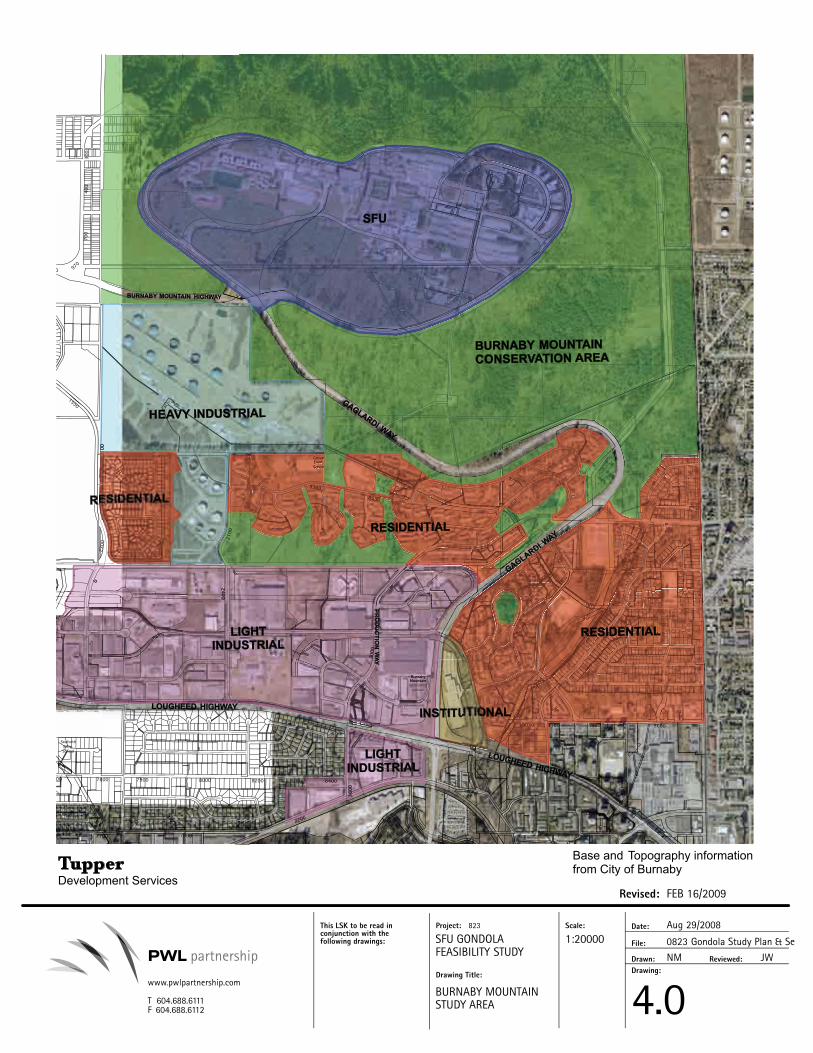
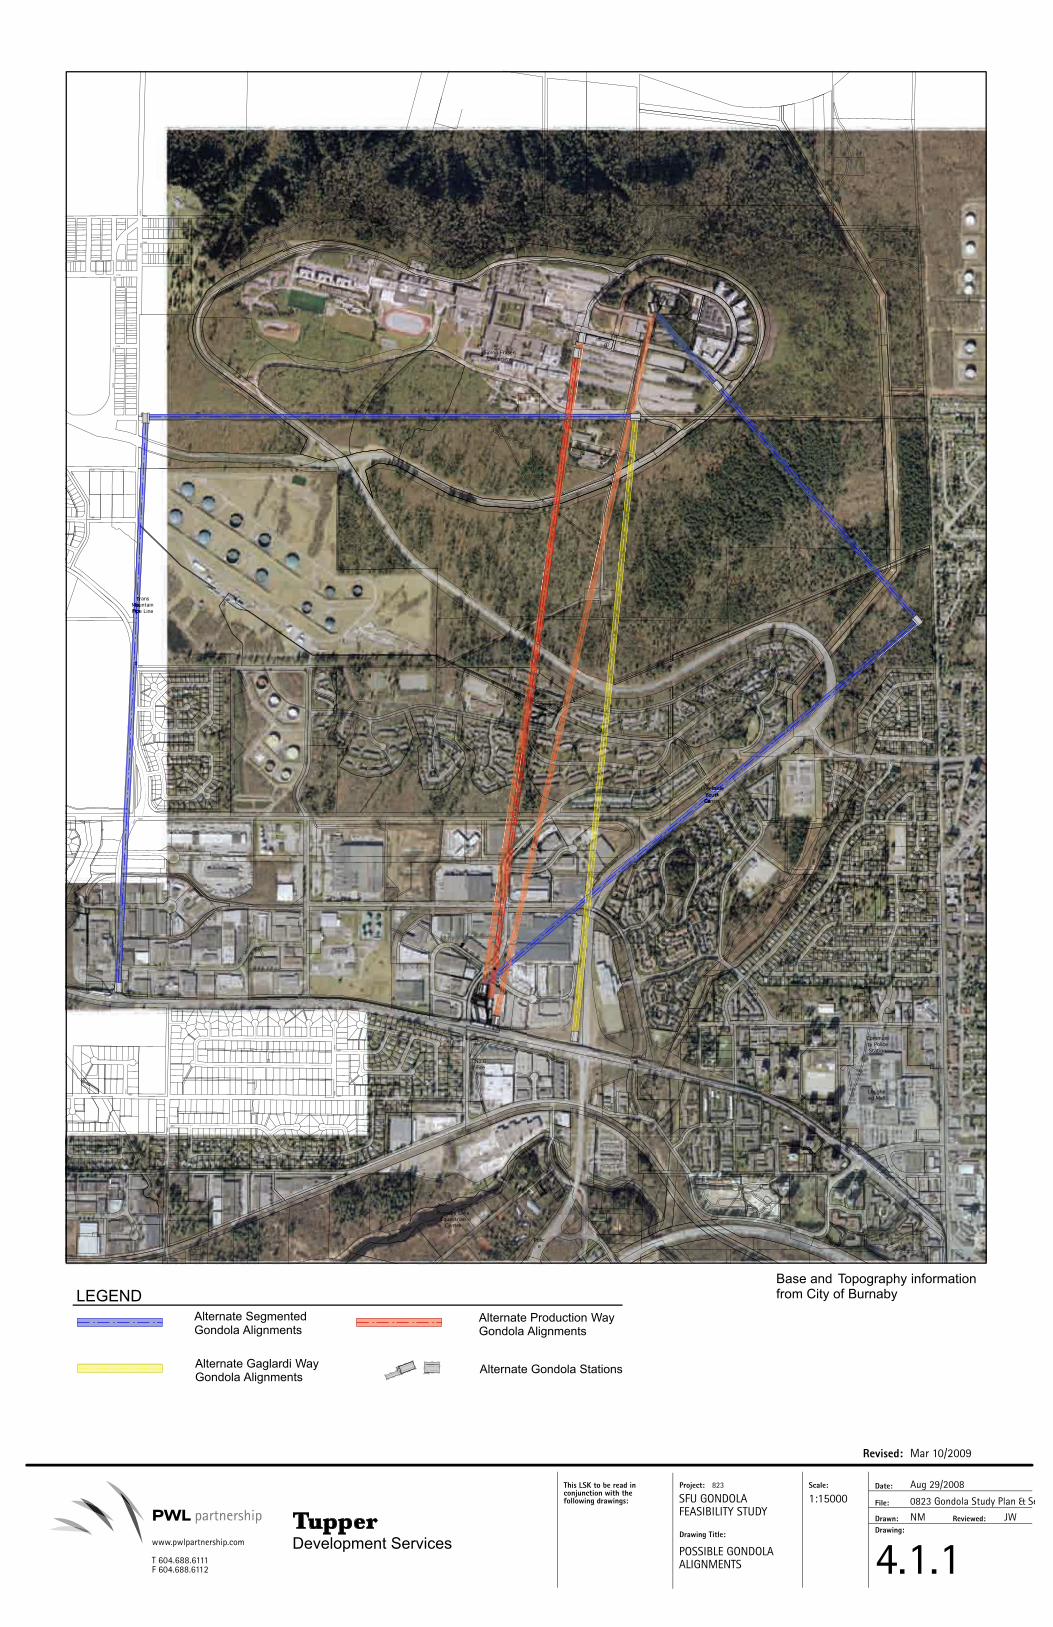
SECTION 4.0 – TECHNICAL EVALUATION OF PROPOSED GONDOLA TRANSIT ON BURNABY MOUNTAIN Many different lift alignments were considered for the Burnaby Mountain Study Area (Figure 4.0). Ridership patterns, land use, lift technologies, terminal station locations and economics all played a major role in the development of viable alignment options. The lift manufacturer’s input regarding technical issues, and SFUCT’s input regarding logistic and planning preferences further influenced the selection of alignment options shown in Figure 4.1.1. This section outlines the specific technical issues surrounding a Case Study Gondola Alignment and briefly examines other alternative options.
4.1 Case Study Gondola Alignment
The Case Study Gondola Alignment shown in red in Figure 4.1.1was chosen because it follows a simple 2.65 km direct route from Production Way-University SkyTrain Station to Town Square, adjacent to the Transit Loop on the SFU campus. The middle dashed line in the figure represents the centre line of the alignment and the outer solid lines represent a distance of 10 metres on each side of the centre line, defining the 20 metre right-of-way required for a gondola.
4.1.1 Ridership
Shorter Travel Time and Convenient Connections Increase Use
Estimating ridership on the gondola is done with an understanding of the major impacts and changes that will occur to the existing bus transit program as a result of the new gondola system. A key consideration in influencing this change is the improved trip frequency and duration for travel from Production Way Station to the Transit Loop. With an assumed speed of 7 m/s over the 2.6 km distance, a gondola travelling this alignment will make the trip in approximately 6 minutes. Together with 1 to 1.5 minutes loading time and virtually no unloading time, the gondola trip duration will be a significant improvement over the current 14-minute travel time of bus route 145, significantly reducing the requirements for this route. With the operation of the Evergreen SkyTrain beginning in 2014, it is planned that route 143 will eventually serve only as a transfer shuttle from Burquitlam Station on the Evergreen Line to the SFU Transit Loop. In the event of a gondola at Production Way, the operation of route 143 can also be significantly reduced9. Passengers would instead travel two additional SkyTrain stops from Burquitlam to Production Way and then travel to SFU via a gondola, all in a slightly shorter time than the projected 13-minute trip of the transfer shuttle. It can also be expected that route 144 will see a change in its course. Instead of climbing the mountain to the SFU Transit Loop, it would turn around at Hastings and Duthie9. The majority of route 144 passengers could opt for a transfer to the SkyTrain at Sperling-Burnaby Lake, proceeding to the gondola. This combination would
Scale:
Drawing:
Drawn: Reviewed:
Date:
File:
Drawing Title:
Project:This LSK to be read inconjunction with thefollowing drawings:
Revised:
1:20000
4.0
NM JW
Aug 29/2008
BURNABY MOUNTAIN
SFU GONDOLA
823
0823 Gondola Study Plan & Sections.vwx
FEB 16/2009
FEASIBILITY STUDY
STUDY AREA
www.pwlpartnership.com
T 604.688.6111F 604.688.6112
PWL partnership
9030 9180 9300 9600
7600
1550
7600 970
7700
7800 7900 8000
7900
8200
8200
8280 8400
3600
3000
2300
011
00
2100
2400
8300
8530
400
300
700
7600
BRUNETTE RIVER
ForestGroveElem.School
BurnabyMountain
Cameron Elem.School
SeaforthElem.School
1100
Forest1100
1100
ForestForestForest1100
1100
ForestForestForest
3000
3000
3000
3000
3000
3000
00
2400240024002400
BurnabyBurnabyMountain
90309030 9180
8400
3600
3600
8200
3600
8400
3600
1100
1100
1100
1100
1100
1100
ForestForestForest
830083008300
85308530
GroveElem.School
ForestForestForestForestForestForestForest
8530
ForestForestForestForestGrove
SchoolSchool
Forest
2100
2100
8530
School
ForestForest
School
Forest
GAGLARDI WAY
GAGLARDI WAY
LOUGHEED HIGHWAY
LOUGHEED HIGHWAY
PRO
DU
CTIO
N W
AY
SFU
HEAVY INDUSTRIAL
RESIDENTIAL
RESIDENTIAL
RESIDENTIAL
LIGHTINDUSTRIAL
LIGHTINDUSTRIAL
INSTITUTIONAL
BURNABY MOUNTAIN CONSERVATION AREA
BURNABY MOUNTAIN HIGHWAY
Base and Topography information from City of BurnabyTupper
Development Services
TupperDevelopment Services
Scale:
Drawing:
Drawn: Reviewed:
Date:
File:
Drawing Title:
Project:This LSK to be read inconjunction with thefollowing drawings:
Revised:
1:15000
4.1.1
NM JW
Aug 29/2008
POSSIBLE GONDOLA
SFU GONDOLA
823
0823 Gondola Study Plan & Sections.vwx
Mar 10/2009
FEASIBILITY STUDY
ALIGNMENTS
www.pwlpartnership.com
T 604.688.6111F 604.688.6112
PWL partnership
BRUNETTE RIVER
BRUNETTE RIVER
7700
0700
0400
7700
7800
78000300
0100
S
7900
0200
0100
0100
9900
7700
7800
7800
7800
2600
8000
1400
7700
0900
7700
1200
7900
3800
8200
3600
8200
3400
8200
3100
7900
81002800
81002000
82008200
8200
330085003400
3200
3100
8500
3100
8300
8500
2700
8300
8600
8700
9100
3300
9000
8700
9900
3200
2900
8800
2700
8700
8900
9000
2700
8700
9000 9200
9600
9500
98002900
9700
2900
9500
9600
2700
2600
9900
2400
9800
99009800
9900
2100
4500
3900
7600
4200
4100
7800
4000
3800
8200
8200
4400
7900
9100 6900
7100
9000
90007000
99004000
9400
9900
4200
9300
9600
Centennial
Pavilion
Simon FraserUniversity
TransMountainPipe Line
CreeksideYouthCentre
ParksNurse
ry
No.6FireHall
Burnaby LakeEquestrian
Centre
Police
Rec.Centre
Cameron
Library
Community PoliceStation
Lougheed Mall
CreeksideYouthCentreCentreYouthYouthCentre
CreeksideYouth
1400
TransTransTransMountainMountainMountainPipe LinePipe LinePipe Line
1400
7800
TransMountainMountainPipe LinePipe Line
1400
7800
TransMountainPipe LinePipe LinePipe LinePipe Line
Base and Topography information from City of Burnaby
Alternate Segmented Gondola Alignments
Alternate Production Way Gondola Alignments
Alternate Gondola StationsAlternate Gaglardi Way Gondola Alignments
LEGEND
BURNABY MOUNTAIN GONDOLA TRANSIT FEASIBILITY STUDY 23
significantly shorten the current 19-minute bus ride up the mountain from Sperling-Burnaby Lake4. Alternatively, passengers could transfer to the remaining bus route 135 along Hastings at Duthie. Based on the changes to the existing bus system presented above, mid-week bus ridership counts from 2007, provided by TransLink, indicate that the current passenger load for a gondola would be approximately 21,000 people per day. Further analysis reveals that the 15-minute peak hour equivalent load is 2,089 people per hour (pph), inbound, between 9:15 and 9:30 a.m. The 30-minute peak hour equivalent load is 1,730 pph occurring between 9:00 and 9:30 a.m. These peak hour equivalent loads are used in order to control and understand the level of service or potential wait times for the gondola. Meeting peak demands for smaller equivalency periods (time segments) yields a higher level of overall service. Looking to the future, OCP population projections (Table 2.3.1) were used to determine future ridership demands, with consideration for transportation mode shift over time (Appendix A). Estimates yielded minimum projections of 2,681 pph and 2,220 pph for 15- and 30-minute peak hour equivalent loads, respectively, and maximum projections of 3,762 pph and 3,116 pph for 15- and 30-minute peak hour equivalent loads, respectively. With both the minimum and maximum projections, increased ridership is expected from present-day level. Conveniently, gondolas can be designed for an ultimate capacity but initially outfitted for a lesser capacity to lower the upfront capital investment. When future ridership conditions dictate, additional cabins are installed to meet the increased demand. For purposes of this report, an original capacity of 2,000 pph is chosen for the Burnaby Mountain Gondola, with a maximum design capacity of 2,800 pph. The original capacity is sufficient to meet current 2007 commuter demands with a very high level of service – no waiting time at all. The design capacity is chosen as a middle ground between the minimum and maximum projected loads. If the most extreme ridership case of 3,762 pph was reached, passengers would only wait a maximum of 6 minutes before boarding the gondola. This wait time plus the 6-minute trip duration is still faster than the 14-minute travel time of route 145, which does not including waiting and loading time.
4.1.2 Gondola Technology for Burnaby Mountain
Early in the technical feasibility investigations, a variety of alignment locations were considered, allowing for the possibility of any of the gondola technologies. However, when considering the direct alignment without an angled mid-station terminal, the choice of gondola technologies was narrowed. A site visit with Doppelmayr/Garaventa, and subsequent assessments of the site findings, eventually concluded that the 3S gondola technology would provide the best combination of technical solutions.
Monocable Not Feasible Due to the need for frequent tower spacing, a monocable was deemed infeasible for the Case Study Gondola Alignment shown in Figure 4.1.1. Interference and constraints with existing building and road infrastructure in the industrial lands below Broadway were deemed too restrictive. Even more limiting, construction disturbance in the ravine below Forest Grove Drive and impacts to residential property between Forest Grove and Gaglardi were considered too high. In addition, the
BURNABY MOUNTAIN GONDOLA TRANSIT FEASIBILITY STUDY 24
smaller cabin sizes of the monocables could possible lead to difficulty in meeting the required disability access standards. The Wind Factor Additionally, a desire to have the most reliable performance in strong winds led to the 3S technology as the preferred technical solution. With requirements to reduce or prevent termination of operations at lower wind speeds, the monocable and 2S systems provided an unacceptable level of risk for possible lift downtime. Specifically, the available wind data for Burnaby Mountain, received from Environment Canada, indicates that over a five-year period from 1973 to 1978, a total of 19 hours (3.5 hours/year) averaged wind speeds greater than 60 km/h with zero hours averaging wind speed over 80 km/h. Additional data from Environment Canada indicates that over an 11-year period from 1978 to 1989, 46 hours (4.2 hours/year) had a wind speed of over 60 km/h in a two-minute period at the end of the hour, while zero hours showed wind speeds over 80 km/h. In conclusion, with data consisting of averages and discrete measurements and with only 16 years of data, it should be expected that winds higher than those measured will be seen on Burnaby Mountain. Nonetheless, the data does give an indication of the likelihood of winds that would affect the operation of a monocable. Therefore, to provide the most reliable level of service, a 3S is preferable. Furthermore, while bus operation typically ceases once or twice a year on Burnaby Mountain due to snow, the unlikelihood of winds over 110 km/h would allow a gondola to provide a much higher level of reliable service than the existing transit system. In the extreme event of debilitating wind conditions, service to the mountaintop could be maintained with a backup bus system, similar to the shuttles between SkyTrain stops provided during unforeseen track closures. Other Possibilities As with the 3S technology, the Funitel gondola technology provides the possibility of long spans, thus eliminating the major issues seen with monocables while also providing the same or better reliability in wind. However, preliminary discussions with a lift manufacturer regarding evacuation and rescue procedures relating specifically to the Case Study Gondola Alignment would make 3S the preferred technology. While the 3S technology is the preferred technology, it should also be understood that these technical assessments are only preliminary, and more detailed risk analysis including possible economic impacts may conclude that a funitel or bicable gondola is a viable solution. Nonetheless, for the purpose of this report, a 3S gondola was deemed most appropriate and as such, all following analysis and cost estimates represent this conclusion.
4.1.3 Case Study Terminal Locations
Next to Existing Transit Facilities
With the Case Study Gondola Alignment, both Terminals are very well integrated into the existing transit network, which in turn will provide a seamless and potentially enhanced transit experience for the passengers.

BURNABY MOUNTAIN GONDOLA TRANSIT FEASIBILITY STUDY 25
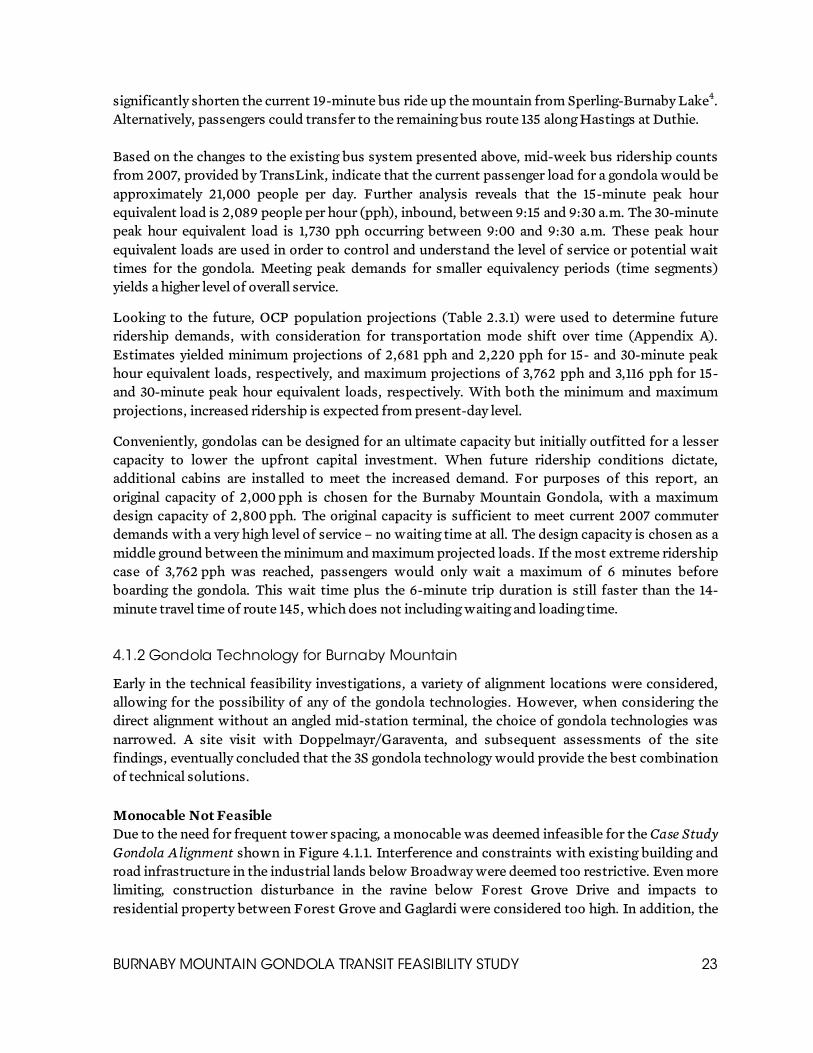
Determining an appropriate location for the Bottom Terminal is difficult with this alignment, given the concentration of existing buildings and their relation to the SkyTrain station. However, connecting directly to the newly constructed bus transfer zone of the Production Way-University Station43 would facilitate the maintenance of a single fare paid zone. Detailed in Figure 4.1.5, the Top Terminal building for the Case Study Gondola Alignment is situated directly below Town Square, adjacent to the existing SFU Transit Loop. A terminal station in this location would deliver gondola transit riders to the vicinity of the existing bus transit hub. With this location between the commercial space of the Cornerstone Building to the east and the campus to the west, the student population of SFU, as well as the growing population of UniverCity will continue to be adequately served by transit. A formal sense of arrival to the SFU campus could also be expected as passengers exit the terminal building into the award-winning Town Square. A feasible alternative location for the proposed Top Terminal would be the existing Transit Loop. This would involve a simple extension of the Case Study Gondola Alignment over Town Square. With the significant reduction in demand for all bus service except route 135 (and the new 95 B-line), it is possible that the SFU Transit Loop could be reconfigured to accommodate the Top Terminal structure.
4.1.4 Case Study Tower Locations and Alignment Sections
Tower site locations for the Case Study Gondola Alignment were originally assessed by observing specific opportunities and constraints on-site. Once preliminary tower locations were determined, a preliminary engineering analysis was performed to confirm the adequacy of the tower locations and determine the probable tower heights. The analysis resulted in the need for five support towers between the terminals, yielding six separate rope span segments along the alignments. Alignment Segment 1 North from a Bottom Terminal at Production Way Station, this gondola ascends along the first alignment segment over parking lots and city roads. With the main gondola mast in the Bottom Terminal referenced as horizontal station 0+000, Tower 1 would be located at the relative horizontal station of 0+160 metres. Preliminary analysis indicates that the height of Tower 1 will be 30 m, yielding an estimated bottom of gondola clearance of 11 m over the road surface. Alignment Segment 2 Between Tower 1 and Tower 2, the second gondola alignment segment travels 510 m over Production Way for most of the span and likely crosses the edge of two 1-storey industrial buildings at the northwest corner of Production Way and Commerce, and a 2-storey federal government building adjacent to the intersection of Production Way and Broadway. Tower 2 would be situated at station 0+770 m and is located in City of Burnaby property designated for a western extension of Broadway. It is assumed that this area can be utilized for Tower 2. Existing hydro lines just down from the tower would likely not require relocation unless plans for the Broadway extension did proceed. With a height of 50 m, Tower 2 would provide estimated clearances of 25 m, 30 m and 35 m over the two industrial buildings, the Production Way road surface and the government building, respectively.
D
0.6
± 4.6LB
LB
LIM
IT O
F W
OR
K LI
NE
BUS LOOP
TOWN SQUARE
PROPOSED TOP GONDOLA TERMINAL
UNIVERSITY HIGH STREET
GONDOLA AREA STORAGE, 260 sq m
CONTROL ROOM,3.5m x 7.5m
PEDESTRIAN CIRCULATION
2m CONSTRUCTION SETBACK TO EXISTING STRUCTURES
6.75
PROPOSED PEDESTRIAN RAMP OVER NATURALIZED PLANTING
REMOVE EXISTING DRIVEWAY AND PAVING
PROPOSED NATIVE PLANTING
Scale:
Drawing:
Drawn: Reviewed:
Date:
File:
Drawing Title:
Project:This LSK to be read inconjunction with thefollowing drawings:
Revised:
1:500
4.1.5
NM JW
Aug 29/2008
Case Study:
SFU GONDOLA
823
0823 Gondola Study Station Sections.vwx
Mar 10/2009
FEASIBILITY STUDY
Gondola AlignmentTop Terminal Plan
www.pwlpartnership.com
T 604.688.6111F 604.688.6112
PWL partnership
Base and Topography information from City of Burnaby
TupperDevelopment Services
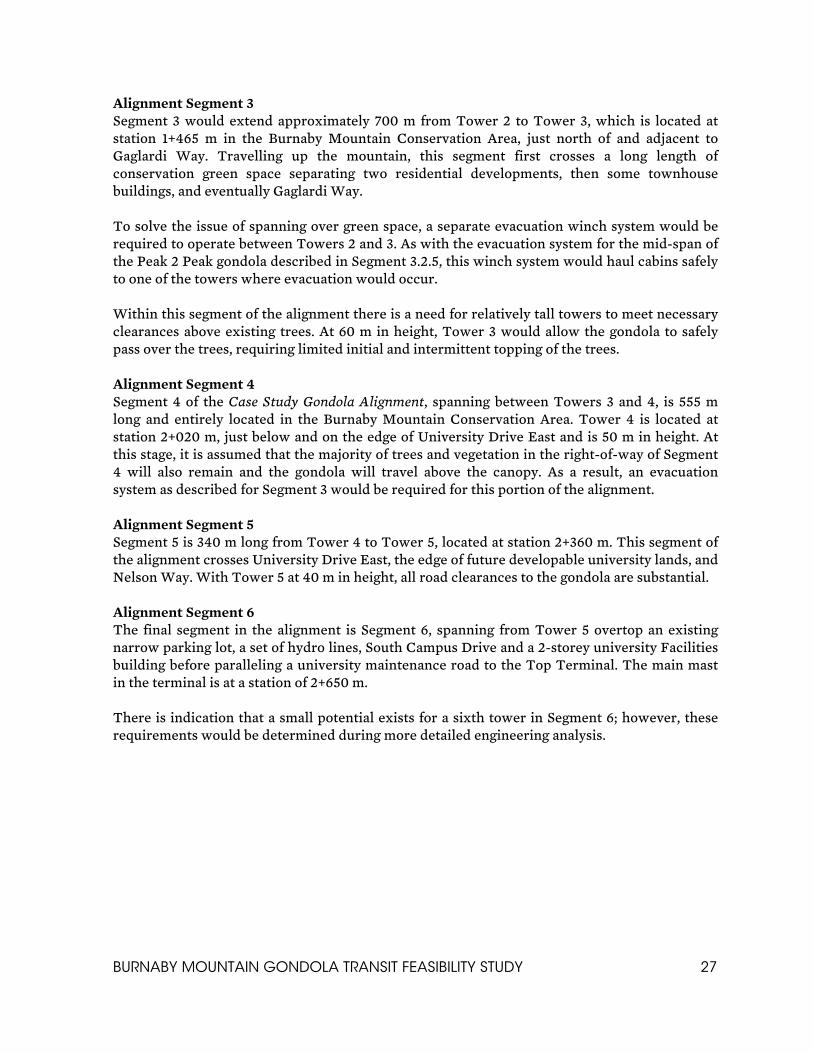
BURNABY MOUNTAIN GONDOLA TRANSIT FEASIBILITY STUDY 27
Alignment Segment 3 Segment 3 would extend approximately 700 m from Tower 2 to Tower 3, which is located at station 1+465 m in the Burnaby Mountain Conservation Area, just north of and adjacent to Gaglardi Way. Travelling up the mountain, this segment first crosses a long length of conservation green space separating two residential developments, then some townhouse buildings, and eventually Gaglardi Way. To solve the issue of spanning over green space, a separate evacuation winch system would be required to operate between Towers 2 and 3. As with the evacuation system for the mid-span of the Peak 2 Peak gondola described in Segment 3.2.5, this winch system would haul cabins safely to one of the towers where evacuation would occur. Within this segment of the alignment there is a need for relatively tall towers to meet necessary clearances above existing trees. At 60 m in height, Tower 3 would allow the gondola to safely pass over the trees, requiring limited initial and intermittent topping of the trees. Alignment Segment 4 Segment 4 of the Case Study Gondola Alignment, spanning between Towers 3 and 4, is 555 m long and entirely located in the Burnaby Mountain Conservation Area. Tower 4 is located at station 2+020 m, just below and on the edge of University Drive East and is 50 m in height. At this stage, it is assumed that the majority of trees and vegetation in the right-of-way of Segment 4 will also remain and the gondola will travel above the canopy. As a result, an evacuation system as described for Segment 3 would be required for this portion of the alignment. Alignment Segment 5 Segment 5 is 340 m long from Tower 4 to Tower 5, located at station 2+360 m. This segment of the alignment crosses University Drive East, the edge of future developable university lands, and Nelson Way. With Tower 5 at 40 m in height, all road clearances to the gondola are substantial. Alignment Segment 6 The final segment in the alignment is Segment 6, spanning from Tower 5 overtop an existing narrow parking lot, a set of hydro lines, South Campus Drive and a 2-storey university Facilities building before paralleling a university maintenance road to the Top Terminal. The main mast in the terminal is at a station of 2+650 m. There is indication that a small potential exists for a sixth tower in Segment 6; however, these requirements would be determined during more detailed engineering analysis.
BURNABY MOUNTAIN GONDOLA TRANSIT FEASIBILITY STUDY 28
4.2 Alternative Gondola Alignments
A number of alternative gondola alignments have been briefly assessed (Figure 4.1.1). Each alternative is technically feasible and would yield different problems, and hence solutions, in their construction. Of the alternative options, there are a series of alignment possibilities that represent a slight variation from the reference option. As can be seen in Figure 4.1.1, the blue lines show alignments with top and bottom terminals located adjacent to the terminals of the Case Study Gondola Alignment. As far as the Bottom Terminals are concerned, with this group of alternative options, additional land acquisition would likely be required, which adds overall costs to the project. In addition to the alternative alignments that are direct, two alignments with an angled mid-station were considered, as shown in yellow in Figure 4.1.1. The greater flexibility of the angled mid-stations provides more options for traversing the terrain. Brief descriptions of the two angled mid-station alternatives are outlined below: Production Way to Mid-Station to Campus This alignment spans 2.25 km from Production Way-University Station northeast along and over Gaglardi Way to a mid-station located in Burnaby Mountain Conservation Area. At the mid-station, the alignment is rotated 90 degrees and continues another 1.6 km northwest up Burnaby Mountain to a Top Terminal adjacent to University High Street. With only one existing structure to span, this alignment allows for the possibility of a relatively more affordable monocable gondola system to be technically feasible. Furthermore, use of almost entirely public lands and air space would result in fewer requirements for statutory rights-of-way and other land use entitlements. Nevertheless, this alignment is 50% longer than the Case Study Gondola Alignment, and any cost savings associated with technology choice could be offset with a longer lift and additional station. This alignment is also less attractive because it adds time to the commute relative to the Case Study Gondola Alignment. Lake City to Mid-station to Campus Another angled mid-station alignment option originates from the Lake City Way Station. With much less infrastructure existing around this SkyTrain station, there are more options for the placement of a Bottom Terminal. Furthermore, a mid-station adjacent to Hastings Street could provide the possibility of terminating bus route 135 early, leaving no requirement for major bus transit on Burnaby Mountain. Similar to the Production Way mid-station alignment, the monocable technology would be possible and land use benefits exist; however, this alignment would be even longer, at 60% more than the Case Study Gondola Alignment. Again, the cost impacts from this added length, the longer travel time, and a slightly less preferable Top Terminal location make this alignment less desirable.

BURNABY MOUNTAIN GONDOLA TRANSIT FEASIBILITY STUDY 29
SECTION 5.0 – IMPACTS OF GONDOLA TRANSIT ON BURNABY MOUNTAIN
In Context of Public Transport Policy
Beyond technical feasibility, there are a number of additional considerations that arise in contemplating a gondola on Burnaby Mountain. Section 5 investigates the policy implications of a gondola as a transit mode along with the land use, environmental, safety and social (community) impacts of the specific Case Study Gondola Alignment.
5.1 Policy Analysis
The policy review provided in Section 2 highlighted three themes in the transportation and related policy documents that are particularly applicable to Burnaby Mountain: transport and land use, reducing reliance on the automobile, and transportation hierarchy. The following discussion considers a gondola transit system on Burnaby Mountain in relation to those themes. Transport/Land Use UniverCity has been very successful in creating a compact community close to a major transit hub. According to the policy review, such compact communities make public transportation a more viable option by putting a large number of people in close proximity to transit, thereby increasing demand. Ridership projections presented in Appendix A indicate that yearly transit trips to and from Burnaby Mountain may increase from 1.5 million trips today to as many as 3 million trips at full build-out of UniverCity, whereupon thousands of new community members will have convenient access to transit at the SFU Transit Loop. A further assertion common to transportation-related policies is that an increase in transit demand should lead to more frequent, convenient and comfortable service. The gondola on Burnaby Mountain can readily meet the anticipated demand for transit to and from SFU in a way that is comfortable and convenient, making the gondola option a legitimate alternative to current modes of transit, and deserving of serious consideration. Reducing Reliance on Automobiles through Gondola Transport The proposed gondola transit connection for Burnaby Mountain presents a unique alternative to motor vehicle travel. The following analysis considers whether a public gondola is likely to meet the policy goal of reducing reliance on private automobiles. The factors that cause travellers to choose one mode of transportation over another (often gravitating to the private automobile) are time, convenience, reliability, cost, flexibility, comfort, safety and availability of parking45. Of these, time is said to be the most critical: travellers prefer to get around more quickly. In this way, time (as well as the other factors) is simply another form of cost that users consider in making their transportation choices. Modes that provide the best travel benefits for the least cost will attract the most passengers. Of course, individuals weigh costs and benefits differently. Some would prefer the privacy and comfort of their vehicle even if it is slower than other, more public, option.

BURNABY MOUNTAIN GONDOLA TRANSIT FEASIBILITY STUDY 30
In any case, the means to reduce reliance on one mode is to increase the relative attractiveness of others for the widest possible audience. Working from the assumption that cost, in its broadest economic definition, is the only factor influencing mode choice, this goal can be accomplished by either increasing the cost of car travel (through road tolls, gas taxes, insurance premiums, automobile purchase taxes, parking charges, etc.), or by reducing the cost of other modes (for example, through transit subsidies, or by providing faster, safer, more comfortable, flexible and convenient service). Under these assumptions, gondola transit appears attractive. The service is quiet and comfortable. It follows a direct route to gain elevation, and thus performs well in terms of speed. It is not subject to delays caused by traffic congestion, snowy and icy roads, road closures, accidents or construction. Frequent, convenient and reliable, service can be provided easily. Integration with existing bus stops and/or rapid transit stations can be seamless. Larger gondola cabins can be accessible to wheelchairs, bicycles, strollers, toddlers and the elderly. The service is also unique, offering views from the mountain not available from other modes of transport. In terms of factors influencing travel behaviour, gondola service to and from Burnaby Mountain compares favourably to private automobiles and is consistent with policy to reduce reliance on the latter. A novel mode of transportation may also inspire not just commuters but also tourists to Vancouver to use public transportation more. Supporting the Transportation Hierarchy with Gondola Transport Policies citing transportation hierarchy do not explicitly recognize gondolas; however, the intent of the hierarchy is clear: prioritize inexpensive and environmentally benign modes of transport. On this continuum, walking, cycling and public transit take precedence. A gondola on Burnaby Mountain falls in the public transit category; however, not all forms of transit are equal. Considering the social, environmental and economic objectives of the hierarchy, and related data on gondola costs and level of service, the gondola service has distinct advantages over other modes of public transit. Compared to existing diesel buses or SkyTrain, the gondola can be considered a cost-effective and environmentally preferable mode. Furthermore, consistent with one of the measures cited in Transport 2040, new forms of technology in the suite of public transit modes should be explored to help solve the future challenges of Metro Vancouver transportation needs. Gondola transit is such a technology. A gondola to the top of Burnaby Mountain is likely to offer further indirect support for the transportation hierarchy by strongly promoting cycling. Tom Prendergast, CEO of TransLink, has stated that it is an objective of TransLink to consider transit modes that promote walking and cycling. Much as the existing SkyTrain serves as an extension of cycling, the frequency and convenience of a gondola will make cycling to Burnaby Mountain much easier. A bike rack activation report for the routes to Burnaby Mountain indicated a low use of the bus bike racks in comparison to downtown Vancouver routes, likely due to the fact that each bus can accommodate only two bikes. With gondola cabins able to carry at least six bikes, the opportunity for getting bicycles to SFU increases significantly.
BURNABY MOUNTAIN GONDOLA TRANSIT FEASIBILITY STUDY 31
Public transit is preferred within the transportation hierarchy, and the salient characteristics of a gondola lend it credence within the range of available transit technologies. According to the review of relevant policies presented in Section 2, this brief analysis suggests that a gondola should be supported in transportation planning, funding and infrastructure decisions.
5.2 Land Use Partnerships and Approvals
Given the location of Production Way-University station and the SFU Transit Loop, it is understood that the Case Study Gondola Alignment on Burnaby Mountain could not be possible without developing partnerships with a variety of stakeholders. As a result, beyond conventional land use entitlements required by government authorities for the planning and construction of such a lift, a number of rights-of-way and land use entitlements are also required from private landowners. Detailed due diligence would be required in the event of a gondola project proceeding. Bottom Terminal Location and Land Use Issues There are many land use issues to consider with a Bottom Terminal that is integrated with Production Way Station. Satisfactory accommodation and arrangements would be required for each stakeholder when partnering to make a gondola possible. An official subdivision would likely be required, with a subsequent purchase of any subdivided parcel. This application and process is regulated and administered by the City of Burnaby53 and governed by the City’s zoning and subdivision bylaws and the BC Land Title Act. It is also assumed that the current M3r – Heavy Industrial District zone54 of the Bottom Terminal building land would require rezoning, possibly to a Comprehensive Development (CD) zone and amended to be included in the same plan with the adjacent Production Way-University station. Given possible terminal orientations, building setback variances may also be required, along with building permits and rights-of-way as required by the City of Burnaby. Towers: Locations and Zoning With the Case Study Gondola Alignment, the site for Tower 1 is a small treed corner of the private industrial lot. Similar to a Bottom Terminal, on private land a subdivision annexing the tower land would likely be required along with a rezoning amendment application to accommodate a tower. Currently, the Tower 1 site is zoned M3r54, which does not contemplate an approximately 40-metre tower. Tower 2 is proposed to be located in the centre of a city-owned right-of-way for the future westward extension of Broadway Street. There is a possibility of having the traffic drive under and around the gondola tower if there is ever a desire to extend the road. As Tower 2 is directly north of an existing set of hydro lines running perpendicular to the alignment, an approval from BC Hydro will also likely be needed in order to cross the lines with the gondola. Towers 3 and 4 of the Case Study Gondola Alignment are located at the edges of the Burnaby Mountain Conservation Area, currently zoned P3 – Park and Public Use54. Planning in this area would be subject to local and provincial regulatory requirements and processes.

BURNABY MOUNTAIN GONDOLA TRANSIT FEASIBILITY STUDY 32
Tower 5 would be located in SFU lands in zone P6 – Regional Institutional District54 and as with other towers, it would be necessary to ensure that the appropriate zoning existed for the possibility of a tower. Alignment Segments The 20–metre-wide right-of-way of the Case Study Gondola Alignment crosses a number of different private and public properties in each of the Segments. As a result, statutory rights-of-way for use of the air space over these properties will be required. Top Terminal The Top Terminal is located on Simon Fraser University lands in the P6 – Regional Institutional District. Beyond approval from appropriate SFU authorities, a conventional building permit is likely the only major requirement for the Top Terminal. Technical Standards and Controls As indicated in Chapter 3, the Canadian Standards Association CAN/CSA-Z98-01 Passenger Ropeways code and standard governs the design and construction of such technologies in Canada. As such, a series of design, construction, inspection and testing approvals will be required by the Z98-01 committee prior to the opening of operation.
5.3 Environmental Considerations for Gondola Transit on Burnaby Mountain
This report section is separated into two distinct parts: a discussion on the physical environmental impacts of a gondola to Burnaby Mountain and a greenhouse gas (GHG) comparison of such a system versus the existing bus transit. The first and second segments of the Case Study Gondola Alignment exist in an industrial area and the fifth and sixth segments exist in SFU lands slated for future development. Environmental sensitivity is not deemed significant in these areas and as a result, the following discussions are specific to mainly Segment 4 in the conservation area.
5.3.1 Direct Physical Environmental Impacts
The majority of background information on biophysical resources in the Conservation Area was collected by the City of Burnaby and their consultants AXYS Environmental. Biophysical field inventories were conducted in 1997 during August, September and early October. The objective of this field inventory was to establish a baseline understanding of physical features, biological features and habitat characteristics on Burnaby Mountain, in order to provide recommendations for management within the Burnaby Mountain Conservation Area46. If a decision is made to proceed with the Burnaby Mountain Gondola Transit Project, the environmental impact to the conservation area will likely be minimal because gondola construction techniques can limit disturbance to the small footprints surrounding the tower locations. Nonetheless, the AXYS report will provide a significant resource for understanding any potential impact from the

BURNABY MOUNTAIN GONDOLA TRANSIT FEASIBILITY STUDY 33
construction of towers.
5.3.2 Greenhouse Gas Emissions Comparison
Gondola Significantly Reduces Demand on Three Bus Routes and Lowers Emissions
by 1,870 tonnes
Climate change has taken hold as the pre-eminent global environmental issue of this generation, a fact reflected by dire predictions of dramatic environmental change with inevitable social and economic ramifications, and an urgency to avert these predictions with strong policy measure and other actions. Greenhouse gas (GHG) emissions, primarily carbon dioxide (CO2), nitrous oxides (NOx), and methane (CH4), are causing the climate to change and, as such, are the quantitative measure used in discussing mitigation efforts. In February 2008, the BC government published the Climate Action Plan, which illustrates BC’s commitment to reduce GHG emissions across the province by 33% by the year 2020. The transportation industry is expected to provide 15% of these total reductions with much of the reduction expected from transit systems. Specifically, the expectations are to double ridership, and reduce transportation-related emissions by 4.7 million tonnes by 2020. In this context, a discussion of relative GHG emission between a new gondola transit system versus an existing bus system is particularly relevant. A gondola on Burnaby Mountain is expected to be powered by electricity with an annual consumption of approximately 7,500 kWh (per Section 6.2). According to BC Hydro, GHG emissions from hydroelectric power are produced at a rate of 22 tonnes per gigawatt hour49, resulting in 0.165 tonnes annually. BC is fortunate that its production of electricity is already relative clean. As a benefit, the gondola will be a source for cheap and emission-free energy. With the significant service reduction of bus routes 145 and 143 and the shortening of route 144, there will be a corresponding reduction in annual bus operation of 31,300, 10,200 and 9,100 hours50, respectively. At an average of 1,000,000 km over 59,500 hours of operation in the lifetime of a bus, this translates to a total reduction of 850,000 km travelled per year. At an average rate of emissions of 2200 g (CO2+CH4) per kilometre for the diesel buses51 used for these routes, this yields a reduction of 1870 tonnes of GHG emissions annually at current rates of use. Assuming that increased bus service would be required to meet anticipated demand along these routes, this value could reach up to 2,800 tonnes annually while the resulting gondola impact would remain constant at 0.165 tonnes. Given current bus service hours, the net reduction in GHG emissions by replacing and modifying the diesel bus routes with a gondola transit system is 1870 tonnes, or the equivalent to taking 360
BURNABY MOUNTAIN GONDOLA TRANSIT FEASIBILITY STUDY 34
automobiles off the road52. Furthermore, according to the Climate Action Plan, the province of BC is planning on implementing carbon emission pricing at the estimated cost of $30/tonne by 2012. This would translate to annual savings of $56,000 with the gondola system today.
5.4 Safety and Performance of Gondola Transit on Burnaby Mountain
Section 3.2.5 of this report addressed most of the components of safety and performance for urban gondolas; however, additional consideration should be given to a gondola located on Burnaby Mountain. In the unlikely event of a complete lift breakdown, an evacuation and rescue program specific to a Burnaby Mountain gondola would need to be in place. The North Shore Rescue (NSR) mountain search and rescue team based in Vancouver is the ideal organization for such a responsibility. The NSR team consists of approximately 40 volunteers skilled in search and rescue operations in mountain, canyon and urban settings. It is reasonable to believe that gondola rescue could be added to the list. As with ski patrols at mountain resorts, initial and subsequent annual evacuation and rescue training would be provided. It is projected that a gondola on Burnaby Mountain would operate on average 20.5 hours a day to match the SkyTrain operation. As a result, available windows for maintenance operations are minimal. According to the Portland Tram maintenance staff, extensive preventative maintenance can be performed during the operations and within the limited downtime, reducing the concern for major downtimes. In the event of the need for a major maintenance activity, the tram has been placed on very limited weekend hours to allow more time for specific tasks. Creating these longer windows of opportunity is deemed adequate for the required maintenance of the gondola.
5.5 Social Impacts of the Case Study Gondola Alignment on Burnaby Mountain
Section 3 outlined a number of the potential social impacts as a result of an aerial ropeway. For passengers of an aerial ropeway, these impacts are mostly positive; however, for communities surrounding the gondola, several concerns may arise. Regarding specific communities impacted by a Burnaby Mountain gondola, four distinct zones can be considered to be affected by the Case Study Gondola Alignment: the industrial zone, the conservation area, SFU and the residential area. The area between Tower 2 and the Bottom Terminal is composed of industrial offices and buildings. By the nature of the land use, it is a zone with manufacturing industries in large warehouses, resulting in high truck traffic, noise and a low expectation for aesthetics and privacy. With people working in this area during the day, it is assumed that little direct concern regarding social impact will arise with a gondola alignment through this area. The green space between Tower 2 and 4 is entirely Burnaby Mountain Conservation Area. Assuming that environmental concerns are addressed appropriately in the context of required regulatory permitting processes, it is expected that physical impacts can be minimized.

BURNABY MOUNTAIN GONDOLA TRANSIT FEASIBILITY STUDY 35
Simon Fraser University is the owner of the property from Tower 4 to the Top Terminal. Buildings with academic functions are adjacent to the Top Terminal and therefore it is expected that aesthetics, more than privacy, will be an issue for SFU. This can be addressed with input when a full design of the Top Terminal building is undertaken. Furthermore, noise should not be an issue, given that a gondola will actually reduce noise in this area with the reduction of bus traffic. In regard to the future developable lands below Tower 5, it is expected that, with previous knowledge of a gondola, future residents of this area of UniverCity can ultimately decide whether a gondola is a significant factor prior to purchasing. Addressing Residents’ Concerns re Privacy and Aesthetics The residents in areas along any gondola line are the most likely to express concern with the main issues being noise, fear of falling objects, privacy, aesthetics and property value reduction. Given the relative quiet of a gondola and the ability to use screens in the cabins, there should be no problem in reassuring residents that noise and falling objects are unlikely. This leaves privacy concerns, aesthetics and property value as the remaining concerns for residents in this area. Only partially encumbered by surrounding trees, views of the multi-family townhouse complexes adjacent to and below will be possible from the passing gondola. However, at approximately 30 metres above the buildings, any views will be largely of rooftops, yards and the surrounding property of the residences. The gondola will be at an elevation that prevents close lines of sight directly into windows. It should also be noted that the typical cabin design has seating facing into the cabin, making views straight down difficult. Privacy can be highly subjective and will likely result in varying levels of concern from residents. Response to aesthetics is another element that is difficult to predict. No views of surrounding landscape or areas will be impacted by a gondola on Burnaby Mountain; therefore, any concern over aesthetics would be with the appearance of the gondola cabins travelling overhead and the possible visual impact of Tower 3. To mitigate any aesthetic concerns, the gondola cabin and tower colour can be selected based on community input, and the tower design may be modified to create a pleasing structure, as was done in Portland (cost should be considered). Further technical studies around exact tower location may also provide solutions for mitigating impact. Lastly, it is difficult to predict any effect on property value associated with a gondola overhead. As was described in Section 3.2.6 above, there can be several positive social benefits to commuting in a gondola. Most notably for a gondola on Burnaby Mountain, the views of the North Shore Mountains, Burrard Inlet, the Vancouver skyline and Fraser Valley would be major features in a ride up or down the mountain. The availability of these views may even alleviate some concerns over privacy from the residents adjacent to the alignment. With 24 of the 30 passenger spaces accommodated by seating in previous examples of 3S cabins, the comfort of this gondola ride will also be greater than a bus, where a higher percentage of riders have to stand at peak times. The interiors of the cabins can be custom-designed to accommodate any use or requirements for the internal space. This increase in comfort, along with the increased gondola frequencies, can be quantified in a mode attraction factor. TransLink has a reliability factor for the various modes of
BURNABY MOUNTAIN GONDOLA TRANSIT FEASIBILITY STUDY 36
transportation that can be simply translated into an effective attraction factor for a particular mode. With a lower factor representing a more attractive mode, the SkyTrain is rated at a base 1.0 in perceived attractiveness, the West Coast Express a 0.5 and buses a 1.2. It is speculated that a gondola will have similar, if not more attractive, elements as the SkyTrain, perhaps in the 0.9 range. In turn, there will be a perception of a more enjoyable transit experience for riders on the gondola as compared to the current bus system, which will likely account for additional mode shift and increased ridership. Gondola Contributes to Tourism and Recreation Growth Another very likely effect of a gondola on Burnaby Mountain is the growth and further expansion of a tourism and recreation culture. As indicated in Section 3, many urban aerial passenger ropeways attribute a major component of ridership to tourism. With the picturesque SFU campus and a growing residential and commercial district in UniverCity, there are an increasing number of reasons to visit Burnaby Mountain. A fast, efficient, comfortable gondola providing expansive views of the region will undoubtedly add to the attraction. The Burnaby Mountain Conservation Area is also the centre of significant local recreation. With an extensive trail network for both hiking and mountain biking, a large number of UniverCity residents cited the recreational opportunities of Burnaby Mountain as a main reason for purchase their home. Currently, there is a mountain bike “shuttle” culture that uses bus route 145 as transportation back to the top of the mountain after descending by bike. This is substantiated with the bus bike rack activation data provided by TransLink, which shows weekend usages as three times greater than usage during the week. Akin to the lift facilities in the mountain bike park in Whistler or the tram on Grouse Mountain, a gondola on Burnaby Mountain offers great potential to capture a significant recreational ridership. Specific to mountain bikers, consideration would be necessary to limit bike transport during peak hours as well as to include a program for cleaning the cabins. A waiver system protecting TransLink from liability associated with injury should also be considered. Whether transit ridership increases because of commuter comfort or through the development of a tourism and recreation industry, this increased ridership could play significantly into the overall economic feasibility of a gondola.
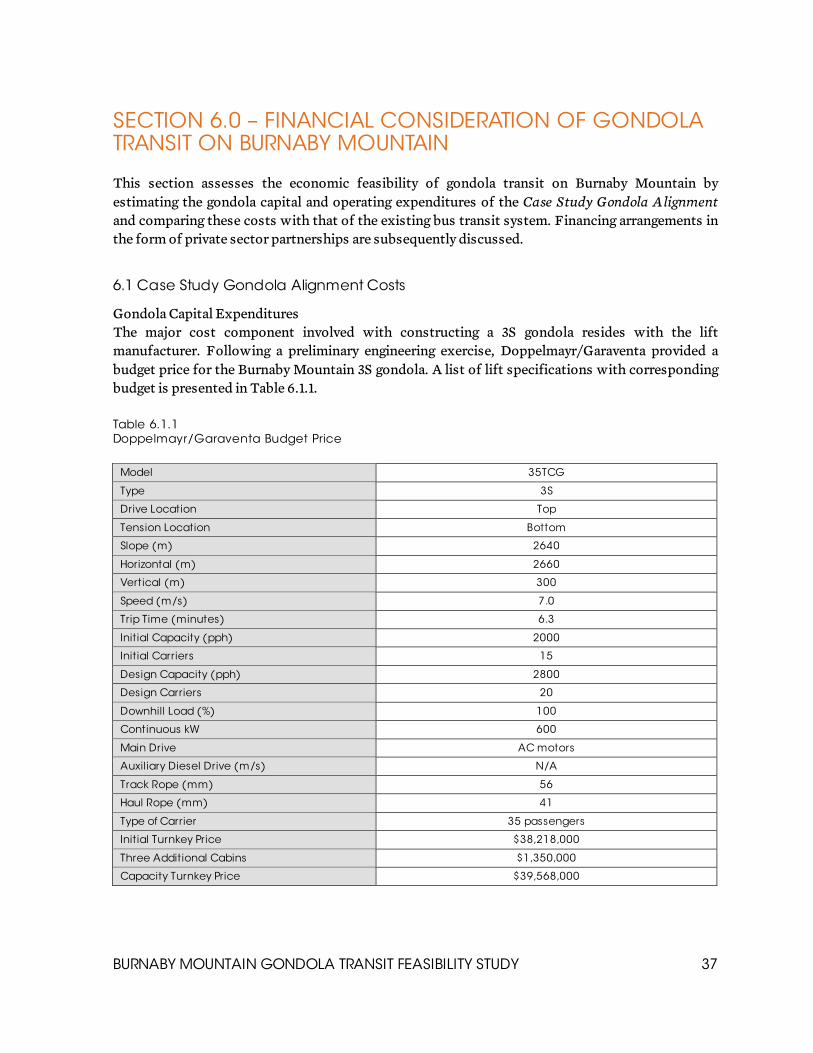
BURNABY MOUNTAIN GONDOLA TRANSIT FEASIBILITY STUDY 37
SECTION 6.0 – FINANCIAL CONSIDERATION OF GONDOLA TRANSIT ON BURNABY MOUNTAIN This section assesses the economic feasibility of gondola transit on Burnaby Mountain by estimating the gondola capital and operating expenditures of the Case Study Gondola Alignment and comparing these costs with that of the existing bus transit system. Financing arrangements in the form of private sector partnerships are subsequently discussed.
6.1 Case Study Gondola Alignment Costs
Gondola Capital Expenditures The major cost component involved with constructing a 3S gondola resides with the lift manufacturer. Following a preliminary engineering exercise, Doppelmayr/Garaventa provided a budget price for the Burnaby Mountain 3S gondola. A list of lift specifications with corresponding budget is presented in Table 6.1.1. Table 6.1.1 Doppelmayr/Garaventa Budget Price
Model 35TCG
Type 3S
Drive Location Top
Tension Location Bottom
Slope (m) 2640
Horizontal (m) 2660
Vertical (m) 300
Speed (m/s) 7.0
Trip Time (minutes) 6.3
Initial Capacity (pph) 2000
Initial Carriers 15
Design Capacity (pph) 2800
Design Carriers 20
Downhill Load (%) 100
Continuous kW 600
Main Drive AC motors
Auxiliary Diesel Drive (m/s) N/A
Track Rope (mm) 56
Haul Rope (mm) 41
Type of Carrier 35 passengers
Initial Turnkey Price $38,218,000
Three Additional Cabins $1,350,000
Capacity Turnkey Price $39,568,000
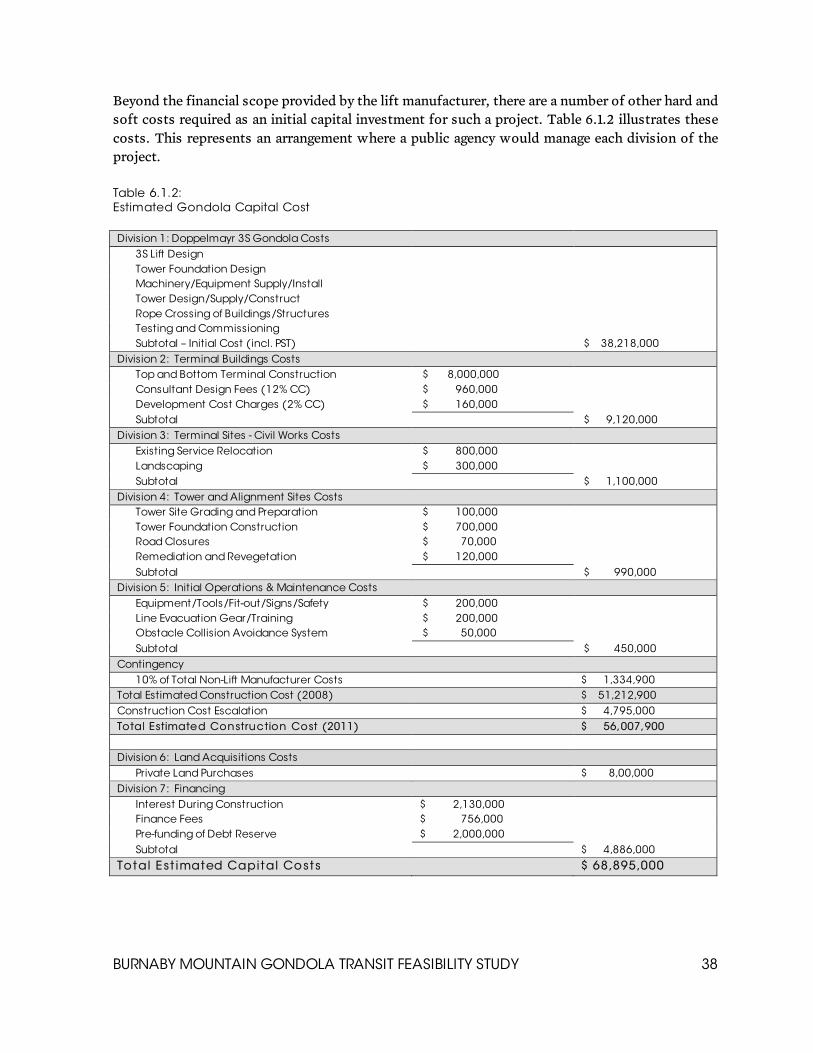
BURNABY MOUNTAIN GONDOLA TRANSIT FEASIBILITY STUDY 38
Beyond the financial scope provided by the lift manufacturer, there are a number of other hard and soft costs required as an initial capital investment for such a project. Table 6.1.2 illustrates these costs. This represents an arrangement where a public agency would manage each division of the project. Table 6.1.2: Estimated Gondola Capital Cost
Division 1: Doppelmayr 3S Gondola Costs
3S Lift Design
Tower Foundation Design
Machinery/Equipment Supply/Install
Tower Design/Supply/Construct
Rope Crossing of Buildings/Structures
Testing and Commissioning
Subtotal – Initial Cost (incl. PST) $ 38,218,000
Division 2: Terminal Buildings Costs
Top and Bottom Terminal Construction $ 8,000,000
Consultant Design Fees (12% CC) $ 960,000
Development Cost Charges (2% CC) $ 160,000
Subtotal $ 9,120,000
Division 3: Terminal Sites - Civil Works Costs
Existing Service Relocation $ 800,000
Landscaping $ 300,000
Subtotal $ 1,100,000
Division 4: Tower and Alignment Sites Costs
Tower Site Grading and Preparation $ 100,000
Tower Foundation Construction $ 700,000
Road Closures $ 70,000
Remediation and Revegetation $ 120,000
Subtotal $ 990,000
Division 5: Initial Operations & Maintenance Costs
Equipment/Tools/Fit-out/Signs/Safety $ 200,000
Line Evacuation Gear/Training $ 200,000
Obstacle Collision Avoidance System $ 50,000
Subtotal $ 450,000
Contingency
10% of Total Non-Lift Manufacturer Costs $ 1,334,900
Total Estimated Construction Cost (2008) $ 51,212,900
Construction Cost Escalation $ 4,795,000
Total Estimated Construction Cost (2011) $ 56,007,900
Division 6: Land Acquisitions Costs
Private Land Purchases $ 8,00,000
Division 7: Financing
Interest During Construction $ 2,130,000
Finance Fees $ 756,000
Pre-funding of Debt Reserve $ 2,000,000
Subtotal $ 4,886,000
To tal E st imated Capi tal Cost s $ 68,895,000
BURNABY MOUNTAIN GONDOLA TRANSIT FEASIBILITY STUDY 39
In the cost arrangement presented above, Doppelmayr or another lift manufacturer would be a subcontractor to the managing public entity and would only be contractually responsible for scope and work associated in Division 1. This would include the elements listed in the table above and all technical work associated with pulling the steel ropes over the existing industrial and residential buildings along with the extent of the retained forest. All reasonable accommodation will be made to keep roads open and operating during the rope pulling. Impacts to existing industrial and residential development will also be kept to minimum. The Division 2 through 5 costs presented in Table 6.1.2 are estimates based on a best understanding of the project scope and site specific requirements for the Case Study Gondola Alignment. To gain further confidence in these estimates, it is essential that all stakeholders express their expectations for the system upfront in an attempt to avoid the cost creep that was seen with the Portland Tram. It is assumed that Divisions 2, 3 and 4 will be publicly tendered contracts and Division 5 will have the possibility of either being tendered or rolled into the scope of the lift manufacturer. A 10% contingency of the total non-Doppelmayr costs is included due to the preliminary nature of the information. It is understood that appropriate contingency for the lift manufacturer’s division is built into the preliminary estimate provided. Including an estimate for construction cost escalation yields a Total Estimated Construction Cost for the year 2011. By adding a cost for land acquisition and a series of financing cost, a Total Capital Cost of $68.9M is derived. Gondola Operational Expenditures and Cost Benefits The total estimated operation expenditures per year for a gondola on Burnaby Mountain are estimated at approximately $3.14M. This is consistent with reports that the three-terminal Telluride Gondola operates for $3.5M per year34 and the Portland Tram, operating 16 hours per day, costs $1.3M excluding consumables and major repairs32. This estimate can be broken down into five components, as follows. There are five main components that build the operational budget of the gondola: energy, salaries, maintenance, insurance and capital reserve. Each of these components is a function of the amount of time the gondola operates, and it is assumed that a gondola will match the current bus and SkyTrain schedules, operating an average of 20.5 hours a day, 7 days a week. All estimated costs that follow are in 2008 dollars. Energy cost This is based on consumption and demand. It is projected that the 3S gondola proposed would have a peak demand of 1000 kW, which is only required at the initial startup when cabins begin moving from a resting position. The ongoing consumption requirements to sustain motion are less, projected at 600 kW. This is due to the gondola’s ability to take advantage of the momentum gained by gravity pulling the descending cabins55. Adding 25% to 2008 BC Hydro Commercial Rates for over 35 kW56 to account for a recently estimate spike, this usage translates to approximately $405,000 per year. It should be noted that this is a conservative estimate, given that the gondola will actually be a net producer of energy at times. In cases when the volume of riders descending the

BURNABY MOUNTAIN GONDOLA TRANSIT FEASIBILITY STUDY 40
mountain is greater than the volume ascending, the benefit of gravity and the weight of the descending passengers will create enough force to pull the ascending cabins up the mountain and provide surplus energy. Automation Benefit One of the major cost benefits of a gondola system is automation, which reduces the number of operators and/or attendants needed, lessening salary expenditures. SkyTrain sees these same benefits. Two full-time employees would be required to staff each gondola terminal during the 20.5 hours of daily operation. By comparison, the Portland Tram has a pool of 13 employees with four working at any one time: an operations supervisor, a mechanic and two cabin attendants. It is also assumed that the average cost of these employees will be $50 per hour, slightly higher than the SkyTrain Attendant (STA) cost at $40.50 per hour9. The extra higher hourly rate accounts for a higher paid mechanic as one of the employees. This results in approximately $1.5M per year in salary expenses. Maintenance This is another considerable cost associated with the gondola operation, especially given the long hours of operation proposed for a Burnaby Mountain gondola. As explained by the General Manager of the Portland Tram, significant effort is invested in preventative maintenance. This is the rationale for staffing maintenance personnel at all times. Nonetheless, there is inevitably maintenance effort beyond which a single person can attend to during a regular shift. Analysis of maintenance costs for a number of aerial passenger ropeways at ski resorts indicate that maintenance generally ranges from $90 to $200 per hour of operations55. Given that this 3S gondola would be new state-of-the-art technology and would exist in a much more temperate climate in an easily accessible urban centre, it is assumed that the maintenance cost will be at the low end of this range, estimated at $125 per hour. Subtracting the hourly costs of the full-time maintenance staff accounted for in salaries, this yields $85 per hour for maintenance, or approximate $636,000 annually. Future Capital Expenditures For the purpose of this analysis, a $200,000 insurance cost has been included in the estimated yearly operating costs of the gondola. TransLink currently has over 1,600 vehicles insured with mandatory ICBC liability coverage at $9M per year, which translates to $5,625 per vehicle57. If the gondola substitutes for approximately 17 buses, this is equivalent to $95,626 in insurance costs. Assuming that a gondola may need to be more heavily insured because of the uniqueness of the system, doubling of the insurance costs results in the estimated $200,000. This translates to approximately 4% of the asset-based cost of the gondola. Given that a gondola is not a typical mode of transit, a comprehensive actuarial assessment of the system should be completed to weigh relative risks. The last component of the estimated operational budget is the accrual of a capital reserve fund for future capital expenditures. It is estimated that over a 25-year period $7M to $10M will be required for the replacement or improvements of major gondola components. Examples of such improvements include replacing or rebuilding: the gear box, sheave assemblies, cabin carriages and

BURNABY MOUNTAIN GONDOLA TRANSIT FEASIBILITY STUDY 41
grips, bullwheel bearings, cabins, track ropes and haul rope. Replacing sheave assemblies and cabin carriage will likely take place twice in a 25-year period, while the major cost items such as replacing cabins and track ropes would only occur once in that time. Using the larger estimate of $10M would be more conservative, accommodating for the purchase of additional cabins in order to increase capacity, and encompassing potential capital expenditures required for the terminals, including floor coverings, major painting, roof replacement, etc. Therefore, to accumulate $10M over 25 years a 4% capital cost accrual rate is required yielding $400,000 per year. It is estimated that no capital expenditures would be required for 8 to 10 years, ensuring that $3M to $4M would be accrued by that time to accommodate such an expense.
6.2 Gondola/Bus Financial Comparison
To assess the economic feasibility of a gondola serving Burnaby Mountain, it is necessary to compare future cash flows of the existing bus transit against a potential new gondola facility. Table 6.2.1 shows the cash flow for a gondola with all capital financing and operational expenditures required to build, operate and maintain the lift projected over a 30-year amortization horizon. Table 6.2.2 shows the cash flow for the bus transit system over the same timeline. In both cases, the analysis shows costs beginning to accrue in 2012, which assumes that the gondola construction is completed in 2011. Also included in this analysis and shown in the tables is a summary of the particular growth rates that were associated with the various components that construct the cash flow. Further explanation of the cash flow and rationale for the growth rates follow. Gondola Cash Flow The gondola analysis shows a series of financing and operational costs for the installation of a 2,000 pph 3S (tricable) gondola with a 30-year amortization. The terms of the financing payments are based on the 2011 capital cost of $68.9M being paid off over 30 years with an escalating interest loan. The total interest rate is 6% with an indexing rate of 3%. This means the first annual loan payment is at a rate of 3%, increasing by an indexing rate of 3% every year over the term of the loan. The benefit of a financing arrangement such as this is to “back-end load” the loan, making payments greater toward the end of the loan and less at the beginning. The gondola is a good candidate for this financing structure because the saving when compared to the bus services is much greater as time passes and ridership increases. All other major capital expenditures for the gondola would be paid for through the capital reserve fund that is included in the operational cash flow. There are five main components built into the annual operational expenditures as previously outlined in Section 6.1. The $3.14M annual cost for the gondola operation is expected to grow over time as a function of the different components that constitute the expense. A summary and rationale for the growth rates follow:
Electricity rates for the last 15 years were provided by BC Hydro. A 15-year cumulative annual growth rate (CAGR) of 1.86% was derived and is used as the future annual growth rate for hydro costs going forward.
The standardized annual increase in overhead costs or salary is 3%. This is a widely held industry norm and also the currently agreed increase between TransLink and the union (CUPE).
The salaries of the gondola operators are assumed to increase by this annual rate.

BURNABY MOUNTAIN GONDOLA TRANSIT FEASIBILITY STUDY 42
As with the cost of future capital expenditures, the annual maintenance costs are increased by a CPI equal to the 15-year CAGR of 2.5%, calculated with data from StatsCan.
The insurance costs are also assumed to grow at a CPI of 2.5% To match inflation and increase in costs of future capital expenditures, the capital reserve
fund is also expected to grow at the CPI of 2.5%
Table 6.2.1: Gondola Cash Flow Analysis
Bus Transit Cash Flow The capital expenditures allocated for bus transit in 2011 are derived from data provided by TransLink, which indicate the cost, number and average age of buses for each route. The capital expenditures beyond the initial bus allocations are for purchases of future buses, using an average bus life of 17 years51. Included in the capital expenditures is an allowance of $450,000 per bus for the cost of TransLink parking facilities. A 16% premium is also applied to the cost of each bus to account for reserve buses that are required during breakdown or maintenance periods9. Both of these additional capital expenditures were provided by TransLink. The annual financing costs for
BURNABY MOUNTAIN GONDOLA TRANSIT FEASIBILITY STUDY 43
the bus capital is determined by discounting 30 years of capital costs to a net present value and amortizing that value evenly over the same 30 years. This methodology assumes that these particular buses are among a much larger pool of capital assets that TransLink finances through one large debt payment. As shown in the table, an interest rate of 6% is used for this financing with a 3.5% rate used when the affected buses produce a surplus balance (i.e., no new buses are required in a particular year, but an associated financing payment is made). Given that the total operational expenditures for bus service are ultimately a function of the gross service hours required to meet the demand, it is necessary to understand the magnitude of bus operating hours that will be reduced with a gondola. In 2008, the articulated diesel buses serving route 145 were in operation for 31,304 service hours. For this analysis, this will be reduced to zero demand with a gondola. Route 144 is expected to be truncated at Hastings and Duthie, resulting in a 24% reduction in route length. This translates to the reduction of 9,079 hours using 2008 operation data. Lastly, route 143 is expected to continue operation until 2014 when it will be shortened to a shuttle service between the Burquitlam Evergreen Line station and the SFU Transit Loop. In the event of a gondola, the service of this shortened 143 route can also be significantly reduced, saving 10,234 hours of bus service. This reduction is predicted with an understanding that the new 143 route will have approximately the same travel time and distance as the 145, but only one-third of the riders. It is seen in Table 6.2.2 that the new 143 does not start accruing cost until 2014 when the Evergreen Line is operational. For the purpose of predicting the operational expenditures for the buses, it is also necessary to estimate a reasonable change in these service hours over the analysis timeline. As calculated in Appendix A, a maximum ridership projection estimates a 80.1% increase in total inbound trips from current levels and a minimum projection shows 28.3% increase by the OCP horizon of 2030. For this analysis, a “benchmark case” of 54.2%, halfway between the maximum and minimum projections, is assumed for a growth estimate by 2030. This yields a 1.97% annual growth rate, which is applied to the operating hours of the buses in Table 6.2.2 and is continued through the entire 30-year analysis period. There are four components associated with growth rates that build the hourly rate of operating a bus. Fuel, maintenance, salaries and insurance constitute 17%, 14%, 67% and 2% of the bus operational costs, respectively. Contrary to the model used for the gondola, an annual capital reserve fund for the buses is not built into the operational expenses; it is associated with the capital expenditures as stated above. The growth rates used for each operational cost component are as follows:
As indicated in Section 2, the current and future buses serving Burnaby Mountain will be powered by diesel fuel. The 25-year cumulative annual growth rate (CAGR) taken from Resources Canada yields a 6.34% annual increase in fuel cost. This same growth rate is used in this analysis.
As with the gondola maintenance, a 15-year Consumer Price Index (CPI) CAGR from StatsCan of 2.5% is used to account for these cost increases.
A 3% growth rate is also expected for bus salaries, given industry standards and the current agreements with the union (CUPE).
Insurance growth is tied to the CPI for this analysis.

BURNABY MOUNTAIN GONDOLA TRANSIT FEASIBILITY STUDY 44
Table 6.2.2 Bus Transit Cash Flow Savings Analysis

BURNABY MOUNTAIN GONDOLA TRANSIT FEASIBILITY STUDY 45
Included in the operational expenditures of these buses is also a “mountainous terrain” factor yielding of 10%, which provides a premium for the fuel consumption and maintenance rates. This factor was provided by TransLink to account for the added fuel and maintenance costs associated with the difficult Burnaby Mountain terrain. Gondola/Bus Cash Flow Comparison As explained above, the financing for the gondola can be “back-end loaded” with payments that are less at the start and more at the end of the 30-year term. When combined with the operational costs, this loan structure produces annual payments less than that of the bus service. Table 6.2.1 shows these annual savings by the gondola. Also shown in Table 6.2.1 and 6.2.2, the cumulative cost over 30 years for the gondola and bus service equal $328M and $499M, respectively. In 2011 net present value terms, using a nominal discount rate of 6%9 typically used by TransLink, these costs yield $133M and $187M, respectively for a difference of $54M. The gondola is a better value for money. Sensitivity Analysis The analyses above are performed with sound assumptions on ridership and a reasonable set of economic predictions based on historic trends. Nevertheless, it is still prudent to perform a sensitivity analysis, inserting alternatives for the major assumptions in order to gain a broader perspective of the economic feasibility of the gondola. The benchmark analysis above assumes that the ridership volumes and service hours grow at a steady rate of 1.97% annually to 2030 and continue at the same rate to the year 2041, the upper end of the analysis timeline. For the purpose of a sensitivity analysis, two additional ridership cases are considered. A minimum projection case assumes a 1.14% annual growth to inbound ridership on Burnaby Mountain with any outbound growth in ridership served by existing capacity. Alternatively, a maximum projection assumes a 2.71% annual growth rate in ridership and, consequently, service hours. These minimum and maximum ridership growth projections were modelled similar to the benchmark growth projection in order to understand the effect on the savings over a gondola. Along with ridership, three other assumptions were tested in the sensitivity analysis: the CPI rate, the diesel fuel growth rate and the salary growth rate. Specifically, two alternative CPI rates were used in addition to the 2.5% benchmark rate: 1.9% and 4.1%. These other rates are CAGRs derived from different extents of historical data. Given the volatile nature of fuel prices, three different growth rates were also used for the diesel fuel prices: 3%, 6.34% and 8.5%. Lastly, rates of 3% and 4% were used in the sensitivity analysis for potential annual salary growth. There is a high level of confidence with the original 3% prediction; however, given that salaries are a large portion of the operating budgets for both the buses and gondolas, an alternative rate of 4% was included. It should be noted that alternative hydro growth rates were not incorporated in the sensitivity analysis. At 13% of the gondola operating budget and fairly consistent historical trends, hydro fluctuation has the least affect of all the variables on the breakeven horizon. Furthermore, for hydro to have any significant effect there would have to be extremely low corresponding diesel fuel cost growth. As both are energy-based variables, this is deemed unlikely. Table 6.2.3 presents a sensitivity matrix indicating the difference in Net Present Value between a gondola and existing bus service. In all cases, the gondola NPV is less than the bus NPV. With each of the three ridership cases, a different financing structure was used: a straight-line 6% amortization

BURNABY MOUNTAIN GONDOLA TRANSIT FEASIBILITY STUDY 46
with the maximum projection and a 6% base interest rate with 3% and 5% indexing rates with the base and minimum projections, respectively. A higher indexing rate was required with the minimum ridership projections to ensure that the gondola costs would be lower than the bus service from year one. As can be seen in the table, even with this lowest ridership projection together with the least favourable growth rates, the gondola still has a $15M NPV benefit over the bus service, while still costing less from year one. Given a maximum ridership occurrence and certain growth rates, this benefit could become as large at $141M in NPV terms. Table 6.2.3: Sensitivity Analysis – 2011 Net Present Value Benefit of Gondola vs. Bus Service (million dollars)
Diesel Fuel Cost Growth
3% Diesel Fuel Cost Growth
6.34% Diesel Fuel Cost Growth
8.5% Salary
Growth 3%
Salary Growth
4%
Salary Growth
3%
Salary Growth
4%
Salary Growth
3%
Salary Growth 4%
CPIa
4.1% 83 100 102 119 124 141
CPI 2.5%
80 96 99 115 121 137
Maximum Ridership Projection (2.71% annual growth) (6% straight-line amortization)
CPI 1.9%
78 95 97 114 114 136
CPI 4.1%
39 50 54 66 72 85
CPI 2.5%
38 50 54
Benchmark 66 72 85
Benchmark Ridership Projection (1.97% annual growth) (6% straight-line amortization)
CPI 1.9%
38 49 54 66 72 84
CPI 4.1%
16 26 29 39 44 55
CPI 2.5%
15 25 28 39 43 54
Minimum Ridership Projection (1.14% annual growth) (6% base interest, 5% indexing rate)
CPI 1.9%
15 25 28 38 43 53
a Consumer Price Indexes based on 15, 20 and 30 year CAGR for the 1.9%, 2.5% and 4.1% values,
respectively. Data from StatsCan b Diesel Fuel Cost Growth of 6.34% based on 15 year CAGR from Natural Resources Canada. 3% and 8.5% arbitrary lower and upper limits
It should be noted that an economic impact that is not factored into this analysis is possible positive effects to the revenue stream due to increased ridership. As explained in Section 5, there are a number of social and community impacts that could increase ridership and ultimately revenue for the operating agency. The Portland Tram is an example where actual ridership has exceeded all preliminary estimates. There are also indirect savings resulting from reduced road maintenance not included in the cash flow analysis. In both cases, these effects would reduce the breakeven horizon, so it is conservative to leave out these effects.
BURNABY MOUNTAIN GONDOLA TRANSIT FEASIBILITY STUDY 47
6.3 Public-Private Arrangements
Pros and Cons
The economic models presented above are based on a public sector project management and financing arrangement. In those cases, a public agency would be responsible for managing all components of the gondola design and construction as well as arranging the operation upon completion and the financing throughout. Alternatively, a possible arrangement is a Design/Build/Operate/Finance (DBOF) or Public Private Partnerships (P3) structure that has gained wide appeal across Canada and especially in BC. The Canada Line and Golden Ears Bridge transportation projects are among the highest profile local examples of these arrangements. Extensive information on the P3 arrangements can be found through Partnership BC, a provincial company responsible for bringing together private sector and public entities for partnering on significant infrastructure projects. According to Partnership BC58, a major benefit of P3 projects is the increased private sector efficiencies that often result in shorter design and construction periods and increased innovation. Furthermore, P3 projects reduce overall financial risk for the public entities and avoid requirement for large capital expenditures, as the arrangements are long term with predetermined annual service payments. Even with the many benefits of P3 arrangements, the elements of this gondola project make it difficult to be implemented as a conventional competitive selection P3. With only Doppelmayr/Garaventa or Leitner-Poma able to design and build the type of lift required, the opportunities for private sector partnerships are limited. The overall dollar magnitude of the project is also small for a P3 at $68.9M with approximately 50% of the total capital expenditures being requirements of the specialty lift manufacturer. As a result, a wide-ranging competitive selection process is unlikely, as the project components not associated with the lift technology are small. This leaves little opportunity for a typical private partner to develop the innovation and value engineering needed to reduce their costs, achieve a desirable return and provide a cost-efficient project to the public entity. As a result, a DBOF or P3 arrangement is likely only reasonable with one of the two lift manufacturers. Upon receipt of the financial proposal from the private sector entity, it is appropriate to compare the proposed schedule of payments with the public sector analysis in Table 6.2.1 for the gondola. Compared to the public sector analysis, the private sector costs will factor in a profit margin that will likely result in higher overall project cost. However, with a risk analysis of the potential volatilities of a public sector arrangement, a private sector arrangement might be deemed appropriate. For example, according to the Canada Line Final Project Report of April 2006, the Public Sector Comparator analysis showed a 95th percentile project cost that was 15% greater than the middle ground (50th percentile) project cost. In comparison, the P3 arrangement limited the 95th percentile cost risk to just 5% above the middle ground (50th percentile) project cost. As a result of the P3 arrangement proved to be best, due to the limited risk exposure.
BURNABY MOUNTAIN GONDOLA TRANSIT FEASIBILITY STUDY 48
SECTION 7.0 – CONCLUSIONS
This section summarizes the findings outlined in previous sections and provides conclusions with a triple bottom line assessment. Recommendations for further considerations are also presented with a brief discussed on project schedule possibilities.
7.1 Triple Bottom Line Assessment
The purpose of a triple bottom line value system is to equally weight the social, environmental and economic dimensions of a decision – following principles that ensure equality for people, planet and profit. Throughout this report, each dimension of the triple bottom line has been discussed and evaluated in detail. A summary and assessment follows: Social: Excellent The social component of the triple bottom line is often the most contentious due to the human element. Nonetheless, when broadly considering the social impact of a gondola on Burnaby Mountain, the benefits are excellent. Tens of thousands of people would benefit from this gondola every day. By reducing the travel time significantly and increasing ridership comfort, this transit solution is much more socially beneficial compared to the existing bus transit system. Regarding long-term policy vision, a gondola meets or exceeds all aspects of a desired transportation system. Therefore, from the social perspective, development of this gondola is very positive. Environmental: Excellent in Light of Alternatives It has been shown that a gondola on Burnaby Mountain can be installed with limited to no long-term environmental impact, given the unique abilities of lift construction. Therefore, the reduction in GHG emissions that will occur with the significant saving in bus operational hours is the only environmental legacy of such a lift. Following the transportation hierarchy, incorporating this mode of transportation would be a major step in national and global campaigns to reduce carbon footprint. With relatively low potential impact to the local conservation area, major GHG reductions, and the promotion of an environmentally sustainable transit mode, the conclusion to this assessment is clear. The environmental benefits of this gondola, when compared to the alternatives, are excellent. Economic: Very Reasonable Compared to Other Infrastructure Costs As seen in Section 6, there are many variables that determine the economic performance of a gondola in this particular application. There are also several unknowns such as the required land acquisitions and future of the SFU Transit Loop. Nonetheless, assuming that the predictions are sound, a Net Present Value savings of $54M over 30 years is a great benefit. The economic benefit of this gondola, given the current information, is very good.
BURNABY MOUNTAIN GONDOLA TRANSIT FEASIBILITY STUDY 49
In conclusion, the triple bottom line assessment of this gondola on Burnaby Mountain is very good overall. There are excellent benefits relating to social and environmental aspects and the current assessment of the economic impact is very promising.
7.2 Recommendations
This report has investigated and determined the feasibility of a gondola on Burnaby Mountain to the broadest extent possible, given the scope of the study; however, there are four main recommendations that will lead to a better understanding of a gondola’s feasibility: 1. A comprehensive community and stakeholder consultation should be undertaken prior to any decision regarding the proposed Burnaby Mountain Gondola Transit Project. Should the Project go ahead, further consultation should seek input from the community and stakeholders regarding the design and construction of the gondola. This consultation would be undertaken in addition to requirements for various approval processes. 2. Engage an architect and planner to specifically study solutions for the Bottom Terminal. A Bottom Terminal adjacent to the Production Way SkyTrain Station may impede functions around the station. Further study could provide alternative solutions solving functional issues related to the Terminal location. 3. Lift manufacturers should be consulted regarding detailed technical requirements and potential financial arrangements. Further assessment of the technical aspects could provide more information about the cost assumptions and lead to a better understanding of the financial impacts. Discussions regarding Private Public Partnership agreements would also provide a deeper understanding of the procurement and financing options.
7.3 Schedule
Operational by the end of 2011
If the recommendations stated above were initiated and each returned favourable results, further steps toward the gondola construction could then be taken. With general acceptance of a gondola system during the 2009 calendar year, it is predicted that all of the land ownership and entitlement requirement could be attained within 18 months – the end of 2010. Correspondingly, if the lift, tower and terminal building designs began in late 2009, it is likely that the design could be completed within a year, by late 2010. Following an adequate period for design, it is predicted that the gondola could be open for operation by the end of 2011 after a 12-month construction schedule.
BURNABY MOUNTAIN GONDOLA TRANSIT FEASIBILITY STUDY 50
REFERENCES
1. http://www.sfu.ca/aq/archives/april02/history.html 2. http://en.wikipedia.org/wiki/Simon_Fraser_University 3. Simon Fraser University Travel Count Program, MMM Group, September 2007 4. www.translink.bc.ca 5. Simon Fraser Community Trust - UniverCity population statistics, Personal Conversation,
2008 6. Transport 2040 Document - Draft, TransLink, June 2008. Note: Another 12% of the
commuting trips to the downtown occur from walking. 7. TransLink SFU Sept-Nov 2007.xls, Data provided by TransLink 8. Bus hours & km for SFU routes Jan 2008-1.xls, Data provided by TransLink 9. Information provided by TransLink Planning Department, 2008 10. Simon Fraser University Student Housing Size and Type of Offerings, SFU Memo, July
2008 11. SFU Official Community Plan, Adopted 1996, Amended 2002, City of Burnaby 12. UniverCity Resident Survey, Mustel Group Market Research, June 2007 13. http://vancouver.ca/engsvcs/transport/plan/1997report/index.htm 14. http://www.trek.ubc.ca/research/stp/index.html 15. Litman, T.A. (2008) http://www.vtpi.org/tranben.pdf 16. http://www.infoniagara.com/attractions/aero.html 17. http://www.uprr.com/newsinfo/releases/heritage_and_steam/2006/0228_skilift.shtml 18. http://www.telluride.com/telluride/the-gondola.html 19. http://www.skinet.com/article.jsp?ID=1000040435 20. http://www.livetremblant.com/en/news.events/news.asp 21. Ogden Urban Gondola/Tram Comparison 22. Wir Magazine for Customers and Employees, Doppelmayr CTEC, June 2008, No 175 23. http://en.wikipedia.org/wiki/Roosevelt_Island_Tramway 24. http://www.nytimes.com/2006/08/25/nyregion/25tram.html?fta=y 25. http://www.anjabergau.de/images/USA/NY/01_-_Roosevelt_Island_Tram.JPG 26. http://www.poma.net/english/actualite/info/info13/info13.pdf 27. http://www.panoramio.com/photos/original/2196247.jpg (columbia photo) 28. http://www.portlandtram.org/ 29. Image courtesy of Doppelmayr, 2008 30. Re-introducing Air Trams, CUI Steven Dale, Draft June 2008 31. General Comparison Funitel – 3S System – 2 - S System, Doppelmayr, August 2003 32. Warren Sparks, Doppelmayr, Personal Conversation, 2008 33. http://en.wikipedia.org/wiki/Funitel 34. http://www.tmvoa.org/Gondola~153469~15003.htm 35. http://www.whistlerblackcomb.com 36. http://www.republic-news.org/archive/183-repub/183_letters.html 37. Statistic provided by Doppelmayr, August 2008 38. http://www.peak2peakgondola.com/news/?p=59 39. Ian Graham, SkyTrain Planning, Personal Conversation, August 2008 40. http://www.whistlerforthedisabled.com/whistlerblackcomb.htm 41. TransLink SFU Sep-Nov 2007.xls, Data provided by TransLink 42. Metro Vancouver Temporal Distribution Transit Model, Data provided by TransLink

BURNABY MOUNTAIN GONDOLA TRANSIT FEASIBILITY STUDY 51
43. Drawings provided by TransLink 44. Image provided by Bryce Tupper 45. Laurenson, Barb Transportation Demand Management Planning Principles
www.nelsonnygaard.com/articles/article_tdm.htm 46. Burnaby Mountain Conservation Area Management Plan, AXYS Environmental, 1999 47. Green and Klinka, 1999 48. FISS, 2008 49. Greenhouse Gas Report, BC Hydro, 2004 50. Yearly Bus hours & km for SFU routes Jan 2008-2.xls, Data provided by TransLink 51. 2009 Bus Procurement Matrix - Board (Final - Apr 7).xls, Data provided by TransLink 52. Projection based on average 18,000 km/year and 280gGHG/km 53. http://www.city.burnaby.bc.ca/__shared/assets/Subdivision_Approval_Guide4098.pdf,
City of Burnaby 54. Zoning Bylaw, City of Burnaby 55 Whistler Blackcomb Personnel, Personal Conversation, 2008 56 http://www.bchydro.com/policies/rates/rates759.html 57 Paul Barlow, TransLink Risk Management, Personal Conversation, August 2008 58 http://www.partnershipsbc.ca/ 59 RIC, 1995 60 MSRM, 2002

BURNABY MOUNTAIN GONDOLA TRANSIT FEASIBILITY STUDY
52
APPENDIX A – RIDERSHIP ANALYSIS
Population Projections
Given the significant population shift and change in land use that is predicted for Burnaby Mountain, it is necessary to analyze the inbound (to mountain) and outbound (from mountain) trips separately. Furthermore, given that the current OCP population projections could change, it is also prudent to consider other reasonable future populations that deviate from the OCP. Tables A-1 and A-2 show minimum and maximum transit ridership for both inbound and outbound directions as a result of different population projections for Burnaby Mountain. Instinctively, it can be reasoned that a condition with the largest population of mountain residents, through a combination of dormitory beds and UniverCity units, would yield the fewest inbound commuters. Conversely, the fewer the number of mountain residents, the larger the pool of potential commuters that would be required to travel inbound to the mountain. Table A-1: Inbound Commuter Projections
Burnaby Mountain Population
SFU Staff/FTE
Student Bed Units
UniverCity UniverCity SFU
Affiliates Potential
Commuters % Growth from
2007
2007 20,109 1,768 2,200 33% 726 17,615
Minimum Ridership Case
29,375 5,600 10,000 33% 3,300 20,475a 16%
Maximum Ridership Case
29,375 3,061 10,000 20% 2,000 24,314b 38%
a=29375-5600-3300 b=29375-3061-2000

BURNABY MOUNTAIN GONDOLA TRANSIT FEASIBILITY STUDY 53
Table A-2: Outbound Commuter Projections
Burnaby Mountain Population
SFU
Staff/FTE Student
Bed Units UniverCity
UniverCity SFU Affiliates
Potential Commuters
% Growth from 2007
2007 20,109 1,768 2,200 33% 726 1474
Minimum Ridership Case
29,375 3,061 10,000 33% 3,300 6,700c 355%
Maximum Ridership Case
29.375 5,600 17,500 20% 3,500 14,000d 850%
c=10000-3300 d=17500-3500
Specifically in this analysis, the largest bed count number is taken from the SFU OCP as stated in Table 2.3.1 and smallest bed count value is taken from a SFU Housing Memo, which outlines that 3,061 bed units is the inventory after the currently planned dormitory construction is completed. The UniverCity population projection of 10,000 is taken from the SFU OCP and the projection of 17,500 for the maximum outbound case is an extreme upper limit provided by SFUCT. The 2007 UniverCity affiliation percentage was determined from a UniverCity Resident Survey by the Mustel Group in June 2007 indicating that one-third of the population is currently associated with SFU as either a student or as staff. The minimum ridership cases assume that the 2007 affiliation proportion would stay constant and the maximum ridership cases assume that this proportion would reduce to one-fifth (as per SFCUT) of the UniverCity population. The resulting population analysis indicates that, with a slight growth in student and staff population, and assuming the OCP projected bed unit number is reached, the overall pool of Inbound commuters to SFU will grow slightly. At the same time, the analysis also shows that the increased UniverCity population will add many more outbound commuters. This will provide a good counter-balance to the inbound student population, resulting in much better efficiencies for mountain transit as a whole.
Transportation Mode Shift In addition to the effects driven by population changes, transit loads are affected by behavioural change that compels commuters to shift from one mode of transportation to another. As an example, the MMM Group reported in their 2007 Travel Count Study that since 2000, 14% to 30% (varying on time of day) of commuters to SFU and Burnaby Mountain shifted from travel in single-occupancy or high-occupancy private vehicles to transit. This significant behaviour change is attributed to the introduction of the Vancity U-pass in 2003, which made transit travel much more affordable for the student population of SFU3. Recent sharp rises in fuel prices and higher parking costs resulting from a reduced parking supply at SFU are also believed to have deterred travel via private vehicles and to have increased transit ridership3. The UniverCity community had an affordable Community Transit pass introduced in 2006, which is thought to have generated additional mode shift to transit12. Given that there was no corresponding change to bus routing,
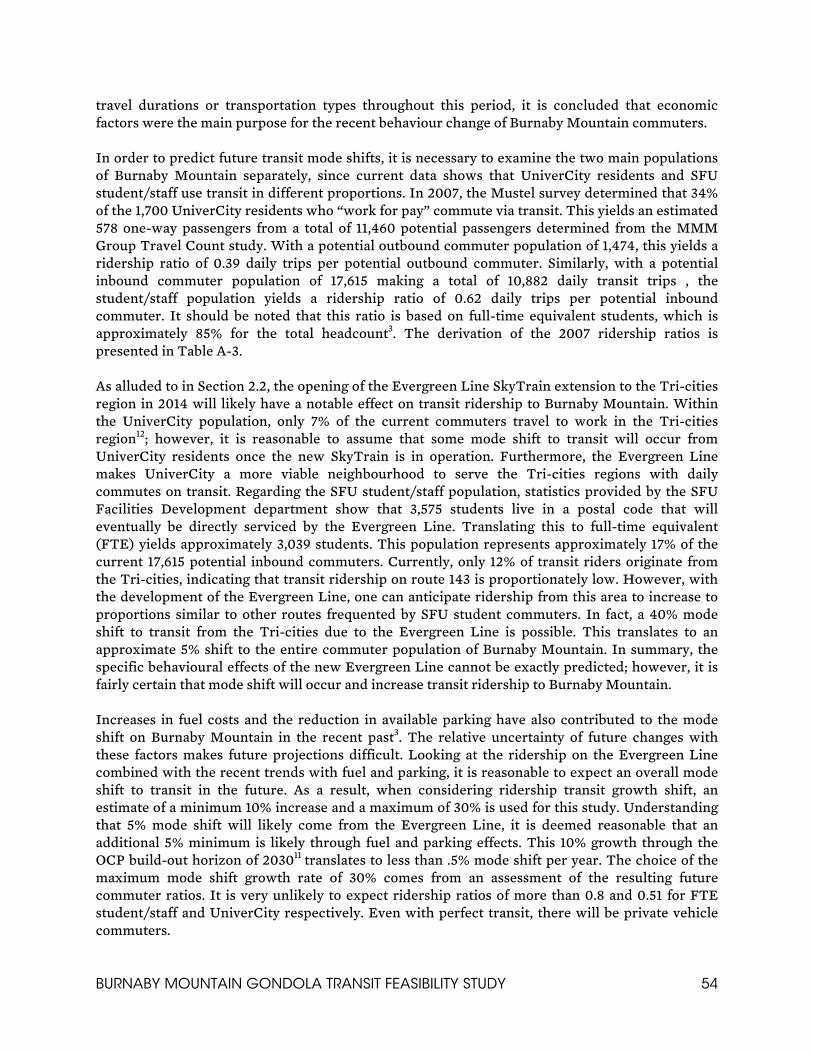
BURNABY MOUNTAIN GONDOLA TRANSIT FEASIBILITY STUDY 54
travel durations or transportation types throughout this period, it is concluded that economic factors were the main purpose for the recent behaviour change of Burnaby Mountain commuters. In order to predict future transit mode shifts, it is necessary to examine the two main populations of Burnaby Mountain separately, since current data shows that UniverCity residents and SFU student/staff use transit in different proportions. In 2007, the Mustel survey determined that 34% of the 1,700 UniverCity residents who “work for pay” commute via transit. This yields an estimated 578 one-way passengers from a total of 11,460 potential passengers determined from the MMM Group Travel Count study. With a potential outbound commuter population of 1,474, this yields a ridership ratio of 0.39 daily trips per potential outbound commuter. Similarly, with a potential inbound commuter population of 17,615 making a total of 10,882 daily transit trips , the student/staff population yields a ridership ratio of 0.62 daily trips per potential inbound commuter. It should be noted that this ratio is based on full-time equivalent students, which is approximately 85% for the total headcount3. The derivation of the 2007 ridership ratios is presented in Table A-3. As alluded to in Section 2.2, the opening of the Evergreen Line SkyTrain extension to the Tri-cities region in 2014 will likely have a notable effect on transit ridership to Burnaby Mountain. Within the UniverCity population, only 7% of the current commuters travel to work in the Tri-cities region12; however, it is reasonable to assume that some mode shift to transit will occur from UniverCity residents once the new SkyTrain is in operation. Furthermore, the Evergreen Line makes UniverCity a more viable neighbourhood to serve the Tri-cities regions with daily commutes on transit. Regarding the SFU student/staff population, statistics provided by the SFU Facilities Development department show that 3,575 students live in a postal code that will eventually be directly serviced by the Evergreen Line. Translating this to full-time equivalent (FTE) yields approximately 3,039 students. This population represents approximately 17% of the current 17,615 potential inbound commuters. Currently, only 12% of transit riders originate from the Tri-cities, indicating that transit ridership on route 143 is proportionately low. However, with the development of the Evergreen Line, one can anticipate ridership from this area to increase to proportions similar to other routes frequented by SFU student commuters. In fact, a 40% mode shift to transit from the Tri-cities due to the Evergreen Line is possible. This translates to an approximate 5% shift to the entire commuter population of Burnaby Mountain. In summary, the specific behavioural effects of the new Evergreen Line cannot be exactly predicted; however, it is fairly certain that mode shift will occur and increase transit ridership to Burnaby Mountain. Increases in fuel costs and the reduction in available parking have also contributed to the mode shift on Burnaby Mountain in the recent past3. The relative uncertainty of future changes with these factors makes future projections difficult. Looking at the ridership on the Evergreen Line combined with the recent trends with fuel and parking, it is reasonable to expect an overall mode shift to transit in the future. As a result, when considering ridership transit growth shift, an estimate of a minimum 10% increase and a maximum of 30% is used for this study. Understanding that 5% mode shift will likely come from the Evergreen Line, it is deemed reasonable that an additional 5% minimum is likely through fuel and parking effects. This 10% growth through the OCP build-out horizon of 203011 translates to less than .5% mode shift per year. The choice of the maximum mode shift growth rate of 30% comes from an assessment of the resulting future commuter ratios. It is very unlikely to expect ridership ratios of more than 0.8 and 0.51 for FTE student/staff and UniverCity respectively. Even with perfect transit, there will be private vehicle commuters.
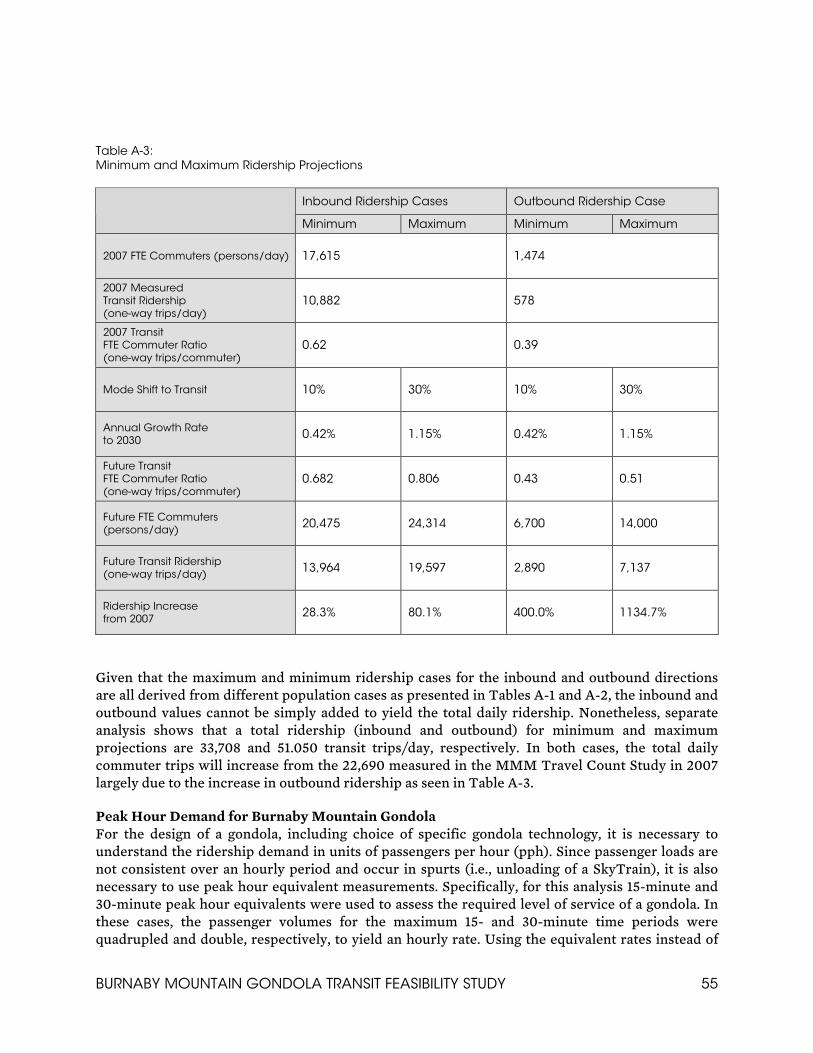
BURNABY MOUNTAIN GONDOLA TRANSIT FEASIBILITY STUDY 55
Table A-3: Minimum and Maximum Ridership Projections
Inbound Ridership Cases Outbound Ridership Case
Minimum Maximum Minimum Maximum
2007 FTE Commuters (persons/day) 17,615 1,474
2007 Measured Transit Ridership (one-way trips/day)
10,882 578
2007 Transit FTE Commuter Ratio (one-way trips/commuter)
0.62 0.39
Mode Shift to Transit 10% 30% 10% 30%
Annual Growth Rate to 2030
0.42% 1.15% 0.42% 1.15%
Future Transit FTE Commuter Ratio (one-way trips/commuter)
0.682 0.806 0.43 0.51
Future FTE Commuters (persons/day)
20,475 24,314 6,700 14,000
Future Transit Ridership (one-way trips/day)
13,964 19,597 2,890 7,137
Ridership Increase from 2007
28.3% 80.1% 400.0% 1134.7%
Given that the maximum and minimum ridership cases for the inbound and outbound directions are all derived from different population cases as presented in Tables A-1 and A-2, the inbound and outbound values cannot be simply added to yield the total daily ridership. Nonetheless, separate analysis shows that a total ridership (inbound and outbound) for minimum and maximum projections are 33,708 and 51.050 transit trips/day, respectively. In both cases, the total daily commuter trips will increase from the 22,690 measured in the MMM Travel Count Study in 2007 largely due to the increase in outbound ridership as seen in Table A-3.
Peak Hour Demand for Burnaby Mountain Gondola For the design of a gondola, including choice of specific gondola technology, it is necessary to understand the ridership demand in units of passengers per hour (pph). Since passenger loads are not consistent over an hourly period and occur in spurts (i.e., unloading of a SkyTrain), it is also necessary to use peak hour equivalent measurements. Specifically, for this analysis 15-minute and 30-minute peak hour equivalents were used to assess the required level of service of a gondola. In these cases, the passenger volumes for the maximum 15- and 30-minute time periods were quadrupled and double, respectively, to yield an hourly rate. Using the equivalent rates instead of

BURNABY MOUNTAIN GONDOLA TRANSIT FEASIBILITY STUDY 56
the actual maximum hourly rate reduces queues and ensures that a high level of service is maintained by the gondola. Table A-4: Peak Hour Ridership Projections
Inbound Ridership Cases
Outbound Ridership Case
Trip Ratio # Trips Trip Ratio # Trips
2007
Daily Transit Trips41 10,882 578
15 min Peak Hour Equivalent 0.192 2,089 0.163 94
30 min Peak Hour Equivalent 0.159 1,730 0.114 66
Minimum Future Projections
Daily Transit Ridership 13,964 2,890
15 min Peak Hour Equivalent 0.192 2,681 0.46 1,329
30 min Peak Hour Equivalent 0.159 2,220 0.42 1,214
Maximum Future Projections
Daily Transit Ridership 19,597 7,137
15 min Peak Hour Equivalent 0.192 3,762 0.46 3,283
30 min Peak Hour Equivalent 0.159 3,116 0.42 2,998
For instance, with 2007 trips counts provided by TransLink, 523 inbound trips occurring between 9:15 a.m. and 9:30 a.m. are allocated to the gondola, and 867 inbound trips between 9:15 a.m. and 9:45 a.m. These peak volumes were quadrupled and doubled respectively to derive the 15-minute and the 30-minute peak hour equivalent trips shown in Table A-4. These values were then divided by the total daily transit trips for each direction to yield a trip ratio. It should be noted, for both the inbound and outbound ridership cases, peak periods occur in the a.m. period. For the purpose of this analysis, the future ridership distribution for the inbound ridership is deemed proportional to the current distribution, as seen in Figure A-1. As a result, the 15-minute and 30-minute peak hour equivalent ratios of 0.192 and 0.159 respectively are held constant for both the minimum and maximum inbound cases. This is due to the large volume of riders and a consistent schedule of SFU classes (i.e., students would be commuting to future classes in the same patterns that they commute currently). Multiplying these ratios by the future number of daily transit trips derived in Table A-3 in turn yields the peak hour equivalent trips.
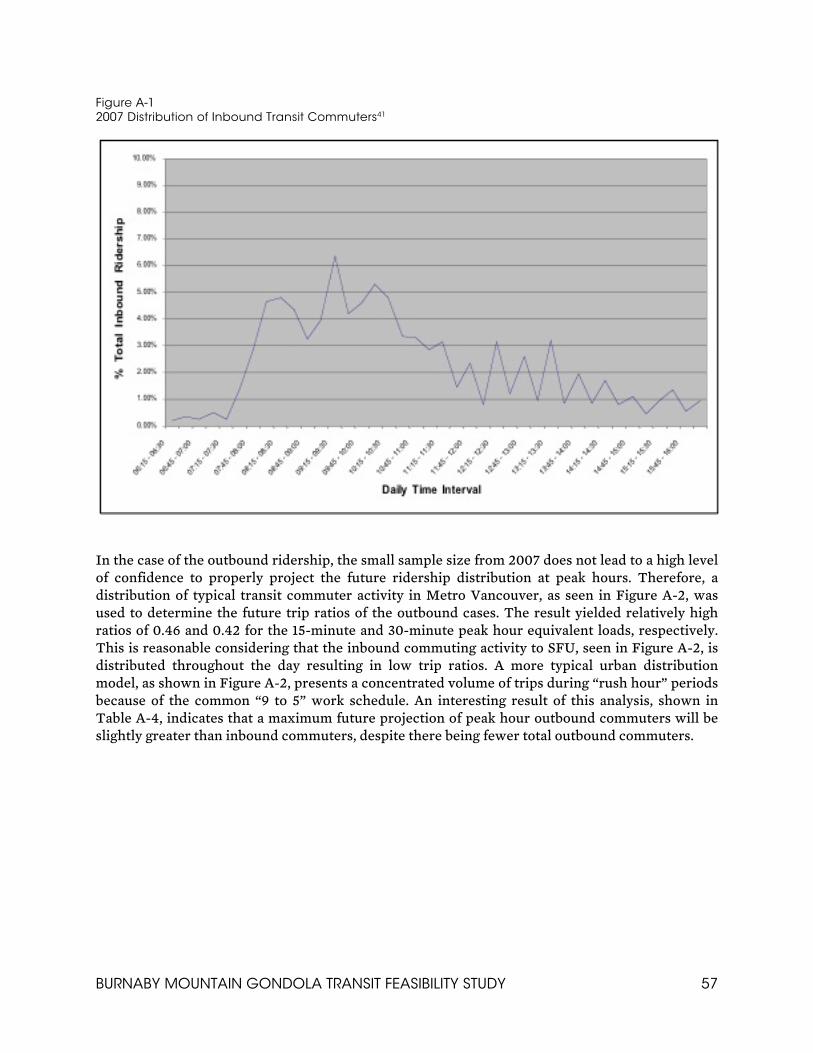
BURNABY MOUNTAIN GONDOLA TRANSIT FEASIBILITY STUDY 57
Figure A-1 2007 Distribution of Inbound Transit Commuters41
In the case of the outbound ridership, the small sample size from 2007 does not lead to a high level of confidence to properly project the future ridership distribution at peak hours. Therefore, a distribution of typical transit commuter activity in Metro Vancouver, as seen in Figure A-2, was used to determine the future trip ratios of the outbound cases. The result yielded relatively high ratios of 0.46 and 0.42 for the 15-minute and 30-minute peak hour equivalent loads, respectively. This is reasonable considering that the inbound commuting activity to SFU, seen in Figure A-2, is distributed throughout the day resulting in low trip ratios. A more typical urban distribution model, as shown in Figure A-2, presents a concentrated volume of trips during “rush hour” periods because of the common “9 to 5” work schedule. An interesting result of this analysis, shown in Table A-4, indicates that a maximum future projection of peak hour outbound commuters will be slightly greater than inbound commuters, despite there being fewer total outbound commuters.
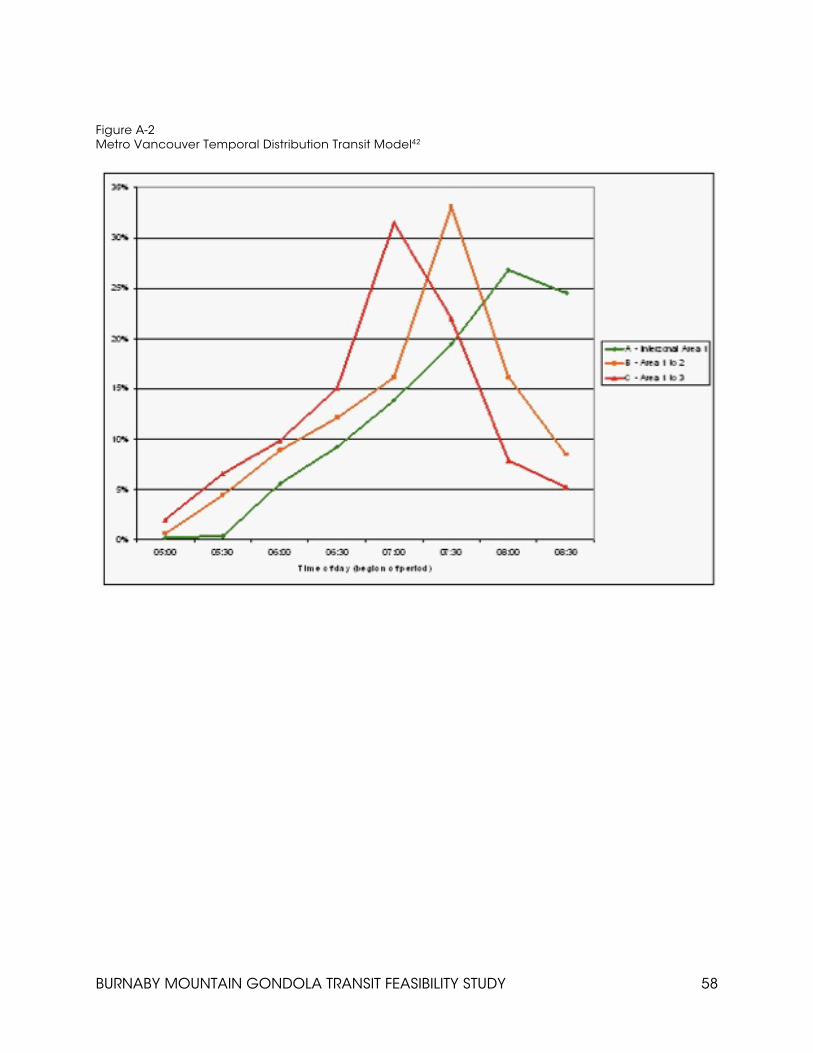
BURNABY MOUNTAIN GONDOLA TRANSIT FEASIBILITY STUDY 58
Figure A-2 Metro Vancouver Temporal Distribution Transit Model42

BURNABY MOUNTAIN GONDOLA TRANSIT FEASIBILITY STUDY 59
ACKNOWLEDGEMENTS
The author would like to first thank Gordon Harris and Simon Fraser Community Trust (SFUCT) for the opportunity to compile and complete this report. The leadership of SFUCT seen through investment into the study of innovative and sustainable technologies at UniverCity and this report is appreciated. Peter Luger and Warren Sparks from Doppelmayr/Garaventa deserve many thanks for their help in accessing the technical components of a Burnaby Mountain gondola. Peter’s technical evaluations along with Warren’s general wealth of knowledge about aerial passenger ropeways provided crucial technical components for this report. Appreciation is extended to Tamim Raad, Dave Leiscester, Paul Barlow, Ian Graham, Elizabeth Bowker and especially Ian Fisher at TransLink for providing all of the bus information and statistics for Burnaby Mountain. Without such open co-operation, much of the ridership and economic assessment would have been very difficult. The author would like to thank Guy Patterson for providing significant input into the policy review and analysis provided in this report. Guy, along with Chris Midgely, Shannon Woron, Tracy Hutton, Linda Davies and Drew Tupper is recognized for donating time to review and edit sections of this report. Jason Wegman and Niall McGarvey from PWL Partnership provided architectural services for this report, providing figures that significantly elevated the presentation quality of this report. Jon Turner from Hemmera also provided environmental services, giving specific important information about Burnaby Mountain. Jonathan Tinney of UniverCity is thanked for helping with the direction of the report and Mark Harrison for adding content and expertise to the economic section. Lastly, appreciation is extended to Doug Forseth and Barb Houghton at Whistler Blackcomb and Elizabeth Starr at SFU Planning for providing data important to this report.