(proposed 51% jv) - aditya birla nuvo · considering current growth plan & with about 2x...
TRANSCRIPT


2
Note 1 : The financial results of ABNL are consolidated financials unless otherwise specified
Note 2 : The financial figures in this presentation have been rounded off to the nearest ` 1 Crore
Note 3 : 1 USD = INR 65
Glossary
CY – Current Year
FY – Financial Year (April-March)
PY – Corresponding period in Previous Year
PQ – Previous Quarter
Q2– July-September
Q3– October-December
YTD – Year to date
EOP – End of Period
L2L – Like to Like
RMS – Revenue Market Share
ROACE – Return on Avg. Operating Capital Employed based on EBIT
VLR – Visitor Location Register
VAS – Value Added Services
TPA – Tons per annum
AAUM – Quarterly Average Assets under Management
FYP – First Year Premium Income
PPI – Prepaid Payment Instrument
Banca - Bancassurance
CAB – Corporate Agents and Brokers
Key Highlights 3 – 11
Business-wise Performance 12 – 26
Going Forward 27
Financials and other Annexure 28 – 47

3
SOLAR
Life Insurance$
(51%)
Aditya Birla Financial Services Ltd. (100%)^ Telecom$#
(23.26%)
DIVISIONS
NBFC (100%)^
Housing Finance (100%)^
Asset Management (51%)$
General Insurance Advisory (50.01%)^
Private Equity (100%)^
Broking (75%)^#
Wealth Management (100%)^
Health Insurance (100%)^
Jaya Shree*
Agri*
Rayon*
Insulators*
*Represents Divisions ^Represents subsidiaries $Represents Joint ventures #Listed
Note 1 : Percentage figures indicated above represent ABNL’s Shareholding in its subsidiaries/JV’s
Note 2 : Major investments include 9.1% stake in Aditya Birla Fashion & Retail Ltd. Aditya Birla Health
Insurance Co. Ltd.
(Proposed 51% JV)
Online Money Management (100%)^
Solar Power JV
(51%)$
Payments
Bank $
49% 51%

4
To be a premium conglomerate building leadership in businesses
and creating value for all the stakeholders
Investing in promising sectors
Building leadership in businesses
A platform to drive synergy of resources
Delivering best value to all the stakeholders
To be a responsible corporate citizen
Integrity
Commitment
Passion
Seamlessness
Speed
5
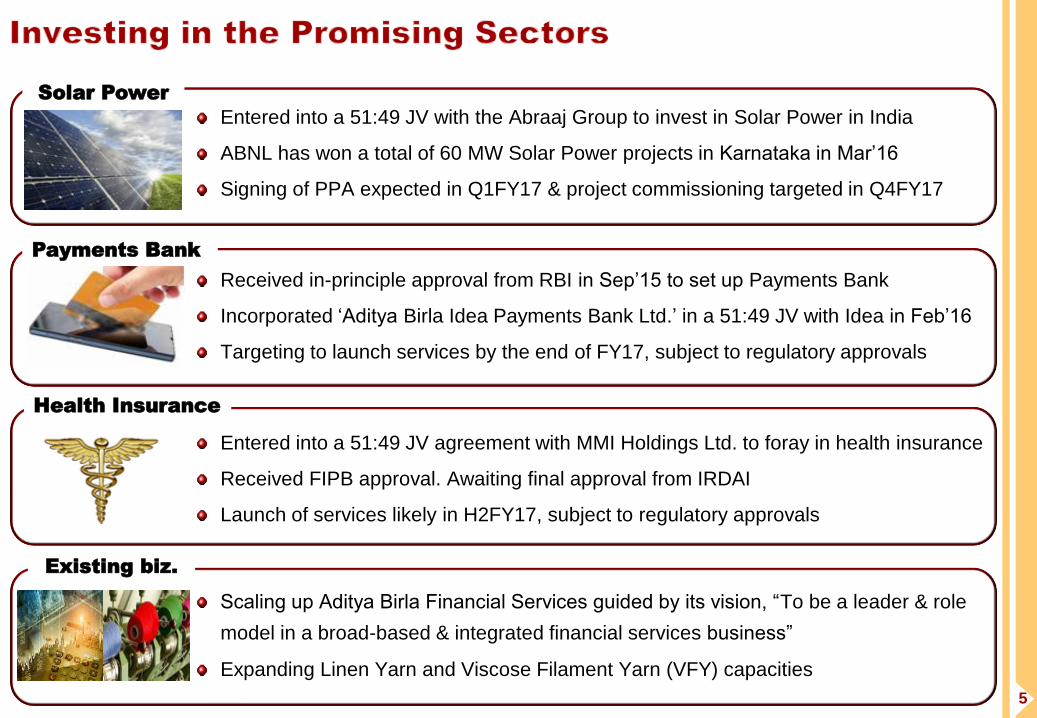
Entered into a 51:49 JV with the Abraaj Group to invest in Solar Power in India
ABNL has won a total of 60 MW Solar Power projects in Karnataka in Mar’16
Signing of PPA expected in Q1FY17 & project commissioning targeted in Q4FY17
Received in-principle approval from RBI in Sep’15 to set up Payments Bank
Incorporated ‘Aditya Birla Idea Payments Bank Ltd.’ in a 51:49 JV with Idea in Feb’16
Targeting to launch services by the end of FY17, subject to regulatory approvals
Entered into a 51:49 JV agreement with MMI Holdings Ltd. to foray in health insurance
Received FIPB approval. Awaiting final approval from IRDAI
Launch of services likely in H2FY17, subject to regulatory approvals
Scaling up Aditya Birla Financial Services guided by its vision, “To be a leader & role
model in a broad-based & integrated financial services business”
Expanding Linen Yarn and Viscose Filament Yarn (VFY) capacities
Solar Power
Health Insurance
Existing biz.
Payments Bank

6
Corporate Action
Sun Life raises its stake in Life
Insurance JV from 26% to 49% in
Apr’16 for ` 1,664 Cr.
Broad based Portfolio
With 12 lines of businesses
Industry Positioning (in India)
Among top 5 fund managers (excl. LIC)
A leading NBFC
# 4 in Life Insurance1
# 4 in Asset Management
# 1 in Online Personal Finance Management
A leading General Insurance Advisor
Funds under Management (Mar’16)
USD 28.4 billion2
(` 184,276 Crore, 12%↑y-o-y)
2 Includes AUM of Life Insurance, Private Equity and quarterly average AUM of Asset Management business
Aditya Birla Financial Services
EBT (FY16)
(Established businesses3)
USD 171 million
(` 1,110 Crore, 21%↑y-o-y)
Revenue (FY16)
(Established businesses3)
USD 1.4 billion
(` 9,192 Crore, 16%↑y-o-y)
Lending Book (Mar’16)
(Incl. Housing Finance book)
USD 4.3 billion
(` 27,728 Crore, 57%↑y-o-y)
1 In terms of Annual Premium Equivalent (APE) market share among private sector players
3 Established businesses include Life Insurance, Asset Management, NBFC, Private Equity, Broking, Wealth Management & General Insurance Broking businesses.

7
Divisions (Jaya Shree, Indo-Gulf fertilisers, Indian Rayon, Aditya Birla Insulators)
Industry Positioning
India’s largest Linen,
VFY & Insulators
player
One of the Leading
manufacturers of Urea
EBITDA (FY16)
USD 117 million
(` 764 Cr., 24%↑y-o-y)
Revenue (FY16)
USD 841 million
(` 5,466 Cr., 1%↑y-o-y)
Strong ROACE
(FY16)
Jaya Shree 44%
Agri 11%
Rayon 30%
Insulators 22% ___________________
Divisions 21%
Telecom (Idea Cellular)
Standalone Cash profit
USD 1.6 billion
(` 10,120 Cr., 19%↑y-o-y)
EBITDA (FY16)
USD 2.0 billion
(` 13,257 Cr., 18%↑y-o-y)
Outperforming Industry
RMS @ 18.9%2
Incremental RMS @ 59%3
Industry Positioning
6th largest1 in the world
3rd largest2 in India
Balance sheet
Net Debt to EBITDA : 3.25x
(Standalone as on 31st Mar’16)
Revenue (FY16)
USD 5.5 billion
(` 35,935 Cr., 14%↑y-o-y)
1 In terms of subscribers based on operations in a single country (Source: GSMA, Dec’15) 2Based on gross revenue for UAS & Mobile licenses for Q3FY16 (Source: TRAI)
3 Q3FY16 over Q3FY15

8
Standalone balance sheet has been ABNL’s growth engine & a platform to drive synergy of capital resources
In FY16, it incurred capex of ` 110 Cr. for divisions and infused capital of ` 967 Cr. in Financial Services business
Proceeds of ` 1,664 Cr. from sale of 23% stake in Birla Sun Life Insurance (BSLI) and Fertilisers subsidy
of ` 489 Cr. have been realised in Apr’16 leading to reduction in the debt of ABNL.
Adjusting for sale proceeds & subsidy realisation, Net Debt / EBITDA stands at comfortable position
Coupled with steady FCF generation from divisions & its ability to pool cash resources, ABNL’s standalone
balance sheet stands strong to drive its growth plans. Capital requirements for FY17 are :
Capex of ~` 325 Cr. for divisions including ` 191 Cr. & ` 40 Cr. towards Linen Yarn & VFY capacities expansion
Equity funding for its 51% share in new ventures viz., (a) Solar Power (b) Payments Bank & (c) Health Insurance
Capital requirement to the tune of about ` 750 Cr. mainly for scaling up NBFC, Housing Finance & MyUniverse
Standalone Ratios
1,151 1,193 1,112
3,196 3,584 3,786
Mar'14 Mar'15 Mar'16
Standalone Net Debt
( ` Crore)
O/s
Fertilisers
Subsidy
2.6 3.0
4.5
0.39 0.42 0.44
Mar'14 Mar'15 Mar'16
Net Debt/annualised EBITDA Net Debt/Equity
9
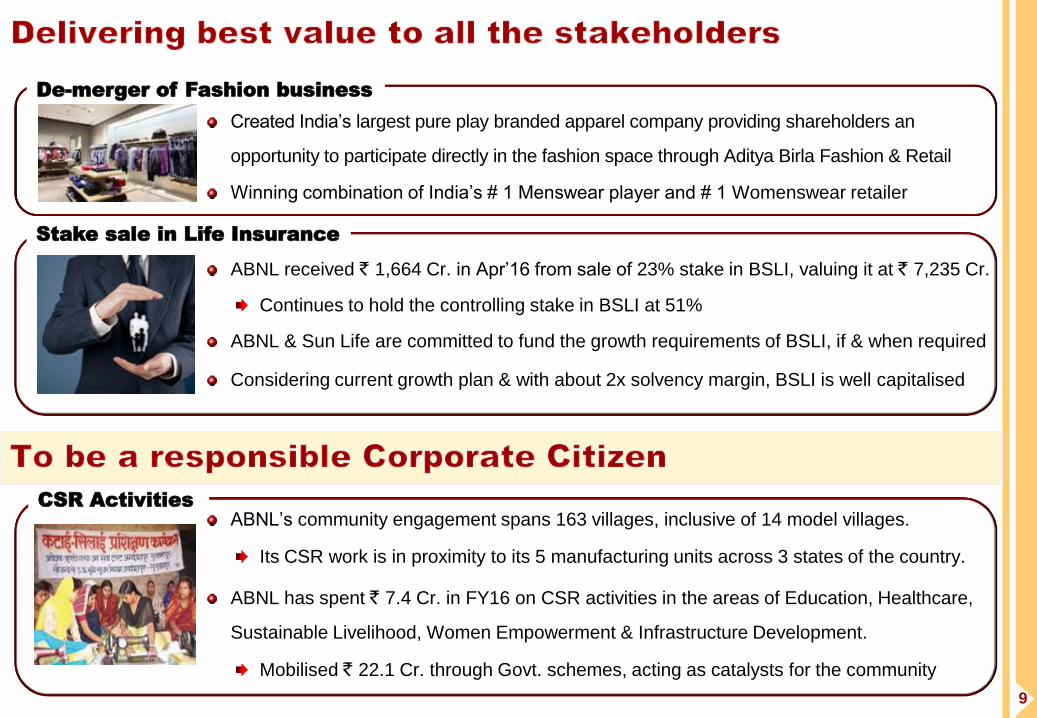
Created India’s largest pure play branded apparel company providing shareholders an
opportunity to participate directly in the fashion space through Aditya Birla Fashion & Retail
Winning combination of India’s # 1 Menswear player and # 1 Womenswear retailer
ABNL received ` 1,664 Cr. in Apr’16 from sale of 23% stake in BSLI, valuing it at ` 7,235 Cr.
Continues to hold the controlling stake in BSLI at 51%
ABNL & Sun Life are committed to fund the growth requirements of BSLI, if & when required
Considering current growth plan & with about 2x solvency margin, BSLI is well capitalised
ABNL’s community engagement spans 163 villages, inclusive of 14 model villages.
Its CSR work is in proximity to its 5 manufacturing units across 3 states of the country.
ABNL has spent ` 7.4 Cr. in FY16 on CSR activities in the areas of Education, Healthcare,
Sustainable Livelihood, Women Empowerment & Infrastructure Development.
Mobilised ` 22.1 Cr. through Govt. schemes, acting as catalysts for the community
De-merger of Fashion business
Stake sale in Life Insurance
CSR Activities

10
Note 1: Pursuant to demerger of Madura Fashion & Lifestyle into Pantaloons Fashion & Retail Ltd. (PFRL), Madura & Pantaloons businesses ceased to be division and subsidiary of
ABNL, hence excluded from consolidated financials w.e.f. 1st April 2015. IT-ITeS subsidiary was divested w.e.f. 9th May 2014. To make the performance comparable, like-to-like
financials for the previous year are exhibited excluding Madura, Pantaloons and IT-ITeS businesses.
Note 2: Net profit for the year ended 31st Mar’16 includes exceptional gain of ` 357 Cr. pertaining to cessation of PFRL as subsidiary of ABNL.
Revenue
( ` Crore)
5,673 6,425
FY15 FY16 Like-to-Like1 Reported
13%
20,798
23,129
11%
EBITDA
( ` Crore)
1,378
1,781
29%
5,272
6,535
24%
Net Profit
( ` Crore)
333 327
2%
1,447
1,886
30%
Q4
Full
Year
FY15 FY16 Like-to-Like1 Reported
FY15 FY16 Like-to-Like1 Reported
FY15 FY16 Like-to-Like1 Reported
FY15 FY16 Like-to-Like1 Reported
FY15 FY16 Like-to-Like1 Reported
2
11
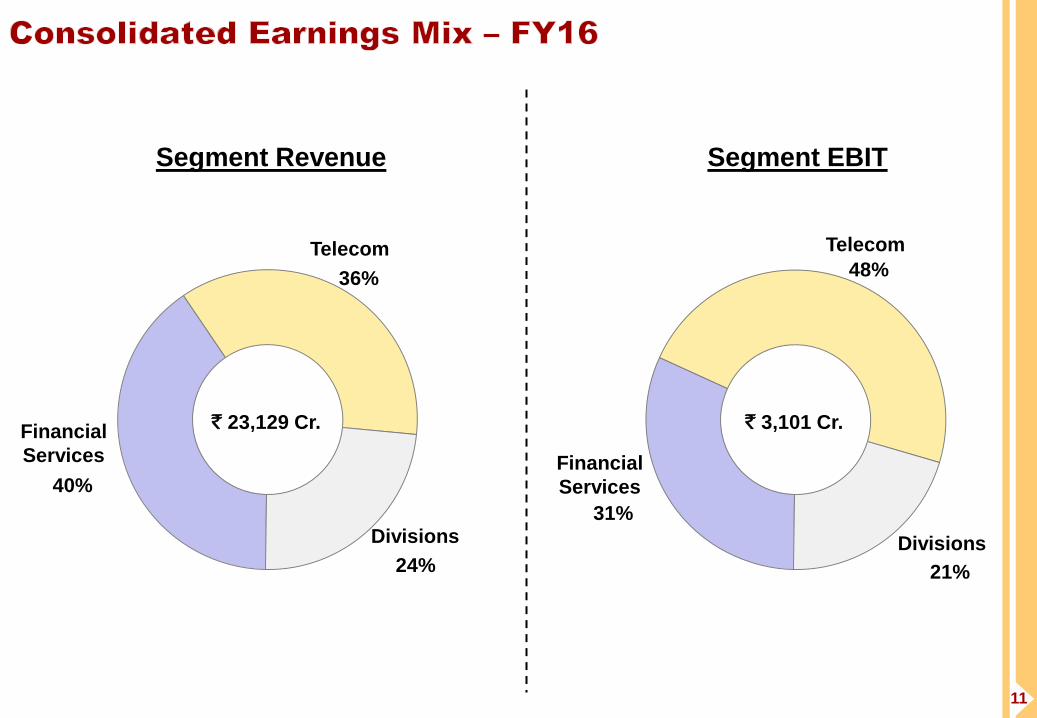
40%
36%
24%
Financial
Services
Telecom
Divisions
Segment Revenue
` 23,129 Cr.
31%
48%
21%
Financial
Services
Telecom
Divisions
Segment EBIT
` 3,101 Cr.

12
Performance highlights : FY 2015-16
A significant non-bank financial services group

13
A significant and well diversified non-bank financial services group
Scaled up operations from 7 lines of business in Mar’11 to a diversified portfolio of 12 lines of business in Mar’16
Assets under Management at ` 184,276 Cr. (12%↑ y-o-y)
Lending book (incl. Housing Finance) at ` 27,728 Cr. (57%↑ y-o-y, 18%↑ q-o-q)
Annual revenue from the established businesses crosses ` 9,000 Cr. & EBT crosses ` 1,100 Cr.
Improved market standing
NBFC business continues to grow ahead of the market while maintaining its portfolio quality
Market share improved y-o-y in the Asset Management and Insurance Advisory businesses
MyUniverse continues to be the #1 online personal finance management platform
6,304 7,920
9,192
FY11 FY15 FY16
Revenue (Rs. Crore)
CAGR 8%
472
915 1,110
FY11 FY15 FY16
EBT (Rs. Crore)
CAGR 19%
88,201
164,775 184,276
Mar'11 Mar'15 Mar'16
Funds under Management1
(₹ Crore)
CAGR 16%
1Includes AUM of Life Insurance, Private Equity & quarterly AAUM of Asset Management businesses
(Established businesses2)
2 Established businesses include Life Insurance, Asset Management, NBFC, Private Equity, Broking, Wealth Management & General Insurance Broking businesses
(Established businesses2)

14
Lending book expanded to ` 25,755 Cr. (47%↑ y-o-y, 16%↑ q-o-q)
Scaled up at a CAGR of 69% p.a. in past 5 years
Built a well diversified portfolio for sustainable growth
Sound portfolio quality led by robust credit appraisal & risk
management practices : Gross NPA at 0.63% & Net NPA at 0.22%
Aditya Birla Finance Ltd. (ABFL) - NBFC
1.16% 1.23% 1.29%
0.90%
0.63%
0.84% 0.83%
0.58%
0.32% 0.22%
Mar'12 Mar'13 Mar'14 Mar'15 Mar'16
Gross NPA Net NPA
1,850
17,564
25,755
FY11 FY15 FY16
Lending Book (₹ Crore)
CAGR 69%
LAP 13%
LRD 8%
Construction Finance 4%
Promoter 6%
HNI 5%
Broker 3%
Retail & Bonds 3%
SME 11%
Large Corp. 9%
Mid-Corp. 7%
Corporate Loan 9%
Structured Finance 4%
Project Loan 16%
Loan Book
Mix
` 25,755 Cr. (Mar’16)
Others
2%

15
Quality of business reflecting in the strong earnings growth …
… and improved Opex & Return Ratios
Funding business growth through healthy internal accruals supported by capital infusion
With capital infusion of ` 702 Cr. in FY16 (~` 2,200 Cr. during past 5 years), net worth has expanded to ` 3,696 Cr.
Aditya Birla Finance Ltd. (ABFL) - NBFC
11.4% 14.3% 13.1%
14.6% 15.4%
2.2% 1.9% 1.9% 2.0% 2.1%
FY12 FY13 FY14 FY15 FY16
Return on Avg. Equity Return on Avg. Assets Opex to Net Interest Income (%)
35% 36%
31% 29%
25%
FY12 FY13 FY14 FY15 FY16
196
1,776
2,442
FY11 FY15 FY16
Revenue (₹ Crore)
CAGR 66%
55
411
626
FY11 FY15 FY16
EBT (₹ Crore)
CAGR 63%
497
2,585
3,696
Mar'11 Mar'15 Mar'16
Net Worth (₹ Crore)
CAGR 49%

16
Birla Sun Life Insurance Co. Ltd. (BSLI)
Ranks # 4 in India with new business1 market share at 7.6%
In FY16, new business premium grew y-o-y by 15% to ` 2,220 Cr.
Group segment FYP rose by 28% to ` 1,509 Cr.
Individual Life FYP declined by 7% to ` 711 Cr. On a like-to-like basis, i.e.,
excl. sales from Citi Bank from last year, it grew y-o-y by 5%
During H2, individual life segment has gained momentum, led by
agency channel, registering y-o-y growth of 6%
Agency channel grew by 12% in H2 and 10% in FY16
AUM at ` 30,811 Cr. (2%↑ y-o-y)
Improvement in quality of business
Individual business surrenders reduced y-o-y
13th month persistency improved y-o-y by 250 bps to 64.7%
Opex to Premium Ratio (incl. commission) reduced y-o-y by 90 bps to 20.1%
Note 1: In terms of Annual Premium Equivalent (APE) among private sector players
3,136 3,295 3,359
1,697 1,938 2,220
FY14 FY15 FY16
Gross Premium Income (` Crore)
New business Renewal
4,833 5,233 5,580

17
Ranks # 4 in India with AAUM market share at 10.1% (Q4FY16)
Equity ranking improved to #4 with an enhanced 7.61% market share
Total AUM grew at a CAGR of 18% in 5 years to ` 152,427 Cr.
Gaining market share & scaling up retail & higher margin assets
Domestic Equity AAUM grew almost 3 times in past 5 years to ` 31,891 Cr.
Offshore & Alternate Assets grew 4 times in past 5 years to ` 15,924 Cr.
Awards
“Runner up - Overall AMC of the Year” and “Runner up - Equity AMC of
the Year” in Outlook Money Awards 2015
Three funds won Thomson Reuters Lipper Fund Award 2016 & two funds
won Morning Star Award 2016
Revenue rose by 28% to ` 765 Cr. & EBT by 73% to ` 314 Cr.
Birla Sun Life Asset Management Co. Ltd. (BSLAMC)
Q4FY16 ∆% (y-o-y)
Share of Equity in domestic AAUM 23.4% 175 bps↑
Live SIP market share 9.69% 82 bps↑
Monthly SIP book size ` 282 Cr. 59%↑
11,313 25,881 31,891
52,383
93,871 104,612
3,864
13,718
15,924
Q4FY11 Q4FY15 Q4FY16
Growth in AAUM
Equity Fixed Income Offshore & Alternate assets
CAGR 18%
67,560
133,470
152,427
9.09%
10.09% 10.10%
5.50%
7.11% 7.61%
Q4FY11 Q4FY15 Q4FY16
Domestic AAUM Market Share
Total AAUM Equity AAUM

18
Aditya Birla Insurance Brokers Ltd. (ABIBL: General Insurance Advisory)
In FY16, ABIBL’s premium placement rose y-o-y by 43% to ` 1,624 Cr.
while industry premium grew by 14%.
Consistently outperforming industry and gaining market share
Aditya Birla Housing Finance Ltd. (ABHFL)
Within one & a half year of commencement of operations, loan book has scaled up
to ` 1,973 Cr. in Mar’16 (PY: ` 142 Cr., PQ: ` 1,232 Cr.). Posted 60% q-o-q growth
Net worth stood at ` 205 Cr. led by capital infusion of ` 189 Cr. in FY16
Launched 360◦ brand campaign based on the ‘True Worth’ proposition
Aditya Birla Health Insurance Co. Ltd. (ABHIL)
Entered into a JV agreement with MMI Holdings Ltd. (a leading South African insurance based financial services group) in
Jun’15 to foray in health insurance business in India.
Received FIPB approval. Awaiting final approval from IRDAI.
ABHIL, currently a 100% sub of Aditya Birla Financial Services Ltd., is proposed to be a 51:49 JV with MMI
1.16% 1.33% 1.68%
FY14 FY15 FY16
ABIBL Market share
60% 34%
6%
Construction
Finance
Loan against
Property
Home
Loan
ABHFL Loan Mix (Mar’16)

19
Aditya Birla Private Equity (ABPE)
Funds under management (net) at ` 1,037 Cr.
Both, Fund I and Sunrise Fund, have invested their net deployable corpus
Aditya Birla Money (Broking, Wealth Management & Online Money Management)
Wealth Management (ABMM) :
Avg. equity Assets under Advisory in Q4FY16 rose y-o-y by 20% to ` 2,185 Cr.
Online Personal Finance Management (MyUniverse) :
Enjoying trust of over 2.6 million registered users who are managing close to ` 200 billion through MyUniverse
Ready to become a multi-product transaction platform with analytics based integrated cross-sell capability

20
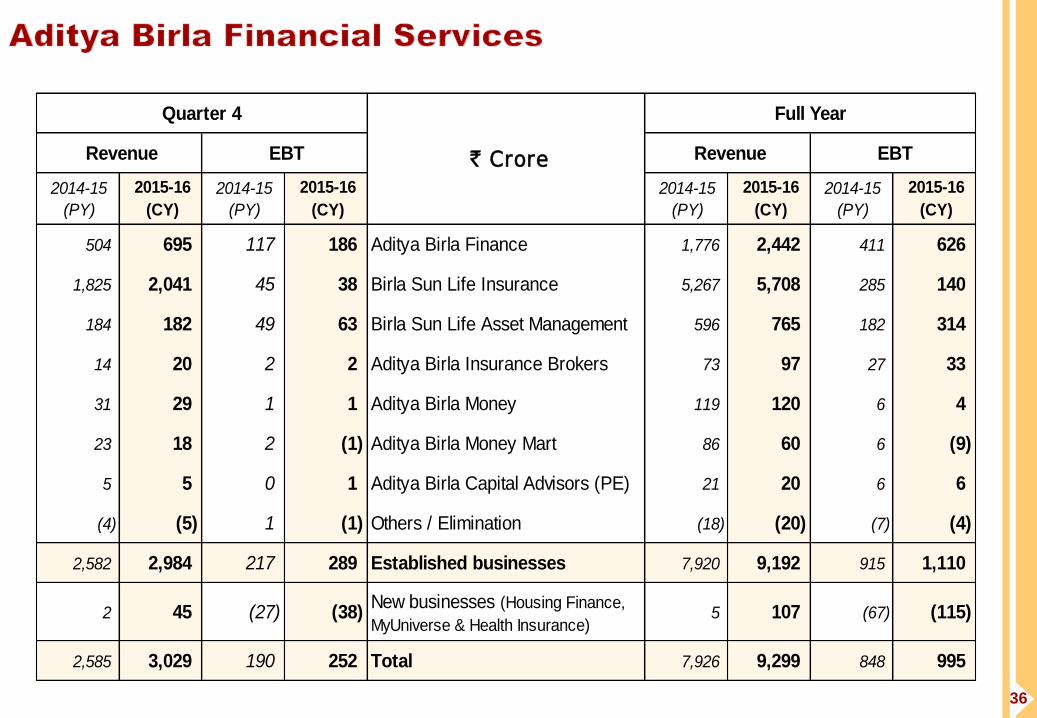
Revenue from the established businesses rose by 16% to ` 9,192 Cr.
EBT from the established businesses surged by 21% to ` 1,110 Cr.
Revenue
FY15 FY16 ∆% (` Crore)
EBT FY15 FY16 ∆%
Remarks on profitability
1,776 2,442 37% NBFC 411 626 52% Expansion of lending book (47%↑ y-o-y)
5,267 5,708 8% Life Insurance 285 140 51% Lower in-force book & higher expense gap
596 765 28% Asset Management 182 314 73% Growth in AUM (14%↑ y-o-y)
73 97 33% General Insurance Advisory 27 33 23% Higher premium placement (43%↑ y-o-y)
119 120 Broking 6 4 28% Lower volumes in retail equity cash & F&O
86 60 30% Wealth Management 6 (9) 127% Cap on upfront commission on MF sales
21 20 3% Private Equity 6 6
(18) (20) Others / Elimination (7) (4)
7,920 9,192 16% Established businesses 915 1,110 21%
5 107 New Businesses (67) (115) Housing Finance, MyUniverse & Health
Insurance are in the investment phase
7,926 9,299 17% Total 848 995 17%
21
3rd largest Cellular Operator in India
Performance highlights : FY 2015-16

22
Fastest growing large Indian mobile operator for straight 8th year
Revenue (14%↑ y-o-y) & EBITDA (18%↑ y-o-y) growth was driven by
subscribers addition and expansion of voice minutes & data volumes
EBITDA margin improved despite higher network opex & subscriber growth
Rise in depreciation & interest on account of rapid expansion of 3G/4G
services & renewal of existing licenses in 7 circles constrained profits
Strong spectrum bank & accelerated expansion to tap data opportunity
Idea’s own 3G/4G wireless broadband spectrum covers 87% of its revenue
Offers own 3G/4G services in 13/10 circles covering 79%/62% of its revenue
Generating strong cash flows to support balance sheet & growth plans
Capex of ` 78 bn was fully funded through cash profit2 of ` 101 bn (19%↑ y-o-y)
Proposed dividend @ 6% of share capital [Outlay of ` 260 Cr. incl. DDT]
Key metrics2 FY15 FY16 Δ%
Minutes of Use (billion) 683 786 +15.0%
Average Realisation per minute (`) 0.455 0.452 - 0.6%
Cost per minute (`) 0.319 0.306 -4.0%
Data Volume (billion Mega Bytes) 172.5 297.9 72.7%
1 Based on gross revenue for UAS & Mobile licenses, as released by TRAI 2 Standalone = Idea and its 100% subsidiaries 3 Q3FY16 over Q3FY15
14.4% 14.8% 16.1%
17.5% 18.9%
Q3FY12 Q3FY13 Q3FY14 Q3FY15 Q3FY16
Revenue Market Share 1
Strong Incremental RMS
Rank &
Circles
RMS Q3FY16
Incremental
RMS3
Leader in 8
Geographies
31.1% 89%
# 3 in 7
Emerging
Geographies
12.5% 30%
# 5 in 7 New
Geographies
6.4% 57%
Total 22 18.9% 59%

23
Leading manufacturer of Linen, Urea, VFY and Insulators in India
Performance highlights : FY 2015-16
24
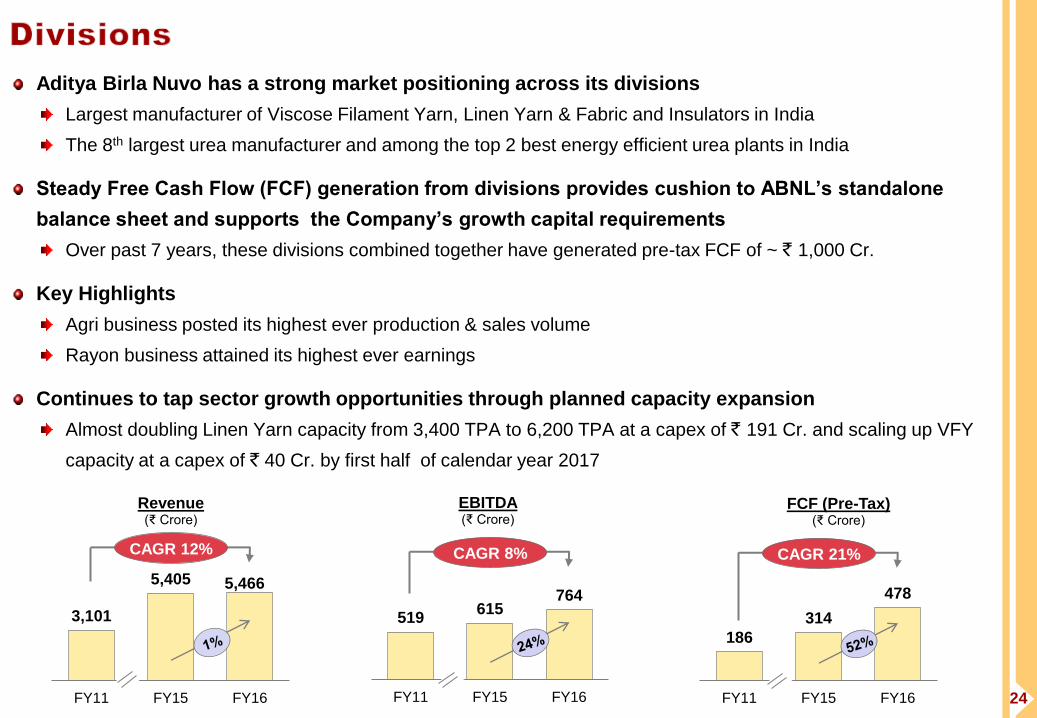
Aditya Birla Nuvo has a strong market positioning across its divisions
Largest manufacturer of Viscose Filament Yarn, Linen Yarn & Fabric and Insulators in India
The 8th largest urea manufacturer and among the top 2 best energy efficient urea plants in India
Steady Free Cash Flow (FCF) generation from divisions provides cushion to ABNL’s standalone
balance sheet and supports the Company’s growth capital requirements
Over past 7 years, these divisions combined together have generated pre-tax FCF of ~ ` 1,000 Cr.
Key Highlights
Agri business posted its highest ever production & sales volume
Rayon business attained its highest ever earnings
Continues to tap sector growth opportunities through planned capacity expansion
Almost doubling Linen Yarn capacity from 3,400 TPA to 6,200 TPA at a capex of ` 191 Cr. and scaling up VFY
capacity at a capex of ` 40 Cr. by first half of calendar year 2017
3,101
5,405 5,466
FY11 FY15 FY16
Revenue (₹ Crore)
CAGR 12%
519 615
764
FY11 FY15 FY16
EBITDA (₹ Crore)
CAGR 8%
186
314
478
FY11 FY15 FY16
FCF (Pre-Tax) (₹ Crore)
CAGR 21%

25
Revenue at ` 5,466 Cr. (1%↑ y-o-y) was marginally up y-o-y due to pass through of reduction in natural gas
prices in the Agri business on account of gas pooling policy effective from 1st June 2015
EBITDA at ` 764 Cr. (24%↑ y-o-y) mainly driven by Rayon and Agri businesses
ROACE improved y-o-y from 16% p.a. to 21% p.a.
Revenue
FY15 FY16 ∆% (` Crore)
EBITDA FY15 FY16 ∆%
Remarks on profitability
1,435 1,459 2% Jaya
Shree 175 175
Profitability maintained despite lower linen volumes
compensated by higher wool volumes
2,557 2,498 2% Agri 148 209 41%
Higher sales volume of neem coated urea & lower repairs
(Observed shutdown in previous year for over one month).
Higher contribution from production beyond 100% capacity
due to lower gas prices owing to gas pooling policy
865 928 7% Rayon 197 266 35% Higher VFY & Caustic volumes & improved realisation
548 581 6% Insulators 95 114 19% Higher volumes & realisation
5,405 5,466 1% Total 615 764 24%

26
Payments Bank
Incorporated ‘Aditya Birla Idea Payments Bank Limited’ in a 51:49 joint venture with Idea Cellular
The JV is in the process of appointing senior management team, selecting the right IT system and defining
innovative products & cost efficient processes before starting services.
Likely to launch its services by the end of FY2016-17, post receipt of requisite approvals from RBI
The JV will acquire customers ‘Online’ leveraging Aditya Birla Group’s current ~45 million digital customers as
well as ‘Offline’ riding on the strength of Idea’s 2 million+ retail distribution channel across 390,000 towns/villages.
Will partner with Aditya Birla Financial Services, select universal banks etc. to offer range of banking products.
The NEFT/IMPS & PPI business of Idea will be integrated with the new Payments Bank to run as single entity
ABNL has entered into a 51:49 JV with the Abraaj Group to invest in Solar Power in India
Aims to build a large scale renewable energy platform focused on developing utility-scale solar power plants
ABNL has won a total of 60 MW (AC Capacity) Solar Power projects in Karnataka in Mar’16
Won 20 MW (AC) project each in 3 Talukas – Ramdurg, Shirahatti and Mulbagal
Tariff ranging between ` 4.86 per KWh to ` 4.97 per KWh
The signing of PPA is expected in Q1FY17 and the commissioning of plants is targeted in Q4FY17
Solar Power
27
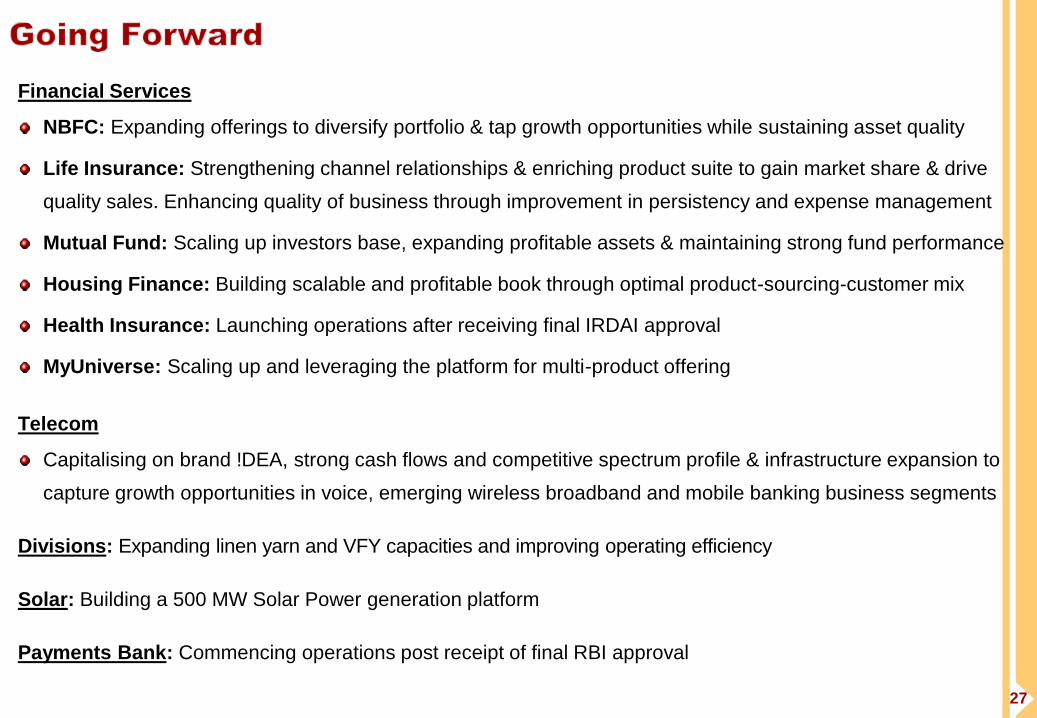
Financial Services
NBFC: Expanding offerings to diversify portfolio & tap growth opportunities while sustaining asset quality
Life Insurance: Strengthening channel relationships & enriching product suite to gain market share & drive
quality sales. Enhancing quality of business through improvement in persistency and expense management
Mutual Fund: Scaling up investors base, expanding profitable assets & maintaining strong fund performance
Housing Finance: Building scalable and profitable book through optimal product-sourcing-customer mix
Health Insurance: Launching operations after receiving final IRDAI approval
MyUniverse: Scaling up and leveraging the platform for multi-product offering
Telecom
Capitalising on brand !DEA, strong cash flows and competitive spectrum profile & infrastructure expansion to
capture growth opportunities in voice, emerging wireless broadband and mobile banking business segments
Divisions: Expanding linen yarn and VFY capacities and improving operating efficiency
Solar: Building a 500 MW Solar Power generation platform
Payments Bank: Commencing operations post receipt of final RBI approval

28

29
* Include Asset Management, NBFC, Housing Finance, Health Insurance, Private Equity, Broking, Wealth Management, Online Money Management & General Insurance Broking biz.
@ Idea is consolidated at ~25.3% till 10th June 2014, at 23.63% till 23rd July 2014 and at ~23.3% thereafter
$ Pursuant to de-merger of Madura Fashion & Lifestyle into Pantaloons Fashion & Retail Ltd. w.e.f. 1st April 2015
^ Divested w.e.f 9th May 2014
(` Crore)
Quarter - 3 Revenue
2015-16
(CY)
2014-15
(PY)
2015-16
(CY)
2014-15
(PY)
2015-16
(CY)
2,104 2,585 3,029 Aditya Birla Financial Services 7,926 9,299
1,191 1,825 2,041 Life Insurance 5,267 5,708
914 761 990 Other Financial Services* 2,665 3,598
(1) (2) (2) Elimination (7) (6)
2,094 1,955 2,201 Telecom (Nuvo's share)@ 7,467 8,361
1,387 1,134 1,189 Divisions 5,405 5,466
333 374 324 Jaya Shree 1,435 1,459
689 381 456 Agri 2,557 2,498
232 216 244 Rayon 865 928
133 163 165 Insulators 548 581
- - 7 Solar - 7
(1) 0 (1) Inter-segment Elimination (0) (4)
5,584 5,673 6,425 Consolidated Revenue
(From Continuing Operations) 20,798 23,129
- 1,403 - Aditya Birla Fashion & Retail$
5,450 -
- - - IT-ITeS^ 283 -
- (3) - Inter-segment Elimination (16) -
5,584 7,073 6,425 Consolidated Revenue (Reported) 26,516 23,129
Quarter 4 Full Year

30
* Include Asset Management, NBFC, Housing Finance, Health Insurance, Private Equity, Broking, Wealth Management, Online Money Management & General Insurance Broking
businesses. Interest cost of NBFC business, being an operating expense as per AS 17, is deducted from Segment EBIT
@ Idea is consolidated at ~25.3% till 10th June 2014, at 23.63% till 23rd July 2014 and at ~23.3% thereafter
$ Pursuant to de-merger of Madura Fashion & Lifestyle into Pantaloons Fashion & Retail Ltd. w.e.f. 1st April 2015
^ Divested w.e.f 9th May 2014
(` Crore)
Quarter - 3 EBIT
2015-16
(CY)
2014-15
(PY)
2015-16
(CY)
2014-15
(PY)
2015-16
(CY)
237 182 249 Aditya Birla Financial Services 814 977
28 45 38 Life Insurance 285 140
209 137 211 Other Financial Services* 529 837
350 367 382 Telecom (Nuvo's share)@ 1,305 1,484
158 71 134 Divisions 494 639
26 38 32 Jaya Shree 146 144
55 (28) 12 Agri 116 176
55 35 64 Rayon 156 223
22 26 26 Insulators 76 96
- - 1 Solar - 1
745 620 766 Segment EBIT
(From Continuing Operations) 2,613 3,101
- 73 - Aditya Birla Fashion & Retail$
261 -
- - - IT-ITeS^ (16) -
745 693 766 Segment EBIT (Reported) 2,857 3,101
Quarter 4 Full Year
31
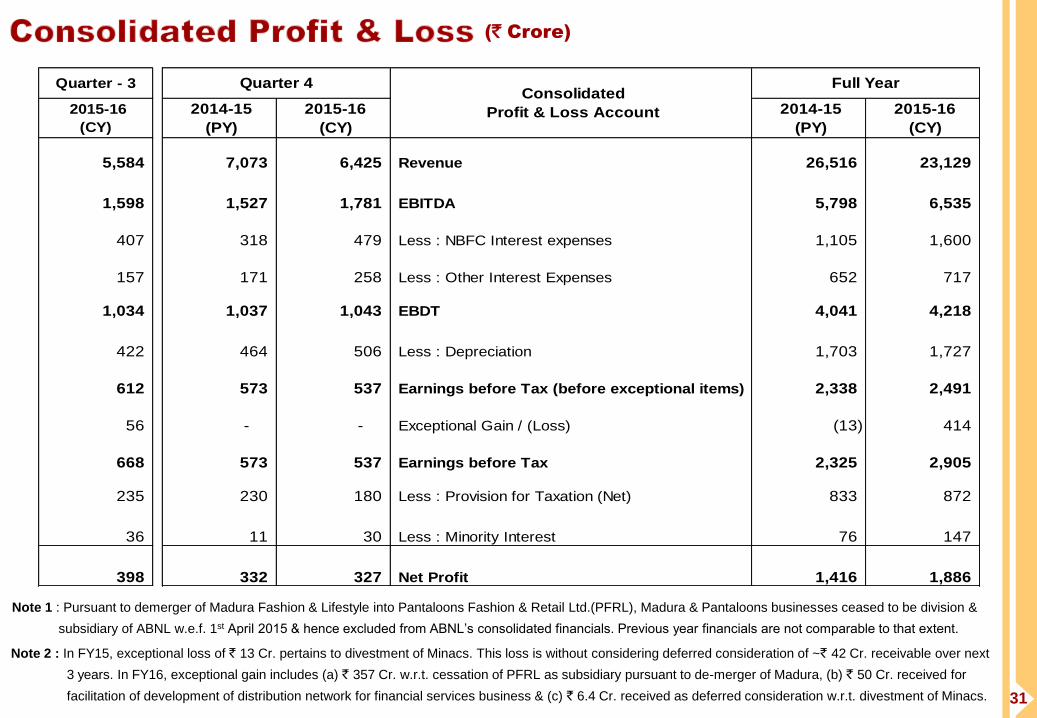
Note 2 : In FY15, exceptional loss of ` 13 Cr. pertains to divestment of Minacs. This loss is without considering deferred consideration of ~` 42 Cr. receivable over next
3 years. In FY16, exceptional gain includes (a) ` 357 Cr. w.r.t. cessation of PFRL as subsidiary pursuant to de-merger of Madura, (b) ` 50 Cr. received for
facilitation of development of distribution network for financial services business & (c) ` 6.4 Cr. received as deferred consideration w.r.t. divestment of Minacs.
Note 1 : Pursuant to demerger of Madura Fashion & Lifestyle into Pantaloons Fashion & Retail Ltd.(PFRL), Madura & Pantaloons businesses ceased to be division &
subsidiary of ABNL w.e.f. 1st April 2015 & hence excluded from ABNL’s consolidated financials. Previous year financials are not comparable to that extent.
(` Crore)
Quarter - 3
2015-16
(CY)
2014-15
(PY)
2015-16
(CY)
2014-15
(PY)
2015-16
(CY)
5,584 7,073 6,425 Revenue 26,516 23,129
1,598 1,527 1,781 EBITDA 5,798 6,535
407 318 479 Less : NBFC Interest expenses 1,105 1,600
157 171 258 Less : Other Interest Expenses 652 717
1,034 1,037 1,043 EBDT 4,041 4,218
422 464 506 Less : Depreciation 1,703 1,727
612 573 537 Earnings before Tax (before exceptional items) 2,338 2,491
56 - - Exceptional Gain / (Loss) (13) 414
668 573 537 Earnings before Tax 2,325 2,905
235 230 180 Less : Provision for Taxation (Net) 833 872
36 11 30 Less : Minority Interest 76 147
398 332 327 Net Profit 1,416 1,886
Quarter 4 Full Year Consolidated
Profit & Loss Account

32
(` Crore)
8,519 8,569 8,559 Net Worth 12,871 14,314 14,535
- - - Minority Interest 802 828 857
3,688 3,241 3,904 Debt 11,299 12,380 13,570
- - - NBFC borrowings (incl. Housing) 14,686 19,754 22,914
106 170 173 Deferred Tax Liabilities (Net) 485 699 788
12,314 11,980 12,637 Capital Employed 40,142 47,975 52,665
- - -
Policyholders' funds (Incl. funds
for future appropriation) 28,839 28,845 29,375
12,314 11,980 12,637 Total Liabilities 68,981 76,820 82,039
1,859 1,597 1,589 Net Block (Incl. Capital Advances) 12,342 18,878 19,052
20 - - Goodwill 3,973 2,209 2,209
- - - NBFC Lending (Incl. Housing) 17,706 23,442 27,728
1,635 1,183 1,464 Net Working Capital 160 85 196
8,695 8,890 9,465 Long Term Investments 408 406 378
- - - Life Insurance Investments 30,147 30,340 30,727
- - - Policyholders' Investments 28,595 28,651 29,022
- - - Shareholders' Investments 1,552 1,688 1,705
105 310 119 Cash Surplus & Current Investments 4,246 1,460 1,749
655 658 657 Book Value (`) 989 1,099 1,116
3.0 3.3 4.5 Net Debt / Annualised EBITDA (x) 1.5 2.3 2.4
0.42 0.34 0.44 Net Debt / Equity (x) 0.55 0.76 0.81
Dec-15
Standalone Consolidated
Mar-15Mar-15 Mar-16Balance Sheet
Dec-15 Mar-16
Remove ICU loan from BSLI to ABFL

33
Note 2 : In FY16, exceptional gain includes ` 50 Cr. received towards facilitation for development of distribution network for financial services business and ` 6.4 Cr.
received as deferred consideration w.r.t. divestment of Minacs.
Note 3 : Board of Directors of ABNL has recommended an equity dividend of 50% (` 5 per share) for FY16 entailing outgo of ` 75.5 Cr. (incl. DDT)
Note 1 : Pursuant to demerger of Madura Fashion & Lifestyle into Pantaloons Fashion & Retail Ltd.(PFRL), Madura business ceased to be a division of ABNL w.e.f.
1st April 2015 and hence excluded from ABNL’s Standalone financials. Previous year financials are not comparable to that extent.
(` Crore)
Quarter - 3 Standalone
Profit & Loss Account
2015-16
(CY)
2014-15
(PY)
2015-16
(CY)
2014-15
(PY)
2015-16
(CY)
1,387 2,071 1,189 Revenue 8,938 5,466
200 257 181 EBITDA 1,186 846
72 71 70 Interest Expenses 263 280
128 186 111 EBDT 922 566
30 52 31 Depreciation 189 119
98 134 80 Earnings before Tax (before exceptional items) 733 447
56 - - Exceptional Gain / (Loss) - 56
155 134 80 Earnings before Tax 733 503
54 50 18 Provision for Taxation (Net) 205 143
101 84 62 Net Profit 528 360
Full YearQuarter 4

34
Note 1 : Pursuant to demerger of Madura Fashion & Lifestyle into Pantaloons Fashion & Retail Ltd.(PFRL), Madura business ceased to be a division of ABNL w.e.f.
1st April 2015 and hence excluded from ABNL’s previous year financials to make the performance comparable.
Revenue
( ` Crore)
1,134 1,189
FY15 FY16 Like-to-Like1 Reported
5%
5,405 5,466
1%
EBITDA
( ` Crore)
108
181
67%
710
846
19%
Net Profit
( ` Crore)
18
62
325 360
11%
Q4
Full
Year
FY15 FY16 Like-to-Like1 Reported
FY15 FY16 Like-to-Like1 Reported
FY15 FY16 Like-to-Like1 Reported
FY15 FY16 Like-to-Like1 Reported
FY15 FY16 Like-to-Like1 Reported
248%

35
36
2014-15
(PY)
2015-16
(CY)
2014-15
(PY)
2015-16
(CY)
2014-15
(PY)
2015-16
(CY)
2014-15
(PY)
2015-16
(CY)
504 695 117 186 Aditya Birla Finance 1,776 2,442 411 626
1,825 2,041 45 38 Birla Sun Life Insurance 5,267 5,708 285 140
184 182 49 63 Birla Sun Life Asset Management 596 765 182 314
14 20 2 2 Aditya Birla Insurance Brokers 73 97 27 33
31 29 1 1 Aditya Birla Money 119 120 6 4
23 18 2 (1) Aditya Birla Money Mart 86 60 6 (9)
5 5 0 1 Aditya Birla Capital Advisors (PE) 21 20 6 6
(4) (5) 1 (1) Others / Elimination (18) (20) (7) (4)
2,582 2,984 217 289 Established businesses 7,920 9,192 915 1,110
2 45 (27) (38) New businesses (Housing Finance,
MyUniverse & Health Insurance)5 107 (67) (115)
2,585 3,029 190 252 Total 7,926 9,299 848 995
EBT
Quarter 4 Full Year
Revenue Revenue ` Crore EBT

37
Spread Analysis FY15 FY16
Total Income / Avg. Loan book 13.1% 12.6%
Interest Cost / Avg. Loan book 8.2% 7.8%
Net Interest Income (Incl. Fee income) 5.0% 4.8%
Opex / Avg. Loan book 1.5% 1.2%
Provisioning & Write-offs / Avg. Loan book 0.5% 0.4%
Earnings before Tax / Avg. Loan book 3.0% 3.2%
ROA (Net Profit / Avg. Loan book) 2.0% 2.1%
Capital Adequacy ratio at 16.2% (Tier I : 13.7 % & Tier II : 2.5%)
Competitive borrowings profile
Long term debt account for 70% of total debt
Long / Short term credit rating at AA+ / A1+
Footprint expanded from 15 markets
in Mar’15 to 32 markets in Mar’16
through 36 branches in 15 states
Aditya Birla Housing Finance Ltd. (ABHFL)
Segment-wise Loan book (EOP) Mar'15 Dec'15 Mar'16
Capital Market 4,157 4,197 4,407
Corporate Finance 4,011 5,643 6,917
Infra Finance 4,032 5,917 7,336
Mortgages (LAP, LRD & Construction Finance) 5,081 5,786 6,593
Others 283 666 502
Total 17,564 22,210 25,755
2014-15
(PY)
2015-16
(CY)
2014-15
(PY)
2015-16
(CY)
504 695 Revenue 1,776 2,442
117 186 Earnings before tax 411 626
77 120 Net Profit 271 409
Full Year
` Crore
Quarter 4
Housing Finance
2014-15
(PY)
2015-16
(CY) ` Crore
2014-15
(PY)
2015-16
(CY)
1 44 Revenue 3 101
(4) (10) Earnings before tax (5) (30)
46 205 Net Worth 46 205
Quarter 4 Full Year

38
Industry
In FY16, industry’s total new business premium1 grew by 11%
while private sector grew by 14%. In individual life segment,
industry grew by 8% while private sector grew by 14%.
Private sector growth is driven by bank backed players
Birla Sun Life Insurance
Agency channel gained momentum through deeper penetration &
enhanced productivity. Direct marketing channel contributed well.
BSLI remains #1 in group segment with 25.6% share2 in FY16
EBT was lower due to lower in-force book & higher expense gap
Product and Channel Mix (Individual Life Segment) :
Note 1: Annual Premium Equivalent (APE) = 100% of regular premium + 10% of single premium Note 2: In terms of APE among private sector players
Product Mix Channel Mix
FY15 FY16 FY15 FY16
ULIP 38% 37% Agency 68% 81%
PAR 41% 43% Banca 19% 9%
Non-PAR 21% 20% CAB 11% 5%
Others 2% 5%
2014-15
(PY)
2015-16
(CY)
2014-15
(PY)
2015-16
(CY)
710 950 New Business Premium (Gross) 1,938 2,220
271 285 Individual 761 711
438 665 Group 1,177 1,509
1,110 1,066 Renewal Premium (Gross) 3,295 3,359
1,065 1,026 Individual 3,156 3,218
45 40 Group 140 141
1,820 2,016 Premium Income (Gross) 5,233 5,580
(79) (74) Less : Reinsurance ceded & Service tax (267) (268)
1,741 1,943 Premium Income (Net) 4,966 5,312
85 98 Other Operating Income 301 396
1,825 2,041 Revenue 5,267 5,708
45 38 Earnings before tax 285 140
45 38 Net Profit 285 140
Assets under management 30,185 30,811
Policyholders' Investments 28,632 29,105
Shareholders' Investments 1,552 1,707
Full Year
` Crore
Quarter 4
39
Industry
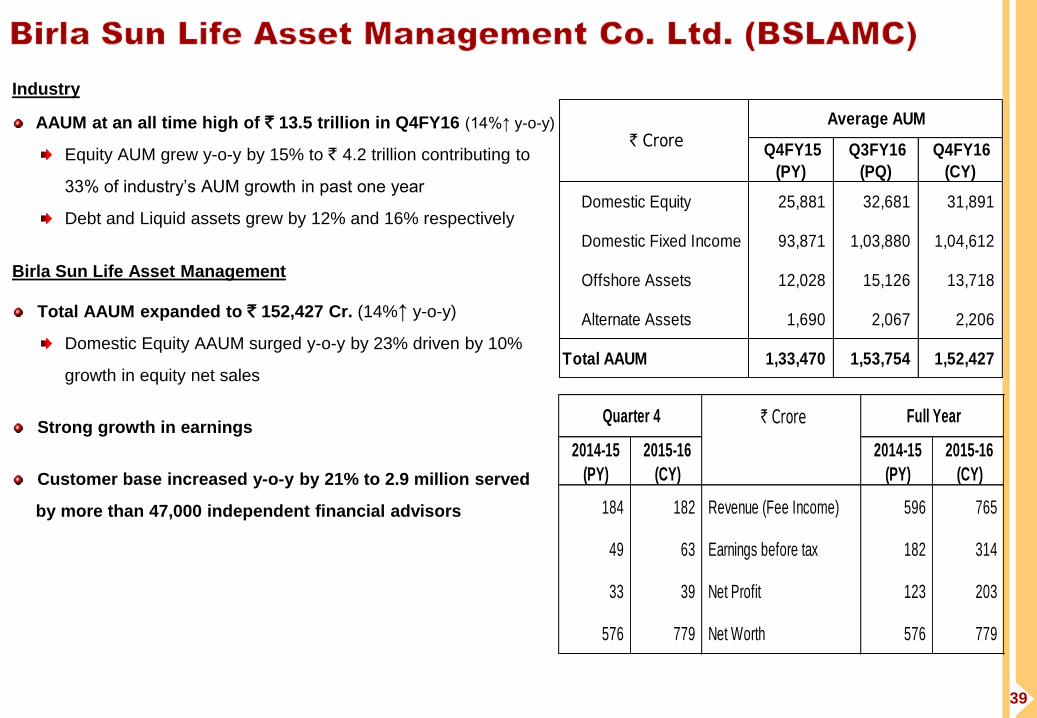
AAUM at an all time high of ` 13.5 trillion in Q4FY16 (14%↑ y-o-y)
Equity AUM grew y-o-y by 15% to ` 4.2 trillion contributing to
33% of industry’s AUM growth in past one year
Debt and Liquid assets grew by 12% and 16% respectively
Birla Sun Life Asset Management
Total AAUM expanded to ` 152,427 Cr. (14%↑ y-o-y)
Domestic Equity AAUM surged y-o-y by 23% driven by 10%
growth in equity net sales
Strong growth in earnings
Customer base increased y-o-y by 21% to 2.9 million served
by more than 47,000 independent financial advisors
Q4FY15
(PY)
Q3FY16
(PQ)
Q4FY16
(CY)
Domestic Equity 25,881 32,681 31,891
Domestic Fixed Income 93,871 1,03,880 1,04,612
Offshore Assets 12,028 15,126 13,718
Alternate Assets 1,690 2,067 2,206
Total AAUM 1,33,470 1,53,754 1,52,427
` Crore
Average AUM
` Crore
2014-15
(PY)
2015-16
(CY)
2014-15
(PY)
2015-16
(CY)
184 182 Revenue (Fee Income) 596 765
49 63 Earnings before tax 182 314
33 39 Net Profit 123 203
576 779 Net Worth 576 779
Quarter 4 Full Year
Revenues
40
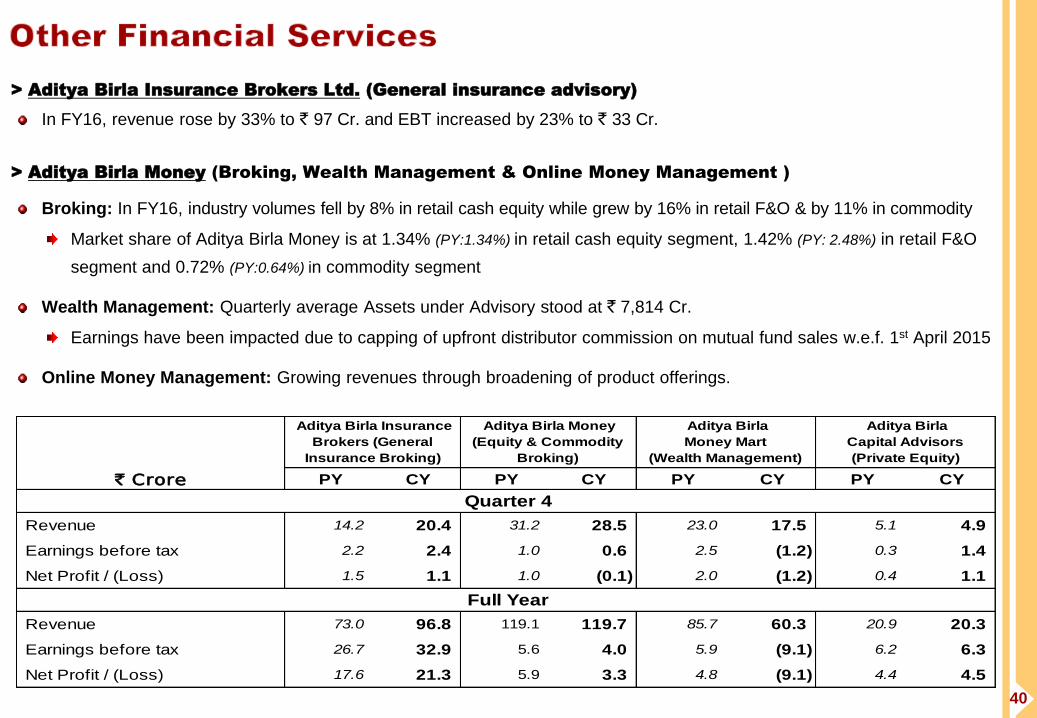
> Aditya Birla Insurance Brokers Ltd. (General insurance advisory)
In FY16, revenue rose by 33% to ` 97 Cr. and EBT increased by 23% to ` 33 Cr.
> Aditya Birla Money (Broking, Wealth Management & Online Money Management )
Broking: In FY16, industry volumes fell by 8% in retail cash equity while grew by 16% in retail F&O & by 11% in commodity
Market share of Aditya Birla Money is at 1.34% (PY:1.34%) in retail cash equity segment, 1.42% (PY: 2.48%) in retail F&O
segment and 0.72% (PY:0.64%) in commodity segment
Wealth Management: Quarterly average Assets under Advisory stood at ` 7,814 Cr.
Earnings have been impacted due to capping of upfront distributor commission on mutual fund sales w.e.f. 1st April 2015
Online Money Management: Growing revenues through broadening of product offerings.
PY CY PY CY PY CY PY CY
Revenue 14.2 20.4 31.2 28.5 23.0 17.5 5.1 4.9
Earnings before tax 2.2 2.4 1.0 0.6 2.5 (1.2) 0.3 1.4
Net Profit / (Loss) 1.5 1.1 1.0 (0.1) 2.0 (1.2) 0.4 1.1
Revenue 73.0 96.8 119.1 119.7 85.7 60.3 20.9 20.3
Earnings before tax 26.7 32.9 5.6 4.0 5.9 (9.1) 6.2 6.3
Net Profit / (Loss) 17.6 21.3 5.9 3.3 4.8 (9.1) 4.4 4.5
` Crore
Aditya Birla
Money Mart
(Wealth Management)
Full Year
Quarter 4
Aditya Birla Money
(Equity & Commodity
Broking)
Aditya Birla Insurance
Brokers (General
Insurance Broking)
Aditya Birla
Capital Advisors
(Private Equity)

41
Base of 184 million VLR (active) subscribers provides Idea a
unique platform for future growth in Mobile Voice, Wireless
Broadband, Digital Content and Mobile banking services
87.6% of Idea’s spectrum holding is acquired through auction
which provides flexibility to offer any service (2G / 3G / 4G), based
on consumer demand & eco-system.
Capex of ` 78 billion (excluding spectrum payout & capitalised
interest / forex cost) was incurred in FY16
Capex guidance for FY17 (excl. spectrum payout &
associated capex) stands at ` 65-70 billion.
FY16 Y-o-Y Δ%
Idea’s total Data Subscribers (Mn) 44.0 +32%
- Of these 3G / 4G Data Subscribers (Mn) 23.6 +63%
- 3G / 4G Data Volume Usage (Bn MB) 190.3 +109%
- 3G / 4G data volume as % of total volume 64% +1100 bps
VLR Subs. as % of reported Subs. 104.4%
(Feb’16)
Highest in
industry
VAS as % of Service revenue (Q4) 28.3% +380 bps
2014-15
(PY)
2015-16
(CY)
2014-15
(PY)
2015-16
(CY)
8,397 9,463 Revenue 31,527 35,935
3,251 3,656 EBITDA 11,281 13,257
1,577 1,642 Segment EBIT 5,508 6,379
942 576 Net Profit 3,193 3,080
Net Worth 23,029 25,768
Total Debt 26,859 41,503
` Crore
(Consolidated Results)
Quarter 4 Full Year
42
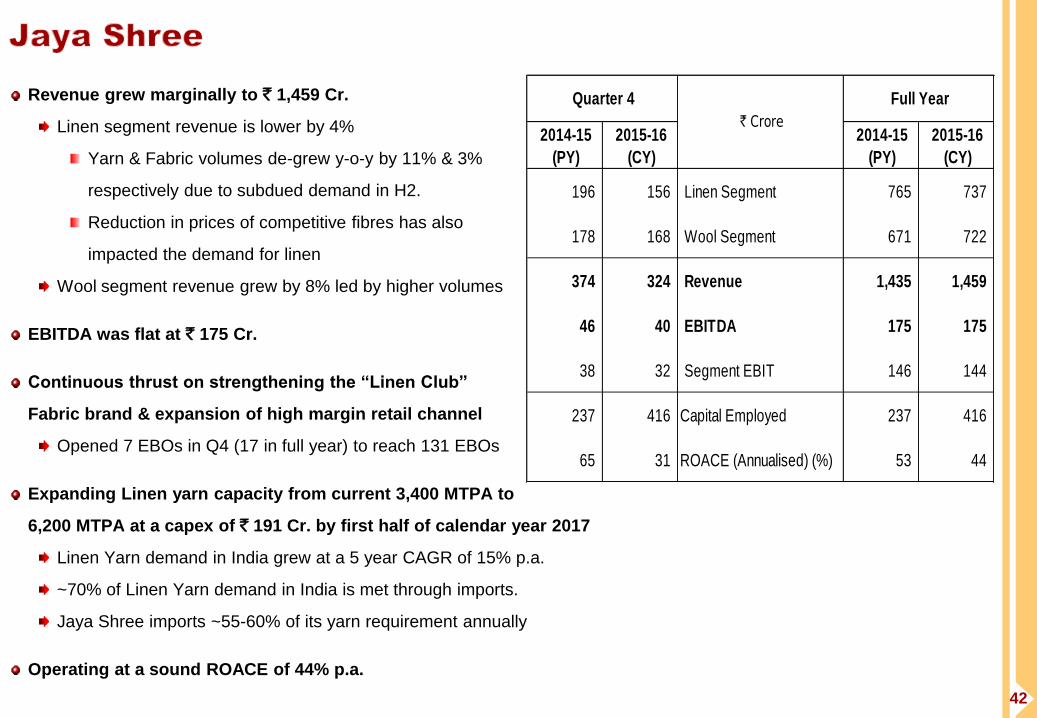
Revenue grew marginally to ` 1,459 Cr.
Linen segment revenue is lower by 4%
Yarn & Fabric volumes de-grew y-o-y by 11% & 3%
respectively due to subdued demand in H2.
Reduction in prices of competitive fibres has also
impacted the demand for linen
Wool segment revenue grew by 8% led by higher volumes
EBITDA was flat at ` 175 Cr.
Continuous thrust on strengthening the “Linen Club”
Fabric brand & expansion of high margin retail channel
Opened 7 EBOs in Q4 (17 in full year) to reach 131 EBOs
Expanding Linen yarn capacity from current 3,400 MTPA to
6,200 MTPA at a capex of ` 191 Cr. by first half of calendar year 2017
Linen Yarn demand in India grew at a 5 year CAGR of 15% p.a.
~70% of Linen Yarn demand in India is met through imports.
Jaya Shree imports ~55-60% of its yarn requirement annually
Operating at a sound ROACE of 44% p.a.
2014-15
(PY)
2015-16
(CY)
2014-15
(PY)
2015-16
(CY)
196 156 Linen Segment 765 737
178 168 Wool Segment 671 722
374 324 Revenue 1,435 1,459
46 40 EBITDA 175 175
38 32 Segment EBIT 146 144
237 416 Capital Employed 237 416
65 31 ROACE (Annualised) (%) 53 44
` Crore
Quarter 4 Full Year

43
Government’s gas pooling policy & allowing 100% production of
neem coated urea benefitted efficient urea manufacturers by
promoting higher production & reducing the subsidy receivables
After taking shutdown for over a month for two consecutive
years due to government policy for urea production beyond
100% capacity, during FY16, Indo-Gulf has achieved its
highest ever production at 1.208 million tons (18%↑ y-o-y)
& sales at 1.196 million tons (17%↑ y-o-y)
Despite higher urea sales volume, revenue marginally de-grew
to ` 2,498 Cr. due to pass through of reduction in natural gas
prices on account of gas pooling policy effective from 1st Jun’15
EBITDA surged by 41% to ` 209 Cr. driven by
Higher sales volume of Neem Coated Urea & lower repairs
(there was shutdown in last year)
Higher contribution on production beyond 100% capacity
due to gas pooling policy leading to lower gas prices
Outstanding fertilisers subsidy at ` 1,112 Cr. (PY: ` 1,193 Cr)
Received ` 489 Cr. in April 2016
ROACE improved y-o-y from 7% p.a. to 11% p.a.
2014-15
(PY)
2015-16
(CY)
2014-15
(PY)
2015-16
(CY)
176 300 Manufactured Urea Sales ('000 MT) 1,025 1,196
381 456 Revenue 2,557 2,498
348 432 Manufacturing(Urea, Customised Fertilisers)
2,248 2,189
33 25 Trading (Fertilisers, Seeds, Agro-Chemicals)
310 309
(20) 21 EBITDA 148 209
(28) 12 Segment EBIT 116 176
1,641 1,525 Capital Employed 1,641 1,525
(7) 3 ROACE (Annualised) (%) 7 11
Full Year
` Crore
Quarter 4

44
2014-15
(PY)
2015-16
(CY)
2014-15
(PY)
2015-16
(CY) VFY
4,632 5,171 Manufactured VFY Sales Volumes (MT) 18,839 20,412
172 191 Revenue (VFY & allied chemicals) ( ` Cr.) 699 745
Chemicals
20,716 21,211 Caustic Soda Sales Volume (MT)1 80,162 83,014
44 53 Revenue ( ` Cr.) 166 184
216 244 Total Revenue 865 928
45 75 EBITDA 197 266
35 64 Segment EBIT 156 223
757 715 Capital Employed 757 715
19 36 ROACE (Annualised) (%) 21 30
Full Year
` Crore
Quarter 4 Posted its highest ever earnings
Revenue at ` 928 Cr. rose y-o-y by 7%
VFY segment revenue grew by 7%
Lower imports led to higher VFY offtake while
improved realisation was driven by higher share of
Superfine yarn in the sales volume mix
Chemicals segment revenue surged by 11%
Higher caustic soda volumes and increase in caustic
prices led by improved international prices & lower
imports contributed
EBITDA rose y-o-y by 35% to ` 266 Cr.
Higher VFY & Caustic Soda volumes and improved
realisation augmented profitability
Scaling up VFY capacity at a capex of ` 40 Cr. by first half of calendar year 2017
ROACE enhanced y-o-y from 21% p.a. to 30% p.a.
Note 1 : Including captive consumption and inter unit sale

45
Sluggish demand in domestic market mainly due to poor
financial health of state utilities has impacted new projects &
caused delay in execution of ongoing projects.
While imports of ceramic insulators have declined post Anti-
dumping imposition, increased acceptance of alternate
technologies and impending land acquisition bill is impacting
demand in the domestic insulators industry.
In the backdrop of weak market conditions, Aditya Birla
Insulator’s revenue grew y-o-y by 6% to ` 581 Cr.
Volumes grew by 6% mainly in the transmission segment
Last year, operations of the Rishra plant were disrupted /
suspended for 42 days due to labour unrest
EBITDA soared y-o-y by 19% to ` 114 Cr.
ROACE has improved y-o-y from 17% p.a. to 22% p.a.
2014-15
(PY)
2015-16
(CY)
2014-15
(PY)
2015-16
(CY)
11,564 11,939 Sales Volumes (MT) 38,581 40,897
163 165 Revenue 548 581
30 30 EBITDA 95 114
26 26 Segment EBIT 76 96
455 401 Capital Employed 455 401
24 26 ROACE (Annualised) (%) 17 22
Full Year Quarter 4
` Crore
46
Certain statements made in this presentation may not be based on historical information or facts and may be “forward looking statements” including, but not
limited to, those relating to general business plans & strategy of Aditya Birla Nuvo Limited ("ABNL"), its future outlook & growth prospects, future
developments in its businesses, its competitive & regulatory environment and management's current views & assumptions which may not remain constant
due to risks and uncertainties. Actual results may differ materially from these forward-looking statements due to a number of factors, including future
changes or developments in ABNL's business, its competitive environment, its ability to implement its strategies and initiatives and respond to technological
changes and political, economic, regulatory and social conditions in the countries in which ABNL conducts business. Important factors that could make a
difference to ABNL’s operations include global and Indian demand supply conditions, finished goods prices, feed stock availability and prices, cyclical
demand and pricing in ABNL’s principal markets, changes in Government regulations, tax regimes, competitors actions, economic developments within India
and the countries within which ABNL conducts business and other factors such as litigation and labour negotiations.
This presentation does not constitute a prospectus, offering circular or offering memorandum or an offer to acquire any shares and should not be considered
as a recommendation that any investor should subscribe for or purchase any of ABNL's shares. Neither this presentation nor any other documentation or
information (or any part thereof) delivered or supplied under or in relation to the shares shall be deemed to constitute an offer of or an invitation by or on
behalf of ABNL.
ABNL, as such, makes no representation or warranty, express or implied, as to, and does not accept any responsibility or liability with respect to, the
fairness, accuracy, completeness or correctness of any information or opinions contained herein. The information contained in this presentation, unless
otherwise specified is only current as of the date of this presentation. ABNL assumes no responsibility to publicly amend, modify or revise any forward
looking statements on the basis of any subsequent developments, information or events or otherwise. Unless otherwise stated in this document, the
information contained herein is based on management information and estimates. The information contained herein is subject to change without notice and
past performance is not indicative of future results. ABNL may alter, modify or otherwise change in any manner the content of this presentation, without
obligation to notify any person of such revision or changes. This presentation may not be copied and disseminated in any manner.
INFORMATION PRESENTED HERE IS NOT AN OFFER FOR SALE OF ANY EQUITY SHARES OR ANY OTHER SECURITY OF ABNL
This presentation is not for publication or distribution, directly or indirectly, in or into the United States, Canada or Japan. These
materials are not an offer of securities for sale in or into the United States, Canada or Japan.
Copyright © 2016 Aditya Birla Nuvo Ltd.

47
Corporate Identity Number L17199GJ1956PLC001107
Regd. Office: Indian Rayon Compound, Veraval – 362 266 (Gujarat)
Corporate Office: 4th Floor ‘A’ Wing, Aditya Birla Center, S.K. Ahire Marg, Worli, Mumbai – 400 030
Website: www.adityabirlanuvo.com or www.adityabirla.com Email: [email protected]
Contact Us
Aditya Birla Nuvo Limited
Investor Relations Contact
Romi Talwar | Corporate Finance & Investor Relations | Aditya Birla Nuvo Ltd.
Address : Aditya Birla Centre | A-Wing | 4th Floor | S. K. Ahire Marg | Worli | Mumbai 400030
Phone : +91 22 2499 5573 | Email : [email protected]