proposed 2018 transportation element dia
TRANSCRIPT

COMPREHENSIVE PLAN EAR-Based Amendments
JUNE 2018
CHAPTER 2
TRANSPORTATION ELEMENT
DATA, INVENTORY AND ANALYSIS

St. Lucie County 2-1 June 2018 Comprehensive Plan Transportation Element DIA
TRANSPORTATION ELEMENT
DATA, INVENTORY AND ANALYSIS INTRODUCTION Until the early 1900’s access to St. Lucie County was essentially restricted to ocean going and inland waterway vessels. What few roads existed in the area were more or less dirt trails. Trips to neighboring communities that, in contemporary society, are now measured in minutes would often take all day or, in some cases, several days. With the construction of the Florida East Coast Railroad, in the 1910’s, St. Lucie County was now better able to export its agricultural products and to import the goods that it needed to grow. In the 1920’s and 1930’s the coastal road, known as the Federal Highway, provided an effective ground route to the cities of Miami and Jacksonville. Historically, St. Lucie County has been an agricultural community. Until the early 1970’s, there was little need for an extensive internal county road network, other than what was necessary to serve the immediate needs of the citrus and ranching community. In many instances, roadway and agricultural drainage canals shared the same right-of-way. However, with the explosive growth that the County has been experiencing over the last 25 years, and with the rates that are expected in the future, the need for an efficient transportation network grows at the same rate, or perhaps faster. This element addresses the requirements of Section 163.3177, Florida Statutes Rule 9J-5.019, Florida Administrative Code (FAC), for the development of the Transportation Element of the St. Lucie County Comprehensive Plan. The purpose of the Transportation Element is to plan for a coordinated, multi-modal transportation system for all of St. Lucie County. This element has been developed in coordination with the St. Lucie Transportation Planning Organization (TPO) and the Transportation elements of the City of Ft. Pierce and Port St. Lucie Local Comprehensive Plans. This Element provides for the coordination between the Future Land Use Element of the County’s Comprehensive Plan and both the short and long term transportation needs for St. Lucie County. EXISTING ROADWAY CONDITIONS As of September 2008, St. Lucie County maintained approximately 517 centerline miles of roadway throughout the County. Of these roads, approximately 374 miles are paved and 143 miles unpaved. The City of Port St. Lucie maintains approximately 877 centerline miles of roadway the City of Fort Pierce maintains approximately 136 centerline miles of roadway, while the St. Lucie Village maintains approximately 4 centerlines miles of roadway. Table 2-1 provides a summary of the major traffic arteries in the County and their functional classification. The roadway information identified in Table 2-1 is not intended to be inclusive of all roadways in the community. St. Lucie County, Port St. Lucie, and Fort Pierce maintain complete lists of all roadways in the county indicating their functional classification and maintenance responsibility. Table 2-2 provides a summary of the State Roadway System in St. Lucie County.

St. Lucie County 2-2 June 2018 Comprehensive Plan Transportation Element DIA
Table 2-1 Local Roadway System
Local Name Location Federal Functional Classification
7th Street South Urban Collector13th Street South Urban Collector13th Street North Urban Collector25th Street North Urban Principal Arterial25th Street South Urban Principal Arterial25th Street South / Urban Principal ArterialAiroso Blvd Urban Principal Arterial
W. of Johnston Rd Urban CollectorW. of Kings Hwy Urban LocalE. of Kings Hwy Urban Minor ArterialE. of 25th St Urban CollectorW. of 25th St Urban Collector
Bayshore Blvd Urban Minor ArterialE. of Florida's Turnpike Urban Minor ArterialW. of Florida's Turnpike Urban Principle Arterial
Bell Ave Urban CollectorW. of Savona Blvd Urban Minor ArterialE. of Savona Blvd Urban Collector
Cashmere Blvd Urban CollectorCitrus Ave Urban CollectorDarwin Blvd Urban CollectorDel Rio Blvd Urban CollectorDelaware Ave Urban Collector
N. of N. Torino Pkwy Urban Minor ArterialS. of N. Torino Pkwy Urban Collector
Edwards Rd Urban Minor ArterialN. of Indrio Rd Urban Minor ArterialS. of Indrio Rd Urban Local
Farmer's Market Rd Urban CollectorW. of Airoso Blvd Urban CollectorE. of Airoso Blvd Urban Minor Arterial
Florida's Turnpike Urban Principal Arterial - Freeway
Angle Rd
Avenue D
Becker Rd
California Blvd
East Torino Pkwy
Emerson Ave
Floresta Dr

St. Lucie County 2-3 June 2018 Comprehensive Plan Transportation Element DIA
Local Name Location Federal Functional Classification
Fort Pierce Blvd Urban CollectorGatlin Blvd Urban Principal ArterialGeorgia Ave Urban Collector
E. of Rangeline Rd Urban Minor ArterialW. of Rangeline Rd Rural Major Collector
Green River Pkwy Urban CollectorHeader Canal Rd Rural Major Collector
N. of Citrus Ave Urban CollectorS. of Citrus Ave Urban Minor ArterialW. of Kings Hwy Urban Principal ArterialE. of Kings Hwy Urban Minor Arterial
Interstate 95 Urban Principal Arterial - Interstate
Jenkins Rd South Urban Minor ArterialJohnston Rd Urban CollectorJuanita Ave Urban CollectorKeen Rd Urban Collector
N. of Indrio Rd Urban CollectorS. of Indrio Rd Urban Principal Arterial
Kings Hwy South Urban Principal ArterialLennard Rd Urban Minor ArterialMariposa Ave Urban CollectorMidport Rd Urban Minor ArterialMidway Rd East Urban Minor Arterial
W. of McCarty Rd Rural Principal ArterialE. of McCarty Rd Urban Principal ArterialE. of Westmoreland Blvd Urban CollectorW. of Westmoreland Blvd Urban LocalW. of McCarty Rd Rural Principal ArterialE. of McCarty Rd Urban Principal ArterialN. of Virgina Ave Urban Minor Arterial
Old Dixie Hwy Urban Minor ArterialN. of Kitterman Urban Minor ArterialS. of Kitterman Rd Urban CollectorW. of Keen Rd Urban Minor ArterialE. of Keen Rd Urban Principal ArterialE. of US 1 North Urban CollectorE. of Darwin Blvd Urban LocalW. of Darwin Blvd Urban Collector
Port St Lucie Blvd Urban Principal ArterialPrima Vista Blvd Urban Principal Arterial
Midway Rd West
Glades Cut-Off Rd
Indian River Dr
Indrio Rd
Kings Hwy North
Morningside Blvd
Okeechobee Rd
Oleander Ave
Orange Ave
Paar Drive
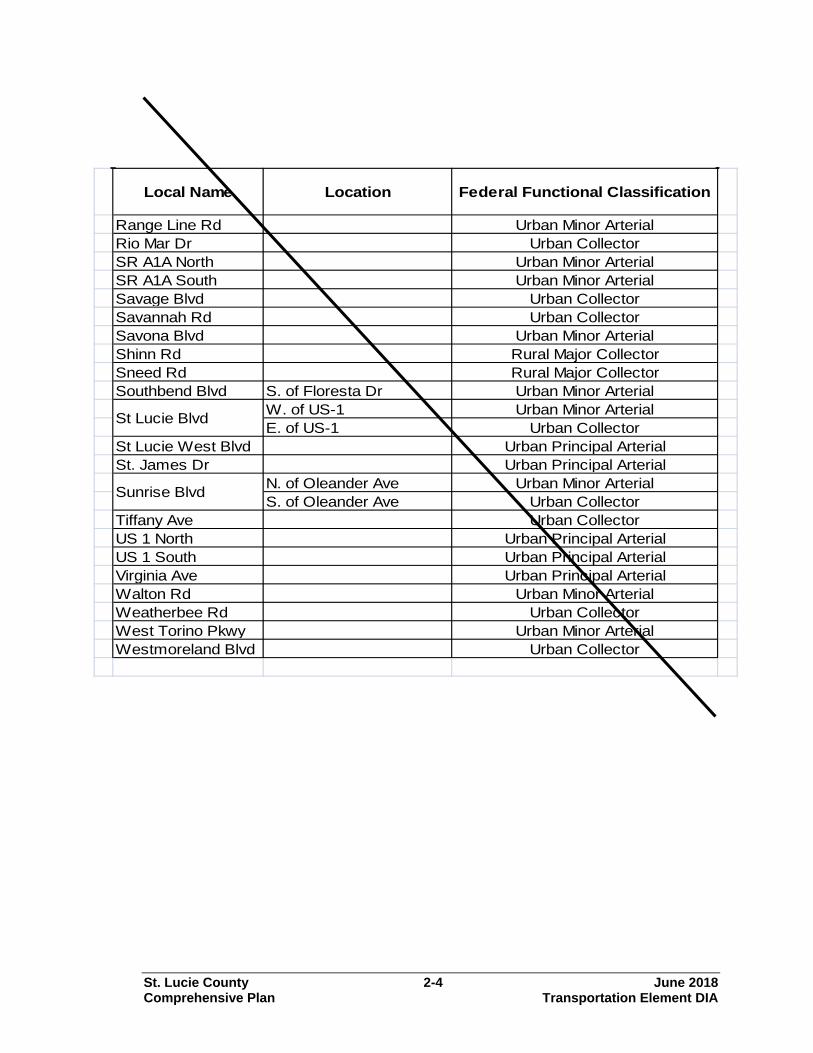
St. Lucie County 2-4 June 2018 Comprehensive Plan Transportation Element DIA
Local Name Location Federal Functional Classification
Range Line Rd Urban Minor ArterialRio Mar Dr Urban CollectorSR A1A North Urban Minor ArterialSR A1A South Urban Minor ArterialSavage Blvd Urban CollectorSavannah Rd Urban CollectorSavona Blvd Urban Minor ArterialShinn Rd Rural Major CollectorSneed Rd Rural Major CollectorSouthbend Blvd S. of Floresta Dr Urban Minor Arterial
W. of US-1 Urban Minor ArterialE. of US-1 Urban Collector
St Lucie West Blvd Urban Principal ArterialSt. James Dr Urban Principal Arterial
N. of Oleander Ave Urban Minor ArterialS. of Oleander Ave Urban Collector
Tiffany Ave Urban CollectorUS 1 North Urban Principal ArterialUS 1 South Urban Principal ArterialVirginia Ave Urban Principal ArterialWalton Rd Urban Minor ArterialWeatherbee Rd Urban CollectorWest Torino Pkwy Urban Minor ArterialWestmoreland Blvd Urban Collector
Sunrise Blvd
St Lucie Blvd

St. Lucie County 2-5 June 2018 Comprehensive Plan Transportation Element DIA
Local Name Location Federal Functional Classification
7th Street South Urban Minor Collector
13th Street South Urban Major Collector
13th Street North Urban Major Collector
25th Street North Urban Principal Arterial - Other
25th Street South Urban Principal Arterial - Other 25th Street South / St. James Dr Urban Principal Arterial - Other
Airoso Blvd Urban Principal Arterial - Other
Angle Rd
W. of Johnston Rd Rural Major Collector
W. of Kings Hwy Rural Major Collector
E. of Kings Hwy Urban Minor Arterial
Avenue D E. of 25th St Urban Major Collector
W. of 25th St Urban Major Collector
Bayshore Blvd N. of NW Prima Vista Blvd Urban Minor Arterial
Bayshore Blvd S. of NW Prima Vista Blvd Urban Principal Arterial - Other
Becker Rd E. of Florida's Turnpike Urban Minor Arterial W. of Florida's Turnpike Urban Minor Arterial
Bell Ave Urban Major Collector
California Blvd W. of Savona Blvd Urban Minor Arterial
E. of Savona Blvd Urban Minor Arterial
Cashmere Blvd Urban Major Collector
Citrus Ave Urban Minor Arterial
Darwin Blvd Urban Major Collector
Del Rio Blvd Urban Major Collector
Delaware Ave E. of S.17th St Urban Minor Arterial
Delaware Ave E. of S. 33rd St Urban Major Collector
Delaware Ave W. of S. 33rd St Urban Minor Collector
East Torino Pkwy E. of California Blvd Urban Minor Arterial
W. of California Blvd Urban Major Collector

St. Lucie County 2-6 June 2018 Comprehensive Plan Transportation Element DIA
Local Name Location Federal Functional Classification
Edwards Rd Urban Minor Arterial
Emerson Ave N. of Indrio Rd Urban Minor Arterial
Farmer's Market Rd Urban Major Collector
Floresta Dr W. of Airoso Blvd Urban Major Collector
E. of Airoso Blvd Urban Minor Arterial
Florida's Turnpike Urban Principal Arterial - Freeway
Fort Pierce Blvd Urban Major Collector
Gatlin Blvd E. of I-95 Urban Principal Arterial - Other
W. of I-95 Urban Minor Arterial
Georgia Ave Urban Minor Arterial
Glades Cut-Off Rd E. of Rangeline Rd Urban Minor Arterial
W. of Rangeline Rd Rural Major Collector
Green River Pkwy Urban Minor Arterial
Header Canal Rd Rural Major Collector
Indian River Dr Urban Major Collector
Indrio Rd W. of Kings Hwy Urban Principle Arterial - Other
E. of Kings Hwy Urban Minor Arterial
Interstate 95 Urban Principal Arterial - Interstate
Jenkins Rd South N. of Orange Ave Urban Major Collector
S. of Orange Ave Urban Minor Arterial
Johnston Rd Rural Major Collector
Juanita Ave Urban Major Collector
Keen Rd Urban Minor Collector
Kings Hwy North N. of Indrio Rd Urban Minor Collector
S. of Indrio Rd Urban Principal Arterial - Other
Lennard Rd Urban Minor Arterial
Mariposa Ave Urban Minor Collector
Midport Rd Urban Minor Arterial
Midway Rd E. of US-1 Urban Minor Arterial

St. Lucie County 2-7 June 2018 Comprehensive Plan Transportation Element DIA
Local Name Location Federal Functional Classification
Midway Rd E. of I-95 Urban Principal Arterial - Other
W. of I-95 Rural Principal Arterial - Other
Morningside Blvd
E. of Westmoreland Blvd Urban Major Collector
W. of Westmoreland Blvd Urban Local
Okeechobee Rd
W. of McCarty Rd Rural Principal Arterial
E. of McCarty Rd Urban Principal Arterial
N. of Virgina Ave Urban Minor Arterial
Old Dixie Hwy Urban Major Collector
Oleander Ave N. of Kitterman Urban Minor Arterial
S. of Kitterman Rd Urban Minor Collector
Orange Ave
W. of Kings Hwy Urban Minor Arterial
E. of Kings Hwy Urban Principle Arterial
W. of Rock Rd Rural Minor Arterial
Paar Drive E. of Darwin Blvd Urban Local
W. of Darwin Blvd Urban Minor Collector
Port St Lucie Blvd Urban Principal Arterial - Other
Prima Vista Blvd Urban Principal Arterial - Other
Range Line Rd Urban Minor Arterial
Rio Mar Dr Urban Major Collector
SR A1A North Urban Minor Arterial
SR A1A South Urban Minor Arterial
Savage Blvd Urban Major Collector
Savannah Club Blvd Urban Local
Savona Blvd Urban Minor Arterial
Shinn Rd Rural Major Collector
Sneed Rd Rural Major Collector
Southbend Blvd S. of Floresta Dr Urban Minor Arterial
St Lucie Blvd W. of US-1 Urban Minor Arterial
E. of US-1 Urban Major Collector

St. Lucie County 2-8 June 2018 Comprehensive Plan Transportation Element DIA
Local Name Location Federal Functional Classification
St Lucie West Blvd Urban Principal Arterial - Other
St. James Dr Urban Principal Arterial - Other
Sunrise Blvd N. of Oleander Ave Urban Minor Arterial
S. of Oleander Ave Urban Major Collector
Tiffany Ave Urban Major Collector
US 1 North Urban Principal Arterial - Other
US 1 South Urban Principle Arterial - Other
Virginia Ave Urban Principle Arterial
Walton Rd Urban Minor Arterial
Weatherbee Rd Urban Major Collector
West Torino Pkwy Rd Urban Major Collector
Westmoreland Blvd Urban Major Collector Strategic Intermodal System (SIS) Facilities In 2003, the Strategic Intermodal System was established through Florida legislation. The state sets level of service standards for the SIS facilities. The roadway portion of the SIS is composed of interconnected limited and controlled access roadways including interstate highways, Florida’s Turnpike, selected urban expressways and major arterial highways. It is a statewide transportation network that provides for high-speed and high-volume traffic movement within the state. The primary functions of SIS roadways and connectors are to serve interstate and regional commerce and other long distance trips. The system is intended to accommodate High-Occupancy Vehicles (HOVs), express bus transit and, in some corridors, passenger rail service. It is strongly recommended by the Florida Department of Transportation (FDOT) that local governments involve the FDOT in development review process at an early stage if the proposed development impacts any SIS facility. A list of all designated and emerging SIS facilities in St. Lucie County are is shown in Table 2-2.
Table 2-2 SIS FACILITIES IN ST. LUCIE COUNTY

St. Lucie County 2-9 June 2018 Comprehensive Plan Transportation Element DIA
Intrastate Highway System (FIHS) The Florida Intrastate Highway System (FIHS) was created in 1990 by the Florida Legislature and is composed of interconnected limited and controlled access roadways including interstate highways, Florida’s Turnpike, selected urban expressways and major arterial highways. The FIHS is a statewide transportation network that provides for high-speed and high-volume traffic movement within the state. The primary function of the system is to serve interstate and regional commerce and other long distance trips. The system is intended to accommodate High-Occupancy Vehicles (HOVs), express bus transit and, in some corridors, passenger rail service. In St. Lucie County, three roadways are part of the FIHS: all of the Florida’s Turnpike, all of I-95, and State Road 70 /Okeechobee Road from South Jenkins Road (east side of I-95 limited access fence) to the Okeechobee County line. Table 2-3 lists all the State Highway System roadways in the County.
Facility Designated SIS Emerging SISHighway Corridors I-95 SR 70 - West of Turnpike
TurnpikeSR 70 -Turnpike to I-95
Highway Connectors SR 70 - I-95 to US-1US-1 - SR 70 to Avenue H
Railway Corridors Florida East Coast Railroad (FEC) South Central Florida ExpressWaterways Atlantic Intracoastal WaterwayWaterway Connectors Port of Fort Pierce Channel
Facility Designated SIS Emerging SISRoadways I-95 SR 70/ Okeechobee Road
TurnpikeRailroad Florida East Coast Railroad (FEC) South Central Florida Express RailroadWaterways Atlantic Intracoastal Waterway

St. Lucie County 2-10 June 2018 Comprehensive Plan Transportation Element DIA
Table 2-3 St. Lucie County State Highway System
TRANSIT The existing transit system in St. Lucie County consists of fixed route buses and demand response service. The St. Lucie County Board of County Commissioners serves as the Community Transportation Coordinator (CTC). The CTC is responsible for coordinating transit service among public service agencies in St. Lucie County. The fixed route services and demand response services provided to St. Lucie County are by a division of Council On Aging of St. Lucie, Inc. (COASL). All fixed route/Community Transit services are provided by the Treasure Coast Connector (TCC). A general description of existing fixed-route and paratransit services provided in St. Lucie County are summarized below. The Community Transit consists of six fixed bus routes in St. Lucie County, including one regional fixed bus route. All bus routes are provided Monday through Friday between the hours of 7:00 am and 6:00 pm. The ridership is constantly increasing since the bus service has been started.
State Road Number Local Name From To C/L Miles
9 I-95 Martin County Line Indian River County Line
27.26
713 Kings Hwy SR 70/ Okeechobee Rd SR 5/ US-1 10.20
614 Indrio Rd 0.343 Mi W. of I-95 SR 713/ Kings Hwy
3.58
615 25th St Edwards Rd SR 5/ US-1 6.17
615 Indian River Dr 25th Street
CR 712/ Midway Rd CR 611B/ Edwards Rd
2.52
608 St. Lucie Blvd SR 615/ Martin Luther King Jr Blvd
Old Dixie Hwy US-1
0.57
607 Emerson Ave SR 614/ Indrio Rd Indian River County Line
2.53
5 US-1 Martin County Line Indian River County Line
21.45
70 Okeechobee Rd/ Virginina Ave
Okeechobee County Line SR 5/ US-1 25.23
A1A SR A1A/ Ocean Dr Martin County Line SR 5/ US-1 17.95
A1A North Bridge Cswy SR 5/US-1 Indian River County Line
7.71
68 Orange Ave SR 713/ Kings Hwy SR 5/ US-1 4.50
716 Port St. Lucie Blvd Underpass SR 91/ FL Turnpike
SR 5/ US-1 4.36
91 FL Turnpike Martin County Line Indian River County Line
35.10

St. Lucie County 2-11 June 2018 Comprehensive Plan Transportation Element DIA
Fixed Route Service Route 1: Route 1 operates along US 1 from the Stuart, Martin County to downtown Fort Pierce on weekdays, between hours 7:00 am to 6:00 pm with headways of one hour. This route serves all major trip generators and attractors on this corridor. It connects with route 2 and route 3. Route 2: Route 2 is known as the ‘North Fort Pierce Residential Transit’ runs in downtown Fort Pierce and circulates within the City of Fort Pierce. This route runs along Avenue D, to 53rd Street, Juanita Avenue and back to 8th Street. The hours of service are from 7:00 am to 6:00 pm with headways of one hour. Route 3: Route 3 is known as the ‘South Fort Pierce Business Transit’ also runs in the downtown Fort Pierce and circulates within City of Fort Pierce. This route runs along Orange Avenue to 33rd Street to Okeechobee Road as far west as Peters Road, traveling east to Virginia Avenue, 23rd Street to Okeechobee Road connecting to 8th Street. The hours of service are from 7:00 am to 6:00 pm with headways of one hour. Route 4: Route 4 is known as the Port St. Lucie Downtown Trolley, which runs in downtown Port St. Lucie. This route runs from 7:00 am to 6:00 pm with headways of one hour in the vicinity of Morningside Library and connects to the Port St. Lucie Community Center, Walton Road and transfer riders to the US-1 Treasure Coast Connector Route. Route 5: Route 5 was recently implemented in March, 2009. This route provides transit service between the Port St. Lucie Community Center and Tradition Landings using Gatlin Boulevard and Port St. Lucie Boulevard. Similarly to the other fixed bus routes, Route 5 operates from 7:00 am to 6:00 pm with headways of one hour. Route 6: Route 6 was also recently implemented in March, 2009. This route operates from the Port St. Lucie Community Center to Prima Vista Crossing, and then to the Shoppes at St. Lucie West Publix Shopping Center and Tradition Field Stadium. Route 6 operates from 7:00 am to 6:00 pm with headways of one hour. St. Lucie County offers traditional fixed-route public transit service through the Treasure Coast Connector (TCC). Additionally, the County provides paratransit services available to qualified residents that meet certain mobility needs and eligibility requirements as Transportation Disadvantaged (TD) and/or meet the criteria of the Americans with Disabilities Act (ADA). The fixed-route and paratransit system is operated by Community Transit, a division of the Council on Aging of St. Lucie, Inc. (COASL) under contract to the St. Lucie County Board of County Commissioners. The County also offers non-traditional public transportation services. Mid-2017, St. Lucie County Department of Community Services began operating a demand response TD service pilot program, known as Direct Connect, providing essential and life sustaining trips during hours that regular public transit and paratransit is not in operation. Direct

St. Lucie County 2-12 June 2018 Comprehensive Plan Transportation Element DIA
Connect fills evening and weekend service gaps enabling the County’s TD population to have access to public transportation services twenty-four hours per day, seven days per week. Last, St. Lucie County has rolled out a new bike share program in the first quarter, 2018. Many of the system’s bike share stations are strategically located to support the County’s fixed-route bus service through improving public access to TCC bus stops on the system’s most popular bus routes. Treasure Coast Connector
The TCC bus service consists of seven fixed-routes. Two TCC routes provide regional transit connections with Martin and Indian River Counties’ transit systems. Routes 1,2,3,4,5 and 6 operate from 6 am to 8 pm Monday through Friday, and Saturday from 8am to 12pm and 1pm to 4pm. Route 7 operates from 7am to 6pm Monday through Friday only. There is no fixed-route bus service on Sundays.
• Route 1 (TCC) was initiated in 2002. Route 1 begins near Downtown Fort Pierce at the Ft. Pierce Intermodal Facility located at North 8th Street and Avenue D. This route terminates at the Treasure Coast Mall in the Jensen Beach section of Martin County. Route 1 is the systems most heavily used bus route and it connects with every TCC bus route except Route 5.
• Route 2 began service in 2005. Route 2 connects commercial and residential
areas in North Fort Pierce with the route commencing and ending at the Ft. Pierce Intermodal Facility providing immediate connections to Routes 1, 3 and 7.
• Route 3 was implemented concurrently with Route 2, serving South Fort Pierce. Route 3 connects densely developed suburban-urban residential areas with important community shopping and governmental service centers including Walmart and the Florida Department of Health. Route 3 commences and terminates at the Ft. Pierce Intermodal providing immediate connections to Route 1,2 and 7.
• Route 4 (City of Port St. Lucie Trolley) began operating in 2006 serving the downtown St. Lucie Boulevard and City Center areas. Route 4 serves as a transit connector for many important Port St. Lucie destinations, including the County Annex Building, Town Center, PSL Community Center and City Hall complex. Accordingly, the Port St. Lucie Trolley has its own unique bus stop signage and bus façades demonstrating the importance of this bus route to the City. Route 4 connects with Routes 1, 5 and 6.
• Route 5 commenced operations in 2009 adding fixed route bus service along SW Gatlin and SW Port St. Lucie Boulevards. Route 5 is designed to connect the rapidly developing Tradition Planned Unit Development with the Port St. Lucie City Hall and Community Center serving residential, municipal government, and community shopping destinations. Route 5 connects with Routes 4 and 6 at the Port St. Lucie Intermodal Facility.
St. Lucie County 2-13 June 2018 Comprehensive Plan Transportation Element DIA
• Route 6 also began operating in 2009. Route 6 connects important major activity centers along the Prima Vista Boulevard/St. Lucie West Boulevard corridor including community shopping centers, recreational areas, library and community resources, and medical services. Route 6 connects with Routes 1,4 and 5.
• Route 7 is the newest TCC bus route and is a pilot service established through the Florida Department Service Development funding program. Route 7 begins and ends at the Ft. Pierce Intermodal Facility, and extends into adjacent Indian River County providing an immediate connection to their GoLine transit system. Route 7 connects with Route 1,2 and 3.
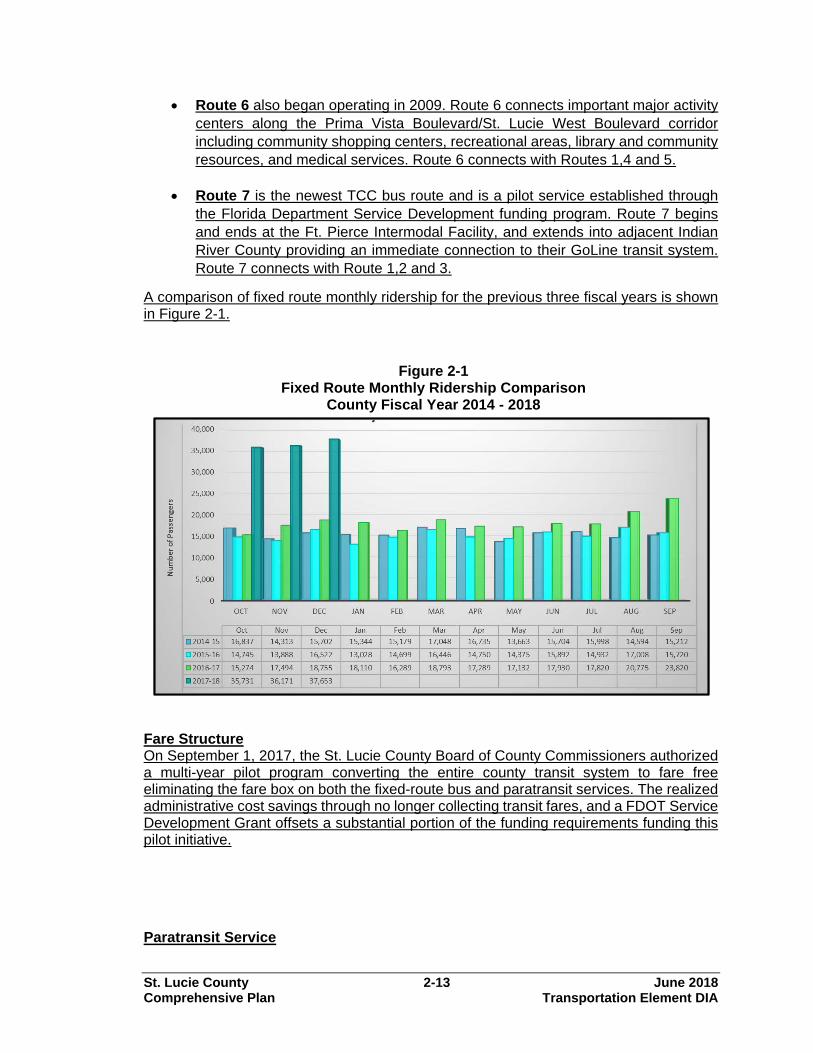
A comparison of fixed route monthly ridership for the previous three fiscal years is shown in Figure 2-1.
Fare Structure On September 1, 2017, the St. Lucie County Board of County Commissioners authorized a multi-year pilot program converting the entire county transit system to fare free eliminating the fare box on both the fixed-route bus and paratransit services. The realized administrative cost savings through no longer collecting transit fares, and a FDOT Service Development Grant offsets a substantial portion of the funding requirements funding this pilot initiative.
Paratransit Service
Figure 2-1 Fixed Route Monthly Ridership Comparison
County Fiscal Year 2014 - 2018

St. Lucie County 2-14 June 2018 Comprehensive Plan Transportation Element DIA
Community Transit provides door to door paratransit services for the American Disability Act of 1990 (ADA) program and the transportation disadvantaged program throughout St. Lucie County. The paratransit service runs Monday through Friday from 7:00 am to 6:00 pm. The Florida Commission for the Transportation Disadvantaged has designated St. Lucie County as the Community Transportation Coordinator (CTC) for the county service area. The CTC is responsible for coordinating and/or providing transportation services to individuals that meet the requirements of Transportation Disadvantaged (TD) as a result of age, income or a disability, where the individual cannot drive or have access to other transportation options.
In St. Lucie County, a TD demand-response, ADA compliant paratransit service is delivered through the St. Lucie County Board of County Commissioners’ contract operator, Community Transit. This demand response service incorporates an origin to destination reservation system requiring qualified clients to contact a Community Transit agent at least twenty-four (24) in advance to schedule their requested trip. Trip reservations are accepted up to two-weeks in advance.
The ADA requires that the county’s paratransit service compliment the service area’s fixed-route bus system. Federal Transit Administration (FTA) guidelines stipulate this paratransit service be available to provide access to the fixed-route inside of ¾-mile from each individual bus route.
A comparison of on-demand monthly ridership for the previous two fiscal years is shown in Figure 2-2.

St. Lucie County 2-15 June 2018 Comprehensive Plan Transportation Element DIA
Demand Response Beginning mid-year 2017, St. Lucie County Transit initiated a personal mobility pilot program for the transportation disadvantaged. The program, marketed as Direct Connect, provides off-hours TD trips during the evening and early morning on weekdays and Saturday, and all-day Sunday when the county’s traditional public transit is idle. Trips are provided for employment, education/job-skills training, non-emergency healthcare, and life-essential destinations such as food shopping. Transportation is delivered through third-party contractors including local taxi companies, non-ambulatory mobility providers, and the Lyft transportation network company. Direct Connect clients conduct their own trip planning and make travel arrangements directly with the county’s contract providers. Direct Connect was planned and designed to be a supplementary mobility program filling regular service gaps of the county’s public transit system. Demand for this program has been extremely robust demonstrating a significant need for expanding public transit service hours and suggesting the implementation of a comprehensive transit optimization analysis. In less than one-year of operation, Direct Connect has exhausted its initial grant funding cycle expending $299,950 in travel expenses. The county transit staff is instituting measures to reduce average trip costs and is vigorously seeking additional operating funds to support this now essential transportation service. Figure 2-3 shows monthly and cumulative Direct Connect client enrollments from May 2017 through February, 2018
Figure 2-2 On-Demand Monthly Ridership Comparison
County Fiscal Year 2015 - 2017

St. Lucie County 2-16 June 2018 Comprehensive Plan Transportation Element DIA
Non-Conventional Public Transportation St. Lucie County, in partnership with FDOT, and the Cities of Fort Pierce and Port St. Lucie, began operating a countywide bike share early this year. The first phase of the bike share consists of nine stations supported by fifty bicycles. Stations are located at recreational destinations, including the Fort Pierce Marina Square (Figure 2-4), South Hutchinson Island and the Port St. Lucie Civic Center. Other stations are strategically located in proximity to the county’s busy bus routes to help eliminate first/last mile transit access barriers. County transit staff are currently working with state and potential private sponsors to provide a sustainable bike share system, and allow for future expansion.
Figure 2-3 Direct Connect Client Enrollment

St. Lucie County 2-17 June 2018 Comprehensive Plan Transportation Element DIA
Park and Ride There are currently two park and ride lots located in St. Lucie County, one on Bayshore Boulevard at Florida’s Turnpike and one on Bayshore Boulevard south of Gatlin Boulevard. Park and ride lots are dedicated (joint use or stand-alone) locations for private automobiles for carpooling and, in some cases, transit. Park and ride lots are dedicated (joint use or stand-alone) locations for private automobiles for carpooling and, in some cases, transit. Table 2-4 lists the locations of park and ride lots in St. Lucie County.
In addition to the existing park and ride lots described above, FDOT is in the process of constructing a regional bus terminal with a park and ride component on Gatlin Boulevard near I-95. The project, known as the Jobs Express Terminal, will accommodate multiple
Table 2-4 St. Lucie County Park and Ride Lots
Figure 2-4 Fort Pierce Marina Bike Share Station

St. Lucie County 2-18 June 2018 Comprehensive Plan Transportation Element DIA
transit providers and will add more than 150 park and ride spaces to the County’s inventory. Parking Generally, St. Lucie County has sufficient capacity of public and private parking facilities. One of the largest parking public parking facilities is located in downtown Ft. Pierce behind City Hall and has a capacity of 465 parking spaces. EXISTING BICYCLE/PEDESTRIAN CONDITIONS St. Lucie County recognizes the need for pedestrian and bicycle accommodations as an integral component of a Countywide transportation System. The development of bicycle and pedestrian facilities and the encouragement of their use serves several important purposes which benefit all the citizens of St. Lucie County. Health and physical benefits: Bicycling and walking are healthy modes of
transportation that, when incorporated into a daily routine, can be both a sustainable and time-efficient exercise.
Environmental benefits: Bicycling and walking can replace short distance motor
vehicle trips which are the least fuel efficient and generate the most pollution per mile traveled.
Transportation benefits: Roadway improvements to accommodate bicyclists
and pedestrians can also enhance safety for motorists by reducing run-off road, head-on, and sideswipe motor vehicle crashes. Roadway widening and drainage improvements can also result in a decrease in the rate of normal roadside erosion and degradation, thereby increasing road longevity and reducing maintenance costs. Traffic calming effects of bicycle and pedestrian improvements in some areas can also serve to reduce vehicle speeds without reducing vehicle capacity, resulting in a decrease of the likelihood of serious injury or death in a motor vehicle accident. Potential reductions in both roadway congestion and parking requirements due to bicycling or walking can result in considerable savings due to decreased roadway and/or parking construction/ improvement costs. Bicycle and pedestrian facilities can also serve to greatly increase the accessibility and viability of transit service.
Recreational benefits: Bicycle and pedestrian facilities can provide an easily
accessible outdoor resource for many forms of recreation, particularly when these facilities are located in scenic environments and/or in conjunction with other recreational facilities.

St. Lucie County 2-19 June 2018 Comprehensive Plan Transportation Element DIA
Quality of life benefits: Bicycle and pedestrian facilities, depending upon their setting, have the capacity to provide significant educational, cultural, societal, and economic benefits.
St. Lucie County currently requires that pedestrian and bicycle accommodations be incorporated into all urban roadway construction/improvement projects. Federal and State guidelines also address the provision of bicycle and pedestrian facilities in conjunction with roadway improvement projects. On May 6, 2008, the Board of County Commissioners adopted the St. Lucie County Bicycle, Pedestrian, Greenways & Trails Master Plan. completed by the St. Lucie Transportation Planning Organization (TPO). The St. Lucie County Bicycle, Pedestrian, Greenways & Trails Master Plan This plan was further fortified by the Go2040 Long Range Transportation Plan (LRTP) of the St. Lucie TPO, including the St. Lucie Walk-Bike Network, which inventoried all the existing sidewalks, bike paths, missing sidewalks, and provided suggestions identified projects to improve the system. Sidewalk Gaps on State Roadways The recent SLC Bicycle Pedestrian, Greenways & Trails study utilizes FDOT roadway inventories to determine gaps along State roadways for potential funding purposes. The study identifies the following sections of state roadways to have missing or incomplete sidewalks:
• S.R. A1A – Blue Heron Boulevard to Fire Station #8 • S.R. A1A – Angelfish Drive to Indian River County Line • S.R. 5 (U.S-1) – Rio Mar Drive to Edwards Road (portions under construction) • S.R. 5 (U.S-1) – North of Euclid Street to Indian River County Line • S.R. 607 (Emerson Avenue) – Indrio Road to Indian River County Line • S.R. 614 (Indrio Road) – I-95 to Old Dixie Highway • S.R. 615 (25th Street) – U.S-1 to Industrial Avenue 3 • S.R. 615 (25th Street) – Midway Road to Edwards Road (under construction) • S.R. 70 (Okeechobee Road) – Crossroads Parkway to Jenkins Road • S.R. 70 (Okeechobee Road) – Darter Court to Crossroads Parkway • S.R. 70 (Okeechobee Road) – West of Kings Highway • S.R. 70 (Virginia Avenue) – Okeechobee Road to Hartman Road • S.R. 713 (Kings Highway) – Okeechobee Road to Indrio Road • S.R. 713 (Turnpike Feeder) – Indrio Road to Susan Lane • S.R. 713 (Turnpike Feeder) – south of Spanish Lakes Boulevard to U.S-1
Furthermore, the bicycle and pedestrian systems analysis portion of the study is intended to serve as input to St. Lucie County’s Bicycle, Pedestrian, Greenways, and Trails Master Plan. The bicycle and pedestrian systems analysis provides input to the Master Plan regarding gaps and missing links in the network, demand for bicycle and pedestrian facilities, and crash information to determine hazardous intersections and locations. The high bicycle and pedestrian crash corridors found during the study period include U.S. 1, Okeechobee Road, Orange Avenue, Port St. Lucie Boulevard, and St. Lucie West Boulevard.

St. Lucie County 2-20 June 2018 Comprehensive Plan Transportation Element DIA
Through the St. Lucie Walk-Bike Network, the The St. Lucie TPO seeks to prioritize funding for bicycle and pedestrian improvements that will complete missing gaps in bike lane and sidewalk networks that will serve areas of the County that experience higher bicycle and pedestrian usage. The improvements will address areas of potential safety concerns and will enhance the network around schools. In addition, FDOT funds can be used to implement bicycle and pedestrian improvements along roadways that connect to the state roadway system. The County would like to continue to work towards the implementation of the St. Lucie TPO Bicycle and Pedestrian Plan Walk-Bike Network. The St. Lucie County’s Bicycle, Pedestrian, Greenways, and Trails Master Plan Walk-Bike Network considers both on-road facilities and off-road bicycle and pedestrian pathways. The ultimate goal is to develop an interconnected network of greenways, trails, bike lanes, and sidewalks to enhance non-motorized transportation options in St. Lucie County. Table 2-5 contains current desired sidewalk projects that are unfunded.
Project From To Approx.
Length (miles) Estimated Cost Angle Road Kings Highway N. 53rd Street 1.26 $1,461,595.00 Easy Street Route One Silver Oak Dr. 0.94 $1,090,396.00 Indrio Road Kings Highway Route One 2.63 $3,050,790.00 Indrio Road Route One Old Dixie Hwy. 0.16 $225,000.00 Juanita Avenue N. 53rd Street N. 25th Street 1.76 $2,041,592.00 Juanita Avenue Bridge US1 0.17 $450,000.00 Keen Road Angle Road St. Lucie Blvd. 1 $1,160,000.00 N. Kings Hwy. N. of I-95 Indrio Road 4.5 $5,219,982.00
Old Dixie Hwy. St. Lucie Blvd. Area Tpk. Feeder Area 5.23 $6,066,780.00
Oleander Ave. Midway Road Edwards Road 2.5 $1,202,125.00 Oleander Ave. Midway Road Saeger Avenue 1.5 $1,323,840.00 Route One St. Lucie Blvd. Turnpike Feeder 5.26 $6,101,580.00 Selvitz Road Edwards Road So. of Midway Rd. 2.38 $2,760,790.00 Silver Oak Drive Easy Street E. Midway Road 1.79 $2,076,392.00 St. James Drive Royce Oleander Ave. 0.25 $260,000.00 Taylor Dairy Rd. Angle Road St. Lucie Blvd. 1.01 $1,160,000.00
W. Midway Rd. W. of Glades Cut-Off Shinn Road Area 4.96 $5,753,580.00
Walton Road Lennard Road Green River 1.1 $632,730.00 Weatherbee Rd. US1 Oleander Ave. 0.5 $445,220.00 St. Lucie Blvd. Kings Highway N. 25th Street 3.02
Source: FDOT, St. Lucie TPO 2017 PORT/AIRPORT/RAIL/WATERWAY St. Lucie County is home to the Port of Ft. Pierce and the St. Lucie County International Airport. Heavy rail freight service in the County is provided by the Florida East Coast (FEC) Railroad. The Atlantic Intracoastal Waterway passes through the eastern part of the county via the Indian River Lagoon.
Table 2-5 Unfunded Sidewalk Projects

St. Lucie County 2-21 June 2018 Comprehensive Plan Transportation Element DIA
St. Lucie County Treasure Coast International Airport The St. Lucie County Treasure Coast International Airport (FPR) is located north of Fort Pierce. It is a general aviation airport that serves several flight schools, an airplane manufacturer, and several businesses ancillary to airport and flight operations. It serves charter flights to and from the Bahamas, as well as, flights throughout the continental United States. Federal Express and United Parcel Services have flight operations from here. The Airport Industrial Park, just to the east of the airport, also benefits from the proximity to the airport and its services. The vast 3,660 acre airport property is owned by the St. Lucie County Board of County Commissioners (BOCC), and is managed by the County’s Airport Department. Because of the availability of developable airport property, a strong potential for both aviation and non-aviation related growth exists at the airport Within St. Lucie County, much of the airport property and surrounding area is designated as a Foreign Trade Zone (FTZ). The Florida Aviation System Plan (FASP) 2025 identifies two types of airports: commercial service and community airports – the FDOT selected the term “community airport” rather than “general aviation” to emphasize the importance of the airport to the community it serves. Since FPR only serves general aviation activity at this time, it is classified as a community airport. However, the FASP 2025 indicates that FPR may attract future commercial airline services associated with tourism, business, and international passengers. (Source: Draft St. Lucie County International Airport Master Plan Update, March 2009). The 2011 Master Plan Update for the Treasure Coast (fka St. Lucie County) International Airport contains a complete discussion of existing conditions, projected demand, facility requirements, and recommended alternatives and funding sources Residential development is normally not compatible with 65 DNL (average day/night sound level) or greater unless soundproofing is incorporated into the structure or the community determines that this type of development is necessary in this noise environment. Future noise contours, which consider expansion of the airport facilities, show that the 65 DNL (average day/night sound level) encompasses a portion of the residential development to the east and southeast of the Airport. An FAR Part 150 Noise Compatibility Study was completed in 2005 which included a detailed noise study to specifically identify noise sensitive areas around the Airport. With an approved Part 150 Study, the FAA and FDOT may provide funding to the Airport in sponsoring noise abatement and mitigation projects such as the purchase, relocation, or soundproofing of homes, and noise abatement measures, and other noise mitigation measures. Certain recommendations were approved including 4 mile Airport notification to residential developers requiring the disclosure of the existence of the airport and aircraft operating in the area, limitation of school development where F.S. Chapter 333 prohibits schools off the ends of runways, and noise easements and/or sound insulation for new residential development in the 60 DNL noise contour. The Airport also instituted Voluntary Noise Abatement Procedures for aircraft in consideration of residential uses south and east of the airport. Additional issues to airport operators are wildlife hazards, tall structures, towers that may create electrical interference with radio transmissions or Navaids, and lighting or glare that could create hazard for pilots using the airport. Furthermore, as a condition of accepting grants for the Airport, the County is required to protect the Airport from incompatible

St. Lucie County 2-22 June 2018 Comprehensive Plan Transportation Element DIA
development. The County does have an Airport Overlay Zone in the Land Development Code (LDC), which helps address issues dealing with incompatible land uses. The St. Lucie County Treasure Coast International Airport protection zones are shown in Figure 2-15.

St. Lucie County 2-23 June 2018 Comprehensive Plan Transportation Element DIA
Figure 2-15 St. Lucie County Treasure Coast International Airport - Runway Protection Zones
Source: St. Lucie County Planning and Development Services Department

St. Lucie County 2-24 June 2018 Comprehensive Plan Transportation Element DIA
Port of Ft. Pierce The Port of Ft. Pierce is the region’s only deep water port, maintaining a channel depth of 28 feet. The County serves as the Port Authority for the Port of Ft. Pierce. The County incorporated a Port Sub-element in the Comprehensive Plan in 2002 as required by Florida statutes. Much of the Port Planning Area lies within the City of Fort Pierce and the Fort Pierce Community Redevelopment Area. A small portion of the Port Planning Area lies within unincorporated St. Lucie County and development of this portion is governed by the County’s Future Land Use Element, the Port Sub-element, and the County’s Land Development Code. The Port of Fort Pierce, approximately 290 acres, is the region’s only deep water port. The Port’s shipping channel maintains an authorized Corps of Engineers depth of 28-feet. Much of the Port Planning Area lies within the City of Fort Pierce and the Fort Pierce Community Redevelopment Area. A small portion of the Port Planning Area lies within unincorporated St. Lucie County and development of this portion is governed by the County’s Future Land Use Element, the Port Sub-element, and the County’s LDC. The 2002 update of the Port of Fort Pierce Master Plan was adopted by the St. Lucie County Board of Commissioners, Ordinance 02-014. The Master Plan provides general goals, objectives and policies to encourage gentrification of the port through a mix of recreational, commercial residential and industrial uses. The plan was also written to strengthen local control over the port uses, and provide flexibility to ensure governmental coordination. The Port Master Plan reflects a vision of how the Port could capitalize on its unique potential for diversified maritime and other waterfront uses of both a public and private nature. That vision sees the Port as a distinctive destination, serving as a catalyst for complementary and recreational development. In addition to the Port Master Plan, the County also adopted the Port of Fort Pierce Implementation Plan. A consolidated master plan for the Port of Fort Pierce was undertaken by FDOT, District 4, Office of Modal Development at the request of the Port of Fort Pierce and St. Lucie County. The consolidation of plans included the Port of Fort Pierce 2002 Port Master Plan, the 2012 update to the 2002 master plan and two studies recently performed for development of the Port’s Fisherman’s Wharf area in 2015 and 2016.
The consolidated master plan is not intended as an update to the master plan nor does it reflect any changes to the overall vision, goals, objectives or policies of the Port. It is intended as a first step to provide a consolidated planning document for the County (Port) to use as a basis for a strategic plan for implementing the stated vision for the Port.
St. Lucie County owns 20 acres at the Port and recently acquired an additional 12.3 acres, formerly known as the "Indian River or King Terminal" property. The goal of St. Lucie County for the port is to broaden and strengthen the economic base of the regional community by providing adequate infrastructure and development processes for water-dependent port development; with particular focus on a marine complex for mega yacht maintenance overall and refitting (MRO). Fisherman’s Wharf, a 24.5 acre mixed use track of land, located at the southern end of the Port, is intended to act as a buffer between the industrial port area and historic downtown Fort Pierce. The idea is to transform the Fisherman’s Wharf area into an economically diverse “Transition Zone” with uses that are compatible and complementary to the area.

St. Lucie County 2-25 June 2018 Comprehensive Plan Transportation Element DIA
The Port is bounded by the State Road A1A causeways on the north and the south, on the west by US 1 - State Road 5/Florida East Coast Railroad (FEC) and on the east by the Indian River Lagoon. The area can be accessed from the intersections of US 1 & Second Street, Seaway Drive at the Indian River Drive, and US 1/Ave H and Seaway Drive/Indian River Drive. The principal arteries in the region, both I-95 and the Turnpike, are easily accessible from the Port through via Avenue H to U.S. Highway 1 to Virginia Avenue/SR 70 (Okeechobee Road) and Orange Avenue, which together are a designated SIS Connector. Currently, the Port is not designated a SIS facility but is identified as a Freight Activity Center (FAC) in the MPO 2030 LRTP. The Port has on-site direct access to the Florida East Coast Railroad. Existing Rail and Freight Conditions Heavy rail freight service in St. Lucie County is provided by the Florida East Coast (FEC) Railroad which serves the east coast of Florida from Jacksonville to Miami. The Florida East Coast (FEC) Railroad runs through eastern Fort Pierce parallel to US 1, and ties into another track which runs across the southwest portion of the City. The Florida East Coast (FEC) is a SIS-Designated facility Railway Corridor in the St. Lucie County. The Florida East Coast (FEC) Intermodal Yard is identified as the Freight Activity Center (FAC) in MPO’s proposed future SIS. The South Central Florida Express (SCXFE) is an independent short line railroad, owned and operated by US Sugar, along Glades Cutoff Road. The SCXFE provides the service from southwest to northeast portions of St. Lucie County. It is designated as an Emerging SIS Railway Corridor. Atlantic Intracoastal Waterway The Atlantic Intracoastal Waterway traverses the eastern edge of St. Lucie County via the Indian River Lagoon. The Waterway is maintained by the U.S. Army Corps of Engineers and, there is one drawbridge crossing at the SR A1A access to North Hutchinson Island. The Intracoastal Waterway serves as a means of access to the Fort Pierce Inlet for both recreational and business uses. The nearest ocean inlets north and south of the Fort Pierce Inlet are the Sebastian Inlet to the north and the St. Lucie Inlet to the south. Of these three area inlets, the Fort Pierce Inlet is generally recognized as being the safest to navigate due to limited shoaling and predictable currents. Hurricane Evacuation In 2003, the Federal Emergency Management Agency and the Army Corp of Engineers completed the Treasure Coast Regional Hurricane Evacuation Study Update to the original 1994 study. The Statewide Regional Evacuation Study Program updated their regional transportation analyses in 2016. This study includes an evaluation of the Treasure Coast region and its ability to properly evacuate the area in response to a hurricane. Generally, t The In-County evacuation Clearance time for St. Lucie County, under the worst case operational scenario in 2020, are 14.25 is 26 hours. In-County evacuation is considered to be the type of evacuation where County residents do not leave the area. Out-of-County evacuation times have not been computed on a County by County basis. The Out of County Clearance time under the worst case operational scenario in 2020 is 30 hours. The Federal Emergency Management Agency and the Army Corp of Engineers

St. Lucie County 2-26 June 2018 Comprehensive Plan Transportation Element DIA
completed the Treasure Coast Regional Hurricane Evacuation Study calculated regional clearance times. Regional clearance times are considered to be a truer indication of the evacuation needs in the event that a Category 3 or high storm were to approach the Treasure Coast. The worst case scenario under the regional evacuation plan requires 30 hours of evacuation time. The Regional Clearance time for the Treasure Coast region under the worst case operational scenario in 2020 is 35 hours. The original study identified four transportation corridors that may be considered regional evacuation routes, I-95; the Florida Turnpike; SR 70, west of Fort Pierce and CR 68, west of Fort Pierce. All other primary evacuation routes would be considered local evacuation routes. The significance between these two locally designated evacuation route classifications is that a local evacuation route is not as likely to have regional evacuation traffic on it during an evacuation event. However, it is possible that there could be extreme levels of congestion at the points of intersection between these local and regional routes. LEVEL OF SERVICE ANALYSIS Level of Service (LOS) is a method of describing the operating condition of a roadway in relation to the volume of traffic using that roadway. Factors which influence level of service include the number of vehicle lanes, the number of vehicles on the roadway, speed of these vehicles, traffic interruptions, ability to maneuver freely and safely as well as the driving comfort and convenience of the public. Level of Service Standards are to be used as a guide for transportation planning purposes and to identify roadway needs and to provide a measure for determining time and type of roadway improvement. In establishing Level of Service, Rule 9J-5.005, FAC, states:
Level of Service Standards: Level of service standards shall be established for ensuring that adequate facility capacity will be provided for future development and for purposes of issuing development orders or development permits pursuant to Section 163.3202(2)(g), Florida Statutes. Each local government shall establish a level of service standard for each public facility located within the boundary for which such local government has authority to issue development orders or development permits. Such level of service standards shall be set for each individual facility or facility type and not on a system wide basis.
Rule 9J5.019(4)(c)(1), FAC, provides the following additional input regarding levels of service as they relate to transportation planning:
Establishment of level of service standards at peak hour for roads and public transit facilities within the local government’s jurisdiction. For facilities on the Florida Intrastate Highway System as defined in s. 338.001, F.S., the local governments shall adopt the level of service standards established by the Department of Transportation by rule. For all other facilities on the future traffic circulation map, local governments shall adopt adequate level of service standards...
Tables 2-46 and 2-7 shows the level of service standards for urban and non-urban roadways in St. Lucie County.
Table 2-46
Non-SIS Minimum Level of Service Standards for Urban and Non-Urban Roadways in St. Lucie County

St. Lucie County 2-27 June 2018 Comprehensive Plan Transportation Element DIA
Facility Type Peak Hour
Non-State Roadway (local) DNon-State Roadway (Major City/County) DNon-State Roadway (arterial) EIntrastate FIHS (rural)Limited Access BControlled Access BIntrastate FIHS (Urban)Limited Access C(D)Controlled Access COther Non-SIS State RoadsMulti-lane (Rural/Urban)Rural BUrban DTwo-lane (Rural/Urban) Rural CUrban D
Table 2-7 SIS Facilities Level of Service Standards
SIS Roadway Corridors Roadway Segment LOS
Standard I-95 Martin County Line to Gatlin Boulevard C I-95 Gatlin Boulevard to St. Lucie Boulevard C I-95 St. Lucie Boulevard to Midway Road C I-95 Midway Road to SR 70/ Okeechobee Road C I-95 SR 70/ Okeechobee Road to SR 68/ Orange Avenue D I-95 SR 68/ Orange Avenue to SR 614/ Indrio Road D I-95 SR 614/ Indrio Road to Indian River County Line C
Florida’s Turnpike Martin County Line to Becker Road C Florida’s Turnpike Becker Road to Port St. Lucie Boulevard C Florida’s Turnpike Port St. Lucie Boulevard to SR 70/ Okeechobee Rd C Florida’s Turnpike SR 70/ Okeechobee Road to Indian River County B
SR 70/ Okeechobee Road Okeechobee County Line to Carlton Road B SR 70/Okeechobee Road Carlton Road to McCarthy Road B SR 70/Okeechobee Road McCarthy Road to Florida’s Turnpike B SR 70/Okeechobee Road Florida’s Turnpike to I-95 C
The County wishes to maintain a LOS D or better for all Non-SIS roadways but recognizes that allowing a LOS E for non-state arterial roadways allows development to proceed while a minimum of LOS D might cause severe constraints on private development. Therefore, the County has adopted a minimum LOS E for all non state arterial roadways. However, a LOS D will be utilized for all non-state arterial roadways when establishing transportation impact fees.

St. Lucie County 2-28 June 2018 Comprehensive Plan Transportation Element DIA
Existing Level of Service Analysis St. Lucie County and FDOT collect the traffic counts on the state and major roadways within the county. Table 2-58 shows the most recent generalized peak hour traffic volumes and level of service conditions for the County’s roadway network based on the minimum levels of service standards identified in Tables 2-46 and 2-7.

St. Lucie County 2-29 June 2018 Comprehensive Plan Transportation Element DIA
Table 2-58 Existing LOS Analysis
Roadway Name Location Roadway Classification # of Lanes
LOS Adopted
2008 AADT
2008 Peak Hour
Volume
2008 LOS
S. of Delaware Ave 2 D 1,834 211 CS. of Georgia Ave 2 D 1,113 119 CN. of Georgia Ave 2 D 6,139 484 CN. of Virginia Ave 2 D 7,224 658 CN. of Delaware Ave 2 D 5,666 504 CN. of Ave D 2 D 4,243 369 CN. or Orange Ave 2 D 4,622 406 CS. of St Lucie Blvd 4 D 8,040 718 BN. of Juanita Ave 4 D 8,329 783 BN. of Edwards Rd 4 D 19,382 1746 BN. of Virginia Ave 4 D 21,821 1877 BS. of Virginia Ave 4 D 20,241 1790 B
25th Street South / St. James Dr
S. of Midway Rd WestState Two-Way Arterial - Interrupted Flow Class I
4 D 16,415 1634 B
N. of Prima Vista Blvd 4 E 12,624 1271 BN. of West Virginia Ave 4 E 16,489 1524 BN. of Floresta Dr 4 E 20,420 2090 BN. of Port St. Lucie Blvd 4 E 16,489 1535 B
Angle Rd N. of Orange AveState Two-Way Arterial - Interrupted Flow Class I
2 E 9,325 936 C
E. of 7th St 2 D 3,726 313 CE. of 13th St 2 D 5,981 474 CE. of 17th St 2 D 6,313 525 CE. of 25th St 2 D 6,724 535 C
W. of 25th StState Two-Way Arterial - Interrupted Flow Class I
2 D 4,287 363 B
N. of Prima Vista Blvd 4 E 15,354 1299 BN. of West Virginia Ave 4 E 23,574 1935 BN. of Port St Lucie Blvd 4 E 24,747 2268 B
Becker Rd E. of Port St Lucie BlvdState Two-Way Arterial - Interrupted Flow Class I
2 E 7,852 807 C
E. of Sunrise Blvd 2 D 3,047 384 CW. of Sunrise Blvd 2 D 2,646 283 C
N. of St. Lucie West Blvd 2 D 7139 662 C
S. of St. Lucie West Blvd 2 D 15924 1398 E
N. of St. Lucie West Blvd 2 D 9810 956 D
S. of St. Lucie West Blvd 2 D 14390 1308 D
Citrus Ave E. of US 1 SouthState Two-Way Arterial - Interrupted Flow Class I
2 E 5,607 575 C
Darwin Blvd. N of Becker RdState Two-Way Arterial - Interrupted Flow Class I
2 D 4869 549 C
Del Rio Blvd. N. of Port St Lucie Blvd Major City/County Road 2 D 11822 981 D
13th Street North Major City/County Road
7th Street South Major City/County Road
13th Street SouthState Two-Way Arterial - Interrupted Flow Class I
25th Street NorthState Two-Way Arterial - Interrupted Flow Class I
25th Street SouthState Two-Way Arterial - Interrupted Flow Class I
Airoso BlvdState Two-Way Arterial - Interrupted Flow Class I
Avenue DMajor City/County Road
Bayshore BlvdState Two-Way Arterial - Interrupted Flow Class I
Bell Ave Other County Road
California Blvd Major City/County Road
Cashmere Blvd Major City/County Road

St. Lucie County 2-30 June 2018 Comprehensive Plan Transportation Element DIA
Roadway Name Location Roadway Classification # of Lanes
LOS Adopted
2008 AADT
2008 Peak Hour
Volume
2008 LOS
Citrus Ave E. of US 1 SouthState Two-Way Arterial - Interrupted Flow Class I
2 E 5,607 575 C
Darwin Blvd. N of Becker RdState Two-Way Arterial - Interrupted Flow Class I
2 D 4869 549 C
Del Rio Blvd. N. of Port St Lucie Blvd Major City/County Road 2 D 11822 981 DDelaware Ave W. of 25th St South Major City/County Road 4 D 6,504 642 CEast Torino Pkwy S. of Midway Rd Major City/County Road 2 D 9,716 1003 D
W. of US 1 4 E 9,003 810 BW. of Oleander Ave 4 E 14,242 1274 BW. of Sunrise Blvd 4 E 17,719 1559 BW. of 25th St South 2 E 13,195 1200 CW. of Selvitz Rd 2 E 9,725 888 C
Emerson Ave N. of Indrio RdState Two-Way Arterial -
Uninterrupted Flow2 C 5586 592 B
Farmer's Market Rd W. of US 1 South Other County Road 2 D 2,314 212 CW. of Airoso Blvd Major City/County Road 2 D 3,575 459 CE. of Airoso Blvd 2 E 10,004 970 CS. of Prima Vista Blvd 2 E 13,458 1211 CN. of Port St Lucie Blvd 2 D 17,493 1570 ES. of Port St Lucie Blvd Major City/County Road 2 D 11,930 1130 DN. of Okeechobee Rd 4 B 27,200 3541 BS. of Okeechobee Rd 4 C 34,400 3633 CS. of Port St Lucie WestBlvd
4 C 37,900 4002 C
S. of Becker Rd 4 C 42,100 4446 C
Fort Pierce Blvd W. of West Seminole RdState Two-Way Arterial - Interrupted Flow Class I
2 E 2,642 254 B
Gatlin Blvd E. of I-95State Two-Way Arterial - Interrupted Flow Class I
6 E 38,506 3354 B
W. of US 1 South 2 D 2,336 245 CW. of 7th St South 2 D 2,449 228 CW. of 13th St South 2 D 5,219 492 C
Gilson Rd N. of Martin County Line Major City/County Road 2 D 11,451 1209 DW. of Selvitz Rd 2 D 5,920 582 CN. of Midway Rd West 2 D 4,703 443 CS. of Midway Rd West 2 D 2,605 272 BN. of Reserve Blvd 2 D 3,738 441 CS. of Reserve Blvd 2 D 2,799 393 B
Green River Pkwy S. of Walton Rd Major City/County Road 2 D 2,498 290 CHeader Canal Rd S. of Orange Ave Major City/County Road 2 D 408 49 C
S. of A1A/ Bridge 2 E 5,351 460 CN. of Orange Ave 2 D 5,102 506 CN. of Citrus Ave 2 E 5,333 535 CN. of Savannah Rd 2 D 4,720 547 CN. of Midway Rd East 2 D 4,352 533 CN. of Walton Rd 2 D 5,416 630 CN. of Martin County Line 2 D 7,467 762 C
Glades Cut-Off Rd
Major City/County Road
State Two-Way Arterial - Interrupted Flow Class I
Indian River Dr
State Two-Way Arterial - Interrupted Flow Class I
Major City/County Road
Floresta DrState Two-Way Arterial - Interrupted Flow Class I
Florida's Turnpike(1) Freeways - Group 2
Georgia Ave Major City/County Road
Edwards RdState Two-Way Arterial - Interrupted Flow Class I

St. Lucie County 2-31 June 2018 Comprehensive Plan Transportation Element DIA
Roadway Name Location Roadway Classification # of Lanes
LOS Adopted
2008 AADT
2008 Peak Hour
Volume
2008 LOS
N. or Indrio Rd 4 C 36,000 3542 BN. of Orange Ave 4 D 37,500 3690 BS. of Orange Ave 4 D 47,343 4659 CN. of Midway Rd West 6 C 53,500 5264 BN. of St. Lucie West Blvd 6 C 55,500 5461 BN. of Gatlin Blvd 6 C 66,000 6052 CS. of Gatlin Blvd 6 C 54,000 4595 BN. of Okeechobee Rd Major City/County Road 2 D 10,292 942 D
S. of Okeechobee RdState Two-Way Arterial - Interrupted Flow Class I 2 D 7,478 641 C
Johnston Rd N. of Indrio Rd Major City/County Road 2 D 6,665 669 CW. of US 1 North 2 D 3,765 322 CE. of 25th St 2 D 3,917 343 CW. of 25th St 2 D 6,378 567 C
Keen Rd S. of St Lucie Blvd Major City/County Road 2 D 2,950 336 CSW of US 1 North 2 C 8,268 859 CN. of Indrio Rd 2 C 12,430 1059 CS. of Indrio Rd 2 C 13,337 1181 CN. of St Lucie Blvd 2 C 12,101 1001 CS. of St Lucie Blvd 2 C 13,165 BN. of Orange Ave 2 C 14,265 1253 CS. of Orange Ave 2 C 10,261 798 CN. of Okeechobee Rd 2 C 7,277 558 CS. of Walton Rd 4 D 5488 502 CN. of Port St. Lucie Blvd 4 D 16945 1486 CE. of Lennard Rd 2 D 7,892 1013 DW. of Lennard Rd 4 D 10,605 1064 C
Midport Rd W. of US 1 South Major City/County Road 4 D 11,580 1067 C
Midway Rd East W. of Indian River DrState Two-Way Arterial - Interrupted Flow Class I 2 E 4,146 470 C
W. of Oleander Ave 2 E 17,892 1513 DW. of Sunrise Blvd 2 E 19,756 1730 FW. of Selvitz Rd 2 E 18,508 1576 EW. of East Torino Blvd 4 E 18,943 2000 B
W. of I-95State Two-Way Arterial -
Uninterrupted Flow 2 E 3,948 357 B
N. of Port St Lucie Blvd 2 D 5,337 885 DS. of Port St Lucie Blvd 2 D 4,104 486 C
E. of Westmoreland BlvdState Two-Way Arterial - Interrupted Flow Class I 2 D 2,543 227 B
W. of Virginia Ave 6 D 32,794 2830 CE. of I-95 6 D 30,671 2574 CW. of I-95(1) 4 C 34,000 3621 F
W. of Florida's Turnpike(1) 4 B 7,500 799 A
W. of McCarty Rd(1) 2 B 6800 724 B
Okeechobee Rd
State Two-Way Arterial - Interrupted Flow Class II
State Two-Way Arterial - Uninterrupted Flow
Mariposa Ave Major City/County Road
Midway Rd West
State Two-Way Arterial - Interrupted Flow Class I
Morningside BlvdMajor City/County Road
Kings Hwy North State Two-Way Arterial - Interrupted Flow Class I
Kings Hwy South State Two-Way Arterial - Interrupted Flow Class I
Lennard Rd Major City/County Road
Juanita Ave Major City/County Road
Interstate 95(1) Freeways - Group 2
Jenkins Rd South

St. Lucie County 2-32 June 2018 Comprehensive Plan Transportation Element DIA
Roadway Name Location Roadway Classification # of Lanes
LOS Adopted
2008 AADT
2008 Peak Hour
Volume
2008 LOS
Old Dixie Hwy N. of St. Lucie BlvdState Two-Way Arterial - Interrupted Flow Class I
2 D 1,563 174 B
N. of Virginia Ave 2 E 4,835 483 CS. of Virginia Ave 2 E 11,737 1049 CS. of Edwards Rd 2 E 13,883 1240 C
S. of Farmers Market Rd 2 D 11,599 1454 D
S. of Midway Rd West 2 C 8,278 833 CN. of Kitterman Rd 2 D 6,884 677 CE. of US 1 North 2 C 322 BW. of US 1 North 2 C 7,514 618 CW. of 7th St 2 C 10,033 876 CW. of 13th St 4 D 12,914 1154 CW. of 25th St 4 D 17,066 1429 CE. of Angle Rd 4 D 17,186 1470 BE. of Jenkins Rd 4 B 12,039 1014 BE. of I-95 4 B 13,997 1203 BW. of I-95 4 B 24,749 1858 B
W. of Shinn RdState Two-Way Arterial -
Uninterrupted Flow2 C 4,201 451 B
Parr Drive W. of Darwin AveState Two-Way Arterial - Interrupted Flow Class I
2 D 2088 182 B
W. of US 1 South 6 D 43,955 3745 BE. of Midport Rd 6 D 33,254 2504 BE. of Floresta Dr 6 D 57,146 4404 CW. of Floresta Dr 6 D 48,790 4113 BE. of Florida's Turnpike 6 D 43,317 3686 BW. of Florida's Turnpike 6 E 52,200 4282 CW. of US 1 South 4 E 31,023 2834 CW. of Rio Mar Dr 4 E 32,638 2813 CW. of Floresta Dr 4 E 23,601 1886 BW. of Airoso Blvd 4 E 25,612 1964 B
Range Line Rd N. of Martin County LineState Two-Way Arterial - Interrupted Flow Class I
2 D 1,730 185 B
Rio Mar Dr N. of Prima Vista BlvdState Two-Way Arterial - Interrupted Flow Class I
2 D 5,296 473 C
S. of Regal RdState Two-Way Arterial -
Uninterrupted Flow2 D 4272 382 B
E. of US 1 NorthState Two-Way Arterial - Interrupted Flow Class I
2 D 8,025 716 C
E. of US 1 North 4 D 14800 1174 BE. of South Bridge 2 D 12491 1035 CS. of Seaway Dr 2 D 6423 617 C
S. of FPL PlantState Two-Way Arterial -
Uninterrupted Flow2 D 3757 527 B
Savage Blvd N. of Gatlin BlvdState Two-Way Arterial - Interrupted Flow Class I
2 E 3,192 345 B
E. of US 1 South 2 D 2,120 224 CW. of Indian River Dr 2 D 1608 180 C
Savona Blvd S. of Becker RdState Two-Way Arterial - Interrupted Flow Class I
2 D 4810 558 C
Savannah Rd Major City/County Road
SR A1A South
State Two-Way Arterial - Interrupted Flow Class I
Oleander Ave
State Two-Way Arterial - Interrupted Flow Class I
Major City/County Road
Orange Ave
State Two-Way Arterial - Interrupted Flow Class II
State Two-Way Arterial - Interrupted Flow Class I
Port St Lucie BlvdState Two-Way Arterial - Interrupted Flow Class I
Prima Vista BlvdState Two-Way Arterial - Interrupted Flow Class I
SR A1A North

St. Lucie County 2-33 June 2018 Comprehensive Plan Transportation Element DIA
Roadway Name Location Roadway Classification # of Lanes
LOS Adopted
2008 AADT
2008 Peak Hour
Volume
2008 LOS
Shinn Rd S. of Orange Ave Major City/County Road 2 D 1,413 150 CSneed Rd N. of Okeechobee Rd Major City/County Road 2 D 731 94 C
S. of Floresta Dr Major City/County Road 2 D 10,071 950 D
N. of Becker RdState Two-Way Arterial - Interrupted Flow Class I 2 D 5,637 587 C
W. of US 1 North 2 E 4,692 423 CW. of 25th St North 2 E 5,661 567 CE. of Keen Rd 2 E 6,260 631 CW. of Florida's Turnpike 4 E 38,330 3481 FE. of I-95 4 E 38,294 3431 FW. of I-95 2 E 10,737 899 CS. of Peachtree Blvd 4 D 18,393 1935 BN. of Airoso Blvd 4 D 9,321 1937 BN. of Virginia Ave 2 D 4,546 470 CS. of Virginia Ave 2 D 6,046 583 CS. of Edwards Rd 2 D 4,402 497 CN. of Edwards Rd 2 D 5,072 480 CS. of Bell Ave 2 D 3,439 400 CN. of Midway Rd West 2 D 2,880 329 CE. of US 1 South 2 D 8,862 737 CW. of Lennard Rd 2 D 5,167 485 CS. of Indian River C/L 4 B 24,670 2290 BS. of Indrio Rd 4 B 20,709 1973 BS. of St Lucie Blvd 4 B 20,317 1924 BS. of Taylor Creek Bridge 4 B 24,997 2300 B
S. of SR A1A SouthState Two-Way Arterial - Interrupted Flow Class II 4 D 19,282 1352 C
S. of Orange Ave 4 D 29,995 2371 CS. of Delaware Ave 4 D 31,419 2596 DN. of Virginia Ave 4 D 32,117 2565 DS. of Virginia Ave 4 D 35,242 2759 DS. of Edwards Rd 4 D 34,278 2654 DN. of Prima Vista Blvd 6 D 39,874 3349 BS. of Prima Vista Blvd 6 D 49,600 3660 BN. of Port St Lucie Blvd 6 D 46,053 3690 BS. of Port St Lucie Blvd 8 D 57,788 4486 BW. of US 1 South 6 D 25,126 2278 CE. of Sunrise Blvd 6 D 27,028 2228 CE. of 13th St South 6 D 28,508 2281 CE. of 25th St South 6 D 25,208 2089 CW. of 25th St South 6 D 24,072 1945 CW. of Indian River Dr 2 D 4,984 553 CE. of Lennard Rd 2 D 7,666 737 CE. of Village Green Dr 2 D 10,770 1010 DE. of US 1 South 4 D 13,077 1098 C
Major City/County Road
US 1 North
State Two-Way Arterial - Interrupted Flow Class I
US 1 South
State Two-Way Arterial - Interrupted Flow Class II
State Two-Way Arterial - Interrupted Flow Class I
Virginia AveState Two-Way Arterial - Interrupted Flow Class II
Walton Rd Major City/County Road
Southbend Blvd
St Lucie BlvdState Two-Way Arterial - Interrupted Flow Class I
St Lucie West BlvdState Two-Way Arterial - Interrupted Flow Class I
St. James Dr State Two-Way Arterial - Interrupted Flow Class I
Sunrise Blvd Major City/County Road
Tiffany Ave

St. Lucie County 2-34 June 2018 Comprehensive Plan Transportation Element DIA
Roadway Name Location Roadway Classification # of Lanes
LOS Adopted
2008 AADT
2008 Peak Hour
Volume
2008 LOS
Weatherbee Rd E. of US 1 South Major City/County Road 2 D 6,511 647 C
West Torino Pkwy Rd E. of US 1 South Major City/County Road 2 D 2,324 226 C
S. of Morningside Blvd 2 D 8,862 843 CS. of Port St Lucie Blvd 2 D 15,059 1346 D
Source: St/ Lucie TPO 2008 Spring Traffic Count Analysis(1) Taken from FDOT 2008 FTI DVD
Westmoreland BlvdState Two-Way Arterial - Interrupted Flow Class I

St. Lucie County 2-35 June 2018 Comprehensive Plan Transportation Element DIA
Pk Hr Ser- vice
Capac- ity
AM PK HR
PK DIR PM PK HR
PK DIR
ROADWAY NAME FROM TO # OF
LANES
ADOPT- ED LOS
2017 AADT
VOL- UME LOS
VOL- UME LOS
10TH ST DELAWARE AVE ORANGE AVE 2 D 600 200 21 C 20 C 10TH ST ORANGE AVE AVENUE C 2 D 600 200 21 C 20 C 10TH ST AVENUE C AVENUE D 2 D 540 200 21 C 20 C 13TH ST GEORGIA AVE DELAWARE AVE 2 D 750 5,400 313 C 295 C 13TH ST DELAWARE AVE ORANGE AVE 2 D 750 4,500 297 C 277 C 13TH ST AVENUE I AVENUE O 2 D 540 4,000 238 C 221 C 13TH ST AVENUE O AVENUE Q 2 D 540 4,000 238 C 221 C 13TH ST ORANGE AVE AVENUE B 2 D 750 3,500 206 C 202 C 13TH ST AVENUE B AVENUE D 2 D 750 3,500 206 C 202 C 13TH ST NEBRASKA AVE GEORGIA AVE 2 D 790 6,797 371 C 428 D 13TH ST VIRGINIA AVE NEBRASKA AVE 2 D 750 6,797 371 D 428 D 13TH ST AVENUE D AVENUE H 2 D 750 4,000 238 C 221 C 13TH ST AVENUE H AVENUE I 2 D 540 4,000 238 C 221 C 17TH ST DELAWARE AVE ORANGE AVE 2 D 790 6,800 345 C 329 C 17TH ST ORANGE AVE AVENUE D 2 D 750 3,967 232 C 222 C 17TH ST AVENUE D AVENUE Q 2 D 750 3,967 232 C 222 C 17TH ST GEORGIA AVE DELAWARE AVE 2 D 600 3,033 168 C 168 C 25TH ST ORANGE AVE AVENUE D 4 D 1630 14,000 606 C 595 C 25TH ST ST LUCIE BLVD US 1 4 D 2100 5,210 299 C 334 C 25TH ST JUANITA AVE ST LUCIE BLVD 4 D 2100 13,814 749 C 703 C 25TH ST MIDWAY RD BELL AVE 4 D 2100 16,637 1192 C 1112 C 25TH ST VIRIGINIA AVE NEBRASKA AVE 4 D 2000 21,031 1206 C 1080 C

St. Lucie County 2-36 June 2018 Comprehensive Plan Transportation Element DIA
Pk Hr Ser- vice
Capac- ity
AM PK HR
PK DIR PM PK HR
PK DIR
ROADWAY NAME FROM TO # OF
LANES
ADOPT- ED LOS
2017 AADT
VOL- UME LOS
VOL- UME LOS
25TH ST BELL AVE EDWARDS RD 4 D 2100 19,423 1075 C 1092 C 25TH ST DELAWARE AVE ORANGE AVE 4 D 1630 18,928 985 D 980 D 25TH ST GEORGIA AVE DELAWARE AVE 4 D 1630 21,500 1104 D 1049 D 25TH ST OKEECHOBEE RD GEORGIA AVE 4 D 1630 21,500 1104 D 1049 D 25TH ST AVENUE Q JUANITA AVE 4 D 2000 13,061 738 C 676 C 25TH ST AVENUE D AVENUE Q 4 D 1630 14,241 750 D 728 C 25TH ST EDWARDS RD CORTEZ BLVD 4 D 2000 21,613 1378 C 1373 C 25TH ST CORTEZ BLVD VIRGINIA AVE 4 D 2000 22,000 1150 C 1204 C 25TH ST NEBRASKA AVE OKEECHOBEE RD 4 D 2000 21,031 1206 C 1080 C 2ND ST CITRUS AVE ORANGE AVE 2 D 540 2,200 193 C 163 C 2ND ST ORANGE AVE AVENUE A 2 D 540 2,100 134 C 126 C 33RD ST DELAWARE AVE ORANGE AVE 2 D 790 5,850 0 B 0 B 33RD ST OKEECHOBEE RD DELAWARE AVE 2 D 750 5,767 337 C 277 C 35TH ST KIRBY LOOP RD CORTEZ BLVD 2 D 540 6,800 542 E 406 D 35TH ST CORTEZ BLVD VIRGINIA AVE 2 D 790 6,800 542 D 406 D 35TH ST VIRGINIA AVE OKEECHOBEE RD 2 D 750 4,467 270 C 272 C 53RD ST ANGLE RD JUANITA AVE 2 D 540 2,633 140 C 155 C 7TH ST DELAWARE AVE CITRUS AVE 2 D 790 2,388 150 C 170 C 7TH ST GEORGIA AVE DELAWARE AVE 2 D 790 1,487 113 C 103 C 7TH ST CITRUS AVE ORANGE AVE 2 D 750 2,388 150 C 170 C 7TH ST SUNRISE BLVD GEORGIA AVE 2 D 600 767 53 C 60 C 7TH ST ORANGE AVE AVENUE C 2 D 750 3,116 214 C 235 C
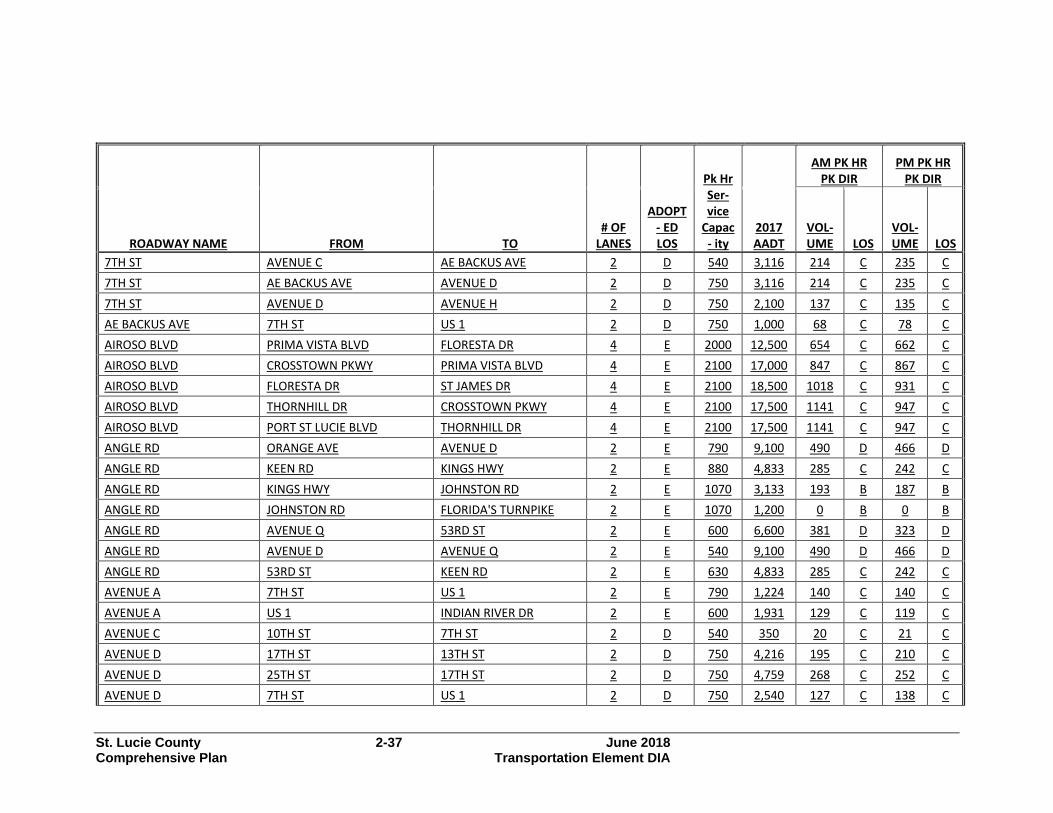
St. Lucie County 2-37 June 2018 Comprehensive Plan Transportation Element DIA
Pk Hr Ser- vice
Capac- ity
AM PK HR
PK DIR PM PK HR
PK DIR
ROADWAY NAME FROM TO # OF
LANES
ADOPT- ED LOS
2017 AADT
VOL- UME LOS
VOL- UME LOS
7TH ST AVENUE C AE BACKUS AVE 2 D 540 3,116 214 C 235 C 7TH ST AE BACKUS AVE AVENUE D 2 D 750 3,116 214 C 235 C 7TH ST AVENUE D AVENUE H 2 D 750 2,100 137 C 135 C AE BACKUS AVE 7TH ST US 1 2 D 750 1,000 68 C 78 C AIROSO BLVD PRIMA VISTA BLVD FLORESTA DR 4 E 2000 12,500 654 C 662 C AIROSO BLVD CROSSTOWN PKWY PRIMA VISTA BLVD 4 E 2100 17,000 847 C 867 C AIROSO BLVD FLORESTA DR ST JAMES DR 4 E 2100 18,500 1018 C 931 C AIROSO BLVD THORNHILL DR CROSSTOWN PKWY 4 E 2100 17,500 1141 C 947 C AIROSO BLVD PORT ST LUCIE BLVD THORNHILL DR 4 E 2100 17,500 1141 C 947 C ANGLE RD ORANGE AVE AVENUE D 2 E 790 9,100 490 D 466 D ANGLE RD KEEN RD KINGS HWY 2 E 880 4,833 285 C 242 C ANGLE RD KINGS HWY JOHNSTON RD 2 E 1070 3,133 193 B 187 B ANGLE RD JOHNSTON RD FLORIDA'S TURNPIKE 2 E 1070 1,200 0 B 0 B ANGLE RD AVENUE Q 53RD ST 2 E 600 6,600 381 D 323 D ANGLE RD AVENUE D AVENUE Q 2 E 540 9,100 490 D 466 D ANGLE RD 53RD ST KEEN RD 2 E 630 4,833 285 C 242 C AVENUE A 7TH ST US 1 2 E 790 1,224 140 C 140 C AVENUE A US 1 INDIAN RIVER DR 2 E 600 1,931 129 C 119 C AVENUE C 10TH ST 7TH ST 2 D 540 350 20 C 21 C AVENUE D 17TH ST 13TH ST 2 D 750 4,216 195 C 210 C AVENUE D 25TH ST 17TH ST 2 D 750 4,759 268 C 252 C AVENUE D 7TH ST US 1 2 D 750 2,540 127 C 138 C

St. Lucie County 2-38 June 2018 Comprehensive Plan Transportation Element DIA
Pk Hr Ser- vice
Capac- ity
AM PK HR
PK DIR PM PK HR
PK DIR
ROADWAY NAME FROM TO # OF
LANES
ADOPT- ED LOS
2017 AADT
VOL- UME LOS
VOL- UME LOS
AVENUE D ANGLE RD 29TH ST 2 D 600 3,890 220 C 217 C AVENUE D 29TH ST 25TH ST 2 D 790 3,890 220 C 217 C AVENUE D 13TH ST 10TH ST 2 D 750 2,830 133 C 149 C AVENUE D 10TH ST 7TH ST 2 D 750 2,540 127 C 138 C AVENUE H 13TH ST 7TH ST 2 D 540 1,800 105 C 113 C AVENUE H 7TH ST US 1 2 D 750 1,300 71 C 70 C AVENUE I 25TH ST 17TH ST 2 D 750 2,633 226 C 177 C AVENUE I 17TH ST 13TH ST 2 D 750 2,633 226 C 177 C AVENUE O 13TH ST US 1 2 D 540 1,900 107 C 110 C AVENUE Q ANGLE RD 25TH ST 2 D 750 6,195 370 C 329 C AVENUE Q 17TH ST 13TH ST 2 D 540 3,747 267 C 299 D AVENUE Q 25TH ST 17TH ST 2 D 750 3,747 267 C 299 C BAYSHORE BLVD THORNHILL DR CROSSTOWN PKWY 4 E 2100 21,610 0 B 0 B BAYSHORE BLVD PRIMA VISTA BLVD FLORESTA DR 2 E 920 16,648 931 F 828 C BAYSHORE BLVD CROSSTOWN PKWY PRIMA VISTA BLVD 4 E 2100 24,500 1197 C 1166 C BAYSHORE BLVD PORT ST LUCIE BLVD THORNHILL DR 4 E 2100 28,500 1406 C 1325 C BAYSHORE BLVD FLORESTA DR SELVITZ RD 2 E 790 13,500 680 C 679 C BAYSHORE BLVD SELVITZ RD 25TH ST 2 E 750 13,500 680 D 679 D BAYSHORE BLVD MOUNTWELL ST PORT ST LUCIE BLVD 2 E 830 6,900 368 C 321 C BEACH AVE OLEANDER AVE RIO MAR DR 2 D 540 3,400 240 C 205 C BECKER RD SAVONA BLVD PORT ST LUCIE BLVD 4 E 2100 15,000 1006 C 1008 C BECKER RD I-95 SAVONA BLVD 4 E 2000 17,000 1556 C 1408 C

St. Lucie County 2-39 June 2018 Comprehensive Plan Transportation Element DIA
Pk Hr Ser- vice
Capac- ity
AM PK HR
PK DIR PM PK HR
PK DIR
ROADWAY NAME FROM TO # OF
LANES
ADOPT- ED LOS
2017 AADT
VOL- UME LOS
VOL- UME LOS
BECKER RD SOUTHBEND BLVD GILSON RD 2 E 920 13,000 1064 F 1099 F BECKER RD PORT ST LUCIE BLVD ALBACORE ST 4 E 2100 11,500 746 C 685 C BECKER RD VILLAGE PKWY I-95 6 E 3170 2,500 196 C 178 C BECKER RD DARWIN BLVD ATHENA DR 4 E 2000 14,500 1246 C 1157 C BECKER RD FLORIDA'S TURNPIKE SOUTHBEND BLVD 4 E 2100 16,000 1074 C 1386 C BECKER RD ALBACORE ST DARWIN BLVD 4 E 1500 11,500 746 C 685 C BECKER RD ATHENA DR FLORIDA'S TURNPIKE 4 E 1500 14,500 1246 C 1157 C BELL AVE 25TH ST SUNRISE BLVD 2 D 790 3,411 207 C 250 C BELL AVE SUNRISE BLVD OLEANDER AVE 2 D 600 3,309 217 C 213 C CALIFORNIA BLVD UNIVERSITY BLVD PEACOCK BLVD 2 D 630 7,833 429 C 396 C CALIFORNIA BLVD ST LUCIE WEST BLVD COUNTRY CLUB DR 2 D 920 7,500 502 C 465 C CALIFORNIA BLVD PEACOCK BLVD TORINO PKWY 2 D 630 12,000 867 F 695 F CALIFORNIA BLVD CAMEO BLVD DEL RIO BLVD 2 D 750 7,800 547 D 448 D CALIFORNIA BLVD DEL RIO BLVD CROSSTOWN PKWY 2 D 920 15,500 1082 F 965 F CALIFORNIA BLVD HEATHERWOOD BLVD ST LUCIE WEST BLVD 2 D 920 17,500 910 D 987 F CALIFORNIA BLVD DEL RIO BLVD SAVONA BLVD 2 D 920 13,500 668 C 677 C CALIFORNIA BLVD SAVONA BLVD DEL RIO BLVD 2 D 920 12,000 802 C 764 C CALIFORNIA BLVD CROSSTOWN PKWY HEATHERWOOD BLVD 2 D 920 17,500 910 D 987 F CALIFORNIA BLVD COUNTRY CLUB DR UNIVERSITY BLVD 2 D 790 7,833 429 C 396 C CAMEO BLVD PORT ST LUICE BLVD CALIFORNIA BLVD 2 D 750 5,200 341 C 290 C CAMEO BLVD CALIFORNIA BLVD CROSSTOWN PKWY 2 D 790 8,733 602 D 467 D CAMPBELL RD PICOS RD ORANGE AVE 2 D 540 500 41 C 41 C
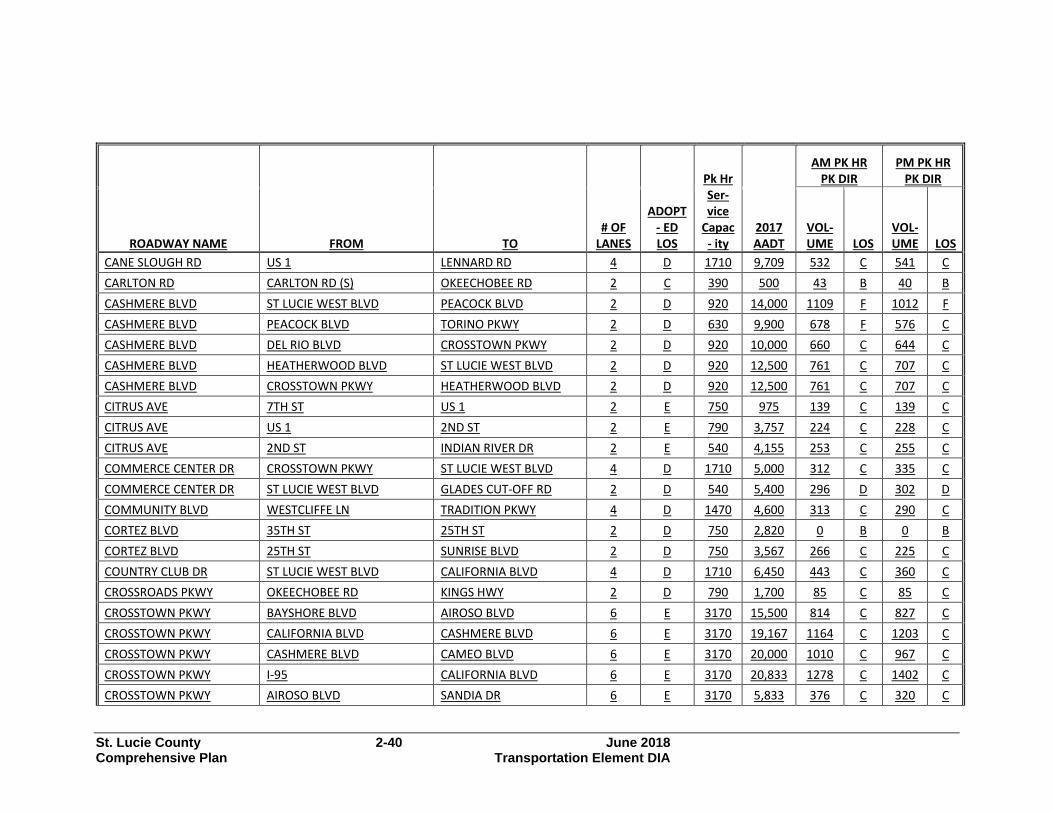
St. Lucie County 2-40 June 2018 Comprehensive Plan Transportation Element DIA
Pk Hr Ser- vice
Capac- ity
AM PK HR
PK DIR PM PK HR
PK DIR
ROADWAY NAME FROM TO # OF
LANES
ADOPT- ED LOS
2017 AADT
VOL- UME LOS
VOL- UME LOS
CANE SLOUGH RD US 1 LENNARD RD 4 D 1710 9,709 532 C 541 C CARLTON RD CARLTON RD (S) OKEECHOBEE RD 2 C 390 500 43 B 40 B CASHMERE BLVD ST LUCIE WEST BLVD PEACOCK BLVD 2 D 920 14,000 1109 F 1012 F CASHMERE BLVD PEACOCK BLVD TORINO PKWY 2 D 630 9,900 678 F 576 C CASHMERE BLVD DEL RIO BLVD CROSSTOWN PKWY 2 D 920 10,000 660 C 644 C CASHMERE BLVD HEATHERWOOD BLVD ST LUCIE WEST BLVD 2 D 920 12,500 761 C 707 C CASHMERE BLVD CROSSTOWN PKWY HEATHERWOOD BLVD 2 D 920 12,500 761 C 707 C CITRUS AVE 7TH ST US 1 2 E 750 975 139 C 139 C CITRUS AVE US 1 2ND ST 2 E 790 3,757 224 C 228 C CITRUS AVE 2ND ST INDIAN RIVER DR 2 E 540 4,155 253 C 255 C COMMERCE CENTER DR CROSSTOWN PKWY ST LUCIE WEST BLVD 4 D 1710 5,000 312 C 335 C COMMERCE CENTER DR ST LUCIE WEST BLVD GLADES CUT-OFF RD 2 D 540 5,400 296 D 302 D COMMUNITY BLVD WESTCLIFFE LN TRADITION PKWY 4 D 1470 4,600 313 C 290 C CORTEZ BLVD 35TH ST 25TH ST 2 D 750 2,820 0 B 0 B CORTEZ BLVD 25TH ST SUNRISE BLVD 2 D 750 3,567 266 C 225 C COUNTRY CLUB DR ST LUCIE WEST BLVD CALIFORNIA BLVD 4 D 1710 6,450 443 C 360 C CROSSROADS PKWY OKEECHOBEE RD KINGS HWY 2 D 790 1,700 85 C 85 C CROSSTOWN PKWY BAYSHORE BLVD AIROSO BLVD 6 E 3170 15,500 814 C 827 C CROSSTOWN PKWY CALIFORNIA BLVD CASHMERE BLVD 6 E 3170 19,167 1164 C 1203 C CROSSTOWN PKWY CASHMERE BLVD CAMEO BLVD 6 E 3170 20,000 1010 C 967 C CROSSTOWN PKWY I-95 CALIFORNIA BLVD 6 E 3170 20,833 1278 C 1402 C CROSSTOWN PKWY AIROSO BLVD SANDIA DR 6 E 3170 5,833 376 C 320 C

St. Lucie County 2-41 June 2018 Comprehensive Plan Transportation Element DIA
Pk Hr Ser- vice
Capac- ity
AM PK HR
PK DIR PM PK HR
PK DIR
ROADWAY NAME FROM TO # OF
LANES
ADOPT- ED LOS
2017 AADT
VOL- UME LOS
VOL- UME LOS
CROSSTOWN PKWY SANDIA DR MANTH LN 2 E 920 6,033 325 C 339 C CROSSTOWN PKWY MANTH LN FLORESTA DR 2 E 540 4,867 273 D 256 C CROSSTOWN PKWY COMMERCE CENTER DR I-95 6 E 3170 13,767 855 C 733 C CROSSTOWN PKWY CAMEO BLVD BAYSHORE BLVD 6 E 3170 19,167 931 C 914 C DARWIN BLVD PAAR DR TULIP BLVD 2 D 920 6,310 590 C 535 C DARWIN BLVD BECKER RD PAAR DR 2 D 630 6,310 590 C 535 C DARWIN BLVD TULIP BLVD PORT ST LUCIE BLVD 2 D 920 13,500 761 C 715 C DEL RIO BLVD PORT ST LUCIE BLVD CALIFORNIA BLVD 2 D 920 10,500 613 C 571 C DEL RIO BLVD CASHMERE BLVD CALIFORNIA BLVD 2 D 880 4,600 269 C 281 C DEL RIO BLVD CALIFORNIA BLVD CASHMERE BLVD 2 D 880 6,664 401 C 347 C DELAWARE AVE OKEECHOBEE RD 13TH ST 2 D 790 10,067 541 D 555 D DELAWARE AVE 25TH ST OKEECHOBEE RD 4 D 1220 4,810 0 B 0 B DELAWARE AVE 7TH ST US 1 2 D 750 7,100 455 D 425 D DELAWARE AVE 33RD ST 25TH ST 4 D 1710 4,100 273 C 312 C DELAWARE AVE HARTMAN RD 33RD ST 2 D 600 1,767 274 C 220 C DELAWARE AVE 13TH ST 10TH ST 2 D 750 7,800 524 D 434 D DELAWARE AVE 10TH ST 7TH ST 2 D 600 7,800 524 D 434 D EAST TORINO PKWY TORINO PKWY MIDWAY RD 2 D 880 13,000 889 F 844 D EAST TORINO PKWY CASHMERE BLVD TORINO PKWY 2 D 830 12,000 712 C 707 C EASY ST US 1 BUCHANAN DR 2 D 750 9,176 825 F 636 D EASY ST BUCHANAN DR YUCCA DR 2 D 540 9,176 825 F 636 F EDWARDS RD OLEANDER AVE US 1 4 E 1630 8,955 433 C 432 C

St. Lucie County 2-42 June 2018 Comprehensive Plan Transportation Element DIA
Pk Hr Ser- vice
Capac- ity
AM PK HR
PK DIR PM PK HR
PK DIR
ROADWAY NAME FROM TO # OF
LANES
ADOPT- ED LOS
2017 AADT
VOL- UME LOS
VOL- UME LOS
EDWARDS RD 25TH ST SUNRISE BLVD 4 E 1630 16,135 885 D 1220 D EDWARDS RD SELVITZ RD 25TH ST 2 E 880 14,500 770 C 781 C EDWARDS RD JENKINS RD MCNEIL RD 2 E 630 10,500 545 C 549 C EDWARDS RD MCNEIL RD SELVITZ RD 2 E 700 10,500 545 C 549 C EDWARDS RD SUNRISE BLVD OLEANDER AVE 4 E 1630 14,943 748 D 730 C FARMER'S MARKET RD OLEANDER AVE US 1 2 D 750 1,784 116 C 102 C FLORESTA DR PRIMA VISTA BLVD AIROSO BLVD 2 E 920 9,700 520 C 548 C FLORESTA DR CROSSTOWN PKWY PRIMA VISTA BLVD 2 E 920 12,000 773 C 682 C FLORESTA DR AIROSO BLVD SELVITZ RD 2 D 880 4,070 327 C 317 C FLORESTA DR OAKLYN ST PORT ST LUCIE BLVD 2 D 920 12,500 841 C 660 C FLORESTA DR PORT ST LUCIE BLVD THORNHILL DR 2 D 880 17,000 1274 F 1052 F FLORESTA DR THORNHILL DR CROSSTOWN PKWY 2 E 880 17,000 1274 F 1052 F FLORESTA DR SELVITZ RD BAYSHORE BLVD 2 D 630 4,070 327 C 317 C FT PIERCE BLVD INDRIO RD EMERSON AVE 2 E 540 3,527 270 C 213 C GARDENIA AVE OLEANDER AVE US 1 2 D 750 2,700 180 C 192 C GATLIN BLVD ROSSER BLVD SAVONA BLVD 6 E 3170 39,345 2961 C 2413 C GATLIN BLVD SAVONA BLVD PORT ST LUCIE BLVD 6 E 3170 39,345 2961 C 2413 C GATLIN BLVD SAVAGE BLVD ROSSER BLVD 6 E 3170 39,345 2961 C 2413 C GATLIN BLVD W OF I-95 E OF I-95 6 E 3170 39,345 2961 C 2413 C GATLIN BLVD E OF I-95 SAVAGE BLVD 6 E 3170 39,345 2961 C 2413 C GEORGIA AVE 13TH ST 7TH ST 2 D 600 1,958 128 C 136 C GEORGIA AVE 7TH ST US 1 2 D 600 1,894 137 C 127 C

St. Lucie County 2-43 June 2018 Comprehensive Plan Transportation Element DIA
Pk Hr Ser- vice
Capac- ity
AM PK HR
PK DIR PM PK HR
PK DIR
ROADWAY NAME FROM TO # OF
LANES
ADOPT- ED LOS
2017 AADT
VOL- UME LOS
VOL- UME LOS
GEORGIA AVE 25TH ST OKEECHOBEE RD 2 D 600 4,667 287 C 295 C GEORGIA AVE OKEECHOBEE RD 17TH ST 2 D 750 4,667 287 C 295 C GEORGIA AVE 17TH ST 13TH ST 2 D 600 4,640 244 C 243 C GILSON RD BECKER RD LAKERIDGE DR 2 D 540 10,500 939 F 981 F GILSON RD MARTIN C.L. BECKER RD 2 D 710 10,500 939 F 981 F GLADES CUT-OFF RD MIDWAY RD JENKINS RD 2 D 790 9,100 562 D 545 D GLADES CUT-OFF RD JENKINS RD SELVITZ RD 2 D 830 6,176 392 C 377 C GLADES CUT-OFF RD COMMERCE CENTER DR MIDWAY RD 2 D 920 2,611 198 C 181 C GLADES CUT-OFF RD RANGE LINE RD RESERVE BLVD 2 D 1070 2,600 184 B 231 B GLADES CUT-OFF RD RESERVE BLVD COMMERCE CENTER DR 2 D 1070 3,485 322 B 322 B GLADES CUT-OFF RD CARLTON RD RANGE LINE RD 2 C 390 2,600 184 B 231 C GRAHAM RD KINGS HWY JENKINS RD 2 D 630 3,400 233 C 221 C GREEN RIVER PKWY MARTIN C.L. CHARLESTON DR 2 D 1070 4,339 327 B 327 B GREEN RIVER PKWY MELALEUCA BLVD WALTON RD 2 D 1070 4,339 327 B 327 B GREEN RIVER PKWY CHARLESTON DR MELALEUCA BLVD 2 D 1070 4,339 327 B 327 B HARTMAN RD OKEECHOBEE RD PETERSON RD 2 D 750 5,400 357 C 328 C HARTMAN RD DELAWARE AVE ORANGE AVE 2 D 790 5,400 357 C 328 C HARTMAN RD PETERSON RD DELAWARE AVE 2 D 540 5,400 357 D 328 D HEADER CANAL RD OKEECHOBEE RD ORANGE AVE 2 D 670 483 28 B 28 B HILLMOOR DR US 1 LENNARD RD 2 D 790 7,487 426 D 365 C I-95 GATLIN BLVD ST LUCIE WEST BLVD 6 C 4580 74,692 3824 C 3455 C I-95 ST LUCIE WEST BLVD MIDWAY RD 6 C 4580 58,368 3283 B 2831 B

St. Lucie County 2-44 June 2018 Comprehensive Plan Transportation Element DIA
Pk Hr Ser- vice
Capac- ity
AM PK HR
PK DIR PM PK HR
PK DIR
ROADWAY NAME FROM TO # OF
LANES
ADOPT- ED LOS
2017 AADT
VOL- UME LOS
VOL- UME LOS
I-95 MIDWAY RD OKEECHOBEE RD 6 C 4580 70,109 4232 C 3436 C I-95 OKEECHOBEE RD ORANGE AVE 8 D 7320 45,500 1822 B 1894 B I-95 ORANGE AVE INDRIO RD 8 D 7320 42,866 2062 B 1898 B INDIAN RIVER DR CITRUS AVE ORANGE AVE 2 E 750 4,629 275 C 315 C INDIAN RIVER DR AVENUE A AVENUE D 2 D 540 5,505 322 D 379 D INDIAN RIVER DR ORANGE AVE AVENUE A 2 D 750 5,429 317 C 309 C INDIAN RIVER DR AVENUE D SEAWAY DR 2 E 790 5,505 322 C 379 C INDRIO RD SLASH PINE TRL US 1 2 E 920 5,542 358 C 343 C INDRIO RD US 1 OLD DIXIE HWY 2 D 750 950 66 C 89 C INDRIO RD SEMINOLE RD KINGS HWY 2 D 790 9,446 569 D 479 D INDRIO RD JOHNSTON RD EMERSON AVE 2 D 880 9,800 560 C 589 C INDRIO RD KOBLEGARD RD JOHNSTON RD 2 D 700 9,800 560 C 589 C INDRIO RD I-95 E RAMP KOBLEGARD RD 4 D 3240 9,800 560 B 589 B INDRIO RD PRIVATE RD I-95 W RAMP 2 D 1080 820 60 B 65 B INDRIO RD I-95 W RAMP I-95 E RAMP 4 D 3240 820 60 B 65 B INDRIO RD EMERSON RD SEMINOLE RD 2 D 920 9,446 569 C 479 C INDRIO RD KINGS HWY SLASH PINE TRL 2 E 790 5,542 358 C 343 C JENKINS RD OKEECHOBEE RD GRAHAM RD 2 D 920 9,100 543 C 545 C JENKINS RD EDWARDS RD OKEECHOBEE RD 2 D 880 7,613 431 C 404 C JENKINS RD PETERSON RD ORANGE AVE 2 D 920 9,100 543 C 545 C JENKINS RD GRAHAM RD PETERSON RD 2 D 630 9,100 543 C 545 C JENNINGS RD US 1 LENNARD RD 4 D 2100 4,533 300 C 245 C

St. Lucie County 2-45 June 2018 Comprehensive Plan Transportation Element DIA
Pk Hr Ser- vice
Capac- ity
AM PK HR
PK DIR PM PK HR
PK DIR
ROADWAY NAME FROM TO # OF
LANES
ADOPT- ED LOS
2017 AADT
VOL- UME LOS
VOL- UME LOS
JOHNSTON RD OLD JOHNSTON RD INDRIO RD 2 D 1070 2,000 127 B 123 B JOHNSTON RD ANGLE RD L20 2 D 1070 2,400 163 B 158 B JOHNSTON RD MEADOWOOD DR OLD JOHNSTON RD 2 D 1070 2,000 127 B 123 B JOHNSTON RD L20 MEADOWOOD DR 2 D 1070 2,000 127 B 123 B JOHNSTON RD INDRIO RD RUSSOS RD 2 D 1070 7,282 439 C 440 C JOHNSTON RD RUSSOS RD INDIAN RIVER C.L. 2 D 1070 7,282 439 C 440 C JUANITA AVE 25TH ST US 1 2 D 750 4,000 223 C 219 C JUANITA AVE 53RD ST 25TH ST 2 D 750 2,800 180 C 165 C KEEN RD ANGLE RD JUANITA AVE 2 D 630 2,658 184 C 212 C KEEN RD JUANITA AVE ST LUCIE BLVD 2 D 630 2,658 184 C 212 C KINGS HWY ST LUCIE BLVD INDRIO RD 2 C 830 12,647 785 C 737 C KINGS HWY ORANGE AVE ANGLE RD 2 C 870 14,305 754 C 758 C KINGS HWY ANGLE RD ST LUCIE BLVD 2 C 830 10,798 594 C 597 C KINGS HWY PICOS RD ORANGE AVE 2 C 830 7,585 374 C 359 C KINGS HWY OKEECHOBEE RD CROSSROADS PKWY 2 C 830 7,191 316 C 322 C KINGS HWY CROSSROADS PKWY GRAHAM RD 2 C 660 7,191 316 C 322 C KINGS HWY GRAHAM RD PICOS RD 2 C 660 7,585 374 C 359 C KIRBY LOOP RD EDWARDS RD 35TH ST 2 D 630 4,216 278 C 341 C KITTERMAN RD OLEANDER AVE US 1 2 D 750 3,191 228 C 182 C KITTERMAN RD US 1 LENNARD EXT 2 D 750 2,400 137 C 139 C LENNARD RD MARIPOSA AVE MELALEUCA BLVD 4 D 1710 19,500 1126 D 1081 D LENNARD RD TIFFANY AVE WALTON RD 4 D 1710 5,767 301 C 306 C

St. Lucie County 2-46 June 2018 Comprehensive Plan Transportation Element DIA
Pk Hr Ser- vice
Capac- ity
AM PK HR
PK DIR PM PK HR
PK DIR
ROADWAY NAME FROM TO # OF
LANES
ADOPT- ED LOS
2017 AADT
VOL- UME LOS
VOL- UME LOS
LENNARD RD US 1 MARIPOSA AVE 4 D 1710 19,500 1126 D 1081 D
LENNARD RD WALTON RD S OF SAVANNA CLUB BLVD 2 D 790 4,271 374 C 365 C
LENNARD RD MELALEUCA BLVD JENNINGS RD 4 D 1630 19,500 1126 D 1081 D LENNARD RD HILLMOOR DR TIFFANY AVE 4 D 1710 19,500 1126 D 1081 D LENNARD RD JENNINGS RD HILLMOOR DR 4 D 1710 19,500 1126 D 1081 D LYNGATE DR MORNINGSIDE BLVD US 1 2 D 920 10,589 669 C 602 C LYNGATE DR VETERANS MEMORIAL PKWY MORNINGSIDE BLVD 2 D 920 10,589 669 C 602 C MARIPOSA AVE LENNARD RD HALLAHAN ST 2 D 880 6,958 477 C 418 C MCCARTY RD WILLIAMS RD MIDWAY RD 2 D 540 350 30 C 32 C MCCARTY RD MIDWAY RD OKEECHOBEE RD 2 D 540 300 29 C 22 C MCNEIL RD OKEECHOBEE RD KIRBY LOOP RD 2 D 790 9,100 480 D 499 D MCNEIL RD KIRBY LOOP RD EDWARDS RD 2 D 540 9,100 480 D 499 D MELALEUCA BLVD LENNARD RD GREEN RIVER PKWY 2 D 920 10,500 684 C 630 C MIDWAY RD I-95 GLADES CUT-OFF RD 4 E 2100 16,293 906 C 1004 C MIDWAY RD SELVITZ RD CHRISTENSEN RD 2 E 920 17,500 912 D 896 D MIDWAY RD SUNRISE BLVD OLEANDER AVE 2 E 790 18,663 1018 F 935 F MIDWAY RD OLEANDER AVE US 1 2 E 790 15,533 820 E 811 E MIDWAY RD 25TH ST SUNRISE BLVD 2 E 790 18,663 1018 F 935 F MIDWAY RD OKEECHOBEE RD SHINN RD 2 E 760 4,742 274 C 348 C MIDWAY RD SHINN RD MCCARTY RD 2 E 630 4,742 274 C 348 C MIDWAY RD MCCARTY RD I-95 2 E 700 4,742 274 C 348 C

St. Lucie County 2-47 June 2018 Comprehensive Plan Transportation Element DIA
Pk Hr Ser- vice
Capac- ity
AM PK HR
PK DIR PM PK HR
PK DIR
ROADWAY NAME FROM TO # OF
LANES
ADOPT- ED LOS
2017 AADT
VOL- UME LOS
VOL- UME LOS
MIDWAY RD GLADES CUT-OFF RD EAST TORINO PKWY 4 E 2100 18,000 1105 C 1037 C MIDWAY RD W OF SELVITZ RD SELVITZ RD 2 E 920 20,500 1084 F 1085 F MIDWAY RD WALLACE ST WEATHERBEE RD 2 E 920 3,600 279 C 308 C MIDWAY RD WEATHERBEE RD INDIAN RIVER DR 2 E 630 3,600 279 C 308 C MIDWAY RD EAST TORINO PKWY MILNER DR 2 E 880 20,500 1084 F 1085 F MIDWAY RD MILNER DR W OF SELVITZ RD 2 E 790 20,500 1084 F 1085 F MIDWAY RD CHRISTENSEN RD 25TH ST 2 E 790 17,500 912 F 896 F MIDWAY RD US 1 WALLACE ST 2 E 790 3,600 279 C 308 C MORNINGSIDE BLVD PORT ST LUCIE BLVD LYNGATE DR 2 D 880 4,637 315 C 303 C MORNINGSIDE BLVD WESTMORELAND BLVD PORT ST LUCIE BLVD 2 D 920 2,700 162 C 155 C NEBRASKA AVE 25TH ST 13TH ST 4 D 1710 3,900 242 C 204 C OAKRIDGE DR MOUNTWELL ST OAKLYN ST 2 D 700 6,900 368 C 321 C OHIO AVE SUNRISE BLVD COLONIAL RD 2 D 540 4,000 237 C 232 C OHIO AVE COLONIAL RD US 1 2 D 750 4,000 237 C 232 C OKEECHOBEE RD GEORGIA AVE DELAWARE AVE 4 D 1710 12,167 724 C 679 C OKEECHOBEE RD 25TH ST GEORGIA AVE 4 D 1630 12,167 724 C 679 C OKEECHOBEE RD 33RD ST 25TH ST 4 D 1630 13,167 729 C 731 D OKEECHOBEE RD IDEAL HOLDING RD HEADER CANAL RD 4 B 1340 6,369 339 B 331 B OKEECHOBEE RD HEADER CANAL RD MIDWAY RD 4 B 1740 6,369 339 B 331 B OKEECHOBEE RD MCCARTY RD FLORIDA'S TURNPIKE 4 B 1810 6,039 302 B 313 B OKEECHOBEE RD MIDWAY RD SHINN RD 4 B 1740 6,369 339 B 331 B OKEECHOBEE RD FLORIDA'S TURNPIKE KINGS HWY 4 C 2010 6,039 302 C 313 C

St. Lucie County 2-48 June 2018 Comprehensive Plan Transportation Element DIA
Pk Hr Ser- vice
Capac- ity
AM PK HR
PK DIR PM PK HR
PK DIR
ROADWAY NAME FROM TO # OF
LANES
ADOPT- ED LOS
2017 AADT
VOL- UME LOS
VOL- UME LOS
OKEECHOBEE RD CROSSROADS PKWY I-95 8 C 4170 20,282 877 C 896 C OKEECHOBEE RD VIRGINIA AVE HARTMAN RD 4 D 2100 11,667 641 C 641 C OKEECHOBEE RD I-95 JENKINS RD 8 D 4240 28,592 1868 C 1616 C OKEECHOBEE RD 35TH ST 33RD ST 4 D 1630 13,167 729 C 731 D OKEECHOBEE RD HARTMAN RD 35TH ST 4 D 1630 11,667 641 C 641 C OKEECHOBEE RD JENKINS RD MCNEIL RD 8 D 4040 28,592 1868 C 1616 C OKEECHOBEE RD MCNEIL RD VIRGINIA AVE 6 D 3170 29,293 1603 C 1673 C OKEECHOBEE RD OKEECHOBEE C.L. BLUEFIELD RD 4 B 1010 7,150 399 B 399 B OKEECHOBEE RD BLUEFIELD RD CARLTON RD 4 B 1270 7,150 399 B 399 B OKEECHOBEE RD CARLTON RD SNEED RD 4 B 1340 6,369 339 B 331 B OKEECHOBEE RD SHINN RD MCCARTY RD 4 B 1810 5,192 0 B 0 B OKEECHOBEE RD KINGS HWY CROSSROADS PKWY 8 C 4170 19,706 890 C 940 C OKEECHOBEE RD SNEED RD IDEAL HOLDING RD 4 B 1340 6,369 339 B 331 B OLD DIXIE HWY SR A1A NORTH ST LUCIE BLVD 2 D 750 1,730 0 B 0 B OLD DIXIE HWY US 1 SR A1A NORTH 2 D 790 5,100 397 D 360 C OLD DIXIE HWY INDRIO RD INDIAN RIVER C.L. 2 C 870 1,115 0 B 0 B OLD DIXIE HWY ST LUCIE BLVD INDRIO RD 2 D 790 2,086 153 C 119 C OLEANDER AVE BEACH AVE KITTERMAN RD 2 D 540 2,900 175 C 193 C OLEANDER AVE VIRGINIA AVE SUNRISE BLVD 2 E 600 4,221 241 C 239 C OLEANDER AVE BELL AVE FARMER'S MARKET RD 2 E 540 12,500 662 F 678 F
OLEANDER AVE FARMER'S MARKET RD EDWARDS RD 2 E 750 12,500 662 D 678 D
OLEANDER AVE WISTERIA AVE GARDENIA AVE 2 E 540 9,900 641 F 576 E

St. Lucie County 2-49 June 2018 Comprehensive Plan Transportation Element DIA
Pk Hr Ser- vice
Capac- ity
AM PK HR
PK DIR PM PK HR
PK DIR
ROADWAY NAME FROM TO # OF
LANES
ADOPT- ED LOS
2017 AADT
VOL- UME LOS
VOL- UME LOS
OLEANDER AVE EDWARDS RD WISTERIA AVE 2 E 750 9,900 641 D 576 D OLEANDER AVE GARDENIA AVE VIRGINIA AVE 2 E 790 9,900 641 D 576 D OLEANDER AVE KITTERMAN RD MIDWAY RD 2 D 750 5,900 369 C 387 D OLEANDER AVE MIDWAY RD WEATHERBEE RD 2 D 750 7,477 425 D 421 D OLEANDER AVE WEATHERBEE RD BELL AVE 2 E 540 7,477 425 D 421 D ORANGE AVE JENKINS RD HARTMAN RD 4 B 0 13,564 730 C 679 C ORANGE AVE HARTMAN RD ANGLE RD 4 B 0 13,564 730 C 679 C ORANGE AVE CAMPBELL RD KINGS HWY 2 D 1070 2,440 0 B 0 B ORANGE AVE 7TH ST US 1 2 C 300 6,808 434 D 386 D ORANGE AVE ANGLE RD 25TH ST 4 D 1710 11,350 894 D 1040 D ORANGE AVE KINGS HWY I-95 4 B 0 17,012 732 C 738 C ORANGE AVE I-95 JENKINS RD 4 B 0 13,294 913 C 859 C ORANGE AVE SNEED RD HEADER CANAL RD 2 C 390 4,735 300 C 297 C ORANGE AVE OKEECHOBEE C.L. SNEED RD 2 C 390 4,735 300 C 297 C ORANGE AVE 2ND ST INDIAN RIVER DR 2 C 370 3,226 205 C 201 C ORANGE AVE US 1 2ND ST 2 C 300 3,226 205 C 201 C ORANGE AVE 25TH ST 17TH ST 4 D 1630 12,975 678 C 744 D ORANGE AVE 17TH ST 13TH ST 4 D 1710 12,975 678 C 744 C ORANGE AVE 13TH ST 10TH ST 2 C 370 12,975 678 D 744 D ORANGE AVE 10TH ST 7TH ST 2 C 300 7,699 389 D 448 D ORANGE AVE SHINN RD CAMPBELL RD 2 B 380 2,440 0 B 0 B PARR DR ROSSER BLVD SAVONA BLVD 2 D 630 1,419 104 C 92 C

St. Lucie County 2-50 June 2018 Comprehensive Plan Transportation Element DIA
Pk Hr Ser- vice
Capac- ity
AM PK HR
PK DIR PM PK HR
PK DIR
ROADWAY NAME FROM TO # OF
LANES
ADOPT- ED LOS
2017 AADT
VOL- UME LOS
VOL- UME LOS
PARR DR SAVONA BLVD PORT ST LUCIE BLVD 2 D 700 1,419 104 C 92 C PARR DR PORT ST LUCIE BLVD DARWIN BLVD 2 D 700 1,419 104 C 92 C PARR DR DARWIN BLVD TULIP BLVD 2 D 540 1,950 145 C 118 C PEACOCK BLVD CALIFORNIA BLVD CASHMERE BLVD 2 D 630 4,300 372 C 310 C PEACOCK BLVD UNIVERSITY BLVD CALIFORNIA BLVD 2 D 920 10,067 660 C 640 C PEACOCK BLVD ST LUCIE WEST BLVD UNIVERSITY BLVD 4 D 2100 15,410 0 B 0 B PETERSON RD BENT CREEK DR HARTMAN RD 2 D 540 1,000 80 C 68 C PICOS RD CAMPBELL RD KINGS HWY 2 D 540 1,300 90 C 84 C PORT ST LUCIE BLVD DEL RIO BLVD CAMEO BLVD 6 D 3170 47,273 3161 D 2869 C PORT ST LUCIE BLVD GATLIN BLVD DEL RIO BLVD 6 E 3170 42,500 2456 C 2219 C PORT ST LUCIE BLVD MORNINGSIDE BLVD US 1 6 D 3170 39,062 2966 C 1850 C PORT ST LUCIE BLVD VETERANS MEMORIAL PKWY MORNINGSIDE BLVD 6 D 3020 38,975 2346 C 2081 C
PORT ST LUCIE BLVD FLORESTA DR VETERANS MEMORIAL PKWY 6 D 3020 61,666 4419 F 3296 F
PORT ST LUCIE BLVD DARWIN BLVD GATLIN BLVD 6 E 3020 32,000 1714 C 1605 C PORT ST LUCIE BLVD PAAR DR TULIP BLVD 2 E 700 13,310 0 B 0 B PORT ST LUCIE BLVD FLORIDA'S TURNPIKE BAYSHORE BLVD 6 D 3170 47,273 3161 D 2869 C PORT ST LUCIE BLVD BAYSHORE BLVD AIROSO BLVD 6 D 3020 46,262 2924 C 2897 C PORT ST LUCIE BLVD AIROSO BLVD FLORESTA DR 6 D 3020 48,361 2977 D 2609 C PORT ST LUCIE BLVD MARTIN C.L. BECKER RD 2 E 920 13,310 0 B 0 B PORT ST LUCIE BLVD BECKER RD PAAR DR 2 E 920 13,310 0 B 0 B PORT ST LUCIE BLVD TULIP BLVD DARWIN BLVD 2 E 920 13,310 0 B 0 B

St. Lucie County 2-51 June 2018 Comprehensive Plan Transportation Element DIA
Pk Hr Ser- vice
Capac- ity
AM PK HR
PK DIR PM PK HR
PK DIR
ROADWAY NAME FROM TO # OF
LANES
ADOPT- ED LOS
2017 AADT
VOL- UME LOS
VOL- UME LOS
PORT ST LUCIE BLVD CAMEO BLVD FLORIDA'S TURNPIKE 6 D 3020 47,273 3161 F 2869 C PRIMA VISTA BLVD BAYSHORE BLVD AIROSO BLVD 4 E 2100 25,000 1138 C 1192 C PRIMA VISTA BLVD RIO MAR DR US 1 4 E 2100 26,500 1213 C 1402 C PRIMA VISTA BLVD AIROSO BLVD FLORESTA DR 4 E 2100 26,500 1220 C 1144 C PRIMA VISTA BLVD NARANJA AVE RIO MAR DR 4 E 2000 39,000 2308 F 2193 F PRIMA VISTA BLVD FLORESTA DR NARANJA AVE 4 E 2100 39,000 2308 F 2193 F PRIMA VISTA BLVD US 1 LENNARD RD 4 E 1710 8,600 522 C 526 C RANGE LINE RD MARTIN C.L. BECKER RD 2 D 1080 1,396 111 B 135 B
RANGE LINE RD BECKER RD 2 MI S OF GLADES CUT-OFF RD 2 D 1080 1,396 111 B 135 B
RANGE LINE RD 2 MI S OF GLADES CUT-OFF RD GLADES CUT-OFF RD 2 D 1080 1,396 111 B 135 B
RIO MAR DR BEACH AVE US 1 2 D 790 5,649 288 C 360 C RIO MAR DR PRIMA VISTA BLVD BEACH AVE 2 D 750 5,649 288 C 360 C ROSSER BLVD PAAR DR APRICOT RD 2 D 1070 4,790 0 B 0 B ROSSER BLVD APRICOT RD GATLIN BLVD 2 D 920 4,790 0 B 0 B SAVAGE BLVD GATLIN BLVD GALIANO RD 2 E 920 3,403 233 C 212 C SAVANNAH RD US 1 INDIAN RIVER DR 2 D 540 2,202 136 C 149 C SAVONA BLVD GATLIN BLVD CALIFORNIA BLVD 2 D 790 13,000 707 D 686 D SAVONA BLVD PAAR DR GATLIN BLVD 2 D 750 8,000 775 E 694 D SAVONA BLVD BECKER RD PAAR DR 2 D 790 8,000 775 D 694 D SELVITZ RD GLADES CUT-OFF RD EDWARDS RD 2 D 790 13,000 761 D 764 D SELVITZ RD BAYSHORE BLVD ST JAMES BLVD 2 D 750 7,440 0 B 0 B

St. Lucie County 2-52 June 2018 Comprehensive Plan Transportation Element DIA
Pk Hr Ser- vice
Capac- ity
AM PK HR
PK DIR PM PK HR
PK DIR
ROADWAY NAME FROM TO # OF
LANES
ADOPT- ED LOS
2017 AADT
VOL- UME LOS
VOL- UME LOS
SELVITZ RD MIDWAY RD GLADES CUT-OFF RD 2 D 700 11,000 807 F 883 F SELVITZ RD ST JAMES BLVD MIDWAY RD 2 D 750 7,440 0 B 0 B SHINN RD OKEECHOBEE RD ORANGE AVE 2 D 1080 731 52 B 57 B SHINN RD MIDWAY RD OKEECHOBEE RD 2 D 580 750 49 C 47 C SNEED RD OKEECHOBEE RD ORANGE AVE 2 D 670 1,230 95 B 91 B SOUTHBEND BLVD BECKER RD FLORESTA DR 2 D 790 14,500 969 F 862 F SR A1A NORTH SHOREWINDS DR INDIAN RIVER C.L. 2 D 920 7,669 412 C 452 C SR A1A NORTH OLD DIXIE HWY N HWY A1A 2 B 0 9,300 510 C 544 C SR A1A NORTH US 1 OLD DIXIE HWY 2 D 920 5,730 386 C 387 C SR A1A SOUTH BLUE HERON BLVD SEAWAY DR 2 D 600 7,380 399 D 477 D SR A1A SOUTH NETTLES ISLAND FPL PLANT 2 D 920 5,971 365 C 328 C SR A1A SOUTH INDIAN RIVER DR US 1 4 D 1710 11,413 628 C 568 C SR A1A SOUTH FPL PLANT BLUE HERON BLVD 2 D 700 3,667 438 C 352 C SR A1A SOUTH OCEAN DR BINNEY DR 2 D 600 12,043 599 D 627 E SR A1A SOUTH S CAUSEWAY PARK INDIAN RIVER DR 4 D 1550 11,413 628 C 568 C SR A1A SOUTH BINNEY DR S CAUSEWAY PARK 2 D 790 12,043 599 D 627 D ST JAMES BLVD SELVITZ RD ST JAMES DR 2 D 790 4,600 270 C 266 C ST JAMES DR TELFORD AVE MIDWAY RD 4 D 2100 20,500 1238 C 1221 C ST JAMES DR AIROSO BLVD ST JAMES BLVD 4 D 2100 17,000 1152 C 1099 C ST JAMES DR ST JAMES BLVD PEACHTREE BLVD 4 D 2100 19,000 1255 C 1209 C ST JAMES DR PEACHTREE BLVD TELFORD AVE 4 D 1800 17,000 1152 C 1099 C ST LUCIE BLVD KINGS HWY KEEN RD 2 E 880 5,125 360 C 380 C

St. Lucie County 2-53 June 2018 Comprehensive Plan Transportation Element DIA
Pk Hr Ser- vice
Capac- ity
AM PK HR
PK DIR PM PK HR
PK DIR
ROADWAY NAME FROM TO # OF
LANES
ADOPT- ED LOS
2017 AADT
VOL- UME LOS
VOL- UME LOS
ST LUCIE BLVD KEEN RD 25TH ST 2 E 880 5,125 360 C 380 C ST LUCIE BLVD SENECA AVE US 1 2 E 790 3,662 187 C 190 C ST LUCIE BLVD 25TH ST SENECA AVE 2 E 750 3,662 187 C 190 C ST LUCIE WEST BLVD CASHMERE BLVD BAYSHORE BLVD 6 E 3170 48,500 2369 C 2317 C ST LUCIE WEST BLVD I-95 CALIFORNIA BLVD 4 E 2100 37,000 1724 C 1673 C ST LUCIE WEST BLVD COUNTRY CLUB DR CASHMERE BLVD 4 E 2100 37,000 1724 C 1673 C ST LUCIE WEST BLVD CALIFORNIA BLVD COUNTRY CLUB DR 4 E 2100 37,000 1724 C 1673 C ST LUCIE WEST BLVD COMMERCE CENTER DR W OF I-95 2 E 700 11,500 544 C 550 C SUNRISE BLVD VIRGINIA AVE OLEANDER AVE 2 D 750 4,797 289 C 347 C SUNRISE BLVD BELL AVE EDWARDS RD 2 D 750 3,857 255 C 289 C SUNRISE BLVD EDWARDS RD CORTEZ BLVD 2 D 600 6,061 481 D 422 D SUNRISE BLVD MIDWAY RD BELL AVE 2 D 540 3,547 246 C 230 C SUNRISE BLVD OLEANDER AVE 7TH ST 4 D 1540 3,800 237 C 275 C SUNRISE BLVD 7TH ST US 1 4 D 1710 3,800 237 C 275 C SUNRISE BLVD CORTEZ BLVD VIRGINIA AVE 2 D 750 6,061 481 D 422 D TIFFANY AVE HILLMOOR DR VILLAGE GREEN DR 4 D 2100 15,896 906 C 802 C TIFFANY AVE VILLAGE GREEN DR LENNARD RD 4 D 2100 5,000 259 C 280 C TIFFANY AVE US 1 HILLMOOR DR 4 D 2100 15,896 906 C 802 C TORINO PKWY CASHMERE BLVD CALIFORNIA BLVD 2 D 630 7,600 404 C 391 C TORINO PKWY CALIFORNIA BLVD EAST TORINO PKWY 2 D 630 3,817 239 C 199 C TRADITION PKWY VILLAGE PKWY W OF I-95 6 D 3170 22,279 1223 C 1225 C TRADITION PKWY COMMUNITY BLVD VILLAGE PKWY 4 D 1710 8,633 611 C 654 C

St. Lucie County 2-54 June 2018 Comprehensive Plan Transportation Element DIA
Pk Hr Ser- vice
Capac- ity
AM PK HR
PK DIR PM PK HR
PK DIR
ROADWAY NAME FROM TO # OF
LANES
ADOPT- ED LOS
2017 AADT
VOL- UME LOS
VOL- UME LOS
TULIP BLVD DARWIN BLVD PORT ST LUCIE BLVD 2 D 790 8,000 577 D 448 D TULIP BLVD PORT ST LUCIE BLVD PAAR DR 2 D 790 5,467 351 C 324 C TULIP BLVD PAAR DR DARWIN BLVD 2 D 790 5,467 351 C 324 C TURNPIKE FEEDER RD INDRIO RD INDIAN PINES BLVD 2 C 870 12,159 658 C 692 C
TURNPIKE FEEDER RD INDIAN PINES BLVD TURNPIKE FEEDER RD SB RAMP 2 C 870 9,656 637 C 584 C
TURNPIKE FEEDER RD TURNPIKE FEEDER RD SB RAMP US 1 2 C 660 5,023 657 C 657 C
US 1 AVENUE H OLD DIXIE HWY 4 D 2000 32,000 1700 C 1674 C US 1 EASY ST MIDWAY RD 6 D 3170 28,231 1316 C 1279 C US 1 TIFFANY AVE WALTON RD 6 D 3020 30,412 1460 C 1550 C US 1 TURNPIKE FEEDER RD INDIAN RIVER C.L. 4 D 2100 19,104 1040 C 1034 C US 1 INDRIO RD TURNPIKE FEEDER RD 4 D 2100 19,104 1040 C 1034 C US 1 25TH ST INDRIO RD 4 D 2100 16,277 969 C 929 C US 1 ST LUCIE BLVD 25TH ST 4 D 2100 16,277 969 C 929 C US 1 SR A1A NORTH JUANITA AVE 4 D 2100 16,195 972 C 778 C US 1 JUANITA AVE ST LUCIE BLVD 4 D 2100 16,195 972 C 778 C US 1 AVENUE D SR A1A SOUTH 4 D 1630 24,245 1228 D 1197 D US 1 ORANGE AVE AVENUE A 4 D 1630 24,245 1228 D 1197 D US 1 DELAWARE AVE CITRUS AVE 4 D 1630 24,245 1228 D 1197 D US 1 CITRUS AVE ORANGE AVE 4 D 1630 20,680 1029 D 928 D US 1 GEORGIA AVE DELAWARE AVE 4 D 1630 20,695 1067 D 1020 D US 1 GARDENIA AVE VIRGINIA AVE 4 D 2000 26,894 1232 C 1208 C

St. Lucie County 2-55 June 2018 Comprehensive Plan Transportation Element DIA
Pk Hr Ser- vice
Capac- ity
AM PK HR
PK DIR PM PK HR
PK DIR
ROADWAY NAME FROM TO # OF
LANES
ADOPT- ED LOS
2017 AADT
VOL- UME LOS
VOL- UME LOS
US 1 EDWARDS RD SAVANNAH RD 4 D 2000 26,894 1232 C 1208 C US 1 FARMER'S MARKET RD EDWARDS RD 4 D 2000 27,000 1268 C 1284 C US 1 MIDWAY RD WEATHERBEE RD 4 D 2100 27,000 1268 C 1284 C US 1 WEATHERBEE RD FARMER'S MARKET RD 4 D 2000 27,000 1268 C 1284 C US 1 PRIMA VISTA BLVD RIO MAR DR 6 D 3170 34,012 1573 C 1548 C US 1 RIO MAR DR KITTERMAN RD 6 D 3170 29,987 1466 C 1327 C US 1 JENNINGS RD TIFFANY AVE 6 D 3020 30,412 1460 C 1550 C US 1 PORT ST LUCIE BLVD JENNINGS RD 6 D 3020 30,412 1460 C 1550 C US 1 LENNARD RD PORT ST LUCIE BLVD 8 D 4040 45,287 2062 C 2425 C US 1 MARTIN C.L. LENNARD RD 8 D 4240 45,287 2062 C 2425 C US 1 SPANISH LAKES BLVD PRIMA VISTA BLVD 6 D 3170 45,567 2421 C 2266 C US 1 SAVANNAH RD GARDENIA AVE 4 D 2000 26,894 1232 C 1208 C US 1 OLD DIXIE HWY AVENUE O 4 D 2000 20,816 1445 C 1129 C US 1 AVENUE O SR A1A NORTH 4 D 2100 20,816 1445 C 1129 C US 1 AE BACKUS AVE AVENUE D 4 D 1630 24,245 1228 D 1197 D US 1 AVENUE A AE BACKUS AVE 4 D 1630 24,245 1228 D 1197 D US 1 KITTERMAN RD S OF SAEGER AVE 6 D 3020 29,987 1466 C 1327 C US 1 S OF SAEGER AVE EASY ST 6 D 3170 29,987 1466 C 1327 C US 1 OHIO AVE GEORGIA AVE 4 D 1630 24,772 1193 D 1202 D US 1 VIRGINIA AVE OHIO AVE 4 D 2000 24,772 1193 C 1202 C US 1 WALTON RD VILLAGE GREEN DR 6 D 3020 38,972 2111 C 1893 C US 1 VILLAGE GREEN DR SPANISH LAKES BLVD 6 D 3170 45,567 2421 C 2266 C

St. Lucie County 2-56 June 2018 Comprehensive Plan Transportation Element DIA
Pk Hr Ser- vice
Capac- ity
AM PK HR
PK DIR PM PK HR
PK DIR
ROADWAY NAME FROM TO # OF
LANES
ADOPT- ED LOS
2017 AADT
VOL- UME LOS
VOL- UME LOS
US 1 SR A1A SOUTH AVENUE H 4 D 2100 32,000 1700 C 1674 C VETERANS MEMORIAL PKWY LYNGATE DR US 1 4 D 2100 16,500 837 C 890 C
VETERANS MEMORIAL PKWY PORT ST LUCIE BLVD LYNGATE DR 4 D 2100 21,500 1173 C 1165 C
VILLAGE GREEN DR US 1 WALTON RD 4 D 2100 9,300 600 C 557 C VILLAGE GREEN DR WALTON RD TIFFANY AVE 2 D 920 4,200 226 C 213 C VILLAGE PKWY BECKER RD DISCOVERY WAY 4 D 1710 9,400 512 C 512 C VILLAGE PKWY TRADITION PKWY WESTCLIFFE LN 4 D 1710 20,500 1116 D 1100 D VILLAGE PKWY WESTCLIFFE LN CROSSROADS PKWY 4 D 1540 11,267 659 C 656 C VILLAGE PKWY DISCOVERY WAY TRADITION PKWY 6 D 2650 9,400 512 C 512 C VIRGINIA AVE SUNRISE BLVD OLEANDER AVE 6 D 3020 20,481 1115 C 1041 C VIRGINIA AVE 25TH ST 13TH ST 6 D 3020 21,157 1106 C 1178 C VIRGINIA AVE HARTMAN RD 35TH ST 6 D 3020 21,979 1167 C 1124 C VIRGINIA AVE 35TH ST 25TH ST 6 D 3020 22,289 1149 C 1120 C VIRGINIA AVE 13TH ST 11TH ST 6 D 3020 22,804 1098 C 1098 C
VIRGINIA AVE 11TH ST SUNRISE BLVD 6 D 3170 22,804 1098 C 1098 C
VIRGINIA AVE OLEANDER AVE COLONIAL RD 6 D 3170 19,991 1128 C 1103 C VIRGINIA AVE COLONIAL RD US 1 6 D 3020 19,991 1128 C 1103 C VIRGINIA AVE OKEECHOBEE RD HARTMAN RD 6 D 3020 21,979 1167 C 1124 C WALTON RD US 1 VILLAGE GREEN DR 4 D 1710 14,251 727 C 806 D WALTON RD VILLAGE GREEN DR LENNARD RD 4 D 1710 17,000 971 D 892 D WALTON RD LENNARD RD GREEN RIVER PKWY 2 D 880 11,000 585 C 630 C

St. Lucie County 2-57 June 2018 Comprehensive Plan Transportation Element DIA
Pk Hr Ser- vice
Capac- ity
AM PK HR
PK DIR PM PK HR
PK DIR
ROADWAY NAME FROM TO # OF
LANES
ADOPT- ED LOS
2017 AADT
VOL- UME LOS
VOL- UME LOS
WALTON RD GREEN RIVER PKWY INDIAN RIVER DR 2 D 630 4,857 334 C 343 C WEATHERBEE RD US 1 MIDWAY RD 2 D 750 5,992 374 D 407 D WEATHERBEE RD OLEANDER AVE US 1 2 D 750 2,533 185 C 171 C WESTCLIFFE LN TREMONTE AVE VILLAGE PKWY 4 D 1470 2,933 176 C 179 C WESTMORELAND BLVD MORNINGSIDE BLVD PORT ST LUCIE BLVD 2 D 920 13,500 672 C 672 C
WESTMORELAND BLVD MARTIN C.L. MORNINGSIDE BLVD 2 D 920 10,000 568 C 520 C

St. Lucie County 2-58 June 2018 Comprehensive Plan Transportation Element DIA
Roadway Improvement Strategies Transportation Regional Incentive Program (TRIP)
The Transportation Regional Incentive Program (TRIP) was enacted by the Florida Statues through Senate Bill 360 in 2005. To encourage regional planning and improvements of regional facilities, the State matches funds with regional partners. To meet the requirements of TRIP funding, the local authorities have to enter into an interlocal agreement and need to develop a regional plan. The St. Lucie TPO along with the Martin and Indian River MPOs entered into an interlocal agreement in April 2006. As with the new legislation, new regional transportation projects may be eligible for TRIP if they meet the regional needs identified in the 2040 Treasure Coast Regional LRTP. Currently, improvements on SR-70/Okeechobee Road are funded through TRIP. Transportation Demand Management (TDM) strategies and techniques can be used to increase the efficiency of the transportation system. Demand management focuses on ways of influencing the amount and demand for transportation by encouraging alternatives to the single-occupant automobile and by altering peak hour travel demand. These strategies and techniques include: ridesharing programs, flexible work hours, telecommuting, shuttle services, and parking management. TDM also is effective at lower residential densities than are required for most public transit and pedestrian and bicycle programs. Proposed candidate roadways for TDM/TSM strategies include US 1 from Edwards Road to St. Lucie Boulevard; Oleander Avenue from Kitterman Road to Sunrise Boulevard; and Floresta Drive from Airoso Boulevard to Southbend Boulevard. For those roads on which both road widening and TDM/TSM are proposed, TDM/TSM projects could replace the a widening project. Transportation System Management (TSM) TSM means improving roads, intersections, and other related facilities to make the existing transportation system operate more efficiently. Intersection improvement, signal timing improvements, and access management are the part of TSM currently used in St. Lucie County. The St. Lucie Advanced Transportation Management System (ATMS) Master Plan identifies the TSM needs and improvements for the County. Congestion Management System Process (CMS CMP) Congestion Management Processes are required by all MPOs in the state of Florida. The objective of a CMP is to develop processes for short and long term solutions for congested corridors utilizing a wide range of strategies. The most recent St. Lucie TPO CMP was CMS, developed in 2008 2018, utilizes two tiers. The first tier identifies congested roadways while the second tier identifies strategies that can be funded and includes an Implementation Plan that identifies the CMP strategies and projects for the County. Backlogged Facilities/ Constrained Corridors The St. Lucie TPO has identified U.S. Highway 1 as a several constrained corridors where additional lanes are not feasible. The County has implemented different CMS strategies to mitigate the failing roadway segments. The Go2040 LRTP includes the US-1 Corridor Retrofit Project that involves a context sensitive approach to develop strategic alternatives to roadway widening.

St. Lucie County 2-59 June 2018 Comprehensive Plan Transportation Element DIA
Proportionate Fair Share: St. Lucie County has adopted a Proportionate Fair Share Ordinance which requires new developments to mitigate its project impacts if the roadway’s projected capacity is lower than the adopted LOS. Energy Conservation and Reduction of Greenhouse Gas Emissions Greenhouse gas emissions can be reduced by minimizing the number of vehicles on the roadway and the time spent on the roadway. Effective strategies to reduce greenhouse gas emissions include increased transit ridership, more efficient roadways, and promoting transportation by walking and bicycling. As discussed in this Element, St. Lucie County has extensive plans to increase the number of future transit routes and ridership numbers. It is also important that all new development and redevelopment promote the County transit goals. Strategies such as TDM and TSM can effectively increase the efficiency of the County roadways. Congested roadways and the time vehicles spend idling at intersections greatly increase the production of greenhouse gases into the environment. The signal timing optimization of key roadways in the County implementation of the St. Lucie Advanced Transportation Management System (ATMS) can provide a great benefit to the reduction of greenhouse gases by minimizing the number of vehicle stops. The County intends to promote multi-modal transportation through the means of new sidewalks, bicycle lanes, and greenways as outlined in the Master Plan St. Lucie Walk-Bike Network,. The recent SLC Bicycle Pedestrian, Greenways & Trails study also provides input to the Master Plan regarding which identifies gaps and missing links in the network, and demand for bicycle and pedestrian facilities. Mobility Fee St. Lucie County mayis considering implementing a mobility fee to encourage in-fill development in urbanized areas. The Joint Report on the Mobility Fee Methodology Study was submitted on December 1, 2009 to the President of the Senate and the Speaker of the House of Representatives by the DCA and FDOT. The report defines a A mobility fee as is “a charge on all new development to provide mitigation for its impact on the transportation system. However, a mobility fee is not a substitute for site related improvements for safety, access and internal circulation, which may still be required under local Land Development Code.” The Joint Report on the Mobility Fee Methodology Study identified the following principles for the mobility fee approach:
• Ensure all new development provides mitigation for its impacts on the transportation system in approximate proportionality to those impacts, and new development should not be required to pay for existing system backlogs and deficiencies;
• Be transparent and predictable in its application; • Be structured and implemented on at least a countywide basis and may be
extended to include multi-county areas; • Be designed to provide for mobility needs including at a minimum roadways,
transit, bikeways, pedestrian walkways, and where applicable other transportation facilities;
• Be able to fund multi-modal transportation improvements, including capital

St. Lucie County 2-60 June 2018 Comprehensive Plan Transportation Element DIA
projects, system efficiency and congestion management strategies and transit operating costs that support the provision of transit service for new development;
• Fairly distribute the mobility fee among the governmental entities responsible for maintaining impacted roadways and other transportation facilities necessary to provide for mobility;
• In order to promote compact, mixed use and energy efficient development a mobility fee should:
o Be sensitive to vehicle or person miles traveled and vary by location and development type;
o Have a fee structure that encourages shorter trips and reduction of total travel (as well as reduction of greenhouse gases); and
o Have a fee structure that charges more per trip in areas where long distance travel is unavoidable.
• Allow for some level of local/ regional flexibility in the implementation of mobility fees:
o The land use and transportation strategies, multi-modal improvement priorities, methodologies and intergovernmental procedures for mobility fees may vary from county to county;
o Allow the continuation of current alternative approaches for implementation of mobility fees; and
o Should be authorized in the comprehensive plan of each local government within the county.
FUTURE CONDITIONS Capital Improvement Projects The Capital Improvement Element identifies funded projects for St. Lucie County for the next 5 years. Table 2-6 lists all the state roadway projects in St. Lucie County for the next 5 years. Capacity improvements on state roadways are planned for Kings Highway, SR 70, Midway Road, and Lennard Road. Additionally Table 2-7 lists all County roadway projects identified in the St. Lucie Capital Improvement Plan.

St. Lucie County 2-61 June 2018 Comprehensive Plan Transportation Element DIA
Table 2-6 Capital Improvement Plan – State Roadway Projects
Source: Capital Improvement Element Update FY 10/11 – 14/15.
Project # Project Title Phase Fund FY 2011 FY 2012 FY 2013 FY 2014 FY 2015231440-2 CST HPP 21,508,847 428169-1 CMS Reserve CST SU 300,000
427854-1Westmoreland Blvd from Morningside to Lennard Rd CST LF 142,486
230256-2Kings Hwy frm SR-70 to TPK to S of I-95 overpass PDE LF 130,000 2,570,000
424143-1SR-713/Kings Hwy @ SR-614/Indrio RW LF 5,460,896 7,369,796
410262-1Lennard Rd Frm Walton to Silver Oaks Dr CST LF 13,578,007
230262-3 SR70 from Mp 5.8-10.2 CST 669,350
230262-2SR70 from Okeechobe Rd to Mp 5.8 PDE/CST 22,740,368
410717-1SR70 from Okeechobe Rd to Kings Hwy PDE/CST 6,502,252
425152-1W. Midway Rd/Reserve From S. 25th to US1 CST 14,312,379
420735-1TPK St. Lucie Interchange Improvements PDE/CST 332,491
2302802SLC enhancement program improvements CST SE 693,000 711,000
2302971 SRA1A Ft. Pierce to SR5 - Reconstruct CST 7,088,000 1,881,000
2303384 Indrio Rd/ I-95 to Emerson PE 1,444,000 4102621 CST XU 13,460,0004107171 PE DDR 19,0004174321 PE 49,0004180411 CST SE 192,2004241431 ROW LF 3,818,000
424764KINGS (ORANGE & SR70) RESURFACE PE 323,000
4263732 CST 1,809,0004262051 CST 2,400,0004262091 CST 2,889,0004263841 CST 150,0004263851 CST 575,000
TOTAL 35,835,357 16,148,007 142,486 21,508,847 21,982,175
y , 25th St, CR 615 to US1
BIKE LANE
SO COU SOUTH, SIDEWALK
RD, ADD LANESINDIAN RIVER DRIVE REHABILITATION
SILVER OAK DR, ADD LANES
13TH ST - ORNAGE TO AVENUE IJUANITA AVE BRIDGE REPLACEMENTSW CALIFORNIA - SIDEWALK
KINGS AT INDRIO ADD TURN LANES
GS O & S S LAKES BLVD - PED
PhasePE = designROW = right-of-way acquisitionCST = constructionRRU = rehabilitationOPS = traffic signal operationsINA = inspectionINA = inspectionDBS = federal highway constructionPDE = project development and environmental* - Adopted Level Of Service for State Arterials is Peak Hour/Direction "D". Each project will either achieve or maintain a LOS "D" or better condition.

St. Lucie County 2-62 June 2018 Comprehensive Plan Transportation Element DIA
Table 2-7 Capital Improvement Plan – County Roadway Projects
Source: Capital Improvement Element Update FY 10/11 – 14/15.
Project # Project Title FY 2011 FY 2012 FY 2013 FY 2014 FY 2015 10' - 12' ***4112-4906 Unincorportated Bike Paths/Sidewalks 550,267 550,2674113-4101 Phase I Prima Vista (US1-RioMar) 79,153 79,1534113-4122 Midway Rd/S. 25th to Turnpike 7,850,000 7,850,0004113-4123 Kings Hwy@Orange Ave Intersect Imp ** 1,682,052 1,682,0524113-4169 Lennard Rd. R/W Acquisition 411,292 411,2924113-4176 Kings Hwy and Angle Road Study ** 1,500,000 1,500,0004113-4178 Kings Hwy (SR 70 to U.S.1) ** 725,000 725,0004113-43106 St. James Drive Sidewalk 55,000 55,0004113-44001 Kings Hwy/Indrio Rd. Signal-Modify ** 681,665 681,6654113-470 Sidewalks & Bikepaths 836,797 836,7974113-4660 Juanita Avenue Sidewalk/Bike Paths 222,271 222,2714113-4702 Angle Road Sidewalk 1,440,806 1,440,8064115-4502 N Lennard Road MSBU 5,205,091 127,8004115-4123 Kings Hwy@Orange Ave Intersect Imp ** 172,263 172,2634115-4410 I-95@W Midway Rd Interchnge (E Side) 202,526 202,5264116-41003 Jenkins Rd (End Wal-Mart to Edwards) 1,311,745 1,311,7454116-41011 Walton Rd (Village Green-Lennard) 1,551,990 1,551,9904116-4104 Midway (U.S.1-25th) 502,645 92,680 595,3254116-4108 S. 25th St.-Phase 1 463,562 463,5624116-4109 S. 25th St.-Phase 2 300,000 300,0004116-4118 Midway Rd-W of Trnpk Brg E to S.25thSt 6,951,906 6,951,9064116-4122 Midway Rd/S. 25th Turnpike 700,000 700,0004116-4123 Kings Hwy@Orange Ave Intersect Imp ** 424,800 12,187 12,187 12,187 12,187 436,9874116-4164 Glades Rd & Selvitz 675,366 675,3664116-4165 Midway Rd. & Weatherbee Rd 150000 2,000,0004116-4169 Lennard Rd. R/W Acquisition 3,533,805 3,533,8054116-4172 Lennard Road Phase 2 2,000,000 2,000,0004116-4174 Kings Hwy Widening (Angle to SR 70) ** 1,487,500 1,487,5004116-4176 Kings Hwy and Angle Road Study ** 250,000 6,500,000 250,0004116-44001 Kings Hwy/Indrio Rd. Signal-Modify ** 40,816 3,500,000 40,8164116-440015 Midway & Selvitz Signals 100,000 100,0004116-440016 Kings Hwy at St. Lucie Blvd ** 1,500,000 1,500,000 1,500,000 1,500,000 4,500,0004116-44011 Angle Rd/Ave Q Intersection 275,000 275,0004116-4700 Juanita Avenue Sidewalk/Bike Paths 100,000 100,0004116-4906 Unincorportated Bike Paths/Sidewalks 338,416 413,4164116-4908 North Hutchinson Isle Bike Paths 110,189 110,1894116-1905 3,477,085 8,107 8,107 8,107 8,107 3,485,1924116-464 124,681 124,6814116-466 100,000 100,0004113-41003 1,300,000 1,300,0004113-4119 385,570 385,5704116-4502 N Lennard Road MSBU 127,800 127,8004113-43106 St. James Drive Sidewalk 256,000 256,0004115-41011 Walton Rd (Village Green-Lennard) 3,665,644 3,665,6444113-4118 Midway Rd-W of Trnpk Brg E to S.25thSt 5,713,726 5,713,726
Total 48,440,561 112,974 20,294 20,294 20,294 48,553,535* - the Level Of Service (LOS) will improve to a LOS "D" or better condition with each improvement** - Kings Highway is a State arterial with an adopted LOS "D" standard*** - funding within the 5 -year timeframe may not represent the total construction cost necessary to implement the project
Road ImprovementsWalton / US1 to Village Green
Jenkins Rd (End Wal-Mart to Edwards) River Branch E. of S. 25th St.
Juanita Avenue Improvements

St. Lucie County 2-63 June 2018 Comprehensive Plan Transportation Element DIA
2030 St. Lucie County Transportation Plan The St. Lucie County Transportation Plan is a comprehensive, long-range outline of all major needed or desired transportation projects through the planning year 2030. Modeling and analysis of this plan has been done concurrent with the development of the St. Lucie and Martin County Regional Long Range Transportation Plan (RLRTP). The RLRTP was adopted in February 2006 and was last amended in September 2008. The St. Lucie TPO and Martin County MPO were both responsible for developing their elements of the RLRTP. However, both Counties worked together to construct a regional plan that would accommodate the future needs of the Treasure Coast region. Essentially, the 2030 St. Lucie Transportation Plan is the St. Lucie Element of the 2030 St. Lucie and Martin County Regional Long Range Transportation Plan. In addition to identifying those projects that have been shown to be a quantitative need as traditionally considered in a future transportation plan program, the 2030 Regional Long Range Transportation Plan also includes a number of projects that are designed to provide for improved community mobility, network connectivity, and the development of alternative transportation corridors that reduce reliance on the Interstate Highway System (I-95) for the trips of short duration, typically one-exit trips. When combined with the traditional needs plan projects, the 2030 Regional Long Range Transportation Plan identifies the base transportation system necessary to meet the goals and objectives through 2030, and beyond, based on the community’s future land use plans. The Regional Long Range Transportation Plan has been developed in several steps. The first step was to analyze the existing network using baseline conditions to establish local demographic and roadway conditions. The second step was to use the Treasure Coast Regional Planning Model (TCRPM) to forecast future traffic volumes and levels of service. The third, and final, step was to develop a program of transportation projects that would relieve areas determined to be points of existing or future congestion. This last phase has been developed in coordination with the City of Fort Pierce, the City of Port St. Lucie, and Martin County. Go2040 Long Range Transportation Plan Go2040 is the LRTP prepared by the St. Lucie TPO. The Go2040 LRTP is intended to guide the investment in multimodal transportation options and identify projects to be completed over the next 25 years. It includes a vision and goals and answers the following questions:
• Where do people live, work, and play now? • Where will people be living, working, and playing in 2040? • How does the community want the transportation system to function in 2040 to
accommodate current and future development needs? • What transportation options will be needed, such as transit, bicycle, pedestrian,
trails or roads, and which are the most important in 2040? • How will these transportation options be paid for? • What are the keys to successful implementation of the Go2040 LRTP?

St. Lucie County 2-64 June 2018 Comprehensive Plan Transportation Element DIA
The Go2040 LRTP is a comprehensive, multimodal “blueprint” aimed at meeting the transportation needs of the TPO planning area, including the incorporated cities of Port St. Lucie, Fort Pierce, and St. Lucie Village. As a multimodal transportation plan, Go2040 considers not only needed road improvements, but also public transportation, bicycle, pedestrian, freight, and other transportation projects. Go2040 relies heavily on input from the public to help identify and prioritize multimodal transportation projects in the development of the plan. Additionally, Go2040:
• Recognizes the tie between land use and transportation. • Supports the economic development goals of the local communities. • Supports regional coordination and collaboration. • Places emphasis on maintenance and preservation of the existing
transportation system. • Looks to provide safe, convenient, and accessible transportation options for
all. • Analyzes and weighs the potential social, economic, and environmental
impacts and benefits of the plan. • Is consistent with all applicable federal and State planning requirements. • Is a performance-based plan establishing metrics to monitor and evaluate the
Go2040 goals and objectives. • Provides a fiscally-constrained financial plan to meet future transportation
needs through 2040. Analysis of Existing and Future Conditions To provide a standardized analysis of expected future transportation conditions in St. Lucie County, a computerized model was run using input data provided by St. Lucie County and Martin County. The output of this model was forecasted traffic volumes and roadway performance (level-of-service) based on the adopted future land use plans of the local area. The Treasure Coast Regional Planning Model (TCRPM) was developed using the Florida Standard Urban Transportation Modeling Structure (FSUTMS) travel demand modeling software. FSUTMS utilizes land use (socio-economic) data to generate simulated trips, and a gravity model to distribute and assign those trips to a simulated transportation system. The geographic area encompassed by the TCRPM includes Indian River, St. Lucie, and Martin Counties. As part of the modeling work done for the St. Lucie and Martin 2030 Regional Long Range Transportation Plan, the TCRPM was validated to the base year 2000. A model is considered to be validated when it replicates field conditions to an acceptable degree. In the case of the TCRPM, the model was made to replicate 2000 traffic counts. The validated model was used to project future transportation system conditions for the 2030 St. Lucie and Martin Regional Long Range Transportation Plan (RLRTP). This was accomplished by inputting Year 2030 land use, or socio-economic data, into the model.

St. Lucie County 2-65 June 2018 Comprehensive Plan Transportation Element DIA
The Effect of Land Use on the TCRPM Land use drives all FSUTMS models, including the TCRPM. Land use information is input into the model, and person trips are generated in numbers that are contingent upon the size and types of land uses. These trips are then assigned to the simulated transportation network. Existing land uses replicate existing conditions; while land use forecasts predict future conditions. St. Lucie County has been divided into 467 Traffic Analysis Zones (TAZs). These zones represent specific geographic units that are coordinated to the existing traffic circulation network and local census block and tract designations. Forecast data sets of population and housing; employment; and other socio-economic characteristics were developed based upon both existing land use patterns and projected development activity through the year 2030. Countywide socio-economic data regarding vacant, developable acreage per Traffic Analysis Zone (TAZ), based upon (1) the Future Land Use Map and (2) information regarding approved development were obtained. This information was used in conjunction with local knowledge to assign socio-economic data to TAZs. Development of the 2030 Transportation Plan
Identification of the Existing + Committed (E+C) Network One of the first steps in developing the 2030 Regional Long Range Transportation Plan was to identify the Existing + Committed (E+C) transportation network that will be used as the base network for developing the 2030 Plan future year modeling and travel demand forecasting. The list of Existing + Committed projects (E + C Network) were developed using the following sources:
I. Roadway improvements completed between 2000 and 2005 II. St. Lucie County TPO Transportation Improvement Program (TIP) III. Martin County MPO Transportation Improvement Program (TIP) IV. Developer funded projects and roadways
Together, these sources list all transportation projects programmed in St. Lucie County through the year 2010. The improvements outlined in Table 2-8, represent the existing plus committed projects used to develop the 2030 Regional Long Range Transportation Plan. The projects identified as Built/Committed represent projects that have already been constructed by St. Lucie County or are planned to be built between the years 2000 and 2010. Developer projects indicate projects that will be funded by a developer by 2030. Analysis of Future Roadway Conditions Using the E+C coded network, model runs were performed using the TCRPM to forecast traffic volumes and conditions for the year 2030 assuming no improvements to the local road network other than those shown in the E+C network. The results provided an estimate of where congestion can be expected, and how severe that congestion will be. The standard used for calculating road performance was volume-to-capacity (V/C) ratio. V/C ratio is a measure of the amount of traffic a roadway is actually carrying in proportion to the amount of traffic it was designed to carry. A V/C ratio of 1.0 represents a road that is carrying the theoretical maximum amount of traffic possible to operate acceptably. For

St. Lucie County 2-66 June 2018 Comprehensive Plan Transportation Element DIA
the purposes of this evaluation, roads were considered to be congested if they had a Year 2030 V/C ratio of 1.0 or greater. Analysis of the model runs indicated that much of the existing or expected congestion lies on the major north-south corridors, such as U.S. Highway 1, 25th Street, Kings Highway, and the Florida Turnpike. However, east-west roads connecting to these north-south corridors will also see their share of capacity deficiencies. Roads such as Okeechobee Road, Indrio Road, and Midway Road in the north part of the County, as well as Port St. Lucie Boulevard in the south, can expected to see significant congestion by 2030, if capacity improvements are not made. Continuing development, particularly in the south part of the County, is expected to put additional strain on roads serving certain areas. This is particularly true of roads such as Jenkins Road, St. James Drive, South 25th Street, and Airoso Boulevard, all of which provide access to developing residential areas. Table 2-9 lists the congested roadway segments that can be expected in the year 2030 if no improvements are made beyond those shown in the E+C Network plan. Development of the Go2040 LRTP The growth of population and employment in the TPO area over the next 25 years is forecasted connecting the land use and development trends with the vision for the TPO area. Areas of high growth will have an impact on the future transportation needs. The future transportation projects to meet the travel needs are identified transportation projects are developed for improving quality of life and future economic development. Included in the development of the plan is an assessment of:
> Future travel demand estimated using the Treasure Coast Regional Planning Model
> St. Lucie Walk/Bike Network > Bus service improvements in the form of expanded hours, more frequent service,
and new bus routes > Freight and goods movement > Transportation related safety and security improvements > Roadway congestion measures that do not require additional lanes
The plan also includes an assessment of the potential impacts transportation projects could have on the environment and established communities. In addition, an assessment of the costs of these needs is completed using standardized costs and other information available from more detailed project specific studies.

St. Lucie County 2-67 June 2018 Comprehensive Plan Transportation Element DIA
Table 2-8 Existing + Committed Roadway Improvement Projects
Facility From To Lanes 2000
Lanes 2030 Project Developer OR
Built/ Committed25th St South Midway Rd Edwards Rd 2 4 Add 2 Lanes Built/ CommittedBecker Rd Village Pkwy Southbend Blvd 2 4 Add 2 Lanes Built/ Committed
Becker Rd Southbend Blvd Murphy Rd 2 4 Add 2 Lanes Developer
Becker Rd Rangeline Rd Village Prkwy 0 4 New 4 Lane DeveloperCross Town Pkwy
I-95 Floresta Dr 0 4 New 4 Lane Built/ Committed
Cross Town Pkwy
Floresta Dr US-1 0 4 New 4 Lane Built/ Committed
Cross Town Pkwy
Rangeline Rd West Annex NS Road "A"
0 4 New 4 Lane Developer
Floresta Dr Prima Vista Blvd
Southbend Blvd 2 4 Add 2 Lanes Built/ Committed
Gatlin Blvd Ext West Annex NS Road "B"
Village Pkwy 0 4 New 4 Lane Developer
I-95 Indian River County
Orange Ave 4 6 Add 2 Lanes Built/ Committed
Lennard Rd US-1 Walton Rd 0 4 New 4 Lane Built/ Committed
Lennard Rd Walton Rd Port St. Lucie Blvd
2 4 Add 2 Lanes Built/ Committed
Lennard Rd Port St. Lucie Blvd
US-1 2 4 Add 2 Lanes Built/ Committed
Okeechobee Rd
County Line FL Turnpike 2 4 Add 2 Lanes Built/ Committed
Southbend Blvd Floresta Dr Becker Rd 0 2 New 2 Lane Built/ Committed
St. Lucie West Blvd
Reserve Blvd Peacock 0 2 New 2 Lane Developer
US-1 South Midway Rd Prima Vista Blvd 4 6 Add 2 Lanes Built/ Committed
Village Pkwy Reserve Blvd Becker Rd 0 4 New 4 Lane Built/ Committed
Walton Rd Village Green Dr
Lennard Rd 2 4 Add 2 Lanes Built/ Committed
West Annex EW Road "A"
Rangeline Rd West Annex NS Road "G"
0 4 New 4 Lane Developer
West Annex EW Road "B"
West Annex NS Road "B"
West Annex NS Road "F"
0 4 New 4 Lane Developer
West Annex EW Road "C"
Rangeline Rd West Annex NS Road "B"
0 4 New 4 Lane Developer
West Annex EW Road "D"
Rangeline Rd Village Pkwy 0 4 New 4 Lane Developer

St. Lucie County 2-68 June 2018 Comprehensive Plan Transportation Element DIA
Facility From To Lanes 2000
Lanes 2030 Project Developer OR
Built/ CommittedWest Annex EW Road "E"
Rangeline Rd Rosser Blvd 0 4 New 4 Lane Developer
West Annex EW Road "F"
Rangeline Rd Rosser Blvd 0 4 New 4 Lane Developer
West Annex NS Road "A"
Cross Town Pkwy
Becker Rd 0 4 New 4 Lane Developer
West Annex NS Road "B"
West Annex EW Road "A"
Becker Rd 0 4 New 4 Lane Developer
West Annex NS Road "C"
West Annex EW Road "E"
West Annex NS Road "B"
0 4 New 4 Lane Developer
West Annex NS Road "D"
West Annex EW Road "A"
West Annex EW Road "B"
0 4 New 4 Lane Developer
West Annex NS Road "E"
West Annex EW Road "A"
West Annex EW Road "B"
0 4 New 4 Lane Developer
West Annex NS Road "F"
West Annex EW Road "A"
West Annex EW Road "F"
0 4 New 4 Lane Developer
West Annex NS Road "G"
Cross Town Pkwy Village Pkwy 0 4 New 4 Lane Developer

St. Lucie County 2-69 June 2018 Comprehensive Plan Transportation Element DIA
Table 2-9
Existing + Committed Roadways
Facility From To 2030 E+C Volume/ Capacity Ratio
13th St South Delaware Ave Orange Ave 1.0625th St South Cortez Blvd Virginia Ave 1.2125th St South Midway Rd Edwards Rd 1.125th St South/ St James Dr
Airoso Blvd Blanton Blvd 1.17
Airoso Blvd Prime Vista Blvd Port St. Lucie Blvd 1.40-1.50Angle Rd Orange Ave Jenkins Rd 1.24Ave D 7th St North US-1 1.24Ave D 25th St North 17th St North 1.16Bayshore Blvd Prima Vista Blvd Sr. James Dr 1.07Delaware Ave 41st St South 17th St South 1.12Edwards Rd Jenkins Rd Selvitz Rd 1.14Gatlin Blvd I-95 Savage Blvd 1Glades Cut Off Rd Selvitz Rd Reserve Blvd 1.40-1.70Indian River Dr Savannah Rd Citrus Ave 1.06Indrio Rd US-1 Johnston Rd 1.03-1.35Jenkins Rd Edwards Rd Angle Rd 1.18-1.52Keen Rd Angle Rd St. Lucie Blvd 1.33Kings Hwy North Kings Hwy US-1 1.18Kings Hwy North Grove Rd Okeechobee Rd 1.15-1.54Midway Rd West US-1 Okeechobee Rd 1.12-1.87Okeechobee Rd McNeil Rd Virginia Ave 1.1Okeechobee Rd I-95 Matthews Rd 1.13-1.54Oleander Ave Azalea Ave Virginia Ave 1.16Oleander Ave Midway Rd West Edwards Rd 1.12Orange Ave 25th St Angle Rd 1.05-1.18Orange Ave 41st St Kings Hwy 1.03-1.32Port St Lucie Blvd US-1 Gatlin Blvd 1.09-1.45St. Lucie West Blvd Glades Cut Off Rd I-95 1.38Rangeline Rd Martin County Line Glade Cut Off Rd 1.14SR A1A Plover Ave Seaway Dr 1.22St. Lucie Blvd 25th St Emerson Ave 1.01-1.69
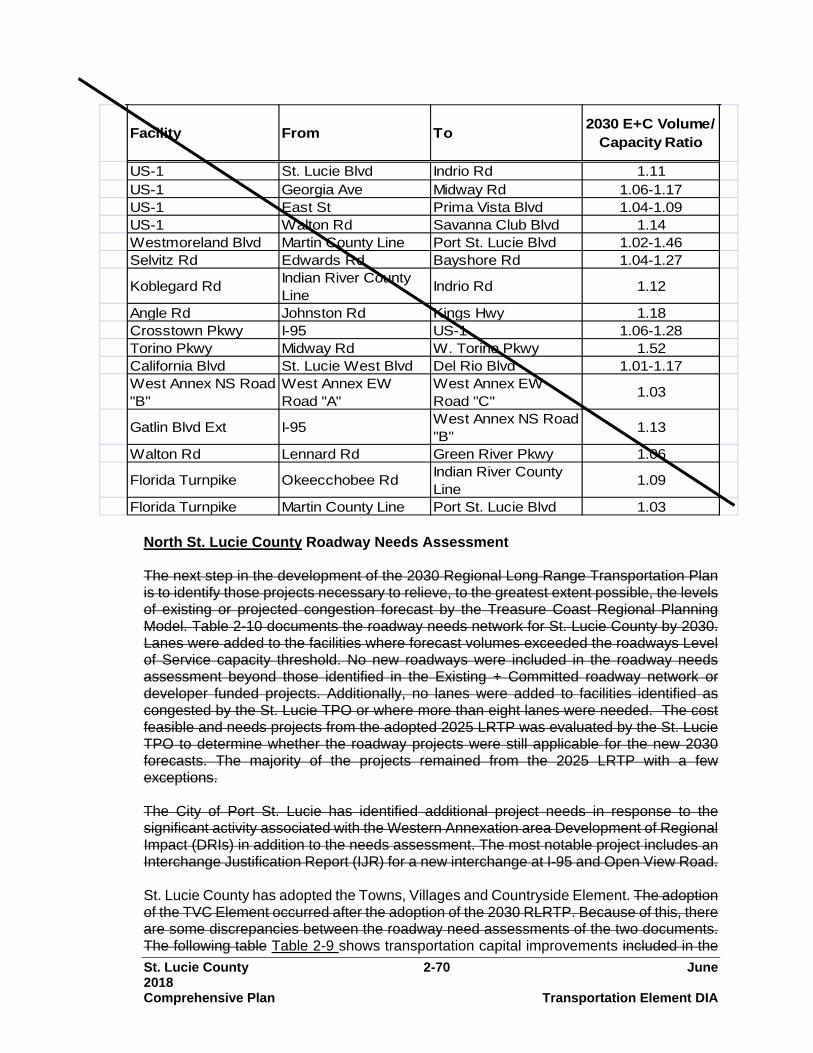
St. Lucie County 2-70 June 2018 Comprehensive Plan Transportation Element DIA
North St. Lucie County Roadway Needs Assessment The next step in the development of the 2030 Regional Long Range Transportation Plan is to identify those projects necessary to relieve, to the greatest extent possible, the levels of existing or projected congestion forecast by the Treasure Coast Regional Planning Model. Table 2-10 documents the roadway needs network for St. Lucie County by 2030. Lanes were added to the facilities where forecast volumes exceeded the roadways Level of Service capacity threshold. No new roadways were included in the roadway needs assessment beyond those identified in the Existing + Committed roadway network or developer funded projects. Additionally, no lanes were added to facilities identified as congested by the St. Lucie TPO or where more than eight lanes were needed. The cost feasible and needs projects from the adopted 2025 LRTP was evaluated by the St. Lucie TPO to determine whether the roadway projects were still applicable for the new 2030 forecasts. The majority of the projects remained from the 2025 LRTP with a few exceptions. The City of Port St. Lucie has identified additional project needs in response to the significant activity associated with the Western Annexation area Development of Regional Impact (DRIs) in addition to the needs assessment. The most notable project includes an Interchange Justification Report (IJR) for a new interchange at I-95 and Open View Road. St. Lucie County has adopted the Towns, Villages and Countryside Element. The adoption of the TVC Element occurred after the adoption of the 2030 RLRTP. Because of this, there are some discrepancies between the roadway need assessments of the two documents. The following table Table 2-9 shows transportation capital improvements included in the
Facility From To 2030 E+C Volume/ Capacity Ratio
US-1 St. Lucie Blvd Indrio Rd 1.11US-1 Georgia Ave Midway Rd 1.06-1.17US-1 East St Prima Vista Blvd 1.04-1.09US-1 Walton Rd Savanna Club Blvd 1.14Westmoreland Blvd Martin County Line Port St. Lucie Blvd 1.02-1.46Selvitz Rd Edwards Rd Bayshore Rd 1.04-1.27
Koblegard Rd Indian River County Line
Indrio Rd 1.12
Angle Rd Johnston Rd Kings Hwy 1.18Crosstown Pkwy I-95 US-1 1.06-1.28Torino Pkwy Midway Rd W. Torino Pkwy 1.52California Blvd St. Lucie West Blvd Del Rio Blvd 1.01-1.17West Annex NS Road "B"
West Annex EW Road "A"
West Annex EW Road "C"
1.03
Gatlin Blvd Ext I-95 West Annex NS Road "B"
1.13
Walton Rd Lennard Rd Green River Pkwy 1.06
Florida Turnpike Okeecchobee Rd Indian River County Line
1.09
Florida Turnpike Martin County Line Port St. Lucie Blvd 1.03

St. Lucie County 2-71 June 2018 Comprehensive Plan Transportation Element DIA
Capital Improvements Element as part of remedial Comprehensive Plan amendments related to the TVC that are needed to facilitate ultimate build-out of the TVC plan.
Table 2-9 North St. Lucie County Special Area Plan
Long Term Transportation Capital Improvements Program
Roadway From To Improvement Koblegard Rd. County
Taylor Dairy
Construct 2-lane road
King's Highway Indrio Rd. US-1 2 to 4 King's Highway Angle Rd. Indrio Rd. 2 to 4 I-95 North Flyover Koblegard
New "C" Rd. Construct 2-lane flyover
New E-W Russo Road Koblegard
Seminole Rd. Construct 2-lane road New E-W Sebastian Rd. Johnston
Emerson
Construct 2-lane road
New E-W Tobias Rd. Johnston
Seminole Rd. Construct 2-lane road Johnston Rd./ Immokolee
County
Kings
2 to 4
Airport Connector Immokolee I-95 Construct 4-lane road New Russakis Rd. Indrio Rd. Johnston Rd. Construct 2-lane road New Seminole Rd. Indrio Rd. New
Construct 2-lane road SR 614 Indrio Rd. I-95 Citrus
Construct 4-lane road
New Transit Line (Indrio
Emerson
I-95 Extend TCC Bus Service 25th St. SW Johnston
Koblegard
Construct 4-land road
New E-W Road
Johnston
Emerson
Construct 2-lane road Emerson Ave. Indrio Rd. Angle Rd. Construct 2-lane road New E-W "A" Road Koblegard
Taylor Dairy
Construct 2-lane road
New N-S "C" Road Indrio Rd. County Line Construct 2-lane road New N-S "C" Road Angle Rd. Indrio Construct 2-lane road New Citrus Highway Indrio Rd. County Line Construct 4-lane road New Citrus Highway Indrio Rd. Godwin Rd. Construct 4-lane road New E-W "E" Road New "C"
Citrus
Construct 2-lane flyover
New E-W "D" Road New "C"
Citrus
Construct 2-lane flyover I-95 South Flyover Koblegard
New "C" Rd. Construct 2-lane flyover
I-95 / Turnpike Interchange Immokolee
FL Turnpike Construct interchange The countywide list of needed improvements as developed in GO2040 LRTP is contained in Table 2-10
Table 2-10 2040 Needs Plan Improvements
ON STREET FROM TO PLANNED IMPROVEMENT
SR-9/I-95 MARTIN C.L. N. OF GLADES
CUTOFF ADD AUXILLIARY
LANES
SR-9/I-95 N. OF GLADES
CUTOFF S. OF SR 70 ADD AUXILLIARY
LANES KING'S
HIGHWAY/SR-713 N. OF I-95
OVERPASS INDRIO RD ADD 2 LANES KING'S
HIGHWAY/SR-713 INDRIO RD SR-5/US 1 ADD 2 LANES

St. Lucie County 2-72 June 2018 Comprehensive Plan Transportation Element DIA
ON STREET FROM TO PLANNED IMPROVEMENT
GLADES CUTOFF RD
COMMERCE CTR DR SELVITZ RD ADD 2 LANES
SELVITZ RD GLADES CUTOFF
RD EDWARDS RD ADD 2 LANES MIDWAY
ROAD/CR-712 GLADES CUTOFF
RD SELVITZ RD ADD 2 LANES
EAST TORINO CASHMERE
BLVD MIDWAY RD ADD 2 LANES ST. LUCIE WEST
BLVD E. OF I-95 CASHMERE
BLVD ADD 2 LANES
SAVONA BLVD GATLIN BLVD CALIFORNIA
BLVD ADD 2 LANES
CALIFORNIA BLVD SAVONA BLVD CROSSTOWN
PKWY ADD 2 LANES
CALIFORNIA BLVD CROSSTOWN
PKWY ST LUCIE WEST
BLVD ADD 2 LANES PORT ST. LUCIE
BLVD BECKER RD PAAR DR ADD 2 LANES PORT ST. LUCIE
BLVD PAAR DR DARWIN BLVD ADD 2 LANES SOUTHBEND
BLVD BECKER RD PORT ST. LUCIE
BLVD ADD 2 LANES JENKINS RD MIDWAY RD EDWARDS RD NEW 4 LANE RD JENKINS RD EDWARDS RD ORANGE AVE ADD 2 LANES JENKINS RD ORANGE AVE ST. LUCIE BLVD NEW 4 LANE RD NORTH-MID
COUNTY CONNECTOR
MIDWAY RD FLORIDA'S TURNPIKE NEW 4 LANE RD
AIRPORT CONNECTOR
FLORIDA'S TURNPIKE I-95 NEW 4 LANE RD
AIRPORT CONNECTOR I-95 KING'S
HIGHWAY/SR-713 NEW 4 LANE RD
RANGE LINE RD GLADES CUTOFF
RD MIDWAY RD NEW 4 LANE RD
SHINN RD GLADES CUTOFF
RD MIDWAY RD NEW 4 LANE RD
MCCARTY RD GLADES CUTOFF
RD MIDWAY RD NEW 4 LANE RD MCCARTY RD WILLIAMS RD MIDWAY RD ADD 2 LANES
ARTERIAL A GLADES CUTOFF
RD WILLIAMS RD NEW 4 LANE RD NEWELL RD SHINN RD ARTERIAL A NEW 4 LANE RD
WILLIAMS RD SHINN RD MCCARTY RD NEW 4 LANE RD
WILLIAMS RD MCCARTY RD GLADES CUTOFF RD NEW 4 LANE RD
E-W RD 6 SHINN RD GLADES CUTOFF
RD NEW 4 LANE RD

St. Lucie County 2-73 June 2018 Comprehensive Plan Transportation Element DIA
ON STREET FROM TO PLANNED IMPROVEMENT
CROSSTOWN PKWY RANGE LINE RD VILLAGE PKWY NEW 4 LANE RD
TRADITION PKWY RANGE LINE RD STONY CREEK
WAY NEW 4 LANE RD STONY CREEK
WAY RANGE LINE RD TRADITION PKWY NEW 4 LANE RD
DISCOVERY WAY RANGE LINE RD COMMUNITY
BLVD NEW 4 LANE RD
DISCOVERY WAY COMMUNITY
BLVD VILLAGE PKWY ADD 2 LANES E-W RD2 N-S RD A VILLAGE PKWY NEW 4 LANE RD
OPEN VIEW DR W RANGE LINE RD VILLAGE PKWY NEW 4 LANE RD PAAR DR W RANGE LINE RD VILLAGE PKWY NEW 4 LANE RD BECKER RD RANGE LINE RD VILLAGE PKWY NEW 4 LANE RD
N-S RD A BECKER RD CROSSTOWN
PKWY NEW 4 LANE RD N-S RD B BECKER RD DISCOVERY WAY NEW 4 LANE RD
COMMUNITY BLVD BECKER RD DISCOVERY WAY NEW 4 LANE RD
FLORIDA'S TURNPIKE
AT AIRPORT CONNECTOR
NEW INTERCHANGE
SR-9/I-95 AT AIRPORT CONNECTOR
NEW INTERCHANGE
FLORIDA'S TURNPIKE AT MIDWAY RD
NEW INTERCHANGE
Cost Feasible Roadway Projects It is not reasonable to expect funding to be made available for all capacity deficits identified in the Roadway Needs Assessment. Therefore, certain projects have been identified as cost feasible and it is expected that funding will be made available for these projects by 2030. If additional funding beyond the cost feasible projects becomes available, then the funding may go to the remaining unfunded projects identified in the Roadways Needs Assessment. The cost feasible roadway improvements build upon those identified in the 2025 Long Range Transportation Plan. Major capacity improvements are planned for the following corridors: US-1, Kings Highway, Angle Road, Jenkins Road, Midway Road, Walton Road, and Port St. Lucie Boulevard, Bayshore Boulevard, Selvitz Road, Torino Parkway, Commerce Boulevard, and Gatling Boulevard Extensions. The cost feasible projects in St. Lucie County are provided in Table 2-11. Cost Feasible Roadway Projects

St. Lucie County 2-74 June 2018 Comprehensive Plan Transportation Element DIA
Table 2-11 contains the Cost Feasible projects identified in the Go 2040 LRTP. They are based on the results of analyses of financial alternatives and the consideration of factors, including technical criteria, policy input, citizen input, and available financial resources as summarized in the plan
Table 2-11 2040 Cost Feasible Plan Projects
Map
Identifier On Street From To Improvement* Project Source
Total Cost (YOE)
2021-2025
402a Kings Hwy N. of I-95 Overpass
St. Lucie Blvd
Add 2 lanes, bike lanes, sidewalks
2035 CFP, 2040 Needs Plan
$27,510,000
408 Port St. Lucie Blvd Paar Dr. Darwin Rd.
Add 2 lanes, bike lanes, sidewalks
2035 CFP, 2040 Needs Plan
$17,800,000
500 US 1 Corridor Retrofit
Indian River County Line
Martin County Line
Corridor Improvements
2035 CFP, 2040 Needs Plan
$6,750,000
Walk-Bike Network Improvements Potential projects below
2040 Walk-Bike Network
$3,270,000
Congestion Management Program Operational Improvements
2035 CFP, 2040 CMP Element
$4,410,000
Total: $59,740,000 2026-2030
402b Kings Hwy St. Lucie Blvd Indrio Rd Add 2 lanes, bike lanes, sidewalks
2035 CFP, 2040 Needs Plan
$40,000,000
413 Midway Rd. Glades Cut-Off Rd. Selvitz Rd.
Add 2 lanes, bike lanes, sidewalks
2035 CFP, 2040 Needs Plan
$24,050,000
500 US 1 Corridor Retrofit
Indian River County Line
Martin County Line
Corridor Improvements
2035 CFP, 2040 Needs Plan
$17,600,000
Walk-Bike Network Improvements Potential projects below
2040 Walk-Bike Network
$4,210,000
Congestion Management Program Operational Improvements
2035 CFP, 2040 CMP Element
$9,870,000
Total: $95,730,000 * All roadway improvements shall incorporate an urban cross section that includes curbs, gutters, and closed drainage.

St. Lucie County 2-75 June 2018 Comprehensive Plan Transportation Element DIA
Map Identifier On Street From To Improvement* Project
Source Total Cost
(YOE) 2031-2040
407 Port St. Lucie Blvd Becker Rd Paar Dr.
Add 2 lanes, bike lanes, sidewalks
2035 CFP, 2040 Needs Plan
$29,360,000
450c Jenkins Rd. Angle Rd St Lucie Blvd
New 4 lanes, bike lanes, sidewalks
2035 CFP, 2040 Needs Plan
$36,540,000
500 US 1 Corridor Retrofit
Indian River County Line
Martin County Line
Corridor Improvements
2035 CFP, 2040 Needs Plan
$35,000,000
Walk-Bike Network Improvements Potential projects below
2040 Walk-Bike Network $15,790,000
Congestion Management Program Operational Improvements
2035 CFP, 2040 CMP Element
$51,810,000
Total: $168,500,000 Developer Roads (2031-2040)
2501 E-W-Road 6 Shinn Rd Glades Cut-
Off Rd New 4 lane road Developer agreement $83,440,000
2502 Williams Rd Shinn Rd McCarty Rd New 2 lane road Developer agreement $36,300,000
2503 Williams Ext McCarty Rd Glades
Cutoff Rd New 4 lane road Developer agreement $64,870,000
2504 Newell Rd Shinn Rd Arterial A New 4 lane road Developer agreement $92,030,000
2505 Range Line Rd
Glades Cut-Off Rd Midway Rd New 4 lane road Developer
agreement $92,820,000
2506 Shinn Rd Midway Rd Glades Cut-Off Rd New 4 lane road Developer
agreement $84,260,000
2507 McCarty Rd Williams Rd Midway Rd Add 2 lanes Developer agreement $32,120,000
2508 McCarty Rd Glades Cut-Off Rd Williams Rd New 4 lane road Developer
agreement $71,530,000
2509 Arterial A Glades Cut-Off Rd Midway Rd New 4 lane road Developer
agreement $84,570,000
2601 Becker Rd Village Pkwy Range Line Rd New 4 lane road Developer
agreement $154,000,000
2602 Paar Dr (West) Village Pkwy Range Line
Rd New 4 lane road Developer agreement $153,630,000
2603 Open View Dr (West) Village Pkwy Range Line
Rd New 4 lane road Developer agreement $142,120,000
2604 E-W Road 2 Village Pkwy N-S Road A New 4 lane road Developer
agreement $96,590,000
2605 Discovery Way Village Pkwy Community
Blvd Add 2 lanes Developer agreement $6,950,000
2606 Discovery Way
Community Blvd
Range Line Rd New 4 lane road Developer
agreement $109,920,000
2607 Stony Creek Way Range Line Rd Tradition
Pkwy New 4 lane road Developer agreement $60,660,000
2608 Tradition Pkwy Range Line Rd Stony Creek
Way New 4 lane road Developer agreement $74,720,000

St. Lucie County 2-76 June 2018 Comprehensive Plan Transportation Element DIA
Map Identifier On Street From To Improvement* Project
Source Total Cost
(YOE) 2609 Crosstown
Pkwy Range Line Rd Village Pkwy New 4 lane road Developer
agreement $98,110,000
2610 N-S Road A Crosstown Pkwy Becker Rd New 4 lane road Developer
agreement $185,790,000
2611 N-S Road B Becker Rd Discovery Way New 4 lane road Developer
agreement $101,480,000
2612 Community Blvd Discovery Way Becker Rd New 4 lane road Developer
agreement $101,300,000
2701 Turnpike/I-95 Connector
Florida's Turnpike I-95 New 4 lane road Developer
agreement $188,750,000
Total: $2,115,960,000 * All roadway improvements shall incorporate an urban cross section that includes curbs, gutters, and closed drainage.
Future Level of Service Analysis The 20340 Future Level of Service Analysis is provided on Table 2-12. The 20340 AADT determined from the cost feasible roadway network was multiplied by the appropriate “K” and “D” factor to derive the peak hour, peak direction roadway volume and LOS.

St. Lucie County 2-77 June 2018 Comprehensive Plan Transportation Element DIA
Table 2-10 Roadway Needs Assessment
Facility From To Project2030 Total Lanes
13th Street** Virgina Ave Orange Ave Add 2 Lanes 425th Street Midway Rd Airoso Blvd Add 2 Lanes 625th Street** Orange Ave Virginia Ave Add 2 Lanes 625th Street US-1 Orange Ave Add 2 Lanes 625th Street** Virgina Ave Edwards Rd Add 2 Lanes 625th Street** Midway Rd Edwards Rd Add 2 Lanes 6Angle Rd Kings Hwy Orange Ave Add 2 Lanes 4Angle Rd Kings Hwy FL Turnpike Add 2 Lanes 4Bayshore Blvd 25th St Prime Vista Blvd Add 2 Lanes 4Brescia St/ Del Rio Ext
Savage Blvd Del Rio Blvd New 2 Lane 2
Brocksmith (Unpaved) Orange Ave Okeechobee Rd New 2 Lane 2
California Blvd St. Lucie West Blvd
Peacock Blvd Add 2 Lanes 4
California Blvd St. Lucie West Blvd
Del Rio Blvd Add 2 Lanes 4
Cashmere St. Lucie West Blvd
Del Rio Blvd Add 2 Lanes 4
Crosstown Pkwy*** Floresta Dr US-1 Add 2 Lanes 6Crosstown Pkwy*** Village Pkwy FL Turnpike Add 2 Lanes 6Edwards Rd Jenkins Rd 25th Street Add 2 Lanes 4
Emerson Ave Indian River Co. Line
St. Lucie Blvd Add 2 Lanes 4
FFA Rd Picos Rd Okeechobee Rd New 2 Lane 2Floresta Dr** Airoso Blvd Harbor View Dr Add 2 Lanes 4Gatlin Blvd Ext Village Pkwy I-95 Add 2 Lanes 6
Gatlin Blvd Ext West Annex NS Road "B"
Village Pkwy Add 2 Lanes 6
Glades Cut-Off Rd Reserve Blvd Selvitz Rd Add 2 Lanes 4
2030 Roadway Needs Assessment (2011-2030)

St. Lucie County 2-78 June 2018 Comprehensive Plan Transportation Element DIA
Facility From To Project2030 Total Lanes
13th Street** Virgina Ave Orange Ave Add 2 Lanes 425th Street Midway Rd Airoso Blvd Add 2 Lanes 625th Street** Orange Ave Virginia Ave Add 2 Lanes 625th Street US-1 Orange Ave Add 2 Lanes 625th Street** Virgina Ave Edwards Rd Add 2 Lanes 625th Street** Midway Rd Edwards Rd Add 2 Lanes 6Angle Rd Kings Hwy Orange Ave Add 2 Lanes 4Angle Rd Kings Hwy FL Turnpike Add 2 Lanes 4Bayshore Blvd 25th St Prime Vista Blvd Add 2 Lanes 4Brescia St/ Del Rio Ext
Savage Blvd Del Rio Blvd New 2 Lane 2
Brocksmith (Unpaved) Orange Ave Okeechobee Rd New 2 Lane 2
California Blvd St. Lucie West Blvd
Peacock Blvd Add 2 Lanes 4
California Blvd St. Lucie West Blvd
Del Rio Blvd Add 2 Lanes 4
Cashmere St. Lucie West Blvd
Del Rio Blvd Add 2 Lanes 4
Crosstown Pkwy*** Floresta Dr US-1 Add 2 Lanes 6Crosstown Pkwy*** Village Pkwy FL Turnpike Add 2 Lanes 6Edwards Rd Jenkins Rd 25th Street Add 2 Lanes 4
Emerson Ave Indian River Co. Line
St. Lucie Blvd Add 2 Lanes 4
FFA Rd Picos Rd Okeechobee Rd New 2 Lane 2Floresta Dr** Airoso Blvd Harbor View Dr Add 2 Lanes 4Gatlin Blvd Ext Village Pkwy I-95 Add 2 Lanes 6
Gatlin Blvd Ext West Annex NS Road "B"
Village Pkwy Add 2 Lanes 6
Glades Cut-Off Rd Reserve Blvd Selvitz Rd Add 2 Lanes 4
Green Riber Pkwy** Walton Rd Martin County Line Add 2 Lanes 4
Hartman Rd Okeechobee Rd Orange Ave Add 2 Lanes 4
Indian River Bridge Indian River Dr A1A New 4 Lane Bridge
4
Facility From To Project2030 Total Lanes
Indrio Rd Emerson Ave Kings Hwy Add 2 Lanes 4Indrio Rd Johnston Rd Emerson Ave Add 2 Lanes 4Indrio Rd Kings Hwy US-1 Add 2 Lanes 4Indrio Rd New TVC Road D Johnston Rd Add 2 Lanes 4Jenkins Rd Angle Rd Okeechobee Rd Add 2 Lanes 4
2030 Roadway Needs Assessment (2011-2030)

St. Lucie County 2-79 June 2018 Comprehensive Plan Transportation Element DIA
Facility From To Project2030 Total Lanes
Savona Blvd California Blvd Becker Rd Add 2 Lanes 4Selvitz Rd Edwards Rd Midway Rd Add 2 Lanes 4Selvitz Rd Midway Rd Bayshore Rd Add 2 Lanes 4
Shinn Rd Orange Ave Glades Cut-Off Rd New 2 Lane 2
Shinn Rd Ext. New TVC Road C Orange Ave New 2 Lane 2St. Lucie Blvd Emerson Ave 25th Street Add 2 Lanes 4St. Lucie West Blvd Peacock Bayshore Blvd Add 2 Lanes 6Torino Pkwy Midway Rd W. Torino Pkwy Add 2 Lanes 4
US-1 Indian River Co. Line
Juanita Ave Add 2 Lanes 6
US-1** Midway Rd Walton Rd Add 2 Lanes 8US-1** Edwards Rd Midway Rd Add 2 Lanes 6US-1** Virgina Ave Edwards Rd Reconstruction 4Virgina Ave** 25th St US-1 Add 2 Lanes 8Walton Rd** Lennard Rd Green River Pkwy Add 2 Lanes 4North Bridge A1A US-1 Reconstruction 2
FL Turnpike Okeechobee County Line
Martin County Line Add 2 Lanes 6
FL Turnpike Interchange
TVC Road C FL Turnpike Interchange 0
FL Turnpike Interchange
Midway Rd FL Turnpike Interchange 0
** Optional Congestion Management Strategies (CMS) possible as alternative to roadway construction or widening*** Crosstown Parkway (West Virginia) - The 4 laneing and bridge corssing projects for the Crosswotwn Parkway are included in the committed projects list as they are anticipated to be funded for construction by 2010. The Crosstown Parkway projects noted in the needs assessment indicated that there is a capacity need to take additional section of the corridor to 6-lanes by 2030.
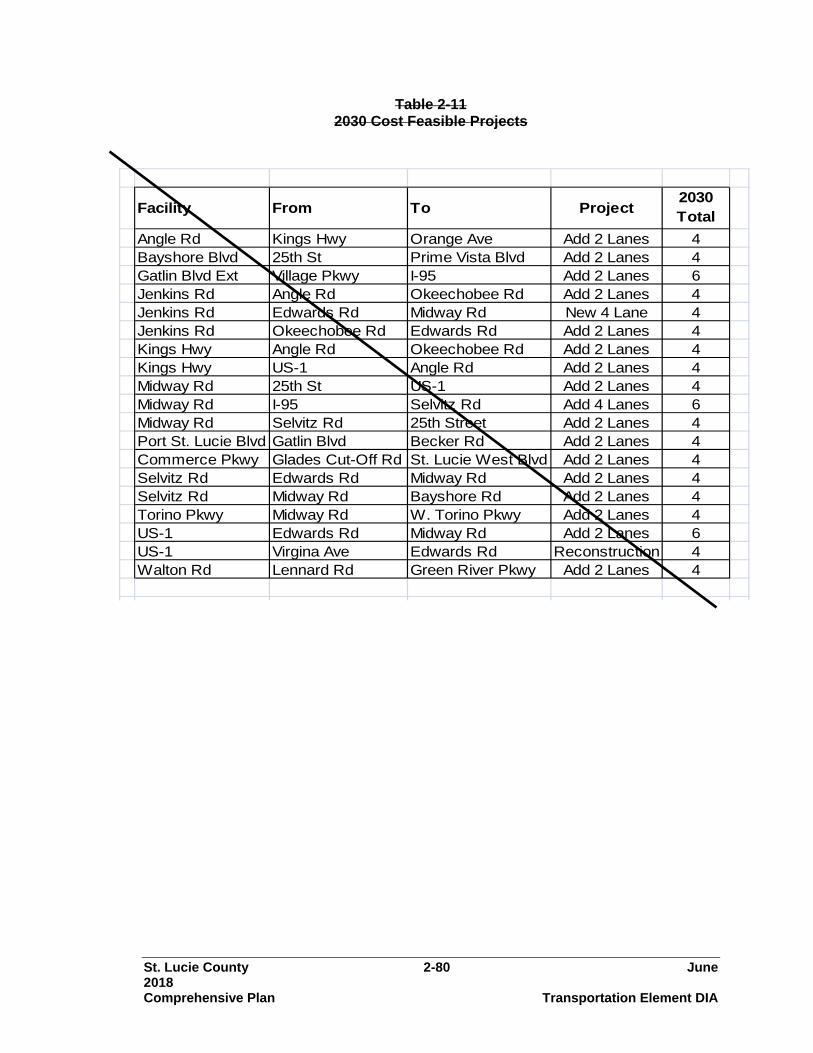
St. Lucie County 2-80 June 2018 Comprehensive Plan Transportation Element DIA
Table 2-11 2030 Cost Feasible Projects
Facility From To Project2030 Total
Angle Rd Kings Hwy Orange Ave Add 2 Lanes 4Bayshore Blvd 25th St Prime Vista Blvd Add 2 Lanes 4Gatlin Blvd Ext Village Pkwy I-95 Add 2 Lanes 6Jenkins Rd Angle Rd Okeechobee Rd Add 2 Lanes 4Jenkins Rd Edwards Rd Midway Rd New 4 Lane 4Jenkins Rd Okeechobee Rd Edwards Rd Add 2 Lanes 4Kings Hwy Angle Rd Okeechobee Rd Add 2 Lanes 4Kings Hwy US-1 Angle Rd Add 2 Lanes 4Midway Rd 25th St US-1 Add 2 Lanes 4Midway Rd I-95 Selvitz Rd Add 4 Lanes 6Midway Rd Selvitz Rd 25th Street Add 2 Lanes 4Port St. Lucie Blvd Gatlin Blvd Becker Rd Add 2 Lanes 4Commerce Pkwy Glades Cut-Off Rd St. Lucie West Blvd Add 2 Lanes 4Selvitz Rd Edwards Rd Midway Rd Add 2 Lanes 4Selvitz Rd Midway Rd Bayshore Rd Add 2 Lanes 4Torino Pkwy Midway Rd W. Torino Pkwy Add 2 Lanes 4US-1 Edwards Rd Midway Rd Add 2 Lanes 6US-1 Virgina Ave Edwards Rd Reconstruction 4Walton Rd Lennard Rd Green River Pkwy Add 2 Lanes 4

St. Lucie County 2-81 June 2018 Comprehensive Plan Transportation Element DIA
Table 2-12 Future 20340 Level of Service Analysis
ROADWAY FROM TO CLASS 1 Adpt LOS 1
PK HR PK DIR LOS
CAP 2
# OF LANE
(2_WY)
2030 AADT VOL 3
K 4 D 4
2030 pk hr pk dir Vol 5
2030 LOS
I 95(6) Indian River Co.
Indrio RoadFreeways - Spacing >=2 mi
C 6,150 8 67,200 0.095 0.5282 3,372 B
I 95(6) Indrio Road Orange AveFreeways - Spacing >=2 mi
D 7,480 8 98,850 0.0907 0.5282 4,736 C
I 95(6) Okeecobee Road
Orange AveFreeways - Spacing >=2 mi
D 7,480 8 111,160 0.0907 0.5457 5,502 C
I 95(6)West Midway Road
Okeechobee Road
Freeways - Spacing >=2 mi
C 4,550 6 127,000 0.0907 0.5282 6,084 E
I 95(6) St. Lucie West Blvd
West Midway Road
Freeways - Spacing >=2 mi
C 4,550 6 114,000 0.0907 0.5282 5,461 D
I 95(6) Gatlin BlvdSt. Lucie West Blvd
Freeways - Spacing >=2 mi
C 4,550 6 116,000 0.0907 0.5282 5,557 E
I 95(6) Martin County Line
Gatlin BlvdFreeways - Spacing >=2 mi
C 4,550 6 126,000 0.085 0.5796 6,208 F
Florida's Turnpike
Okeechobee Road
Indian River County Line
Freeways - Spacing >=2 mi
B 2,110 4 44,259 0.095 0.55 2,313 C
Florida's Turnpike
Port St. Lucie Blvd
Okeechobee Road
Freeways - Spacing >=2 mi
C 2,940 4 47,915 0.095 0.55 2,504 C
Florida's Turnpike
Martin County Line
Port St. Lucie Blvd
Freeways - Spacing >=2 mi
C 2,940 4 51,570 0.095 0.55 2,695 C
13th Street South
Avenue D Avenue QMajor City/County Road
D 760 2 8,531 0.095 0.55 446 C
13th Street South
Delaware Avenue
Orange Avenue
Major City/County Road
D 760 2 10,145 0.095 0.55 530 D
13th Street South
Georgia Avenue
Delaware Avenue
Major City/County Road
D 760 2 6,564 0.095 0.55 343 C
13th Street South
Virginia Avenue
Georgia Avenue
Major City/County Road
D 760 2 6,081 0.095 0.55 318 C
13th Street South
Orange Avenue
Avenue DMajor City/County Road
D 760 2 9,418 0.095 0.55 492 D
25th Street North
St. Lucie Blvd
U.S. 1State Two-Way Arterial - Class I
D 1,860 4 19,115 0.095 0.55 999 B
25th Street North
Tampa Trail Blvd
St. Lucie BlvdState Two-Way Arterial - Class I
D 1,860 4 18,747 0.095 0.55 980 B
25th Street North
Juanita Avenue
Tampa Trail Blvd
State Two-Way Arterial - Class I
D 1,860 4 15,399 0.095 0.55 805 B
25th Street North
Avenue MJuanita Avenue
State Two-Way Arterial - Class I
D 1,860 4 19,570 0.095 0.55 1,023 B

St. Lucie County 2-82 June 2018 Comprehensive Plan Transportation Element DIA
ROADWAY FROM TO CLASS 1 Adpt LOS 1
PK HR PK DIR LOS
CAP 2
# OF LANE
(2_WY)
2030 AADT VOL 3
K 4 D 42030 pk hr pk dir
2030 LOS
25th Street South
Okeechobee Road
Orange Avenue
State Two-Way Arterial - Class I
D 1,860 4 25,158 0.095 0.55 1,315 B
25th Street South
Virginia Avenue
Okeechobee Road
State Two-Way Arterial - Class I
D 1,860 4 32,996 0.095 0.55 1,724 C
25th Street South
Cortez BlvdVirginia Avenue
State Two-Way Arterial - Class I
D 1,860 4 33,407 0.095 0.55 1,746 C
25th Street South
Edwards Avenue
Cortez BlvdState Two-Way Arterial - Class I
D 1,860 4 36,718 0.095 0.55 1,919 F
25th Street South
Midway Rd Edwards RdState Two-Way Arterial - Class I
D 1,860 4 26,722 0.095 0.55 1,396 B
25th Street South
Midway Rd Edwards RdState Two-Way Arterial - Class I
D 1,860 4 26,527 0.095 0.55 1,386 B
25th Street South/St James Dr
Blanton Blvd
West Midway Road
State Two-Way Arterial - Class I
D 1,860 4 17,956 0.095 0.55 938 B
25th Street South/St James Dr
Airoso Blvd Blanton BlvdState Two-Way Arterial - Class I
D 1,860 4 19,220 0.095 0.55 1,004 B
7th Street South
Delaware Avenue
Orange Avenue
Major City/County Road
D 1,720 4 6,425 0.095 0.55 336 C
7th Street South
Georgia Avenue
Delaware Avenue
Major City/County Road
D 760 2 5,683 0.095 0.55 297 C
7th Street South
Nebraska Avenue
Georgia Avenue
Major City/County Road
D 760 2 3,703 0.095 0.55 193 C
Airoso BlvdFloresta Drive
St. James Drive
State Two-Way Arterial - Class I
E 1,860 4 18,337 0.095 0.55 958 B
Airoso BlvdPrima Vista Blvd
Floresta DriveState Two-Way Arterial - Class I
E 1,860 4 12,584 0.095 0.55 658 B
Airoso BlvdWest Virginia Drive
Prima Vista Blvd
State Two-Way Arterial - Class I
E 1,860 4 13,661 0.095 0.55 714 B
Airoso BlvdPort St. Lucie Blvd
West Virginia Drive
State Two-Way Arterial - Class I
E 1,860 4 14,571 0.095 0.55 761 B
Angel RdJohnston Rd
Kings HwyState Two-Way Arterial - Class I
E 890 2 15,967 0.095 0.55 834 D
Angle RdOrange Avenue
Jenkins RoadState Two-Way Arterial - Class I
E 1,860 4 24,267 0.095 0.55 1,268 B
Angle Rd N Fia Rd Johnson RdState Two-Way Arterial - Class I
E 890 2 10,777 0.095 0.55 563 C
Avenue A U.S. 1Indian River Drive
State Two-Way Arterial - Class I
E 890 2 1,615 0.095 0.55 84 B
Avenue A7th Street North
U.S. 1State Two-Way Arterial - Class I
E 3,348 3 6,358 0.095 0.55 332 B
Avenue D7th Street North
U.S. 1Major City/County Road
D 760 2 7,916 0.095 0.55 414 C
Avenue D13th Street North
7th Street North
Major City/County Road
D 760 2 8,076 0.095 0.55 422 C
Avenue D17th Street North
13th Street North
Major City/County Road
D 760 2 9,839 0.095 0.55 514 D
Avenue D25th Street North
17th Street North
Major City/County Road
D 760 2 11,762 0.095 0.55 615 D
Avenue D Angle Road25th Street North
Major City/County Road
D 760 2 6,547 0.095 0.55 342 C
Bayshore BlvdPrima Vista Blvd
St. James Drive
State Two-Way Arterial - Class I
E 1,860 4 14,469 0.095 0.55 756 B

St. Lucie County 2-83 June 2018 Comprehensive Plan Transportation Element DIA
ROADWAY FROM TO CLASS 1 Adpt LOS 1
PK HR PK DIR LOS
CAP 2
# OF LANE
(2_WY)
2030 AADT VOL 3
K 4 D 4
2030 pk hr pk dir Vol 5
2030 LOS
Becker RdVillage Prkwy
Southbend Blvd
State Two-Way Arterial - Class I
E 1,860 4 12,038 0.095 0.55 629 B
Becker RdSouthbend Blvd
Murphy RdState Two-Way Arterial - Class I
E 1,860 4 15,729 0.095 0.55 822 B
Becker RdRangeline Rd
Village PrkwyState Two-Way Arterial - Class I
E 1,860New 4 Lane
(DEV)6,551 0.095 0.55 342 B
Bell AveSunrise Blvd
Oleander BlvdOther County Road
D 530 2 4,579 0.095 0.55 239 C
Bell Ave25th Street South
Sunrise BlvdOther County Road
D 530 2 3,280 0.095 0.55 171 C
California BlvdSt. Lucie West Blvd
Crosstown Pkwy
Major City/County Road
D 760 2 9,454 0.095 0.55 494 D
California BlvdCrosstown Pkwy
Del Rio BlvdMajor City/County Road
D 760 2 9,942 0.095 0.55 519 D
CashmereWt Lucie West Blvd
Del Rio Blvd.Major City/County Road
D 760 2 9,769 0.095 0.55 510 D
Citrus Ave U.S. 1Indian River Drive
State Two-Way Arterial - Class I
E 1,860 4 8,299 0.095 0.55 434 B
Citrus Ave 7th St US 1State Two-Way Arterial - Class I
E 890 2 3,141 0.095 0.55 164 C
Crosstown Pkwy
Floresta Dr US 1Major City/County Road
E 1,620 4 19,618 0.095 0.55 1,025 C
Crosstown Pkwy
Rangeline Rd
West Annex NS Road "A"
Major City/County Road
E 1,620New 4 Lane
(DEV)6,961 0.095 0.55 364 C
Crosstown Pkwy
West Annex NS Road "A"
Village PkwyMajor City/County Road
E 1,620New 4 Lane
(DEV)9,925 0.095 0.55 519 C
Crosstown Pkwy
I-95 Floresta DrMajor City/County Road
E 1,620New 4 Lane
21,795 0.095 0.55 1,139 D
Crosstown Pkwy
I-95 Floresta DrMajor City/County Road
E 1,620New 4 Lane
13,277 0.095 0.55 694 C
Crosstown Pkwy
I-95 Floresta DrMajor City/County Road
E 1,620New 4 Lane
5,198 0.095 0.55 272 C
Crosstown Pkwy
I-95 Floresta DrMajor City/County Road
E 1,620New 4 Lane
9,759 0.095 0.55 510 C
Del Rio BlvdCalifornia Blvd
Mackenzie StMajor City/County Road
D 760 2 9,736 0.095 0.55 509 D
Delaware Ave41st Street South
17th Street South
Major City/County Road
D 760 2 10,234 0.095 0.55 535 D
Edwards RdOleander Avenue
U.S. 1State Two-Way Arterial - Class I
E 1,860 4 10,980 0.095 0.55 574 B
Edwards RdSunrise Blvd
Oleander BlvdState Two-Way Arterial - Class I
E 1,860 4 10,159 0.095 0.55 531 B
Edwards Rd25th Street South
Sunrise BlvdState Two-Way Arterial - Class I
E 1,860 4 16,681 0.095 0.55 872 B
Edwards RdSelvitz Road
25th Street South
State Two-Way Arterial - Class I
E 890 2 13,834 0.095 0.55 723 D
Edwards RdJenkins Road
Selvitz RoadState Two-Way Arterial - Class I
E 890 2 15,765 0.095 0.55 824 D

St. Lucie County 2-84 June 2018 Comprehensive Plan Transportation Element DIA
ROADWAY FROM TO CLASS 1 Adpt LOS 1
PK HR PK DIR LOS
CAP 2
# OF LANE
(2_WY)
2030 AADT VOL 3
K 4 D 4
2030 pk hr pk dir Vol 5
2030 LOS
Emerson Ave Indrio Road North BlvdState Two-Way Arterial - Uninterrupted Flo
C 790 2 14,933 0.095 0.55 780 C
Farmer's Market Rd
Oleander Avenue
U.S. 1Other County Road
D 530 2 3,252 0.095 0.55 170 C
Floresta Dr Airoso BlvdPrima Vista Blvd
Major City/County Road
D 760 2 8,870 0.095 0.55 463 C
Floresta DrCrosstown Parkway
Port St. Lucie Blvd
State Two-Way Arterial - Class I
E 1,860 4 14,519 0.095 0.55 759 C
Floresta DrPort St. Lucie Blvd
Southbend Blvd
State Two-Way Arterial - Class I
E 1,860 4 13,658 0.095 0.55 714 C
Floresta Dr Harbor ViewCrosstown Parkway
Major City/County Road
D 1,620 4 18,767 0.095 0.55 981 C
Floresta DrPrima Vista Blvd
Harbor View Dr
Major City/County Road
D 1,620 4 18,767 0.095 0.55 981 C
Gatlin BlvdSavona Blvd
Port St. Lucie Blvd
State Two-Way Arterial - Class I
E 2,790 6 36,437 0.095 0.55 1,904 B
Gatlin Blvd I-95 Savage BlvdState Two-Way Arterial - Class I
E 2,790 6 39,462 0.095 0.55 2,062 B
Gatlin Blvd Ext I 95 Village PkwyState Two-Way Arterial - Class I
E 2,790 6 38,914 0.095 0.55 2,033 B
Georgia Ave7th Street South
U.S. 1Major City/County Road
D 760 2 3,246 0.095 0.55 170 C
Georgia Ave13th Street South
7th Street South
Major City/County Road
D 760 2 2,946 0.095 0.55 154 C
Georgia AveOkeechobee Road
13th Street South
Major City/County Road
D 760 2 7,090 0.095 0.55 370 C
Glades Cut-Off Rd
West Midway Road
Selvitz RoadMajor City/County Road
D 760 2 12,966 0.095 0.55 677 D
Glades Cut-Off Rd
Reserve Blvd
West Midway Road
Major City/County Road
D 760 2 16,836 0.095 0.55 880 F
Glades Cut-Off Rd
Range Line Road
Reserve BlvdMajor City/County Road
D 760 2 6,744 0.095 0.55 352 C
Green River Pkwy
CR 707A NCLMajor City/County Road
D 760 2 6,837 0.095 0.55 357 C
Indian River DrA.E. Backus Drive
Seaway DriveState Two-Way Arterial - Class I
E 890 2 1,047 0.095 0.55 55 B
Indian River DrOrange Avenue
A.E. Backus Drive
State Two-Way Arterial - Class I
E 890 2 3,034 0.095 0.55 159 B
Indian River DrCitrus Avenue
Orange Avenue
Major City/County Road
D 760 2 3,695 0.095 0.55 193 C
Indian River DrMidway Road East
Savannah Road
Major City/County Road
D 760 2 4,283 0.095 0.55 224 C
Indian River DrWalton Road
Midway Road East
Major City/County Road
D 760 2 3,267 0.095 0.55 171 C
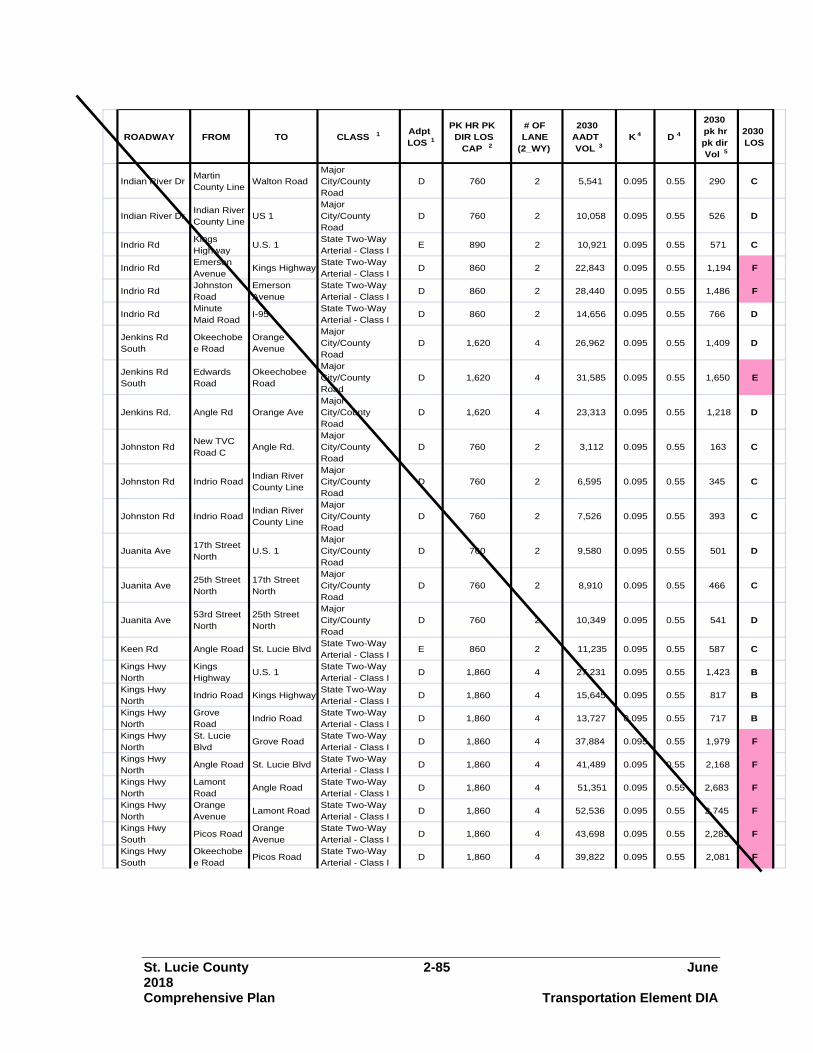
St. Lucie County 2-85 June 2018 Comprehensive Plan Transportation Element DIA
ROADWAY FROM TO CLASS 1 Adpt LOS 1
PK HR PK DIR LOS
CAP 2
# OF LANE
(2_WY)
2030 AADT VOL 3
K 4 D 4
2030 pk hr pk dir Vol 5
2030 LOS
Indian River DrMartin County Line
Walton RoadMajor City/County Road
D 760 2 5,541 0.095 0.55 290 C
Indian River DrIndian River County Line
US 1Major City/County Road
D 760 2 10,058 0.095 0.55 526 D
Indrio RdKings Highway
U.S. 1State Two-Way Arterial - Class I
E 890 2 10,921 0.095 0.55 571 C
Indrio RdEmerson Avenue
Kings HighwayState Two-Way Arterial - Class I
D 860 2 22,843 0.095 0.55 1,194 F
Indrio RdJohnston Road
Emerson Avenue
State Two-Way Arterial - Class I
D 860 2 28,440 0.095 0.55 1,486 F
Indrio RdMinute Maid Road
I-95State Two-Way Arterial - Class I
D 860 2 14,656 0.095 0.55 766 D
Jenkins Rd South
Okeechobee Road
Orange Avenue
Major City/County Road
D 1,620 4 26,962 0.095 0.55 1,409 D
Jenkins Rd South
Edwards Road
Okeechobee Road
Major City/County Road
D 1,620 4 31,585 0.095 0.55 1,650 E
Jenkins Rd. Angle Rd Orange AveMajor City/County Road
D 1,620 4 23,313 0.095 0.55 1,218 D
Johnston RdNew TVC Road C
Angle Rd.Major City/County Road
D 760 2 3,112 0.095 0.55 163 C
Johnston Rd Indrio RoadIndian River County Line
Major City/County Road
D 760 2 6,595 0.095 0.55 345 C
Johnston Rd Indrio RoadIndian River County Line
Major City/County Road
D 760 2 7,526 0.095 0.55 393 C
Juanita Ave17th Street North
U.S. 1Major City/County Road
D 760 2 9,580 0.095 0.55 501 D
Juanita Ave25th Street North
17th Street North
Major City/County Road
D 760 2 8,910 0.095 0.55 466 C
Juanita Ave53rd Street North
25th Street North
Major City/County Road
D 760 2 10,349 0.095 0.55 541 D
Keen Rd Angle Road St. Lucie BlvdState Two-Way Arterial - Class I
E 860 2 11,235 0.095 0.55 587 C
Kings Hwy North
Kings Highway
U.S. 1State Two-Way Arterial - Class I
D 1,860 4 27,231 0.095 0.55 1,423 B
Kings Hwy North
Indrio Road Kings HighwayState Two-Way Arterial - Class I
D 1,860 4 15,645 0.095 0.55 817 B
Kings Hwy North
Grove Road
Indrio RoadState Two-Way Arterial - Class I
D 1,860 4 13,727 0.095 0.55 717 B
Kings Hwy North
St. Lucie Blvd
Grove RoadState Two-Way Arterial - Class I
D 1,860 4 37,884 0.095 0.55 1,979 F
Kings Hwy North
Angle Road St. Lucie BlvdState Two-Way Arterial - Class I
D 1,860 4 41,489 0.095 0.55 2,168 F
Kings Hwy North
Lamont Road
Angle RoadState Two-Way Arterial - Class I
D 1,860 4 51,351 0.095 0.55 2,683 F
Kings Hwy North
Orange Avenue
Lamont RoadState Two-Way Arterial - Class I
D 1,860 4 52,536 0.095 0.55 2,745 F
Kings Hwy South
Picos RoadOrange Avenue
State Two-Way Arterial - Class I
D 1,860 4 43,698 0.095 0.55 2,283 F
Kings Hwy South
Okeechobee Road
Picos RoadState Two-Way Arterial - Class I
D 1,860 4 39,822 0.095 0.55 2,081 F
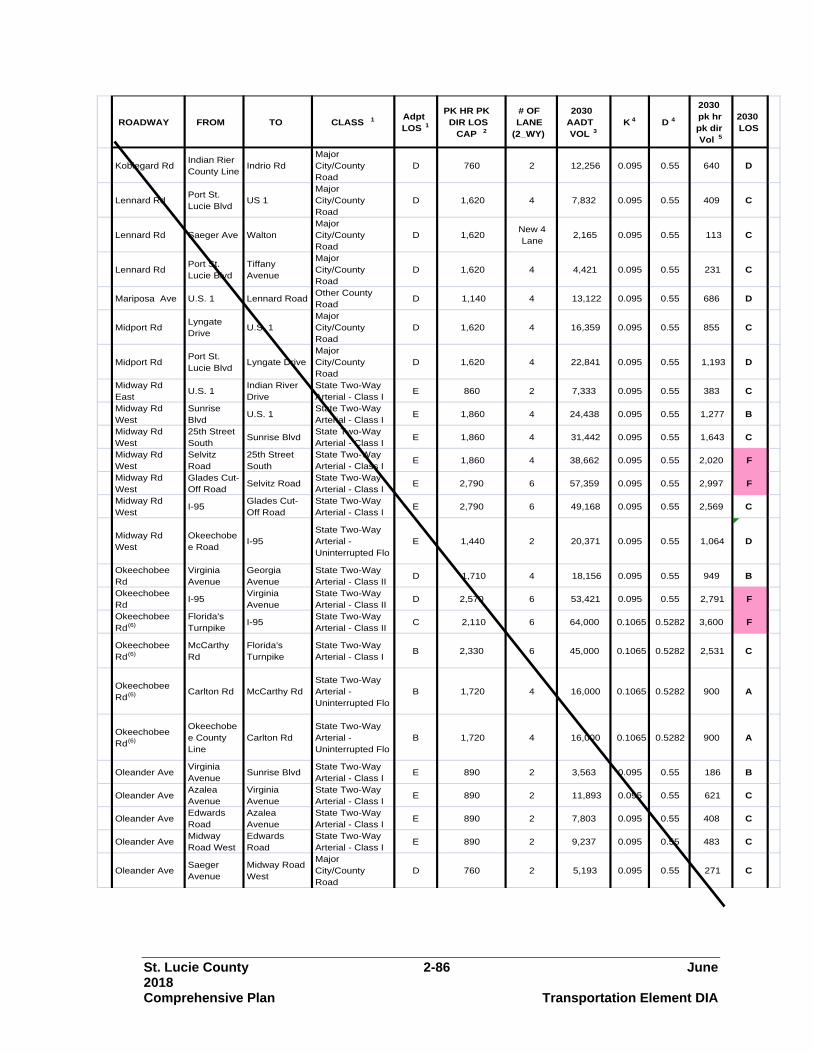
St. Lucie County 2-86 June 2018 Comprehensive Plan Transportation Element DIA
ROADWAY FROM TO CLASS 1 Adpt LOS 1
PK HR PK DIR LOS
CAP 2
# OF LANE
(2_WY)
2030 AADT VOL 3
K 4 D 4
2030 pk hr pk dir Vol 5
2030 LOS
Koblegard RdIndian Rier County Line
Indrio RdMajor City/County Road
D 760 2 12,256 0.095 0.55 640 D
Lennard RdPort St. Lucie Blvd
US 1Major City/County Road
D 1,620 4 7,832 0.095 0.55 409 C
Lennard Rd Saeger Ave WaltonMajor City/County Road
D 1,620New 4 Lane
2,165 0.095 0.55 113 C
Lennard RdPort St. Lucie Blvd
Tiffany Avenue
Major City/County Road
D 1,620 4 4,421 0.095 0.55 231 C
Mariposa Ave U.S. 1 Lennard RoadOther County Road
D 1,140 4 13,122 0.095 0.55 686 D
Midport RdLyngate Drive
U.S. 1Major City/County Road
D 1,620 4 16,359 0.095 0.55 855 C
Midport RdPort St. Lucie Blvd
Lyngate DriveMajor City/County Road
D 1,620 4 22,841 0.095 0.55 1,193 D
Midway Rd East
U.S. 1Indian River Drive
State Two-Way Arterial - Class I
E 860 2 7,333 0.095 0.55 383 C
Midway Rd West
Sunrise Blvd
U.S. 1State Two-Way Arterial - Class I
E 1,860 4 24,438 0.095 0.55 1,277 B
Midway Rd West
25th Street South
Sunrise BlvdState Two-Way Arterial - Class I
E 1,860 4 31,442 0.095 0.55 1,643 C
Midway Rd West
Selvitz Road
25th Street South
State Two-Way Arterial - Class I
E 1,860 4 38,662 0.095 0.55 2,020 F
Midway Rd West
Glades Cut-Off Road
Selvitz RoadState Two-Way Arterial - Class I
E 2,790 6 57,359 0.095 0.55 2,997 F
Midway Rd West
I-95Glades Cut-Off Road
State Two-Way Arterial - Class I
E 2,790 6 49,168 0.095 0.55 2,569 C
Midway Rd West
Okeechobee Road
I-95State Two-Way Arterial - Uninterrupted Flo
E 1,440 2 20,371 0.095 0.55 1,064 D
Okeechobee Rd
Virginia Avenue
Georgia Avenue
State Two-Way Arterial - Class II
D 1,710 4 18,156 0.095 0.55 949 B
Okeechobee Rd
I-95Virginia Avenue
State Two-Way Arterial - Class II
D 2,570 6 53,421 0.095 0.55 2,791 F
Okeechobee Rd(6)
Florida's Turnpike
I-95State Two-Way Arterial - Class II
C 2,110 6 64,000 0.1065 0.5282 3,600 F
Okeechobee Rd(6)
McCarthy Rd
Florida's Turnpike
State Two-Way Arterial - Class I
B 2,330 6 45,000 0.1065 0.5282 2,531 C
Okeechobee Rd(6) Carlton Rd McCarthy Rd
State Two-Way Arterial - Uninterrupted Flo
B 1,720 4 16,000 0.1065 0.5282 900 A
Okeechobee Rd(6)
Okeechobee County Line
Carlton RdState Two-Way Arterial - Uninterrupted Flo
B 1,720 4 16,000 0.1065 0.5282 900 A
Oleander AveVirginia Avenue
Sunrise BlvdState Two-Way Arterial - Class I
E 890 2 3,563 0.095 0.55 186 B
Oleander AveAzalea Avenue
Virginia Avenue
State Two-Way Arterial - Class I
E 890 2 11,893 0.095 0.55 621 C
Oleander AveEdwards Road
Azalea Avenue
State Two-Way Arterial - Class I
E 890 2 7,803 0.095 0.55 408 C
Oleander AveMidway Road West
Edwards Road
State Two-Way Arterial - Class I
E 890 2 9,237 0.095 0.55 483 C
Oleander AveSaeger Avenue
Midway Road West
Major City/County Road
D 760 2 5,193 0.095 0.55 271 C
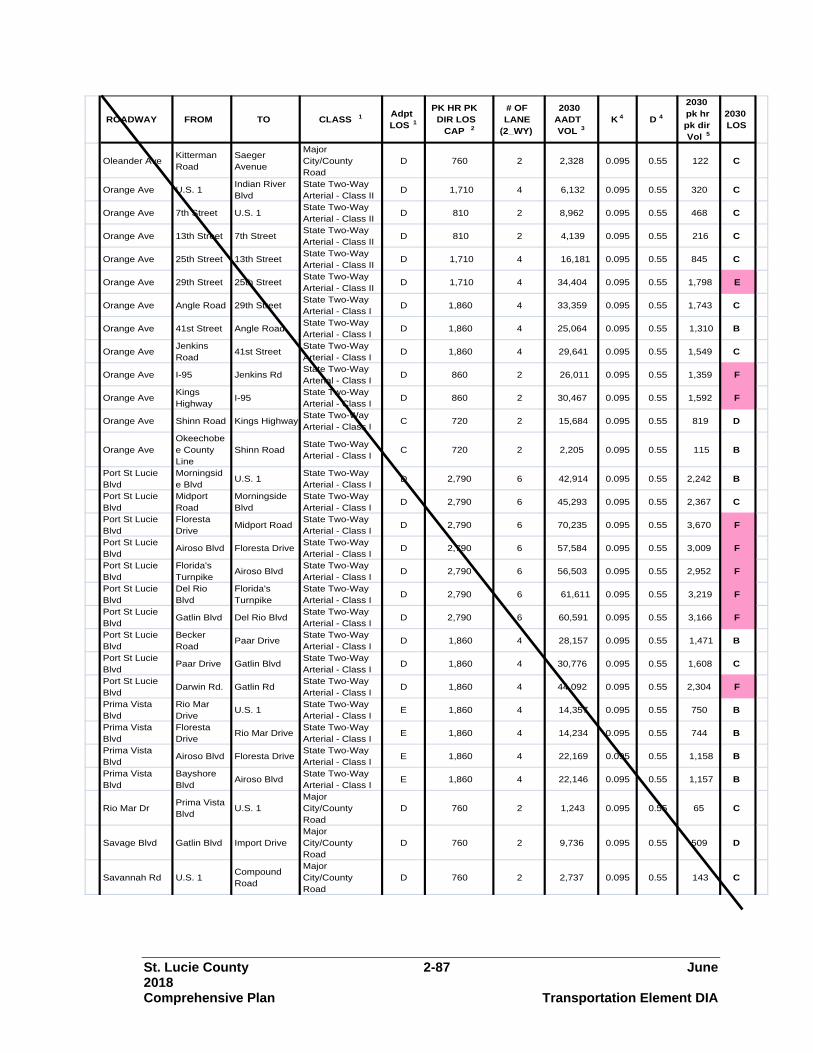
St. Lucie County 2-87 June 2018 Comprehensive Plan Transportation Element DIA
ROADWAY FROM TO CLASS 1 Adpt LOS 1
PK HR PK DIR LOS
CAP 2
# OF LANE
(2_WY)
2030 AADT VOL 3
K 4 D 4
2030 pk hr pk dir Vol 5
2030 LOS
Oleander AveKitterman Road
Saeger Avenue
Major City/County Road
D 760 2 2,328 0.095 0.55 122 C
Orange Ave U.S. 1Indian River Blvd
State Two-Way Arterial - Class II
D 1,710 4 6,132 0.095 0.55 320 C
Orange Ave 7th Street U.S. 1State Two-Way Arterial - Class II
D 810 2 8,962 0.095 0.55 468 C
Orange Ave 13th Street 7th StreetState Two-Way Arterial - Class II
D 810 2 4,139 0.095 0.55 216 C
Orange Ave 25th Street 13th StreetState Two-Way Arterial - Class II
D 1,710 4 16,181 0.095 0.55 845 C
Orange Ave 29th Street 25th StreetState Two-Way Arterial - Class II
D 1,710 4 34,404 0.095 0.55 1,798 E
Orange Ave Angle Road 29th StreetState Two-Way Arterial - Class I
D 1,860 4 33,359 0.095 0.55 1,743 C
Orange Ave 41st Street Angle RoadState Two-Way Arterial - Class I
D 1,860 4 25,064 0.095 0.55 1,310 B
Orange AveJenkins Road
41st StreetState Two-Way Arterial - Class I
D 1,860 4 29,641 0.095 0.55 1,549 C
Orange Ave I-95 Jenkins RdState Two-Way Arterial - Class I
D 860 2 26,011 0.095 0.55 1,359 F
Orange AveKings Highway
I-95State Two-Way Arterial - Class I
D 860 2 30,467 0.095 0.55 1,592 F
Orange Ave Shinn Road Kings HighwayState Two-Way Arterial - Class I
C 720 2 15,684 0.095 0.55 819 D
Orange AveOkeechobee County Line
Shinn RoadState Two-Way Arterial - Class I
C 720 2 2,205 0.095 0.55 115 B
Port St Lucie Blvd
Morningside Blvd
U.S. 1State Two-Way Arterial - Class I
D 2,790 6 42,914 0.095 0.55 2,242 B
Port St Lucie Blvd
Midport Road
Morningside Blvd
State Two-Way Arterial - Class I
D 2,790 6 45,293 0.095 0.55 2,367 C
Port St Lucie Blvd
Floresta Drive
Midport RoadState Two-Way Arterial - Class I
D 2,790 6 70,235 0.095 0.55 3,670 F
Port St Lucie Blvd
Airoso Blvd Floresta DriveState Two-Way Arterial - Class I
D 2,790 6 57,584 0.095 0.55 3,009 F
Port St Lucie Blvd
Florida's Turnpike
Airoso BlvdState Two-Way Arterial - Class I
D 2,790 6 56,503 0.095 0.55 2,952 F
Port St Lucie Blvd
Del Rio Blvd
Florida's Turnpike
State Two-Way Arterial - Class I
D 2,790 6 61,611 0.095 0.55 3,219 F
Port St Lucie Blvd
Gatlin Blvd Del Rio BlvdState Two-Way Arterial - Class I
D 2,790 6 60,591 0.095 0.55 3,166 F
Port St Lucie Blvd
Becker Road
Paar DriveState Two-Way Arterial - Class I
D 1,860 4 28,157 0.095 0.55 1,471 B
Port St Lucie Blvd
Paar Drive Gatlin BlvdState Two-Way Arterial - Class I
D 1,860 4 30,776 0.095 0.55 1,608 C
Port St Lucie Blvd
Darwin Rd. Gatlin RdState Two-Way Arterial - Class I
D 1,860 4 44,092 0.095 0.55 2,304 F
Prima Vista Blvd
Rio Mar Drive
U.S. 1State Two-Way Arterial - Class I
E 1,860 4 14,357 0.095 0.55 750 B
Prima Vista Blvd
Floresta Drive
Rio Mar DriveState Two-Way Arterial - Class I
E 1,860 4 14,234 0.095 0.55 744 B
Prima Vista Blvd
Airoso Blvd Floresta DriveState Two-Way Arterial - Class I
E 1,860 4 22,169 0.095 0.55 1,158 B
Prima Vista Blvd
Bayshore Blvd
Airoso BlvdState Two-Way Arterial - Class I
E 1,860 4 22,146 0.095 0.55 1,157 B
Rio Mar DrPrima Vista Blvd
U.S. 1Major City/County Road
D 760 2 1,243 0.095 0.55 65 C
Savage Blvd Gatlin Blvd Import DriveMajor City/County Road
D 760 2 9,736 0.095 0.55 509 D
Savannah Rd U.S. 1Compound Road
Major City/County Road
D 760 2 2,737 0.095 0.55 143 C

St. Lucie County 2-88 June 2018 Comprehensive Plan Transportation Element DIA
ROADWAY FROM TO CLASS 1 Adpt LOS 1
PK HR PK DIR LOS
CAP 2
# OF LANE
(2_WY)
2030 AADT VOL 3
K 4 D 4
2030 pk hr pk dir Vol 5
2030 LOS
Savannah RdCompound Road
Indian River Drive
Major City/County Road
D 760 2 2,109 0.095 0.55 110 C
Savona BlvdAlcantarra Blvd
California Blvd
Major City/County Road
D 760 2 8,374 0.095 0.55 438 C
Savona BlvdSavage Blvd
Alcantarra Blvd
Major City/County Road
D 760 2 7,702 0.095 0.55 402 C
Selvitz Rd Midway Rd Bayshore RdMajor City/County Road
D 1,620 4 19,048 0.095 0.55 995 C
Selvitz RoadMidway Road West
Edwards Road
Major City/County Road
D 1,620 4 13,461 0.095 0.55 703 C
SR A1A NorthJackson Way
Indian River County Line
State Two-Way Arterial - Uninterrupted Flo
D 1,130 2 8,529 0.095 0.55 446 C
SR A1A NorthShorewinds Drive
Jackson WayState Two-Way Arterial - Uninterrupted Flo
D 1,130 2 11,077 0.095 0.55 579 C
SR A1A NorthNorth Bridge
Shorewinds Drive
State Two-Way Arterial - Uninterrupted Flo
D 1,130 2 14,465 0.095 0.55 756 C
SR A1A North U.S. 1 North BridgeState Two-Way Arterial - Class I
D 860 2 15,639 0.095 0.55 817 D
SR A1A SouthSouth Bridge
U.S. 1State Two-Way Arterial - Class I
D 1,860 4 22,664 0.095 0.55 1,184 B
SR A1A SouthOcean Drive
South BridgeState Two-Way Arterial - Class I
D 1,860 4 20,796 0.095 0.55 1,087 B
SR A1A SouthPlover Avenue
Seaway DriveState Two-Way Arterial - Class I
D 860 2 15,580 0.095 0.55 814 D
SR A1A SouthBlue Her n Blvd
Plover Avenue
State Two-Way Arterial - Uninterrupted Flo
D 1,130 2 11,562 0.095 0.55 604 C
SR A1A South
Walton Rocks Beach Road
Blue Heron Blvd
State Two-Way Arterial - Uninterrupted Flo
D 1,130 2 8,230 0.095 0.55 430 C
SR A1A SouthNettles Blvd
Walton Rocks Beach Blvd
State Two-Way Arterial - Uninterrupted Flo
D 1,130 2 13,096 0.095 0.55 684 C
SR A1A SouthMartin County Line
Nettles BlvdState Two-Way Arterial - Uninterrupted Flo
D 1,130 2 18,879 0.095 0.55 986 D
St Lucie Blvd25th Street North
U.S. 1State Two-Way Arterial - Class I
E 890 2 9,906 0.095 0.55 518 C
St Lucie Blvd Sapp Road25th Street North
State Two-Way Arterial - Class I
E 890 2 12,855 0.095 0.55 672 C
St Lucie BlvdKings Highway
Sapp RoadState Two-Way Arterial - Class I
E 890 2 18,952 0.095 0.55 990 F
St Lucie BlvdEmerson Ave
Kings Hwy North
State Two-Way Arterial - Class I
E 25,777 0.095 0.55 1,347
St. Lucie West Blvd
Country Club Drive
Bayshore Blvd
State Two-Way Arterial - Class I
E 1,860 4 27,695 0.095 0.55 1,447 B
St. Lucie West Blvd
Glades Cut-Off Road
I-95State Two-Way Arterial - Class I
E 1,860 4 16,344 0.095 0.55 854 B

St. Lucie County 2-89 June 2018 Comprehensive Plan Transportation Element DIA
ROADWAY FROM TO CLASS 1 Adpt LOS 1
PK HR PK DIR LOS
CAP 2
# OF LANE
(2_WY)
2030 AADT VOL 3
K 4 D 4
2030 pk hr pk dir Vol 5
2030 LOS
St. Lucie West Blvd
Reserve Blvd
PeacockState Two-Way Arterial - Class I
E 2,790 6 43,531 0.095 0.55 2,274 B
St. Lucie West Blvd
Peacock CashmereState Two-Way Arterial - Class I
E 1,860 4 43,531 0.095 0.55 2,274 F
Sunrise BlvdVirginia Avenue
U.S. 1Major City/County Road
D 760 2 5,935 0.095 0.55 310 C
Sunrise Blvd Cortez BlvdVirginia Avenue
Major City/County Road
D 760 2 4,896 0.095 0.55 256 C
Sunrise Blvd Bell AvenueEdwards Road
Major City/County Road
D 760 2 3,542 0.095 0.55 185 C
Sunrise BlvdEdwards Road
Cortez BlvdMajor City/County Road
D 760 2 6,769 0.095 0.55 354 C
Sunrise BlvdWeatherbee Road
Bell AvenueMajor City/County Road
D 760 2 2,303 0.095 0.55 120 C
Sunrise BlvdMidway Road West
Weatherbee Road
Major City/County Road
D 760 2 2,029 0.095 0.55 106 C
Tiffany Ave U.S. 1Village Green Drive
Major City/County Road
D 760 2 7,637 0.095 0.55 399 C
Tiffany AveVillage Green Drive
Lennard RoadMajor City/County Road
D 760 2 4,927 0.095 0.55 257 C
US 1 North Indrio RoadIndian River County Line
State Two-Way Arterial - Class I
D 1,860 4 31,388 0.095 0.55 1,640 C
US 1 NorthSt. Lucie Blvd
Indrio RoadState Two-Way Arterial - Class I
D 1,860 4 37,382 0.095 0.55 1,953 F
US 1 NorthS.R. A1A South
S.R. A1A North
State Two-Way Arterial - Class II
D 1,710 4 29,588 0.095 0.55 1,546 D
US 1 NorthOrange Avenue
S.R. A1A South
State Two-Way Arterial - Class II
D 1,710 4 29,843 0.095 0.55 1,559 D
US 1 SouthDelaware Avenue
Orange Avenue
State Two-Way Arterial - Class II
D 1,710 4 27,354 0.095 0.55 1,429 D
US 1 SouthGeorgia Avenue
Delaware Avenue
State Two-Way Arterial - Class II
D 1,710 4 35,206 0.095 0.55 1,840 F
US 1 SouthVirginia Avenue
Georgia Avenue
State Two-Way Arterial - Class II
D 1,710 4 39,965 0.095 0.55 2,088 F
US 1 SouthEdwards Road
Virginia Avenue
State Two-Way Arterial - Class II
D 2,570 6 38,961 0.095 0.55 2,036 C
US 1 SouthMarket Avenue
Edwards Road
State Two-Way Arterial - Class II
D 2,570 6 43,992 0.095 0.55 2,299 D
US 1 SouthMidway Road
Market Avenue
State Two-Way Arterial - Class I
D 2,790 6 46,221 0.095 0.55 2,415 C
US 1 South Easy Street Midway RoadState Two-Way Arterial - Class I
D 2,790 6 52,104 0.095 0.55 2,722 D
US 1 SouthKitterman Road
Easy StreetState Two-Way Arterial - Class I
D 2,790 6 53,710 0.095 0.55 2,806 F
US 1 SouthPrima Vista Blvd
Kitterman Road
State Two-Way Arterial - Class I
D 2,790 6 55,939 0.095 0.55 2,923 F
US 1 SouthSavanna Club Blvd
Prima Vista Blvd
State Two-Way Arterial - Class I
D 2,790 6 45,588 0.095 0.55 2,382 C
US 1 SouthWalton Road
Savanna Club Blvd
State Two-Way Arterial - Class I
D 2,790 6 55,794 0.095 0.55 2,915 F
US 1 SouthPort St. Lucie Blvd
Walton RoadState Two-Way Arterial - Class I
D 2,790 6 46,964 0.095 0.55 2,454 C

St. Lucie County 2-90 June 2018 Comprehensive Plan Transportation Element DIA
ROADWAY FROM TO CLASS 1 Adpt LOS 1
PK HR PK DIR LOS
CAP 2
# OF LANE
(2_WY)
2030 AADT VOL 3
K 4 D 4
2030 pk hr pk dir Vol 5
2030 LOS
US 1 SouthMartin County Line
Port St. Lucie Blvd
State Two-Way Arterial - Class I
D 2,790 8 60,621 0.095 0.55 3,167 F
Village PkwySt. Lucie West Blvd
Becker RdMajor City/County Road
D 1,620New 4 Lane
11,637 0.095 0.55 608 C
Virginia AveOleander Avenue
U.S. 1State Two-Way Arterial - Class II
D 2,570 6 7,626 0.095 0.55 398 C
Virginia AveSunrise Blvd
Oleander BlvdState Two-Way Arterial - Class II
D 2,570 6 16,736 0.095 0.55 874 C
Virginia Ave13th Street South
Sunrise BlvdState Two-Way Arterial - Class II
D 2,570 6 34,830 0.095 0.55 1,820 C
Virginia Ave25th Street South
13th Street South
State Two-Way Arterial - Class II
D 2,570 6 38,682 0.095 0.55 2,021 C
Virginia Ave35th Street South
25th Street South
State Two-Way Arterial - Class II
D 2,570 6 30,978 0.095 0.55 1,619 C
Virginia AveOkeechobee Road
35th Street South
State Two-Way Arterial - Class II
D 2,570 6 25,174 0.095 0.55 1,315 C
Walton RdVillage Green Drive
Lennard RoadMajor City/County Road
D 1,620 4 18,200 0.095 0.55 951 C
Walton Rd U.S. 1Village Green Drive
Major City/County Road
D 1,620 4 12,435 0.095 0.55 650 C
Walton RdLennard Road
Green River Parkway
Major City/County Road
D 1,620 4 9,520 0.095 0.55 497 C
Westmoreland Blvd
Morningside Blvd
Martin County Line
Major City/County Road
D 760 2 6,150 0.095 0.55 321 C
Westmoreland Blvd
Cambridge Drive
Morningside Blvd
Major City/County Road
D 760 2 8,903 0.095 0.55 465 C
Westmoreland Blvd
Port St. Lucie Blvd
Cambridge Drive
Major City/County Road
D 760 2 9,881 0.095 0.55 516 D
Westmoreland Blvd
US 1COUNTY LINE
Major City/County Road
D 760 2 8,116 0.095 0.55 424 C
Note:
6) Data provided by FDOT
(2) The values for adopted level of service are directly taken from the FDOT 2007 Quality/Level of Service Handbook (Table 4-7-4-9) for Generalized 1) Classification for the roadways are based on "St. Lucie County 2006 Traffic Report".
3) 2030 volumes are directly taken from the St. Lucie TPO 2030 LRTP.
4) K and D values are directly taken from the FDOT Genralized tables. 5) 2030 peak hour peak direction volume is calculated from multiplying 2030 AADT with K and D.

St. Lucie County 2-91 June 2018 Comprehensive Plan Transportation Element DIA
ROADWAY NAME FROM TO
ROAD- WAY TYPE
ADOPT- ED LOS
2040 AADT
2040 PEAK HOUR VOL- UME
2040 LOS
10TH ST DELAWARE AVE ORANGE AVE 2U D 2,044 103 C
10TH ST ORANGE AVE AVENUE C 2U D 4,414 222 C
10TH ST AVENUE C AVENUE D 2U D 1,476 74 C
13TH ST GEORGIA AVE DELAWARE AVE 2U D 8,177 412 D
13TH ST DELAWARE AVE ORANGE AVE 2U D 8,267 417 D
13TH ST AVENUE I AVENUE O 2U D 6,976 352 D
13TH ST AVENUE O AVENUE Q 2U D 1,099 55 C
13TH ST ORANGE AVE AVENUE B 2U D 10,495 455 D
13TH ST AVENUE B AVENUE D 2U D 9,030 455 D
13TH ST NEBRASKA AVE GEORGIA AVE 2U D 8,762 442 D
13TH ST VIRGINIA AVE NEBRASKA AVE 2U D 6,165 442 D
13TH ST AVENUE D AVENUE H 2U D 7,881 397 D
13TH ST AVENUE H AVENUE I 2U D 7,300 368 D
17TH ST DELAWARE AVE ORANGE AVE 2U D 9,427 475 D
17TH ST ORANGE AVE AVENUE D 2U D 6,844 345 D
17TH ST AVENUE D AVENUE Q 2U D 4,765 240 C
17TH ST GEORGIA AVE DELAWARE AVE 2U D 2,041 103 D
25TH ST ORANGE AVE AVENUE D 4D D 18,491 932 D
25TH ST ST LUCIE BLVD US 1 4D D 10,020 505 C
25TH ST JUANITA AVE ST LUCIE BLVD 4D D 12,693 640 C

St. Lucie County 2-92 June 2018 Comprehensive Plan Transportation Element DIA
ROADWAY NAME FROM TO
ROAD- WAY TYPE
ADOPT- ED LOS
2040 AADT
2040 PEAK HOUR VOL- UME
2040 LOS
25TH ST MIDWAY RD BELL AVE 4D E 18,890 952 C
25TH ST VIRIGINIA AVE NEBRASKA AVE 4D D 14,578 735 C
25TH ST BELL AVE EDWARDS RD 4D E 17,316 873 C
25TH ST DELAWARE AVE ORANGE AVE 4D D 17,768 896 D
25TH ST GEORGIA AVE DELAWARE AVE 4D D 17,952 905 D
25TH ST OKEECHOBEE RD GEORGIA AVE 4D D 18,378 926 D
25TH ST AVENUE Q JUANITA AVE 4D D 18,272 921 C
25TH ST AVENUE D AVENUE Q 4D D 17,373 876 D
25TH ST EDWARDS RD CORTEZ BLVD 4D D 21,244 1071 C
25TH ST CORTEZ BLVD VIRGINIA AVE 4D D 19,160 966 C
25TH ST NEBRASKA AVE OKEECHOBEE RD 4D D 17,518 883 C
29TH ST AVENUE D AVENUE Q 2U D 1,412 71 C
29TH ST ORANGE AVE AVENUE D 2U D 3,193 161 C
2ND ST CITRUS AVE ORANGE AVE 2U D 1,365 69 C
2ND ST ORANGE AVE AVENUE A 2U D 2,132 107 C
33RD ST DELAWARE AVE ORANGE AVE 2U D 11,204 565 D
33RD ST OKEECHOBEE RD DELAWARE AVE 2U D 7,656 386 D
35TH ST KIRBY LOOP RD CORTEZ BLVD 2U D 3,896 196 D
35TH ST CORTEZ BLVD VIRGINIA AVE 2U D 9,140 461 D
35TH ST VIRGINIA AVE OKEECHOBEE RD 2U D 4,534 229 D

St. Lucie County 2-93 June 2018 Comprehensive Plan Transportation Element DIA
ROADWAY NAME FROM TO
ROAD- WAY TYPE
ADOPT- ED LOS
2040 AADT
2040 PEAK HOUR VOL- UME
2040 LOS
53RD ST ANGLE RD JUANITA AVE 2U D 5,330 269 C
7TH ST DELAWARE AVE CITRUS AVE 2U D 7,671 333 D
7TH ST GEORGIA AVE DELAWARE AVE 2U D 6,195 312 C
7TH ST CITRUS AVE ORANGE AVE 2U D 6,617 333 D
7TH ST SUNRISE BLVD GEORGIA AVE 2U D 4,719 238 C
7TH ST ORANGE AVE AVENUE C 2U D 6,067 285 D
7TH ST AVENUE C AE BACKUS AVE 2U D 9,644 285 D
7TH ST AE BACKUS AVE AVENUE D 2U D 5,656 285 D
7TH ST AVENUE D AVENUE H 2U D 6,658 336 D
AE BACKUS AVE 7TH ST US 1 2U D 4,043 204 C
AE BACKUS AVE US 1 INDIAN RIVER DR 2U D 4,562 204 C
AIROSO BLVD PRIMA VISTA BLVD FLORESTA DR 4D E 9,587 483 C
AIROSO BLVD CROSSTOWN PKWY PRIMA VISTA BLVD 4D E 18,087 912 C
AIROSO BLVD FLORESTA DR ST JAMES DR 4D E 15,414 777 C
AIROSO BLVD THORNHILL DR CROSSTOWN PKWY 4D E 16,044 809 C
AIROSO BLVD PORT ST LUCIE BLVD THORNHILL DR 4D E 11,378 573 C
AIRPORT CONNECTOR FL TURNPIKE W RAMP I-95 4D E 22,855 1152 C
ALCANTARRA BLVD SAVONA BLVD PORT ST LUCIE BLVD 2U D 5,654 280 C
ANGLE RD ORANGE AVE AVENUE D 2U E 13,161 663 D
ANGLE RD KEEN RD KINGS HWY 2U E 10,793 534 C

St. Lucie County 2-94 June 2018 Comprehensive Plan Transportation Element DIA
ROADWAY NAME FROM TO
ROAD- WAY TYPE
ADOPT- ED LOS
2040 AADT
2040 PEAK HOUR VOL- UME
2040 LOS
ANGLE RD KINGS HWY JOHNSTON RD 2U D 4,302 213 C
ANGLE RD AVENUE Q 53RD ST 2U E 10,647 537 D
ANGLE RD AVENUE D AVENUE Q 2U E 12,339 622 D
ANGLE RD FLORIDAS TURNPIKE 1/2 MI E OF GODWIN RD 2U D 250 12 B
ANGLE RD 1/2 MI E OF GODWIN RD GODWIN RD 2U D 250 12 B
ANGLE RD 53RD ST KEEN RD 2U E 12,827 534 C
ANGLE RD JOHNSTON RD FLORIDAS TURNPIKE 2U D 2,101 104 C
ARTERIAL A GLADES CUT-OFF RD MIDWAY RD 4D D 2,663 134 C
AVENUE A 7TH ST US 1 2O D 2,841 256 C
AVENUE A US 1 INDIAN RIVER DR 2U D 2,630 133 C
AVENUE B 13TH ST 10TH ST 2U D 2,157 109 C
AVENUE C 10TH ST 7TH ST 2U D 4,542 229 C
AVENUE D 17TH ST 13TH ST 2U D 2,438 123 C
AVENUE D 25TH ST 17TH ST 2U D 1,838 93 C
AVENUE D 7TH ST US 1 2U D 3,238 163 C
AVENUE D ANGLE RD 29TH ST 2U D 1,036 52 C
AVENUE D 13TH ST 10TH ST 2U D 3,532 221 C
AVENUE D 10TH ST 7TH ST 2U D 4,394 221 C
AVENUE D 29TH ST 25TH ST 2U D 1,955 99 C
AVENUE H 13TH ST 7TH ST 2U D 2,970 432 D

St. Lucie County 2-95 June 2018 Comprehensive Plan Transportation Element DIA
ROADWAY NAME FROM TO
ROAD- WAY TYPE
ADOPT- ED LOS
2040 AADT
2040 PEAK HOUR VOL- UME
2040 LOS
AVENUE H 7TH ST US 1 2U D 8,566 432 D
AVENUE I 25TH ST 17TH ST 2U D 2,584 130 C
AVENUE I 17TH ST 13TH ST 2U D 2,789 141 C
AVENUE O 13TH ST US 1 2U D 8,617 434 D
AVENUE Q ANGLE RD 25TH ST 2U D 3,947 199 C
AVENUE Q 17TH ST 13TH ST 2U D 1,318 66 C
AVENUE Q 25TH ST 17TH ST 2U D 2,158 109 C
BAYSHORE BLVD THORNHILL DR CROSSTOWN PKWY 4D E 27,357 1379 C
BAYSHORE BLVD PRIMA VISTA BLVD FLORESTA DR 2U E 16,127 798 C
BAYSHORE BLVD CROSSTOWN PKWY PRIMA VISTA BLVD 4D E 24,956 1258 C
BAYSHORE BLVD PORT ST LUCIE BLVD THORNHILL DR 4D E 36,678 1849 C
BAYSHORE BLVD FLORESTA DR SELVITZ RD 2U E 11,692 579 C
BAYSHORE BLVD SELVITZ RD 25TH ST 2U E 4,318 218 C
BAYSHORE BLVD MOUNTWELL ST PORT ST LUCIE BLVD 2U D 15,512 768 D
BEACH AVE OLEANDER AVE RIO MAR DR 2U D 2,416 122
BECKER RD SAVONA BLVD PORT ST LUCIE BLVD 4D E 20,266 1021 C
BECKER RD I-95 SAVONA BLVD 4D E 35,360 1782 C
BECKER RD SOUTHBEND BLVD GILSON RD 2U E 16,797 831 D
BECKER RD PORT ST LUCIE BLVD ALBACORE ST 4D E 17,752 895 C
BECKER RD VILLAGE PKWY I-95 6D E 35,550 1792 C

St. Lucie County 2-96 June 2018 Comprehensive Plan Transportation Element DIA
ROADWAY NAME FROM TO
ROAD- WAY TYPE
ADOPT- ED LOS
2040 AADT
2040 PEAK HOUR VOL- UME
2040 LOS
BECKER RD DARWIN BLVD ATHENA DR 4D E 19,022 959 C
BECKER RD FLORIDAS TURNPIKE SOUTHBEND BLVD 4D E 15,909 802 C
BECKER RD ALBACORE ST DARWIN BLVD 4D E 15,164 764 C
BECKER RD ATHENA DR FLORIDAS TURNPIKE 4D E 21,917 1105 C
BECKER RD N-S ROAD A RANGE LINE RD 4D E 3,332 168 C
BECKER RD VILLAGE PKWY COMMUNITY BLVD 4D E 21,210 1069 C
BECKER RD COMMUNITY BLVD N-S ROAD B 4D E 6,593 168 C
BECKER RD N-S ROAD B N-S ROAD A 4D E 6,761 168 C
BELL AVE 25TH ST SUNRISE BLVD 2U D 5,023 253 C
BELL AVE SUNRISE BLVD OLEANDER AVE 2U D 4,608 232 C
BINNEY DR SR A1A S (SEAWAY) SR A1A S (OCEAN) 2U D 3,112 157 C
BLANTON BLVD TORINO PKWY VOLUCIA DR 2U D 1,561 77 B
BLANTON BLVD VOLUCIA DR EAST TORINO PKWY 2U D 4,546 225 B
BLUEFIELD RD BLUEFIELD RANCH RD OKEECHOBEE RD 2U D 47 2 B
BUCHANAN DR EASY ST MIDWAY RD 2U D 4,140 209 C
CALIFORNIA BLVD UNIVERSITY BLVD PEACOCK BLVD 2U E 10,138 502 C
CALIFORNIA BLVD ST LUCIE WEST BLVD COUNTRY CLUB DR 2U E 12,843 636 C
CALIFORNIA BLVD PEACOCK BLVD TORINO PKWY 2U E 10,239 507 C
CALIFORNIA BLVD CAMEO BLVD DEL RIO BLVD 2U D 7,967 402 D
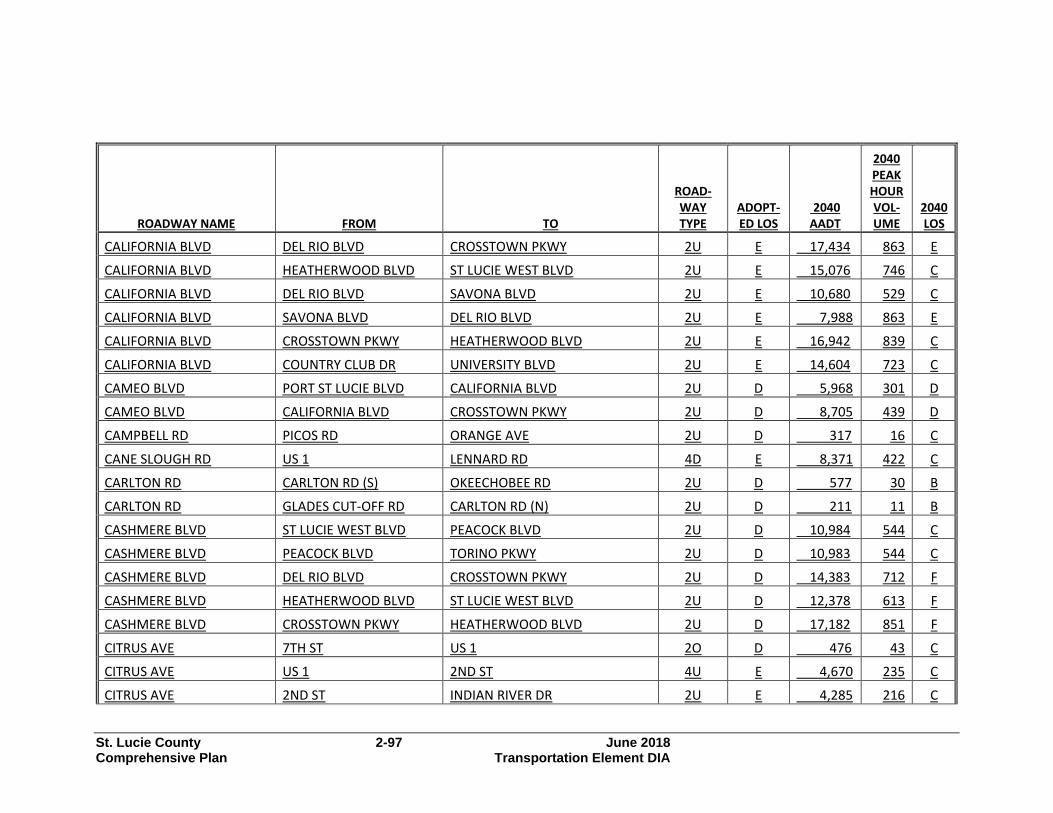
St. Lucie County 2-97 June 2018 Comprehensive Plan Transportation Element DIA
ROADWAY NAME FROM TO
ROAD- WAY TYPE
ADOPT- ED LOS
2040 AADT
2040 PEAK HOUR VOL- UME
2040 LOS
CALIFORNIA BLVD DEL RIO BLVD CROSSTOWN PKWY 2U E 17,434 863 E
CALIFORNIA BLVD HEATHERWOOD BLVD ST LUCIE WEST BLVD 2U E 15,076 746 C
CALIFORNIA BLVD DEL RIO BLVD SAVONA BLVD 2U E 10,680 529 C
CALIFORNIA BLVD SAVONA BLVD DEL RIO BLVD 2U E 7,988 863 E
CALIFORNIA BLVD CROSSTOWN PKWY HEATHERWOOD BLVD 2U E 16,942 839 C
CALIFORNIA BLVD COUNTRY CLUB DR UNIVERSITY BLVD 2U E 14,604 723 C
CAMEO BLVD PORT ST LUCIE BLVD CALIFORNIA BLVD 2U D 5,968 301 D
CAMEO BLVD CALIFORNIA BLVD CROSSTOWN PKWY 2U D 8,705 439 D
CAMPBELL RD PICOS RD ORANGE AVE 2U D 317 16 C
CANE SLOUGH RD US 1 LENNARD RD 4D E 8,371 422 C
CARLTON RD CARLTON RD (S) OKEECHOBEE RD 2U D 577 30 B
CARLTON RD GLADES CUT-OFF RD CARLTON RD (N) 2U D 211 11 B
CASHMERE BLVD ST LUCIE WEST BLVD PEACOCK BLVD 2U D 10,984 544 C
CASHMERE BLVD PEACOCK BLVD TORINO PKWY 2U D 10,983 544 C
CASHMERE BLVD DEL RIO BLVD CROSSTOWN PKWY 2U D 14,383 712 F
CASHMERE BLVD HEATHERWOOD BLVD ST LUCIE WEST BLVD 2U D 12,378 613 F
CASHMERE BLVD CROSSTOWN PKWY HEATHERWOOD BLVD 2U D 17,182 851 F
CITRUS AVE 7TH ST US 1 2O D 476 43 C
CITRUS AVE US 1 2ND ST 4U E 4,670 235 C
CITRUS AVE 2ND ST INDIAN RIVER DR 2U E 4,285 216 C

St. Lucie County 2-98 June 2018 Comprehensive Plan Transportation Element DIA
ROADWAY NAME FROM TO
ROAD- WAY TYPE
ADOPT- ED LOS
2040 AADT
2040 PEAK HOUR VOL- UME
2040 LOS
COMMERCE CENTER DR CROSSTOWN PKWY ST LUCIE WEST BLVD 4D D 1,048 53 C
COMMERCE CENTER DR ST LUCIE WEST BLVD GLADES CUT-OFF RD 2U D 10,450 517 C
COMMUNITY BLVD WESTCLIFFE LN TRADITION PKWY 4D D 4,415 223 C
COMMUNITY BLVD TRADITION PKWY DISCOVERY WAY 2D D 7,937 400 D
COMMUNITY BLVD DISCOVERY WAY OPEN VIEW (WEST) 4D D 15,050 759 C
COMMUNITY BLVD OPEN VIEW (WEST) PAAR (WEST) 4D D 5,066 255 C
COMMUNITY BLVD PAAR (WEST) BECKER RD 4D D 4,000 202 C
CORTEZ BLVD 35TH ST 25TH ST 2U D 3,728 188 C
CORTEZ BLVD 25TH ST SUNRISE BLVD 2U D 846 43 C
COUNTRY CLUB DR ST LUCIE WEST BLVD CALIFORNIA BLVD 4D D 1,761 89 C
CROSSROADS PKWY OKEECHOBEE RD KINGS HWY 2U D 3,255 164 C
CROSSTOWN PKWY BAYSHORE BLVD AIROSO BLVD 6D E 29,568 1490 C
CROSSTOWN PKWY CALIFORNIA BLVD CASHMERE BLVD 6D E 37,110 1870 C
CROSSTOWN PKWY CASHMERE BLVD CAMEO BLVD 6D E 42,759 2155 C
CROSSTOWN PKWY FLORESTA DR CORAL REEF ST 6D E 40,082 2020 C
CROSSTOWN PKWY I-95 CALIFORNIA BLVD 6D E 47,592 2399 C
CROSSTOWN PKWY AIROSO BLVD SANDIA DR 6D E 26,886 1355 C
CROSSTOWN PKWY SANDIA DR MANTH LN 6D E 26,886 1355 C
CROSSTOWN PKWY MANTH LN FLORESTA DR 6D E 25,395 1280 C
CROSSTOWN PKWY COMMERCE CTR DR I-95 6D E 38,318 1931 C
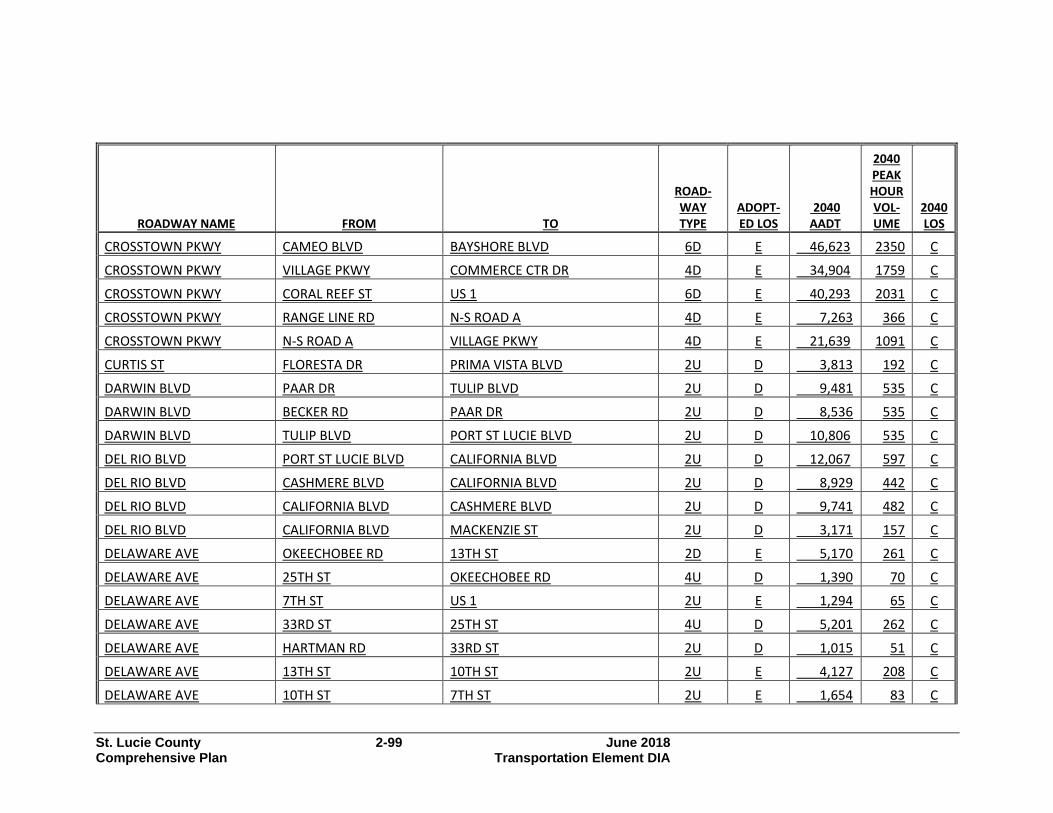
St. Lucie County 2-99 June 2018 Comprehensive Plan Transportation Element DIA
ROADWAY NAME FROM TO
ROAD- WAY TYPE
ADOPT- ED LOS
2040 AADT
2040 PEAK HOUR VOL- UME
2040 LOS
CROSSTOWN PKWY CAMEO BLVD BAYSHORE BLVD 6D E 46,623 2350 C
CROSSTOWN PKWY VILLAGE PKWY COMMERCE CTR DR 4D E 34,904 1759 C
CROSSTOWN PKWY CORAL REEF ST US 1 6D E 40,293 2031 C
CROSSTOWN PKWY RANGE LINE RD N-S ROAD A 4D E 7,263 366 C
CROSSTOWN PKWY N-S ROAD A VILLAGE PKWY 4D E 21,639 1091 C
CURTIS ST FLORESTA DR PRIMA VISTA BLVD 2U D 3,813 192 C
DARWIN BLVD PAAR DR TULIP BLVD 2U D 9,481 535 C
DARWIN BLVD BECKER RD PAAR DR 2U D 8,536 535 C
DARWIN BLVD TULIP BLVD PORT ST LUCIE BLVD 2U D 10,806 535 C
DEL RIO BLVD PORT ST LUCIE BLVD CALIFORNIA BLVD 2U D 12,067 597 C
DEL RIO BLVD CASHMERE BLVD CALIFORNIA BLVD 2U D 8,929 442 C
DEL RIO BLVD CALIFORNIA BLVD CASHMERE BLVD 2U D 9,741 482 C
DEL RIO BLVD CALIFORNIA BLVD MACKENZIE ST 2U D 3,171 157 C
DELAWARE AVE OKEECHOBEE RD 13TH ST 2D E 5,170 261 C
DELAWARE AVE 25TH ST OKEECHOBEE RD 4U D 1,390 70 C
DELAWARE AVE 7TH ST US 1 2U E 1,294 65 C
DELAWARE AVE 33RD ST 25TH ST 4U D 5,201 262 C
DELAWARE AVE HARTMAN RD 33RD ST 2U D 1,015 51 C
DELAWARE AVE 13TH ST 10TH ST 2U E 4,127 208 C
DELAWARE AVE 10TH ST 7TH ST 2U E 1,654 83 C

St. Lucie County 2-100 June 2018 Comprehensive Plan Transportation Element DIA
ROADWAY NAME FROM TO
ROAD- WAY TYPE
ADOPT- ED LOS
2040 AADT
2040 PEAK HOUR VOL- UME
2040 LOS
DISCOVERY WAY VILLAGE PKWY COMMUNITY BLVD 4D D 20,228 1019 D
DISCOVERY WAY COMMUNITY BLVD N-S ROAD B 4D D 1,240 62 C
DISCOVERY WAY N-S ROAD B N-S ROAD A 4D D 380 19 C
DISCOVERY WAY N-S ROAD A RANGE LINE RD 4D D 2,355 119 C
EAST TORINO PKWY TORINO PKWY MIDWAY RD 2U E 17,533 868 E
EAST TORINO PKWY CASHMERE BLVD BLANTON BLVD 2U E 7,520 372 C
EAST TORINO PKWY BLANTON BLVD TORINO PKWY 2U E 12,684 628 C
EASY ST US 1 BUCHANAN DR 2U D 5,043 254 C
EASY ST BUCHANAN DR YUCCA DR 2U D 1,446 73 C
EDWARDS RD OLEANDER AVE US 1 4D E 5,322 268 C
EDWARDS RD 25TH ST SUNRISE BLVD 4D E 15,617 787 C
EDWARDS RD SELVITZ RD 25TH ST 2U E 12,782 633 C
EDWARDS RD JENKINS RD MCNEIL RD 2U E 12,300 609 C
EDWARDS RD MCNEIL RD SELVITZ RD 2U E 15,990 792 C
EDWARDS RD SUNRISE BLVD OLEANDER AVE 4D E 10,280 518 C
EMERSON AVE FT PIERCE BLVD NORTH BLVD 2U D 10,915 540 C
EMERSON AVE INDIRO RD RUSSOS RD 2U D 8,439 418 C
EMERSON AVE RUSSOS RD FT PIERCE BLVD 2U D 10,794 534 C
E-W ROAD 2 VILLAGE PKWY COMMUNITY BLVD 4D D 10,037 506 C
E-W ROAD 2 COMMUNITY BLVD N-S ROAD B 4D D 10,145 511 C

St. Lucie County 2-101 June 2018 Comprehensive Plan Transportation Element DIA
ROADWAY NAME FROM TO
ROAD- WAY TYPE
ADOPT- ED LOS
2040 AADT
2040 PEAK HOUR VOL- UME
2040 LOS
E-W ROAD 2 N-S- ROAD B N-S ROAD A 4D D 7,202 363 C
E-W ROAD 6 MCCARTY RD GLADES CUT-OFF RD 4D D 183 9 C
E-W ROAD 6 SHINN RD MCCARTY RD 4D D 95 9 C
FARMERS MARKET RD OLEANDER AVE US 1 2U D 2,466 124 C
FFA RD ORANGE AVE ANGLE RD 2U D 1,314 65 B
FLORESTA DR PRIMA VISTA BLVD AIROSO BLVD 2U E 10,914 540 C
FLORESTA DR CROSSTOWN PKWY PRIMA VISTA BLVD 2U E 14,936 739 C
FLORESTA DR AIROSO BLVD SELVITZ RD 2U D 5,844 289 C
FLORESTA DR OAKLYN ST PORT ST LUCIE BLVD 2U E 16,487 816 D
FLORESTA DR PORT ST LUCIE BLVD THORNHILL DR 2U E 11,060 547 C
FLORESTA DR THORNHILL DR CROSSTOWN PKWY 2U E 11,934 591 C
FLORESTA DR SELVITZ RD BAYSHORE BLVD 2U D 5,300 262 C
FLORIDA'S TURNPIKE BECKER RD PORT ST LUCIE BLVD 4F D 46,433 2286 C
FLORIDA'S TURNPIKE PORT ST LUCIE BLVD MIDWAY RD 4F D 39,805 1960 B
FLORIDA'S TURNPIKE AIRPORT CONNECTOR INDIAN RIVER C.L. 4F C 34,987 2039 C
FLORIDA'S TURNPIKE MARTIN C.L. BECKER RD 4F D 50,989 2510 C
FLORIDA'S TURNPIKE OKEECHOBEE RD AIRPORT CONNECTOR 4F C 11,265 656 B
FLORIDA'S TURNPIKE MIDWAY RD OKEECHOBEE RD 4F D 39,805 1960 B
FT PIERCE BLVD INDIRO RD EMERSON AVE 2U D 2,432 120 B
GARDENIA AVE OLEANDER AVE US 1 2U D 1,419 72 C
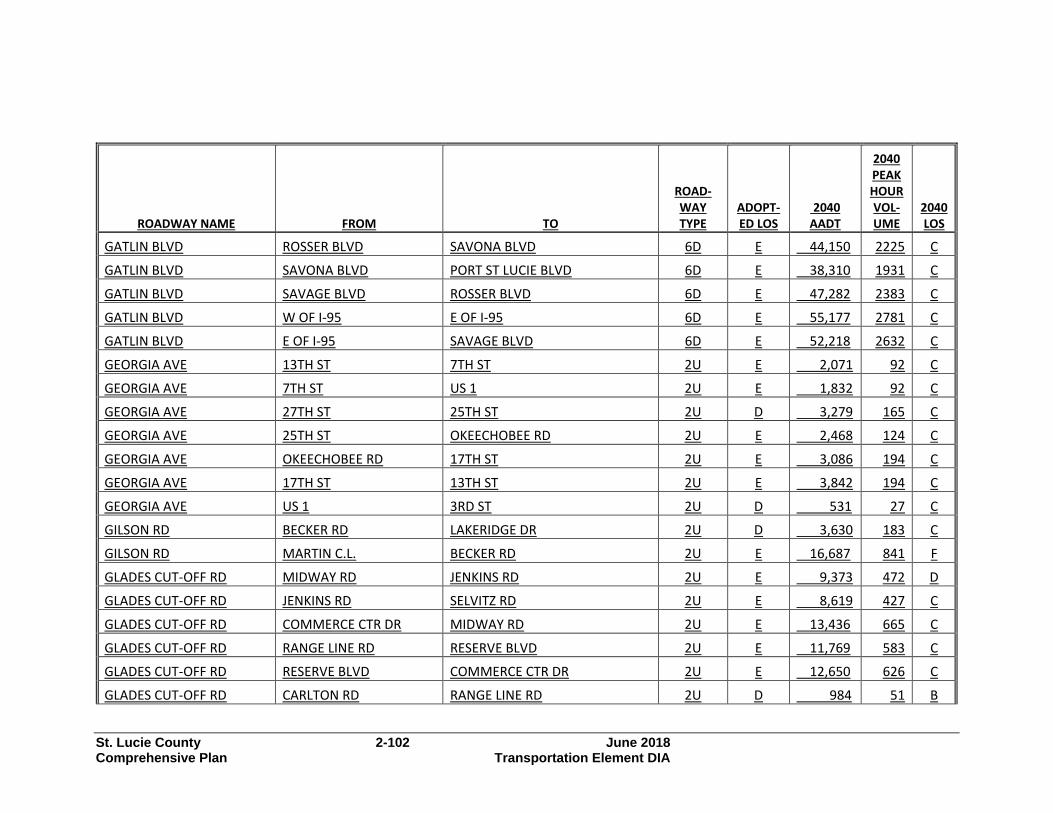
St. Lucie County 2-102 June 2018 Comprehensive Plan Transportation Element DIA
ROADWAY NAME FROM TO
ROAD- WAY TYPE
ADOPT- ED LOS
2040 AADT
2040 PEAK HOUR VOL- UME
2040 LOS
GATLIN BLVD ROSSER BLVD SAVONA BLVD 6D E 44,150 2225 C
GATLIN BLVD SAVONA BLVD PORT ST LUCIE BLVD 6D E 38,310 1931 C
GATLIN BLVD SAVAGE BLVD ROSSER BLVD 6D E 47,282 2383 C
GATLIN BLVD W OF I-95 E OF I-95 6D E 55,177 2781 C
GATLIN BLVD E OF I-95 SAVAGE BLVD 6D E 52,218 2632 C
GEORGIA AVE 13TH ST 7TH ST 2U E 2,071 92 C
GEORGIA AVE 7TH ST US 1 2U E 1,832 92 C
GEORGIA AVE 27TH ST 25TH ST 2U D 3,279 165 C
GEORGIA AVE 25TH ST OKEECHOBEE RD 2U E 2,468 124 C
GEORGIA AVE OKEECHOBEE RD 17TH ST 2U E 3,086 194 C
GEORGIA AVE 17TH ST 13TH ST 2U E 3,842 194 C
GEORGIA AVE US 1 3RD ST 2U D 531 27 C
GILSON RD BECKER RD LAKERIDGE DR 2U D 3,630 183 C
GILSON RD MARTIN C.L. BECKER RD 2U E 16,687 841 F
GLADES CUT-OFF RD MIDWAY RD JENKINS RD 2U E 9,373 472 D
GLADES CUT-OFF RD JENKINS RD SELVITZ RD 2U E 8,619 427 C
GLADES CUT-OFF RD COMMERCE CTR DR MIDWAY RD 2U E 13,436 665 C
GLADES CUT-OFF RD RANGE LINE RD RESERVE BLVD 2U E 11,769 583 C
GLADES CUT-OFF RD RESERVE BLVD COMMERCE CTR DR 2U E 12,650 626 C
GLADES CUT-OFF RD CARLTON RD RANGE LINE RD 2U D 984 51 B
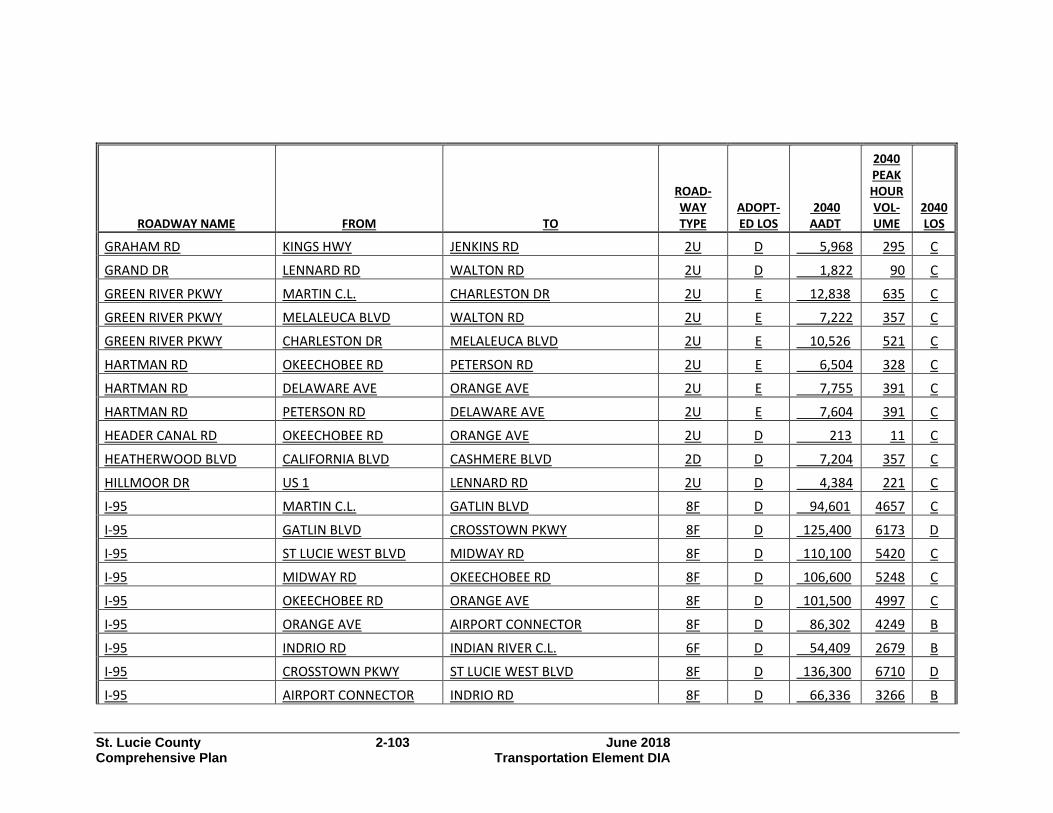
St. Lucie County 2-103 June 2018 Comprehensive Plan Transportation Element DIA
ROADWAY NAME FROM TO
ROAD- WAY TYPE
ADOPT- ED LOS
2040 AADT
2040 PEAK HOUR VOL- UME
2040 LOS
GRAHAM RD KINGS HWY JENKINS RD 2U D 5,968 295 C
GRAND DR LENNARD RD WALTON RD 2U D 1,822 90 C
GREEN RIVER PKWY MARTIN C.L. CHARLESTON DR 2U E 12,838 635 C
GREEN RIVER PKWY MELALEUCA BLVD WALTON RD 2U E 7,222 357 C
GREEN RIVER PKWY CHARLESTON DR MELALEUCA BLVD 2U E 10,526 521 C
HARTMAN RD OKEECHOBEE RD PETERSON RD 2U E 6,504 328 C
HARTMAN RD DELAWARE AVE ORANGE AVE 2U E 7,755 391 C
HARTMAN RD PETERSON RD DELAWARE AVE 2U E 7,604 391 C
HEADER CANAL RD OKEECHOBEE RD ORANGE AVE 2U D 213 11 C
HEATHERWOOD BLVD CALIFORNIA BLVD CASHMERE BLVD 2D D 7,204 357 C
HILLMOOR DR US 1 LENNARD RD 2U D 4,384 221 C
I-95 MARTIN C.L. GATLIN BLVD 8F D 94,601 4657 C
I-95 GATLIN BLVD CROSSTOWN PKWY 8F D 125,400 6173 D
I-95 ST LUCIE WEST BLVD MIDWAY RD 8F D 110,100 5420 C
I-95 MIDWAY RD OKEECHOBEE RD 8F D 106,600 5248 C
I-95 OKEECHOBEE RD ORANGE AVE 8F D 101,500 4997 C
I-95 ORANGE AVE AIRPORT CONNECTOR 8F D 86,302 4249 B
I-95 INDRIO RD INDIAN RIVER C.L. 6F D 54,409 2679 B
I-95 CROSSTOWN PKWY ST LUCIE WEST BLVD 8F D 136,300 6710 D
I-95 AIRPORT CONNECTOR INDRIO RD 8F D 66,336 3266 B
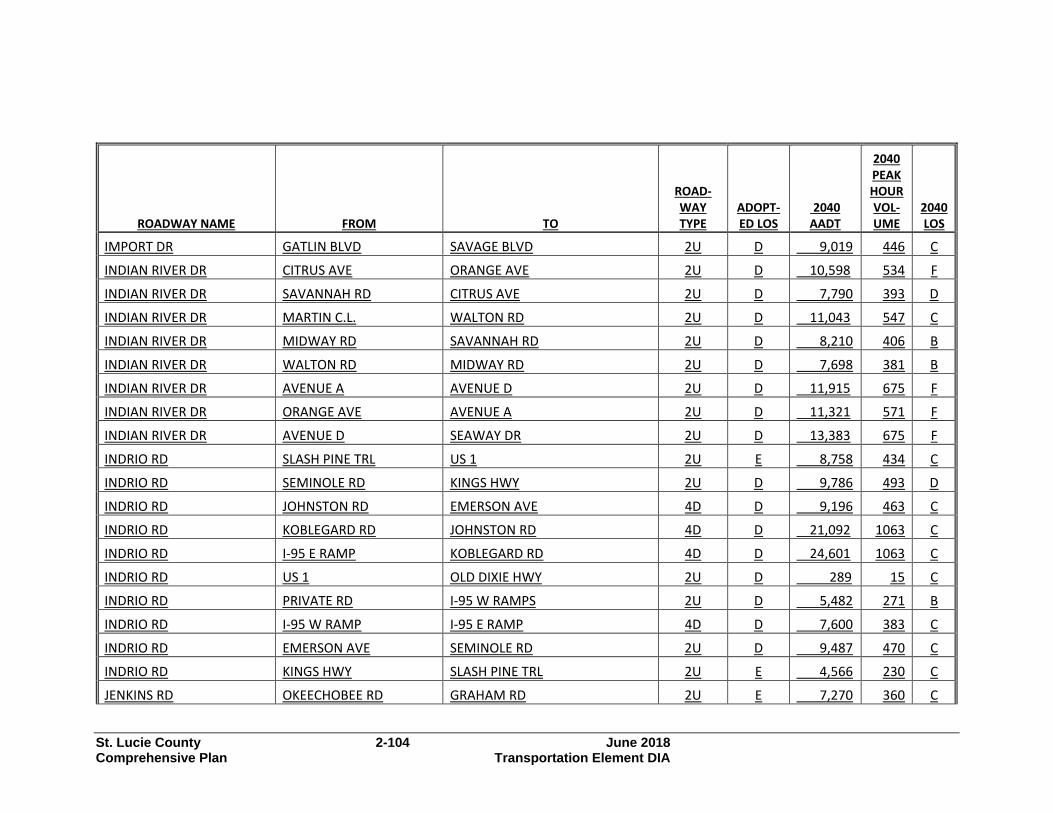
St. Lucie County 2-104 June 2018 Comprehensive Plan Transportation Element DIA
ROADWAY NAME FROM TO
ROAD- WAY TYPE
ADOPT- ED LOS
2040 AADT
2040 PEAK HOUR VOL- UME
2040 LOS
IMPORT DR GATLIN BLVD SAVAGE BLVD 2U D 9,019 446 C
INDIAN RIVER DR CITRUS AVE ORANGE AVE 2U D 10,598 534 F
INDIAN RIVER DR SAVANNAH RD CITRUS AVE 2U D 7,790 393 D
INDIAN RIVER DR MARTIN C.L. WALTON RD 2U D 11,043 547 C
INDIAN RIVER DR MIDWAY RD SAVANNAH RD 2U D 8,210 406 B
INDIAN RIVER DR WALTON RD MIDWAY RD 2U D 7,698 381 B
INDIAN RIVER DR AVENUE A AVENUE D 2U D 11,915 675 F
INDIAN RIVER DR ORANGE AVE AVENUE A 2U D 11,321 571 F
INDIAN RIVER DR AVENUE D SEAWAY DR 2U D 13,383 675 F
INDRIO RD SLASH PINE TRL US 1 2U E 8,758 434 C
INDRIO RD SEMINOLE RD KINGS HWY 2U D 9,786 493 D
INDRIO RD JOHNSTON RD EMERSON AVE 4D D 9,196 463 C
INDRIO RD KOBLEGARD RD JOHNSTON RD 4D D 21,092 1063 C
INDRIO RD I-95 E RAMP KOBLEGARD RD 4D D 24,601 1063 C
INDRIO RD US 1 OLD DIXIE HWY 2U D 289 15 C
INDRIO RD PRIVATE RD I-95 W RAMPS 2U D 5,482 271 B
INDRIO RD I-95 W RAMP I-95 E RAMP 4D D 7,600 383 C
INDRIO RD EMERSON AVE SEMINOLE RD 2U D 9,487 470 C
INDRIO RD KINGS HWY SLASH PINE TRL 2U E 4,566 230 C
JENKINS RD OKEECHOBEE RD GRAHAM RD 2U E 7,270 360 C

St. Lucie County 2-105 June 2018 Comprehensive Plan Transportation Element DIA
ROADWAY NAME FROM TO
ROAD- WAY TYPE
ADOPT- ED LOS
2040 AADT
2040 PEAK HOUR VOL- UME
2040 LOS
JENKINS RD EDWARDS RD OKEECHOBEE RD 2U E 12,360 612 C
JENKINS RD PETERSON RD ORANGE AVE 2U E 2,268 112 C
JENKINS RD GRAHAM RD PETERSON RD 2U E 2,441 112 C
JENNINGS RD US 1 LENNARD RD 4D D 8,302 418 C
JOHNSTON RD MEADOWOOD DR OLD JOHNSTON RD 2U D 1,118 55 B
JOHNSTON RD OLD JOHNSTON RD INDRIO RD 2U D 2,483 123 B
JOHNSTON RD ANGLE RD L20 2U D 2,073 103 B
JOHNSTON RD L20 MEADOWOOD DR 2U D 2,073 103 B
JOHNSTON RD INDIRO RD RUSSOS RD 2U D 15,173 751 C
JOHNSTON RD RUSSOS RD INDIAN RIVER C.L. 2U D 15,682 776 C
JUANITA AVE 25TH ST US 1 2U D 4,430 223 C
JUANITA AVE 53RD ST 25TH ST 2U D 4,737 239 C
KEEN RD ANGLE RD JUANITA AVE 2U D 6,955 344 C
KEEN RD JUANITA AVE ST LUCIE BLVD 2U D 6,955 344 C
KINGS HWY ST LUCIE BLVD INDRIO RD 4D D 24,127 1216 C
KINGS HWY N OF I-95 OVERPASS ANGLE RD 4D D 26,569 1339 C
KINGS HWY ANGLE RD ST LUCIE BLVD 4D D 19,709 993 C
KINGS HWY PICOS RD ORANGE AVE 4D D 12,663 638 C
KINGS HWY INDRIO RD INDIAN PINES BLVD 2U D 20,362 1008 F
KINGS HWY OKEECHOBEE RD CROSSROADS PKWY 4D D 8,822 445 C

St. Lucie County 2-106 June 2018 Comprehensive Plan Transportation Element DIA
ROADWAY NAME FROM TO
ROAD- WAY TYPE
ADOPT- ED LOS
2040 AADT
2040 PEAK HOUR VOL- UME
2040 LOS
KINGS HWY CROSSROADS PKWY GRAHAM RD 4D D 12,212 638 C
KINGS HWY GRAHAM RD PICOS RD 4D D 13,938 638 C
KINGS HWY INDIAN PINES BLVD KINGS HWY SB RAMP 2U D 22,591 780 F
KINGS HWY ORANGE AVE N OF I-95 OVERPASS 4D D 27,084 1365 C
KINGS HWY KINGS HWY SB RAMP US 1 2U D 15,751 780 F
KINGS HWY SB RAMP US 1 KINGS HWY 2O D 12,868 1158 C
KIRBY LOOP RD EDWARDS RD 35TH ST 2U D 4,266 211 C
KITTERMAN RD OLEANDER AVE US 1 2U E 3,320 167 C
KITTERMAN RD US 1 LENNARD EXT RD 2U D 452 23 C
LAKEHURST DR BAYSHORE BLVD AIROSO BLVD 2U D 8,522 422
LENNARD RD MARIPOSA AVE MELALEUCA BLVD 4D E 19,373 976 C
LENNARD RD TIFFANY AVE WALTON RD 4D E 5,035 254 C
LENNARD RD US 1 MARIPOSA AVE 4D E 17,019 858 C
LENNARD RD WALTON RD S OF SAVANNA CLUB BLVD 2U D 330 17 C
LENNARD RD KITTERMAN RD PRIMA VISTA BLVD 2U D 1,408 71 C
LENNARD RD MELALEUCA BLVD JENNINGS RD 4D E 18,977 633 C
LENNARD RD HILLMOOR DR TIFFANY AVE 4D E 7,120 359 C
LENNARD RD JENNINGS RD HILLMOOR DR 4D E 12,568 633 C
LYNGATE DR MORNINGSIDE BLVD US 1 2D D 13,858 686 C
LYNGATE DR VETERANS MEMORIAL PKWY MORNINGSIDE BLVD 2D D 7,066 350 C

St. Lucie County 2-107 June 2018 Comprehensive Plan Transportation Element DIA
ROADWAY NAME FROM TO
ROAD- WAY TYPE
ADOPT- ED LOS
2040 AADT
2040 PEAK HOUR VOL- UME
2040 LOS
MARIPOSA AVE LENNARD RD HALLAHAN ST 2U D 3,460 171 C
MCCARTY RD WILLIAMS RD MIDWAY RD 4D D 2,402 121 C
MCCARTY RD MIDWAY RD OKEECHOBEE RD 2U D 537 27 C
MCCARTY RD RESERVE BLVD EXT WILLIAMS RD 4D D 1,799 91 C
MCCARTY RD GLADES CUT-OFF RD RESERVE BLVD EXT 4D D 3,970 200 C
MCNEIL RD OKEECHOBEE RD KIRBY LOOP RD 2U D 8,462 426 D
MCNEIL RD KIRBY LOOP RD EDWARDS RD 2U D 6,280 317 D
MELALEUCA BLVD LENNARD RD GREEN RIVER PKWY 2U D 9,301 460 C
MIDWAY RD I-95 GLADES CUT-OFF RD 4D E 23,854 1202 C
MIDWAY RD SELVITZ RD CHRISTENSEN RD 4D E 22,903 1154 C
MIDWAY RD SUNRISE BLVD OLEANDER AVE 4D E 25,407 1281 D
MIDWAY RD OLEANDER AVE US 1 4D E 12,748 642 D
MIDWAY RD 25TH ST SUNRISE BLVD 4D E 24,035 1211 D
MIDWAY RD OKEECHOBEE RD SHINN RD 2U E 5,442 269 B
MIDWAY RD SHINN RD MCCARTY RD 2U E 9,070 449 C
MIDWAY RD MCCARTY RD I-95 2U E 14,006 693 C
MIDWAY RD GLADES CUT-OFF RD EAST TORINO PKWY 4D E 33,432 1685 C
MIDWAY RD W OF SELVITZ RD SELVITZ RD 4D E 27,865 1404 C
MIDWAY RD WALLACE ST WEATHERBEE RD 2U E 4,195 208 C
MIDWAY RD WEATHERBEE RD INDIAN RIVER DR 2U E 4,170 206 C

St. Lucie County 2-108 June 2018 Comprehensive Plan Transportation Element DIA
ROADWAY NAME FROM TO
ROAD- WAY TYPE
ADOPT- ED LOS
2040 AADT
2040 PEAK HOUR VOL- UME
2040 LOS
MIDWAY RD EAST TORINO PKWY MILNER DR 4D E 28,044 1413 C
MIDWAY RD MILNER DR W OF SELVITZ RD 4D E 27,807 1404 C
MIDWAY RD CHRISTENSEN RD 25TH ST 4D E 22,925 1155 D
MIDWAY RD US 1 WALLACE ST 2U E 10,189 514 D
MORNINGSIDE BLVD PORT ST LUCIE BLVD LYNGATE DR 2D D 7,914 392 C
MORNINGSIDE BLVD WESTMORELAND BLVD PORT ST LUCIE BLVD 2D D 6,419 318 C
N KINGS HWY KINGS HWY NORTH BLVD 2U D 4,231 213 C
NEBRASKA AVE 25TH ST 13TH ST 4D D 1,847 93 C
NEWELL RD SHINN RD MCCARTY RD 4D D 519 26 C
NEWELL RD MCCARTY RD ARTERIAL A 4D D 223 11 C
NORTH BLVD N KINGS HWY EMERSON AVE 2U D 1,321 67 C
N-S ROAD A CROSSTOWN PKWY TRADITION PKWY 4D C 10,878 548 C
N-S ROAD A TRADITION PKWY STONY CREEK WAY 4D C 1,611 112 C
N-S ROAD A STONY CREEK WAY DISCOVERY WAY 4D C 2,736 112 C
N-S ROAD A OPEN VIEW (WEST) PAAR (WEST) 4D C 892 45 C
N-S ROAD A DISCOVERY WAY OPEN VIEW (WEST) 4D C 2,228 112 C
N-S ROAD A PAAR (WEST) BECKER RD 4D C 2,898 146 C
N-S ROAD B BECKER RD PAAR DR (WEST) 4D D 1,209 61 C
N-S ROAD B PAAR DR (WEST) OPEN VIEW (WEST) 4D D 2,734 138 C
N-S ROAD B OPEN VIEW (WEST) E-W ROAD 2 4D D 535 27 C

St. Lucie County 2-109 June 2018 Comprehensive Plan Transportation Element DIA
ROADWAY NAME FROM TO
ROAD- WAY TYPE
ADOPT- ED LOS
2040 AADT
2040 PEAK HOUR VOL- UME
2040 LOS
N-S ROAD B E-W ROAD 2 DISCOVERY WAY 4D D 860 43 C
OAKRIDGE DR MOUNTWELL ST OAKLYN ST 2U D 10,043 497 D
OHIO AVE SUNRISE BLVD COLONIAL RD 2U D 2,675 79 C
OHIO AVE COLONIAL RD US 1 2U D 1,575 79 C
OKEECHOBEE RD GEORGIA AVE DELAWARE AVE 4D E 14,155 713 D
OKEECHOBEE RD 25TH ST GEORGIA AVE 4D E 15,357 774 D
OKEECHOBEE RD 33RD ST 25TH ST 4D E 16,739 844 D
OKEECHOBEE RD IDEAL HOLDING RD HEADER CANAL RD 4D C 9,249 458 B
OKEECHOBEE RD HEADER CANAL RD MIDWAY RD 4D C 9,876 489 B
OKEECHOBEE RD MCCARTY RD FLORIDAS TURNPIKE 4D D 9,288 460 B
OKEECHOBEE RD MIDWAY RD SHINN RD 4D D 4,448 220 B
OKEECHOBEE RD FLORIDAS TURNPIKE KINGS HWY 4D D 11,094 549 B
OKEECHOBEE RD CROSSROADS PKWY I-95 8D D 33,326 1680 C
OKEECHOBEE RD VIRGINIA AVE HARTMAN RD 4D E 27,206 1371 D
OKEECHOBEE RD I-95 JENKINS RD 8D D 62,649 3158 C
OKEECHOBEE RD 35TH ST 33RD ST 4D E 17,616 888 D
OKEECHOBEE RD HARTMAN RD 35TH ST 4D E 13,334 888 D
OKEECHOBEE RD JENKINS RD MCNEIL RD 8D D 53,820 2713 C
OKEECHOBEE RD MCNEIL RD VIRGINIA AVE 6D D 52,715 2657 C
OKEECHOBEE RD OKEECHOBEE C.L. BLUEFIELD RD 4D C 6,596 345 B

St. Lucie County 2-110 June 2018 Comprehensive Plan Transportation Element DIA
ROADWAY NAME FROM TO
ROAD- WAY TYPE
ADOPT- ED LOS
2040 AADT
2040 PEAK HOUR VOL- UME
2040 LOS
OKEECHOBEE RD BLUEFIELD RD CARLTON RD 4D C 6,698 350 B
OKEECHOBEE RD CARLTON RD SNEED RD 4D C 7,349 364 B
OKEECHOBEE RD SHINN RD MCCARTY RD 4D D 6,603 327 B
OKEECHOBEE RD KINGS HWY CROSSROADS PKWY 8D D 26,436 1332 C
OKEECHOBEE RD SNEED RD IDEAL HOLDING RD 4D C 8,757 433 B
OLD DIXIE HWY SR A1A NORTH ST LUCIE BLVD 2U D 159 8 C
OLD DIXIE HWY US 1 SR A1A NORTH 2U D 6,694 337 C
OLD DIXIE HWY INDRIO RD INDIAN RIVER C.L. 2U D 1,910 95 B
OLD DIXIE HWY ST LUCIE BLVD INDRIO RD 2U D 182 9 C
OLEANDER AVE BEACH AVE KITTERMAN RD 2U D 1,758 89 C
OLEANDER AVE VIRGINIA AVE SUNRISE BLVD 2U E 5,252 265 C
OLEANDER AVE BELL AVE FARMERS MARKET RD 2U E 7,681 430 D
OLEANDER AVE FARMERS MARKET RD EDWARDS RD 2U E 8,540 430 D
OLEANDER AVE EDWARDS RD WISTERIA AVE 2U E 9,543 481 D
OLEANDER AVE GARDENIA AVE VIRGINIA AVE 2U E 10,837 546 D
OLEANDER AVE KITTERMAN RD MIDWAY RD 2U E 5,551 280 C
OLEANDER AVE MIDWAY RD WEATHERBEE RD 2U E 7,843 395 D
OLEANDER AVE WEATHERBEE RD BELL AVE 2U E 7,765 430 D
OLEANDER AVE WISTERIA AVE GARDENIA AVE 2U E 9,482 546 D
OPEN VIEW DR (WEST) VILLAGE PKWY COMMUNITY BLVD 4D D 2,127 107 C

St. Lucie County 2-111 June 2018 Comprehensive Plan Transportation Element DIA
ROADWAY NAME FROM TO
ROAD- WAY TYPE
ADOPT- ED LOS
2040 AADT
2040 PEAK HOUR VOL- UME
2040 LOS
OPEN VIEW DR (WEST) COMMUNITY BLVD N-S ROAD B 4D D 7,726 389 C
OPEN VIEW DR (WEST) N-S ROAD B N-S ROAD A 4D D 3,980 69 C
OPEN VIEW DR (WEST) N-S ROAD A RANGE LINE RD 4D D 1,371 69 C
ORANGE AVE JENKINS RD HARTMAN RD 4D D 20,775 1047 C
ORANGE AVE HARTMAN RD ANGLE RD 4D D 20,369 1027 C
ORANGE AVE CAMPBELL RD KINGS HWY 2U E 11,329 561 C
ORANGE AVE 7TH ST US 1 2U D 3,504 177 C
ORANGE AVE ANGLE RD 25TH ST 4D D 16,546 834 D
ORANGE AVE KINGS HWY I-95 4D D 31,554 1590 C
ORANGE AVE I-95 JENKINS RD 4D D 20,522 1034 C
ORANGE AVE HEADER CANAL RD SHINN RD 2U E 4,015 199 B
ORANGE AVE SNEED RD HEADER CANAL RD 2U E 3,724 195 B
ORANGE AVE OKEECHOBEE C.L. SNEED RD 2U E 4,478 234 B
ORANGE AVE 2ND ST INDIAN RIVER DR 2U D 1,232 62 C
ORANGE AVE US 1 2ND ST 2U D 3,607 182 C
ORANGE AVE 25TH ST 17TH ST 4D D 12,406 625 D
ORANGE AVE 17TH ST 13TH ST 4D D 15,535 783 D
ORANGE AVE 13TH ST 10TH ST 2U D 8,951 451 C
ORANGE AVE 10TH ST 7TH ST 2U D 6,648 335 C
ORANGE AVE SHINN RD CAMPBELL RD 2U E 5,734 284 B

St. Lucie County 2-112 June 2018 Comprehensive Plan Transportation Element DIA
ROADWAY NAME FROM TO
ROAD- WAY TYPE
ADOPT- ED LOS
2040 AADT
2040 PEAK HOUR VOL- UME
2040 LOS
PAAR DR ROSSER BLVD SAVONA BLVD 2U D 5,142 255 C
PAAR DR SAVONA BLVD PORT ST LUCIE BLVD 2U D 9,284 460 C
PAAR DR PORT ST LUCIE BLVD DARWIN BLVD 2U D 4,714 233 C
PAAR DR DARWIN BLVD TULIP BLVD 2U D 1,974 99 C
PAAR DR (WEST) VILLAGE PKWY COMMUNITY BLVD 4D D 1,329 67 C
PAAR DR (WEST) COMMUNITY BLVD N-S ROAD B 4D D 3,372 170 C
PAAR DR (WEST) N-S ROAD B N-S ROAD A 4D D 580 54 C
PAAR DR (WEST) N-S ROAD A RANGE LINE RD 4D D 1,073 54 C
PEACHTREE BLVD SELVITZ RD ST JAMES DR 2U D 6,268 310 C
PEACOCK BLVD CALIFORNIA BLVD CASHMERE BLVD 2U D 4,369 216 C
PEACOCK BLVD UNIVERSITY BLVD CALIFORNIA BLVD 2U D 12,048 596 C
PEACOCK BLVD ST LUCIE WEST BLVD UNIVERSITY BLVD 4D D 22,364 1127 C
PETERSON RD BENT CREEK DR HARTMAN RD 2U D 5,850 295 D
PICOS RD CAMPBELL RD KINGS HWY 2U D 420 21 C
PORT ST LUCIE BLVD DEL RIO BLVD CAMEO BLVD 6D E 63,062 3178 F
PORT ST LUCIE BLVD GATLIN BLVD DEL RIO BLVD 6D E 61,357 3092 F
PORT ST LUCIE BLVD MORNINGSIDE BLVD US 1 6D D 53,114 2677 C
PORT ST LUCIE BLVD VETERANS MEMORIAL PKWY MORNINGSIDE BLVD 6D D 50,148 2527 C
PORT ST LUCIE BLVD FLORESTA DR VETERANS MEMORIAL PKWY 6D D 71,764 3617 C
PORT ST LUCIE BLVD DARWIN BLVD GATLIN BLVD 4D E 47,279 2383 C
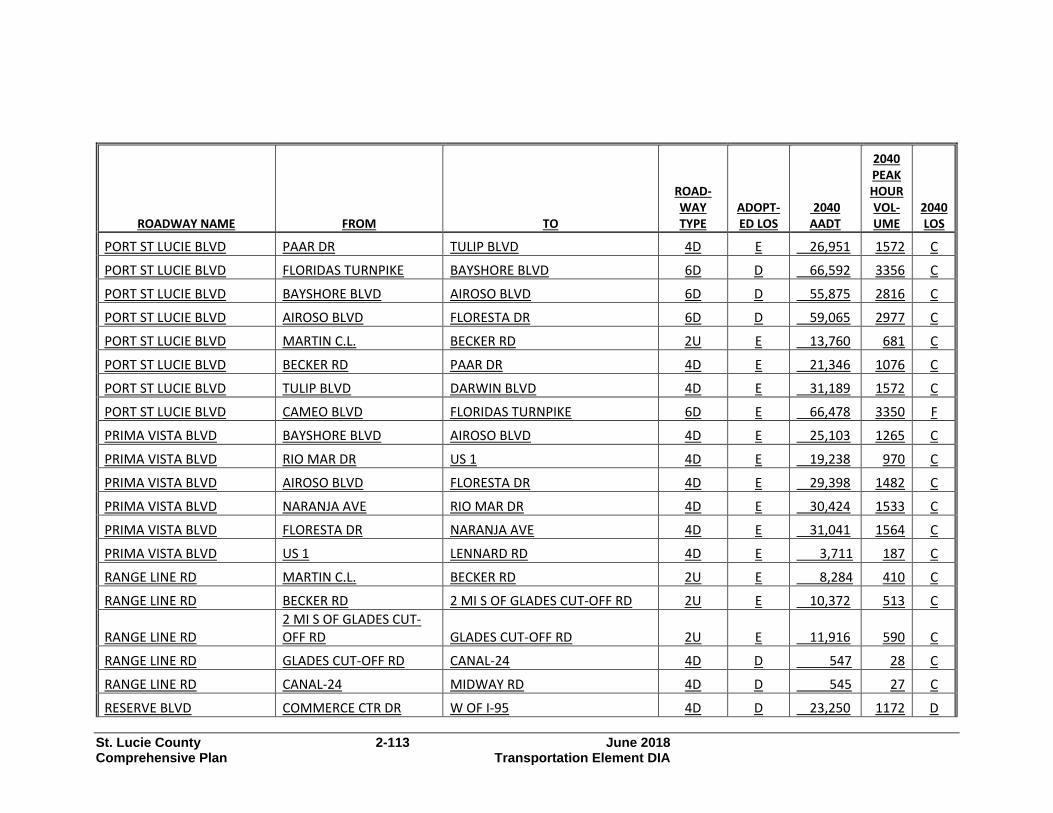
St. Lucie County 2-113 June 2018 Comprehensive Plan Transportation Element DIA
ROADWAY NAME FROM TO
ROAD- WAY TYPE
ADOPT- ED LOS
2040 AADT
2040 PEAK HOUR VOL- UME
2040 LOS
PORT ST LUCIE BLVD PAAR DR TULIP BLVD 4D E 26,951 1572 C
PORT ST LUCIE BLVD FLORIDAS TURNPIKE BAYSHORE BLVD 6D D 66,592 3356 C
PORT ST LUCIE BLVD BAYSHORE BLVD AIROSO BLVD 6D D 55,875 2816 C
PORT ST LUCIE BLVD AIROSO BLVD FLORESTA DR 6D D 59,065 2977 C
PORT ST LUCIE BLVD MARTIN C.L. BECKER RD 2U E 13,760 681 C
PORT ST LUCIE BLVD BECKER RD PAAR DR 4D E 21,346 1076 C
PORT ST LUCIE BLVD TULIP BLVD DARWIN BLVD 4D E 31,189 1572 C
PORT ST LUCIE BLVD CAMEO BLVD FLORIDAS TURNPIKE 6D E 66,478 3350 F
PRIMA VISTA BLVD BAYSHORE BLVD AIROSO BLVD 4D E 25,103 1265 C
PRIMA VISTA BLVD RIO MAR DR US 1 4D E 19,238 970 C
PRIMA VISTA BLVD AIROSO BLVD FLORESTA DR 4D E 29,398 1482 C
PRIMA VISTA BLVD NARANJA AVE RIO MAR DR 4D E 30,424 1533 C
PRIMA VISTA BLVD FLORESTA DR NARANJA AVE 4D E 31,041 1564 C
PRIMA VISTA BLVD US 1 LENNARD RD 4D E 3,711 187 C
RANGE LINE RD MARTIN C.L. BECKER RD 2U E 8,284 410 C
RANGE LINE RD BECKER RD 2 MI S OF GLADES CUT-OFF RD 2U E 10,372 513 C
RANGE LINE RD 2 MI S OF GLADES CUT-OFF RD GLADES CUT-OFF RD 2U E 11,916 590 C
RANGE LINE RD GLADES CUT-OFF RD CANAL-24 4D D 547 28 C
RANGE LINE RD CANAL-24 MIDWAY RD 4D D 545 27 C
RESERVE BLVD COMMERCE CTR DR W OF I-95 4D D 23,250 1172 D

St. Lucie County 2-114 June 2018 Comprehensive Plan Transportation Element DIA
ROADWAY NAME FROM TO
ROAD- WAY TYPE
ADOPT- ED LOS
2040 AADT
2040 PEAK HOUR VOL- UME
2040 LOS
RIO MAR DR BEACH AVE US 1 2U D 10,396 524 D
RIO MAR DR PRIMA VISTA BLVD BEACH AVE 2U D 11,098 559 D
ROSSER BLVD PAAR DR ANDALUSIA RD 2U D 5,508 273 C
ROSSER BLVD ANDALUSIA RD GATLIN BLVD 4D D 12,268 618 C
SAEGER AVE CITRUS AVE US 1 2U D 542 27 C
SAVAGE BLVD GATLIN BLVD GALIANO RD 2U D 4,524 224 C
SAVANNAH RD US 1 INDIAN RIVER DR 2U D 4,656 235 C
SAVONA BLVD GATLIN BLVD CALIFORNIA BLVD 2U E 14,622 737 E
SAVONA BLVD PAAR DR GATLIN BLVD 2U E 9,923 500 D
SAVONA BLVD BECKER RD PAAR DR 2U E 12,776 644 D
SELVITZ RD GLADES CUT-OFF RD EDWARDS RD 2U E 15,653 789 F
SELVITZ RD BAYSHORE BLVD ST JAMES BLVD 2U E 9,397 474 D
SELVITZ RD MIDWAY RD GLADES CUT-OFF RD 2U E 9,865 488 C
SELVITZ RD ST JAMES BLVD MIDWAY RD 2U E 10,637 536 D
SHINN RD OKEECHOBEE RD ORANGE AVE 2U D 2,116 105 B
SHINN RD MIDWAY RD OKEECHOBEE RD 2U D 3,633 180 B
SHINN RD MIDWAY RD WILLIAMS RD 4D D 1,056 54 C
SHINN RD E-W ROAD 6 GLADES CUT-OFF RD 4D D 1,044 54 C
SHINN RD WILLIAMS RD E-W ROAD 6 4D D 1,023 52 C
SNEED RD OKEECHOBEE RD ORANGE AVE 2U D 1,546 81 B

St. Lucie County 2-115 June 2018 Comprehensive Plan Transportation Element DIA
ROADWAY NAME FROM TO
ROAD- WAY TYPE
ADOPT- ED LOS
2040 AADT
2040 PEAK HOUR VOL- UME
2040 LOS
SOUTHBEND BLVD BECKER RD FLORESTA DR 2U E 11,475 578 D
SR A1A NORTH SHOREWINDS DR INDIAN RIVER C.L. 2U D 6,495 322 B
SR A1A NORTH OLD DIXIE HWY N HWY A1A 2U D 13,806 683 C
SR A1A NORTH US 1 OLD DIXIE HWY 2U D 9,252 458 C
SR A1A SOUTH BLUE HERON BLVD SEAWAY DR 2U D 11,448 567 C
SR A1A SOUTH MARTIN C.L. NETTLES ISLAND 2U D 14,323 709 C
SR A1A SOUTH NETTLES ISLAND FPL PLANT 2U D 7,582 375 B
SR A1A SOUTH INDIAN RIVER DR US 1 4D D 14,376 725 D
SR A1A SOUTH FPL PLANT BLUE HERON BLVD 2U D 4,331 214 B
SR A1A SOUTH OCEAN DR BINNEY DR 2U D 14,542 733 F
SR A1A SOUTH SOUTH CAUSEWAY PARK INDIAN RIVER DR 4U D 17,654 890 D
SR A1A SOUTH BINNEY DR SOUTH CAUSEWAY PARK 2U D 17,654 890 F
ST JAMES BLVD SELVITZ RD ST JAMES DR 2U D 5,248 264 C
ST JAMES DR TELFORD AVE MIDWAY RD 4D E 18,486 932 C
ST JAMES DR AIROSO BLVD ST JAMES BLVD 4D E 18,110 913 C
ST JAMES DR ST JAMES BLVD PEACHTREE BLVD 4D E 21,365 1077 C
ST JAMES DR PEACHTREE BLVD TELFORD AVE 4D E 16,497 932 C
ST LUCIE BLVD KINGS HWY KEEN RD 2U E 5,671 281 C
ST LUCIE BLVD KEEN RD 25TH ST 2U E 4,826 239 C
ST LUCIE BLVD SENECA AVE US 1 2U D 3,360 169 C

St. Lucie County 2-116 June 2018 Comprehensive Plan Transportation Element DIA
ROADWAY NAME FROM TO
ROAD- WAY TYPE
ADOPT- ED LOS
2040 AADT
2040 PEAK HOUR VOL- UME
2040 LOS
ST LUCIE BLVD 25TH ST SENECA AVE 2U D 5,217 263 C
ST LUCIE BLVD US 1 OLD DIXIE HWY 2U D 145 7 C
ST LUCIE WEST BLVD CASHMERE BLVD BAYSHORE BLVD 6D E 52,465 2644 C
ST LUCIE WEST BLVD E OF I-95 CALIFORNIA BLVD 6D E 55,599 2802 D
ST LUCIE WEST BLVD COUNTRY CLUB DR CASHMERE BLVD 6D E 40,013 2017 C
ST LUCIE WEST BLVD CALIFORNIA BLVD COUNTRY CLUB DR 6D E 37,450 1887 C
ST LUCIE WEST BLVD W OF I-95 E OF I-95 4D E 49,959 2518 F
STONY CREEK WAY RANGE LINE RD N-S ROAD A 4D D 4,588 231 C
STONY CREEK WAY N-S ROAD A TRADITION PKWY 4D D 5,712 288 C
SUNRISE BLVD VIRGINIA AVE OLEANDER AVE 2U D 4,643 234 C
SUNRISE BLVD BELL AVE EDWARDS RD 2U D 4,102 207 C
SUNRISE BLVD EDWARDS RD CORTEZ BLVD 2U D 2,342 118 C
SUNRISE BLVD MIDWAY RD BELL AVE 2U D 2,793 141 C
SUNRISE BLVD OLEANDER AVE 7TH ST 2D E 7,420 374 C
SUNRISE BLVD CORTEZ BLVD VIRGINIA AVE 2U D 3,543 179 C
SUNRISE BLVD 7TH ST US 1 2D E 2,703 136 C
TAYLOR DAIRY RD ANGLE RD ST LUCIE BLVD 2U E 704 35 C
THORNHILL DR BAYSHORE BLVD FLORESTA DR 2U D 11,117 550 C
TIFFANY AVE HILLMOOR DR VILLAGE GREEN DR 4D D 7,904 391 C
TIFFANY AVE VILLAGE GREEN DR LENNARD RD 4D D 7,763 391 C

St. Lucie County 2-117 June 2018 Comprehensive Plan Transportation Element DIA
ROADWAY NAME FROM TO
ROAD- WAY TYPE
ADOPT- ED LOS
2040 AADT
2040 PEAK HOUR VOL- UME
2040 LOS
TIFFANY AVE US 1 HILLMOOR DR 4D D 10,467 528 C
TORINO PKWY VOLUCIA DR CALIFORNIA BLVD 2U E 4,908 243 C
TORINO PKWY CALIFORNIA BLVD EAST TORINO PKWY 2U D 3,510 174 C
TORINO PKWY CASHMERE BLVD VOLUCIA DR 2U E 6,888 341 C
TRADITION PKWY STONY CREEK WAY COMMUNITY BLVD 4D E 20,030 1200 D
TRADITION PKWY VILLAGE PKWY W OF I-95 6D E 64,165 3234 C
TRADITION PKWY COMMUNITY BLVD VILLAGE PKWY 4D E 23,815 1200 D
TRADITION PKWY N-S ROAD A STONY CREEK WAY 4D E 13,030 657 D
TRADITION PKWY RANGE LINE RD N-S ROAD A 4D E 5,886 657 D
TULIP BLVD DARWIN BLVD PORT ST LUCIE BLVD 2U D 4,474 225 C
TULIP BLVD PORT ST LUCIE BLVD PAAR DR 2U D 7,380 372 D
TULIP BLVD PAAR DR DARWIN BLVD 2U D 2,974 150 D
US 1 AVENUE H OLD DIXIE HWY 4D D 29,115 1525 C
US 1 EASY ST MIDWAY RD 6D D 41,435 2088 C
US 1 TIFFANY AVE WALTON RD 6D D 52,214 2632 C
US 1 KINGS HWY INDIAN RIVER C.L. 4D D 38,035 1917 C
US 1 INDRIO RD KINGS HWY 4D D 27,485 1385 C
US 1 25TH ST INDRIO RD 4D D 35,694 1799 C
US 1 ST LUCIE BLVD 25TH ST 4D D 25,654 1293 C
US 1 SR A1A NORTH JUANITA AVE 4D D 31,818 1354 C

St. Lucie County 2-118 June 2018 Comprehensive Plan Transportation Element DIA
ROADWAY NAME FROM TO
ROAD- WAY TYPE
ADOPT- ED LOS
2040 AADT
2040 PEAK HOUR VOL- UME
2040 LOS
US 1 JUANITA AVE ST LUCIE BLVD 4D D 26,872 1354 C
US 1 AVENUE D SR A1A SOUTH 4D D 13,269 669 C
US 1 ORANGE AVE AVENUE A 4D D 13,256 668 C
US 1 DELAWARE AVE CITRUS AVE 4D D 17,982 906 D
US 1 CITRUS AVE ORANGE AVE 4D D 14,314 721 D
US 1 GEORGIA AVE DELAWARE AVE 4D D 17,696 892 D
US 1 GARDENIA AVE VIRGINIA AVE 4D D 35,758 1802 C
US 1 EDWARDS RD SAVANNAH RD 4D D 34,503 1739 C
US 1 FARMERS MARKET RD EDWARDS RD 4D D 35,514 1790 C
US 1 MIDWAY RD WEATHERBEE RD 4D D 33,034 1665 C
US 1 WEATHERBEE RD FARMERS MARKET RD 4D D 35,011 1765 C
US 1 PRIMA VISTA BLVD RIO MAR DR 6D D 41,008 2067 C
US 1 RIO MAR DR KITTERMAN RD 6D D 48,407 2440 C
US 1 JENNINGS RD TIFFANY AVE 6D D 49,265 2483 C
US 1 PORT ST LUCIE BLVD JENNINGS RD 6D D 47,050 2371 C
US 1 LENNARD RD PORT ST LUCIE BLVD 8D D 73,784 3719 C
US 1 MARTIN C.L. LENNARD RD 8D D 79,851 4024 C
US 1 OLD DIXIE HWY AVENUE O 4D D 23,284 1525 C
US 1 AVENUE O SR A1A NORTH 4D D 30,251 1525 C
US 1 AE BACKUS AVE AVENUE D 4D D 14,175 714 C

St. Lucie County 2-119 June 2018 Comprehensive Plan Transportation Element DIA
ROADWAY NAME FROM TO
ROAD- WAY TYPE
ADOPT- ED LOS
2040 AADT
2040 PEAK HOUR VOL- UME
2040 LOS
US 1 AVENUE A AE BACKUS AVE 4D D 13,369 674 C
US 1 KITTERMAN RD S OF SAEGER AVE 6D D 46,252 2318 C
US 1 S OF SAEGER AVE EASY ST 6D D 45,991 2318 C
US 1 OHIO AVE GEORGIA AVE 4D D 17,170 865 D
US 1 VIRGINIA AVE OHIO AVE 4D D 16,573 835 C
US 1 WALTON RD VILLAGE GREEN DR 6D D 60,106 3029 C
US 1 VILLAGE GREEN DR SPANISH LAKES BLVD 6D D 50,099 2525 C
US 1 SPANISH LAKES BLVD PRIMA VISTA BLVD 6D D 49,632 2501 C
US 1 SAVANNAH RD GARDENIA AVE 4D D 35,929 1811 C
US 1 SR A1A SOUTH AVENUE H 4D D 24,747 1247 C VETERANS MEMORIAL PKWY LYNGATE DR US 1 4D E 7,552 381 C VETERANS MEMORIAL PKWY PORT ST LUCIE BLVD LYNGATE DR 4D E 11,970 603 C
VILLAGE GREEN DR US 1 WALTON RD 4D D 16,443 829 C
VILLAGE GREEN DR WALTON RD TIFFANY AVE 2U D 5,325 264 C
VILLAGE PKWY OPEN VIEW (WEST) DISCOVERY WAY 4D E 20,046 1010 D
VILLAGE PKWY TRADITION PKWY WESTCLIFFE LN 4D E 10,879 548 C
VILLAGE PKWY WESTCLIFFE LN CROSSROADS PKWY 4D E 7,441 375 C
VILLAGE PKWY DISCOVERY WAY TRADITION PKWY 6D E 35,532 1791 D
VILLAGE PKWY BECKER RD PAAR (WEST) 4D E 15,183 765 D

St. Lucie County 2-120 June 2018 Comprehensive Plan Transportation Element DIA
ROADWAY NAME FROM TO
ROAD- WAY TYPE
ADOPT- ED LOS
2040 AADT
2040 PEAK HOUR VOL- UME
2040 LOS
VILLAGE PKWY PAAR (WEST) OPEN VIEW (WEST) 4D E 17,044 859 D
VIRGINIA AVE SUNRISE BLVD OLEANDER AVE 6D D 32,653 1646 C
VIRGINIA AVE 25TH ST 13TH ST 6D D 40,181 2025 C
VIRGINIA AVE 13TH ST 11TH ST 6D D 39,341 1905 C
VIRGINIA AVE 11TH ST SUNRISE BLVD 6D D 37,807 1905 C
VIRGINIA AVE OLEANDER AVE COLONIAL RD 6D D 23,424 1262 C
VIRGINIA AVE COLONIAL RD US 1 6D D 25,047 1262 C
VIRGINIA AVE HARTMAN RD 35TH ST 6D D 37,249 1877 C
VIRGINIA AVE 35TH ST 25TH ST 6D D 34,083 1718 C
VIRGINIA AVE OKEECHOBEE RD HARTMAN RD 6D D 37,249 1877 C
VOLUCIA DR TORINO PKWY BLANTON BLVD 2U D 5,469 276 C
WALTON RD US 1 VILLAGE GREEN DR 4D E 4,700 237 C
WALTON RD VILLAGE GREEN DR LENNARD RD 4D E 13,152 663 C
WALTON RD LENNARD RD GREEN RIVER PKWY 2U E 12,476 618 C
WALTON RD GREEN RIVER PKWY INDIAN RIVER DR 2U E 9,594 475 C
WEATHERBEE RD US 1 MIDWAY RD 2U D 3,928 198 C
WEATHERBEE RD OLEANDER AVE US 1 2U D 8,111 409 D
WESTCLIFFE LN TREMONTE AVE VILLAGE PKWY 4D D 3,928 198 C
WESTMORELAND BLVD MORNINGSIDE BLVD PORT ST LUCIE BLVD 2D D 10,894 539 C
WESTMORELAND BLVD MARTIN C.L. MORNINGSIDE BLVD 2D D 12,739 631 C
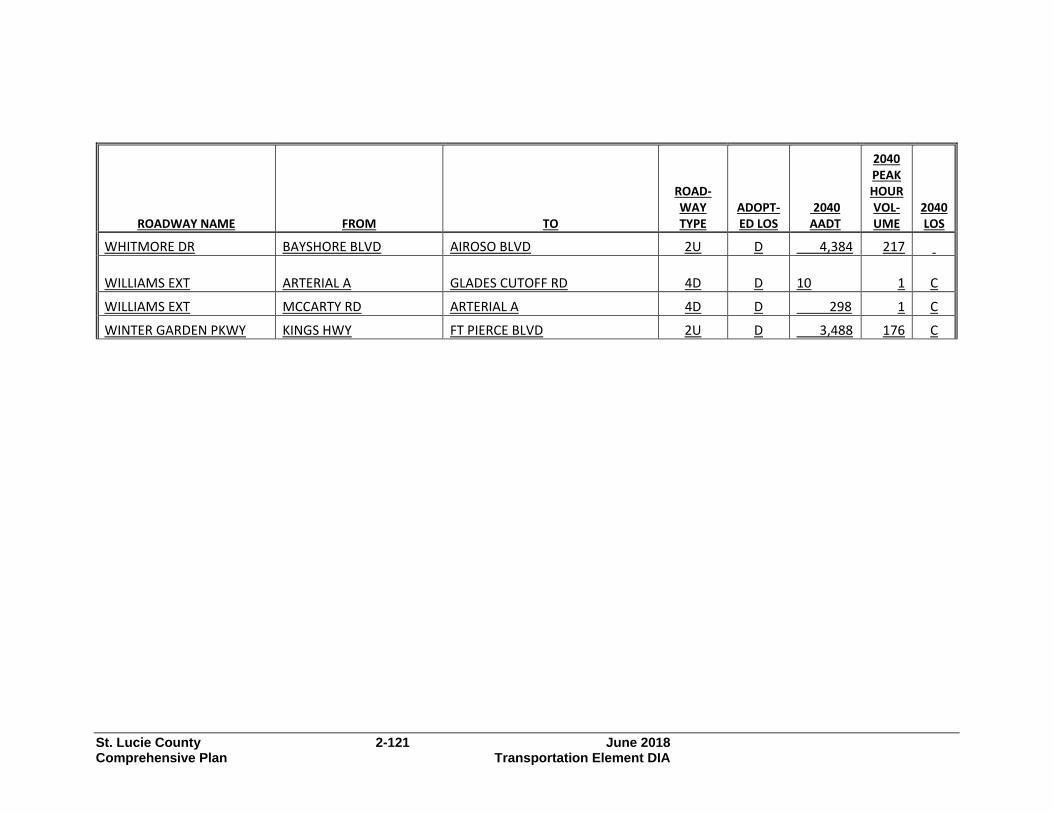
St. Lucie County 2-121 June 2018 Comprehensive Plan Transportation Element DIA
ROADWAY NAME FROM TO
ROAD- WAY TYPE
ADOPT- ED LOS
2040 AADT
2040 PEAK HOUR VOL- UME
2040 LOS
WHITMORE DR BAYSHORE BLVD AIROSO BLVD 2U D 4,384 217
WILLIAMS EXT ARTERIAL A GLADES CUTOFF RD 4D D 10 1 C
WILLIAMS EXT MCCARTY RD ARTERIAL A 4D D 298 1 C
WINTER GARDEN PKWY KINGS HWY FT PIERCE BLVD 2U D 3,488 176 C
St. Lucie County 2-122 June 2018 Comprehensive Plan Transportation Element DIA
The Towns, Villages and Countryside (TVC) Area Traffic Study
St. Lucie County has adopted the Towns, Villages and Countryside Element as well as the development review requirements for the TVC area. The TVC area starts from east of the Turnpike to west of Kings Highway in the northern part of the county. A long term transportation analysis prepared in 2006 evaluated the roadway capacities and identified the required improvements to support the transportation infrastructure to meet the needs of proposed land uses. The traffic analysis showed that the roadways will be operating at an acceptable level of service with the land use changes and related roadway improvements in future conditions. The study used the Treasure Coast Regional Planning Model (TCRPM) which also accounted for internal capture. In the study, the future TCRPM travel demand model was revised and additional Traffic Analysis Zone (TAZ) socioeconomic data was included to reflect future 2030 and 2050 conditions. The following roadways within the TVC area were identified as deficient roadways in 2030 conditions without improvements:
• CR 603/ Johnston Road from 25th Street to SR 614/ Indrio Road • SR 713/ Kings Highway from US-1 to Angle Road • SR 614/ Indrio Road from I-95 to CR 603/ Johnston Road • Immokolee Road from CR 607/ Emerson Avenue to SR 713/ Kings Highway • SR 608/ St. Lucie Boulevard from SR 713/ Kings Highway to CR 611
To address the deficiencies in the Year 2030, two new flyovers at I-95 north and south of Indrio Road were identified. Other roadway improvements identified for the 2050 conditions are listed below:
• New Connector Road from Emerson Road to I-95 • New Connector Road from I-95 to Florida Turnpike • New Interchange at I-95 and New Connector Road • New Interchange at Florida Turnpike and New Connector Road
The future travel demand model was run with the above proposed roadway improvements for future analysis in the study area and it was illustrated that all the deficient roadways will be operating within capacity. TRANSIT Recognizing that it may not be fiscally possible to construct all of the projects shown in the 2030 Transportation Plan, if the community is to maintain a reasonable degree of mobility for its residents, alternatives to the traditional road building approach must be considered. These alternatives include expanded intra-county transit services, expanded inter-county/regional transit services, the development of expanded non-motorized means of travel and a re-evaluation of the basic land use development patterns in the community. St. Lucie County and Martin County have recently worked together to complete a Regional Transit Development Plan for the Port St. Lucie Urbanized Area. The final plan was adopted in September 2009. The Regional Transit Development Plan evaluated the

St. Lucie County 2-123 June 2018 Comprehensive Plan Transportation Element DIA
existing transit network and prepared future transit alternatives. Seven different scenarios were run for the existing route network. Scenario One: Grow the base existing system to 2019 with no service improvements. This scenario does not add any additional transit services to the public by 2019. However, annual passenger trips will increase by 48 percent over the 2009 ridership trips. Additionally, the overall efficiency would increase from 4 to 6 passengers per revenue hour. Scenario Two: Bring all existing system routes to a frequency of one bus every 30 minutes. During the public involvement process, the community consistently desired less waiting times. The main disadvantage of this scenario is the cost of doubling the existing busses in circulation to reduce the frequency in half. Scenario Three: Add Saturday service to all base system routes. The Saturday service would operate from 7:00 am to 6:00 pm with one hour frequencies for all bus routes. The cost of weekend service is considerably less than weekday improvements since there are only 52 Saturdays in a year. The increase in ridership for this scenario would be 21,900 annual passenger trips. Scenario Four: Add Saturday and Sunday service to all base system routes. This scenario is similar to Scenario Three with the addition of Sunday bus routes from 7:00 am to 6:00 pm with one hour frequencies. The anticipated increase in ridership for Sundays is 12,300 annual passenger trips. Scenario Five: Increase the service hours for all base system routes from 6:00 am to 10:00 pm. The additional five hours of service resulted in the highest single ridership increase of the model runs. The cost of this improvement is comparable to the cost of adding the weekend service. Scenario Six: Bring all base system routes to a frequency of one bus every 30 minutes on weekdays and add Saturday and Sunday service with a frequency of one bus every 60 minutes. This scenario is a combination of Scenarios Two and Four and is the final model run for improvements to the existing system. The anticipated ridership increase from the model was 340,000 annual passenger trips. However, the frequency and weekend improvements do not yield greater results when combined together than each does separately. Scenario Seven: Future Route Network to Address Service Areas. A conceptual fixed route transit network was developed as part of the Transit Development Plan Update. The objectives for the conceptual fixed route transit network are listed below:
• Improve connectivity and customer travel choices by placing transit transfer

St. Lucie County 2-124 June 2018 Comprehensive Plan Transportation Element DIA
centers throughout the Port St. Lucie Urbanized Area; • Provide linkages between transit transfer centers with existing and new bus routes; • Provide greater accessibility to fixed-route bus transit by saturating the service
area and bringing a greater proportion of the population within ¼ mile of a bus route;
• Focus the transit network on US-1 which has the greatest employment base for the urbanized area;
• Provide more connections between Martin and St. Lucie Counties; • Provide greater inter-county connections with Indian River and Palm Beach
Counties; and • Employ transit mobility as a unifying factor for all residents of the Port St. Lucie
Urbanized Area. A total of 16 new routes were developed for the conceptual transit network in St. Lucie and Martin County. However, several infrastructure improvements will be necessary to accommodate the new conceptual routes including the development of transit transfer centers. Transit Transfer Centers Seven transit transfer centers are proposed for the conceptual transit network and are summarized below:
• Fort Pierce Intermodal Center – The Fort Pierce Intermodal Center is planned for a parcel northwest of downtown Ft. Pierce.
• St. Lucie West – The St. Lucie West transit transfer station is proposed to provide regional connections to the western St. Lucie developments such as the Port St. Lucie Annex area and the Tradition DRI.
• Port St. Lucie Community Center – The Port St. Lucie Community Center is located at the corner of Airoso Boulevard and Port St. Lucie Boulevard within Port St. Lucie.
• Treasure Coast Mall – The Treasure Coast Mall is located on US-1 in Martin County just south of the St. Lucie County line.
• Stuart Depot Center – The Stuart Depot Center is located in southwest downtown Stuart.
• Southwest Transit Transfer Station – The Southwest Transit Transfer Station is also proposed to be a park and ride facility on Kanner Highway in Martin County between I-95 and the Florida Turnpike.
• Hobe Sound Transit Transfer Center – The Hobe Sound Transit Transfer Center is proposed to be located on US-1 and Bridge Road in Hobe Sound.
The conceptual 16 new routes developed in the Regional Transit Development Plan will provide better connectivity between transit centers, focus the transit network on US-1, and be accessible to a larger percent of the population than the existing transit network. The Treasure Coast Mall will continue to be the anchor of the conceptual transit network with additional regional connectivity to the transit centers discussed above. The conceptual future transit map along with the high activity destinations and major employers map developed in the Regional Transit Development Plan is included in Figure 2-2.
The St. Lucie County Transit Development Plan FY 2015-FY2024 was adopted in August 2014. A variety of transit projects have been initiated since that time including:

St. Lucie County 2-125 June 2018 Comprehensive Plan Transportation Element DIA
1. Fort Pierce Intermodal Center and Port St. Lucie Community Center bus interconnection facilities;
2. Extended weekday and Saturday service fixed route operating hours; 3. Route 7 Lakewood Park bus route interconnection with Indian River County Go-
Lines. 4. Two-year fare free pilot program eliminating the fare box for the county’s fixed
route and paratransit bus services; 5. Delivery of a supplementary demand response off-hours TD pilot program
providing evening and early morning weekday and Saturday, and all-day Sunday service; and
6. A countywide bike share providing enhanced access to the fixed-route bus system. New service development initiatives are planned for FY18-FY20 including:
1. Route One improved frequency to thirty-minutes; 2. New Ft. Pierce/Port St. Lucie north-south express service; and 3. Port St. Lucie Flex-Microtransit demonstration for the GDC area.
St. Lucie County Transit and the St. Lucie TPO are currently preparing a major update to the county Transit Development Plan (TDP) with a programmed summer, 2019 completion target. This TDP major update comes at an important crossroad for the county public transit system for the following reasons:
1. Demand for public transit service has grown significantly. County transit ridership has more than doubled since the last TDP major update dramatically exceeding county population growth for the same time period;
2. New technological and transit operating systems are being deployed nationwide, including smart mobile device trip reservation and vehicle routing systems, enabling public transit agencies to deliver improved cost-effective and comprehensive mobility strategies;
3. Electric and Autonomous transit vehicles are now entering the public transportation ecosystem;
4. Changing public mobility preferences shifting from private vehicle ownership to transportation services; and
5. Transit agencies are required to identify new revenue sources as the federal government seeks to decrease its share of financial support for public transit as transit agencies work to expand the types of mobility services they deliver.
Figure 2-6 shows the concept transit network. Park and Ride Each of the Transit Transfer Centers identified in the Regional Transit Development Plan TDP can be potentially utilized as a park and ride location.
Figure 2-36 High Activity Destinations and Major Employers with Concept Transit Network

St. Lucie County 2-126 June 2018 Comprehensive Plan Transportation Element DIA
Source: Regional Transit Development Plan, 2009 FY 2015 – FY 2024 Transit Development Plan Major Update 2014
Transit Legend Number Transit Center Name 1 Stuart Depot Center 2 Transit Transfer Center 3 Industrial Park Transit Station 4 Treasure Coast Mall Transit Station 5 Port St. Lucie Community Center Transit Station 6 Saint Lucie West Transit Station 7 Fort Pierce Intermodal Transit Station

St. Lucie County 2-127 June 2018 Comprehensive Plan Transportation Element DIA
Paratransit Alternatives In addition to the alternatives relating to the expansion of the fixed route services, the Regional Transit Development PlanTDP identified two additional alternatives for the paratransit services. The two paratransit service alternatives are the “General Public Dial-A-Ride” and “Ride Request.” General Public Dial-A-Ride This alternative would devote all resources to providing door-to-door services to anyone who requests a ride. The advantage of this alternative is that it targets those individuals who want use the transit system. The main disadvantage to this alternative is that it is significantly more expensive than a fixed route cost per passenger trip. Additionally, since no trip request can be denied, the associated cost could be difficult to control as demand increases. Ride Request This alternative allows the public to request a ride to a local van stationed in a specific geographical zone. The customer can request a trip to a destination within the zone or a trip to a connecting point with a regional fixed route. The van operator can then negotiate a pick up and drop off time with the customer based on demand. The advantage of this alternative is that it can extend transit services into areas where there is not a fixed bus route and it can bring in more customers to the regional transit network. The disadvantage of this alternative is that similarly to the “General Public Dial-A-Ride” alternative, this service can be expensive. Ten-Year Improvement Plan The Florida Department of Transportation (FDOT) now requires that all Transit Development Plan incorporate a program of improvements over a ten year period. The ten year plan requires an annual update of what has and has not been accomplished and allows agencies to make modification of the plan based on the changes to the local conditions of the community. The Regional Transit Development Plan has outlined the following policies and priorities for the Years 2010-2014:
• Continue to pursue regional transit organization opportunities to further unify regional mobility.
• Pursue the single identity of transit in the region including integrated transit name, logo, and color scheme; integration of information materials to include all regional transit services, integrated website for regional transit, integrated bus stops and single toll free number for all regional fixed route and paratransit services.
• Continue to develop the infrastructure needed to accommodate future network growth. Since the Fort Pierce Intermodal Center, the Stuart Depot, and the Southwest Transit Transfer Centers are all currently vacant parcels of land, and Island Crossing Shopping Center is privately owned property, continue to pursue funding, design and construction of these facilities in order to provide passengers with safe, comfortable and state of the art transfer facilities.
• Focus service improvements on the existing system, with span of service improvements on weekdays as the highest priority, implementation of Saturday

St. Lucie County 2-128 June 2018 Comprehensive Plan Transportation Element DIA
and Sunday a medium priority, and frequency improvements a low priority. • Consider new routes as existing funding sources allow, such as the routes that
have been designed in Martin County for the South Stuart Shuttle, Jensen Beach, and Hobe Sound using Job Access/ Reverse Commute (JARC) and New Freedom funds from FTA. Not all of them can be immediately funded within the current available funding.
For Years 2015 – 2019:
• Begin implementing future transit network routes that show the most promise for generating ridership and promoting regional mobility.
• Maintain strategic initiatives for improvements not made in the ten year program of improvements even beyond the future transit network.
Additionally, the Regional Transit Development PlanTDP outlined non-service related initiates over the next ten years:
• Pursue the development of an action plan to guide the development of coordinated transit services in the region.
• Establish one system identity for public transportation services in the region. • Increase local support for fixed route transit services. • Develop a Marketing and Communication Plan. • Increase coordinated public outreach efforts to existing and potential transit users. • Develop a Bus Stop Infrastructure Plan. • Develop and Implement transit transfer centers. • Conduct a fare policy and transfer analysis of inter- and intra-county services in
the region. • Continue the vehicle replacement program and purchase new expansion vehicles. • Develop a performance monitoring program to track the performance of individual
routes. • Continue involvement and cooperation in the transportation planning process. • Support local jurisdictions in adopting transit supportive comprehensive plan
amendments. • Maximize use of the fixed route bus system.

St. Lucie County 2-129 June 2018 Comprehensive Plan Transportation Element DIA