proportioning and properties of ultra-high performance
TRANSCRIPT

Clemson UniversityTigerPrints
All Dissertations Dissertations
12-2015
PROPORTIONING AND PROPERTIES OFULTRA-HIGH PERFORMANCE CONCRETEMIXTURES FOR APPLICATION IN SHEARKEYS OF PRECAST CONCRETE BRIDGESZhengqi LiClemson University, [email protected]
Follow this and additional works at: https://tigerprints.clemson.edu/all_dissertations
Part of the Civil Engineering Commons
This Dissertation is brought to you for free and open access by the Dissertations at TigerPrints. It has been accepted for inclusion in All Dissertations byan authorized administrator of TigerPrints. For more information, please contact [email protected].
Recommended CitationLi, Zhengqi, "PROPORTIONING AND PROPERTIES OF ULTRA-HIGH PERFORMANCE CONCRETE MIXTURES FORAPPLICATION IN SHEAR KEYS OF PRECAST CONCRETE BRIDGES" (2015). All Dissertations. 1565.https://tigerprints.clemson.edu/all_dissertations/1565
i
PROPORTIONING AND PROPERTIES OF ULTRA-HIGH PERFORMANCE
CONCRETE MIXTURES FOR APPLICATION IN SHEAR KEYS OF PRECAST
CONCRETE BRIDGES
A Dissertation
Presented to
the Graduate School of
Clemson University
In Partial Fulfillment
of the Requirements for the Degree
Doctor of Philosophy
Civil Engineering
by
Zhengqi Li
December 2015
Accepted by:
Dr. Prasad Rangaraju, Committee Chair
Dr. Amir Poursaee
Dr. Bradley Putman
Dr. Thomas Cousins
ii
ABSTRACT
Ultra-high performance concrete (UHPC) is defined as a cementitious based
composite material with compressive strengths above 150 MPa, pre-and post-cracking
tensile strengths above 5 MPa, and enhanced durability. To achieve desired properties,
UHPC is typically produced with low water-cementitious materials (w/cm) ratio (i.e.
w/cm < 0.25), high cementitious materials content (i.e. >1000 kg/m3), high quality
aggregate, high dosage of high-range water reducing admixture (HRWRA) and
reinforcing fibers. UHPC has distinct advantages in applications where narrow formwork
and dense reinforcement are inevitable, high compressive strength concrete material is
required and the surrounding environment is aggressive. The construction of shear keys
in precast bridges is one of the important applications for UHPC. Although many
previous research studies have focused on developing UHPC using a range of materials,
evaluating UHPC properties and exploring different application for UHPC, the choice of
commercial UHPC mixture is very limited, proprietary and expensive. This hinders the
widespread use of UHPC in construction.
The principal objective of this study was to investigate the feasibility of
developing UHPC using locally available materials to achieve desirable properties for
application in construction of shear keys in precast bridges.
This study was carried out in three parts. In the first part of the study, each of the
component materials including portland cement, high range water reducing admixtures,
supplementary cementitious materials (SCM), sand and reinforcing fibers was studied,
focusing on their influence on the properties of UHPC under different proportions. The

iii
specific aspects of the component materials studied include different types of high range
water reducing admixtures, sand characteristics, alkali content of portland cement,
different types of supplementary cementitious materials, different types of reinforcing
fibers and the interaction of sand and fibers on the segregation of steel fibers in UHPC
matrix. The investigated properties of UHPC included mixing time to achieve fluid
mixture, workability, setting time, autogenous shrinkage, compressive strength,
tensile/flexural strength, drying shrinkage, rapid chloride permeability, volume of
permeable voids, alkali silica reaction and bulk electrical resistivity. Techniques such as
thermogravimetric analysis, loss-on-ignition (LOI) and scanning electron microscopy
were used to identify and explain the material behavior of UHPC.
Test results from the first part of the study showed that a w/cm of 0.20 was low
enough to produce high quality UHPC mixtures. Low alkali (< 0.7% Na2Oeq) portland
cement was found to be better suited for UHPC than high alkali cement as the latter
resulted in reduction in the workability, compressive strength, and increase in the drying
shrinkage. A powder form Poly-carboxylate ether-based HRWRA, such as Melflux®
4930F, was found to be suitable to produce a self-consolidating UHPC at very low w/cm.
A low carbon (low LOI) silica fume was found to be the ideal SCM compared to fly ash
and meta-kaolin from the consideration of improving the compressive strength and
durability of UHPC. Silica flour was not a necessary component in UHPC, as its only
beneficial effect was to improve the early age compressive strength of UHPC. The
ternary use of meta-kaolin, fly ash and cement could overcome the reduction in the 1-day
compressive strength and the increase in the drying shrinkage due to the binary use of fly

iv
ash and cement, and address the reduction in the workability and the increase in mixing
time due to the binary use of meta-kaolin and cement. Properly proportioned ternary
blend of meta-kaolin, fly ash and cement could produce cementitious paste suitable for
use in UHPC with higher workability, higher 28-day compressive strength and lower
drying shrinkage than a paste containing binary blend of silica fume and cement
particularly when high SCM contents (0.3 and 0.4 by mass of cement) was used. An
optimal proportion of fly ash and meta-kaolin was identified by using the desirability
functions from the considerations of workability, compressive strength, drying shrinkage
and SCM content. Natural siliceous sand with its natural gradation meeting ASTM C33
requirements was suitable for producing UHPC. The increase in the sand content
decreased the workability, drying shrinkage and chloride ion permeability of mortar. It
also reduced the cost of UHPC. Steel micro fibers (SMF) performed better than polyvinyl
alcohol micro fibers (PVAMF) in UHPC formulation, as they could significantly improve
the post-crack tensile strength of hardened UHPC and resulted in less reduction in the
workability of fresh UHPC than PVAMF. Certain minimum sand content (i.e. sand-to-
cementitious materials ratio of 1.25 by mass) was required to prevent severe segregation
of SMF in UHPC. A strong correlation between the bulk electrical resistivity and rapid
chloride ion permeability of UHPC was found in this investigation. This indicated that
the chloride ion permeability results obtained from the rapid chloride ion permeability
method was affected by the bulk electrical resistivity of the specimen.
In the second part of the study, selected component materials and their
proportions were used to produce UHPC mixtures, based on the results in the first part of

v
the study. Chemical admixtures were used to further improve the properties of UHPC.
The test results showed that several UHPC mixtures were developed by adding sand and
SMF at certain proportion into selected cementitious paste formulations (containing silica
fume or containing meta-kaolin and fly ash). The drying shrinkage of UHPC could be
further reduced and without significantly sacrificing the 1-day compressive strength by
combined use of a liquid form shrinkage reducing admixture and a chemical accelerator.
In the third part of the study, the influence of substrate surface roughness, surface
moisture condition, surface cleanliness and surface roughening pattern on the bond
performance between UHPC and precast concrete was investigated. The test results
showed that third-point flexural bond test was an easy and reliable method of evaluating
the bond performance between UHPC and precast concrete, compared to the slant shear
and pull-off test methods. The roughness of the substrate surface of precast concrete
prepared by sandblasting could be evaluated by both sand spread test and laser profiling.
The increase in the roughening duration increased the surface roughness. Adequate bond
between UHPC and precast concrete was achieved as long as the substrate surface of
precast concrete was well roughened and cleaned. The influence of surface moisture
condition (i.e. saturated surface dry and ambient dry) of roughened precast concrete on
the bond performance with UHPC was not significant. Moreover, an adequate bond
between UHPC and precast concrete could be achieved by partly roughening the
substrate surface of precast concrete in the tensile stress zone, instead of roughening the
entire substrate surface.
vi
In conclusion, this dissertation showed that UHPC with desirable material
properties could be manufactured by using locally available materials. The UHPC
mixtures developed in this study exhibited adequate bond with precast concrete, which
was expected to have successful structural performance for the construction of shear keys
in precast bridges.

vii
DEDICATION
I dedicate this dissertation to my parents for their endless inspiration throughout my
education.

viii
ACKNOWLEDGMENTS
I would like to express my gratitude to Dr. Prasad Rangaraju for being my advisor
and offering me financial support during my doctoral studies. I appreciate his
professional knowledge in the field of concrete materials without which I would not have
finished this dissertation. Dr. Prasad Rangaraju has made great effort helping me with the
paper publications, conference presentations and scholarship applications. I would like to
thank other professors who are also members of my committee, Dr. Amir Poursaee, Dr.
Brad Putman and Dr. Thomas Cousins, for the their comments and assistance to finish
this dissertation.
I would like to acknowledge several faculty and staff members at Clemson
University. Dr. Harish Kizhakommudom leaded and trained me to conduct experimental
tests at the initial stage of this research. Dr. Scott Schiff' helped me with the structural
test. Mr. Danny Metz and his team kept the lab equipment in good condition. Mrs.
Kimberly Ivey from the Department of Material Science helped me with the TGA test. I
would like to acknowledge several people outside Clemson University as well. Dr. Ben
Graybeal from Federal Highway Administration and Dr. Jiqiu Yuan from Professional
Service Industries shared their knowledge on the latest structural applications of UHPC
with me. Dr. Kay Wille from the University of Connecticut provided me with valuable
literatures and inspiring comments. Dr. Jason Woodard from Metromont Corporation and
Dr. Zhengsheng Li from Florence Concrete Products shared their field experience on the
constructions of precast bridges with me.

ix
I would like to thank several graduate students, Shubhada Gadkar, Betiglu Jimma,
Trent Dellinger, Kaveh Afshinnia, Hassan Rashidian, Andrew Neptune, David Cousins,
Samuel Johnson, Nathan Schneider and Tao Ruan, for helping me in the lab. I would like
to thank everyone who has helped me indirectly through my research work.
At last, I appreciate the South Carolina Department of Transportation for
providing funding for this research.

x
TABLE OF CONTENTS
Page
TITLE PAGE .................................................................................................................... i
ABSTRACT ..................................................................................................................... ii
DEDICATION ............................................................................................................... vii
ACKNOWLEDGMENTS ............................................................................................ viii
LIST OF TABLES ........................................................................................................ xvi
LIST OF FIGURES ...................................................................................................... xix
CHAPTER
1 INTRODUCTION ............................................................................................... 1
1.1 Background .................................................................................................... 1
1.2 Problem Statement and Research Significance ............................................. 7
1.3 Objective of the Research ............................................................................ 10
1.4 Scope of the Research ...................................................................................11
1.5 Organization of the Dissertation .................................................................. 12
2 LITERATURE REVIEW ................................................................................... 13
2.1 General ......................................................................................................... 13
2.2 Behaviors of Component Materials in Concrete ......................................... 15
2.2.1 Cementitious materials .......................................................................... 15
2.2.2 Inert fillers ............................................................................................. 23
2.2.3 Chemical admixtures ............................................................................. 24
2.2.4 Water ..................................................................................................... 26
2.2.5 Aggregate .............................................................................................. 27
2.2.6 Reinforcing fibers .................................................................................. 29
2.3 Mixing and Curing Methods of UHPC........................................................ 32
2.4 Material Properties of UHPC ...................................................................... 34

xi
Table of Contents (Continued) Page
2.4.1 Workability ............................................................................................ 34
2.4.2 Time of setting ....................................................................................... 35
2.4.3 Compressive strength ............................................................................ 36
2.4.4 Tensile strength...................................................................................... 38
2.4.5 Modulus of elasticity ............................................................................. 41
2.4.6 Bond strength ........................................................................................ 42
2.4.7 Chloride ion permeability ..................................................................... 44
2.4.8 Shrinkage ............................................................................................... 46
2.4.9 Alkali-silica reaction ............................................................................. 47
2.5 Summaries of Literature Review ................................................................. 48
3 MATERIALS AND TEST METHODS ............................................................. 50
3.1 Materials ...................................................................................................... 50
3.1.1 Cementitious materials .......................................................................... 50
3.1.2 Chemical admixtures ............................................................................. 52
3.1.3 Fine aggregate ....................................................................................... 54
3.1.4 Inert filler............................................................................................... 56
3.1.5 Reinforcing micro-fibers ....................................................................... 56
3.1.6 Sodium hydroxide ................................................................................. 57
3.1.7 Precast concrete ..................................................................................... 57
3.2 Test Methods ................................................................................................ 58
3.2.1 Workability ............................................................................................ 58
3.2.2 Time of set ............................................................................................. 58
3.2.3 Density and air content of fresh mixture ............................................... 59
3.2.4 Autogenous shrinkage ........................................................................... 59
3.2.5 Compressive strength ............................................................................ 60
3.2.6 Modulus of elasticity ............................................................................. 60
3.2.7 Flexural strength .................................................................................... 61
3.2.8 Splitting tensile strength ........................................................................ 62
3.2.9 Thermo-gravimetric analysis (TGA) ..................................................... 62
3.2.10 Loss-on-ignition (LOI) ........................................................................ 64
3.2.11 Rapid chloride ion penetration ............................................................ 65

xii
Table of Contents (Continued) Page
3.2.12 Drying shrinkage ................................................................................. 65
3.2.13 Volume of permeable void .................................................................. 65
3.2.14 ASR expansion .................................................................................... 65
3.2.15 Flexural strength loss due to ASR ....................................................... 66
3.2.16 Bulk electrical resistivity of saturated concrete .................................. 66
3.2.17 Bond behavior between UHPC and precast concrete.......................... 67
3.2.18 Sand spread test ................................................................................... 72
3.2.19 Laser profiling ..................................................................................... 73
3.2.20 Scanning electron microscopy (SEM)................................................. 75
3.3 Preparation of Fresh Mixture ....................................................................... 76
3.3.1 Mixing method 1 ................................................................................... 76
3.3.2 Mixing method 2 ................................................................................... 76
3.3.3 Mixing method 3 ................................................................................... 77
3.3.4 Mixing method 4 ................................................................................... 77
4 EXPERIMENTAL PROGRAM ......................................................................... 78
4.1 Preliminary Investigations on Materials’ Selection for UHPC.................... 80
4.1.1 High range water reducing admixtures ................................................. 80
4.1.2 Fine aggregate ....................................................................................... 81
4.1.3 Silica fume and silica flour.................................................................... 82
4.1.4 Reinforcing fibers .................................................................................. 84
4.2 Preliminary Investigations on Developing UHPC....................................... 86
4. 3 Effect of Alkali Content on the Properties of UHPC .................................. 90
4.4 Effect of Sand Content on the Properties of Mortar .................................... 94
4.5 Effect of Pozzolans on the Properties of UHPC .......................................... 97
4.5.1 Paste using binary blend of SCM and cement....................................... 97
4.5.2 Paste using ternary blend of MK, UFA and cement .............................. 99
4.5.3 Paste using ternary blend of MK, FA and cement ............................... 100
4.6 Combined Effect of Sand and Fiber on the Properties of UHPC .............. 103
4.7 Development of UHPC .............................................................................. 106
4.8 Effect of Chemical Admixtures on the Properties of UHPC ..................... 107
4.9 Bond Behavior between UHPC and Precast Concrete .............................. 109

xiii
Table of Contents (Continued) Page
4.9.1 Effect of substrate surface physical condition ..................................... 109
4.9.2 Effect of substrate surface roughening pattern ..................................... 111
5 RESULTS AND DISCUSSIONS .....................................................................113
5.1 Preliminary Investigations on Materials’ Selection for UHPC...................113
5.1.1 High range water reducing admixtures (HRWRA) ..............................113
5.1.2 Fine aggregate ......................................................................................115
5.1.3 Silica fume and silica flour...................................................................118
5.1.4 Reinforcing fibers ................................................................................ 131
5.1.5 Summary of preliminary investigation on materials selection ............ 133
5.2 Preliminary Investigations on Developing UHPC..................................... 136
5.2.1 Fresh concrete properties .................................................................... 136
5.2.2 Compressive strength .......................................................................... 137
5.2.3 Post-crack tensile strength (splitting tensile strength and flexural
strength) .................................................................................................................... 139
5.2.4 Modulus of elasticity (MOE) .............................................................. 141
5.2.5 Rapid chloride ion permeability (RCP) ............................................... 142
5.2.6 Drying shrinkage test results ............................................................... 143
5.2.7 Bond behavior between UHPC and precast concrete.......................... 144
5.2.8 Summary of preliminary development of UHPC ................................ 153
5.3 Effect of Alkali Content on the Properties of UHPC ................................. 155
5.3.1 Fresh state properties ........................................................................... 155
5.3.2 Compressive strength development .................................................... 159
5.3.3 Durability ............................................................................................ 162
5.3.4 Summary of the effect of alkali content on the properties of mortar .. 172
5.4 Effect of Sand Content on the Properties of Mortar .................................. 175
5.4.1 Workability of mortar .......................................................................... 175
5.4.2 Compressive strength of mortar .......................................................... 181
5.4.3 Durability of mortar ............................................................................ 189
5.4.4 Summary of the effect of sand content on the properties of mortar .... 193
5.5 Effect of Supplementary Cementitious Materials on the Properties of Paste
..................................................................................................................................... 195
5.5.1 Paste using binary blend of SCM and cement..................................... 195

xiv
Table of Contents (Continued) Page
5.5.2 Paste using ternary blend of MK, UFA and cement ............................ 205
5.5.3 Paste using ternary blend of MK, FA and cement ............................... 219
5.5.4 Discussion of developing UHPC with MK and UFA/FA.................... 232
5.5.5 Prediction of properties of paste using MK, UFA and SFU ................ 234
5.5.6 Summary of the effect of SCM on the properties of paste .................. 239
5.6 Combined Effect of Sand and Fiber on the Properties of UHPC .............. 241
5.6.1 Material properties .............................................................................. 241
5.6.2 Discussion of the effect of sand and SMF on properties of mortar ..... 256
5.6.3 Prediction of properties of SMF reinforced mortar ............................. 258
5.6.4 Summary of combined effect of sand and SMF on properties of mortar
.................................................................................................................................. 261
5.7 Development of UHPC .............................................................................. 263
5.7.1 Properties of SMF reinforced mortars ................................................. 264
5.7.2 Comparison between properties of UHPCs and their parent pastes.... 267
5.8 Effect of Chemical Admixtures on the Properties of UHPC ..................... 269
5.8.1 Influence of chemical admixtures on the properties of paste .............. 269
5.8.2 Properties of UHPC using liquid SRA and accelerator ....................... 275
5.8.3 Summary of the use of chemical admixtures in UHPC ...................... 277
5.9 Bond Performance between UHPC and Precast Concrete ........................ 279
5.9.1 Influence of surface roughness ............................................................ 279
5.9.2 Influence of surface moisture condition, cleanliness and curing
condition ................................................................................................................... 285
5.9.3 Bond performance of different UHPC mixtures ................................. 287
5.9.4 Influence of roughening pattern .......................................................... 287
5.9.5 Summary of the bond strength between UHPC and precast concrete. 289
6 CONCLUSIONS.............................................................................................. 291
APPENDICES .................................................................................................... 304
APPENDIX A: GUIDANCE ON RAW MATERIALS’ SELECTION AND
PROPORTIONING OF UHPC MIXTURES FOR APPLICATION IN SHEAR KEYS
..................................................................................................................................... 305
A.1 Guidance on Selecting Raw Materials for Producing UHPC ............... 305
A.2 Guidance on Mixture Proportions for Producing UHPC ...................... 308
xv
Table of Contents (Continued) Page
A.3 Guidance on surface preparation of the substrate precast concrete ........311
APPENDIX B: EXPERIMENTAL DATA ...................................................... 312
APPENDIX C: SPECIFICATION OF UHPC FOR THE SOUTH CAROLINA
DEPARTMENT OF TRANSPORTATION ................................................................. 323
REFERENCES ................................................................................................... 329

xvi
LIST OF TABLES
Table Page
Table 1.1 Typical mixture proportions of I m3 of UHPC ................................................... 3
Table 3.1 Chemical and physical properties of Type III Cement ..................................... 51
Table 3.2 Physical and chemical properties of materials .................................................. 51
Table 3.3 Physical and chemical properties of materials .................................................. 52
Table 3.4 Properties of HRWRAs .................................................................................... 53
Table 3.5 Gradation of sand .............................................................................................. 55
Table 3.6 Physical and chemical properties of silica flour ............................................... 56
Table 3.7 Mixture proportions of precast concrete (kg/m3) .............................................. 57
Table 4.1 Relative proportions of ingredients used in mortar mixtures ........................... 82
Table 4.2 Mixture proportions for 1m3 of each of the mortars ......................................... 83
Table 4.3 Relative proportions of UHPC mixtures ........................................................... 86
Table 4.4 Mixture proportions for 1 m3 of UHPC mixture ............................................... 87
Table 4.5 Material properties and test method .................................................................. 88
Table 4.6 Relative proportions of mortar (by mass) ......................................................... 90
Table 4.7 Quantities of materials used for 1 m3 of mortar................................................ 92
Table 4.8 Identifications of mortars .................................................................................. 94
Table 4.9 Mixture proportions for 1 m3 of mortar ............................................................ 95
Table 4.10 Relative proportions of materials in paste (by mass) ...................................... 98
Table 4.11 Quantities of materials used for 1 m3 of paste ................................................ 99
Table 4.12 Relative proportions of component materials in paste containing ternary blend
of MK, UFA and cement ................................................................................................ 100

xvii
List of Tables (Continued) Page
Table 4.13 Quantities of materials used for 1 m3 of paste containing MK, UFA and
cement ............................................................................................................................. 100
Table 4.14 Quantities of materials used for 1 m3 of paste .............................................. 101
Table 4.15 Relative proportions of materials in mortar using SMF ............................... 103
Table 4.16 Quantities of materials used for 1 m3 of mortar using SMF ......................... 104
Table 4.17 Quantities of materials used for 1 m3 of mortar using PVAMF ................... 105
Table 4.18 Quantities of materials used for 1 m3 of paste .............................................. 107
Table 4.19 Influence of Surface Roughness on the Bond Performance between UHPC
and Precast Concrete (whole surface roughened) ........................................................... 111
Table 5.1 Properties of freshly prepared UHPCs............................................................ 136
Table 5.2 Mechanical properties of the precast concrete ................................................ 144
Table 5.3 Ultimate load and failure mode of slant shear test specimens ........................ 146
Table 5.4 28-day fracture stress of third point flexural specimen .................................. 149
Table 5.5 Ultimate load of slab pull-off test specimens of UHPC ................................. 150
Table 5.6 Analysis of variance of compressive strength ................................................ 187
Table 5.7 Approximate time needed for the dry mixture to reach fluid state- Tc (min) 196
Table 5.8 Approximate time needed for the dry mixture to reach fluid state- Tc (min) 205
Table 5.9 Comparison between compressive strength of pastes using ternary blend of
UFA, MK and cement (CSMF) and the compressive strength of pastes using binary blend
of SFU and cement (CSSFU) ............................................................................................ 211
Table 5.10 Approximate time needed for the dry mixture to reach fluid state- Tc (min)
......................................................................................................................................... 220
Table 5.11 Comparison between compressive strength of pastes using ternary blend of
MK, FA and cement (CSMF) and the compressive strength of pastes using binary blend of
SFU and cement (CSSFU) ................................................................................................ 225
Table 5.12 Prediction of properties of pastes.................................................................. 235

xviii
List of Tables (Continued) Page
Table 5.13 Predicted properties of optimal paste............................................................ 238
Table 5.14 Electrical resistivity and rapid chloride penetration of mortar containing SMF
......................................................................................................................................... 250
Table 5.15 Electrical resistivity and rapid chloride penetration of mortar containing
PVAMF in comparison with SMF .................................................................................. 254
Table 5.16 Specific gravity of SMF, sand, and calculated specific gravity of cement
paste. ............................................................................................................................... 257
Table 5.17 Properties of SMF reinforced mortar ............................................................ 259
Table 5.18 Prediction of relative changes in the drying shrinkage of mortars ............... 260
Table 5.19 Prediction of properties of SMF reinforced portland cement mortar ........... 261
Table 5.20 Relative mixture proportions of UHPC ........................................................ 263
Table 5.21 Properties of paste used for preparing UHPC ............................................... 264
Table 5.22 Properties of UHPC ...................................................................................... 264
Table 5.23 Comparison of properties between UHPCs and their parent pastes ............. 267
Table 5.24 Properties of UHPC containing both liquid form SRA and accelerator ....... 275
Table 5.25 Surface roughness of precast concrete prepared by sandblasting ................. 280
Table 5.26 Influence of surface roughness on the bond behavior between UHPC and
precast concrete ............................................................................................................... 281
Table 5.26 Influence of surface moisture condition, cleanliness and curing condition on
the bond behavior between UHPC and precast concrete ................................................ 285
Table 5.27 Bond performance of different UHPC mixtures ........................................... 287
Table 5.28 Influence of surface roughness on the bond behavior between UHPC and
precast concrete ............................................................................................................... 288
xix
LIST OF FIGURES
Figure Page
Figure 1.1 Applications of UHPC ....................................................................................... 2
Figure 2.1 Types of the steel fibers used in UHPC: ......................................................... 29
Figure 3.1 Appearances of the sand .................................................................................. 54
Figure 3.2 Reinforcing fibers used for study of UHPC .................................................... 57
Figure 3.3 Test method of workability ............................................................................. 58
Figure 3.4 ASTM C1698 autogenous shrinkage............................................................... 60
Figure 3.5 Example TGA test result of one mortar mixture ............................................. 63
Figure 3.6 Loss on ignition test......................................................................................... 64
Figure 3.7 Example Nyquist plot for determining the bulk resistance ............................. 67
Figure 3.8 Specimen for slant shear bond strength test .................................................... 68
Figure 3.9 Specimen for third-point bond strength test .................................................... 70
Figure 3.10 loading system of third point flexural bond test ............................................ 70
Figure 3.11 Test method of pull-off bond test .................................................................. 71
Figure 3.12 Sand spread test ............................................................................................. 72
Figure 3.13 Laser profiling ............................................................................................... 74
Figure 3.14 Calculation of Sa ........................................................................................... 74
Figure 4.1 Mixing regime for preparing fresh cementitious paste.................................. 102
Figure 4.2 Different roughening patterns........................................................................ 112
Figure 5.1 Comparison of various HRWRAs ................................................................. 114
Figure 5.2 Comparison between natural sand and Ottawa sand ..................................... 116
Figure 5.3 Effect of gradation of natural sand ................................................................ 117

xx
List of Figures (Continued) Page
Figure 5.4 Compressive strength of mortar containing SFU and SFL ........................... 119
Figure 5.5 Effect of SFL content on the relatively degree of hydration of cementitious
materials .......................................................................................................................... 122
Figure 5.6 RCP test results of mortar containing SFU and SFL ..................................... 124
Figure 5.7 Bulk density and volume of permeable voids of mortar containing SFU and
SFL .................................................................................................................................. 126
Figure 5.8 Correlation between the charge passed of RCP test and volume of permeable
voids ................................................................................................................................ 127
Figure 5.9 Drying shrinkage of mortar ........................................................................... 128
Figure 5.10 Microstructural of mortar containing SFU and SFL ................................... 130
Figure 5.11 Influence of different types of fiber on properties of mortar ....................... 131
Figure 5.12 Compressive strength of UHPC .................................................................. 138
Figure 5.13 Tensile Strength ........................................................................................... 139
Figure 5.14 MOE of UHPC ............................................................................................ 142
Figure 5.15 RCP of UHPC ............................................................................................. 143
Figure 5.16 Drying shrinkage behavior .......................................................................... 144
Figure 5.17 Failure modes of slant shear test ................................................................. 146
Figure 5.18 Failure mode of third-point flexural bond strength test............................... 148
Figure 5.19 Fresh state properties of mortar influenced by alkali content ..................... 155
Figure 5.20 Compressive strength of mortar influenced by alkali content ..................... 160
Figure 5.21 Drying shrinkage of mortar influenced by alkali content ............................ 162
Figure 5.22 RCP of mortar influenced by alkali content ................................................ 164
Figure 5.23 Volume of permeable voids of mortars ....................................................... 165
Figure 5.24 Correlation between compressive strength and volume of permeable voids
......................................................................................................................................... 166

xxi
List of Figures (Continued) Page
Figure 5.25 Effect of alkali content on the ASR of mortars ........................................... 168
Figure 5.26 Workability of mortar affected by sand content .......................................... 176
Figure 5.27 Sensitivity of workability of mortar to the sand content ............................. 180
Figure 5.28 Compressive strength of mortar without SFU affected by sand content ..... 182
Figure 5.29 Compressive strength of mortar with SFU affected by sand content .......... 185
Figure 5.30 Influence of s/cm on RCP of UHPC without SFU ...................................... 190
Figure 5.31 Drying shrinkage of UHPC impacted by sand content ............................... 192
Figure 5.32 Workability of paste using binary blend of SCM and cement .................... 197
Figure 5.33 Time of set using binary blend of SCM and cement ................................... 198
Figure 5.34 Autogenous shrinkage of paste using binary blend of SCM and cement .... 200
Figure 5.35 Compressive strength of paste using binary blend of SCM and cement ..... 202
Figure 5.36 Drying shrinkage of paste using binary blend of SCM and cement ............ 204
Figure 5.37 Workability of pastes ................................................................................... 206
Figure 5.38 Compressive strength of pastes ................................................................... 208
Figure 5.39 Drying shrinkage of pastes .......................................................................... 213
Figure 5.40 Bound water content of pastes ..................................................................... 214
Figure 5.41 Volume of permeable voids......................................................................... 216
Figure 5.42 Compressive strength and drying shrinkage of paste containing MK and UFA
......................................................................................................................................... 218
Figure 5.43 Workability of pastes ................................................................................... 221
Figure 5.44 Compressive strength of pastes ................................................................... 223
Figure 5.45 Drying shrinkage of pastes .......................................................................... 226
Figure 5.46 Bound water content of pastes ..................................................................... 228

xxii
List of Figures (Continued) Page
Figure 5.47 Volume of permeable voids......................................................................... 229
Figure 5.48 Compressive strength and drying shrinkage of paste containing MK and FA
......................................................................................................................................... 231
Figure 5.49 Optimization of MK and UFA in paste by JMP® 11 ................................... 237
Figure 5.50 Workability of SMF reinforced mortar (%) ................................................ 241
Figure 5.51 Compressive strength of SMF reinforced mortar ........................................ 243
Figure 5.52 Loading-stroke relation of specimen under flexure moment (UTM) .......... 245
Figure 5.53 Flexural strength of SMF reinforced mortar ............................................... 247
Figure 5.54 25-day drying shrinkage (%) ....................................................................... 248
Figure 5.55 Correlation of bulk electrical resistivity and RCP results ........................... 252
Figure 5.56 Correlation of electrical resistivity and RCP results ................................... 253
Figure 5.57 Microstructure of high strength mortar (mortar M22) ................................ 255
Figure 5.58 Comparison of pastes using different chemical admixtures ........................ 270
Figure 5.59 properties of paste with combined use of accelerator and liquid form SRA 273
Figure 5.60 Failure mode of flexural bond test............................................................... 282
Figure 5.61 Microstructural of bond between UHPC and precast concrete ................... 284
Figure 5.62 Failure of bond specimen with dusty bond face .......................................... 286
Figure 5.63 Different surface roughening pattern........................................................... 288

1
CHAPTER
1 INTRODUCTION
1.1 Background
Ultra-high performance concrete (UHPC) is a new class of concrete which has
superior workability, mechanical properties and durability, compared to normal strength
and high strength concrete. It typically consists of portland cement, supplementary
cementitious materials (SCM), water, high range water reducing admixtures (HRWRA),
fine aggregate/sand and reinforcing fibers. Silica flour is used as a substitute of either
cement or sand to improve the gradation of the component materials of UHPC. Coarse
aggregate is not incorporated. UHPC has great advantages in many applications where
narrow formwork and dense reinforcement are inevitable, and the concrete material is
required to have superior high compressive strength and durability. The applications of
UHPC have been explored by many universities and research agencies all around the
world [1-3]. As it is reported, UHPC has been used in the construction of bridges,
precast/prestressed bridge girders, field cast connections of precast members and other
structures (see Figure 1.1) [1-6].

2
(a) Casting bridge girder by precaster (b) Field cast shear key
(c) First UHPC bridge in U.S.
Figure 1.1 Applications of UHPC [6]
Federal Highway Administration (FHWA) has proposed definition of UHPC
which is a cementitious based composite materials with discontinuous fiber
reinforcement, compressive strengths above 21.7 ksi (150 MPa), pre-and post-cracking
tensile strengths above 0.72 ksi (5 MPa), and enhanced durability [4, 7]. To achieve those
desired properties, UHPC is produced with low water-cementitious materials (w/cm)
ratio (i.e. w/cm < 0.25), high cementitious materials content (i.e. >1000 kg/m3), high
quality aggregate, high dosage of high-range water reducing admixture (HRWRA) and
reinforcing fibers [4, 5, 7-10]. Typical mixture proportion of UHPC is shown in Table 1.1
[11].

3
Table 1.1 Typical mixture proportions of I m3 of UHPC
Component materials content (kg/m3)
Portland cement 712
Silica fume 231
Water 109
Sand 1020
Silica flour 211
HRWRA 30.7
Accelerator 30
Steel fibers 156
Portland cement is the most important component material in UHCP. The
principal component of cement is clinker which consists of tricalcium silicate (C3S),
dicalcium silicate (C2S), tricalcium aluminate (C3A) and tetracalcium alumino ferrite
(C4AF) [12]. The hydration product of C2S and C3S are C-S-H gel and Ca(OH)2. C-S-H
gel is the main contributor to the strength of concrete [12]. Ca(OH)2 reacts with
amorphous silica from pozzolans to produce more C-S-H gel in the system, which is the
main process of pozzolanic reaction [12]. It has been observed in previous research that a
combined C2S + C3S content greater than 65% is preferred for developing UHPC [7, 8].
The hydration process of C3A is very fast, which has significant impact on the hydration
rate of clinker and the workability of the fresh concrete [12]. To control the hydration rate
of cement, proper amount of gypsum is mixed with the clinker to produce a cement with
good setting characteristics. C3A content of less than 8% by the mass of cement has been
found to have limited impact on the workability of fresh concrete [13].
Supplementary cementing materials (SCM) or pozzolanic materials are commonly
used in the formulations of UHPC. Silica fume (SFU), a by-product of the production of
elemental silicon or alloys containing silicon, is the most widely used SCM in UHPC. Its

4
super fine particles and pozzolanic reactivity densify the microstructure of hardened
concrete and improve the compressive strength of concrete significantly [12, 14]. A
preliminary study on the use of fly ash (FA), granulated blast furnace slag, meta-kaolin
(MK) in UHPC has been reported recently [7]. This study simply replaces SFU with FA,
slag or MK in the UHPC proportion. The results showed that concrete with 28-day
compressive strength can be prepared with SCM rather than SFU [7]. However, as a
preliminary study, only the workability and compressive strength of UHPC using binary
blend of SCM and cement were investigated. Information on the durability properties of
UHPC using different SCM is still not available.
Silica flour (SFL) is an inert form of silica which does not have chemical
reactivity at ambient temperature. The fine particulate nature of the SFL can physically
improve the grading and packing of the aggregate and reduces the permeability of
concrete [15]. SFL is usually used as filler material, substituting part of the fine aggregate.
However, studies have shown that at a temperature of 250 oC, SFL with mean particle
size of 10 µm can react with amorphous hydration products of portland cement to form
crystal hydrates, such as xonotlite [16, 17]. This is the main reason studies of developing
UHPC containing SFL require elevated temperature curing.
Reinforcing fibers are frequently used in UHPC mainly to improve the tensile
strength due to their ability of restraining crack propagation in concrete material [12].
Steel microfiber (SMF) the most widely used reinforcing fibers [5].
Several research studies have developed UHPC with desirable properties over last
decades [5, 7, 8, 11]. Most of these studies require the special treatment which is elevated

5
temperature curing or pressure curing to achieve superior compressive strength of
concrete. Elevated temperature curing is to increase the reactivity of component materials
in concrete. Pressure curing is to reduce the porosity of the concrete mixture. Richard et
al. developed concrete mixture having compressive strength up to 230 MPa with 90 oC
curing [16]. Concrete having compressive strength up to 680 MPa was prepared when
elevated temperature curing ranging from 250 to 400 oC and 50 MPa pressure curing
were both applied [16]. In another study, Roy et al. developed concrete with compressive
strength up to 510 MPa under curing condition with temperature of 150 oC and pressure
of 170 to 340 MPa [18]. However, it is difficult to apply special treatment methods to
achieve desired properties of UHPC, particularly in the field application. Studies on
developing UHPC under ambient temperature and atmospheric pressure curing have been
conducted in recent years. Wille et al. prepared several non-fiber reinforced UHPCs
having compressive strength up to 206 MPa without special treatment [8]. The lowest
w/cm in this study was 0.12 [8]. Rangaraju et al. developed fiber reinforced UHPCs
having superior workability and compressive strength over 150 MPa without special
treatment at w/cm of 0.2 [5].
At the present time, the approaches of producing qualified UHPC materials with
superior properties fall into the following categories:
a. Optimizing the gradation of compositional materials to maximize the
matrix packing density of cementitious concrete [19-22];
6
b. Utilizing interactions between water-soluble polymers and cement to
prevent macro defect in cementitious concrete which is referred to as Micro Defect Free
Concrete [23, 24];
c. Applying pressure to fresh cementitious mixture to increase the density of
the matrix [18, 25, 26];
d. Promoting the reactivity of mineral admixtures in cementitious concrete
under elevated temperature. Such type of concrete is also referred to as reactive powder
concrete [16, 17];
e. Using reinforcing fibers, such as steel fibers, to improve the properties of
cementitious concrete, particularly the properties under tension. The surface of fibers is
usually treated to improve the bond with cementitious matrix [7, 10, 16].
Among all of these categories, development of UHPC at ambient temperature and
atmospheric pressure by improving the packing density of cementitious concrete and
using reinforcing fibers has been increasingly attracting research interests, as it needs no
costly water-soluble polymers or special curing procedures.

7
1.2 Problem Statement and Research Significance
Regardless of the qualified UHPC material formulations that have been developed
in the previous studies, the options for commercial UHPC material product are still
limited in the market place. For instance, among most of the applications in U.S., the
dominant UHPC material was a product named Ductal® [4, 7, 27, 28]. The limited option
of UHPC products is largely because of the rigorous requirements on the qualities of raw
materials, the difficulties in manufacturing and field construction, and the high economic
cost. Another issue with UHPC is the limited information available on the behavior of
UHPC in reinforced concrete structure. Although UHPC has been used and studied in
some structural applications, the focus of the investigation has been limited to the global
structural performance of the structure (i.e. precast bridge). There is still limited
knowledge on the bond performance between UHPC and precast concrete, which is
critical to the integral performance of precast structures using field cast UHPC joint.
Specifically, some of the limitations of the present UHPC material development
and applications are recognized as follows:
a. High quality raw materials, such as low carbon silica fume, are required to
produce UHPC. However, their availability is limited and the price is high. The
information on the effect of chemical compositions and gradation of these raw materials
on the properties of UHPC is important to find out potential substitutionary materials. For
example, questions may be raised as whether higher carbon content silica fume can be
used in the same way as low carbon silica fume to produce UHPC, and whether fly ash is
suitable in developing UHPC. However, such information is limited.
8
b. The manufacturing and field construction procedures of UHPC have
special requirements. For instance, the mixing procedures of UHPC are more
complicated than normal concrete due to the sticky nature of fresh UHPC. High energy
output concrete mixer is required to produce UHPC. Another example is that, in studies,
vacuum mixing, pressure curing, or elevated temperature curing is required to achieve the
desired properties of UHPC [16, 25, 29]. All these requirements increase the cost of
UHPC, and make the quality control during the manufacturing and field construction
process difficult.
c. The dominant UHPC products in the market are proprietary and expensive.
The information on their compositions is not available. It is impossible to modify or
customize the proportions for specific application.
d. Most research focused on the 28-day compressive strength of UHPC.
There is limited information on the early age properties, such as workability, setting time
and the early age compressive strength (i.e. 1-day compressive strength) of UHPC. The
early age property is important if UHPC is to be used as self-compacting concrete or as
concrete for rapid construction.
e. The information on the durability of UHPC is limited. For instance, two of
the concerns of concrete: drying shrinkage and alkali silica reaction are not fully
understood in UHPC.
f. The information of mixture proportions design of UHPC is limited.
g. Limited knowledge on the bond performance between UHPC and precast
concrete.
9
Facing those challenges, the principal objective of this study is to develop UHPC
materials having superior material’s properties, customizable mixture proportions, good
bond with precast concrete, and cost efficiency compared with the commercial products
[5, 7, 9]. This study focused on the effects of properties of component materials and their
proportions on the performance of UHPC cured at ambient temperature. The findings of
this study provide much-needed information on the workability, mechanical properties
and durability of UHPC developed at ambient temperature, and provide guidance for the
development of UHPC. This guidance covers the processes from the stage of materials’
selection to the stage of materials’ proportioning.

10
1.3 Objective of the Research
The principal objective of this study is to investigate the feasibility to produce
UHPC using locally available materials and methods that do not require special mixing
and curing procedures. The specific objectives include:
a. Determine the influence of component materials and their proportions on
both early and later age properties of UHPC.
b. Provide guidance on selection and proportioning of qualified raw
materials for developing UHPC.
c. Determine the bond performance between UHPC and precast concrete,
and provide guidance on substrate surface preparation for achieving adequate bond.
11
1.4 Scope of the Research
The early and later age properties of UHPC produce using selected materials are
studied. The test methods include standard ASTM methods, modified ASTM methods
and non-standard methods.
The component materials investigated included:
a. Portland cement with various alkali contents.
b. Various types of high range water reducing admixtures.
c. Pozzolans, such as fly ash, meta-kaolin and silica fume, used in binary or
ternary blend with portland cement.
d. Inert filler such as silica flour.
e. Sand.
f. Steel fibers.
g. Other types of chemical admixtures, such as accelerator and shrinkage
reducing admixtures.
The early and later age material properties of UHPC studied included workability,
time of set, autogenous shrinkage, compressive strength, tensile strength, flexural
strength, drying shrinkage, bulk electrical resistivity, rapid chloride ion permeability
(RCP), alkali-silica reaction (ASR) distress.
The bond performance between UHPC and precast concrete was also studied with
considerations of different substrate surface preparation methods.
The findings in this study provided several guidelines for developing UHPC with
superior material and structural performance.

12
1.5 Organization of the Dissertation
This dissertation includes six chapters.
Chapter 1 provides an introduction to this study. Problem statements and research
needs are placed. The principal objectives and scope of this study are defined as well.
Chapter 2 is the literature review of the past studies. The material selection,
material proportions, and test methods used in the past study are discussed.
Chapter 3 discusses the materials used and the test methods adopted for this
research.
Chapter 4 describes the experimental program adopted for achieving the
objectives of this research.
Chapter 5 reports the results of the various tests, and provides reasonable
discussions.
Chapter 6 draws conclusions relating to the principal findings of this study.
Chapter 7 provides guidance on raw materials’ selection and proportioning for
producing UHPC. Guidance on substrate surface preparation for achieving adequate bond
between UHPC and precast concrete is also provided.

13
CHAPTER
2 LITERATURE REVIEW
This chapter introduces the past literatures related to the development of UHPC.
The influencing factors and mechanisms on the properties of UHPC are reviewed.
Previous findings on the material selection, material proportions, curing methods and test
methods for UHPC are introduced. Shortcomings of the past studies are stated.
2.1 General
The term UHPC was first introduced in 1990s [20]. Although no official
definition of UHPC has been given so far, based on research work conducted in recent
years by the FHWA, a widely accepted definition of UHPC as a concrete material having
compressive strengths above 150 MPa, and pre- and post- crack tensile strength above 5
MPa and durability has gained recognitions [4, 7]. The early studies related to concrete
with such high compressive strength can be dated back to 1970s when elevated
temperature was required for curing [18, 22]. The recent research work focuses on
producing UHPC without elevated curing or pressure curing [5, 8]. Although many
studies have been conducted on UHPC, the only commercially available UHPC product
in U.S. named Ductal® is produced by a French company [4, 7, 11]. It has become the
dominant UHPC product in field applications in North America.
The typical composition of UHPC includes portland cement, silica fume, silica
flour, HRWRA, water and reinforcing fibers [4, 5, 7, 8, 11, 27]. The chemical
composition, gradation and proportion of these materials are critical to achieve desired

14
properties of UHPC. The effect of component materials and their proportion on the
properties of convention concrete or UHPC are reviewed in this chapter.

15
2.2 Behaviors of Component Materials in Concrete
2.2.1 Cementitious materials
2.2.1.1 Portland cement
As it is known, portland cement consists of finely ground clinker and gypsum [12].
The main compositions of clinker include C3S, C2S, C3A and C4AF. C-S-H gel, a
hydration product of C2S and C3S, is the main contributor to the strength of concrete [12].
Ca(OH)2, another hydration product of C2S and C3S, reacts with amorphous silica from
pozzolans to produce additional C-S-H gel, which is the main process of pozzolanic
reaction [12]. It has been observed in a research that a combined C2S + C3S composition
greater than 65% in cement is preferred for developing UHPC [7, 8]. The hydration
process of C3A is very fast, which has significant impact on the hydration rate of clinker
and the workability of fresh concrete. To control the hydration rate of clinker, proper
amount of gypsum is mixed with the clinker, which leads to the final form of portland
cement. The hydration product of C3A does not contribute to the strength of concrete, but
it can bind HRWRA and result in less HRWRA available to improve the workability of
fresh concrete [12]. The content of C3A and gypsum in cement has significant influence
on the properties of concrete, especially workability. Study has shown that C3A content
of less than 8% by mass of cement has limited impact on the workability of fresh
concrete [13].
Alkali content is another factor in cement which has impact on the properties of
concrete. As reported in previous research work on conventional concrete, an increase in

16
the alkali content of cement accelerates the hydration of cement and decreases the
workability of fresh concrete [30-36]. It was reported in literature that the increase in the
alkali cations in the liquid phase of fresh cementitious mixture accelerated the hydration
of C3A by depressing the Ca2+ cations released from gypsum whose effectiveness was
therefore decreased [30, 34-36]. Alkali content of cement also has impact on the
compressive strength of concrete [30-32, 37-42]. As observed in the past studies, the
increasing alkali content reduced the later age compressive strength of concrete, and it
was attributed to the porous microstructure and lower strength of alkali-containing C-S-H
gel of hardened mixture developed in high alkali condition [30-32, 37-42]. An increase in
the alkali content of cement also increases the potential of the ASR in concrete [43-45]. A
study on the ASR expansion of concrete with alkali content of cement varying from 0.9%
to 1.25% Na2Oeq was conducted by Rogers C. et al [44]. The original portland cement
had alkali content of 0.9% Na2Oeq. Higher alkali content was achieved by dissolving
corresponding quantity of sodium hydroxide (NaOH) into mixing water [44]. The test
results showed an approximately linear relation between increasing ASR expansion and
the increasing alkali content [44]. In another study, 70 to 80% of the expansion was
reduced when the alkali content of mortar mixtures was reduced from the higher (13.4
kg/m3) to the lower value (6.2 kg/m3) [43].
The fineness of cement also impacts the properties of concrete. Cement with high
fineness tends to hydrate fast and give higher early age compressive strength of
cementitious mixture than cement with low fineness, but the former gives lower
workability of fresh concrete than the latter one [12]. As for the different types of cement,

17
study has found that Type I/II cement perform better than Type III cement in developing
UHPC from a consideration of 28-day compressive strength [7].
2.2.1.2 Silica fume
Silica fume is a by-product of the production of elemental silicon or alloys
containing silicon [14]. SFU is the most frequently used SCMs in UHPC formulations. Its
super fine particles and pozzolanic reactivity improve the compressive strength and
durability of UHPC significantly, by densifying the microstructure of both the bulk paste
and the interfacial transition zone (ITZ) between paste and aggregate of hardened
cementitious mixture [12, 14, 46, 47]. Accelerated pozzolanic reaction of SFU has been
observed when the cementitious mixture is cured at 90 0C [16].
SFU is also able to reduce bleeding and increase the cohesiveness of fresh
cementitious mixtures [48]. In most cases, SFU is found to reduce the workability of
fresh concrete [12]. However, studies have shown that concrete with SFU has improved
fluidity, despite that SFU has large specific surface area [48-50]. For example, a study on
the rheology of cementitious paste found that for mixtures in which less than 10% of
cement was replaced by equal volume of SFU the viscosity of paste decreased as the
silica fume content increased when polyacrylate based HRWRA was used [50]. This was
explained by the packing of SF particles between cement grains which displaced water
and by a ball-bearing effect of silica spheres [50]. Research has shown that low carbon
content SFU is preferred to achieve good workability [7].
The effect of SFU on the durability of concrete has been studied from the aspects
of freeze-thaw resistance, scaling, permeability and dimensional stability. As it was

18
observed that the addition of SFU improved the freeze-thaw resistance of concrete [51].
The use of silica fume also reduces scaling [52]. The reduced chloride ion permeability of
concrete by the addition of SFU has been observed in many studies, and it is attributed to
the densified microstructure of hardened cementitious matrix, as discussed previously
[53-56]. The previous literature on the effect of SFU on the drying shrinkage of concrete
is contrary. Increased drying shrinkage with the presence of SFU has been observed [57].
However, other studies showed different phenomenon that the use of SFU reduced the
drying shrinkage of concrete, which was attributed to the higher capillary stress due to
the finer pore size distribution in concrete resulting from the micro filler effect and
pozzolanic effect of SFU [58]. Increased autogenous shrinkage of concrete was observed
with the presence of SFU in some literature [59, 60].
2.2.1.3 Fly ash
Fly ash is a by-product of thermal power stations [12, 61]. Many studies have
shown that fly ash can improve the properties of concrete, such as workability, durability,
and strength [12, 61-67].
It is widely known that the electro static repulsion and ball bearing effect of FA
can improve workability of fresh concrete [12]. The carbon content of FA (referred to as
loss on ignition value) has significant effect on the workability of concrete by influencing
the tendency of absorbing HRWRA [63, 64]. Moreover, FA has been found to have
chemical impact on the mechanism and kinetic of the cement hydration, which is an
initial retardation effect on the C3A hydration [64]. Other factors, such as fineness and
particle shape, have also been studied from an aspect of workability of concrete [62]. As

19
shown in the literature, decreased workability was observed with the increase in the
fineness of FA, and it was attributed to the angular particle content due to the grinding
process [62]. Fly ash was also found to reduce the autogenous shrinkage of concrete [68].
The effect of FA on the strength of concrete has been understood from the
perspective of both physical and chemical effect of FA on hardened concrete. At early
ages, i.e. less than 7 days, pozzolanic effect of FA is not significant. The early chemical
and physical influences of FA on the hydrating cement are understood as assisting the
dispersion of cement, which let cement expose a greater surface area of the cement grains
for hydration [64]. Moreover, FA helps reduce bleeding and form a uniform
microstructure of concrete [64]. At later ages, pozzolanic effect of FA is getting more
significant. Denser impermeable concrete microstructure is formed which exhibits higher
compressive strength and better durability [64]. A Study showed that FA with high
degree of fineness exhibited more effectiveness in improving the compressive strength of
concrete than fly ash with low degree of fineness [62, 65-67].
FA also improves the durability of concrete. A study on the resistance of concrete
to the sulfate attack showed that FA was effective in improving the sulfate attack
resistance, and the dosage ranging from 10% to 25% was considered optimal [69]. The
drying shrinkage of concrete can be reduced by the use of FA. A study on the effect of
fineness of FA on the drying shrinkage of concrete showed that the difference in the
drying shrinkage resulted from FA with different fineness was not significant, and w/cm
was still the dominant factors influencing the drying shrinkage of concrete [70]. The
ability of FA in mitigating ASR has been recognized by many studies [45, 71]. The
20
underlying mechanisms were considered as dilution effect, pozzolanic reactivity which
resulted in the depletion of calcium hydroxide [72], alkali binding ability [45, 73, 74] and
reduced permeability as a result of more supplemental C–S–H gel produced from the
pozzolanic reaction [75].
From a consideration of producing UHPC, the use of FA can be beneficial from a
workability and economic consideration. However, the slow strength development of
concrete should be of concern.
2.2.1.4 Meta-kaolin
Meta-kaolin is produced from a well-controlled process of de-hydroxylation of
quality kaolin clay within a specific temperature range (650–800 oC) to convert the
crystalline structure to an amorphous alumino-silicate [76, 77]. The process of
manufacturing MK is well controlled, so that most of the impurities in MK are removed
and a high reactivity is achieved [76, 78]. MK can react with calcium hydroxide to form
C-S-H, which is a typical process of pozzolanic reaction [78]. Study has shown that
mixtures containing high-reactivity MK yield comparable performance to SFU mixtures
in terms of strength, permeability, chemical resistance, and drying shrinkage resistance
[77, 79, 80].
Studies on the fresh properties of concrete showed that the use of MK required
almost as much superplasticizer and air-entraining admixture as the silica fume concrete
in order to achieve similar slump and air content [76, 78]. One of the disadvantages of
using MK is that it reduces the workability of fresh mixture [81]. Slightly longer mixing
time has also been observed when MK was used in the UHPC formulation [82]. The

21
initial and final setting times of the MK concrete were decreased than those of the control
and silica fume concretes, and the bleeding of the MK concrete was negligible [76, 78].
The use of MK has also been observed to accelerate the cement hydration [83, 84]. The
maximum temperature reached during the hydration of cement with the presence of MK
was higher, and this maximum temperature was reached earlier than that of the control
and the silica fume concretes [76, 78].
As for the compressive strength of concrete using MK, contrary experimental
results exist in the literature. Many studies showed that the addition of MK at dosages of
5%, 10%, and 15% by mass of cement improved the compressive strength of concrete
[76, 78, 85]. Refined micro structure of concrete with the presence of MK was observed
[85]. Also, at early ages, concrete with MK presented faster strength development [76,
78]. However, the decrease in the later age compressive strength was also observed for
concrete using MK [86]. The study showed that the total porosity decreased up to 28 or
56 days of curing age for concrete using MK [86]. But, above this age, the total porosity
of MK mixes tended to increase with respect to the concrete without MK [86]. One of the
proposed explanations was that the consumption of MK for pozzolanic reaction left
porosities which were previously occupied by the MK particles in concrete [86].
However, the mechanism underlying this phenomenon has not been fully understood.
As for the durability of concrete using MK, the general knowledge is that MK
improves the durability of concrete. As shown in a study, the resistance of the MK
concrete to the penetration of chloride-ions was significantly higher than that of the
control concrete, but similar to that of the silica fume concrete [76]. The MK concrete

22
showed excellent performance under the freezing and thawing cycling. The performance
of the MK concrete subjected to the de-icing salt scaling test was similar to that of the
silica fume concrete, but was marginally inferior to the control concrete [76]. MK has
been found to reduce the early age autogenous shrinkage of concrete measured from the
time of initial set, and the reduction in the autogenous shrinkage is greater at higher
replacement levels [79]. However, the long-term autogenous shrinkage measured from 24
hr after mixing increases significantly for the MK concretes with a reducing trend at
higher replacement levels [79]. Compared with the control concrete, the major part of the
total shrinkage of the MK concretes is constituted by autogenous shrinkage, and the
smaller part is drying shrinkage [79]. This is not influenced by the replacement level.
Total creep, basic creep and drying creep of the concrete are greatly reduced due to the
use of MK, particularly at higher replacement levels [79]. The incorporation of MK also
improve other durability of concrete, such as resistance to acids and sulphates and
prevent alkali-silica reaction [80].
From a consideration of producing UHPC, the use of MK can be beneficial from
an early age strength. However, the reduction in the workability of fresh concrete due to
the use of MK needs to be solved. Considering the effect of FA in improving the
workability of concrete, the combined use of MK and FA would be a potential path of
using MK and FA in UHPC.
2.2.1.5 Ternary or quaternary use of SCMs
The ternary or quaternary use of SCM with portland cement is to limit the side
effect of binary use of SCM and portland cement on the properties of concrete. for
23
instance, studies on the use of ternary blend of FA, MK and portland cement in
conventional strength concrete has shown that the retardation and strength loss of
concrete in early ages due to the use of FA can be compensated by the use of MK, and
the reduction in workability of fresh concrete resulted from the use of MK can be limited
by the use of FA [81, 87]. Another example is that for concrete containing binary blend
of SFU and portland cement the increase in the drying shrinkage due to the use of SFU
can be eliminated by ternary and quaternary blends of SFU, FA, MK and portland cement
[88].
2.2.2 Inert fillers
Inert fillers refer to powder materials that do not present pozzolanic reactivity at
ambient temperature, such as silica flour, ground quartz and stone powder. Inert filler is
produced by grinding quartz into fine powder. SFL has been used in concrete in two
ways. The first way is to use it as micro filler to improve the gradation of the component
materials of concrete and achieve high packing density of the concrete mixture [8].
Another way is to use it at certain high temperature to let it present chemical reactivity
and improve the strength of the concrete mixture [16].
SFL’s fine particles physically improve the gradation of the aggregate and
reduces the permeability of concrete [89-91]. Studies showed that these fine particles also
promoted the rate of cement hydration physically, and increase the early-age strength of
cement paste [15, 90, 91]. In these studies, fine inert silica was incorporated into concrete
either as mineral admixture replacing part of the cement, or as fillers replacing part of the
fine aggregate. The test results under ambient temperature curing showed significantly
24
higher compressive strength of mixture with proper amount of inert silica than the control
without inert silica at early ages, but insignificant difference in compressive strength at
later ages. Studies on the heat evolution of cement hydration found that the higher
compressive strength at early ages was because of the accelerated degree of hydration
[15]. It was believed that the accelerated degree of cement hydration by inert silica was
due to the accelerated crystallization of portlandite [15, 90, 91]. Specifically, the particles
of fine inert materials provided a large amount of substrates surface for portlandite to
crystallize at early stages of cement hydration [15, 90, 91]. However, the effect of SFL on
the properties of UHPC under ambient temperature has not been fully understood.
Studies have shown that at a temperature of 250 oC, SFL with mean particle size
of 10 µm can react with amorphous hydration products of portland cement to form crystal
hydrates, such as xonotlite [16, 17, 92]. The resulting cementitious compounds with
CaO/SiO2 ratio equal or less than 1 presented higher compressive strength and lower
permeability [16, 17, 92]. This is the reason that SFL has been used in UHPC proportion
to achieve high compressive strength under elevated temperature.
2.2.3 Chemical admixtures
2.2.3.1 High range water reducing admixture
High range water reducing admixture (HRWRA) is used to improve the
workability of concrete, and it is especially critical for concrete with very low w/cm. The
traditional types of HRWRA, such as lignosulfate formaldehyde based HRWRA, have
problem of slump loss which is getting more significant when the w/cm of concrete is
decreasing [93]. Re-tempering or re-dosing have to be used to deal with the slump loss
25
[93, 94]. Polycarboxylate based HRWRA is the newest type of HRWRA which is more
efficient in improving and maintaining the workability of fresh concrete even at low
w/cm [93, 95-97]. Several studies have been focused on modifying the molecular
structure of HRWRA to produce highly efficient HRWRA [95-97].
When selecting commercial polycarboxylate-based HRWRA products, the
average molecular weight of the HRWRA is one of the important concerns. Generally the
larger the average molecular weight, the better the HRWRA performs [12, 98]. For a
given HRWRA, higher dosage usually gives better workability. However, excessive
dosage of HRWRA is not preferred as the price of such admixture is very high. Other
problems such as severe set-retardation and slow compressive strength development of
concrete can occur due to the overdosed HRWRA [12]. This will be a severe problem, if
the concrete material is for rapid structure repair. It is always important to identify an
optimal range of HRWRA dosage for specific type of cement, type of HRWRA and
structural application purpose.
2.2.3.2 Other chemical admixtures
The other types of chemical admixtures include shrinkage reducing admixture
(SRA) which is used to decrease the shrinkage behavior of concrete, and accelerator
which is used to achieve high early age strength of concrete. As it is known, UHPC has
high cement paste content which is the main cause of significant drying shrinkage or
autogenous shrinkage of concrete. Excessive shrinkage of UHPC material may result in
undesired early cracks in the structures. Therefore, the dimensional stability is an
important concern of UHPC. SRA has been used in UHPC to reduce the drying shrinkage

26
as reported in literature [5, 11, 99]. The mechanism of SRA in reducing shrinkage is
understood that SRA can reduce the capillary pressure of the pore solution in the
microstructure of concrete [12]. However, the use of SRA reduces the early age
compressive strength of the UHPC mixtures [5]. As for the applications of rapid repair
construction, UHPC with high early age strength is preferred. A method of improving the
early age compressive strength of UHPC in presence of SRA is needed. Chemical
accelerator accelerates the process of setting and strength development of concrete. It is
used to speed up construction and allow the structure to carry load early. However,
studies have found that it can lower the 28-day compressive strength of concrete [12].
Proper dosage of chemical accelerator is important to achieve early age strength but have
limit effect on the 28-day compressive strength. The use of SRA and chemical accelerator
has strong potential in developing UHPC with desired properties.
2.2.4 Water
Water participates in the process of portland cement hydration and the process of
pozzolanic reaction. The requirement on the water quality as described in ASTM C94
include suspend solid content, organic impurities content, dissolved sulfate and chloride
content et al. However, the quality of water is not a big issue during the production of
concrete, as municipal water is good enough for use. The main concern of water in
concrete is the water content which is expressed as water-to-cement ratio (w/c) or water-
to-cementitious materials (w/cm) ratio. Low w/cm (i.e. <0.25) is preferred for producing
UHPC as the compressive strength of concrete increases with the decrease in the w/cm

27
[4, 5, 7-10]. However, low workability of UHPC becomes an issue as the w/cm
decreases. Therefore, high dosage of HRWRA is needed to improve the workability.
2.2.5 Aggregate
Aggregate occupies the major volume of concrete mixtures. The properties of
aggregate, such as type of aggregate, the maximum aggregate size, the particle size
distribution, and the aggregate to cement ratio, affect the workability, compressive
strength and durability of concrete [12, 100]. Low w/c and high content of HRWRA
result in UHPC with a sticky consistency even at high workability, which is different
from normal cementitious mixtures [12, 48, 101]. Low w/c also decreases the risk of
segregation by lowering the difference in density between aggregate and paste [102].
Both of these two factors reduce the chance of segregation [101, 103, 104].
To produce concrete with high compressive strength, the preferred aggregate is
expected to have strong texture and limited chemical reactivity. Siliceous aggregate is
one of the examples of strong and chemically stable aggregate. A study has shown that
the highest compressive strength values of concrete can be achieved by using quartz
aggregate, followed by basalt aggregate, volcanic rock and limestone [7]. Chemically
stable aggregate presents reduced chance of chemically deleterious reaction in UHPC,
such as ASR.
UHPC usually does not contain coarse aggregate. Many studies have confirmed
that concrete with fine aggregate achieve higher compressive strengths than the one with
coarse aggregate [7]. In many studies related to UHPC, the maximum grain size of fine
aggregate is less than 1 mm [7, 11]. Fine aggregate gradation with the high compaction
28
density was believed to be preferred for developing UHPC [7, 8]. The high compaction
density indicates denser structure of concrete and less defect in concrete, which will
guarantee high compressive strength and durability of concrete [7, 8]. However, studies
have found some advantages in using coarse aggregate. A study showed that concrete
matrix with coarse aggregates demanded less water to achieve comparable spread values
in comparison to matrix with only fine aggregates [7]. Another study showed that the
autogenous shrinkage could be reduced considerably by including a basalt coarse
aggregate with an aggregate size ranging from 2 to 5 mm [105].
Fine aggregate content which is usually expressed as sand-cementitious material
(s/cm) ratio by mass affects the workability and compressive strength of UHPC. A
comprehensive study on the effect of sand content on the properties of normal strength
mortar showed that increasing sand content decreased the workability of mortar, and the
increasing sand content might increase or decrease the compressive strength depending
on the use of HRWRA [106]. Generally, it is preferred to increase the sand content of
concrete to get more cost efficient concrete formulation. But excessive sand content
cause problems such as increasing risk of sacrificing workability and strength. It is
important to find out the optimal sand content of concrete for specific application. Sand-
cementitious material ratio ranging from 1 to 1.4 has been found to be the optimal range
of UHPC in studies [7-9, 107].
The increasing sand content of concrete also improves the durability of concrete.
Study found that the chloride ion permeability was decreased as the sand content
increased up to certain point, but above this point the permeability was increased [12,

29
108]. The decreased permeability was attributed to the deceased volume of cement paste
which was more permeable than sand particles, but the increase permeability was
attributed to the increased volume of interfacial transition zone (ITZ) as sand content
increased [12, 108]. As it is widely known, ITZ which surrounds sand particles has
higher porosity than the cement paste. If sand content goes up to certain point when
adjacent ITZs start to percolate, the permeability of the whole structure of concrete
increases significantly [12, 108]. An increase in the sand content was also found to
reduce the drying shrinkage of concrete [12]. The reduction in drying shrinkage as sand
content increased was likely because of the reduced volume of cement paste which was
the main component resulting in shrinkage under drying [12].
2.2.6 Reinforcing fibers
Carbon fiber, polymer fiber, and steel fiber have been used to develop UHPC.
However, steel fiber is the most widely used fiber among others. Configurations of some
types of steel fibers are shown in Figure 2.1 [109].
a. Straight smooth; b. Hooked; c. High twisted; d Low twisted
Figure 2.1 Types of the steel fibers used in UHPC: [109]
30
The use of fibers improves the tensile strength and ductility of the UHPC
materials due to their ability of retaining the propagation of cracks in concrete. As
observed in the past studies, the failure mode of high-strength concrete under
compression was changed from a brittle and explosive failure mode to a ductile failure
mode with the presence of fiber [11]. Fiber reinforced UHPC with compressive strength
up to 292 MPa, post-crack tensile strength up to 37 MPa and strain at peak stress up to
1.1% were obtained at the age of 28 days [109]. The compressive strength of the concrete
can be increased in the presence of fibers, but not as much as the increase in the tensile
strength. A study showed that the use of micro steel fiber increased the compressive
strength of the concrete by 25% [5]. Other studies found that the use of steel fibers could
improve the post-crack tensile strength of UHPC more that 100% [5, 110].
The strength of the fiber, the fiber aspect ratio, bond between matrix and fiber, the
fiber volume fraction, and fiber distribution are the main factors affecting the properties
of fiber reinforced concrete. The fiber with high strength is always preferred. In study the
tensile strength of fiber used for developing UHPC went up to 2100 to 3160 MPa [11,
111]. The fiber with length to diameter ratio about 65 to 90 has been found to have a
good pull-out resistance and does not decrease the workability of fresh concrete
significantly [11, 111]. A study on the fiber shape showed that the addition of 1.5% of
high strength twisted steel fibers by volume in UHPC led to a post-cracking tensile
strength of 13 MPa, which was 60% higher than that of UHPC using smooth fibers, and
also to a tensile strain at peak stress of 0.6%, which was about three times that of UHPC
using smooth fibers [109]. Roughened, deformed or hook fiber provide good bond with

31
the matrix, but the workability of the finished concrete can be decreased, and a balance
between adequate bond and good workability is preferred [111]. The dosage of fibers use
in the past studies typically ranges from 0% to 10% by volume of the total mixture [4, 7,
112]. Due to high material costs of steel fiber, the optimal fiber content needs to be
determined for a cost efficient UHPC. Alternative types of cheaper fiber for UHPC are
also preferred from a consideration of the economic cost. The distribution of fibers in
concrete mixture is desired to be uniform. Any clumps of fibers should be prevented.
One of the problems of using steel fibers is the segregation. As the specific
gravity of steel is 7.8, while the specific gravity of non-fiber concrete is about 2.4, the
steel fibers tend to sink. Aggregate can be helpful to reduce the segregation of steel
fibers. Thus the interaction between sand content and steel fiber content in UHPC is
important from a consideration of segregation of steel fiber. However, there is limited
information on this topic.
32
2.3 Mixing and Curing Methods of UHPC
Fresh UHPC mixture has cohesive and sticky nature mainly due to the low w/cm
and use of HRWRA. A high-energy output mixer is required to produce a fresh UHPC
with good consistency. The high-energy output mixer, such as IMER® Mortarman 750
mixer is more expensive than normal mixer [113]. Such special requirement on the mixer
is one of the reasons of the high economic cost of UHPC. The sequence of mixing is
important to prevent overloading the mixer and achieve good workability of UHPC. The
general sequence is that: first, dry mix the cementitious material with aggregate so that
the clump of cementitious material can be break down by the shear action among
aggregate particles; second, the HRWRA is added and dry mixing continues until all the
dry component materials are mixed thoroughly; at last, the mixing water is added [4]. The
actual mixing procedures may vary. For some type of mixer having limited energy
output, over loading may occur because of the sticky fresh concrete mixture. In such
case, mixing procedures which can relieve the loading on the mixer should be followed.
One of the examples as reported in a literature is that half of the total component
materials are mixed firstly following the procedures discussed above. After the fresh
mixture reaches a fluid state, the rest of the component materials are added [9].
Generally, UHPC mixtures require longer mixing time than conventional concrete, which
may go up to 15 to 20 minutes [5]. Expensive equipment, complicated mixing procedures
and long mixing time increase the economic cost of UHPC.
The properties of UHPC are significantly affected by the method of curing.
Generally, higher curing temperatures resulted in higher compressive strengths. Steam

33
curing is one of the frequently applied curing methods in the previous studies to improve
the properties, such as compressive strength of UHPC. A study has been conducted on
the effect of curing method on the properties of UHPC using three curing conditions
which are steam curing at 90 °C for 48 hours starting at 24 hours after casting; steam
curing at 90 °C starting at 15 days after casting; and ambient temperature laboratory
curing [11]. The results showed that all the steam curing methods increased the
compressive strengths, modulus of elastic and abrasion resistance, but decreased the
creep, drying shrinkage, and chloride ion penetrability [11]. Another study showed that
the heat curing at various temperatures between 65 and 180 °C could produce concrete
with 28-day compressive strength as high as 280 MPa compared with concrete cured at
20 °C having compressive strength of 178 and 189 MPa [114]. Also the steam curing
accelerates the early age strength development of UHPC [11, 115]. UHPC with
compressive strengths higher than 200 MPa at an age of 24 hours can be prepared after 8
hours storage at 20 °C followed by 8 hours at 90 °C in water [115]. Considering the
difficulty of applying special treatment in the field, some of the recent studies try to
produce UHPC at ambient temperature and pressure curing [5, 8, 9].

34
2.4 Material Properties of UHPC
2.4.1 Workability
UHPC is expected to be self-consolidating, as it is mainly used in the construction
with narrow formwork and dense reinforcement, and it usually has steel fiber which is
not safe to handle. Therefore, workability is one of the most important properties of
UHPC. The test method for the workability of UHPC varied among different researchers.
The test results from different test method are not comparable. One of the widely used
test methods is modified from the standard ASTM C1437 as UHPC generally includes no
coarse aggregate. In this method the fresh UHPC sample is allowed to spread freely on a
steady leveled platform, instead of being dropped on a flow table for 25 times as per
ASTM C1437. The test result which is referred to as flow value indicates the workability
of the UHPC. Study using this test method has developed UHPC with flow value of at
least 150%, without noticeable segregation [5]. Another study using similar test method
has found that the preferable flow value for UHPC is in the range of 180% to 240% [7].
Higher flow value than this range is not preferable since it may significantly increase the
amount of entrapped air and reduce the compressive strength of UHPC [7].
The segregation and bleeding are not likely problems to non-fiber UHPC, since it
has a sticky consistency even at high flow, and the difference in density of paste and
aggregate is small [12, 48, 101]. However, when steel fibers are presented, the
segregation may become an issue as the specific gravity of steel is much higher than that

35
of cementitious mortar. However, there is few systematic information in the literature
regarding the segregation of steel fibers in UHPC.
The bleeding of fresh UHPC does not likely occur as SFU is commonly presented
in the mixture formulation and makes the fresh mixture sticky [48].
2.4.2 Time of setting
The time of setting of UHPC is generally evaluated by penetration test method,
such as AASHTO T197 and ASTM C403. In these methods, the initial and final time of
setting are determined by finding the durations for UHPC to achieve defined penetration
resistances.
UHPC may have much longer time of set than conventional concrete due to the
high HRWRA content. In a study using AASHTO T197 method, the initial setting times
ranging from 70 minutes to 15 hours, and the corresponding final setting times ranged
from 5 to 20 hours for different UHPC formulations. In another study, the time of final
setting went up to 16.4 hr due to the use of high dosage of HRWRA and SRA [9].
In some of the study, the behavior of setting of UHPC is very different from
conventional concrete. As observed in a study, UHPC tends to exhibit virtually no setting
within an long initial stage of hydration, say at least 12 hours [11]. At some point of
timetable, the mixture begins to set and quickly reaches both initial and final set [11].
Time of set is important for applications where the UHPC is expected to achieve
required strength with a relatively short time. The use of accelerators is one of the
solutions to counter severely delayed setting. Other methods include elevated temperature

36
curing which has been proved that the both the initial and final set are significantly
reduced by higher curing temperature [116].
2.4.3 Compressive strength
Compressive strength is the most frequently measured properties of UHPC. So
far, UHPC with compressive strength over 150 MPa has been developed in some
universities and research agencies. Since no standard test method has been developed for
UHPC, specimens with different dimensions have been used in those studies, and the
curing method and testing method varies a lot. The difference in the test methods
includes specimen size, curing temperature, loading rate, capping methods. Thus, it is
important to clarify the experimental methods when comparing the compressive strength
test results of UHPC from different researchers.
As for the dimensions of the specimens, the smaller the size of the specimen the
higher the compressive strength is observed. In U.S., the widely used compressive
strength test is conducted on cubic specimen with dimensions of 50 mm × 50 mm × 50
mm for mortars and pastes, and on cylindrical specimen with diameter ranging from 50
mm to 200 mm and length ranging from 1.8 to 2.2 times the diameter (mostly 2 times the
diameter) for concrete. Since UHPC has superior high compressive strength and no
coarse aggregate incorporated, smaller dimension specimen is frequently used mainly due
to the limitation on the loading capacity of tester. Studies on developing UHPC without
heat curing or pressure curing showed UHPCs having compressive strength over 150
MPa based on the cubic specimens with dimensions of 50 mm × 50 mm × 50 mm [8]. A
study focused on the effect of specimen size on the measured compressive strength. The

37
investigated specimens included three types of cylindrical specimens with dimensions of
50 mm, 75mm, 100 mm in diameter, and 100mm, 150mm and 200 mm in length,
respectively, and two types of cubic specimens with 50mm in width and 100 mm in
width, respectively [11, 117]. It was found that the cylinders with different diameters
appeared to have similar compressive strength, but the cubes had compressive strengths
about 5% higher than the cylinders [117]. Another study of developing UHPC with steam
curing at 90 oC found that cubes with dimensions of 50 mm, 70 mm and 100 mm showed
decreasing compressive strength as the dimensions of cubes increased for both UHPC
with and without reinforcing fibers [110].
The loading rate of compressive strength has been recognized to impact the test
results for conventional concrete [12]. As described in the ASTM C39, the loading rate
for cylinder is 0.28 MPa/s. However, if the UHPC cylinder with compressive strength of
150 MPa is tested at such a low rate, it would take as long as 9 min to finish testing on
one specimen. A study on the effect of loading rate on the test of UHPC under
compression showed that loading rates between 0.24 and 1.7 MPa/s had no noticeable
effect on the measured compressive strength, modulus of elasticity, and Poisson’s ratio
[11]. If this conclusion is true, the loading rate for testing UHPC can be set at a high end
in such range of loading rate to save time of testing.
The loading surface condition is another factor affect the measured compressive
strength. If cylindrical specimen is used for study, the polymer pad is not suitable for
UHPC which is stated in the ASTM standard that the polymer pad is only good for
concrete with strength lower than 83 MPa. In the past research, two methods were used
38
for testing cylindrical specimen: applying high strength capping material to form bond
capping or grinding the two ends of the specimen to a smooth and parallel condition
before test [4]. However, the effect of loading surface condition on the measured
compressive strength of UHPC has not been fully recognized, and the equipment for
preparing the loading surfaces is not easily available to many researchers. Cubic
specimen which does not have the loading surface problem is preferred for investigating
the compressive strength of UHPC.
2.4.4 Tensile strength
UHPC exhibits much higher tensile strength than conventional concrete, and the
tensile failure mode tends to be brittle the fiber is absent. Generally, the tensile strength
of UHPC was evaluated by methods including direct tensile test, split tensile test and
flexural strength test. Similar to the compressive strength, the widely used test methods
for tensile strength of UHPC are developed from the test method for the conventional
concrete, mostly derived from standard method such as ASTM C78 (third point flexural
strength of concrete) and ASTM C496 (splitting tensile strength). A standard method for
UHPC has not been developed.
As recognized in many studies, the strain-hardening phenomenon of fiber
reinforced UHPC is significant. Therefore, the tensile strength of UHPC has been
reported by two values, first-crack/pre-crack tensile strength and post-crack/peak tensile
strength. The standard tensile test methods designed to assess the cracking strength of
conventional concrete were considered appropriate for assessing the pre-crack tensile
strength of UHPC, but are unlikely to be appropriate for quantitatively assessing the post-

39
cracking tensile strength of UHPC [11]. The reason is that those methods include
assumptions of mechanical behaviors that are not consistent with strain-hardening fiber
reinforced concretes and thus are likely to overestimate the tensile strength of the UHPC
[4]. As described in some research on UHPC, the tensile behavior of UHPC was studied
by following ASTM C1609 which was developed for fiber reinforced concrete [109]. It
could capture the pre-crack tensile strength and post-cracking tensile strength. Similar to
the situation of the compressive strength test, there is no unified test method on the
tensile strength of UHPC has been developed. The difference in the tensile strength test
methods induced by factors like loading condition, specimen size and curing condition
should be noted.
For the study using direct tensile strength test, ultimate stress of 37 MPa was
achieved for UHPC specimens having square cross section of 50 mm × 50 mm under
ambient temperature curing, by mixing a cementitious matrix having a compressive
strength in excess of 240 MPa with high quality high strength twisted steel fibers at a
volume fraction of 5% [109]. It was also found that the tensile strength and the tensile
strain at peak stress was increased by increasing the compressive strength of the
cementitious matrix, tailoring the fiber geometry by shaping and twisting the fiber, or
increasing the fiber volume fraction within a proper range [109]. A study using Briquet
test specimens (AASHTO T 132) showed that the cracking loads was lower than the post-
crack peak loads [113]. This indicated that the fibers contributed to the post-cracking
tensile strength, while once the peak load was reached the specimens were unable to
continue to resist load [113].

40
For the flexural strength test of UHPC, a study using ASTM C1609 third point
loading on specimens cured at ambient temperature with square cross section of 50 mm ×
50 mm showed that that the ratio of post-crack flexural strength to post-crack direct
tensile strength of UHPC ranges between 2.4 and 2.65 [109]. In a study using 75 mm
square cross section third point flexural test (ASTM C78), UHPC using local material
was developed under ambient temperature curing with post-crack flexural strength of 25
MPa [9]. The size effect on the test flexural strength was also studied. Research has
shown that the tested post-crack third-point flexural strength from 100 mm square cross
section and 150 mm square cross section were almost identical, which was illustrated by
the test results that the 100 mm square cross section only showed 6% higher flexural
strength than the other [118]. Graybeal reported a UHPC with pre-crack flexural strength
of approximately 9.0 MPa for steam-cured specimens and approximately 6.2 MPa
without any heat treatment [11]. In another study, the depth of the specimens for both
flexural and direct tension tests ranged from 25 to 150 mm with width-to-depth ratios
ranging from 1 to 5, and the authors reported a decrease in both strengths with increasing
size of the test specimens [119]. More study found that the post-crack flexural tensile
strength of the 40 x 40 x 160 mm prisms was 1.47 times higher than that of the 100 x 100
x 300 prisms [110].
For the study of splitting tensile strength, the post-crack splitting tensile strength
was significantly improved with increasing fiber volume fraction. As study showed, the
post-crack splitting tensile strength of cylindrical specimen with dimensions of ϕ150 mm
× 300 mm was 19.0% to 98.3% higher than that of control (contained no fiber) for the
41
fiber content from 0.5% to 2.0%, and the achieved post-crack splitting tensile strength
was 11.5 MPa when the fiber content was 2% [120]. In a study using 75 mm diameter
cylinder with length of 150 mm (ASTM C496), UHPC cured under ambient temperature
using local material was developed with post-crack splitting tensile strength of 15 MPa
[9]. A study measured splitting tensile strengths at first cracking were 11.7 MPa for
steam-cured specimens and 9.0 MPa for untreated specimens [4].
2.4.5 Modulus of elasticity
For evaluating the modulus of elasticity of UHPC, The widely used test method is
ASTM C496 which was conducted on a cylindrical specimen with diameter of 100 mm
and length of 200 mm. The modulus of elasticity of UHPC is typically around 50 GPa [4,
5]. A study on the effect of curing regimes on the modulus of elasticity of UHPC showed
that at the age of 28 days the modulus of elasticity was 52.8 GPa for steam-treated, 42.8
GPa for untreated, 51.0 GPa for tempered steam-treated, and 50.3 GPa for delayed steam-
treated UHPC [11]. It was also observed from this study that the development of modulus
of elasticity of UHPC had good correlation with the development of compressive strength
of UHPC [11]. For specimens without steam curing, the modulus of elasticity increased
with curing age from 1 day to 28 days, as well as the compressive strength of UHPC [11].
For specimens with steam curing, the curing process accelerated the development of the
compressive strength, and whenever the compressive strength reached a steady value the
modulus of elasticity also became steady, and no significant further increase was
observed [11].

42
Other study also observed that the modulus of elasticity of UHPC specimens with
dimensions of ϕ150 mm × 300 mm was about 50 GPa at the age of 28 days, and the use
of silica fume, steel reinforcing fiber, or shrinkage reducing admixture did not show
significant impact on the modulus of elasticity of UHPC at the age of 28 days [5, 9].
2.4.6 Bond strength
Adequate bond between UHPC and precast concrete is critical to the integral
performance of structures using UHPC for the construction of connections. The bond
strength depends not only on the inherent characteristics of the two adjoining concrete
mixtures and but also on the surface conditions of the substrate concrete such as its
surface texture, cleanliness (or absence or presence of any surface coatings) and its
moisture content. Also, the magnitude of the bond strength is also dependent on the test
method employed. Typical test methods used to determine bond strength between UHPC
and precast concrete include slant-shear test (ASTM C882) and pull-off test (ASTM
C1583) which evaluate the bond performance between the two materials under shear and
direct tension, respectively. Splitting tensile test has also been used to evaluate bond
performance between two concrete mixtures under indirect tension [121, 122].
Several studies have been conducted in the past to evaluate the test methods and
the surface roughness on the bond strength. In a study, the influence of surface roughness
on the bond performance between UHPC and normal strength substrate concrete was
evaluated with three different bond test methods: splitting tensile test, slant-shear test and
pull-off test [121]. The substrate concrete surface conditions included sawed, brushed,
chipped, sandblasted and grooved surface [121]. Macro-texture depth test according to

43
ASTM E965 was conducted to evaluate the degree of roughness of textured substrate
concrete surface. The results showed that the roughness of the substrate concrete surface
was not a critical factor to obtain a good bond when the substrate surface was in saturated
surface dry condition [121]. This was attributed to an assumption that a saturated
substrate concrete surface helped to generate hydration products and create a high
cohesion between UHPC and substrate concrete, as a considerable amount of un-hydrated
cement presented in UHPC [121]. When the substrate surface was ambient dry, de-
bonding failure mode likely occurred when the substrate surface was not roughened
sufficiently [121]. However, a very different phenomenon was observed in a study on the
bond strength between conventional concrete substrates and UHPC toppings cured with
steam, where samples in which the substrate was saturated before placing the UHPC
achieved higher bond strengths than samples with a dry substrate [123].
Another study on the bond performance between UHPC and substrate concrete
was carried out with two different bond test methods: slant-shear test and splitting tensile
test [122]. The conditions of the substrate concrete surface included as cast without
roughening, sand blasted, wire brushed, drilled holes and grooved surface [122]. The
results showed that the highest bond strength was achieved by using sand blasted surface,
and the failure always occurred at the substrate concrete in both the bond test methods
[122]. The other four surface conditions did not provide adequate bond as some of the
specimens exhibited de-bonding failure in either of the two bond test methods, even when
the substrate concrete surface was in saturated surface dry condition [122]. However, one
of the shortcomings of this study was that it did not provide quantitative surface
44
roughness measurement on the different roughening methods [122]. Another
shortcoming of the previous studies on evaluation of the bond strength is related to the
test methods employed in the investigation. Test methods such as slant shear test, split
tensile and pull-off tests represent shear or indirect or direct tensile stress conditions,
which do not reflect flexural tensile stress conditions that are expected in shear key
connections.
From the perspective of the effect of the component materials on the bond
performance between UHPC and precast concrete, the use of silica fume was found to
increase the bond strength, but the use of steel fiber and shrinkage reducing admixture
did not show impact on the bond strength between UHPC topping and precast
conventional concrete substrate in slab pull-off test [5, 9].
2.4.7 Chloride ion permeability
The chloride ion permeability of UHPC has been studied by standard test
methods. The most frequently used standard test method used is ASTM C1202 (rapid
chloride penetration method -RCP). One of the main advantages of this method is
obtaining results within a relatively short duration of time. This test evaluates the
resistance of a concrete sample to the chloride ion penetration by measuring the amount
of electrical current that passes through a 50 mm thick slice of concrete in 6 hours. The
less amount of ion passing through the specimen, the lower the permeability of the
specimen has. The chloride ion permeability of UHPC has been found to be very
minimum in many studies [5, 9, 11]. The densified micro structure of UHPC due to the
low w/cm and high content of SCM were considered the reasons for the observed
45
minimum permeability [5, 9, 11]. In a study using w/cm of 0.2 and silica fume content of
20% by weight of cement, the observed chloride ion passed of UHPC cured under
ambient temperature was 64 coulombs following ASTM C1202 at the age of 28 days [9].
Charge passed less than 100 coulombs was classified as negligible according to the
category in ASTM C1202. Another study using ASTM C1202 method found that the
charge passed was less than 40 coulombs at 28 days for steam cured specimens, and the
charge passed was 360 and 76 coulombs at 28 and 56 days, respectively, for ambient
temperature cured specimens [11]. However, one of the shortcomings of ASTM C1202
method is the correlation between electrical resistivity and the RCP results, which makes
this method sensitivity to the presence of conductive reinforcing fibers in the concrete.
When the conductivity of sample is high, the chloride ion permeability measured from
this test would be significantly high [9]. Joule effect has been used to explain the relation
between conductivity and RCP result, which indicates that the increase in the temperature
of sample increase the mobility of ions in the pore solution [124]. Thus more charge
passed is observed for sample with higher conductivity.
Another standard test method is AASHTO T259 which does not involve the use
of electric current. This test evaluates the depth of the penetration of chloride ions in the
concrete specimen ponding in the chloride ions rich solutions. This test method can
eliminate the impact of conductive fibers on the test results. However, one of the main
shortcomings of this test is that it takes about 2 month to get results. If the UHPC has
very less permeability, no significant results can be observed even after 90 days test [11].
This method is not widely used for research on UHPC.
46
2.4.8 Shrinkage
The shrinkage behavior of UHPC includes drying shrinkage and autogenous
shrinkage which are resulted from different mechanisms. Drying shrinkage is caused by
loss of moisture from the UHPC. The widely used test method for the drying shrinkage of
UHPC is ASTM C596. This test is conducted on a specimen with dimensions of
25×25×285mm. A study showed that the use of steel fiber or SRA could significantly
reduce the drying shrinkage of UHPC cured under ambient temperature [9]. If both of
these two components were used together in a mixture with w/cm of 0.2, the achieved
ultimate drying shrinkage of UHPC was 580 micro-strain [9]. Another test method has
been used is ASTM C157. This test is conducted on a specimen with dimensions of
75×75×285mm. A study following ASTM C157 has found an ultimate shrinkage range of
620 to 766 micro-strains for 90 oC steam cured UHPC specimen, and 555 micro-strains
for UHPC specimens cured under ambient temperature [11].
Autogenous shrinkage is caused by the loss of water by the cementitious materials
hydration. A study following ASTM C1698 showed that the use of silica fume, steel
fiber, or SRA could significantly reduce the autogenous shrinkage of UHPC under
ambient temperature [5]. If all these three components were used together in a mixture
with w/cm of 0.2, the achieved ultimate autogenous shrinkage was 290 micro-strains at
the age of 48 hr after the final set [5]. Another study found that during the initial
hydration period, peak shrinkage of 64 millionths/hour was measured [11]. As much as
400 micro-strains of shrinkage occurred in the first 24 hours for specimens cured under
ambient temperature, and by following 90 oC steam curing, further shrinkage was almost

47
eliminated [11]. As for UHPC cured under other temperature range, a study reported
autogenous shrinkage of about 270 micro-strains and drying shrinkage of about 100
micro-strains at 350 days on 70 mm diameter cylinders cured at 50 °C [125]. For UHPC
cured at 42 °C, the total shrinkage measured for a mix containing meta-kaolin was
negligible compared with mixes with silica fume or fly ash [126]. To offset the
magnitude of autogenous shrinkage, the use of expansive additive and SRA has been
investigated and an autogenous shrinkage of more than 700 micro-strains would be
reduced to zero [127]. Another similar study reported that total shrinkage at 90 days was
reduced from 800 to 400 micro-strains [128]. Other studies using various test methods
and materials, such as SRA and internal curing agent, found a range of autogenous
shrinkage values which were 600 to 900 micro-strains at 28 days [129], 200 to 550
micro-strains at 150 days [130], and 640 micro-strains at 365 days [131].
2.4.9 Alkali-silica reaction
The study on the ASR of UHPC has been reported in few literature. It is
considered that UHPC is less vulnerable to the ASR deterioration due to the less
permeable micro structure, less free water presented inside the UHPC and the always
presented pozzolans in UHPC [4, 11]. In a study following the test method in ASTM
C1260, less than 0.02% expansion was observed even after 30 days of exposure to the
aggressive environment [11]. The conclusion in this study was that there should be no
concern of ASR problems in UHPC mainly due to the low permeability of UHPC [11].
48
2.5 Summaries of Literature Review
Based on the literature, the superior material properties of UHPC have been
recognized. However, challenges also exist in the development of UHPC, which are
summarized as follows:
a. The development of UHPC under ambient temperature curing has not
been comprehensively investigated.
b. Most of the research has been focused on the 28 day compressive strength
of UHPC, as the definition of UHPC evaluate 28 day compressive strength a critical
criterion for defining UHPC. However, from a perspective of UHPC application in rapid
construction work, such as shear key in precast highway bridges, the early age (i.e. 1 day)
properties of UHPC are important when the UHPC is aimed to achieve required
properties within a short period. The available literature on the early age properties of
UHPC is still limited.
c. The alkali content of cement has impact on the properties of concrete,
particularly the alkali-silica reaction. However, there is no available literature related to
UHPC.
d. The widely used pozzolans for developing UHPC is a low carbon silica
fume. Considering the high economic cost of low carbon SFU, it is important to find
potential substitutes to SFU, such as fly ash and meta-kaolin. However, there are very
few literature on this topic.
e. Significant research on the properties of UHPC has been conducted when
SFU and SFL have been used together and cured at elevated temperatures. The roles of

49
SFU and SFL at elevated temperature have been well studied. However, there is still
limited knowledge on the effect of SFU and SFL combination on the mechanical and
durability properties of UHPC at ambient temperature curing.
f. The material properties of UHPC under various mixture proportions of the
constituent materials are still not fully understood. More work is needed from both the
perspectives of optimizing properties and reducing economic cost of UHPC. For instance,
a study on the optimal sand content has not been found in the past literature related to
UHPC. Considering the economic benefit of increasing sand content, and the potential
decrease in the mechanical properties of UHPC, it is necessary to have this information to
make rational decision on mixture proportion of UHPC.
g. The interaction between sand content and steel fibers content in UHPC has
not been studied.
h. The performance of widely used chemical admixtures, such as chemical
accelerator and viscosity modifying admixtures have not been investigated in UHPC.
i. The guidelines on the selection of component materials and mixture
proportions of UHPC are limited. More research is needed on this topic.
j. Information is needed on the bond behavior between UHPC and precast
concrete.

50
CHAPTER
3 MATERIALS AND TEST METHODS
This chapter describes the experimental materials and the test procedures used for
study. With the principal objective of this research being to produce UHPC using locally
available materials, many of the materials used in this investigation were from local
sources. The test procedures used in this study included standard ASTM procedures,
modified procedures from standard ASTM procedures and other procedures being widely
used for scientific research.
3.1 Materials
3.1.1 Cementitious materials
3.1.1.1 Portland cement
A Type III portland cement meet ASTM C150 specification was used for
developing UHPC in this study. The cement was from ARGOS Cement Company in
Harleyville, South Carolina. Two batches of cement produced by the same manufacturer
at different time periods were used. The first batch cement was produced in the January
2013. The second batch cement was produced in the June 2014. The chemical and
physical properties of the cement are provided in Table 3.1.

51
Table 3.1 Chemical and physical properties of Type III Cement
Oxide content (%) Batch 1 Batch 2
SiO2 20.4 20.5
Fe2O3 3.5 3.5
Al2O3 5.0 4.9
CaO 64.4 64.1
MgO 1.0 1.3
Na2Oeq 0.49 0.47
SO3 3.5 3.6
LOI 1.0 1.34
Blaine’s surface area (m2/kg) 540 540
Specific gravity 3.15 3.15
3.1.1.2 Supplementary cementitious materials (SCM)
A low carbon content (LOI 2%) SFU with an off-white color was used. Table 3.2
lists the physical and chemical properties of SFU.
Table 3.2 Physical and chemical properties of materials
SFU
Specific gravity 2.2
Specific surface area (m2/kg) 20000 a
Particle size (µm) 0.15 b
Passing 325 mesh (%) 99.8
LOI (%) 2.0
SiO2 (%) 95.5
Fe2O3 (%) 0.3
Al2O3 (%) 0.7
CaO (%) 0.4
MgO (%) 0.5
Na2Oeq. (%) 1.4 a BET-Gas adsorption surface area; b Average particle size
Besides SFU, two types of class F fly ash and one type of meta-kaolin were also
investigated as substitutional SCM to SFU. The first type of class F fly ash was regular
fly ash (FA) with an average particle size of 10 microns. The second type of class F fly

52
ash was ultra-fine fly ash (UFA) with an average particle size of 3 microns. The average
particle size of meta-kaolin (MK) was 1.4 microns. The chemical properties of fly ash
and meta-kaolin are listed in Table 3.3.
Table 3.3 Physical and chemical properties of materials
Oxide content (%) FA UFA MK
LOI 2.39 1.75 1.36
SiO2 54.1 52.4 50.4
Fe2O3 8.0 5.7 0.45
Al2O3 27.8 23.2 42.6
CaO 1.3 7.49 0.02
MgO 0.9 1.71 0.16
Na2Oeq 2.13 1.17 0.22
SO3 0.16 0.8 0.00
3.1.2 Chemical admixtures
3.1.2.1 High range water reducing admixtures (HRWRA)
Eight different types of poly-carboxylate ester/ether-based HRWRAs were
compared in the initial stage of the study. One of the best performing HRWRA was
selected for use in the later study. The properties of the HRWRAs used in this study are
listed in Table 3.4.

53
Table 3.4 Properties of HRWRAs
HRWRA
ID Product name Manufacturer
Solid
content ,% Form
Specific
gravity
Bulk density,
kg/m³
SP1 Glenium® – 7500 BASF 26 Liquid 1.05 --
SP2 Chryso® –
Premia 150 Lafarge 30 Liquid 1.06 --
SP3 Chryso® –
Optima 203 Lafarge 22 Liquid 1.04 --
SP4 ADVA® 190 Grace 31 Liquid 1.07-1.09 --
SP5 ViscoCrete®
2100 SIKA 40 Liquid
1.075-
1.085 --
SP6 Melflux® 2651F BASF 100 Powder -- 300-600
SP7 Melflux® 6681F BASF 100 Powder -- 300-600
SP8 Melflux® 4930F BASF 100 Powder -- 300-600
As shown in Table 3.4, the first five types of HRWRA were in liquid form. The
water content in the HRWRA was subtracted from the mixing water during proportioning
cementitious mixtures. The last three five types of HRWRA were in powder form which
was convenient in proportioning cementitious mixtures.
3.1.2.2 Other types of chemical admixtures
Effect of viscosity modifying admixture (VMA), chemical accelerator and
shrinkage reducing admixture (SRA) on the properties of UHPC were investigated.
Specifically, the chemical admixtures included powder form shrinkage reducing
admixture (Prevent-C from Premier Magnesia) which was basically MgO more than 95%
in the product by mass, liquid form chemical accelerator (Chryso Turbocast 650A,
calcium nitrate based) which had solid content of 47% by mass, liquid form shrinkage
reducing admixture (BASF Masterlife® SRA20 meeting ASTM C494M requirements for

54
Type S) and liquid form viscosity modifying admixture (Sika Stabilizer 4R) which had
solid content of 25% by mass.
3.1.3 Fine aggregate
In total three types of sand were used in this study for different research purposes.
A natural siliceous sand from a local quarry was used as fine aggregate for developing
UHPC formulation. The specific gravity, water absorption, and fineness modulus of the
fine aggregate were 2.62, 0.30%, and 2.65, respectively. The LOI of sand is 0.445%. The
influence of this natural siliceous sand on the properties of UHPC was compared with
that of Ottawa sand. An alkali-silica reactive sand named Jobe sand from EI Paso, TX
was used as fine aggregate to study the performance of UHPC under the distress due to
alkali-silica reaction (ASR). The appearances of the sand grains are shown in Figure 3.1.
The three figures in Figure are not in the same scale.
(a) Glasscock sand (b) Jobe sand (c) Ottawa sand
Figure 3.1 Appearances of the sand

55
The influence of natural siliceous sand on the properties of UHPC was studied at
five gradation conditions which are natural gradation, coarse gradation as per ASTM
C33, fine gradation as per ASTM C33, Ottawa sand gradation 1 and Ottawa sand
gradation 2. The coarse gradation and fine gradation as per ASTM C33 were prepared by
modifying the natural gradation of natural sand to a coarse gradation and a fine gradation
in ASTM C33, respectively. These three gradation conditions were compared to study the
effect of gradation of natural sand on the properties of UHPC. The Ottawa sand gradation
1 and Ottawa sand gradation 2 were prepared by modifying the natural gradation of
natural sand to the gradations of two Ottawa sand as purchased. The properties of UHPC
using natural sand were compared with that of UHPC using Ottawa sand under the same
gradation condition. The reactive sand was used under its natural gradation to evaluate
the properties of UHPC subjected to ASR distress. The natural gradation of the natural
siliceous sand and the Jobe sand all met the requirement in the ASTM C33. The
gradations of the sand are listed in Table 3.5.
Table 3.5 Gradation of sand
Sieve Percent Passing
NS a Natural NS a Coarse NS a Fine OS b 1 OS b 2 Jobe
9.5-mm 100.0 100.0 100.0 100.0 100.0 100.0
4.75-mm 99.8 97.0 100.0 100.0 100.0 99.4
2.36-mm 97.1 90.0 100.0 100.0 100.0 90.2
1.18-mm 82.0 60.0 82.0 100.0 100.0 67.9
600-µm 41.9 33.0 55.0 0.0 99.3 40.6
300-µm 14.0 10.0 23.0 0.0 22.4 8.6
150-µm 0.5 0.0 10.0 0.0 0.0 0.7
75-µm 0.1 0.0 0.0 0.0 0.0 0.1
FM c 2.65 3.10 2.30 3.00 1.78 2.93 a Natural siliceous sand; b Ottawa sand; c Fineness modulus according to ASTM C136
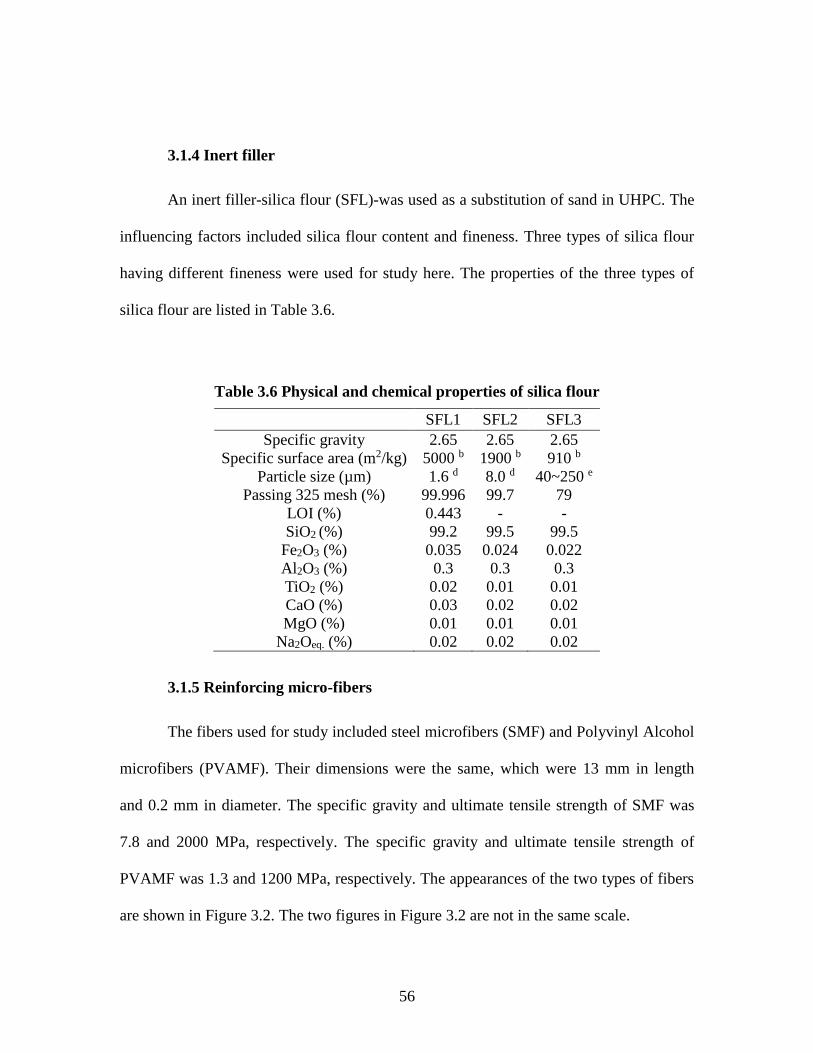
56
3.1.4 Inert filler
An inert filler-silica flour (SFL)-was used as a substitution of sand in UHPC. The
influencing factors included silica flour content and fineness. Three types of silica flour
having different fineness were used for study here. The properties of the three types of
silica flour are listed in Table 3.6.
Table 3.6 Physical and chemical properties of silica flour
SFL1 SFL2 SFL3
Specific gravity 2.65 2.65 2.65
Specific surface area (m2/kg) 5000 b 1900 b 910 b
Particle size (µm) 1.6 d 8.0 d 40~250 e
Passing 325 mesh (%) 99.996 99.7 79
LOI (%) 0.443 - -
SiO2 (%) 99.2 99.5 99.5
Fe2O3 (%) 0.035 0.024 0.022
Al2O3 (%) 0.3 0.3 0.3
TiO2 (%) 0.02 0.01 0.01
CaO (%) 0.03 0.02 0.02
MgO (%) 0.01 0.01 0.01
Na2Oeq. (%) 0.02 0.02 0.02
3.1.5 Reinforcing micro-fibers
The fibers used for study included steel microfibers (SMF) and Polyvinyl Alcohol
microfibers (PVAMF). Their dimensions were the same, which were 13 mm in length
and 0.2 mm in diameter. The specific gravity and ultimate tensile strength of SMF was
7.8 and 2000 MPa, respectively. The specific gravity and ultimate tensile strength of
PVAMF was 1.3 and 1200 MPa, respectively. The appearances of the two types of fibers
are shown in Figure 3.2. The two figures in Figure 3.2 are not in the same scale.

57
(a) Steel microfibers (b) Polyvinyl Alcohol microfibers
Figure 3.2 Reinforcing fibers used for study of UHPC
3.1.6 Sodium hydroxide
A reagent grade sodium hydroxide (NaOH) in pellet form was used for two
purposes. For the study on the effect of alkali content of cement on the properties of
UHPC, NaOH was used to boost up the alkali content of the virgin cement. For the study
of ASR distress in UHPC, NaOH was used to prepare a 1 normal (1N) solution for
soaking the specimens.
3.1.7 Precast concrete
Precast concrete was prepared to study the bond performance between UHPC and
precast concrete. The mixture proportions of the precast concrete are given by
manufacturer and shown in Table 3.7.
Table 3.7 Mixture proportions of precast concrete (kg/m3)
Type I cement Fly ash Coarse aggregate Fine aggregate Water HRWRA
433 64 964 775 161 3.0
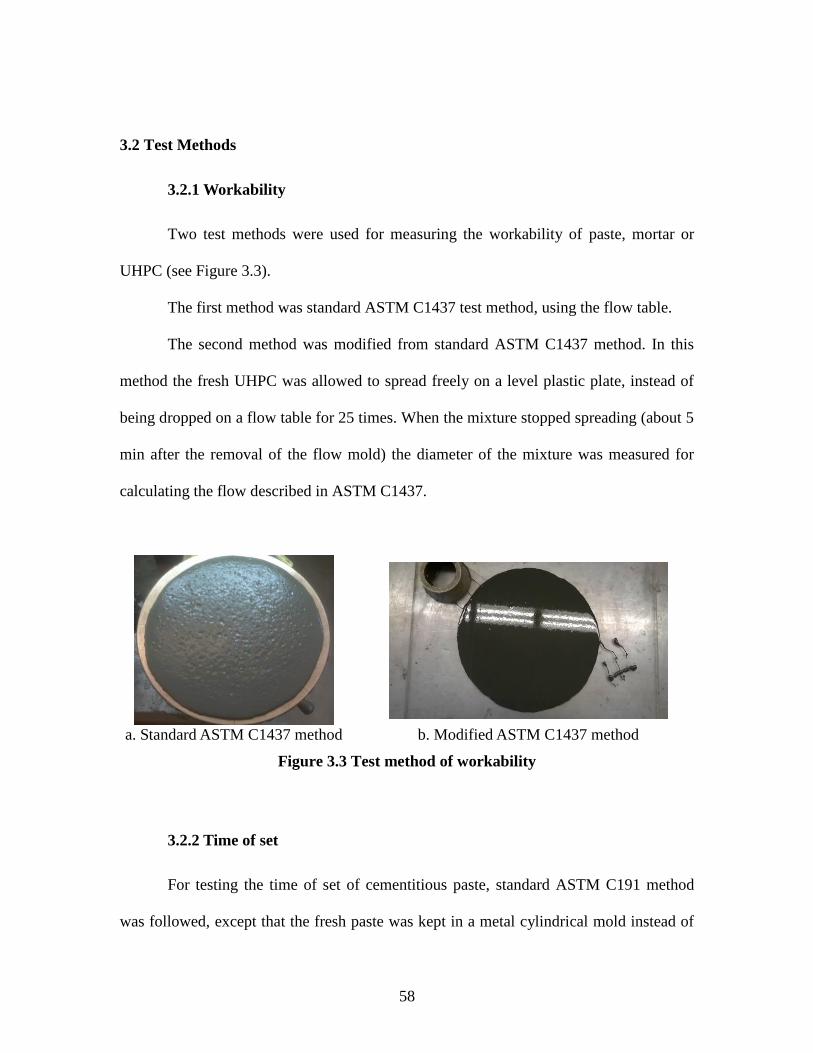
58
3.2 Test Methods
3.2.1 Workability
Two test methods were used for measuring the workability of paste, mortar or
UHPC (see Figure 3.3).
The first method was standard ASTM C1437 test method, using the flow table.
The second method was modified from standard ASTM C1437 method. In this
method the fresh UHPC was allowed to spread freely on a level plastic plate, instead of
being dropped on a flow table for 25 times. When the mixture stopped spreading (about 5
min after the removal of the flow mold) the diameter of the mixture was measured for
calculating the flow described in ASTM C1437.
a. Standard ASTM C1437 method b. Modified ASTM C1437 method
Figure 3.3 Test method of workability
3.2.2 Time of set
For testing the time of set of cementitious paste, standard ASTM C191 method
was followed, except that the fresh paste was kept in a metal cylindrical mold instead of

59
conical ring to prevent the highly flowable paste from leaking. The diameter of the
cylindrical mold was 80 mm. The height of the finished paste sample in the cylindrical
mold was 40 mm.
For testing time of set of mortar and UHPC, standard ASTM C403 method was
followed. Freshly prepared mixture was filled in a cylindrical mold having a diameter of
150 mm and a length of 150 mm and leveled using mechanical vibration.
3.2.3 Density and air content of fresh mixture
The density and air content of fresh mortar/UHPC was determined by following
ASTM C138 method and ASTM C231 method, respectively.
3.2.4 Autogenous shrinkage
The autogenous shrinkage of selected UHPC mixtures was determined according
to ASTM C1698 test method (see Figure 3.4). The freshly prepared mixture was filled in
a corrugated plastic mold that offered little resistance to length change of the test
specimen. The mold was sealed to prevent moisture loss and the specimen was stored at
constant temperature. Starting at the time of final setting, the length of the specimen was
measured using a comparator. The change in length was recorded at regular time intervals
up to 48 hours. The change in length and original length of the specimen were used to
compute the autogenous strain. Three specimens were tested for each mixture.
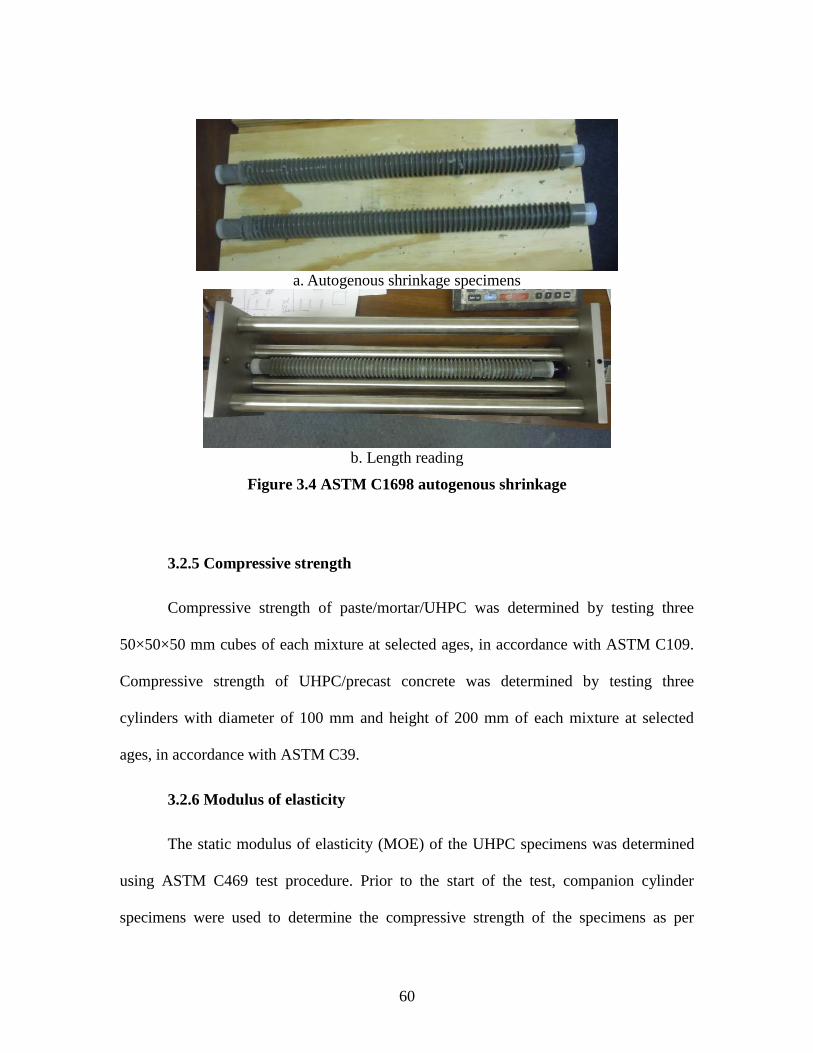
60
a. Autogenous shrinkage specimens
b. Length reading
Figure 3.4 ASTM C1698 autogenous shrinkage
3.2.5 Compressive strength
Compressive strength of paste/mortar/UHPC was determined by testing three
50×50×50 mm cubes of each mixture at selected ages, in accordance with ASTM C109.
Compressive strength of UHPC/precast concrete was determined by testing three
cylinders with diameter of 100 mm and height of 200 mm of each mixture at selected
ages, in accordance with ASTM C39.
3.2.6 Modulus of elasticity
The static modulus of elasticity (MOE) of the UHPC specimens was determined
using ASTM C469 test procedure. Prior to the start of the test, companion cylinder
specimens were used to determine the compressive strength of the specimens as per

61
ASTM C39 test method. Subsequently, three 100 mm x 200 mm cylinder specimens were
instrumented with compresso-meter and tested. The axis of the specimen was aligned
with the center of thrust of the spherically seating upper bearing block of the
hydraulically operated Universal Testing Machine (UTM). As the spherically-seated
block was brought slowly to bear upon the specimen, adjustments were made to ensure
uniform seating of specimen. The specimen was then loaded twice before the actual
readings were taken in order to account for appropriate seating of the gauges. Then, the
load was applied gradually without shock at a constant rate of 250 + 50 kPa/s. The
applied load and the corresponding strains were measured without any interruption until
the load was equal to 40% of the ultimate load of the specimen. The static modulus of
elasticity of the cylinder specimens, E was calculated as:
E = (S1-S2) / (ε2-0.00005) (3.1)
Where S2 = stress in MPa corresponding to 40 % of ultimate load,
S1 = stress in MPa corresponding to a longitudinal strain (ε1) of 50 millionths and
ε2 = longitudinal strain produced by stress S2.
3.2.7 Flexural strength
Two standard ASTM methods were used for research. Standard ASTM C348 was
used for paste/mortar/UHPC specimens. In this method, three specimens with dimensions
40×40×160 mm were prepared for each of the mixtures studied. Standard ASTM C78
was used for UHPC/precast concrete specimens. In this method, three specimens with
dimensions 75×75×285 mm were prepared for each of the mixtures studied.

62
Considering the difference in the pre-crack and post-crack flexural strength of
UHPC, a universal testing machine was used to monitor the relation between loading and
stroke during testing. The pre-crack and post-crack flexural strength of UHPC was
identified from the loading-stroke curve.
3.2.8 Splitting tensile strength
Standard ASTM C496 was conducted on cylindrical specimen with diameter of
75 mm and length of 150 mm to evaluate the splitting tensile strength of mortar/UHPC.
Only the post-crack splitting tensile strength was identified.
3.2.9 Thermo-gravimetric analysis (TGA)
TGA was conducted to investigate the Ca(OH)2 content in hardened concrete
which indicated the degree of hydration of cement. In this test, a sample weighing around
30 mg was prepared by grinding the center portion of a broken mortar cube specimen
(from compressive strength tests) into fine powder using a Retsch PM100 disc mill. This
would minimize the variance of test results caused by picking up debris containing large
fine aggregate grains. The weight change of sample was monitored while the sample was
gradually heated up to a temperature of 800 oC. The amount of Ca(OH)2 of each sample
was calculated based on the weight changes observed in the TGA curve at a specific
temperature range around 400-500°C.
To illustrate the calculation of the Ca(OH)2 content, an example is given in Figure
3.5. The weight loss curve shown in Figure 3.5 is the percent change in weight of sample
based on the original weight as the temperature increases. The first derivative curve

63
represents the rate of change in the weight loss upon the increase in the temperature. The
area covered under the peak observed in the first derivative curve indicates the weight
loss due to the decomposition of Ca(OH)2 to CaO and H2O between 400°C and 500°C.
To determine the Ca(OH)2 content decomposed, the weight loss (i.e. H2O released) is
correlated to Ca(OH)2 content by using the balanced equation Ca(OH)2 → CaO + H2O.
As shown in Figure 3.5, the weight loss due to the H2O released is 0.405%. Thus, the
Ca(OH)2 content of this sample is calculated as 1.67%.
Figure 3.5 Example TGA test result of one mortar mixture
Three samples were tested for each of the mixtures studied.
Weight Loss Curve
First Derivative Curve

64
3.2.10 Loss-on-ignition (LOI)
Loss-on-ignition was conducted to investigate the chemical bound water content
in hardened concrete which indicated the degree of hydration of cement. The center
portion of a broken compressive strength specimen was crushed and sieved to obtain a 40
g sample. Material passing through #4 sieve and retained on #8 sieve was selected for
this test. The sample was soaked in Propanol for 5 hr. at ambient temperature to dissolve
any free water. Then the debris was dried at 105 oC for 24 hr in an oven. The oven-dried
sample was heated up to 1000 oC at a rate of 200 oC/hr. in a muffle furnace and held at
that temperature for a period of 1 hr (see Figure 3.6). The weight change that occurred
between 105 oC and 1000 oC was recorded to determine the weight of the bound water. A
correction was made in order to account for the weight change due to LOI of the raw
materials such as cement, SFU, SFL, and sand.
Sample before test Muffle furnace Sample after test
Figure 3.6 Loss on ignition test
Three samples were tested for the LOI.

65
3.2.11 Rapid chloride ion penetration
Cylindrical specimens with a diameter of 100 mm and height of 50 mm were
prepared by sawing sections from a cylinder with diameter of 100 mm and height of 200
mm. ASTM C1202 was followed for RCP test at the age of 28 days. Three specimens
were tested.
3.2.12 Drying shrinkage
Three specimens with dimensions of 25×25×285 mm were prepared for each of
the mixtures studied. In accordance with ASTM C596, length comparator reading of each
specimen stored in the environmental chamber was taken at selected ages.
3.2.13 Volume of permeable void
Volume of permeable void of hardened mixture was determined by standard
ASTM C642 method. Three specimens were tested for each mixture.
3.2.14 ASR expansion
The test method in ASTM C1260 was modified to study expansion caused by
ASR distress in UHPC mixture. The mixture proportions described in ASTM C1260
were not followed. Three specimens with dimensions of 25×25×285 mm were prepared
and stored in the 1N NaOH solution with temperature of 80 oC for each of the UHPCs
studied. Length expansion reading of each specimen was taken at selected periods of
exposure, which was in accordance with ASTM C1260.

66
3.2.15 Flexural strength loss due to ASR
Six specimens with dimensions 40×40×160 mm were prepared for each of the
mixture studied. Three specimens were cured in tap water at 80 oC, and another three
specimens were cured in the 1N NaOH solution at 80 oC. At 28 days of exposure, the
flexural strength of these six specimens was tested, following the procedures described in
ASTM C348.
3.2.16 Bulk electrical resistivity of saturated concrete
Bulk resistivity of saturated concrete was measure by electrochemical impedance
spectroscopy which measured the response of a system to the application of a small-
amplitude alternating potential signal at different frequencies. The result obtained by this
method was a Nyquist plot [132]. A Nyquist plot was the plot of the imaginary
impedance component against the real impedance component at each excitation
frequency [132]. In this study, the Nyquist plots were used to measure the value of
concrete resistance of concrete. The saturated specimen for RCP test is used for this test
before RCP test. Three resistance readings were taken for each specimen. Four thickness
readings on the two diameter direction of the cylindrical specimen were taken for each
specimen. The measurements were carried out over a frequency range from 1 Hz to 1
MHz. Figure 3.7 shows an example of a Nyquist plot.

67
Figure 3.7 Example Nyquist plot for determining the bulk resistance [132]
The impedance component at the valley in Figure 3.7 indicates the bulk resistance
of saturated concrete. The electrical resistivity of mortar is calculated based on the
electrical resistance and the dimensions of the specimen.
3.2.17 Bond behavior between UHPC and precast concrete
3.2.17.1 Slant shear test
The slant shear test was modified from the test procedures described in ASTM
C882. The slant shear specimen was cylindrical specimen with diameter of 75 mm and
length of 150 mm. It consisted of two parts: half-slant shear specimen which was made of
precast concrete and another half-slant shear specimen which was made of UHPC. The
angle of the slant interface was 30o measured from the longitudinal axis of the specimen.
The precast half-slant shear specimen was prepared 28 days before applying UHPC. At
the age of 24 hour after casting precast concrete, the precast half-slant shear specimen
was de-molded and stored in the moisture room. At the age of 28 days, the precast half-

68
slant shear specimen was taken out of the moisture room, and the slant surface was
roughened with a sand blaster. The roughening treatment proceeded until the surface
layer of cement paste was removed and the aggregate was exposed. The finished precast
half-slant shear specimen is shown in Figure 3.8a. Then the roughened surface was
damped to saturated surface dry state, and the precast half-slant shear specimens were put
back into corresponding cylindrical mold. Fresh UHPC was placed into the mold to cover
the precast half-slant shear specimen to form a full composite cylinder. At the age of 24
hour after casting UHPC, the specimens were de-molded and stored in the moisture
room. The finished full specimen is shown in Figure 3.8b. At the age of 28 days after
casting UHPC, the specimens were tested. The entire age of the precast half-slant shear
specimen was 56 days when the test was carried out.
(a) Half-slant shear specimen
of conventional concrete
(b) Finished full slant shear
specimen
Figure 3.8 Specimen for slant shear bond strength test
An adequate bond between UHPC and precast concrete was indicated by a failure
in the precast concrete portion. A poor bond between UHPC and precast concrete was
indicated by a failure of de-bonding.

69
3.2.17.2 Third-point flexural test
The specimen for third-point flexural test was prismatic specimen with square
cross-section of 75mm × 75mm. The length of this prismatic specimen was 300 mm.
Similar to the specimen for slant shear test, specimen for third-point flexural test
consisted of two parts: half-prismatic specimen which was made of precast concrete and
another half-prismatic specimen which was made of UHPC. The interface was
perpendicular to the longitudinal axis of the specimen. The precast half-prismatic
specimen was prepared 28 days before applying UHPC. At the age of 24 hour after
casting precast specimen, the half-prismatic specimen was de-molded and stored in the
moisture room. At the age of 28 days, the half-prismatic specimen was taken out of the
moisture room, and the interface was also roughened with a sand blaster until the surface
layer of cement paste was removed and the aggregate was exposed. The finished half-
prismatic specimen of conventional concrete is shown in Figure 3.9a. Then the roughened
surface was damped to saturated surface dry state, and the precast half-prismatic
specimen was put back into corresponding mold (see Figure 3.9b). Fresh UHPC was cast
into the mold afterward to form a full composite prism. At the age of 24 hour after
casting UHPC, the specimen was de-molded and stored in the moisture room. The
finished full specimen is shown in Figure 3.9c. At selected testing age after casting
UHPC, the specimens were tested in flexure.

70
(a) Half-prismatic specimen
of conventional concrete (b) Mold
(c) Finished full
specimen
Figure 3.9 Specimen for third-point bond strength test
As Figure 3.9c shows, the dark color portion of the specimen is UHPC, the light
color portion is conventional concrete. The loading system is shown in Figure 3.10.
Figure 3.10 loading system of third point flexural bond test
An adequate bond between UHPC and precast concrete was indicated by a failure
in the precast concrete portion under flexural moment. A poor bond between UHPC and
precast concrete was indicated by a failure of de-bonding under flexural moment.

71
3.2.17.3 Pull-off test
The specimen for pull-off test was prepared by placing a 25 mm thick layer of
fresh UHPC mixture on the roughened top surface of a precast concrete slab. The
roughened surface was damped to saturated surface dry state before casting UHPC. Each
of these specimens was stored in the lab under ambient temperature (23 oC). Tap water
was sprayed on the UHPC layer periodically to keep the surface wet and cured. Three
shallow cores with diameter of 56 mm were drilled into the UHPC overlaid precast
concrete surface for each testing age. The drilling bit was controlled to penetrate into the
slab with a depth of 50 mm. So, the core specimen consisted of 25 mm thick UHPC and
25 mm thick precast concrete. A high strength epoxy was used to glue the aluminum disc
on the top of core specimen for loading. The test method is shown in Figure 3.11.
a. Pull-off tester b. Failed specimens
Figure 3.11 Test method of pull-off bond test
An adequate bond between UHPC and precast concrete was indicated by a failure
under direct tension in the precast concrete portion. A poor bond between UHPC and
precast concrete was indicated by a failure of de-bonding under direct tension.
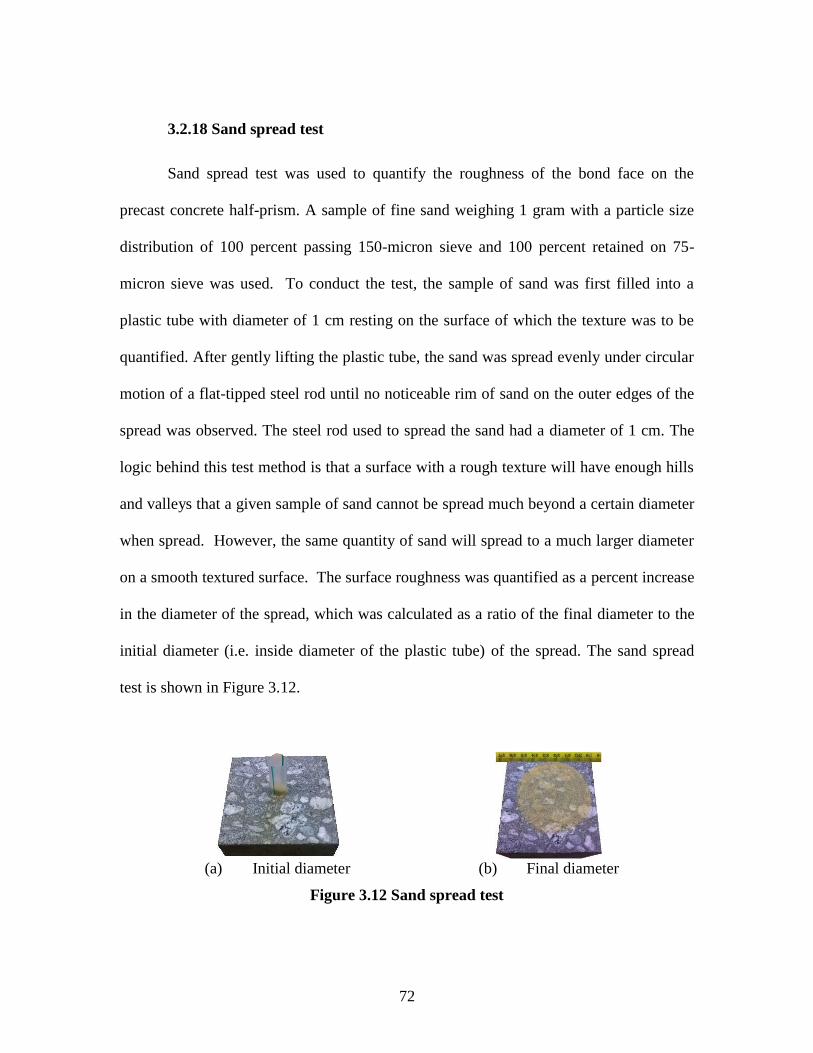
72
3.2.18 Sand spread test
Sand spread test was used to quantify the roughness of the bond face on the
precast concrete half-prism. A sample of fine sand weighing 1 gram with a particle size
distribution of 100 percent passing 150-micron sieve and 100 percent retained on 75-
micron sieve was used. To conduct the test, the sample of sand was first filled into a
plastic tube with diameter of 1 cm resting on the surface of which the texture was to be
quantified. After gently lifting the plastic tube, the sand was spread evenly under circular
motion of a flat-tipped steel rod until no noticeable rim of sand on the outer edges of the
spread was observed. The steel rod used to spread the sand had a diameter of 1 cm. The
logic behind this test method is that a surface with a rough texture will have enough hills
and valleys that a given sample of sand cannot be spread much beyond a certain diameter
when spread. However, the same quantity of sand will spread to a much larger diameter
on a smooth textured surface. The surface roughness was quantified as a percent increase
in the diameter of the spread, which was calculated as a ratio of the final diameter to the
initial diameter (i.e. inside diameter of the plastic tube) of the spread. The sand spread
test is shown in Figure 3.12.
(a) Initial diameter (b) Final diameter
Figure 3.12 Sand spread test
73
3.2.19 Laser profiling
Laser profiling gives visual and numerical information of the surface roughness of
sandblasted precast concrete. A LEXT OLS4000 laser profiler branded Olympus was
used to do the laser profiling (see Figure 3.13a). This tester provided the laser image and
the value of surface roughness index Sa of a square area with width of 640 μm on the
roughened surface. Considering the difference in the strength of mortar fraction and
coarse aggregate fraction in precast concrete, the roughness index Sa was distinguished
between these two fractions (see Figure 13b and 13c).

74
(a) Laser profiler (b) Coarse aggregate (c) Mortar
Figure 3.13 Laser profiling
An example of calculating Sa is given in Figure 3.14.
(a) Average height of the original profile (b) Lift up the curve fraction which is
below the average height
Figure 3.14 Calculation of Sa
This example starts with a two dimensional curve situation. To calculate the
roughness of the two dimensional curve, the first step is to find out the average height of
the original profile, see Figure 3.14a. The second step is to lift up the curve fraction
below the average height line, see Figure 3.14b. The third step is to calculate the average
height of the up-lifted curve, which is the roughness of the two dimensional curve. Sa is
Average height Average height

75
the similar scenario to the roughness of the two dimensional curve, as it is for a three
dimensional surface which is the profile of the substrate concrete surface.
3.2.20 Scanning electron microscopy (SEM)
This test provided information on the microstructure of hardened UHPC mixture.
The specimens were prepared by sectioning samples from the mortar bars using a
lapidary saw, followed by grinding and polishing the surfaces using resin-bonded
diamond discs (MD-Piano Discs from Struers Inc.) in grit sizes from #80 through #4000.
Mineral oil was used as lubricants. Glycol was used as cleaning agents. The SEM
examination was conducted in back-scatter mode using Hitachi TM 3000 unit. The unit
was operated in a variable-pressure mode and no conductive coating was applied on to
the samples.

76
3.3 Preparation of Fresh Mixture
Four mixing methods were followed at different stages of research work and for
different research purpose. The main reasons of using different procedures included the
lack of mixing power and the limitation of volume capacity of certain type of mixer.
3.3.1 Mixing method 1
This mixing method was carried out by using a Hobart N50 4.7-liter mortar
mixer. At first, the dry materials including cement, sand, were mixed for 1 min at low
speed (60 RPM). Then the mixing water was added to the dry mixture. The mixing
continued at low speed for 2 to 4 min before the mixture became flowable. Finally, the
flowable mixture was mixed for another 1 to 2 min at intermediate speed (120 RPM). The
entire mixing process lasted for 4 to 7 min.
3.3.2 Mixing method 2
This mixing method was carried out by using a UNIVEX M20 11-liter planetary
mixer. At first, the dry materials were mixed for 1 to 2 min at low speed (100 RPM).
Then the mixing water was added to the dry mixture. The mixing continued at low speed
for 3 to 4 min before the mixture became flowable. Finally, the flowable mixture was
mixed for another 1 to 2 min at medium speed (300 RPM). The entire mixing process
lasted for 5 to 8 min. When reinforcing fibers were used, they were added at the last step,
and the mixing continued for another 3 min.

77
3.3.3 Mixing method 3
This mixing method was carried out by using a Whiteman 248-liter mortar mixer.
A sequential mixing procedure was followed so as to not overload the mixer at the initial
stages when the UHPC mixture is highly viscous. As a first step, half of the dry materials
were mixed for 1 to 2 minutes. This was followed by adding half of water. As long as the
mixtures had enough ability to flow, the rest of the dry materials and liquid were
gradually introduced into the mixer. When SMF was used, it was added into the plastic
concrete mixture gradually and mixed thoroughly at the end of the mixing cycle. The
total process of mixing took 15 to 20 minutes.
3.3.4 Mixing method 4
This mixing method was also carried out by using a UNIVEX M20 11-liter
planetary mixer. Its difference from the method 3 is the significant longer time needed for
mixing the mixtures. At first, the dry materials were mixed for 1 to 2 min at low speed
(100 RPM). Then the mixing water was added to the dry mixture. The mixing continued
at low speed until the mixture became flowable. This step would last for up to 40 min to
achieve a flowable mixture. Finally, the flowable mixture was mixed for another 2 min at
medium speed (300 RPM). The entire mixing process lasted for 15 to 45 min depending
on the behavior of the fresh mixture. When reinforcing fibers were used, they were added
at the last step, and the mixing continued for 3 min.

78
CHAPTER
4 EXPERIMENTAL PROGRAM
This chapter describes experimental programs to study the impact of various
materials and their proportions on the properties of UHPC. Several UHPC mixtures are
developed. The experimental programs of evaluating the bond performance between
UHPC and precast concrete is illustrated as well. The mixture proportions of component
materials are designed referring to the approximate ranges of their mixture proportions
available in the literature, which are,
a. Water to cement ration (w/c) or water to cementitious materials ratio
(w/cm): less than 0.25 by mass [4, 7];
b. HRWRA to cementitious materials ratio: 0.5% ~ 3% by mass;
c. Pozzolans to cement ratio: 0% ~ 40% by mass;
d. Sand to cement ration (s/c) or sand to cementitious materials ratio (s/cm):
0 ~ 2.5 by mass;
e. Coarse aggregate is not used.
f. Steel fiber to the total UHPC mixture: 0% ~ 10% by volume [4, 7, 112]
The research is carried out into four stages:
Stage 1
As a preliminary study, various types of each of the component materials
including cement, HRWRA, sand and reinforcing fibers are studied from the perspective
of their influence on the properties of mortar. Selected types of component materials and
their proportions are used for the following studies.

79
Stage 2
The properties of cementitious paste or mortars prepared by portland cement with
different alkali content, several types of SCMs and different sand content are studied
under various proportions. Combined effect of sand and reinforcing fibers on the
properties of mortars are studied. Several cementitious paste formulations, sand content
and reinforcing fibers content are selected for the following studies.
Stage 3
The properties of mortar proportioned by selected cementitious paste
formulations, sand content and reinforcing fibers content are studied. Several UHPC
formulations are developed. Selected chemical admixtures are used to further improve the
properties of UHPC.
Stage 4
The bond behavior between UHPC and precast concrete are studied.

80
4.1 Preliminary Investigations on Materials’ Selection for UHPC
4.1.1 High range water reducing admixtures
In this part of study, the first batch of Type III cement was used. Properties of
portland cement mortars prepared with eight types of HRWRA (see Table 3.4) were
compared from the perspective of workability and 3-day compressive strength of mortar
at the same HRWRA dosage (based on solid content). In the first step, the five types of
liquid form HRWRAs were compared under the dosage range from 0% to 1.25% by
weight of cement in the same mortar formulations with w/c at 0.25 and s/c at 1.25 by
mass. Ottawa sand passing #30 sieve and retained on #100 sieve was used as fine
aggregate (see Table 3.5). In the second step, the three types of powder form HRWRAs
were compared with the best liquid form HRWRA from the first step at the HRWRA
dosage of 1.5% by weight of cement. The mortars were prepared with w/c at 0.2 and s/c
at 1.25 by mass. Natural siliceous sand with its natural gradation was used as fine
aggregate (see Table 3.3).
All the fresh mixtures for this part of study were prepared with a Hobart mortar
mixer following the mixing procedure 1 as discussed above. Immediately after finishing
mixing, the workability was measured. Vibration was applied to remove entrapped air
during casting. Specimens were kept in the moist room which was setup in accordance
with ASTM C511. Specimens were de-molded at 24 hr. after casting. The specimens
were stored in the moist room before test. Workability and compressive strength of
mortar were tested following corresponding standard ASTM test methods.

81
4.1.2 Fine aggregate
In this part of study, the first batch of Type III cement was used. The natural sand
and the Ottawa sand were compared. The gradations of natural sand was modified to be
the same gradations as Ottawa sand for comparison (see Table 3.5). The workability and
compressive strength of portland cement mortar using natural sand and Ottawa sand were
compared under the same HRWRA (ViscoCrete® 2100) dosage ranging from 0.5 to
1.25%. The w/c and s/c were set at 0.25 and 1.25, respectively. The first batch Type III
cement was used. The workability and compressive strength were tested following
corresponding standard ASTM test methods.
The effect of gradation of the natural sand on the workability, compressive
strength and drying shrinkage of portland cement mortar was studied under three
gradation conditions which were the natural gradation, a coarse gradation as per ASTM
C33 and a fine gradation as per ASTM C33 (see Table 3.3). The HRWRA (Melflux®
4930) dosage, w/c and s/c were set at 1%, 0.2 and 1.6 by mass, respectively. The tests
were conducted following standard ASTM test methods.
All the fresh mixtures for this part of study were prepared with the Hobart mortar
mixer following the mixing procedure 1 as discussed above. Immediately after finishing
mixing, the workability was measured. Vibration was applied to remove entrapped air
during casting. Specimens were kept in the moist room which was setup in accordance
with ASTM C511. Specimens were de-molded at 24 hr. after casting. The specimens
were stored in the moist room before test. Workability and compressive strength of
mortar were tested following standard ASTM test methods.

82
4.1.3 Silica fume and silica flour
In this part of study, the first batch of Type III cement was used. The proportions
of the materials in the mortars were designed to study the effect of SFU and SFL
combination on the compressive strength and the durability of mortar. w/cm was set at
0.225. SFU was used in addition to cement. SFL was used as replacement to sand. Thus
the filler material includes SFL and sand. The filler material to cementitious materials
ratio was fixed at 1.25. Table 4.1 shows the relative proportions of the ingredients in each
of the mortar mixtures.
Table 4.1 Relative proportions of ingredients used in mortar mixtures
Mortar ID c a/c a SFU/c a w/cm b FM b/cm = 1.25
HRWRA/c a Sand/FM c SFL1/FM c SFL2/FM c SFL3/FM c
C-0.225 1 0 0.225 1 0 0 0 0.0125
SFU-10%
(SFL1-0%) 1 0.1 0.225 1 0 0 0 0.0125
SFU-20% 1 0.2 0.225 1 0 0 0 0.0125
SFU-30% 1 0.3 0.225 1 0 0 0 0.0125
SFL1-10% 1 0.1 0.225 0.9 0.1 0 0 0.0125
SFL1-20% 1 0.1 0.225 0.8 0.2 0 0 0.0125
SFL1-30% 1 0.1 0.225 0.7 0.3 0 0 0.0125
SFL2-20% 1 0.1 0.225 0.8 0 0.2 0 0.0125
SFL3-20% 1 0.1 0.225 0.8 0 0 0.2 0.0125 a Cement; b Cementitious materials; c Filler materials (Sand +SFL)
As shown in Table 4.1, the first mortar was the control which did not contain
either SFU or SFL. The next three mortars, SFU-10%, SFU-20% and SFU-30% had SFU
content at 10%, 20%, and 30% by weight of cement, respectively, but did not contain
SFL. The effect of SFU addition on the properties of mortars was determined by
comparing the performance of these mortars with that of the mortar C-0.225. The
remaining 5 mortars contained both SFU and SFL, while the content of SFU was held
constant at 10% by weight of cement. In order to study the effect of SFL content on the

83
properties of mortar, three mixtures that contained SFL1 were designed and identified as
SFL1-10%, SFL1-20% and SFL1-30% which contained SFL1 at a dosage of 10%, 20%
and 30% by mass replacement of sand, respectively. To study the effect of fineness of
SFL at a given content, mortar mixtures SFL1-20%, SFL2-20% and SFL3-20% were
designed, wherein the SFL content was fixed at 20% by mass replacement of sand.
However, the fineness of SFL was varied as indicated by the use of three types of SFL,
i.e. SFL1, SFL2 and SFL3. SFL1 was the finest of the three SFLs and SFL3 was the
coarsest. In order to have fresh mixtures with at least 150% flow in accordance with
ASTM C1437, the dosage of HRWRA was kept at 1.25% by weight of cementitious
materials. Table 4.2 shows the detailed proportions for 1 m3 of each of the mortars.
Table 4.2 Mixture proportions for 1m3 of each of the mortars
Mortar ID Constituent (kg/m3)
Cement SFU Water Sand SFL1 SFL2 SFL3 HRWRA
C-0.225 980 0 221 1225 0 0 0 12.3
SFU-10%
(SFL1-0%) 880 88 218 1211 0 0 0 12.1
SFU-20% 799 160 216 1199 0 0 0 12.0
SFU-30% 731 219 214 1189 0 0 0 11.9
SFL1-10% 881 88 218 1090 121 0 0 12.1
SFL1-20% 881 88 218 970 242 0 0 12.1
SFL1-30% 882 88 218 849 364 0 0 12.1
SFL2-20% 881 88 218 970 0 242 0 12.1
SFL3-20% 881 88 218 970 0 0 242 12.1
The fresh mixtures were prepared by a UNIVEX M20 planetary mixer following
the mixing method 2. At first, the cementitious materials, filler materials, and the powder
HRWRA were dry mixed for 1 min at low speed (100 RPM), followed by the addition of

84
water. The mixing continued at low speed for 1 to 2 min before the mixture became
flowable. Finally, the flowable mixtures were mixed for another 3 to 4 min at medium
speed (300 RPM). The entire mixing process lasted for about 6 min. Before casting
specimens, flow tests were conducted to verify that the fresh mixtures had at least 150%
flow.
Vibration was applied to remove entrapped air during casting. Immediately after
casting, specimens were kept in the moist room which was setup in accordance with
ASTM C511. Specimens were de-molded at 24 hr. after casting. For the study of
compressive strength, RCP, bulk density, and volume of permeable voids, the specimens
were stored in the moist room before test. For the study of drying shrinkage, the
specimens were stored in saturated lime water for 2 days after de-molding, and then
stored in the environmental chamber throughout the test. Inside the environmental
chamber, the temperature and the relative humidity was maintained at 23±2 oC and
50±4%, respectively, which was in accordance with ASTM C157.
4.1.4 Reinforcing fibers
In this part of study, the second batch of Type III cement was used. PVA
microfibers and steel microfibers were used for study. The workability, compressive
strength and drying shrinkage of fiber reinforced cement mortar were studied. Fibers
were used at dosages of 1% and 2% by volume of total mixture. The HRWRA (SP8)
dosage, w/c and s/c were set at 1%, 0.2 and 1.25, respectively. All the fresh mixtures for
this part of study were prepared with a UNIVEX M20 planetary mixer following the
mixing method 2 as discussed above. Immediately after finishing mixing, the workability

85
was measured. No vibration was applied to remove entrapped air during casting.
Specimens were kept in the moist room which was setup in accordance with ASTM
C511. Specimens were de-molded at 24 hr. after casting. The specimens were stored in
the moist room before test. The tests were conducted following standard ASTM test
methods, except the modified ASTM C1437 method was used for measuring workability.

86
4.2 Preliminary Investigations on Developing UHPC
The initial attempt of developing UHPC was explored by investigating four
mixtures. The influencing factors include SFU content, SMF content and liquid form
SRA content. For this part of study, the w/cm was set at 0.2, and s/cm was set at 1.25.
The relative proportions of UHPC mixtures are show in Table 4.3.
Table 4.3 Relative proportions of UHPC mixtures
Mortar ID
By mass By volume
c a/c a SFU/c a w/cm b Sand/cm b HRWRA/cm b
SRA/cm b SMF F c H d
C 1 0 0.2 1.25 0.010 0.010 0 0
SU2 1 0.2 0.2 1.25 0.010 0.007 0 0
SU2F 1 0.2 0.2 1.25 0.010 0.010 0 0.02
SU2S 1 0.2 0.2 1.25 0.010 0.005 0.02 0.02 a Cement; b Cementitious materials; c Dosage for the study of fresh properties ; d Dosage for the
study of hardened properties
As shown in Table 4.3, the first mortar mixture C was the control. It was basically
a portland cement mortar without either SFU, SMF or SRA. The second mortar mixture
SU2 was prepared by adding SFU into the mortar mixture C. The SFU to cement ratio
was 0.2 by mass. The w/cm was kept constant at 0.2. The effect of SFU on the properties
of mortar was understood by comparing mortar C and SU2. The third mortar mixture
SU2F was prepared by adding SMF into the mortar mixture SU2. The SMF content was
2% by volume of the total mixture. The effect of SMF on the properties of mortar was
understood by comparing mortar SU2 and SU2F. The fourth mortar mixture SU2S was
prepared by adding SRA into the mortar mixture SU2F. The SRA content was 2% by

87
mass of cementitious materials. The effect of SRA on the properties of mortar was
understood by comparing mortar SU2F and SU2S. The mixture proportions for 1 m3 of
UHPC mixture are listed in Table 4.4.
Table 4.4 Mixture proportions for 1 m3 of UHPC mixture
UHPC ID
Constituents (kg/m3)
Cement SFU Water Sand SMF SRA HRWRA
F a H b
C 1005 0 201 1257 0 0 10.1 10.1
SU2 819 164 197 1229 0 0 9.8 7.2
SU2F 803 160 193 1204 156 0 9.6 9.6
SU2S 786 157 189 1179 153 19 9.4 4.7
The material properties of UHPC investigated included workability, air content of
fresh mixture, fresh density, time of set, compressive strength, splitting tensile strength,
flexural strength, modulus of elasticity, rapid chloride permeability, and drying
shrinkage. The bond performance between UHPC and precast concrete was studied with
three bond test methods: slant shear test, pull-off test and third point flexural bond test.
In this part of study, the first batch of Type III cement was used. All the fresh
mixtures for this part of study were prepared with a Whiteman mixer (0.248 m3)
following the mixing procedure 3 as discussed above. If SRA was used, it was dispersed
into the mixing water in advance. Immediately after mixing, the fresh properties of
UHPC were tested.
Even though the UHPC mixture was highly flowable, external vibration to the
molds was applied to remove any unintended entrapped air during casting. Specimens
cast for studying compressive strength, splitting tensile strength, flexural strength, MOE,
RCP, slant shear and flexural bond were kept in a moist room conforming to ASTM

88
C511 specification. At the age of 24 hours, specimens were demolded and stored in the
moist room until testing. For studying drying shrinkage of UHPC mixtures based on
ASTM C596, specimens were stored in the moist room and de-molded at the age of 24
hours. Subsequently, the specimens were stored in saturated lime water for 2 days after
de-molding, and then stored in an environmental chamber maintained at a temperature of
23±2 oC (73±3 oF) and a relative humidity of 50±4%, throughout the duration of the test.
For studying bond strength between UHPC and precast concrete by pull-off test, a 25 mm
(1 inch) thick layer of fresh UHPC mixture was placed on the roughened top surface of a
precast concrete slab. Each of these specimens was stored in the lab under ambient
conditions.
The material properties of UHPC were tested following standard ASTM test
methods (see Table 4.5).
Table 4.5 Material properties and test method
Properties ASTM
Specification
Tested Ages
(day)
Specimen Dimensions
(mm)
Workability C1437 0 --
Fresh density C138 0 --
Fresh air content C231 0 --
Time of set C403 0 --
Compressive strength C109 1,3,7, 28 50×50×50
Splitting tensile
strength C496 28 75×150
Flexural strength C78 28 75×75×300
MOE C469 28 100×200
RCP C1202 28 100×50
Drying shrinkage C596 Up to 177 25×25×285
89
The bond strength between UHPC and precast concrete was evaluated by three
test methods: slab pull-off test, flexural test and slant shear test.
With this initial study, the problems of developing UHPC using the materials and
proportions selected from experimental studies discussed above were identified and
addressed in the following research work.

90
4. 3 Effect of Alkali Content on the Properties of UHPC
The effect of alkali content of cement on the properties of cementitious mortar
was studied at 0.49%, 0.6%, 0.7%, 0.75% and 0.88% Na2Oeq by weight of portland
cement. Those properties included workability, compressive strength and durability. The
various alkali contents of cement were achieve by adding corresponding quantity of
reagent grade NaOH in to the virgin cement which had alkali content of 0.49% Na2Oeq.
The NaOH was dissolved into the mixing water before use. The fine aggregate was a
reactive sand (Jobe sand). The HRWRA (Melflux® 4930) dosage, w/cm and s/cm were
set at 1%, 0.2 and 1.25, respectively. A total of 9 mortar mixtures with and without FA
were investigated. In mixtures with fly ash, 17% of the cement by mass was replaced by
fly ash. The alkali content was increased to 0.6%, 0.7%, 0.75%, and 0.88% Na2Oeq by
mass of cement by adding reagent grade NaOH to the mixing water. The mixture
proportions of the 9 mortars are shown in Table 4.6.
Table 4.6 Relative proportions of mortar (by mass)
Mortar ID c a/cm b FA c/cm b Water/cm b HRWRA/cm b (%) Na2Oeq/c a (%)
C 1 0 0.2 0.75 0.49
A1 1 0 0.2 0.75 0.6
A2 1 0 0.2 0.75 0.7
A3 1 0 0.2 0.75 0.75
A4 1 0 0.2 0.75 0.88
A3a 1 0 0.2 1.0 0.75
A4a 1 0 0.2 1.5 0.88
CF 0.83 0.17 0.2 0.75 0.49
A4F 0.83 0.17 0.2 0.75 0.88 a Cement; b Cementitious materials; c Fly ash

91
As Table 4.6 shows, the first five mortar mixtures C, A1, A2, A3 and A4 had the
same mixture proportions except that the alkali content was varied from 0.49% to 0.88%
Na2Oeq by mass of cement. The dosages of HRWRA were kept constant at 0.75% by
mass of cementitious materials. The effect of alkali content on the workability, time of
setting, compressive strength and drying shrinkage of mortars without FA was
determined.
The next two mortar mixtures A3a and A4a were prepared by increasing the
dosage of HRWRA of mortars A3 and A4 to 1% and 1.5%, respectively, to match the
workability of other mixtures, i.e. mortars C, A1 and A2 (see Table 4.6). In this case, the
influence of compactibility on other properties was minimized. The effect of alkali
content on the ASR induced expansion and the associated loss in flexural strength of
mortars without FA was determined by comparing mortars C, A1, A2, A3a, and A4a.
The last two mortars CF and A4F were prepared by replacing 17% of the cement
with FA in mortars C and A4, respectively, while maintaining a constant dosage of
HRWRA at 0.75%. Mortars C, A4a, CF and A4F all exhibited similar workability. The
effect of alkali content on the workability, setting time, compressive strength and drying
shrinkage of mortars with FA was determined by comparing mortars C, A4, CF and A4F.
The effect of alkali content on the ASR induced expansion and associated loss in flexural
strength of mortars with FA was determined by comparing the performance of mortars C,
A4a, CF and A4F. The quantities of materials used for 1 m3 of mortar are presented in
Table 4.7.
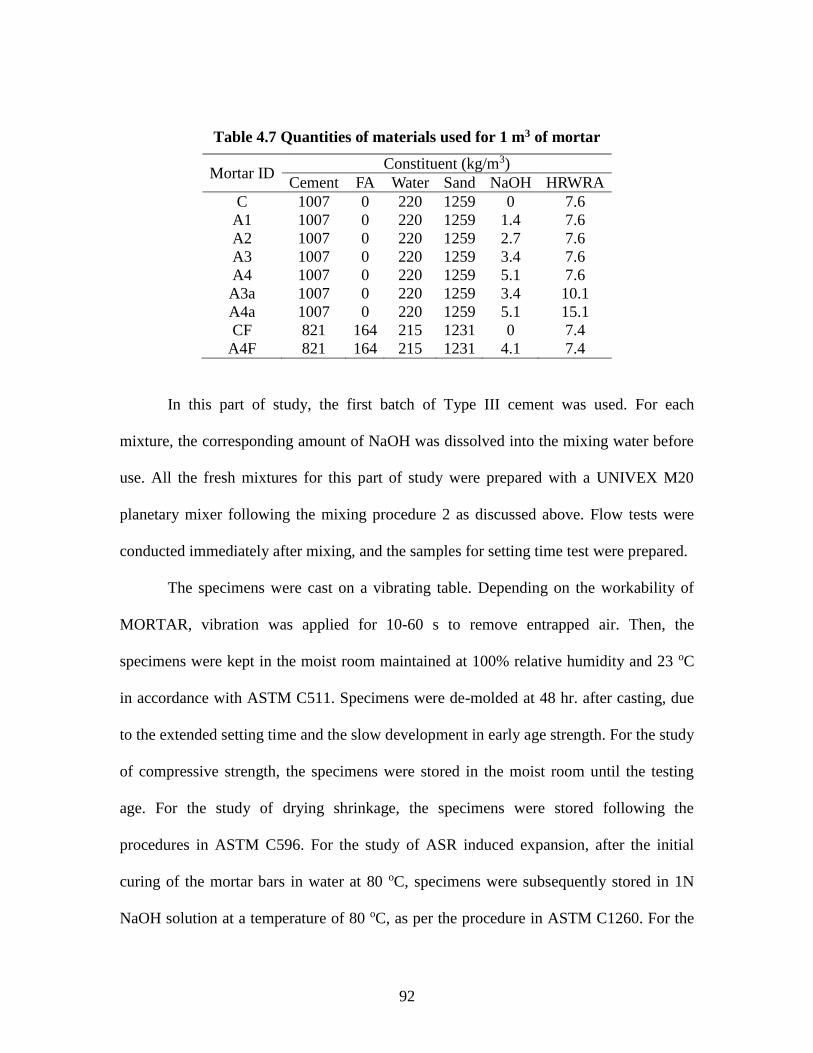
92
Table 4.7 Quantities of materials used for 1 m3 of mortar
Mortar ID Constituent (kg/m3)
Cement FA Water Sand NaOH HRWRA
C 1007 0 220 1259 0 7.6
A1 1007 0 220 1259 1.4 7.6
A2 1007 0 220 1259 2.7 7.6
A3 1007 0 220 1259 3.4 7.6
A4 1007 0 220 1259 5.1 7.6
A3a 1007 0 220 1259 3.4 10.1
A4a 1007 0 220 1259 5.1 15.1
CF 821 164 215 1231 0 7.4
A4F 821 164 215 1231 4.1 7.4
In this part of study, the first batch of Type III cement was used. For each
mixture, the corresponding amount of NaOH was dissolved into the mixing water before
use. All the fresh mixtures for this part of study were prepared with a UNIVEX M20
planetary mixer following the mixing procedure 2 as discussed above. Flow tests were
conducted immediately after mixing, and the samples for setting time test were prepared.
The specimens were cast on a vibrating table. Depending on the workability of
MORTAR, vibration was applied for 10-60 s to remove entrapped air. Then, the
specimens were kept in the moist room maintained at 100% relative humidity and 23 oC
in accordance with ASTM C511. Specimens were de-molded at 48 hr. after casting, due
to the extended setting time and the slow development in early age strength. For the study
of compressive strength, the specimens were stored in the moist room until the testing
age. For the study of drying shrinkage, the specimens were stored following the
procedures in ASTM C596. For the study of ASR induced expansion, after the initial
curing of the mortar bars in water at 80 oC, specimens were subsequently stored in 1N
NaOH solution at a temperature of 80 oC, as per the procedure in ASTM C1260. For the

93
study of ASR induced loss in flexural strength, two sets of specimens were prepared, one
set was stored in tap water and another in 1N NaOH solution. The temperature was 80 oC
for both curing conditions.

94
4.4 Effect of Sand Content on the Properties of Mortar
In This section, thirty seven different mortars were prepared to study the influence
of sand content on the fresh and hardened state properties of cementitious mortar at
various SFU and HRWRA (Melflux® 4930F) contents. SFU was proportioned at three
levels, 0%, 10%, and 20% by weight of cement. The HRWRA was dosed at four levels,
0.5%, 0.75%, 1%, and 1.5% by weight of cementitious material. Sand content, expressed
as s/cm by weight, was studied at 0, 0.5, 1.25, 1.6, and 2. For the entire study, the w/cm
by weight was fixed at 0.20. The investigated s/cm ranged from 0 to 2 for mortar with
and without silica fume. The experimental design is shown in Table 4.8. The mixture
proportions are shown in Table 4.9.
Table 4.8 Identifications of mortars
SFU HRWRA s/cm (level)
Content (%) level Dosage (%) level 0(1st) 0.5(2nd) 1.25(3rd) 1.6(4th) 2(5th)
0 C
0.5 1st C1-1 C1-2 C1-3 - -
0.75 2nd C2-1 C2-2 C2-3 C2-4 -
1 3rd C3-1 C3-2 C3-3 C3-4 C3-5
1.5 4th C4-1 C4-2 C4-3 C4-4 C4-5
10 L 0.75 2nd L2-1 L2-2 L2-3 L2-4 L2-5-
1 3rd L3-1 L3-2 L3-3 L3-4 L3-5
20 H 0.75 2nd H2-1 H2-2 H2-3 H2-4 H2-5-
1 3rd H3-1 H3-2 H3-3 H3-4 H3-5 Note: For UHPC ID, the letter in the front indicates the SFU content (C:0%, L:10%, and H:20%). The
following two numbers, i-j, indicate dosage level of HRWRA and s/cm, respectively. For example, L2-3
indicates UHPC with 10% SFU, the second level of HRWRA dosage which is 0.75%, and the third level of
s/cm which is 1.25; - Data unavailable. The dashed line in the table represents the distinction between
mixtures that were workable (to the left) and non-workable (to the right).

95
Table 4.9 Mixture proportions for 1 m3 of mortar
UHPC ID Constituent (kg)
UHPC ID Constituent (kg)
Cement SFU FA Water HRWRA Cement SFU FA Water HRWRA
C1-1 1933 0 0 387 9.7 L2-3 904 90 1244 203 7.5
C1-2 1413 0 707 285 7.1 L2-4 799 80 1406 180 6.6
C1-3 1007 0 1259 205 5.0 L2-5 705 70 1550 160 5.8
C2-1 1933 0 0 387 14.5 L3-1 1716 172 0 377 18.9
C2-2 1413 0 707 285 10.6 L3-2 1263 126 694 280 13.9
C2-3 1007 0 1259 205 7.6 L3-3 904 90 1244 203 9.9
C2-4 888 0 1421 182 6.7 L3-4 799 80 1406 180 8.8
C3-1 1933 0 0 387 19.3 L3-5 705 70 1550 160 7.7
C3-2 1413 0 707 285 14.1 H2-1 1542 308 0 370 13.9
C3-3 1007 0 1259 205 10.1 H2-2 1141 228 685 276 10.3
C3-4 888 0 1421 182 8.9 H2-3 821 164 1231 201 7.4
C3-5 783 0 1565 161 7.8 H2-4 725 145 1393 178 6.5
C4-1 1933 0 0 387 29.0 H2-5 641 128 1538 158 5.8
C4-2 1413 0 707 285 21.2 H3-1 1542 308 0 370 18.5
C4-3 1007 0 1259 205 15.1 H3-2 1141 228 685 276 13.7
C4-4 888 0 1421 182 13.3 H3-3 821 164 1231 201 9.8
C4-5 783 0 1565 161 11.7 H3-4 725 145 1393 178 8.7
L2-1 1716 172 0 377 14.2 H3-5 641 128 1538 158 7.7
L2-2 1263 126 694 280 10.4
In this part of study, the first batch of Type III cement was used. Fresh mortars
were prepared by using a UNIVEX M20 planetary mixer following mixing method 3.
Immediately after mixing, the flow test was conducted. The workability of the mortars
was evaluated by the modified test method from ASTM C1437.
Fresh mixture was poured into molds to prepare specimens for the test of
hardened properties of mortar. Flowable mortars were allowed to consolidate in the
molds under self-weight. However, for the other mortars which were not able to flow
under the self-weight, external vibration was applied for consolidating for about 30 s.

96
Specimens were kept in the moist room which was setup in accordance with ASTM C511
after casting, and de-molded 24 hr. later. For the study of compressive strength and RCP,
the specimens were stored in the moist room until the test. For the study of drying
shrinkage, the specimens were stored following the procedures in ASTM C596. The
compressive strength, drying shrinkage and RCP of mortar were evaluated following
standard ASTM methods.

97
4.5 Effect of Pozzolans on the Properties of UHPC
This part of study was aimed to find out potential pozzolan or combination of
pozzolans as substitute to silica fume to develop UHPC. To have a close view of the
behavior of SCMs on the properties of UHPC, only cementitious paste fraction of UHPC
was studied. The experiment was divided into two parts. In the first part, the effects of
binary blend of SCM (SFU, MK or UFA) and portland Type III cement (second batch) on
the properties of cementitious paste were comprehensively studied. The investigated
properties included workability, setting time, autogenous shrinkage, compressive strength
and drying shrinkage of paste. In the second part, workability, compressive strength and
drying shrinkage of paste using ternary blend of MK, UFA/FA and cement were studied,
in comparison with paste using binary blend of SFU and cement. For the entire
investigation, the w/cm by mass was fixed at 0.2, and the HRWRA (Melflux® 4930)
dosage was fixed at 1% by mass of total cementitious materials.
4.5.1 Paste using binary blend of SCM and cement
In this part, ten paste mixtures were investigated to study the properties of pastes
using binary blend of SCM and cement. The supplementary cementitious materials
content in the paste was expressed as the mass ratio of SCM to portland cement (SCM/c).
The investigated levels of SCM/c included 0, 0.05, 0.1, 0.2 and 0.3. The relative mixture
proportions of the ten paste mixtures are shown in Table 4.10.

98
Table 4.10 Relative proportions of materials in paste (by mass)
Paste ID ca/ca SFU/ca MK/ca UFA/ca SCMb/ca Water/cmc HRWRA/cmc (%)
C
1.00
0 0 0 0.00
0.20 1.0
S1 0.10 0 0 0.10
S2 0.20 0 0 0.20
S3 0.30 0 0 0.30
M1 0 0.05 0 0.05
M2 0 0.10 0 0.10
M3 0 0.20 0.20
UF1 0 0 0.10 0.10
UF2 0 0 0.20 0.20
UF3 0 0 0.30 0.30 Note: a cement; b supplementary cementing materials: SFU alone or MK+UFA; c cementitious materials: cement + SCM
As Table 4.10 shows, the first paste C was the control which only contained Type
III portland cement as cementitious material.
The next three pastes S1, S2, and S3 contained binary blend of SFU and cement
as cementitious material, and the corresponding levels of SCM/c were 0.1, 0.2 and 0.3,
respectively. The following three pastes M1, M2 and M3 contained binary blend of MK
and cement as cementitious material, and the corresponding levels of SCM/c were 0.05,
0.1 and 0.2, respectively. The maximum MK content was set at SCM/c=0.2 was based on
the concern of the prolonged mixing time and low workability of paste when MK content
was too high. The following three pastes UF1, UF2 and UF3 contained binary blend of
UFA and cement as cementitious material, and the corresponding levels of SCM/c were
0.1, 0.2 and 0.3, respectively. The maximum UFA content was set at SCM/c=0.3 was
based on the concern of the slow development of compressive strength of paste when
UFA content was too high. The effect of different types of SCM and their content on the
properties of paste was determined by comparing these ten mixtures.

99
The quantities of materials used for 1 m3 of paste are presented in Table 4.11.
Table 4.11 Quantities of materials used for 1 m3 of paste
Paste ID Constituent (kg/m3)
Cement SFU MK UFA Water HRWRA
C 1933 0 0 0 387 19.3
S1 1716 172 0 0 377 18.9
S2 1542 308 0 0 370 18.5
S3 1401 420 0 0 364 18.2
M1 1818 0 91 0 382 19.1
M2 1716 0 172 0 377 18.9
M3 1542 0 308 0 370 18.5
UF1 1731 0 0 173 381 19.0
UF2 1568 0 0 314 376 18.8
UF3 1433 0 0 430 373 18.6
4.5.2 Paste using ternary blend of MK, UFA and cement
In this part, eight paste mixtures were investigated to study the properties of
pastes using ternary blend of MK, UFA and cement. The supplementary cementitious
materials content in the paste was expressed as the mass ratio of SCM to portland cement
(SCM/c). The investigated levels of SCM/c included 0, 0.1, 0.2 and 0.3. Properties of
paste containing different proportions of MK, UFA and cement were compared with the
properties of paste containing different proportions of SFU and cement. The relative
mixture proportions of the ten paste mixtures are shown in Table 4.12. The quantities of
materials used for 1 m3 of paste are presented in Table 4.13.

100
Table 4.12 Relative proportions of component materials in paste containing ternary
blend of MK, UFA and cement
Paste ID ca/ca SFU/ca MK/ca UFA/ca SCMb/ca Water/cmc HRWRA/cmc (%)
MUF1
1.00
0 0.05 0.05 0.10
0.20 1.0
MUF2 0 0.05 0.15 0.20
MUF3 0 0.10 0.10 0.20
MUF4 0 0.05 0.25 0.30
MUF5 0 0.10 0.20 0.30
MUF6 0 0.20 0.10 0.30
MUF7 0 0.10 0.30 0.40
MUF8 0 0.20 0.20 0.40 a cement; b supplementary cementing materials: SFU alone or MK+UFA; c cementitious materials: cement + SCM
Table 4.13 Quantities of materials used for 1 m3 of paste containing MK, UFA and
cement
Paste ID Constituent (kg/m3)
Cement SFU MK UFA Water HRWRA
MUF1 1724 0 86 86 379 19.0
MUF2 1562 0 78 234 375 18.7
MUF3 1556 0 156 156 373 18.7
MUF4 1428 0 71 357 371 18.6
MUF5 1423 0 142 285 370 18.5
MUF6 1412 0 283 141 367 18.4
MUF7 1311 0 131 393 367 18.4
MUF8 1302 0 261 261 365 18.2
4.5.3 Paste using ternary blend of MK, FA and cement
In this part, eight paste mixtures were investigated to study the properties of
pastes using ternary blend of MK, FA and cement. The supplementary cementitious
materials content in the paste was expressed as the mass ratio. The relative mixture
proportions of the paste mixtures are same as previous which are shown in Table 4.10
and 4.12. The quantities of materials used for 1 m3 of paste are presented in Table 4.14.

101
Table 4.14 Quantities of materials used for 1 m3 of paste
Paste ID Constituent (kg/m3)
Cement SFU MK FA Water HRWRA
F1 1719 0 0 172 378 18.9
F2 1548 0 0 310 372 18.6
F3 1408 0 0 422 366 18.3
MF1 1717 0 86 86 378 18.9
MF2 1547 0 77 232 371 18.6
MF3 1545 0 155 155 371 18.5
MF4 1407 0 70 352 366 18.3
MF5 1406 0 142 281 365 18.3
MF6 1403 0 281 140 365 18.2
MF7 1289 0 129 387 361 18.0
MF8 1287 0 258 258 360 18.0
All the fresh mixtures for this part of study were prepared with a UNIVEX M20
planetary mixer following the mixing procedure 4 as discussed above. The mixing time
was divided into three parts: time of drying mixing, time of conversion (Tc) from dying
mixture to fluid mixture and time of fluid mixture (see Figure 4.1). The time of
conversion from dying mixture to fluid mixture was recorded. The workability,
compressive strength, volume of permeable voids and drying shrinkage of paste were
tested following standard ASTM test methods, except the modified ASTM C1437
method was used for measuring workability. The bound water content and TGA test were
also conducted.
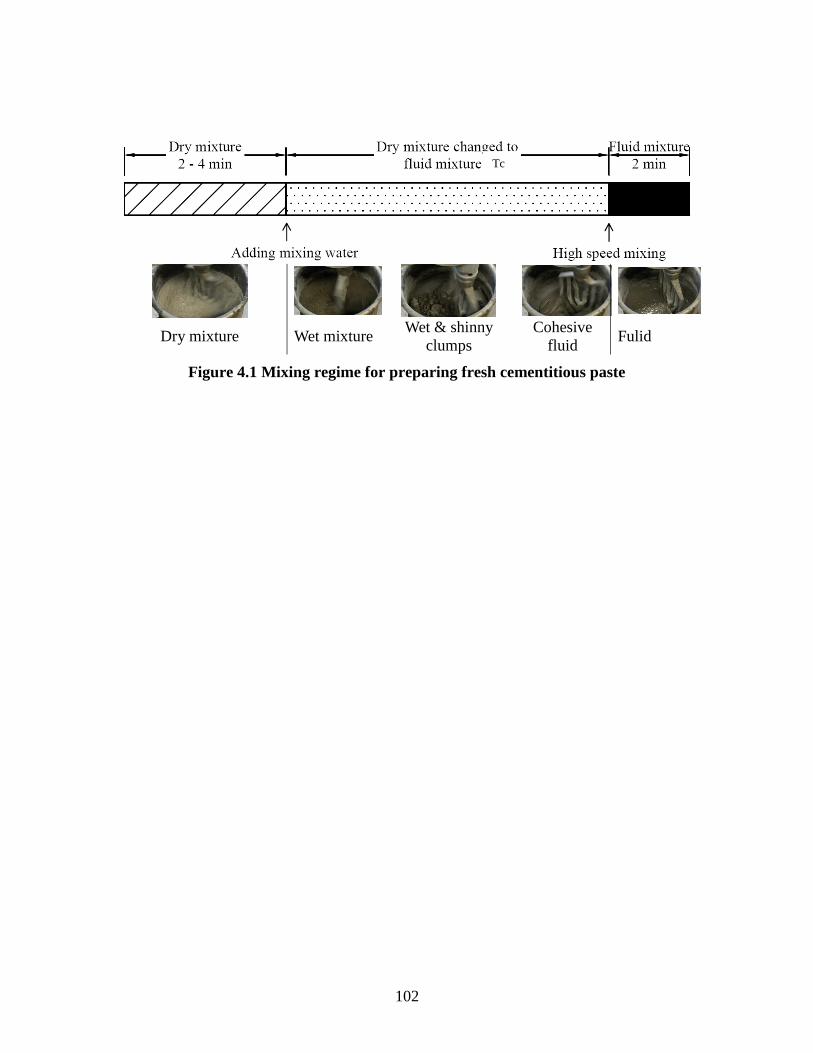
102
Dry mixture Wet mixture Wet & shinny
clumps
Cohesive
fluid Fulid
Figure 4.1 Mixing regime for preparing fresh cementitious paste
Tc

103
4.6 Combined Effect of Sand and Fiber on the Properties of UHPC
This part of study was aimed to find out the combined effect of sand content and
SMF content on the workability, compressive strength, flexural strength bulk electrical
resistivity, RCP and drying shrinkage of SMF reinforced mortar. Type III cement (second
batch) was the only cementitious material used. The sand content ranged from s/c=0 to
s/c=1.6 by mass. The SMF content ranged from 0% to 3%. For the entire study, the w/c
and HRWRA dosage was kept constantly at 0.2 and 1%, respectively. The relative
proportions of the component materials are shown in Table 4.15.
Table 4.15 Relative proportions of materials in mortar using SMF
Mortar ID By mass By volume
ca/cmb s/cmb Water/cmb HRWRA/cmb VSMF/VT
M00
1.00
0.00
0.20 0.01
0.00
M01 0.50 0.00
M02 1.25 0.00
M03 1.60 0.00
M11 0.50 0.01
M12 1.25 0.01
M13 1.60 0.01
M21 0.50 0.02
M22 1.25 0.02
M23 1.60 0.02
M31 0.50 0.03
M32 1.25 0.03
M33 1.60 0.03 Note: a cement; b cementitious materials
As Table 4.15 shows, the first mortar M00 was the control mortar which did not
contain either sand or SMF. It was basically cement paste. The next three mortar mixtures
M01, M02 and M03 were non-fiber reinforced mortars with sand content at s/c=0.5, 1.25
and 1.6, respectively. The last nine mortar mixtures were fiber reinforced mortars

104
prepared by adding SMF into mortars M01, M02 and M03 at contents of VSMF/VT=0.01,
0.02 and 0.03. The mixture proportions for I m3 of mixture are shown in Table 4.16.
Table 4.16 Quantities of materials used for 1 m3 of mortar using SMF
Mortar ID Constituents (kg/m3)
Cement Sand Water HRWRA SMF
M00 1933 0 387 19.3 0
M01 1413 707 283 14.1 0
M02 1007 1259 201 10.1 0
M03 888 1421 178 8.9 0
M11 1399 700 280 14.0 78
M12 997 1247 199 10.0 78
M13 879 1407 176 8.8 78
M21 1385 693 277 13.9 156
M22 987 1234 197 9.9 156
M23 870 1393 174 8.7 156
M31 1371 685 274 13.7 234
M32 977 1221 195 9.8 234
M33 862 1379 172 8.6 234
The bulk electrical resistivity of the SMF reinforced mortar was measured to
identify the segregation of SMF in the fresh mortar. The relation between the bulk
electrical resistivity and RCP values was discussed. To limit the effect of bulk electrical
resistivity on RCP test, PVAMF which were nonconductive were used at the same
content of SMF to study the effect of fiber on RCP. The relative proportions were same
as mortar M12 and M22. The mixture proportions for I m3 of mixture using PVAMF are
shown in Table 4.17.

105
Table 4.17 Quantities of materials used for 1 m3 of mortar using PVAMF
Mortar ID Constituents (kg/m3)
Cement Sand Water HRWRA SMF
MP12 997 1247 199 10.0 13
MP22 987 1234 197 9.9 26
All the fresh mixtures for this part of study were prepared with a UNIVEX M20
planetary mixer following the mixing procedure 4 as discussed above. All the tests were
conducted following standard ASTM test methods, except the modified ASTM C1437
method was used for measuring workability.

106
4.7 Development of UHPC
Selected paste formulations were used to develop UHPC. SMF content was set at
2% as SMF content at 1% did not have significant improve on the compressive strength
of UHPC. The sand content was set to be at least of s/cm=1.25, as lower sand content
than s/cm=1.25 would result in potential of severe segregation of SMF. All the fresh
mixtures for this part of study were prepared with a UNIVEX M20 planetary mixer
following the mixing procedure 4 as discussed above. All the tests were conducted
following standard ASTM test methods, except the modified ASTM C1437 method was
used for measuring workability.

107
4.8 Effect of Chemical Admixtures on the Properties of UHPC
The properties of UHPC was further improved by using chemical admixtures. The
study was divided into two parts. In the part of study, the workability, compressive
strength and drying shrinkage of cementitious paste using four types of chemical
admixtures were studied. The four types of chemical admixtures were used at the
manufacture recommended dosage, based on the solid content – cementitious materials
(sc/cm) ratio. The chemical admixtures included powder form shrinkage reducing
admixture (dosed at sc/cm=0.05), liquid form chemical accelerator (dosed at
sc/cm=0.02), liquid form shrinkage reducing admixture (dosed at 2% by mass of
cementitious materials) and liquid form viscosity modifying admixture (dosed at
sc/cm=0.001). The water content in the liquid form admixture was deducted from the
mixing water in the mixture. The mixture proportions of the 4 cementitious pastes are
shown in Table 4.18.
Table 4.18 Quantities of materials used for 1 m3 of paste
Paste
ID
Constituent (kg/m3) Type of Chemical
admixture Cement SFU Water HRWRA Chemical
admixture
CA1 1542 308 370 18.5 92.5 Powder SRA
CA2 1542 308 333 18.5 37 Liquid SRA
CA3 1542 308 328.3 18.5 78.7 Accelerator
CA4 1542 308 364.5 18.5 7.4 VMA
In this part of study, the second batch of Type III cement was used. All the fresh
paste mixtures for this part of study were prepared with a UNIVEX M20 planetary mixer

108
following the mixing procedure 4 as discussed above. The workability, compressive
strength and drying shrinkage of paste were studied. All the tests were conducted
following standard ASTM test methods, except the modified ASTM C1437 method was
used for measuring the workability of paste.
In the second part of study, selected chemical admixtures were used to improve
the performance of UHPC from the consideration of workability, compressive strength
and drying shrinkage. The virgin UHPC mixture was proportioned with w/cm=0.2 by
mass, s/cm=1.25 by mass, SMF dosage at 2% by volume of total mixture, and
HRWRA/cm=0.01 by mass. All the fresh mixtures for this part of study were prepared
with a UNIVEX M20 planetary mixer following the mixing procedure 4 as discussed
above. The workability, compressive strength and drying shrinkage of UHPC were
studied. All the tests were conducted following standard ASTM test methods, except the
modified ASTM C1437 method was used for measuring the workability of UHPC.

109
4.9 Bond Behavior between UHPC and Precast Concrete
4.9.1 Effect of substrate surface physical condition
In this part of study, the bond performance between UHPC and precast concrete
was investigated with the third-point flexural test. The bond performance was influenced
by four factors: precast concrete surface roughness, precast concrete surface moisture
condition, precast concrete surface cleanliness and the curing condition of the third-point
flexural specimens.
To study the influence of the precast concrete surface roughness on the bond
performance between UHPC and precast concrete, UHPC mixture was cast on the
substrate precast concrete with different surface roughness which included four sawed
face conditions roughened for 0 s, 10 s, 30 s and 60 s, and two molded face conditions
roughened for 0 s and 10 s (see Table 4.19). The surface roughness was quantified by
sand spread test and laser profiling. Before casting UHPC, the substrate precast concrete
surface was cleaned and prepared to saturated surface dry (SSD) condition. After casting,
specimens were demolded at the age of 24 hours and then cured in the moisture room
until the test at the age of 7 days.
To study the influence of the precast concrete surface moisture condition on the
bond performance between UHPC and precast concrete, UHPC mixture was cast on the
substrate precast concrete having molded face roughened for 0 s and 10 s (see Table
4.19). Before casting UHPC, the substrate precast concrete surface was cleaned and kept

110
ambient dry. After casting, specimens were demolded at the age of 24 hours and then
cured in the moisture room until the test at the age of 7 days.
To study the influence of the precast concrete surface cleanliness on the bond
performance between UHPC and precast concrete, UHPC mixture was cast on the
substrate precast concrete having molded face roughened for 10 s (see Table 4.19).
Before casting UHPC, the substrate precast concrete surface was not cleaned and was
kept ambient dry. After casting, specimens were demolded at the age of 24 hours and
then cured in the moisture room until the test at the age of 7 days.
To study the influence of the curing condition on the bond performance between
UHPC and precast concrete, UHPC mixture was cast on the substrate precast concrete
having molded face roughened for and 10 s (see Table 4.19). Before casting UHPC, the
substrate precast concrete surface was cleaned and kept ambient dry. After casting, the
composite specimens were demolded at the age of 24 hours and then placed outside the
lab until the test at the age of 7 days.
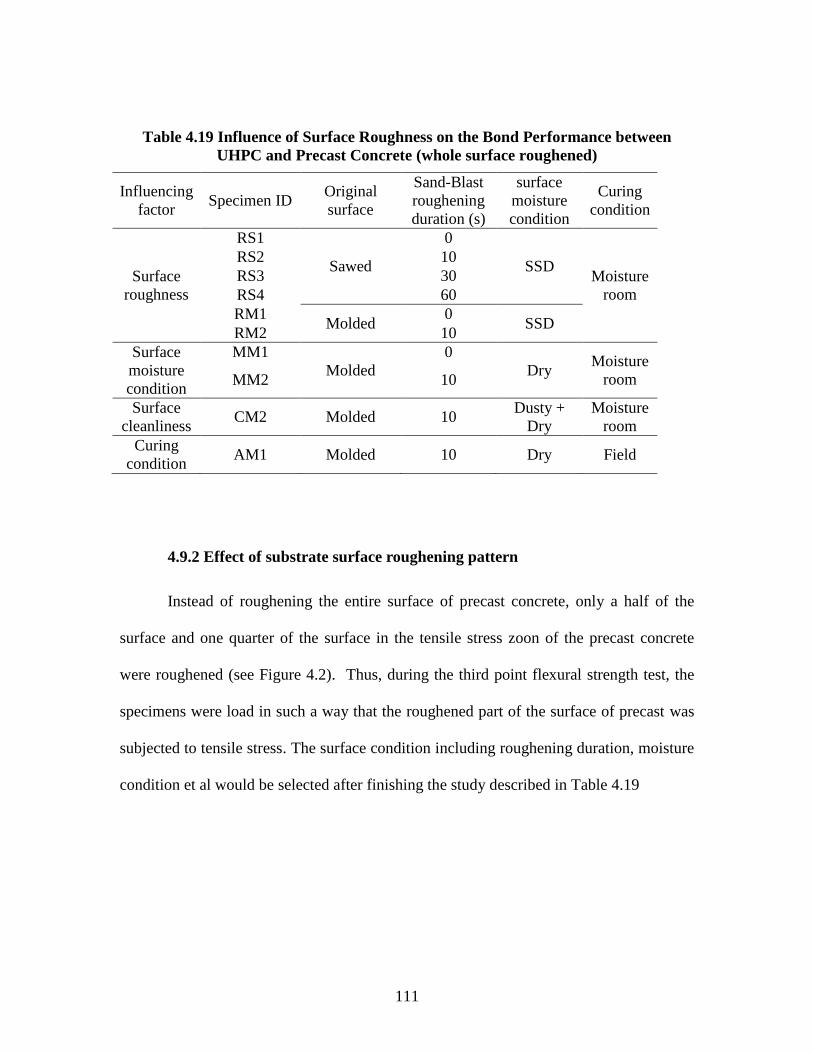
111
Table 4.19 Influence of Surface Roughness on the Bond Performance between
UHPC and Precast Concrete (whole surface roughened)
4.9.2 Effect of substrate surface roughening pattern
Instead of roughening the entire surface of precast concrete, only a half of the
surface and one quarter of the surface in the tensile stress zoon of the precast concrete
were roughened (see Figure 4.2). Thus, during the third point flexural strength test, the
specimens were load in such a way that the roughened part of the surface of precast was
subjected to tensile stress. The surface condition including roughening duration, moisture
condition et al would be selected after finishing the study described in Table 4.19
Influencing
factor Specimen ID
Original
surface
Sand-Blast
roughening
duration (s)
surface
moisture
condition
Curing
condition
Surface
roughness
RS1
Sawed
0
SSD Moisture
room
RS2 10
RS3 30
RS4 60
RM1 Molded
0 SSD
RM2 10
Surface
moisture
condition
MM1
Molded
0
Dry Moisture
room MM2 10
Surface
cleanliness CM2 Molded 10
Dusty +
Dry
Moisture
room
Curing
condition AM1 Molded 10 Dry Field

112
Whole surface roughened Half surface roughened Quarter surface roughened
Figure 4.2 Different roughening patterns
To maintain a constant surface roughness among the three roughening pattern, the
sandblasting process was controlled by a value defined as roughening intensity which is
calculated by the ratio of roughening duration to roughened surface area. For instance, if
the whole surface was roughened for 10 s, the half surface roughened pattern required 5 s
roughening, and the quarter surface roughened pattern required only 2.5 s roughening.
The second batch of Type III cement was used. All the fresh mixtures for this part
of study were prepared with a UNIVEX M20 planetary mixer following the mixing
procedure 4 as discussed above. After casting, specimens were demolded at the age of 24
hours and then cured in the moisture room until the test at the age of 7 days.
Plan View

113
CHAPTER
5 RESULTS AND DISCUSSIONS
This chapter presents the results of the various researches described in chapter 4.
Discussions are made to interpret the results.
5.1 Preliminary Investigations on Materials’ Selection for UHPC
This section includes the preliminary investigations on the influence of different
types of raw materials on the workability, compressive strength and drying shrinkage of
cementitious mortar with low w/cm (from 0.2 to 0.25). The raw materials include high
range water reducing admixtures, sand, silica fume, silica flour and reinforcing fibers.
5.1.1 High range water reducing admixtures (HRWRA)
The test results of the workability and 3-day compressive strength of fresh
mortars using different HRWRAs are shown in Figure 5.1.
(a) Workability of mortar using liquid
form HRWRA
(b) Workability of mortar using powder
form HRWRA

114
(c) 3-day compressive strength of mortar
using liquid form HRWRA
(d) 3-day compressive strength of mortar
using powder form HRWRA
Figure 5.1 Comparison of various HRWRAs
As shown in Figure 5.1a, the best liquid form HRWRA was SP5 (ViscoCrete®
2100) as the mortar using SP5 exhibited the highest flow value among mortars using
other liquid form HRWRAs under the same dosage level. To achieve a full flow (150%
flow) at w/c of 0.25, the dosage of ViscoCrete® 2100 should be higher than 0.6% by
weight of cement. If the w/c went down to 0.2 which was the typical value for UHPC, the
workability of the mixture using ViscoCrete® 2100 was only 56% even at the
manufacture recommended maximum dosage of 1.5% (see Figure 5.1b). If other
materials such as silica fume were to be used in the mixture to further improve the
compressive strength of mortar, the workability of fresh mortar would be even worse.
Due to this reason, ViscoCrete® 2100 was not good enough for developing UHPC.
Another three types of powder form HRWRAs were compared with ViscoCrete® 2100 at
the dosage of 1.5%, (Figure 5.1b). The HRWRA SP8 (Melflux® 4930F) was found to be
the best HRWRA among other HRWRAs. Mortar using SP8 presents 48% higher flow

115
value than mortar using SP5. Moreover, Melflux® 4930F performed well in maintaining a
good workability for the following 1 hour after mixing.
Figure 5.1c shows the compressive strength of mixtures using liquid HRWRA at
the highest dosage during the workability test presented in Figure 5.1a. The mixture using
SP4 failed to achieve final set even at 48 hr. Thus the compressive strength is not
presented. The compressive strength of mortar using ViscoCrete® 2100 at dosage of 0.6%
was slightly lower than the highest compressive strength achieved by mixture using SP2.
Figure 5.1d shows the compressive strength of mixtures using liquid or powder HRWRA
at fixed dosage of 1.5% by weight of cement. The compressive strength of mixture using
Melflux® 4930F at dosage of 1.5% was the highest compressive strength among others
including ViscoCrete® 2100. Based on the workability and 3-day compressive strength,
Melflux® 4930F was considered the best HRWRA and would be used for developing
UHPC.
5.1.2 Fine aggregate
5.1.2.1 Comparison between natural sand and Ottawa sand
The comparison of mortars using natural siliceous sand and Ottawa sand from the
perspective of workability and compressive strength of the mortars is shown in Figure
5.2.

116
(d) Workability of mortar (e) Compressive strength of mortar
Figure 5.2 Comparison between natural sand and Ottawa sand
As shown in Figure 5.2a, NS1 and NS2 represent natural sand with the same
gradation as OS1 and OS2 which are Ottawa sand, respectively. It was noted that the
mortars using sand with finer gradation presented less flow value than that using sand
with coarser gradation at all HRWRA (ViscoCrete® 2100) dosage levels, regardless of
natural sand or Ottawa sand being used. Under the same gradation, mortars using Ottawa
sand presented higher flow value than mixtures using natural sand. It was likely due to
the round particle shape of Ottawa sand, while angular particle shape of natural sand. The
workability of mortar using natural sand with natural gradation fell into the middle of the
workability of gradation modified natural sand and Ottawa sand.
As shown in Figure 5.2b, the mortars using sand with finer gradation presented
higher 3-day and 28-day compressive strength than that those using sand with coarser
gradation at the highest HRWRA dosage levels presented in Figure 5.2a, regardless of
natural sand or Ottawa sand being used. Mixture using Ottawa sand with finer gradation
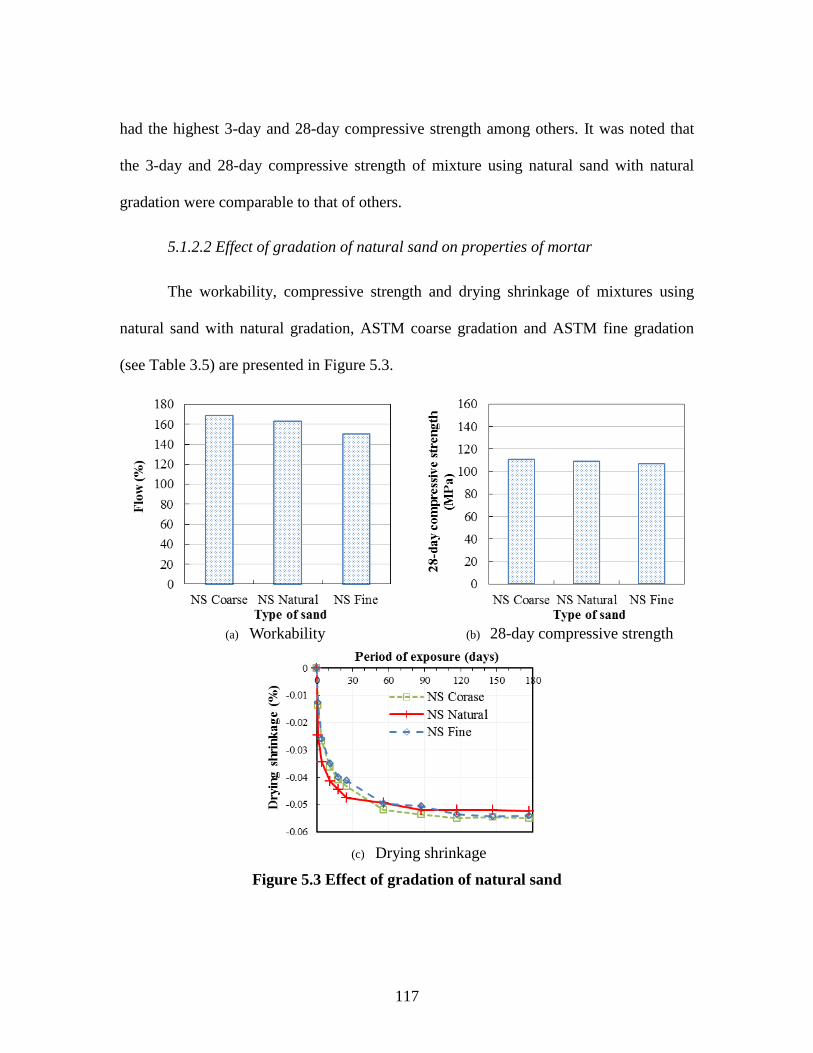
117
had the highest 3-day and 28-day compressive strength among others. It was noted that
the 3-day and 28-day compressive strength of mixture using natural sand with natural
gradation were comparable to that of others.
5.1.2.2 Effect of gradation of natural sand on properties of mortar
The workability, compressive strength and drying shrinkage of mixtures using
natural sand with natural gradation, ASTM coarse gradation and ASTM fine gradation
(see Table 3.5) are presented in Figure 5.3.
(a) Workability (b) 28-day compressive strength
(c) Drying shrinkage
Figure 5.3 Effect of gradation of natural sand

118
As shown in Figure 5.3a, the flow of mortars using natural sand slightly decreased
with the increase in the fineness of the gradation. For instance the flow of mortar using
natural sand with ASTM fine gradation was 7% lower than that of mortar using natural
sand with ASTM coarse gradation. As shown in Figure 5.3b, the 28-day compressive
strength of mortar was not significantly affected by the fineness of the gradation of sand.
It was also observed in Figure 5.3c that the drying shrinkage behavior of mortars was not
significantly affected by the gradation of sand either.
Both Figure 5.2 and Figure 5.3 indicate that the mortars using natural siliceous
sand with natural gradation presented acceptable performance in comparison with Ottawa
sand. The gradation of natural sand does not have significant effect on the workability,
compressive strength and drying shrinkage. Considering the potential increase in the cost
if Ottawa sand or natural sand with modified gradation is used as fine aggregate, natural
siliceous sand with natural gradation will be used in the future development of UHPC.
5.1.3 Silica fume and silica flour
5.1.3.1 Effect of SFU and SL on the compressive strength of mortar
The effects of SFU content, SFL content, and fineness of SFL on the compressive
strength of mortar at the ages of 1 and 28 days are presented in Figure. 5.4.

119
(a) Effect of SFU content (b) Effect of SFL content
(c) Effect of SFL fineness
Figure 5.4 Compressive strength of mortar containing SFU and SFL
As shown in Figure 5.4a, at the age of 1 day, the increase in the SFU content did
not significantly affect the compressive strength of mortar. However, at the age of 28
days, the increase in the SFU content up to 20% by mass of cement improved the
compressive strength of mortar by 21%. Beyond SFU content of 20%, the increase in the
SFU content resulted in reduction in the compressive strength of mortar. The
improvement in the compressive strength of mortar due to the use of SFU was significant
only in later ages, which was in accordance with previous findings and could be
(Finest)
120
attributed to the pozzolanic effect of SFU which was more prominent at later ages [12,
90].
As shown in Figure 5.4b, the effect of SFL content on the compressive strength of
mortar depended on the age of testing. At the age of 1 day, SFL content at 10% did not
have noticeable effect on the compressive strength of mortar compared with SFL content
at 0%. Beyond SFL content at 10%, the increase in the SFL content significantly
improved the early age compressive strength of mortar. For instance as the SFL content
increased to 20% and 30%, the compressive strength of mortar increased by 22% and
41%, compared with mortar without SFL, respectively. At the age of 28 days, SFL
content at 10% slightly increased the compressive strength by 3%, compared with mortar
without SFL. Beyond SFL content at 10%, the increase in the SFL content significantly
decreased the compressive strength of mortar. For instance the compressive strength of
mortars with SFL contents at 20% and 30% was 3% and 9% lower than that of mortar
without SFL, respectively.
As shown in Figure 5.4c, the fineness of SFL had significant effect on the
compressive strength of mortar. The decrease in the fineness of SFL resulted in a
decrease in the compressive strength of mortar at both ages of 1 and 28 days. At the age
of 1 day, as the specific surface area of SFL decreased from 5.0 to 0.91 m2/g the
compressive strength of mortar was reduced by 19%. Similar trend was observed in
previous studies, which was attributed to the fact that finer SFL was more effective in
improving the compressive strength of concrete at early stage by increasing the rate of
cement hydration through nucleation effect [91]. At the age of 28 days, mortar SFL1-

121
20% showed higher strength than mortars SFL2-20% and SFL3-20%, respectively. This
was attributed to the densified microstructure, which was supported by the data presented
later that mortar SFL1-20% had less volume of permeable voids than mortars SFL2-20%
and SFL3-20% by 29% and 20%, respectively.
In order to determine the reasons underlying the observed phenomenon in the
compressive strength, mortars with SFL contents at 0%, 10%, and 30% (SFL1-0%,
SFL1-10%, and SFL1-30%) were selected to investigate the relative degree of hydration
of cementitious materials using TGA and LOI tests. The test results are shown in Figure
5.5. The Ca(OH)2 was a product of hydration of cementitious materials. It was assumed
that all the Ca(OH)2 in the tested sample came from the hydration of cementitious
materials. Therefore, the difference in Ca(OH)2 content indicated the difference in the
degree of hydration resulting from different SFL content. Bound water content was
another indicator of the degree of hydration. Bound water was released when the sample
was heated from 105 oC to 1000 oC. In reality, besides the bound water produced by
hydration, the impurities in materials before being mixed together might also contribute
to the weight loss between 105 oC and 1000 oC. In order to exclude the impact of the
impurities on the bound water data, LOI test was conducted on the oven dried virgin
cement, SFU, SFL, and fine aggregate as well. The bound water data from the mortars
was corrected accordingly.

122
(a) Effect of SFL content on Ca(HO)2
content
(b)Effect of SFL content on bound water
content
Figure 5.5 Effect of SFL content on the relatively degree of hydration of
cementitious materials
As presented in Figure 5.5, at the age of 1 day, when SFL content increased from
0% to 10%, the Ca(OH)2 content of mortar slightly decreased by 2%. However, beyond
SFL content of 10%, the Ca(OH)2 content significantly increased with the SFL content.
For instance mortar SFL1-30% had 66% more Ca(OH)2 content than mortar SFL1-0%.
Similarly the bound water content increased with the increase in the SFL content. As the
contents of SFL increased from 0% to 10% and 30%, the bound water contents of mortars
at the age of 1 day increased by 6% and 10%, respectively. The observed data of
Ca(OH)2 content and bound water content at the age of 1 day provided proof that SFL
promoted the hydration of cementitious materials at early ages, which as in accordance
with previous literature [15, 91].
However, at the age of 28 days, higher content of SFL seemed to inhibit the
hydration of cementitious materials, which was indicated by the decreasing amount of
Ca(OH)2 content or decreasing bound water content as the SFL content increased. As the

123
contents of SFL increased from 0% to 10% and 30%, the Ca(OH)2 contents of mortars
decreased by 6% and 25%, respectively. The addition of SFL showed insignificant
impact on the Ca(OH)2 content at 10% content level, but significant impact at a content of
30%. The bound water contents of mortars increased by 1% and 4%, as the contents of
SFL increased from 0% to 10% and 30%, respectively. The inhibited hydration could be
explained by the results of volume of permeable voids of mortars, which was presented
later in Figure 5.7 which showed that a less permeable hardened paste structure was
found when the SFL content was higher. It was possible that such less permeable
structure slowered further hydration due to lack of access to moisture for un-hydrated
cementitious material.
The results of the Ca(OH)2 content and bound water content test explained the
phenomenon of compressive strength of mortars with SFL. At early ages, mortar with
higher SFL content had higher strength due to increased degree of hydration of
cementitious materials. At later ages, mortar with higher SFL content had lower strength
due to less C-S-H gel formed, as a result of lack of access to moisture for continued
hydration.
5.1.3.2 Effect of SFU and SFL on the rapid chloride ion permeability of mortar
The effects of SFU content, SFL content, and SFL fineness on the RCP of mortar
at the age of 28 days are presented in Figure 5.6.

124
(a) Effect of SFU content (b) Effect of SFL content
(c) Effect of SFL fineness
Figure 5.6 RCP test results of mortar containing SFU and SFL
As shown in Figure 5.6a, the use of SFU significantly reduced the RCP of mortar.
At SFU content of 10% and 20%, the charge passed of mortar was 81% and 91% lower
than that of mortar at SFU content of 0%, respectively. However, when SFU content was
higher than 20% no significant change was observed in the charge passed. For instance,
the charge passed through sample with SFU content of 20% was only 4% more than that
with SFU content of 30%. The micro-filler effect and pozzolanic effect of SFU, which
densified the pore structure of hardened concrete, were believed to be the main reasons of

125
improved resistance to RCP [46, 47]. The criteria of classifying the resistance to RCP in
accordance with ASTM C1202 are shown in Figure 5.6 for reference.
The increasing content of SFL decreased the amount of charge passed in mortar,
as shown in Figure 5.6b. Compared with mortar with 0% substitution of fine aggregate by
SFL, 10%, 20%, and 30% substitution reduced charge passed by 31%, 42%, and 49%
respectively. Since all the other factors were kept constant except SFL content, the
possible reason for such reduction was the denser microstructure of mortar [15, 91].
It is noted in Figure 5.6c that the increasing fineness of SFL decreased the amount
of charge passed in mortar. Compared to mortar using SFL with specific surface area of
5.0 m2/g, mortar using SFL with specific surface area of 1.9 and 0.91 m2/g resulted in
64% and 78% more charge passing through, respectively. This phenomenon indicated
that finer SFL behaved more effectively in densifying the microstructure of mortar.
5.1.3.3 Effect of SFU and SFL on the bulk density and volume of permeable voids
of mortar
The effects of SFU and SFL on the bulk density are shown in Figure 5.7.
(a) Bulk density

126
(b) Volume of permeable voids
Figure 5.7 Bulk density and volume of permeable voids of mortar containing SFU
and SFL
As shown in Figure 5.7a, the addition of SFU which had lower specific gravity
than cement slightly reduced the bulk density of mortar. When the SFU contents
increased from 0% to 30%, the bulk density of mortar was reduced by 2%. The bulk
densities of mixtures containing SFL fluctuate within the range from 2244 kg/m3 to
2261kg/m3. There was no clear trend of the effect of SFL on the bulk density, because of
the similar specific gravity of SFL and sand.
The influence of SFU and SFL on the volume of permeable voids of mortar was
significant, as shown in Figure 5.7b. The addition of SFU up to 20% which appeared to
be the optimum SFU content for resisting chloride ion permeability decreased the volume
of permeable voids of mortar by 38% when compared with 0% addition. This was
attributed to the filler effect and pozzolanic effect of SFU, which densified the
microstructure of mortar [12]. The partial substitution of fine aggregate of mortar by SFL
reduced the volume of permeable voids. Mortar with SFL content of 20%, which
appeared to be the optimum SFL content had 20% less volume of permeable voids than

127
mixture without SFL. Finer SFL appeared to be most effective in reducing the volume of
permeable voids. Mortar containing the finest SFL had the lowest volume of permeable
voids among the three types of SFL. The effect of SFL densifying the microstructure of
mortar by either promoting hydration or filler effect was considered as the main reason
[15, 91].
The correlation between the charge passed of RCP test and volume of permeable
of mortar containing SFU or SFL was studied. In many of the past research, the
correlation between the chloride ion permeability and volume of permeable voids was
found to be weak [133]. However, in this study, the correlation between the increasing
charge passed and increasing volume of permeable voids could be described with a
regression equation with R2 of 0.74, as shown in Figure 5.8.
Figure 5.8 Correlation between the charge passed of RCP test and volume of
permeable voids

128
5.1.3.4 Drying shrinkage
The effects of SFU content, SFL content, and SFL fineness on the drying
shrinkage of mortar are presented in Figure 5.9.
(a) Effect of SFU content (b) Effect of SFL content
(c) Effect of SFL fineness
Figure 5.9 Drying shrinkage of mortar
As shown in Figure 5.9a, the effect of SFU addition on the drying shrinkage of
mortar did not show up until the period of exposure of 117 days. However, from the
period of exposure of 117 days to 177 days, the addition of SFU induced slightly increase

129
in the drying shrinkage of mortar. Although similar phenomenon of increased drying
shrinkage in the presence of SFU had been found in literature [57], other studies showed
different phenomenon that the addition of SFU reduced the drying shrinkage of concrete
[58]. In this study, the higher capillary stress due to the finer pore size distribution in
mortar resulting from the micro filler effect and pozzolanic effect of SFU would likely be
responsible for the observed increased drying shrinkage of mortar [12].
The substitution of fine aggregate by SFL increases drying shrinkage of mortar, as
seen in Figure 5.9b. mortars using the finest SFL at contents of 10%, 20%, and 30%
(SFL1-10%, SFL1-20%, and SFL1-30%) all have slightly higher drying shrinkage than
mortar without SFL (SFL-0%). Similar phenomenon was observed in other studies which
used inert fine materials [89]. However, the difference in drying shrinkage among
mortars with different amount of SFL was not significant in this study.
The drying shrinkage of mortars with three types of SFL with different fineness
was compared in Figure 5.9c. It can be observed that mortar with the finest SFL (SFL1-
20%) exhibited higher drying shrinkage compared to mortars with SFL2 and SFL3.
Reminding that the mortar with the finest SFL had the lowest volume of permeable voids
and the mortar with the medium fineness SFL had the highest volume of permeable
voids, it was reasonable to believe that the SFL which densified the microstructure of
mortar better resulted in higher drying shrinkage. The higher capillary stress due to the
finer pore size distribution in mortar explained this phenomenon [12].
5.1.3.5 Micro structure of mortar containing SFU and SFL

130
The microstructure of mortar C-0.225, SFL1-20% and SFL3-20% under the SEM
is shown in Figure 5.10.
a. C-0.225 b. SFL1-20%
SFL3-20%
Figure 5.10 Microstructural of mortar containing SFU and SFL
As shown in Figure 5.10, there were un-hydrated cement particles spreading in
the system due to a very low w/cm of 0.225. The SFL1 had very fine particle size, and
thus no silica flour particles was observed in Figure 5.10b. However, SFL3 had coarse
particle size which were observed in Figure 5.10c.
Un-hydrated cement
Sand
Un-hydrated cement
Sand
Un-hydrated cement
SFL3 particles

131
5.1.4 Reinforcing fibers
The comparison of mortars using PVA micro fiber (PVAMF) and steel micro
fiber (SMF) from the perspective of workability, compressive strength and drying
shrinkage behavior of the mortars is shown in Figure 5.11. In these mixtures, 100%
portland cement was used and a constant dosage of HRWRA was used at a dosage of 1%
by mass of cement.
(a) Workability (b) Compressive strength
(c) Drying shrinkage
Figure 5.11 Influence of different types of fiber on properties of mortar

132
As shown in Figure 5.11a, the increase in the reinforcing fibers content resulted in
a decrease in the workability of mortar, regardless of PVAMF or SMF being used. It is
also noted that the PVAMF presented more significant influence in reducing the
workability than SMF. As the fiber content increased from 0 to 2% by volume of total
mortar, the flow of mortar using PVAMF decreased by 60%, the flow of mortar using
SMF decreased by 20%.
As shown in Figure 5.11b, PVAMF and SMF presented different influence on the
compressive strength of mortar. At a given age, the use of PVAMF appeared to decrease
the compressive strength, while the use of SMF appeared to improve the compressive
strength. For instance, at the age of 28 days, the compressive strength of mortar with
PVAMF content at 2% was 17% lower than that of control, and the compressive strength
of mortar with SMF content at 2% was 5% higher than that of control. However, it should
be noted that in these mixtures 100% portland cement was used and no silica fume was
used. High percent increase in the compressive strength due to the use of SMF was
expected in the mortar containing silica fume.
As shown in Figure 5.11c, both PVAMF and SMF presented benefit effect in
reducing the drying shrinkage of mortar. For mortars using SMF, the increase in the SMF
content resulted in a decrease in the drying shrinkage. For instance, at the period of
exposure of 25 days, the drying shrinkage of mortar with SMF content at 2% was 16%
lower than that of control. However, for mortars using PVAMF, the decrease in the
drying shrinkage of mortar was not significant. For instance, at the period of exposure of

133
25 days, the drying shrinkage of mortar with PVAMF content at 2% was 9% lower than
that of control.
As discussed above, SMF caused less reduction in the workability and more
reduction in the drying shrinkage of mortar than PVAMF. SMF also improved the
compressive strength of mortar compared to PVAMF. Thus, from the perspectives of
workability, compressive strength and drying shrinkage, the use of SMF is preferable for
the development of UHPC than PVAMF.
5.1.5 Summary of preliminary investigation on materials selection
The powder form HRWRA Melflux® 4930F which was a poly-carboxylate ether-
based HRWRA was the best HRWRA among all other types of HRWRAs investigated
from the consideration of improving the workability and causing limited 28-day
compressive strength reduction of mortar. It will be used for developing UHPC in the
following experimental research.
Mortar prepared with Ottawa sand exhibited higher workability and 28-day
compressive strength than natural sand at all gradation conditions due to the sphere
particles shape of Ottawa sand. Mortar prepared with natural sand with natural gradation
also exhibited good workability and 28-day compressive strength. The workability,
compressive strength, drying shrinkage of mortar was not significantly affected by the
gradation of natural sand (natural gradation, ASTM coarse gradation and ASTM fine
gradation). Considering the potential increase in the cost if Ottawa sand or natural
siliceous sand with modified gradation is used as fine aggregate, natural siliceous sand
with natural gradation will be used in the future development of UHPC.
134
SFU was more effective in improving compressive strength of mortar at later ages
than at early ages. The usage of fine SFL significantly improved the compressive strength
at early ages (i.e. 1 day), due to its effect in increasing the rate of hydration of
cementitious materials at early ages. However, higher SFL content would reduce the
later-age compressive strengths, due to inhibited hydration of cementitious materials at
later ages. The use of SFU and the finest SFL was helpful in reducing the chloride ion
permeability of mortar. The effect of densifying the microstructure of mortar by SFU and
SFL combination were considered as the main reasons for the reduced permeability of
mortar. The bulk density of mortar decreased with increasing SFU content. SFL did not
have significant effect on the bulk density of mortar. An optimal combination of SFU and
SFL gave less volume of permeable voids of mortar. SFL1 was found to be most
effective in reducing the volume of permeable voids among three SFLs with different
fineness. The adoption of higher content of SFU or SFL increased the drying shrinkage of
mortar. Among the SFLs with different fineness, the finest SFL densified the
microstructure of mortar and consequently resulted in the highest drying shrinkage. Thus,
for future research, SFL will not necessarily be a component of UHPC developed at
ambient temperature, unless the situations when high early age strength is desired.
Regardless of PVAMF or SMF being used, the increase in the fiber content
resulted in decrease in both the workability and the drying shrinkage of mortar. PVAMF
decreased the compressive strength, while SMF improved the compressive strength of
mortar. Moreover, SMF caused less reduction in the workability and more reduction in
135
the drying shrinkage of mortar than PVAMF. Thus, SMF are more preferable for the
development of UHPC than PVAMF in the future development of UHPC.

136
5.2 Preliminary Investigations on Developing UHPC1
This section includes the preliminary investigations on the fresh state properties,
compressive strength, splitting tensile strength, flexural strength, modulus of elasticity,
rapid chloride ion permeability, drying shrinkage and bond performance of UHPC
mixtures. Issues related to the development of UHPC are identified.
5.2.1 Fresh concrete properties
The workability, density, air content, and time of set of UHPC C, SU2, SU2F, and
SU2S are shown in Table 5.1. All the UHPCs used HRWRA at the dosage of 1% by
weight of the cementitious materials.
Table 5.1 Properties of freshly prepared UHPCs
UHPC ID Flow (%) Density (kg/m3) Air Content (%) Time of Set (hour)
Initial Final
C 150 2416 3.5 5.58 7.06
SU2 150 2374 3.2 7.43 8.71
SU2F 150 2459 2.6 7.30 8.42
SU2S 150 2453 3.1 14.93 16.40
Note: kg/m3=1.69 lb/yd3
As shown in Table 5.1, the flow values of all the UHPC mixtures were equal to
150% which was the maximum value that could be captured by the test method in ASTM
1 This section has been published: Li, Z., Harish K.V., Rangaraju P. R., Schiff, S., “Development of ultra-
high performance concrete for shear-keys in precast bridges using locally available materials in South
Carolina.” Proceedings 2014 60th Anniversary Convention and National Bridge Conference, Washington
D.C., Sep. 2014.

137
C1437. It was also noted that, in this investigation, the effects of SU, SMF or SRA on
the workability of UHPC could not be captured by following ASTM C1437, as all the
mixtures exhibited 150% flow. However, during the test, it was observed that the
mixtures present different appearance. To be specific, some of the UHPCs reached 150%
flow with the flow table being dropped less than 25 times, while some of the UHPCs
reached 150% flow with the flow table being dropped 25 times. The method in ASTM
1437 could not tell the difference in workability of high-flow UHPCs. A modification to
the standard ASTM C1437 method is used for study which will be discussed later.
The test results of density, air content, and time of set showed a general picture of
the effect of SU, SMF, and SRA. The addition of SU at 20% dosage level reduced the
density and air content by 2% and 9%, respectively compared to the control mixture (C).
The time of initial and final set in SU2 mixture were delayed by 33% and 23%,
respectively, when compared with control mixture C. In the comparison between UHPC
SU2 and SU2F, it was observed that the addition of SMF increased the density by 4%,
but decreased the air content by 19%. It did not have significant effect on the time of set.
The addition of SRA slightly reduced the density by 0.2%, but increased the air content
by 19%, when compared with UHPC SU2F. However, the addition of SRA significantly
delayed the time of initial and final set by 105% and 95%, respectively, compared with
UHPC SU2F. The abnormal long time of set of UHPC SU2S appeared to be influenced
by the combination of HRWRA and SRA in the study.
5.2.2 Compressive strength
The compressive strength of UHPCs investigated is shown in Figure 5.12.

138
Figure 5.12 Compressive strength of UHPC
As shown in Figure 5.12, the use of SFU at content of 20% decreases the
compressive strength of UHPC at early ages. However, SFU significantly improves the
compressive strength at the age of 28 days. A comparison of the 28-day compressive
strengths reveals that 20% addition of SFU improved the compressive strength by 18%,
compared with the control. Similar phenomenon has been observed and attributed to the
filler effect and pozzolanic effect of SFU [46, 47]. The effect of addition of 2% SMF can
be assessed by comparing the compressive strength of UHPC SU2 with UHPC SU2F.
The compressive strength of UHPC SU2F is significantly higher than the SU2 at all
curing periods. For example, at the ages of 7 and 28 days, the percentage increase in
compressive strength due to microfiber addition is 46% and 28%, respectively. The effect
of addition of 2% SRA can be assessed by comparing the compressive strength of UHPC
SU2F with UHPC SU2S. The compressive strength of SU2S mixture is significantly
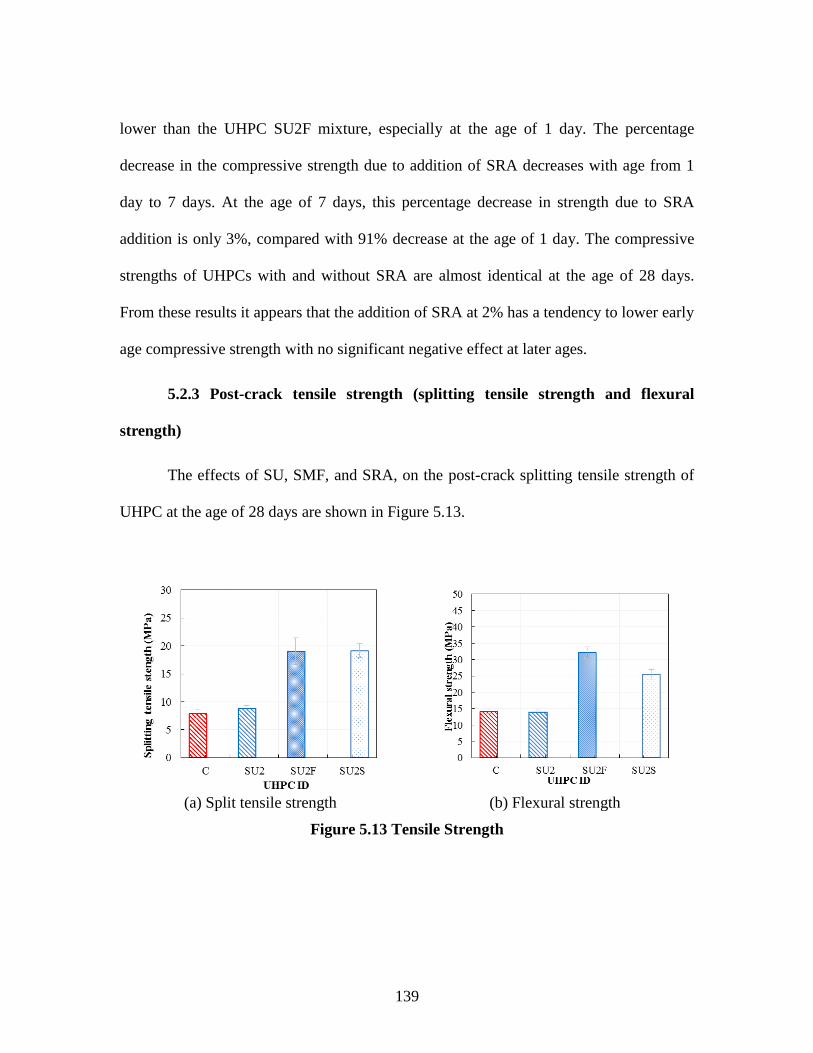
139
lower than the UHPC SU2F mixture, especially at the age of 1 day. The percentage
decrease in the compressive strength due to addition of SRA decreases with age from 1
day to 7 days. At the age of 7 days, this percentage decrease in strength due to SRA
addition is only 3%, compared with 91% decrease at the age of 1 day. The compressive
strengths of UHPCs with and without SRA are almost identical at the age of 28 days.
From these results it appears that the addition of SRA at 2% has a tendency to lower early
age compressive strength with no significant negative effect at later ages.
5.2.3 Post-crack tensile strength (splitting tensile strength and flexural
strength)
The effects of SU, SMF, and SRA, on the post-crack splitting tensile strength of
UHPC at the age of 28 days are shown in Figure 5.13.
(a) Split tensile strength (b) Flexural strength
Figure 5.13 Tensile Strength

140
As shown in Figure 5.13a, the use of SFU did not have significant effect on the
post-crack splitting tensile strength. The post-crack splitting tensile strength values of
UHPCs with SFU dosage of 10% and 20% was 6% lower and 13% higher than that of
UHPC without SFU, respectively. Comparing the post-crack splitting tensile strength
values for the UHPC SU2 and SU2F, it was observed that the addition of SMF increased
the tensile strength substantially by 115%. The post-crack splitting tensile strength of
UHPC SU2S, which contains SRA, was almost identical to that of SUSF, but
significantly higher than UHPCs C, SU1, and SU2 by 140%, 160%, and 116%,
respectively.
As shown in Figure 5.13b, addition of SFU did not have significant effect on the
post-crack flexural strength. The 28-day flexural strength of UHPCs with SFU dosage of
10% and 20% was 6% higher and 1% lower than UHPC without SFU, respectively.
Comparing the post-crack flexural strength values for UHPCs SU2 and SU2F at the age
of 28 days, it was observed that the addition of SMF increased the post-crack flexural
strength by 131%. The addition of SRA decreased the post-crack flexural strength of the
UHPC SU2S specimen by 21%, which was evident by comparing the test results of SU2F
and SU2S mixture. But the post-crack flexural strength of UHPC SU2S was still higher
than UHPC C and SU2 by 81% and 83%, respectively. The use of SMF was the most
effective way of improving the post-crack tensile strength of UHPC. This observation
was similar to that reported in previous studies, and the crack restraining ability of
microfibers was believed to be the reasons [12]. In these studies, the impact of using SU
141
alone on the post-crack tensile strength of the UHPC was not significant at any dosage
level.
5.2.4 Modulus of elasticity (MOE)
The MOE of UHPC at the curing age of 28 days is shown in Figure 5.14. By
comparing the 28-day MOE values of UHPCs C and SU2, it was found that the addition
of SFU slightly increased the MOE. The addition of SU at 20% increased the MOE by
9%, compared with UHPC without SFU. Similarly by comparing the MOE values of
UHPCs SU2 and SU2F mixture, it was observed that the addition of SMF decreased the
MOE by 2%. The addition of SRA reduced the MOE of UHPC by 5%, which was
evident by comparing the test results of SU2S and SU2F mixture. Similar effect of SFU
and SMF on MOE had also been observed in other studies [134]. Koksal et al found that
MOE of high strength concrete increased as the SFU content increased up to 15%, but it
decreased as the SFU content further increased [134]. They attributed this phenomenon to
the brittle structure of high strength concrete caused by SFU. It was also found that SMF
decreased the MOE of high strength concrete, which was attributed to the ductility of
SMF [134].

142
Figure 5.14 MOE of UHPC
5.2.5 Rapid chloride ion permeability (RCP)
The RCP test results of UHPC at the age of 28 days are shown in Figure 5.15. A
comparison among test results of C and SU2 mixture indicated that the 20% addition of
SFU decreased the charge passed substantially by 89%. By comparing the RCP of the
SU2 and SU2F mixture, it was observed that the addition of SMF significantly increased
the RCP value of concrete by about 14 times. A comparison of UHPC SU2F and SU2S
mixture revealed that the addition of SRA reduced the charge passed by 80%. The
addition of SFU appeared to be the most effective way of reducing the chloride
permeability of UHPC. The micro-filler and pozzolanic effects of SU resulting in the
densification of microstructure of UHPC was believed to be the main reason for the
observed reduction in the RCP values [46, 47]. The reason for higher RCP value of SU2F
mixture was not clear so far. More research is conducted and presented later in this study.
In the presence of SRA, the UHPC mixtures containing SMF showed reduced RCP value.
Although the precise mechanism is not clear at the present time, the presence of SRA in

143
the mixture may have produced a better insulation between the individual steel fibers and
thus reducing the RCP values. More studies are needed to confirm these effects of SRA.
Figure 5.15 RCP of UHPC
5.2.6 Drying shrinkage test results
The drying shrinkage test results of the UHPCs are shown in Figure 5.16. At 6
months, the addition of SU at 10% and 20% reduced the drying shrinkage by 31% and
20%, compared with UHPC C mixture. Similar phenomenon of reduces drying shrinkage
with the addition of SFU was observed in previous studies [58].
The use of SMF and/or SRA reduced the drying shrinkage of UHPC. At 6
months, it was observed that the drying shrinkage of SU2F was 11% less than that of
SU2. The main reason for the reduced drying shrinkage in the presence of SMF was that
the fibers restrained the shrinkage of cementitious paste in the UHPC. A comparison
between UHPCs SU2F and SU2S showed that 2% addition of SRA reduced the drying
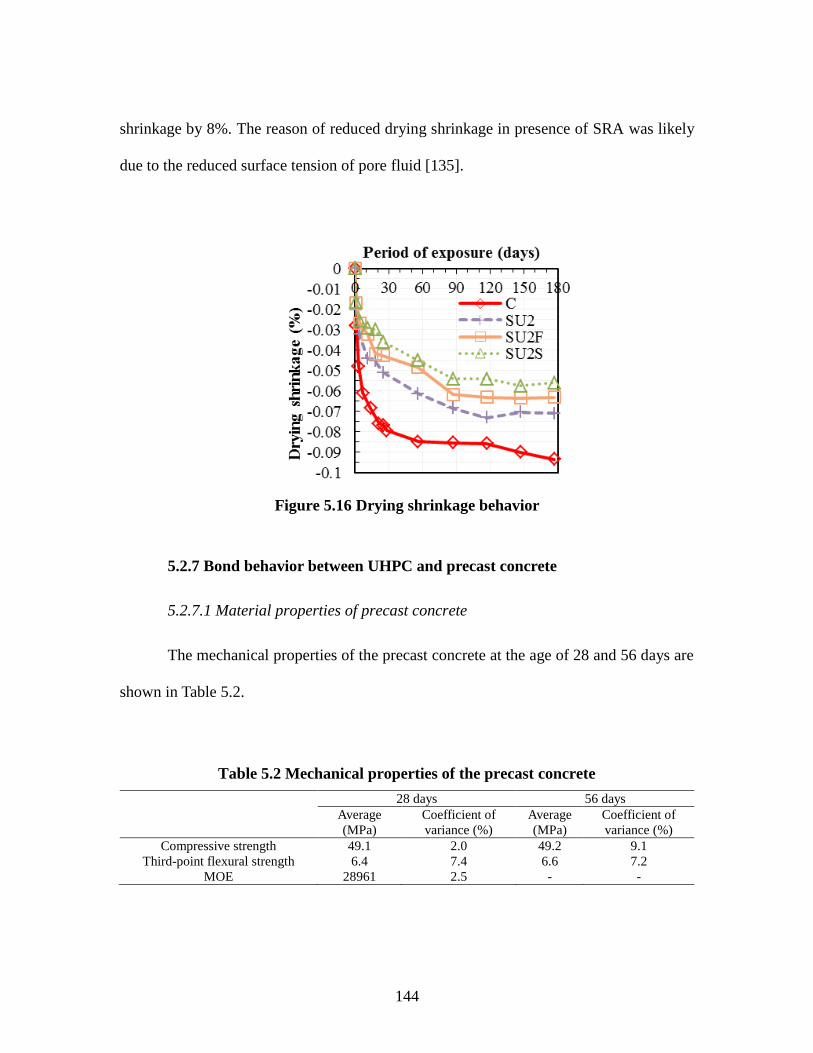
144
shrinkage by 8%. The reason of reduced drying shrinkage in presence of SRA was likely
due to the reduced surface tension of pore fluid [135].
Figure 5.16 Drying shrinkage behavior
5.2.7 Bond behavior between UHPC and precast concrete
5.2.7.1 Material properties of precast concrete
The mechanical properties of the precast concrete at the age of 28 and 56 days are
shown in Table 5.2.
Table 5.2 Mechanical properties of the precast concrete
28 days 56 days
Average
(MPa)
Coefficient of
variance (%)
Average
(MPa)
Coefficient of
variance (%)
Compressive strength 49.1 2.0 49.2 9.1
Third-point flexural strength 6.4 7.4 6.6 7.2
MOE 28961 2.5 - -

145
5.2.7.2 Slant shear
The basic failure modes observed during slant shear test were classified as (i)
failure in precast concrete, (ii) failure in the bond and (iii) failure in both precast concrete
and UHPC, based on the location of the main cracks, as shown in Figure 5.17. The dash
line in Figure 5.17 indicates the location of the interface between precast concrete and
UHPC of the specimen. The most frequent failure mode that occurred was the failure in
precast concrete, as shown in Figure 5.17a. In this failure mode, the main cracks occurred
in the precast concrete portion. Some minor cracks at the bond between precast concrete
and UHPC, and some minor cracks might propagate into the UHPC portion. However the
UHPC portion and precast concrete portion still had strong bond after test finished.
Another failure mode was de-bonding at the interface between precast concrete and
UHPC, as shown in Figure 5.17b. In this failure mode, minor cracks or no cracks
occurred in either the precast or the UHPC portion of the specimen. The last failure mode
was the failure in both precast concrete and UHPC, as shown in Figure 5.17c. In this
failure mode, the cracks initiated first in the precast concrete portion and then penetrated
into the UHPC portion when the specimen failed. No cracks were observed at the bond
between precast concrete and UHPC. The ultimate load and failure mode of specimens in
the slant shear test are shown in Table 5.3.
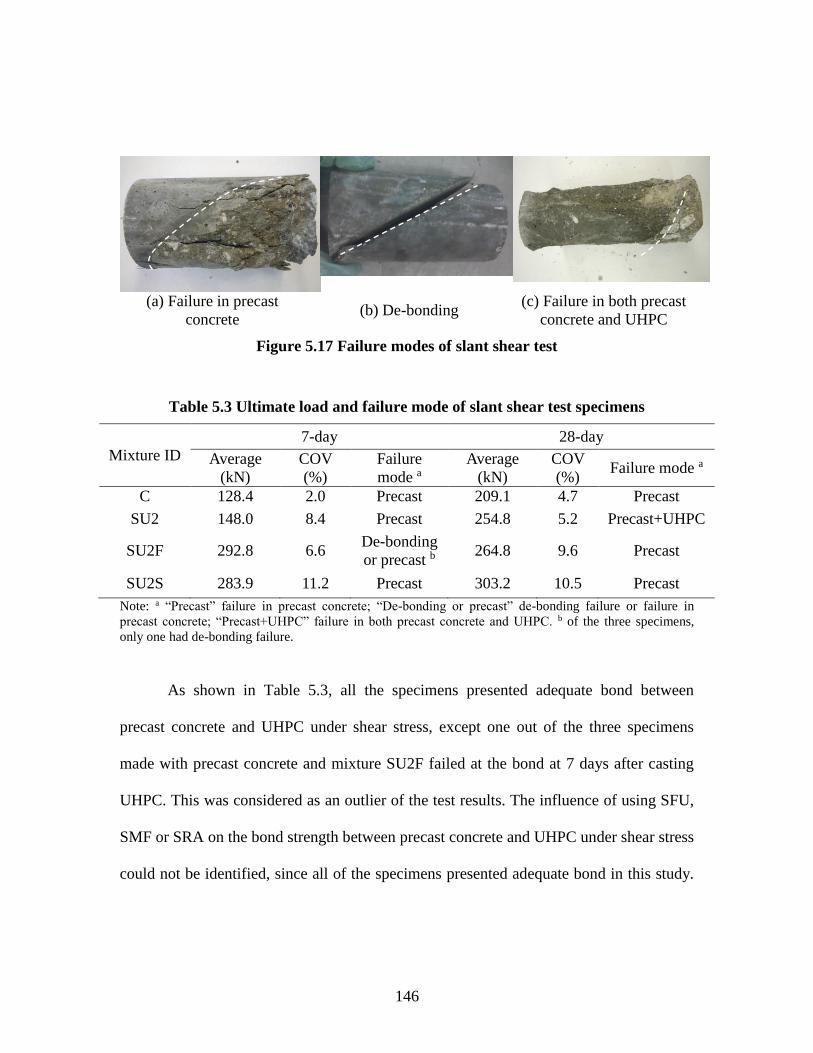
146
(a) Failure in precast
concrete (b) De-bonding
(c) Failure in both precast
concrete and UHPC
Figure 5.17 Failure modes of slant shear test
Table 5.3 Ultimate load and failure mode of slant shear test specimens
Mixture ID
7-day 28-day
Average
(kN)
COV
(%)
Failure
mode a
Average
(kN)
COV
(%) Failure mode a
C 128.4 2.0 Precast 209.1 4.7 Precast
SU2 148.0 8.4 Precast 254.8 5.2 Precast+UHPC
SU2F 292.8 6.6 De-bonding
or precast b 264.8 9.6 Precast
SU2S 283.9 11.2 Precast 303.2 10.5 Precast
Note: a “Precast” failure in precast concrete; “De-bonding or precast” de-bonding failure or failure in
precast concrete; “Precast+UHPC” failure in both precast concrete and UHPC. b of the three specimens,
only one had de-bonding failure.
As shown in Table 5.3, all the specimens presented adequate bond between
precast concrete and UHPC under shear stress, except one out of the three specimens
made with precast concrete and mixture SU2F failed at the bond at 7 days after casting
UHPC. This was considered as an outlier of the test results. The influence of using SFU,
SMF or SRA on the bond strength between precast concrete and UHPC under shear stress
could not be identified, since all of the specimens presented adequate bond in this study.

147
Additional research is needed to reveal the influence of using SFU, SMF or SRA on the
bond behavior between precast concrete and UHPC under shear stress.
Another interesting finding from the slant shear test was that as the compressive
strength of UHPC increased the ultimate load carried by the slant shear specimen
increased. This can be observed in Table 5.3 by comparing the ultimate load of specimen
made with mixtures C, SU2, SU2F and SU2S under the same curing age, or comparing
the ultimate load of specimen made with same UHPC at different curing age. Reminding
that when the slant shear test was conducted at the age of 7 and 28 days after casting
UHPC, the precast concrete have been cured for 35 and 56 days, respectively. However,
from the age of 28 days to 56 days, the compressive strength of precast concrete did not
change significantly, as shown in Table 5.2. The compressive strength of the precast
concrete was 49.1MPa and 49.2 MPa at the age of 28 days and 56 days, respectively. If
the compressive strength of the precast concrete from the age of 28 days to 56 days was
assumed constant, the ultimate load for breaking 75 mm ×150 mm precast concrete
cylinder was found to be 224kN, based on the compressive strength of 49.2 MPa. This
ultimate load value was in the middle of the measured ultimate load value of slant shear
specimens made with mixtures C, SU2, SU2F and SU2S at the age of 7 and 28 days after
casting UHPC. In other words, the ultimate load of pure precast concrete cylinder was
different from the ultimate load of precast concrete bonded with UHPC. It was noted that
the failure mode in pure precast specimen was typical failure mode with the formation of
a failure cone, while the failure mode in the UHPC bonded specimen was of tensile
failure in the precast portion of the specimen (see the longitudinal cracks in Figure
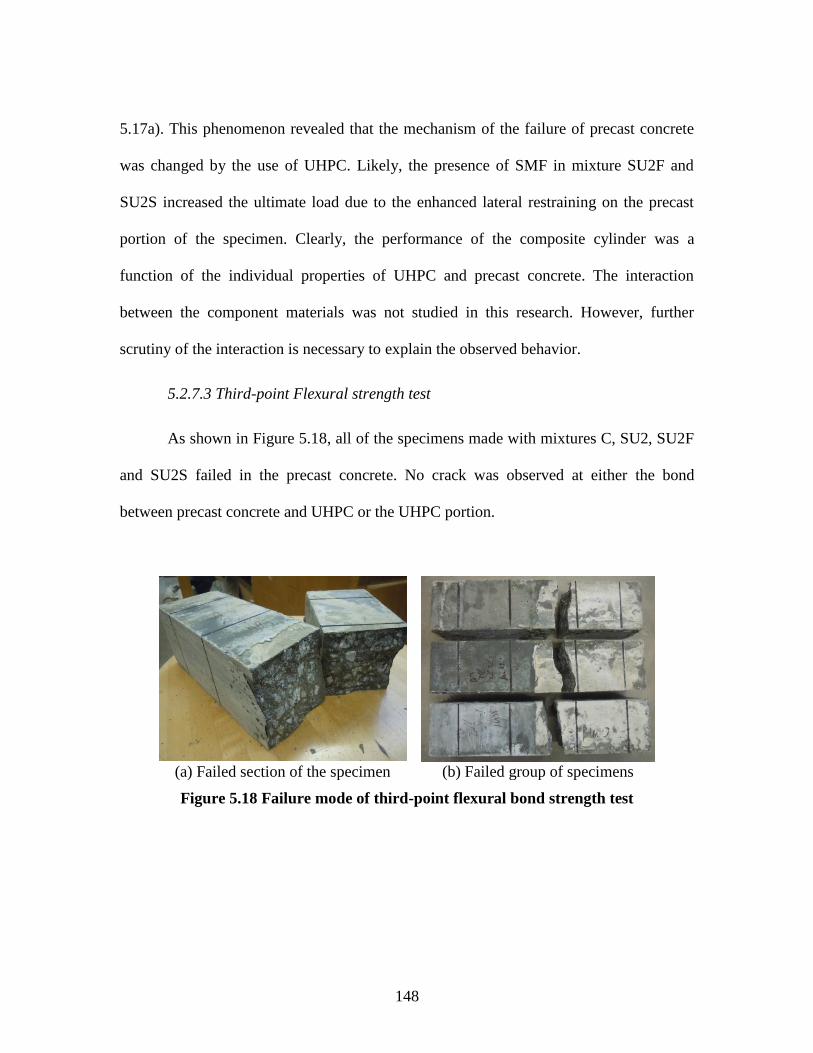
148
5.17a). This phenomenon revealed that the mechanism of the failure of precast concrete
was changed by the use of UHPC. Likely, the presence of SMF in mixture SU2F and
SU2S increased the ultimate load due to the enhanced lateral restraining on the precast
portion of the specimen. Clearly, the performance of the composite cylinder was a
function of the individual properties of UHPC and precast concrete. The interaction
between the component materials was not studied in this research. However, further
scrutiny of the interaction is necessary to explain the observed behavior.
5.2.7.3 Third-point Flexural strength test
As shown in Figure 5.18, all of the specimens made with mixtures C, SU2, SU2F
and SU2S failed in the precast concrete. No crack was observed at either the bond
between precast concrete and UHPC or the UHPC portion.
(a) Failed section of the specimen (b) Failed group of specimens
Figure 5.18 Failure mode of third-point flexural bond strength test

149
The average flexural strength of precast concrete was 6.58 MPa, with the
coefficient of variance of 7.2%. The flexural strength of bond specimen (precast
concrete-UHPC prism) and pure UHPC specimen are compared and shown in Table 5.4.
Table 5.4 28-day fracture stress of third point flexural specimen
Mixture
ID
Bond specimen Monolithic UHPC specimen
Average (MPa) COV (%) Average (MPa) COV (%)
C 6.39 7.8 14.1 3.8
SU2 6.4 11.5 14.5 4.1
SU2F 6.2 3.7 32.1 5.4
SU2S 6.7 6.0 25.4 5.8
As Table 5.4 shows, the fracture stress of specimen made with precast concrete and
UHPC was similar to the fracture stress of pure precast concrete prism and much lower
than the fracture stress of the pure UHPC prism. The use of SFU, SMF or SRA did not
have any significant influence on the bond strength between precast concrete and UHPC
under flexural stress. All of the specimens showed adequate bond between the precast
concrete and UHPC in this study.
5.2.7.4 Pull-off test
The failure modes observed during pull-off test were classified as failure in
precast concrete, failure in the bond between precast concrete and UHPC and failure in
the epoxy, based on the location of the main cracks. The most frequent failure mode that
occurred was the failure in precast concrete. In this failure mode, a single crack occurred
in the precast concrete portion. No crack was observed in the bond or in the UHPC.
Another failure mode was the failure in the bond between precast concrete and UHPC. In

150
this failure mode, a single crack occurred at the interface between precast concrete and
UHPC. The specimen was broken into two pieces which were the precast concrete
portion and the UHPC portion. These two portions themselves had no cracks at all. The
last failure mode was the failure in epoxy, which represented a failure of the bond
between the aluminum disc and the UHPC.
The ultimate load carried by the slab pull-off test specimens at the age of 7 and 28
days after casting UHPC is shown in Table 5.5.
Table 5.5 Ultimate load of slab pull-off test specimens of UHPC
Mixture
ID
7-day ultimate load 28-day ultimate load
Average (kN) COV
(%) Failure mode* Average (kN)
COV
(%) Failure mode*
C 1.7 29.4 Bond 4.3 2.3 Bond
SU2 3.9 5.1 Precast 4.8 2.5 Precast
SU2F 4.6 6.5 Precast 5.9 12.1 Precast
SU2S 6.0 0.0 Precast 6.2 6.8 Precast Note: *“Precast” failure occurred in the concrete portion, “Bond” failure occurred at bond between precast
concrete and UHPC.
As shown in Table 5.5, the control mixture C mixture did not have good bond
with the precast concrete at the ages of both 7 and 28 days. For the mixture containing
SFU and mixture containing both SFU and SMF, adequate bond was observed, as the
failure occurred in the precast concrete. The beneficial effect of SFU was identified in
this test and such effect was attributed to the formation of a denser interface between the
precast concrete and newly poured UHPC [136]. The mixture SU2S performed equally
well compared to mixture SU2F in the pull-off bond strength test. The influence of using
SMF or SRA on the bond strength between precast concrete and UHPC under direct

151
tensile stress could not be identified, since all of the specimens using presented adequate
bond.
Similar finding to the slant shear test was observed in pull-off test that as the
compressive strength of UHPC increased the ultimate load when pull-off test specimen
failed increased. This can be observed in Table 5.5 by comparing the ultimate load of
specimen made with mixtures C, SU2, SU2F and SU2S at the same curing age, or
comparing the ultimate load of specimen made with same UHPC at different curing age.
The properties of the precast concrete in the four pull-off test were the same. The
difference in the ultimate load seemed to be related with the compressive strength of
UHPC. This phenomenon also revealed that the mechanism of the failure of precast
concrete was affected by the compressive strength of UHPC. Additional studies are
needed to further investigate more fundamental issue of the bond strength between UHPC
and precast concrete.
5.2.7.5 Discussion of the bond test methods and results
The widely used test methods for evaluating bond performance between UHPC
and precast concrete include slant-shear test, splitting tensile test and pull-off test, and
these tests evaluate the bond performance between the two materials under shear, indirect
tension and direct tension, respectively [121, 122]. In this study, slant-shear test, pull-off
test and third-point flexural test are used to evaluate the bond performance between the
two materials. Splitting tensile test was not used. Third-point flexural test evaluates the
bond performance under flexural tension. This test method is new, as it has not been used

152
for studying the bond performance between UHPC and precast concrete in previous
literature.
One of the problems with the slant-shear test is that the interface between UHPC
and precast concrete is subjected to a combined influence of compressive stress and shear
stress [137, 138]. The complicated stress condition causes inconsistency in the test results.
As observed in this study, even within the same group of specimens, different failure
modes have been observed in the slant shear test. Specifically, two failure modes – de-
bonding failure and failure in precast concrete-were observed between UHPC 2 and
precast concrete at the age of 7 days, and two failure modes - failure in UHPC and failure
in precast concrete -were observed between UHPC 1 and precast concrete at the age of 28
days. Such inconsistence in the test results gives confusing information.
The problem with the pull-off test is the difficulty of conducting the test including:
need for a large scale precast concrete slab that needs to be cast; the effect of drilling on
formation of any micro-cracking; strong bonding materials (usually ultra-strong epoxy) is
needed to provide strong bond between the metal disc and the concrete specimen, and
such bonding materials are costly; and all the preparation work needs to be done one 1
day before the test as the bonding materials require certain curing time.
Third-point flexural bond test is a convenient and reliable test method to conduct.
The test setup is easy. No special and costly device or materials are needed. It is will be
used for studying the bond performance between UHPC and precast concrete in the later
part of this stud.

153
5.2.8 Summary of preliminary development of UHPC
The preliminary investigation of developing UHPC provides initial recognitions
on the material selection and mixture proportions for producing cost efficient UHPC
materials. These recognitions include:
A w/cm of 0.2 is low enough to prepare concrete mixtures having 28-day
compressive strength above 150 MPa. Considering the potential increase in the
economic cost of UHPC by decreasing the w/cm, the subsequent study will be
mainly based on w/cm of 0.2.
The standard test method in ASTM C1437 is not suitable for measuring the
workability of UHPC due to its highly flowable performance.
SFU is effective in improving the compressive strength and durability of UHPC.
The modulus of elasticity of UHPC is not noticeably affected by the use of either
SFU, SMF or SRA.
The natural siliceous sand with natural gradation is suitable for producing UHPC.
The use of SMF can improve the compressive strength and tensile strength of
mortar.
SRA is effective in reducing the drying shrinkage of UHPC.
UHPC mixtures SU2F and SU2S exhibited adequate bond strength with precast
concrete as observed in the three bond test methods: slant shear test, pull-off test
and third point flexural test. It is noted that third point flexural test is a reliable
and convenient way of investigating the bond between UHPC and precast
concrete.
154
However, there are several challenges of developing UHPC being recognized
during the preliminary investigation:
From the consideration of materials’ availability, the information on the alkali
content of cement is important as it may affect the performance of UHPC such as
ASR behavior. The research result on this topic may screen out several cement
products if they have poor performance due to their improper alkali content.
SFU is more costly than cement and other types of SCMs. To decrease the
economic cost of UHPC, economic substitutes to SFU such as fly ash and meta-
kaolin need to be investigated.
More information is needed on the effect of HRWRA dosage, sand content, SMF
content, etc. on the performance of UHPC. Optimization study on the proportions
of the component materials of UHPC is needed.
SRA is used to decrease the drying shrinkage of UHPC. However, the use of SRA
significantly reduces the early age compressive strength. Alternative method of
reducing the drying shrinkage of UHPC or chemical accelerator to improve the
early age compressive strength of UHPC is worthy to explore.
The reason for increased RCP due to the use of SMF is not clear.
Bond behavior between UHPC and precast concrete affected by factors such as
surface roughness and preparation method needs further research to understand
the influence.

155
5.3 Effect of Alkali Content on the Properties of UHPC2
This section includes the investigations on the effect of alkali content of cement
on the workability, setting time, compressive strength, drying shrinkage, RCP, ASR
induced expansion, ASR caused loss in flexural strength, and volume of permeable voids
of UHPC.
5.3.1 Fresh state properties
The workability and time of set influenced by the alkali content of mortar is
shown in Figure 5.19.
(a) Workability of mortar (b) Time of set of mortar
Figure 5.19 Fresh state properties of mortar influenced by alkali content
As shown in Figure 5.19a, at HRWRA dosage of 0.75%, there was a threshold
alkali content of 0.70% Na2Oeq, below which, the increase in the alkali content did not
have significant impact on the workability of mortar. However, when the alkali content
2 This section has been published: Z. Li, K.Afshinnia, P. R. Rangaraju, “Effect of alkali content of cement
on properties of high performance cementitious mortars.” Construction and Building Materials, v.102, pp.
631-639, 2015.

156
was higher than 0.70% Na2Oeq, the workability of mortar significantly decreased with the
increase in the alkali content. It was noted that as alkali content increased from 0.70% to
0.88% Na2Oeq the flow value decreased by 74%. The findings on the influence of alkali
content on the workability of cementitious mixtures in previous literature were different
[30, 32-36, 98]. In one of the literature, the threshold alkali content was found to be
between 0.4% and 0.5% Na2Oeq at which the mixture exhibited the highest workability
[98]. This was attributed to the cement/HRWRA compatibility which was influenced by
the alkali content [98]. However, many other literature showed a continuous decrease in
the workability of fresh cementitious mixtures as the alkali content increased [30, 32, 33].
The decrease in the workability due to the increased alkali content was understood that
the additional alkali cations accelerated the hydration of C3A by depressing the release of
Ca2+ from gypsum, which inhibited the effectiveness of gypsum [30, 34-36]. Likely both
the cement/HRWRA compatibility and inhibited effectiveness of gypsum contributed to
the observed results in this study.
For mortars containing FA, the increase in the workability due to the use of FA
was observed, and the increase in the workability of mortar was especially significant
when the alkali content was high (0.88% Na2Oeq). A simple calculation revealed that the
addition of FA increased the flow value by 250% when the alkali content was 0.88%
Na2Oeq, but only 13% when the alkali content was 0.49% Na2Oeq. The increase in the
flow value could be attributed to the ball bearing effect of FA [12]. However, this was not
enough to explain the significant difference in the flow value increases at low and high
levels of alkali contents. Noting that the NaOH which was dosed by percent mass of
157
cement is dissolved into the mixing water prior to the mixing process and the w/cm was
kept constant at 0.2, it was understandable that in mortars containing FA the actual
concentration of NaOH in the mixing water was proportionately reduced. Knowing that
the alkali in the cement is not dissolved in the mixing water immediately, such dilution
effect of using FA is more significant at high level of alkali content than low level of
alkali content. This probably explained the more significant increase in the flow value of
FA mixtures when alkali content was 0.88% Na2Oeq.
Figure 5.19a also shows the flow values of mortars A3a and A4a (square markers)
which were prepared by increasing the dosages of HRWRA of mortars A3 and A4,
respectively. The increase in workability due to increased dosages of HRWRA was
observed. The flow values of both mortars A3a and A4a were all above 150%, which
were similar to that of mortars C, A1, and A2. Thus, mortars C, A1, A2, A3a and A4a
were compared for the study of ASR behavior of mortar affected by the alkali content, as
to eliminate the impact of compactability of mortar on the ASR behavior of mortar.
As shown in Figure 5.19b, for mortars without FA, there was a threshold alkali
content of 0.70% Na2Oeq, at which the shortest time of initial set was observed. When the
alkali content was increased from 0.49% to 0.70% Na2Oeq the time of initial set of
mortars was reduced by 23%. However, when the alkali content was increased from
0.70% to 0.88% Na2Oeq the time of initial setting of mortars was increased by 32%. The
time of final setting increased continuously as the alkali content increased. When the
alkali content was increased from 0.49% to 0.88% Na2Oeq, the time of final setting of
mortars was increased by 36%. The observed phenomena of both time of initial and final
158
set appeared to be different from past studies where the increasing alkali content
increased the rate of hydration of cement and promoted setting [30, 31, 139-141].
The possible reasons of the test results observed in this study are proposed as
follows: First, the time of set of UHPCs was tested using the penetration method in
ASTM C403. This method actually evaluates the penetration resistance of fresh mortar
which is more related to the strength of the fresh mortar at early hydration stage [12].
Thus, the hydration of C3S was more influential than the hydration of C3A in the time of
set according to the penetration method, as the hydration product of C3S contributed most
to the strength of mortar [12]. Second, the effect of alkali content on the rate of hydration
of C3S is related to the alkali source added into the system as well [30]. For instance,
when alkali sulfates, alkali carbonate or alkali chloride was used as alkali sources,
remarkable increase in the rate of hydration of C3S was observed [12, 30, 31, 139-141].
However, when NaOH was used, the influence of NaOH on the rate of hydration of C3S
was not significant [30, 37, 142, 143]. In the present study, the NaOH was added into
UHPC to achieve a certain level of alkali content. If the quantity of NaOH is expressed as
a concentration of the mixing water as in the past studies [37, 142, 143], the maximum
concentration (UHPC A4) was only 0.58 M which should be classified as low dosage [37,
142, 143]. Third, many previous studies on the effect of alkali content on the early
hydration of fresh mixture were conducted using pure C3S instead of cement [142, 143].
When gypsum or C3A were present in these mixtures, the mechanism of the hydration of
C3S would be substantially different. For instance, it has been known that gypsum
significantly accelerate the hydration of C3S [12, 144]. In such case, the presence of

159
NaOH would depress the rate of hydration of C3S by depressing the dissolution of
gypsum. Alternatively, depressed effectiveness of gypsum in presence of NaOH results in
faster hydration of C3A, as discussed earlier [34-36]. In such case, the hydration products,
like monosulfoaluminate and calcium aluminate hydrates, rapidly precipitate on the C3S
grains and prolong the induction period [12], Thus the hydration of C3S is inhibited.
These three explanations potentially contributed to the observed phenomena of time of
initial and final set. It should be noticed that the measured workability and setting time of
UHPC are not necessarily related. Less flowable appearance does not indicate a stronger
micro structure of fresh mixture to resist mechanical penetration.
For mortars with FA, the addition of FA delayed the time of initial setting by 26%
and 42% at alkali content of 0.49% Na2Oeq and 0.88% Na2Oeq, respectively. Such a
significant delay in the measured time of initial setting was likely due to the lower early
strength of mortar developed under higher actual w/c, when w/cm was fixed for
proportioning mortar with FA [12]. It should be noted that the effect of higher actual w/c
was less significant at later stage of early hydration, since the observed time of final
setting was only increased by 16% at alkali content of 0.49% Na2Oeq, and decreased by
3% at alkali content of 0.88% Na2Oeq.
5.3.2 Compressive strength development
The effects of alkali content, dosage of HRWRA and addition of FA on the
compressive strength of mortar at the ages of 7 and 28 are presented in Figure 5.20.
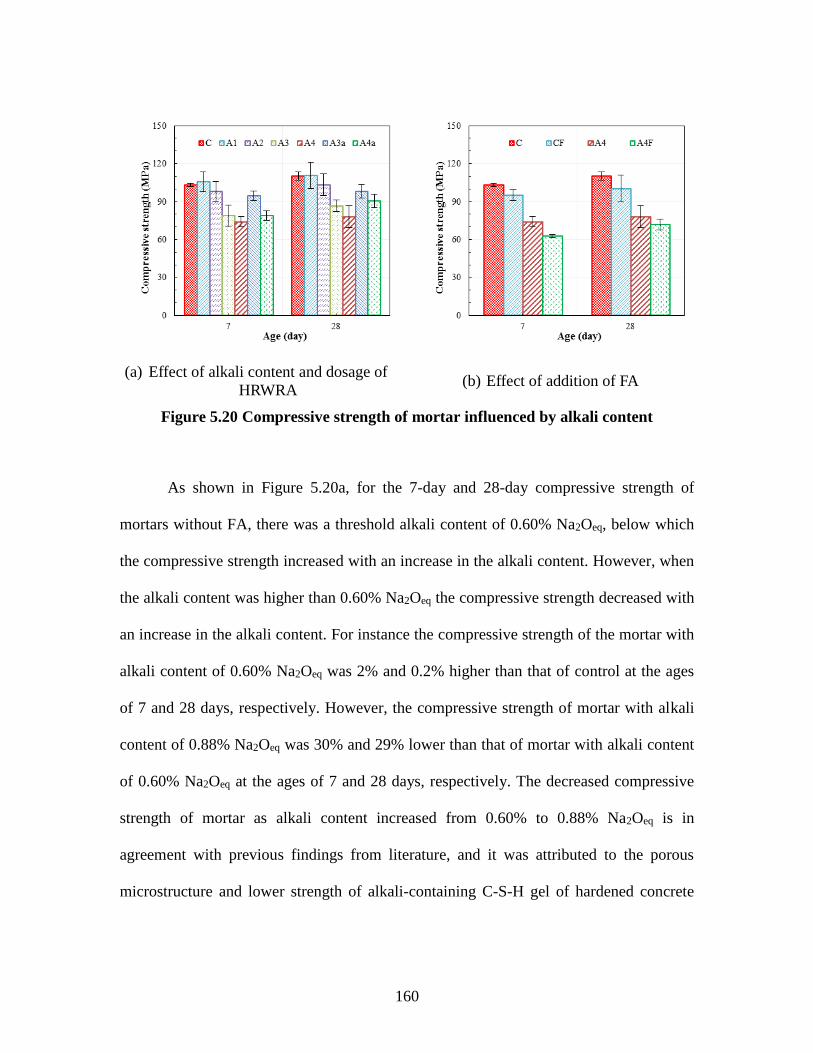
160
(a) Effect of alkali content and dosage of
HRWRA (b) Effect of addition of FA
Figure 5.20 Compressive strength of mortar influenced by alkali content
As shown in Figure 5.20a, for the 7-day and 28-day compressive strength of
mortars without FA, there was a threshold alkali content of 0.60% Na2Oeq, below which
the compressive strength increased with an increase in the alkali content. However, when
the alkali content was higher than 0.60% Na2Oeq the compressive strength decreased with
an increase in the alkali content. For instance the compressive strength of the mortar with
alkali content of 0.60% Na2Oeq was 2% and 0.2% higher than that of control at the ages
of 7 and 28 days, respectively. However, the compressive strength of mortar with alkali
content of 0.88% Na2Oeq was 30% and 29% lower than that of mortar with alkali content
of 0.60% Na2Oeq at the ages of 7 and 28 days, respectively. The decreased compressive
strength of mortar as alkali content increased from 0.60% to 0.88% Na2Oeq is in
agreement with previous findings from literature, and it was attributed to the porous
microstructure and lower strength of alkali-containing C-S-H gel of hardened concrete

161
developed in high alkali condition [30-32, 37-42]. Reminded the workability test results,
it might be reasonable to believe that the increase in compressive strength of mortar as
alkali content increased from 0.49% to 0.60% Na2Oeq was because of better
compactibility as alkali content increased, and the decreased compressive strength of
mortar as alkali content increased from 0.60% to 0.88% Na2Oeq was because of poor
compactibility as alkali content increased. Probably, both the lower strength of alkali-
containing C-S-H gel and poor compactibility of mortar influenced by the alkali content
contribute to the observed compressive strength of mortars.
The increase in the HRWRA dosage improved the compressive strength of
mortar, which is shown in Figure 5.20a. By comparing mortar A3 and A3a, the
compressive strength was found to increase by 20% and 13% at the age of 7 and 28 days,
respectively. Similarly, by comparing mortar A4 and A4a, the compressive strength was
found to be increased by 7% and 16% at the age of 7 and 28 days, respectively.
Remembering that the workability of mortar with higher dosage of HRWRA presented
significantly higher flow value, it is reasonable to believe that the better compactibility
played a primary role in the increased compressive strength of mortar with higher dosage
of HRWRA.
As it is shown in Figure 5.20b, the mass replacement of 17% of cement by FA
reduced the compressive strength at the ages of both 7 and 28 days. At alkali content of
0.49% Na2Oeq, the compressive strength of UHPC was reduced by 8% and 9% at the ages
of 7 and 28 days, respectively. At alkali content of 0.88% Na2Oeq, the compressive
strength was reduced by 15% and 8% at the ages of 7 and 28 days, respectively. The low
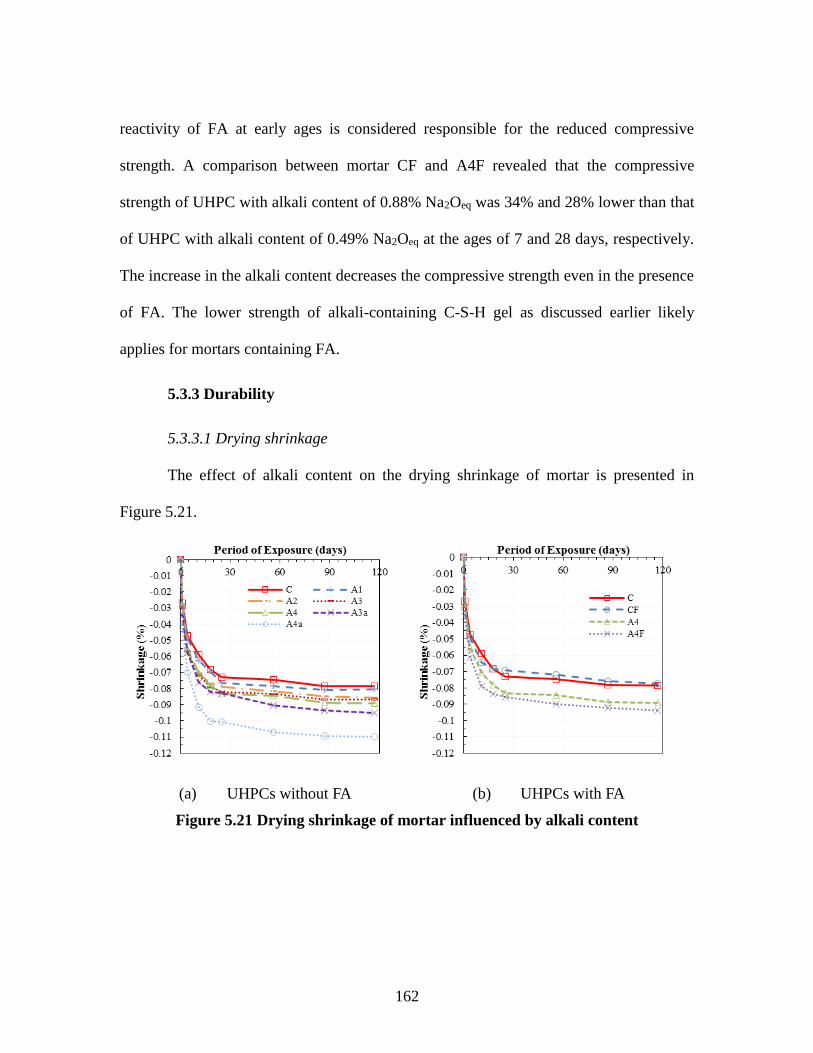
162
reactivity of FA at early ages is considered responsible for the reduced compressive
strength. A comparison between mortar CF and A4F revealed that the compressive
strength of UHPC with alkali content of 0.88% Na2Oeq was 34% and 28% lower than that
of UHPC with alkali content of 0.49% Na2Oeq at the ages of 7 and 28 days, respectively.
The increase in the alkali content decreases the compressive strength even in the presence
of FA. The lower strength of alkali-containing C-S-H gel as discussed earlier likely
applies for mortars containing FA.
5.3.3 Durability
5.3.3.1 Drying shrinkage
The effect of alkali content on the drying shrinkage of mortar is presented in
Figure 5.21.
(a) UHPCs without FA (b) UHPCs with FA
Figure 5.21 Drying shrinkage of mortar influenced by alkali content
163
The effect of alkali content on the drying shrinkage of mortar without FA was
studied by comparing the drying shrinkage development of UHPC C, A1, A2, A3 and
A4. The dosages of HRWRA were same among those mortars, so that that the variation
induced by HRWRA was excluded. A calculation of the drying shrinkage values at 87
days of exposure reveals that mortar A1, A2, A3 and A4 presented 3%, 9%, 11% and
13% more drying shrinkage than mortar C, respectively. The drying shrinkage of mortar
increases with the increase in the alkali content, which was also observed in past studies
[30, 41, 145, 146]. Some of the studies attributed this phenomenon to the increased
capillary stress and decreased disjoining pressure [41, 145], or high porosity of the
microstructure resulted from the increased alkali content [41]. Probably all of these
explanations contribute to the phenomenon observed in the present study.
The effect of HRWRA dosage on the drying shrinkage of mortar without FA can
be observed by comparing A3, A3a, A4 and A4a (see Figure 5.21a). At 87 days of
exposure, A3a and A4a had 8% and 28% more drying shrinkage than A3 and A4,
respectively. The increase in the dosage of HRWRA resulted in an increase in the drying
shrinkage of mortar.
Similarly, the effect of alkali content on the drying shrinkage of mortar using FA
was studied by comparing the drying shrinkage development of mortar C, CF, A4 and
A4F (see Figure 5.21b). Increased drying shrinkage of mortar with increased alkali
content was also observed for mortar using FA. At 87 days of exposure, A4F presented
21% more drying shrinkage than CF. The explanations discussed above for increased
drying shrinkage with alkali content probably applies for mortar with FA as well.

164
5.3.3.2 Rapid chloride ion penetration
The effects of alkali content on the rapid chloride ion permeability of mortar with
and without FA are presented in Figure 5.22.
Figure 5.22 RCP of mortar influenced by alkali content
The dosage of HRWRA was held constant at 0.75% by mass of cement. As shown
in Figure 5.22, for mortars without FA, the measured amount of charge passed through
mortar specimens gradually increased with the increase in the alkali content of cement.
For instance when the alkali content was increased from 0.49% to 0.88% Na2Oeq the
amount of charge passed was increased by only 14%.
For mortars containing FA, the addition of FA increased the measured amount of
charge passed through mortar specimens. At low alkali content (0.49% Na2Oeq), the use
of FA increased the amount of charge passed by 29%. At high alkali content (0.88%
Na2Oeq), the use of FA increased the amount of charge passed by 9%. The increased
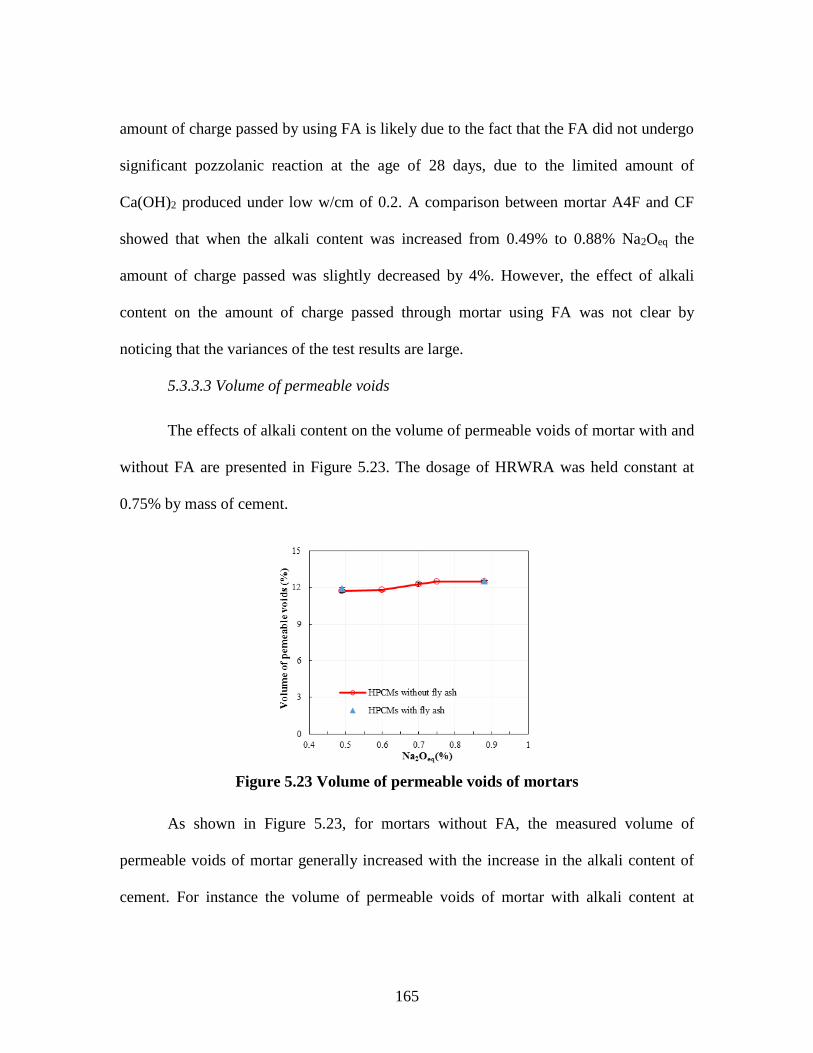
165
amount of charge passed by using FA is likely due to the fact that the FA did not undergo
significant pozzolanic reaction at the age of 28 days, due to the limited amount of
Ca(OH)2 produced under low w/cm of 0.2. A comparison between mortar A4F and CF
showed that when the alkali content was increased from 0.49% to 0.88% Na2Oeq the
amount of charge passed was slightly decreased by 4%. However, the effect of alkali
content on the amount of charge passed through mortar using FA was not clear by
noticing that the variances of the test results are large.
5.3.3.3 Volume of permeable voids
The effects of alkali content on the volume of permeable voids of mortar with and
without FA are presented in Figure 5.23. The dosage of HRWRA was held constant at
0.75% by mass of cement.
Figure 5.23 Volume of permeable voids of mortars
As shown in Figure 5.23, for mortars without FA, the measured volume of
permeable voids of mortar generally increased with the increase in the alkali content of
cement. For instance the volume of permeable voids of mortar with alkali content at

166
0.6%, 0.7%, 0.75% and 0.88% Na2Oeq was 1%, 5%, 7% and 7% higher than that of
mortar with alkali content at 0.49% Na2Oeq, respectively.
For mortars containing FA, an increase in the alkali content of the mixture from
0.49% Na2Oeq. to 0.88% Na2Oeq. increased the volume of permeable voids by 5%. Also
comparing the volume of permeable voids of mortars without FA, mortars with FA were
found to have 1% and 2% higher permeable void contents in mixtures with low and high
alkali cement contents, respectively. The increase in the volume of permeable voids of
mortar with an increase in the alkali content of cement could be attributed to the porous
microstructure of concrete at high alkali content as discussed in previous studies [30-32,
37-42].
Figure 5.24 shows the correlations between the volume of permeable voids and
compressive strength of mortar.
Figure 5.24 Correlation between compressive strength and volume of permeable
voids

167
As shown in Figure 5.24, for mortars without FA, there appeared to be a threshold
value of the volume of permeable voids which was 11.78% (corresponding to alkali
content of 0.60% Na2Oeq). The 7-day or 28-day compressive strength of mortars with
volume of permeable voids lower than 11.78% was not significantly affected by the
volume of permeable voids. However, when the volume of permeable voids was more
than 11.78%, the 7-day and 28-day compressive strength of mortars significantly
decreased with increasing volume of permeable voids. Reminding the compressive
strength of mortars without FA at different alkali contents (see Figure 5.20a), a threshold
value of alkali content of 0.6% Na2Oeq existed. When the alkali content was lower than
0.6% Na2Oeq, the compressive strength of mortar was not significantly affected by the
change in the alkali content. However, when the alkali content was higher than 0.6%
Na2Oeq, the compressive strength of mortar decreases with the increase in the alkali
content. This supported the previous discussion that high alkali content (i.e. 0.88%
Na2Oeq) resulted in porous microstructure of hardened concrete, and thus reduced
compressive strength of mortar. For mortar containing FA, an increase in the volume of
permeable voids resulted in a decrease in the 7-day and 28-day compressive strength.
Reminding the decrease in the compressive strength of mortars containing FA resulted
from the increase in the alkali content from 0.49% Na2Oeq to 0.88% Na2Oeq (see Figure
5.20b), the mechanism that high alkali content resulted in porous microstructure of
hardened concrete and reduced the compressive strength also applied for mortars
containing FA. However, for mortars with and without FA, the extent by which the
compressive strength was negatively affected was unlikely to be solely due to the volume
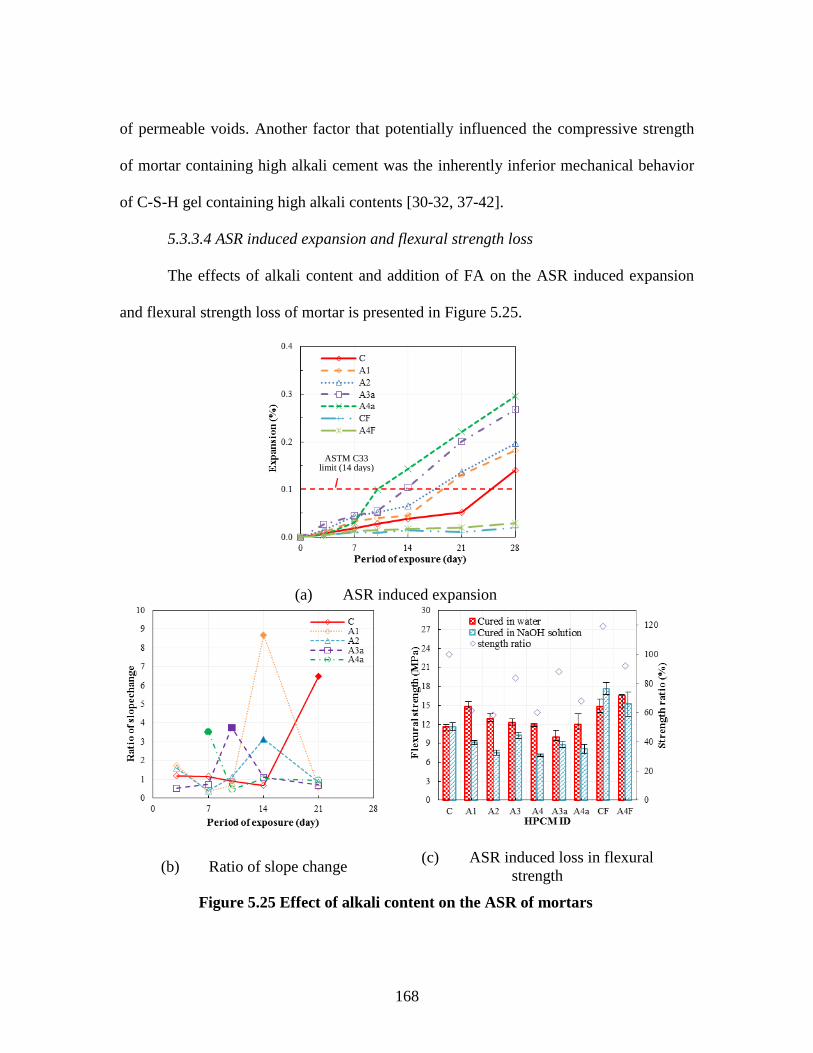
168
of permeable voids. Another factor that potentially influenced the compressive strength
of mortar containing high alkali cement was the inherently inferior mechanical behavior
of C-S-H gel containing high alkali contents [30-32, 37-42].
5.3.3.4 ASR induced expansion and flexural strength loss
The effects of alkali content and addition of FA on the ASR induced expansion
and flexural strength loss of mortar is presented in Figure 5.25.
(a) ASR induced expansion
(b) Ratio of slope change (c) ASR induced loss in flexural
strength
Figure 5.25 Effect of alkali content on the ASR of mortars
ASTM C33 limit (14 days)

169
As it is shown in Figure 5.25a, the ASR induced expansion of mortars without FA
increased with the alkali content, which can be clearly observed between 10 and 28 days
of exposure. A comparison of expansion values at 14 days of exposure revealed that an
increase in alkali content from 0.49% to 0.60%, 0.70%, 0.75% and 0.88% Na2Oeq
resulted in an increase of expansion of 25%, 75%, 150% and 275%, respectively, over
that of the control. A similar comparison at 28 days of exposure revealed that an increase
in alkali content from 0.49% to 0.60%, 0.70%, 0.75% and 0.88% Na2Oeq resulted in an
increase of expansion of 30%, 41%, 92% and 112%, respectively, over that of the
control. However, for mortars containing FA, the ASR induced expansion was minimal
even up to 28 days of exposure (expansion <0.03%), and the difference in expansion
between alkali content of 0.49% and 0.88% Na2Oeq was not significant. FA was found
effective in suppressing ASR even at high alkali content, which was similar to the past
studies [147-149]. The criterion for categorizing reactive and non-reactive aggregate of
0.1% at 14 days as per ASTM C33 is presented as horizontal line in Figure 5.25a for
reference.
It was also noticed from Figure 5.25a that for each mortar there appeared to be a
certain period of exposure, after which the ASR induced expansion started to increase
more significantly than before. The age at which the sudden increase in the expansion
occurred appeared to be related to the inherent alkali content of the mixtures. The higher
the alkali content of the specimens, the earlier the rapid change in expansion occurred.
However, once the change in the rate of expansion occurred, all mixtures exhibited

170
similar rates of expansion, suggesting the overwhelming influence of the soak solution
alkalinity on the expansion. To understand the changes in the rate of ASR induced
expansion with time, an index-ratio of slope change (Rs)-was introduced. Rs at specified
period of exposure was evaluate by calculating the ratio of the slope of expansion curve
immediately after the specified period of exposure to the slope of expansion curve
immediately before the specified period of exposure. For example, mortar A1 mixture,
the ASR induced expansion at 10, 14 and 21 days of exposure was 0.0393%, 0.045% and
0.131%, respectively. The slope of expansion curve immediately after 14 days of
exposure was,
The slope of expansion curve immediately before 14 days of exposure was,
Thus, the Rs at 14 days of exposure is .
Same calculation was done to the mortars without FA at various periods of
exposure, and the results were presented in Figure 5.25b. The peak of each curve in
Figure 5.25b indicates the period of exposure, after which the ASR induced expansion
started to have significant increase. For mortars C, A1, A2, A3a and A4a, the peak
appeared at 21, 14, 14, 10, and 7 days of exposure, respectively, which probably
indicated that as the alkali content increased, the significant increase in ASR induced
expansion of mortar tended to occur earlier. Mortars with FA showed minimal expansion

171
throughout the test duration and no sudden change in the rate of expansion was observed.
Hence, no Rs value was calculated.
The loss in flexural strength of mortar s with various alkali contents due to ASR is
presented in Figure 5.25c. The strength ratio was defined as the ratio of flexural strength
of mortar cured in NaOH solution to that cured in water. For mortars with neither alkali
addition nor FA (UHPC C), specimens cured in NaOH solution and water did not show
noticeable difference in the flexural strength, the strength ratio was 100%. For mortar s
with alkali addition but without FA (mortar A1,A2,A3,A4,A3a and A4a), lower flexural
strength was observed for specimens cured in NaOH solution than that cured in water, the
strength reduction ratio ranged from 50% to 88%. However, for mortars containing FA,
specimens cured in NaOH solution showed 19% higher flexural strength than those cured
in water when no alkali was added (mortar CF), but when the alkali content was 0.88%
Na2Oeq (mortar A4F), strength ratio of 92% was observed. Based on the test results, it can
be concluded that when alkali was added into the mixture, mortar without FA cured in
NaOH solution showed significant loss in flexural strength. The decrease in the flexural
strength of mortars was likely attributed to the ASR which was accelerated in NaOH
solution. However, the ASR in mortar was depressed with the presence of FA, which is
evident by noticing that when the alkali content was at 0.88% Na2Oeq, mortar using FA
had strength ratio of 92% which was higher than the strength ratio of UHPC without FA
which was 68%.

172
5.3.4 Summary of the effect of alkali content on the properties of mortar
The influence of alkali content up to 0.88% Na2Oeq on several properties of
mortar using reactive sand is studied in this section.
From the perspective of workability, there appeared to be a threshold alkali
content of 0.70% Na2Oeq, below which no significant change in workability of mortars
was observed. When the alkali content of cement was higher than 0.70% Na2Oeq, the
workability of mortars significantly decreased with increasing alkali content. The
addition of FA increases the workability especially at higher alkali content of mortar.
For mortars without FA, the shortest time of initial setting was observed when the
alkali content was 0.70% Na2Oeq. However, the time of final setting showed a gradual
increase with an increase in the alkali content of cement. The use of FA prolongs both the
initial and final time of setting.
From the perspective of compressive strength, there appeared to be an optimum
alkali content of 0.60% Na2Oeq for mortar without FA. When the alkali content was less
than 0.60% Na2Oeq, the compressive strength of mortars was not significantly affected by
the increase in the alkali content. When the alkali content was more than 0.60% Na2Oeq,
the compressive strength of mortars significantly decreased with increasing alkali
content. The effect of alkali content on the compressive strength of mortar exists even in
the presence of FA. The lower strength of alkali-containing C-S-H gel and poor
compactibility of mortar as alkali content increased were considered to contribute to the
phenomena observed in this study.
173
The increase in the alkali content increased the drying shrinkage of mortar
without FA. For mortars with FA, the increase in the alkali content increased the drying
shrinkage as well.
For mortars without FA, the rapid chloride ion permeability increased as the alkali
content of cement was gradually increased from 0.49% to 0.88% Na2Oeq. For mortars
with FA, the effect of alkali content on the chloride ion permeability was not clear.
The increase in the alkali content resulted in an increase in the volume of
permeable voids, which contributed to the decreased compressive strength, increased
drying shrinkage and decreased RCP resistance.
Even when the w/cm ratio was as low as 0.20, significant ASR induced
expansions was observed in the test specimens. The ASR induced expansion of mortar
increased with the alkali content. The higher the alkali content of the cement used in the
mortar mixture, the earlier the occurrence of a rapid increase in ASR induced expansion
of mortar. FA was effective in depressing ASR even at high alkali content (i.e. 0.88%
Na2Oeq). Considering that SCM is always presented in the formulation of UHPC, ASR
induced expansion may not be a problem to UHPC.
The loss in the flexural strength of mortar due to ASR was observed with an
increase in the alkali content of the cement, regardless of presence or absence of FA.
However, when FA was used, the loss in the flexural strength was not significant.
In summary, low alkali content cement is preferred for producing UHPC. In cases
where the low alkali content cement is limited, there may be an acceptable alkali content
of cement depending on the component materials’ properties such as reactivity of sand

174
and SCM content, at which the impact of alkali content on certain properties of UHPC is
still in an acceptable range. In this study, alkali content of cement less than 0.70% Na2Oeq
is likely an acceptable level from the consideration of limited impact on the workability
and compressive strength of UHPC.

175
5.4 Effect of Sand Content on the Properties of Mortar3
This section includes the investigations on the effect of sand content on the
workability, compressive strength, drying shrinkage and RCP of mortar with w/c of 0.2.
The maximum sand content for non-fibers reinforced mortar is determined.
5.4.1 Workability of mortar
The workability of mortar influenced by the sand content, HRWRA dosage and
SFU content is shown in Figure 5.26.
(a) Workability of UHPCs without
SFU
(b) Workability of UHPCs with SFU
(HRWRA dosage at 0.75%)
3 This section has been published: Z. Li, P. R. Rangaraju, “Effect of sand content on the properties of self-
consolidating high performance cementitious mortar.” Transportation Research Record, v.2508, pp. 84-92,
2015

176
(c) Workability of UHPCs with SFU (HRWRA dosage at 1%).
Figure 5.26 Workability of mortar affected by sand content
5.4.1.1 Workability of mortar without SFU
As shown in Figure 5.26a, each of the four curves presents the effect of increasing
sand content on the workability of mortar without SFU at a given HRWRA dosage. It
was observed that when the HRWRA dosage was constant the workability of mortars
decreased with the increase in the sand content. This was in agreement with common
knowledge [106]. It was also observed that when the sand content was kept constant, an
increase in the HRWRA dosage resulted in an increase in the workability of mortars.
However, when the HRWRA dosage was higher than a certain level, the workability of
mortar was not increased significantly by the increase in the HRWRA dosage. For
example, by comparing mortars C1-3, C2-3, C3-3, and C4-3 which had s/cm at 1.25, it
was observed that the flow of mortar with HRWRA dosage at 0.75%, 1%, and 1.5% was
125%, 263%, and 275% higher than that with HRWRA dosage at 0.5%, respectively. The
rise in HRWRA dosage from 1% to 1.5% only caused minimal increase in the
177
workability of mortar. A dosage of HRWRA beyond which only minimal increase in
workability was observed was known as saturation dosage [150]. In this study, the
saturation HRWRA dosage was determined to be 1%. Therefore a HRWRA dosage of
1.5% was considered as an overdose. Such HRWRA dosage was not considered
economic cost efficient as the minimal increase in the workability of mortar comparing to
the significant 50% increase in the HRWRA dosage from 1% to 1.5%.
The results from flow tests indicates that the workability of mortar without SFU is
affected by the combined effect of sand content and HRWRA dosage. The workability of
mortar can be increased through either reducing the sand content at a fixed HRWRA
dosage or by increasing HRWRA dosage at a fixed sand content. However, the former
approach is not economically preferable since manufacturers want more sand in mortar to
reduce the cost. The latter approach also has its limitation, since excessive HRWRA
dosage does not increase the workability much further but causes other problems such as
segregation and delayed setting [12, 101, 104]. For economical self-consolidating UHPC,
a balance would probably be reached by finding out the maximum sand content when
HRWRA is dosed at the saturation dosage.
It should be noted that mortars with flow value ranging from 44% to 56% (mortar
C1-3, C2-4, C3-5, and C4-5) had poor workability. They were not considered self-
consolidating UHPCs. External vibration was required during casting the specimens for
compressive strength test. Other mortars were assumed to be self-consolidating mortars,
because they exhibited flowable workability and seemed to be able to consolidate well

178
under self-weight. As Figure 5.26a shows, when the HRWRA was dosed at saturation
dosage (1%), the maximum sand content for flowable mortar without SFU was s/cm=1.6.
5.4.1.2 Workability of mortar with SFU
As shown in Figure 5.26b and 5.23c, for mortars containing SFU, similar trends
were observed that the increasing sand content reduced the workability of mortar at both
HRWRA dosages of 0.75% and 1%. When the HRWRA dosage was 0.75% (Figure
5.26b), the maximum sand content at which the mortar without SFU remained flowable
was s/cm=1.25, and the maximum sand content at which the mortar with SFU content at
either 10% or 20% remained flowable was s/cm=1.6. When the HRWRA dosage was 1%
(Figure 5.26c), the maximum sand content at which the mortar without SFU remained
flowable was s/cm=1.6, and the maximum sand content at which the mortar with SFU
content at 10% and 20% remained flowable was s/cm=1.6 and s/cm=2, respectively.
These mortars consolidated under self-weight during casting and needed no external
vibration. In mixtures with sand content exceeding the maximum s/cm ratios (i.e. mortar
C2-4, L2-5, H2-5, C3-5, and L2-5), the workability was observed to be poor, indicated by
flow values ranging from 32% to 50%. For these mortars external vibration was applied
during casting.
It should be mentioned that among all the flowable mortars, the mortar H3-5
mixture has the lowest flow value (i.e. 69%) that did not require any external vibration to
consolidate. Therefore, based on these observations, a flow value of 69% is considered
as a minimum threshold value that distinguishes non-flowable mortars from flowable
mortars. Such threshold value of 69% is presented in the Figure 5.26 for reference.

179
Mortars with flow values above this threshold value are non-flowable, and they were
subjected to external vibration during casting of the specimens for compressive strength
test. Mortars with flow values below this threshold value are flowable, and they were
consolidated under self-weight during casting of the specimens for compressive strength
test. Thus far, all the mortars studied in this research can be classified into two groups -
flowable mortars and non-flowable mortars. The dashed line in Table 4.8 distinguishes
these two groups. The mortars on the left side of the dash line were flowable mixtures
which were consolidated under self-weight during casting. Mortars on the right side of
the dash line were non-flowable mortars which were consolidated under external
vibration during casting.
5.4.1.3 Sensitivity of workability of mortar to the sand content
Both Figure 5.26b and 5.26c show that SFU seemed to be helpful in improving
the workability of mortar. Under the sand change in the sand content, mortars containing
SFU appears to have less reduction in the workability than mortars without SFU. That is,
the sensitivity of workability of mortar to the sand content is different in mortar with and
without SFU.
An index is introduced to understand the effect of
SFU on the changes in the workability of mortar in response to the changes in the sand
content. is defined as the ratio of the reduction of flow to the increase in s/cm, see
equation (5.1).
(5.1)

180
Where
is the flow of mortar with sand content at 0
is the flow of mortar with sand content at s/cm
is the sand-cementitious material ratio of mortar
For example, of mortar L3-4 (SFU=10%; HRWRA dosage=1%; s/cm=1.6)
was calculated as follow,
The value of indicated how sensitive the workability of mortar was to the changes
in sand content. The calculated of mortars are shown in Figure 5.27.
(a) of mortar, HRWRA = 0.75% (b) of mortar, HRWRA = 1%
Figure 5.27 Sensitivity of workability of mortar to the sand content
It can be noticed from Figure 5.27a that when the HRWRA dosage was 0.75%,
decreased with the increasing addition of SFU at all s/cm levels. For example,

181
when the sand content was at s/cm=1.25, of mortar with SFU content at 0%, 10%,
and 20% was 115%, 80%, and 50%, respectively. This indicates that when subjected to
the same degree of change in the sand content the higher the amount of SFU presented in
the mortar the less the workability will be decreased. That is the workability of mortar
becomes less sensitive to the increased sand content as the SFU content increased. When
the HRWRA dosage was 1.0% (see Figure 5.27b), of mortar with SFU content at
0% and 10% is close. However, mortar with SFU content at 20% showed significant
lower at all s/cm levels. Probably the increase in the HRWRA dosage diminishes
the difference in of mortar when SFU contents are low (0% and 10%).
5.4.2 Compressive strength of mortar
5.4.2.1 Compressive strength of mortar without SFU
The effect of sand content on the 1-day and 28-day compressive strength of
mortar without SFU at various HRWRA dosages is presented in Figures 5.28. The
mortars that consolidated under self-weight are presented in the plots using hollow
symbols, and those that were subjected to external vibration are presented using filled
symbols.

182
(a) UHPC without SFU at 1-day (b) UHPC without SFU at 28-day
Figure 5.28 Compressive strength of mortar without SFU affected by sand content
As shown in Figures 5.28a and 5.28b, the effect of sand content on the 1-day and
28-day compressive strength of mortar was not clear. The 1-day and 28-day compressive
strength seemed to fluctuate around certain values as the sand content increased.. An
analysis of variance is presented later to evaluate the influence of sand content on the
compressive strength of mortar.
The increased HRWRA dosage appeared to have negative effect on the
compressive strength of mortars, especially at the age of 1 day. The 1-day compressive
strength of mortars with s/cm=0.5 revealed that mixtures with HRWRA dosages of
0.75%, 1%, and 1.5% had lower strength compared to mixture with 0.5% HRWRA
dosage by 16%, 29%, and 40%, respectively. Although no calorimetric or setting time
studies were conducted on these mixtures in the present study, it was suspected that
higher dosage levels of HRWRA might cause set-retardation of cement which resulted in
lower compressive strengths at early ages. A similar comparison of mortars with

183
s/cm=0.5 at the age of 28 days revealed that the compressive strength of UHPC with
HRWRA dosages of 0.75% and 1% were 6% higher and 0.4% lower, respectively,
compared to mixture with HRWRA dosage of 0.5%. The effect of HRWRA dosage up to
1% on the compressive strength was not significant at the age of 28 days. However, the
compressive strength of mortar with HRWRA dosage of 1.5% was 23% lower than that
of mortar with HRWRA dosage of 0.5%. Similar findings were reported in another
research study where the optimal HRWRA dosage was observed to be at 1% by weight of
cement, beyond which compressive strength was negatively affected [106]. The improved
compressive strength with an increase in HRWRA dosage up to 1% was explained by
better dispersion of cement, while the reduced compressive strength beyond 1% dosage
of HRWRA was explained by segregation [106]. However, in the present study no
segregation was observed in the mortars even with HRWRA dosage of 1.5%, and
therefore it is unlikely for segregation to be the reason for the observed reduction in the
28-day compressive strength. Considering that some HRWRA typically tend to entrain
air at high dosage levels, even in the absence of air-entraining agents, it is suspected that
at HRWRA dosage levels of 1.5%, increase in the air content of UHPC may have
resulted in lowering of the 28-day compressive strength compared to mortars with lower
HRWRA dosage.
Considering that the HRWRA dosage of 1% was determined as the saturation
dosage from a workability perspective and the HRWRA dosage of 1.5% was determined
as an overdose in early part of this study, it is reasonable to assume that from a
compressive strength perspective the HRWRA dosage of 1% was also the saturation

184
dosage, and HRWRA dosage higher than 1% (i.e. 1.5%) was an overdose which had a
lasting negative effect on the compressive strength of mortars.
5.4.2.2 Compressive strength of mortar with SFU
Figure 5.29 shows the effect of sand content on the 1-day and 28-day compressive
strength of mortar with HRWRA dosage at 0.75% and various SFU contents. Similarly to
Figures 5.28, the mortars consolidated under self-weight are plotted as hollow symbols.
The mortars consolidated under external vibration are plotted as filled symbols.
(a) UHPC with SFU at 1-day (HRWRA
dosage at 0.75%)
(b) UHPC with SFU at 28-day
(HRWRA dosage at 0.75%)

185
(c) UHPC with SFU at 1-day (HRWRA
dosage at 1%)
(d) UHPC with SFU at 28-day
(HRWRA dosage at 1%)
Figure 5.29 Compressive strength of mortar with SFU affected by sand content
For mortars containing SFU, the relation between compressive strength and sand
content was not clear if simply check the results presented in Figure 5.29. An analysis of
variance is presented later to evaluate the influence of sand content on the compressive
strength of mortar. However, it was observed that increased SFU content at either 10% or
20% seemed to reduce the compressive strength of the mortars at the age of 1 day.
Reminding the w/cm was kept constant for mortar with SFU, it was reasonable to assume
that the higher actual w/c probably attributed to the reduced 1-day compressive strength
of mortar with higher SFU content. But, at the age of 28 days, the compressive strength
of mortar with SFU was pretty close to that of UHPC without SFU. This increase could
be because of the pozzolanic effect of SFU which was more prominent at later ages [12].

186
5.4.2.3 Statistical analysis of compressive strength affected by sand content
The purpose of the statistical analysis was to find out whether the change in sand
content would cause statistically significant difference in either 1-day or 28-day
compressive strength of self-consolidating mortars. Analysis of variance (F-test) on the
compressive strength of mortars was only conducted on mortars consolidated under self-
weight. For each F-test at the age of either 1 day or 28 days, only mortars with same SFU
content and same HRWRA dosage were included. As shown in Table 5.6, mortars are
sorted into eight groups, and mortars in each group have same SFU content and same
HRWRA dosage. Total sixteen F-tests were conducted on eight groups of mortars (two F-
tests for each group at 1 day and 28 days, respectively).
Before starting the analysis of variance the following assumptions were made:
a. The compressive strength of each mortar had a normal distribution.
b. Under the same SFU content and the same HRWRA dosage, the variances
of compressive strength of mortars with various sand contents were equal.
c. The compressive strength of mortars with various sand contents was
independent from each other.
The problem of the hypothesis testing was stated as,
Where is the mean compressive strength of mortar with sand content at
s/cm.

187
The possibility of Type I error was set at α=0.05. If the p-value of F-test was
larger than α, we did not have enough evidence to reject , which inferred that the sand
content did not have statistically significant effect on the compressive strength of mortar.
However, if the p-value of F test was equal or less than α, we had enough evidence to
reject , which inferred that the sand content had statistically significant effect on the
compressive strength of mortar. The results of analysis of variance are presented in Table
5.6.
Table 5.6 Analysis of variance of compressive strength
SFU (%) Dosage of
HRWRA (%) UHPCs included
1-day 28-day
p-value Decision a p-value Decision a
0
0.5 C1-1,C1-2 0.716 N 0.432 N
0.75 C2-1,C2-2,C2-3 0.449 N 0.354 N
1 C3-1,C3-2,C3-3,C3-4 0.191 N 0.197 N
1.5 C4-1,C4-2,C4-3,C4-4 0.041 Rej. 0.058 N
10 0.75 L2-1,L2-2,L2-3,L2-4 0.019 Rej. 0.052 N
1 L3-1,L3-2,L3-3,L3-4 0.302 N 0.789 N
20 0.75 H2-1,H2-2,H2-3,H2-4 0.091 N 0.002 Rej.
1 H3-1,H3-2,H3-3,H3-4,H3-5 0.599 N 0.713 N
Note: a N-did not reject H0 or Rej.-rejected H0
It can be observed that the calculated p-values of mortars without SFU were
larger than α when HRWRA dosage varied from 0.5% to 1%, which indicated that sand
content did not have significant effect on both the 1-day and 28-day compressive strength
of mortar with HRWRA dosage ranging from 0.5% to 1%. When the HRWRA dosage
was 1.5%, the decision was to reject H0 for 1-day compressive strength (p-
value=0.041<α), but failed to reject H0 for 28-day compressive strength (p-
value=0.058>α). This inferred that when the HRWRA dosage was 1.5%, the changes in

188
sand content resulted in changes in the 1-day compressive strength of mortar, but it did
not have significant influence on the 28-day compressive strength. However, it was
necessary to notice that these decisions for mortar with HRWRA dosage at 1.5% were
not statistically strong, because the p-values were very close to α which was set at 0.05 in
this study. If lower α was set, say 0.04, the decision would be fail to reject H0 for both 1-
day and 28-day compressive strength. So far, a conclusion is drawn that, with HRWRA
dosage at 1%, the maximum sand content was able to go up to s/cm=1.6 without having
statistically strong influence on either the 1-day or 28-day compressive strength of mortar
without SFU.
For mortars with SFU content at 10%, rejections to H0 only occurred for 1-day
compressive strength when the HRWRA dosage was 0.75%. When HRWRA dosage was
1%, we failed to reject H0 for both 1-day and 28-day compressive strength. This indicated
that when HRWRA dosage was at 0.75%, the change in s/cm from 0 to 1.6 resulted in
noticeable changes in the 1-day compressive strength of UHPCs. However, when
HRWRA dosage was at 1%, s/cm went up to 1.6 failed to cause significant changes in
either 1-day or 28-day compressive strength of mortars.
Similarly, for mortars with SFU content at 20%, rejections to H0 only occurred for
28-day compressive strength when the HRWRA dosage was 0.75%. The decision was
strong since p-value is remarkably smaller than α (0.002< α). A test of Fisher’s least
significant difference procedure (LSD) identified that mortar with s/cm=1.6 had the most
significantly different 28-day compressive strength from the rest mortars. Considering the
results presented in Figure 5.29b, it was noticed that sand content at s/cm=1.6 resulted in

189
remarkable compressive strength loss at the age of 28 days. However, when HRWRA
dosage was 1%, we failed to reject H0 for both 1-day and 28-day compressive strength,
which indicated that sand contents up to s/cm=2 did not have statistically significant
influence on either the 1-day or 28-day compressive strength of mortar.
5.4.2.4 Discussion of maximum sand content of self-consolidating mortar
From the point of lowering economic cost, it is generally preferable to increase
the sand content of mortar. However, increasing sand content would reduce the
workability and cause compressive strength loss. The maximum sand content at which
the mortar still maintained the ability of self-consolidating and the compressive strength
of mortar was not significantly lowered is important in the design of self-consolidating
mortar. Based on a combined consideration of both workability and compressive strength
of mortar in this study, it is reasonable to believe that for self-consolidating mortar with
SFU contents at 0%, 10%, and 20%, the maximum sand content could go up to 1.6, 1.6,
and 2, respectively. It should be reminded that such maximum sand contents are affected
by many factors, such as gradation and texture of sand. Different maximum sand contents
of self-consolidating mortar likely exist when different types of sand was used.
5.4.3 Durability of mortar
5.4.3.1 Rapid Chloride Ion permeability
The RCP of mortar without SFU was studied on mortar C3-1, C3-2, C3-3, C3-4,
and C3-5. The experimental results are presented in Figure 5.30, which depicts the RCP
values at different s/cm ratios and a prediction equation.

190
Figure 5.30 Influence of s/cm on RCP of UHPC without SFU
As shown in Figure 5.30, the amount of charge passed decreased as the s/cm
increased, which indicated that the chloride permeability of mortar decreased as
increasing amount of siliceous sand is added into the mixture. Considering the sand is
much less permeable than cement paste, the reduced chloride permeability of mortar is
likely because of the reduced volume of cement paste through which the charge passed.
However, when the sand content goes up to s/cm=2, the reduction in charge passed was
not significant. For mortar with sand content at s/cm=2 the charge passed was only 3%
lower than mortar with sand content at s/cm=1.6. The lack of significant decrease in the
chloride ion permeability beyond s/cm ratio of 1.6 can be attributed to two conflicting
effects – the reduction in the cement paste volume (which should reduce the
permeability) and the percolation effect in cement paste due to interfacial transition zone
(ITZ) (which should increase the increase the permeability). With increasing sand
content, the volume of cement paste in the mortar is proportionately reduced and
therefore the permeability of the mortar should decrease. However, with increasing sand
R2=0.999

191
content, the volume of paste that is in the ITZ is relatively more compared to the paste
that is considered as bulk paste. If sand content goes up to certain point when adjacent
ITZs start to percolate, the permeability of the whole structure of concrete increases
significantly [12, 108]. The RCP of mortar affected by increasing sand content is
assumed to be a function of reduced paste content and increased ITZ in the present study.
The following three-parameter regression equation based on five data points was
used to describe the charge passed during RCP test for mortars without SFU ( also see
Figure 5.30),
(5.2)
Where
y is dependent variable
x is independent variable
a, b, and c are constants to be determined by the test results
In this study, the following equation was proposed,
(R2=0.999) (5.3)
Where
k is charge passed
r is s/cm
The plot of Equation (5.3) is shown in Figure 5.30.

192
5.4.3.2 Drying shrinkage
The drying shrinkage of mortar without SFU was studied on mortar C3-1, C3-2,
C3-3, C3-4, and C3-5. The drying shrinkage developments of mortar without SFU are
shown in Figure 5.31.
(a) Drying shrinkage development (b) Influence of s/cm on the maximum
drying shrinkage
Figure 5.31 Drying shrinkage of UHPC impacted by sand content
As shown in Figure 5.31a, mortar with high sand content presented lower drying
shrinkage than mortar with low sand at all testing ages. After 56 days of exposure, the
curves of drying shrinkage development of mortars almost flattened out. Thus, the drying
shrinkage of 56 days of exposure was considered the maximum drying shrinkage of
studied mortar, see Figure 5.31b. A simple calculation revealed that the maximum drying
shrinkage of mortar with sand content at s/cm=0.5, 1.25, 1.6, and 2 was 44%, 65%, 72%,
and 75% lower than that of mortar without sand, respectively. The reduction in drying
R2=0.997

193
shrinkage as sand content increased was likely because of the reduced volume of cement
paste, which is the main reason of shrinkage under drying [12].
The relationship between the 56-day shrinkage as a function of s/cm can be
described by equation (5.4) which is a three-parameter regression equation based on five
data points (also see Figure 5.31b).
(R2=0.997) (5.4)
Where
D is the maximum drying shrinkage
r is s/cm
5.4.4 Summary of the effect of sand content on the properties of mortar
The workability, compressive strength and durability of self-consolidating mortar
with and without containing SFU were experimentally studied.
For mortar without SFU, the workability was influenced by the combination of
HRWRA dosage and sand content. Increasing HRWRA dosage or decreasing sand
content improved the workability of mortar, however HRWRA exceeding saturation
dosage did not increase the workability further. Based on the material and mixture
proportions used in this study, the saturation dosage of HRWRA was established at 1%
by weight of the cement.
The workability of mortar became less sensitive to the changes in the sand content
when the SFU content increased, which was revealed by the index Rs/cm.
The compressive strength of self-consolidating mortar was not significantly
influenced by the sand content up to a maximum sand content, depending on the dosage

194
of SFU and HRWRA. In this study, with HRWRA at saturation dosage (1%), the
maximum sand content for self-consolidating mortar without SFU was able to go up to
s/cm=1.6, and the maximum sand content for self-consolidating mortar with SFU content
at 10% and 20% was able to go up to s/cm=1.6 and s/cm=2, respectively.
For self-consolidating mortar without SFU, increased sand content was helpful in
improving the durability of mortar. Lower chloride permeability and less drying
shrinkage were observed as the sand content increased.
In summary, the increase in the sand content in the UHPC not only reduce the
economic cost, but also improve some of the durability properties of UHPC such as
drying shrinkage and RCP which are studied in This section. Sand content up to certain
point will not significantly decrease the workability compressive strength of UHPC.
Within the accept range of effect on the workability and compressive strength, the sand
content is preferred to be as high as possible, which explain the significance of maximum
sand content of self-consolidating mortar which is studied in This section. However, it
should be noted that the use of sand of different angularity or particle size distribution
from the sand used in this study may result in different maximum sand content. To
specific circumstance, the maximum sand content needs to be determined.

195
5.5 Effect of Supplementary Cementitious Materials on the Properties of Paste
This section includes the investigations on the effect of different SCM and their
proportions on the workability, time of conversion from dry mixture to fluid mixture,
setting time, autogenous shrinkage, compressive strength, drying shrinkage and volume
of permeable voids of paste with w/c of 0.2. The mechanism of the influence of SCM on
the properties of paste is determined. The optimal MK and FA content is investigated.
Prediction models of the material properties of cementitious paste are developed based on
the SFU content, MK content and FA content.
5.5.1 Paste using binary blend of SCM and cement
5.5.1.1 Time of conversion from dry mixture to fluid mixture (Tc)
The conversion of mixture from a dry mixture to a fluid mixture (i.e. a cohesive
and flowable consistency) after adding mixing water is a gradual process during the
mixing, and the time needed for this conversion is referred to as Tc. The judgment on
when the mixture behaves as fluid is more or less subjective, and is based on visual
observation of the mixture during the mixing process. Thus, the determination of Tc is
not definite. The approximate time (Tc) observed for the studied pastes to transform from
dry mixture to fluid mixture is given in Table 5.7.

196
Table 5.7 Approximate time needed for the dry mixture to reach fluid state- Tc
(min)
Paste ID Tc SCMb/ca Paste ID Tc SCMb/ca Paste ID Tc SCMb/ca
C 0.4 0.00 S4 5.0 0.40 UF1 0.3 0.10
S1 0.9 0.10 M1 2.5 0.05 UF2 0.2 0.20
S2 2.9 0.20 M2 8.0 0.10 UF3 0.2 0.30
S3 3.8 0.30 M3 32.0 0.20 a cement; b supplementary cementing materials: silica fume alone or meta-kaolin + fly ash
As shown in Table 5.7, for pastes containing binary blend of SFU and cement, the
increase in the SFU content noticeably increased the Tc. As the SCM/c increased from 0
to 0.4, the Tc continuously increased from 0.4 min to 5 min. This was attributed to the
large surface area of fine SFU particles that required longer energy input time (Tc) to
achieve homogenous paste system [12]. For pastes containing binary blend of MK and
cement, the increase in the MK content significantly increased the Tc. As the SCM/c
increased from 0 to 0.2, the Tc continuously increased from 0.4 min to 32 min. Such
significant increase in the Tc was related to the promoted cement hydration in the
presence of MK [81, 83, 84], in addition to the large surface area of fine MK particles.
For pastes containing binary blend of UFA and cement, the increase in the UFA content
did not have significant effect on the Tc, by noticing that as the SCM/c increased from 0
to 0.3, the Tc was slightly decreased from 0.4 min to 0.2 min. The ball bearing effect and
water reducing effect of UFA [12] were helpful to achieve homogenous paste system
within a relatively short time even in presence of large surface area of fine UFA particles.
5.5.1.2 Workability
The workability of cementitious paste using binary blend of SCM and cement is
shown in Figure 5.32.

197
Figure 5.32 Workability of paste using binary blend of SCM and cement
As shown in Figure 5.32, for pastes containing binary blend of cement and UFA,
the increase in the UFA content from SCM/c=0 to SCM/c=0.1 slightly increased the flow
value of paste by 4%. This was similar to what observed in previous literature that the
increase in the UFA content improved the workability of concrete and it was attributed to
the ball bearing effect and water reducing effect of UFA [12]. However, the further
increase in the UFA content from SCM/c=0.1 to SCM/c= 0.3 slightly decreased the flow
value of paste by 8%. Considering the fine particles size of UFA, the decrease in the flow
value was attributed to the large surface area provided by the UFA particles. For pastes
containing binary blend of cement and SFU, the increase in the SFU content decreased
the flow value. For instance the flow of pastes with SCM/c at 0.1, 0.2 and 0.3 was 7%,
17% and 39% lower than that of control (SCM/c=0.0), respectively. Likely the large
surface area provided by the fine SFU particles contributed to the decrease in the flow

198
value as the SFU content increases [12]. For pastes containing binary blend of cement
and MK, the increase in the MK content decreased the flow value of pastes significantly.
The flow of pastes with SCM/c at 0.05, 0.1 and 0.2 was 2%, 14% and 37% lower than
that of control, respectively. The decrease in the flow value due to the use of MK had
also been observed in the previous literature, and it was attributed to the promoted
cement hydration in the presence of MK [81, 83, 84]. It should be noted that MK has the
most significantly effect in decreasing the flow value than both UFA and SFU at the
same levels of SCM/c.
5.5.1.3 Time of set
The time of set of cementitious paste using binary blend of SCM and cement is
shown in Figure 5.33.
Figure 5.33 Time of set using binary blend of SCM and cement

199
As shown in Figure 5.33, for pastes containing binary blend of cement and UFA,
the increase in the UFA content from SCM/c=0 to SCM/c=0.2 significantly increased
both the time of initial set and the time of final set. This was in accordance with previous
literature on the retarding effect of UFA on the hydration of cement, and it was attributed
to the low pozzolanic reactivity of UFA at early ages [81, 84, 151, 152]. For pastes
containing binary blend of cement and SFU, there appeared to be a threshold SFU
content of SCM/c=0.1. When the SFU content increased from SCM/c=0 to SCM/c=0.1,
the time of initial set increased by 12%, and the time of final set increased by 2%. When
the SFU content increased from SCM/c=0.1 to SCM/c=0.2, the time of initial set
decreased by 21%, and the time of final set decreased by 17%. In this study the influence
of SFU on the setting behavior of cement was attributed to the increased actual water-
cement (w/c) ratio with the increase in SFU content as w/cm was kept constant, the
nucleation effect provided by the surface area of SFU particles, and the early pozzolanic
reactivity of SFU. At low SFU content, the increased actual w/c was likely responsible to
the increased time of set of cement. At high SFU content, the nucleation effect and the
early pozzolanic reaction of SFU were likely responsible to the decreased time of set of
cement. For pastes containing binary blend of cement and MK, the increase in the MK
content decreased both the time of initial set and the time of final set. This had been
observed in the previous literature, and attributed to the promoted cement hydration in the
presence of MK [81, 83, 84].
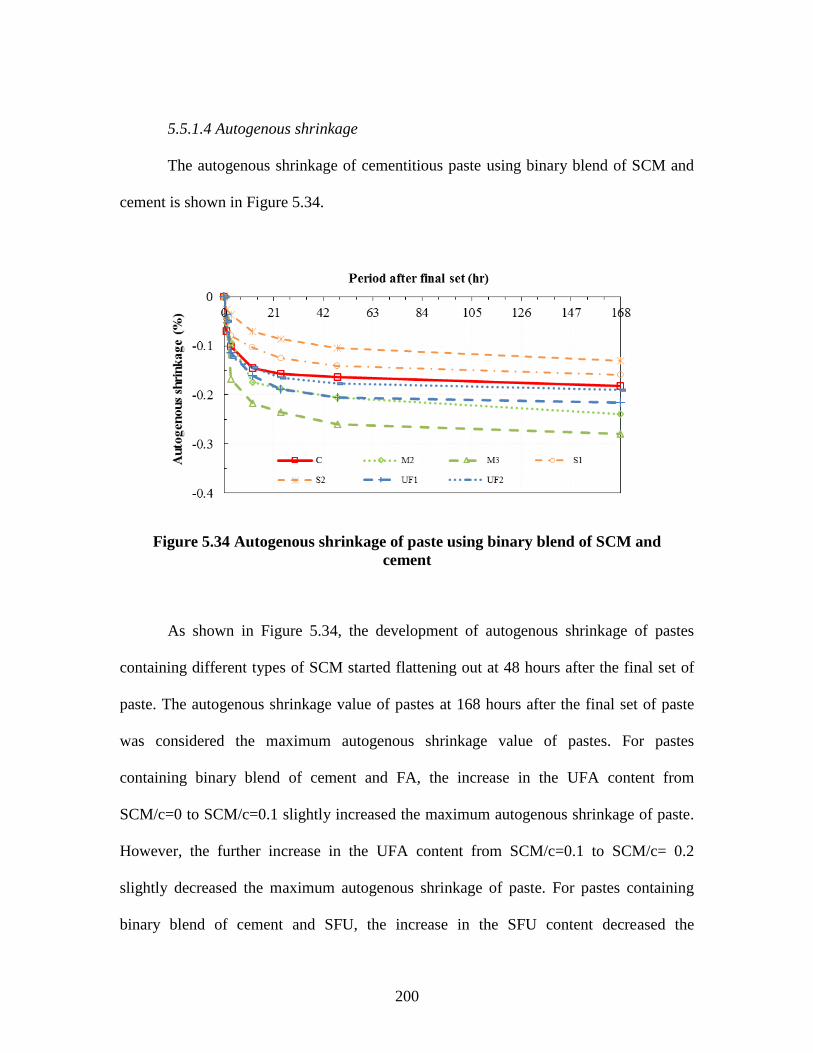
200
5.5.1.4 Autogenous shrinkage
The autogenous shrinkage of cementitious paste using binary blend of SCM and
cement is shown in Figure 5.34.
Figure 5.34 Autogenous shrinkage of paste using binary blend of SCM and
cement
As shown in Figure 5.34, the development of autogenous shrinkage of pastes
containing different types of SCM started flattening out at 48 hours after the final set of
paste. The autogenous shrinkage value of pastes at 168 hours after the final set of paste
was considered the maximum autogenous shrinkage value of pastes. For pastes
containing binary blend of cement and FA, the increase in the UFA content from
SCM/c=0 to SCM/c=0.1 slightly increased the maximum autogenous shrinkage of paste.
However, the further increase in the UFA content from SCM/c=0.1 to SCM/c= 0.2
slightly decreased the maximum autogenous shrinkage of paste. For pastes containing
binary blend of cement and SFU, the increase in the SFU content decreased the

201
maximum autogenous shrinkage of paste. For instance, the flow of pastes with SCM/c at
0.1and 0.2 was found to be 13% and 29% lower than that of control, respectively. For
pastes containing binary blend of cement and MK, the increase in the MK content
increased the maximum autogenous shrinkage of paste significantly. For instance the
maximum autogenous shrinkage of pastes with SCM/c at 0.1 and 0.2 was 31% and 53%
higher than that of control, respectively.
Previous literature on the effect of SCM on the autogenous shrinkage of paste is
contradictory. The increase and decrease in the autogenous shrinkage of paste resulted
from the use of SCM both have been reported [153-160]. The autogenous shrinkage
behavior of paste containing SCM has been attributed to possible effects of SCM which
include the dilution effect that decreases the autogenous shrinkage, heterogeneous
nucleation which may increase or decrease the autogenous shrinkage, pozzolanic effect
which increases the autogenous shrinkage, filler effect which increases the autogenous
shrinkage and properties of hydration products [154, 157, 158, 160]. Mineral admixtures
may increase or decrease the autogenous shrinkage of paste depending on the
significance of each of the possible effects of SCM. The autogenous shrinkage of pastes
is also related with the materials, proportions and test method used for study. This study
did not focus on the mechanism underlying the autogenous shrinkage behavior of paste
affected by SCMs. More research is needed to address these issues.
5.5.1.5 Compressive strength
The compressive strength of cementitious paste using binary blend of SCM and
cement is shown in Figure 5.35.
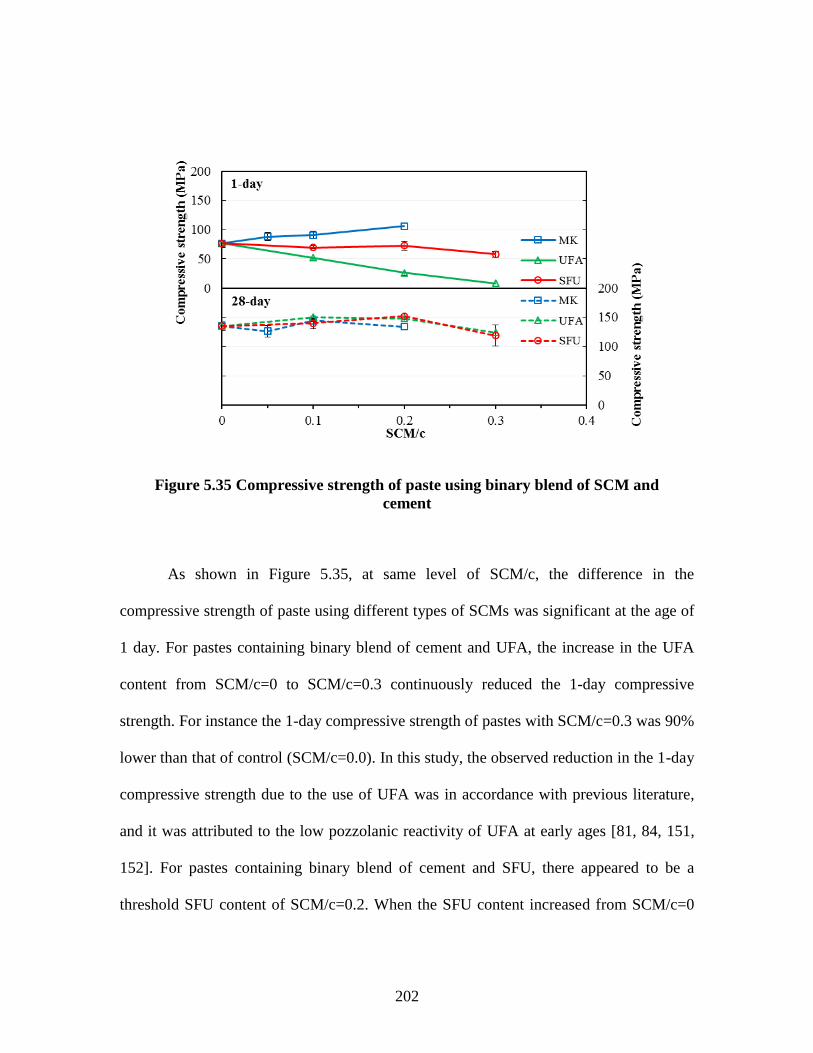
202
Figure 5.35 Compressive strength of paste using binary blend of SCM and
cement
As shown in Figure 5.35, at same level of SCM/c, the difference in the
compressive strength of paste using different types of SCMs was significant at the age of
1 day. For pastes containing binary blend of cement and UFA, the increase in the UFA
content from SCM/c=0 to SCM/c=0.3 continuously reduced the 1-day compressive
strength. For instance the 1-day compressive strength of pastes with SCM/c=0.3 was 90%
lower than that of control (SCM/c=0.0). In this study, the observed reduction in the 1-day
compressive strength due to the use of UFA was in accordance with previous literature,
and it was attributed to the low pozzolanic reactivity of UFA at early ages [81, 84, 151,
152]. For pastes containing binary blend of cement and SFU, there appeared to be a
threshold SFU content of SCM/c=0.2. When the SFU content increased from SCM/c=0

203
to SCM/c=0.2, the 1-day compressive strength was not affected significantly. The 1-day
compressive strength of pastes with SCM/c=0.2 was only 7% higher than that of control.
However, when the SFU content was further increased from SCM/c=0.2 to SCM/c=0.3,
1-day compressive strength was decreased by 30%. Likely the increased actual w/c,
nucleation effect, and the early pozzolanic reactivity of SFU contributed to the observed
phenomenon. For pastes containing binary blend of cement and MK, the increase in the
MK content continuously increased the 1-day compressive strength. For instance, the 1-
day compressive strength of pastes with SCM/c=0.2 was found to be 38% higher than
that of control. The increase in the early age compressive strength of paste due to the use
of MK had been observed in the previous literature, and attributed to the promoted
cement hydration in the presence of MK [81, 83, 84].
The use of SCM at proper proportions improved the 28-day compressive strength
of paste, compared with the control. For pastes containing binary blend of UFA and
cement, the 28-day compressive strength of paste increased with the increase in the UFA
content up to SCM/c=0.1, after which the 28-day compressive strength of paste decreased
with the increase in the UFA content. The highest 28-day compressive strength achieved
by using binary blend of UFA and cement was 150 MPa. For pastes containing binary
blend of SFU and cement, the 28-day compressive strength of paste increased with the
increase in the SFU content up to SCM/c=0.2, after which the 28-day compressive
strength of paste decreased with the increase in the SFU content. The highest 28-day
compressive strength achieved by using binary blend of SFU and cement was 152 MPa.
The effect of MK on the 28-day compressive strength did not have clear trend. The

204
highest 28-day compressive strength achieved by using binary blend of MK and cement
was 144 MPa (SCM/c=0.2).
5.5.1.6 Free drying shrinkage
The drying shrinkage of cementitious paste using binary blend of SCM and
cement is shown in Figure 5.36.
Figure 5.36 Drying shrinkage of paste using binary blend of SCM and cement
As shown in Figure 5.36, for pastes containing binary blend of cement and UFA,
the increase in the UFA content resulted in increase in the drying shrinkage of paste. At
the period of exposure of 25 days, the drying shrinkage of paste with SCM/c=0.2 was
20% higher than that of control. For pastes containing binary blend of cement and SFU,
the increase in the SFU content also increased the drying shrinkage of paste. However,
the difference in the drying shrinkage of paste with SCM/c=0.1 and SCM/c=0.2 was not
significant. For instance, at the period of exposure of 25 days, the drying shrinkage of
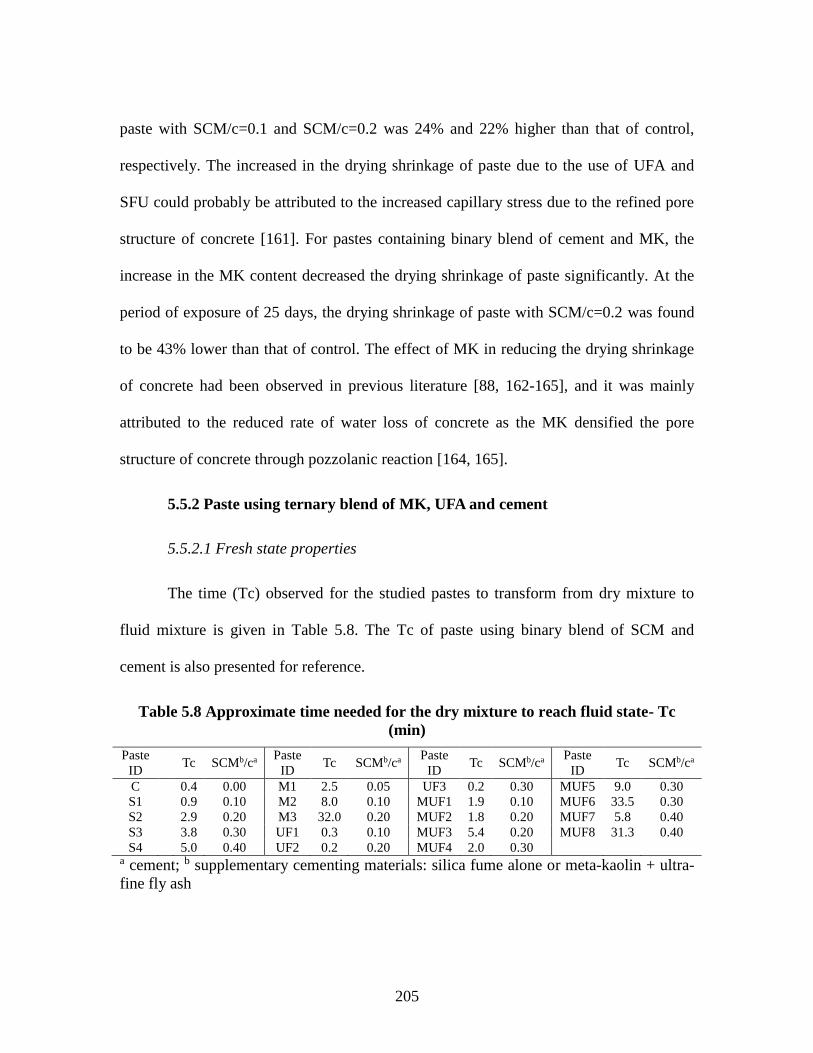
205
paste with SCM/c=0.1 and SCM/c=0.2 was 24% and 22% higher than that of control,
respectively. The increased in the drying shrinkage of paste due to the use of UFA and
SFU could probably be attributed to the increased capillary stress due to the refined pore
structure of concrete [161]. For pastes containing binary blend of cement and MK, the
increase in the MK content decreased the drying shrinkage of paste significantly. At the
period of exposure of 25 days, the drying shrinkage of paste with SCM/c=0.2 was found
to be 43% lower than that of control. The effect of MK in reducing the drying shrinkage
of concrete had been observed in previous literature [88, 162-165], and it was mainly
attributed to the reduced rate of water loss of concrete as the MK densified the pore
structure of concrete through pozzolanic reaction [164, 165].
5.5.2 Paste using ternary blend of MK, UFA and cement
5.5.2.1 Fresh state properties
The time (Tc) observed for the studied pastes to transform from dry mixture to
fluid mixture is given in Table 5.8. The Tc of paste using binary blend of SCM and
cement is also presented for reference.
Table 5.8 Approximate time needed for the dry mixture to reach fluid state- Tc
(min)
Paste
ID
Tc SCMb/ca Paste
ID Tc SCMb/ca
Paste
ID Tc SCMb/ca
Paste
ID Tc SCMb/ca
C 0.4 0.00 M1 2.5 0.05 UF3 0.2 0.30 MUF5 9.0 0.30
S1 0.9 0.10 M2 8.0 0.10 MUF1 1.9 0.10 MUF6 33.5 0.30
S2 2.9 0.20 M3 32.0 0.20 MUF2 1.8 0.20 MUF7 5.8 0.40
S3 3.8 0.30 UF1 0.3 0.10 MUF3 5.4 0.20 MUF8 31.3 0.40
S4 5.0 0.40 UF2 0.2 0.20 MUF4 2.0 0.30 a cement; b supplementary cementing materials: silica fume alone or meta-kaolin + ultra-
fine fly ash

206
For pastes containing ternary blend of MK, UFA and cement, when SCM/c was
fixed, the increase in the MK content increases the Tc, and the increase in the UFA
content decreased the Tc. For instance, when SCM/c was 0.20, the Tc of pastes UF2,
MUF2, MUF3 and M3 (pastes arranged in an order of increasing MK content or
decreasing UFA content) was 0.2, 1.8, 5.4 and 32 min, respectively. It was also noted that
at the same level of SCM/c, some of the pastes using ternary blend of MK, UFA and
cement exhibited longer Tc than pastes using binary blend of SFU and cement, depending
on the proportions of MK and UFA in the ternary blend. When MK content was high, i.e.
pastes MUF6 and S3, the Tc of former was 7.8 time longer than Tc of later. When MK
content was low, i.e. pastes MUF4 and S3, the Tc of former was 47% shorter than Tc of
later. Thus, the MK content in the ternary blend of MK, UFA and cement should be
carefully selected to avoid long mixing time.
The workability of pastes using ternary blend of MK, UFA and cement is
presented in Figure 5.37.
Figure 5.37 Workability of pastes

207
As shown in Figure 5.37, for pastes using ternary blend of MK, UFA and cement,
the flow values fell into the middle of flow values of pastes using binary blend of either
MK and cement or UFA and cement. At the same level of SCM/c, the flow decreased
with the increase in the MK content in the ternary blend of MK, UFA and cement. For
instance, when SCM/c was 0.30, the flow of pastes MUF4, MUF5 and MUF6 (pastes
arranged in an order of increasing MK content) was 6%, 13% and 32% lower than that of
paste UF3, respectively. It should be noted that the flow of pastes containing both MK
and UFA as SCM was higher than that of pastes containing SFU alone as SCM at the
same level of SCM/c, especially at high levels of SCM/c (i.e. when SCM/c =0.3 and
SCM/c =0.4).
Based on the experimental results of the time of transformation from dry mixture
to fluid mixture and the workability of pastes containing different pozzolans, it was noted
that the increase in MK content resulted in increase in the mixing time and decrease in
the workability of the paste. This was in accordance with the past studies, which was
attributed to the high specific surface of MK and the accelerated cement hydration in
presence of MK [81-84]. The increase in UFA content slightly increased the workability
of the paste. The time of transformation from dry mixture to fluid mixture was not
significantly decreased. The combined use of MK and UFA could conquer the decrease
in the workability and the increase in the mixing time of paste due to the use of MK. At
the same level of SCM/c, the combined use of MK and UFA as SCM could produce paste
with higher flow than use SFU alone as SCM, especially at higher SCM/c levels.
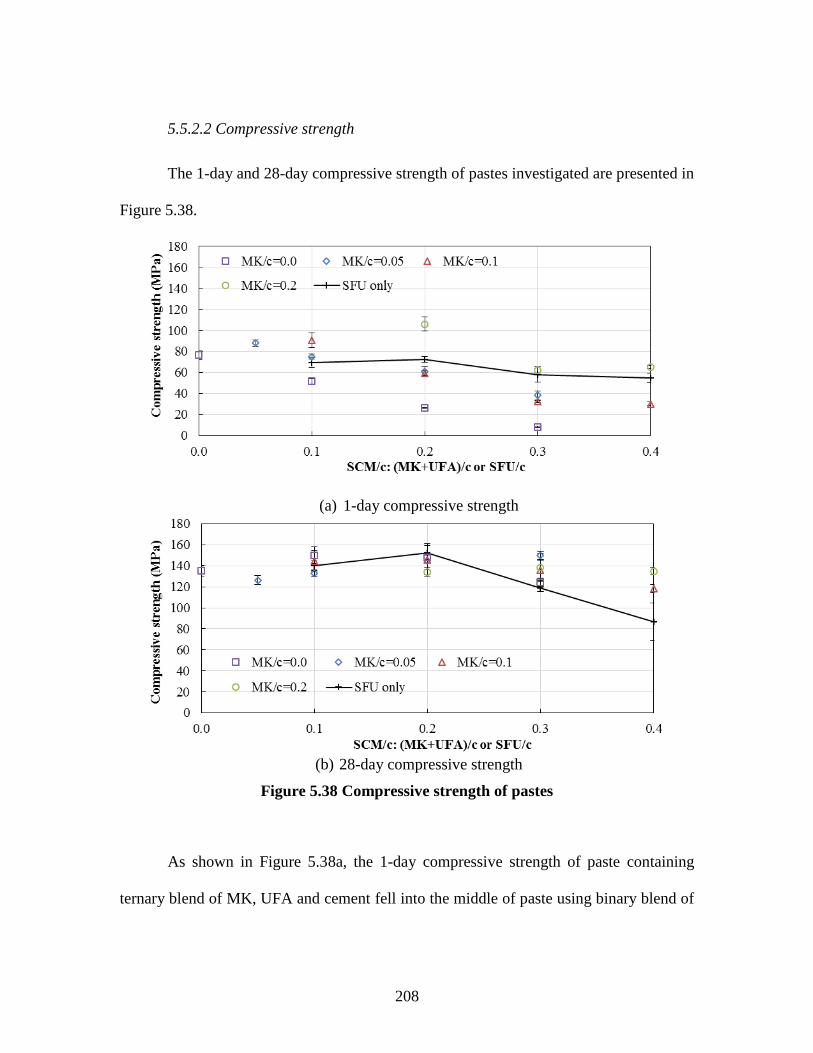
208
5.5.2.2 Compressive strength
The 1-day and 28-day compressive strength of pastes investigated are presented in
Figure 5.38.
(a) 1-day compressive strength
(b) 28-day compressive strength
Figure 5.38 Compressive strength of pastes
As shown in Figure 5.38a, the 1-day compressive strength of paste containing
ternary blend of MK, UFA and cement fell into the middle of paste using binary blend of

209
either MK and cement or UFA and cement. For instance, when SCM/c was 0.2, the 1-day
compressive strength of paste MUF2, MUF3 and M3 (ordered in increasing MK content)
was 133%, 127% and 306% higher than that of paste UF2 which contains no MK,
respectively. It was noted that at the same level of SCM/c some of the pastes using MK-
UFA combinations seemed to have similar or higher 1-day compressive strength than
paste using SFU alone as SCM, especially at high levels of SCM/c. The Student’s t test is
conducted later in this paper to make a statistically evident judgement and detailed
discussion on this phenomenon.
As shown in Figure 5.38b, the 28-day compressive strength of pastes containing
MK-UFA combinations as SCM ranged from 118.1MPa to 150.1MPa. For pastes
containing binary blend of SFU and cement, the 28-day compressive strength increased
with the increasing SFU content up to SCM/c=0.2, after which the 28-day compressive
strength noticeably decreased with the increasing SFU content. It was noted that the
highest 28-day compressive strength of pastes investigated in this study was achieved by
paste S2, which was 152 MPa. If comparing the compressive strength of pastes
containing MK-UFA combinations and pastes containing SFU alone at the same SCM/c
level, pastes containing MK-FA combinations seemed to have similar compressive
strength to pastes containing SFU alone at low SCM/c levels, but higher compressive
strength than pastes containing SFU alone at high SCM/c levels. Student’s t test is
conducted later to reveal the difference between the 28-day compressive strength of
pastes containing MK-UFA combinations as SCM and pastes containing binary blend of
SFU and cement in detail.

210
To compare the compressive strength of pastes using MK-UFA combination as SCM
(CSMUF) and the compressive strength of pastes using binary blend of SFU and cement
(CSSFU) at the same SCM/c level and at the same age, Student’s t test for independent
samples with unequal variances was conducted [166]. The 1-day and 28-day compressive
strength of pastes were studied separately. The problem statements of the student’s t tests
are listed as follows:
Test 1: Ho: CSMUF ≤ CSSFU
Ha: CSMUF > CSSFU
The Type I error was set at 0.05. When Ho is rejected, it implies that the
difference in the compressive strength of paste using MK-FA combinations as SCM and
that of paste using SFU alone as SCM is significant, and paste using MK-FA
combinations as SCM has higher compressive strength than paste using SFU alone as
SCM.
Test 2: Ho: CSMUF ≥ CSSFU
Ha: CSMUF < CSSFU
The Type I error was set at 0.05. When Ho is rejected, it implies that the
difference in the compressive strength of paste using MK-FA combinations as SCM and
that of paste using SFU alone as SCM is significant, and paste using MK-FA
combinations as SCM has lower compressive strength than paste using SFU alone as
SCM.
In cases where it failed to reject the Ho in both of the test problems, the difference
in the compressive strength between pastes containing MK-UFA combination and pastes
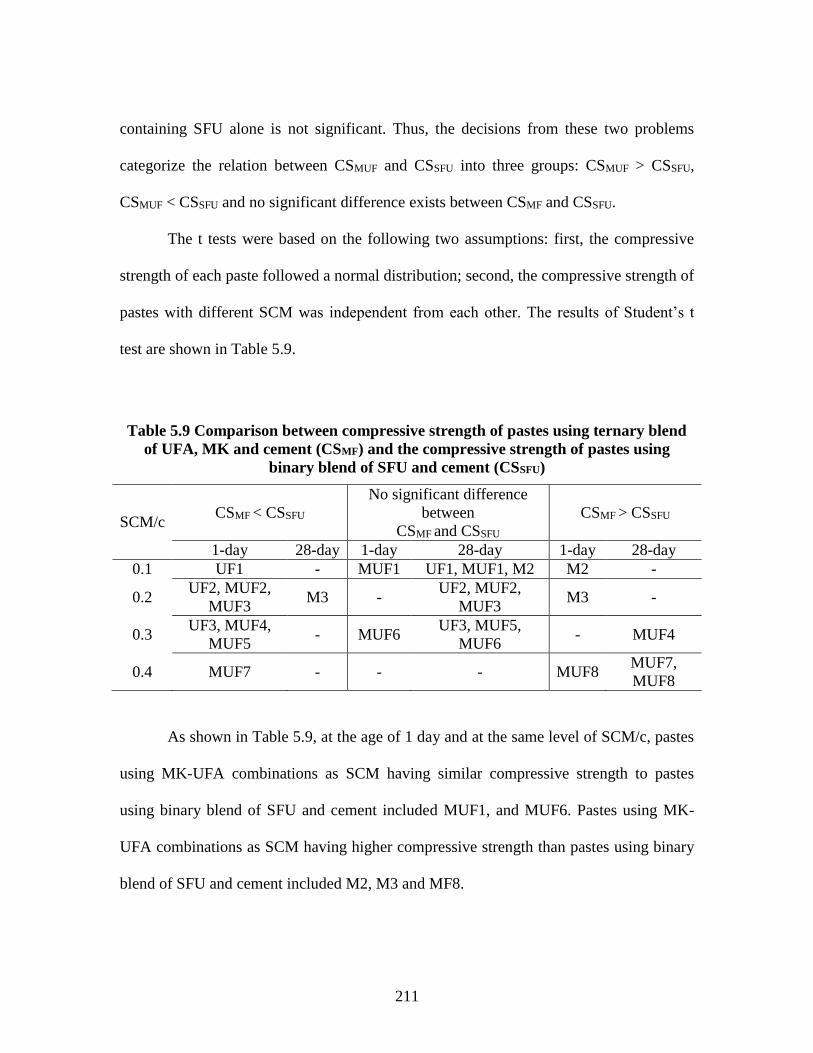
211
containing SFU alone is not significant. Thus, the decisions from these two problems
categorize the relation between CSMUF and CSSFU into three groups: CSMUF > CSSFU,
CSMUF < CSSFU and no significant difference exists between CSMF and CSSFU.
The t tests were based on the following two assumptions: first, the compressive
strength of each paste followed a normal distribution; second, the compressive strength of
pastes with different SCM was independent from each other. The results of Student’s t
test are shown in Table 5.9.
Table 5.9 Comparison between compressive strength of pastes using ternary blend
of UFA, MK and cement (CSMF) and the compressive strength of pastes using
binary blend of SFU and cement (CSSFU)
As shown in Table 5.9, at the age of 1 day and at the same level of SCM/c, pastes
using MK-UFA combinations as SCM having similar compressive strength to pastes
using binary blend of SFU and cement included MUF1, and MUF6. Pastes using MK-
UFA combinations as SCM having higher compressive strength than pastes using binary
blend of SFU and cement included M2, M3 and MF8.
SCM/c CSMF < CSSFU
No significant difference
between
CSMF and CSSFU
CSMF > CSSFU
1-day 28-day 1-day 28-day 1-day 28-day
0.1 UF1 - MUF1 UF1, MUF1, M2 M2 -
0.2 UF2, MUF2,
MUF3 M3 -
UF2, MUF2,
MUF3 M3 -
0.3 UF3, MUF4,
MUF5 - MUF6
UF3, MUF5,
MUF6 - MUF4
0.4 MUF7 - - - MUF8 MUF7,
MUF8

212
At the age of 28 day and at the same level of SCM/c, pastes using MK-UFA
combinations as SCM having similar compressive strength to pastes using binary blend
of SFU and cement included UF1, UF2, UF3, M2, MUF1, MUF2, MUF3, MUF5 and
MUF6. Pastes using MK-UFA combinations as SCM having higher compressive strength
than pastes using binary blend of SFU and cement included MUF4, MUF7 and MUF8.
Pastes MUF1, MUF2, MUF6 and MUF8 performed as well as or better than paste
using SFU alone as SCM at the corresponding same level of SCM/c, from a perspective
of both 1-day and 28-day compressive strength. The highest 28-day compressive strength
of paste using ternary blend of MK, UFA and cement was 150 MPa achieved by paste
MUF4. However, the 1-day compressive strength of paste MUF4 was 38 MPa which was
lower than 58 MPa which was the 1-day compressive strength of paste using binary blend
of SFU and cement at the same level of SCM/c (paste S3).
5.5.2.3 Drying shrinkage
The drying shrinkage of pastes investigated at the period of exposure of 25 days is
presented in Figure 5.39.

213
Figure 5.39 Drying shrinkage of pastes
As shown in Figure 5.39, for pastes containing ternary blend of MK, UFA and
cement, the drying shrinkage fell into the middle of drying shrinkage of pastes using
binary blend of either MK and cement or UFA and cement. The drying shrinkage
decreased with the increase in the MK content in the ternary blend. When SCM/c was
fixed, the drying shrinkage of pastes with SCM consisting of both MK and UFA was
lower than that of paste using SFU alone as SCM. For instance, when SCM/c was 0.2, the
drying shrinkage of paste MUF2 and MUF3 was 19% and 24% lower than that of paste
S2, respectively. The use of MK and UFA was a potential way of producing low
shrinkage UHPC.
5.5.2.4 Bound water content and volume of permeable voids
The bound water content and volume of permeable void of hardened paste are
conducted to explain the observed behavior of compressive strength and drying shrinkage
of paste using different types of SCM.

214
5.5.2.4.1 Bound water content
The 1-day and 28-day bound water content of pastes investigated are presented in
Figure 5.40.
(a) 1-day bound water content
(b) 28-day bound water content
Figure 5.40 Bound water content of pastes
As shown in Figure 5.40a, for pastes using binary blend of MK and cement, the 1-
day bound water content of pastes with SCM/c at 0.05, 0.1 and 0.2 was 17%, 35% and
215
37% higher than that of control (SCM/c=0.0), respectively. The increased bound water
content indicated the promoted early age hydration of cement in the presence of MK, and
explained the increasing 1-day compressive strength of pastes as the MK content
increased as well. For pastes using binary blend of UFA and cement, the bound water
content of pastes with SCM/c at 0.1, 0.2 and 0.3 was 14%, 24% and 65% lower than that
of control (SCM/c=0.0), respectively. This indicated the slowed early age hydration of
cement in the presence of FA, and also explained the decreasing 1-day compressive
strength of pastes as the FA content increased. The decrease in the bound water content
might be resulted from the low reactivity of UFA at early ages [81, 84, 151, 152]. For
pastes using SFU alone as SCM, the bound water content was not significantly affected
by the use of SFU. The bound water content of pastes with SCM/c at 0.1, 0.2, 0.3 and 0.4
was 6%, 19%, 20% and 18% higher than that of control, respectively. The 1-day bound
water content of pastes containing ternary blend of MK, UFA and cement fell into the
middle of pastes containing binary blend of either MK and cement or UFA and cement.
The general trend was that at the same SCM/c level the 1-day bound water content
increased with the increase in the MK content in the ternary blend. This was similar to
the phenomenon observed in the 1-day compressive strength test results.
As shown in Figure 5.40b, at the age of 28 day, the bound water content of pastes
increased with the increase in the SCM content. Pastes using ternary blend of MK, UFA
and cement and pastes using binary blend of SFU and cement did not present significant
different in the 28-day bound water content, at the same level of SCM/c.

216
5.5.2.4.2 Volume of permeable voids (Vp)
The volume of permeable voids of pastes investigated is presented in Figure 5.41.
Figure 5.41 Volume of permeable voids
As shown in Figure 5.41, for pastes with SFU alone as SCM, Vp decreased with
the increasing SFU content up to SCM/c=0.2, after which Vp increased with the
increasing SFU content. The lowest Vp of paste achieved by using SFU at content of
SCM/c=0.2 was 34% lower than that of control (SCM/c=0.0). For pastes with SCM
consisting of MK alone as SCM (see pastes with SCM/c equal to MK/c), Vp decreased
with the MK content. For instance Vp of pastes with SCM/c at 0.05, 0.1 and 0.2 was 4%,
19% and 41% lower than that of control, respectively. For pastes with SCM consisting of
UFA alone as SCM (see pastes with MK/c equal to 0.0), the use of UFA slightly
increased the Vp, compared with control. For instance Vp of pastes with SCM/c at 0.1, 0.2
and 0.3 was 2%, 5% and 5% higher than that of control, respectively. For pastes
containing both MK and UFA as SCM, when SCM/c was fixed, Vp decreased with the

217
increase in the MK content. For instance, when SCM/c was 0.30, Vp of pastes MUF4,
MUF5 and MUF6 (pastes arranged in an order of increasing MK content) was 10%, 27%
and 46% lower than that of paste UF3, respectively. It was also noted that Vp of pastes
containing both MK and UFA as SCM was higher than that of pastes containing SFU
alone as SCM at the same level of SCM/c.
The previous literature on the study of Vp of concrete was reported together with
the study of the drying shrinkage of concrete, which was helpful to understand the
behavior of SCM in affecting the Vp of paste. Studies on the relation between drying
shrinkage and water loss of concrete revealed that the MK could reduce drying shrinkage
of concrete which was attributed to the reduced rate of water loss due to densified pore
structure of concrete through pozzolanic reaction [164, 165]. Decrease in the drying
shrinkage as the SFU content increased was also observed, which was attributed to the
reduced water loss from densified micro structure of concrete and micro aggregates effect
of SFU particles [167]. The findings in these studies were in accordance with the findings
here that the use of SFU and MK could reduce the Vp of paste. However, the previous
literature on the effect of UFA on the Vp of concrete was limited. In this study, use of
UFA was observed to slightly increase the Vp of paste, which was likely due to the low
reactivity of UFA.
5.5.2.5 Discussion of compressive strength and drying shrinkage of paste
containing MK and UFA
It was noticed that the changes in 1-day compressive strength and the changes in
1-day bound water content of paste due to the changes in components of SCM seemed to

218
have similar pattern. To understand the behavior of compressive strength of pastes due to
the changes in the constituents of SCMs, the correlation between compressive strength
and bound water content of paste was studied and presented in Figure 5.42a. Besides that,
the correlation between drying shrinkage and volume of permeable voids of paste was
also studied and presented in Figure 5.42b.
(a) Bound water v.s. compressive strength
(b) Volume of permeable voids v.s. Drying shrinkage
Figure 5.42 Compressive strength and drying shrinkage of paste containing MK and
UFA

219
As showed in Figure 5.42a and 5.42b, at the age of 1 day, the compressive
strength of paste was strongly related with the cement hydration, since a good correlation
was found between 1-day compressive strength and bound water content. At the same
w/cm, SCMs with constituents that can promote the cement hydration increase the 1-day
compressive strength of pastes. At the age of 28 day, no good correlation between 28-day
compressive strength and the bound water content is found. It was considered that at
fixed w/cm as this study, the 28-day compressive strength of paste was affected more by
factors such as the packing of the component materials’ particles and the C-S-H gel
characteristic, rather than by the degree of cement hydration.
As showed in Figure 5.42b, the drying shrinkage of paste at the period of
exposure of 25 days had a good correlation with Vp. This could be understood that the
less permeable micro structure of paste reduced the moisture loss from the paste to the
external environment, which resulted in less drying shrinkage. Proportions of MK and
UFA in the paste that could reduce the volume of permeable voids decreased the drying
shrinkage of paste.
5.5.3 Paste using ternary blend of MK, FA and cement
5.5.3.1 Fresh state properties
The properties of pastes using ternary blend of MK, a regular particle size FA and
cement are studied in comparison with the properties of pastes using ternary blend of
MK, UFA and cement which was discussed above.
The time of conversion from dry mixture to fluid mixture is given in Table 5.10.

220
Table 5.10 Approximate time needed for the dry mixture to reach fluid state- Tc
(min)
Paste
ID Tc SCMb/ca Paste
ID Tc SCMb/ca
Paste
ID Tc SCMb/ca
Paste
ID Tc SCMb/ca
C 0.4 0.00 M1 2.5 0.05 F3 0.3 0.30 MF5 7.2 0.30
S1 0.9 0.10 M2 8.0 0.10 MF1 3 0.10 MF6 26.4 0.30
S2 2.9 0.20 M3 32.0 0.20 MF2 3.3 0.20 MF7 5.6 0.40
S3 3.8 0.30 F1 0.4 0.10 MF3 7.7 0.20 MF8 24.8 0.40
S4 5.0 0.40 F2 0.3 0.20 MF4 3.5 0.30 a cement; b supplementary cementing materials: silica fume alone or meta-kaolin + fly ash
As shown in Table 5.10, for pastes containing binary blend of FA and cement, the
increase in the FA content did not have significant effect on the Tc, which was noted that
as the SCM/c increased from 0 to 0.3, the Tc was slightly decreased from 0.4 min to 0.3
min. For pastes containing ternary blend of MK, FA and cement, when SCM/c was fixed,
the increase in the MK content increased the Tc, and the increase in the FA content
decreased the Tc. For instance, when SCM/c was 0.20, the Tc of pastes F2, MF2, MF3
and M3 (pastes arranged in an order of increasing MK content or decreasing FA content)
was 0.3, 3.3, 7.7 and 32 min, respectively. It was also noted that paste using MK-UFA
combination needed longer time than paste using MK-FA combination when MK was
high. For instance, the Tc of pastes MUF8 and MF8 was 31.3 min and 24.8 min,
respectively. This was likely due to the finer particles size of UFA than FA.
The workability of the pastes investigated is presented in Figure 5.43.
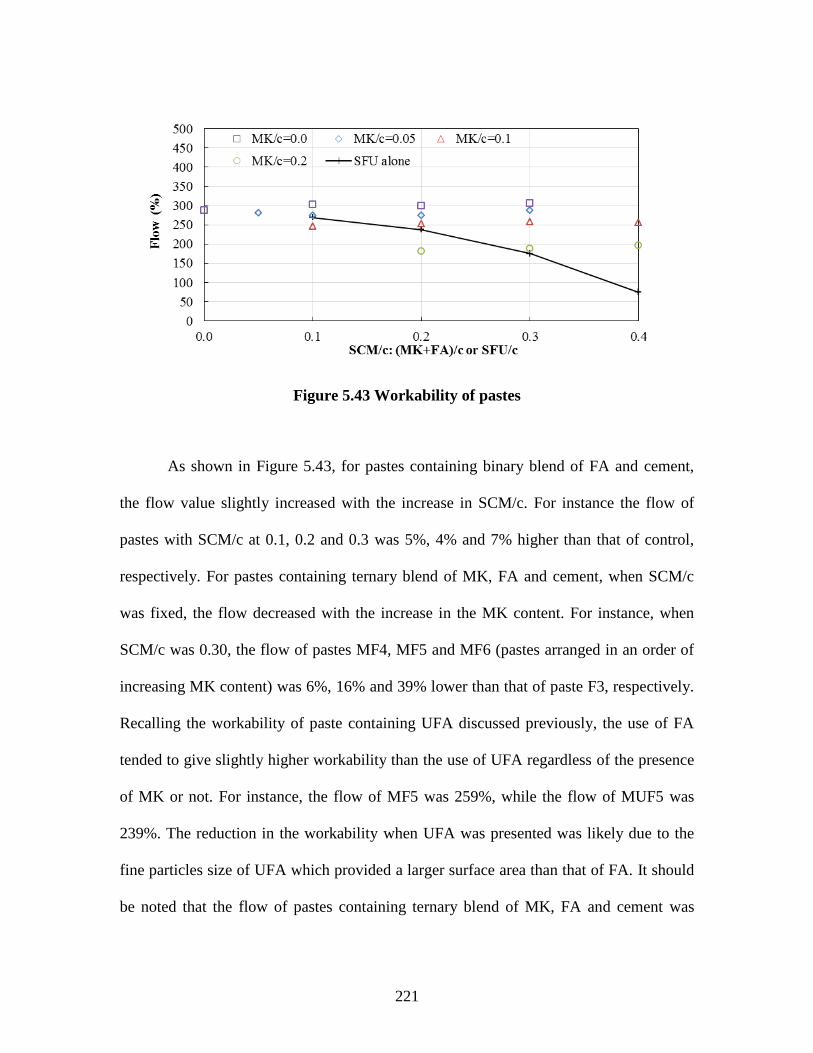
221
Figure 5.43 Workability of pastes
As shown in Figure 5.43, for pastes containing binary blend of FA and cement,
the flow value slightly increased with the increase in SCM/c. For instance the flow of
pastes with SCM/c at 0.1, 0.2 and 0.3 was 5%, 4% and 7% higher than that of control,
respectively. For pastes containing ternary blend of MK, FA and cement, when SCM/c
was fixed, the flow decreased with the increase in the MK content. For instance, when
SCM/c was 0.30, the flow of pastes MF4, MF5 and MF6 (pastes arranged in an order of
increasing MK content) was 6%, 16% and 39% lower than that of paste F3, respectively.
Recalling the workability of paste containing UFA discussed previously, the use of FA
tended to give slightly higher workability than the use of UFA regardless of the presence
of MK or not. For instance, the flow of MF5 was 259%, while the flow of MUF5 was
239%. The reduction in the workability when UFA was presented was likely due to the
fine particles size of UFA which provided a larger surface area than that of FA. It should
be noted that the flow of pastes containing ternary blend of MK, FA and cement was

222
higher than that of pastes containing SFU alone as SCM at the same level of SCM/c,
especially at high levels of SCM/c (i.e. when SCM/c =0.3 and SCM/c =0.4).
Based on the experimental results of the time of transformation from dry mixture
to fluid mixture and the workability of pastes containing different pozzolans, it was noted
that increase in FA content slightly increased the workability of the paste. The time of
conversion from dry mixture to fluid mixture was not significantly increased. The
combined use of MK and FA could conquer the decrease in the workability and the
increase in the mixing time of paste due to the use of MK. At the same level of SCM/c,
the combined use of MK and FA as SCM could produce paste with higher flow than use
SFU alone as SCM, especially at higher SCM/c levels. It was also noted that UFA and
FA behaved similarly in affecting the Tc and workability of paste, Except that paste using
UFA needed longer time than paste using FA when MK was high, and paste using UFA
presented slightly lower workability than paste using FA. The finer particles size of UFA
than FA was likely the underlying reason.
5.5.3.2 Compressive strength
The 1-day and 28-day compressive strength of pastes investigated are presented in
Figure 5.44.

223
(c) 1-day compressive strength
(d) 28-day compressive strength
Figure 5.44 Compressive strength of pastes
As shown in Figure 5.44a, for pastes using binary blend of FA and cement, the 1-
day compressive strength decreased with the increase in SCM/c. For instance the 1-day
compressive strength of pastes with SCM/c at 0.1, 0.2 and 0.3 was 27%, 65% and 91%
lower than that of control, respectively. The 1-day compressive strength of pastes
containing MK-FA combinations as SCM was significantly affected by the proportions of
MK and FA. The general trend was that at the same level of SCM/c the increasing MK

224
content resulted in increased 1-day compressive strength. For instance, when SCM/c was
0.2, the 1-day compressive strength of paste MF2, MF3 and M3 (ordered in increasing
MK content) was 104%, 133% and 295% higher than that of paste F2 which contained no
MK, respectively. The effect of FA on the 1-day compressive strength of paste was
similar to that of UFA. It was noted that at the same level of SCM/c some of the pastes
using MK-FA combinations seemed to have similar or higher 1-day compressive strength
than paste using SFU alone as SCM, especially at high SCM/c levels. The Student’s t test
was conducted later to make a statistically judgement on this phenomenon.
As shown in Figure 5.44b, the 28-day compressive strength of pastes containing
MK-FA combinations as SCM ranged from 116.8 MPa to 150.5MPa. If comparing the
compressive strength of pastes containing MK-FA combinations and pastes containing
SFU alone at the same SCM/c level, pastes containing MK-FA combinations seemed to
have similar compressive strength to pastes containing SFU alone at low SCM/c levels,
but higher compressive strength than pastes containing SFU alone at high SCM/c levels.
The effect of FA on the 28-day compressive strength of paste was similar to that of UFA.
However, the ternary blend of MK, UFA and cement tended to give slightly higher 28-
day compressive strength than the ternary blend of MK, FA and cement. For instance,
pastes MUF1, MUF2, MUF3, MUF4, MUF5, MUF6 and MUF8 all had higher 28-day
compressive strength than their corresponding counterparts MF1, MF2, MF3, MF4, MF5,
MF6 and MF8 that using ternary blend of MK, FA and cement. It was recognized that
fine particle size of FA improved the 28-day compressive strength of paste. Student’s t
test was conducted to reveal the difference between the 28-day compressive strength of

225
pastes containing MK-FA combinations as SCM and pastes containing SFU alone as
SCM in detail.
Similar to the student’s test conducted in the previous session discussing ternary
blend of MK, UFA and cement, a student’s test was conducted for pastes using ternary
blend of MK, FA and cement. The statements of problems and the assumptions for the
student’s test were the same. The results of Student’s t test are shown in Table 5.11.
Table 5.11 Comparison between compressive strength of pastes using ternary blend
of MK, FA and cement (CSMF) and the compressive strength of pastes using binary
blend of SFU and cement (CSSFU)
As shown in Table 5.11, at the age of 1 day and at the same level of SCM/c,
pastes using MK-FA combinations as SCM having similar compressive strength to pastes
using SFU alone as SCM included MF1, MF4, MF5, MF6, F3 and MF8, and pastes using
MK-FA combinations as SCM having higher compressive strength than pastes using SFU
alone as SCM included M2 and M3.
At the age of 28 day and at the same level of SCM/c, pastes using MK-FA
combinations as SCM having similar compressive strength to pastes using SFU alone as
SCM/c
CSMF < CSSFU
No significant difference
between
CSMF and CSSFU
CSMF > CSSFU
1-day 28-day 1-day 28-day 1-
day 28-day
0.1 F1 MF1 MF1 F1, M2 M2 -
0.2 F2, MF2,
MF3
M3, MF2,
MF3 - F2 M3 -
0.3 F3 - MF4. MF5,
MF6 F3 -
MF4. MF5,
MF6
0.4 MF7 - MF8 - - MF7, MF8

226
SCM included F1, F2 and M2, and pastes using MK-FA combinations as SCM having
higher compressive strength than pastes using SFU alone as SCM included MF4, MF5,
MF6, MF7 and MF8.
Pastes M2, MF4, MF5, MF6 and MF8 performed as well as or better than paste
using SFU alone as SCM at the corresponding same level of SCM/c, from a perspective
of both 1-day and 28-day compressive strength. Paste MF7 had higher compressive
strength which was 148 MPa than paste using SFU alone at the same level of SCM/c at
the age of 28 days. At the age of 1 day, the compressive strength of paste MF7 was lower
than paste using SFU alone at the same level of SCM/c.
5.5.3.3 Drying shrinkage
The drying shrinkage of pastes investigated at the period of exposure of 25 days is
presented in Figure 5.45.
Figure 5.45 Drying shrinkage of pastes

227
As shown in Figure 5.45, for pastes using binary blend of FA and cement, the
drying shrinkage increased with the increasing FA content up to SCM/c=0.2, after which
the drying shrinkage slightly decreased. For instance the drying shrinkage of pastes with
SCM/c at 0.1, 0.2 and 0.3 was 16%, 24% and 19% higher than that of control,
respectively. For pastes containing both MK and FA as SCM, the drying shrinkage was in
the middle of drying shrinkage of pastes using binary blend of either MK and cement or
FA and cement. Also the drying shrinkage decreased with the increase in the MK content.
When SCM/c was fixed, the drying shrinkage of pastes with SCM consisting of both MK
and FA was lower than that of paste using SFU alone as SCM. For instance, when SCM/c
was 0.2, the drying shrinkage of paste MF2 and MF3 was 19% and 24% lower than that
of paste S2, respectively. The effect of FA on the drying shrinkage of paste was similar to
that of UFA from the consideration that both of FA and UFA increased the drying
shrinkage of paste. However, the use of UFA caused more drying shrinkage of paste than
the use of FA. For instance, the 25-day drying shrinkage of paste MUF8 and MF8 was -
0.1103% and -0.1003%, respectively. This was likely due to the fine particle size of UFA
that densified the micro structure of paste better and cause more drying shrinkage than
that of FA.
5.5.3.4 Bound water content and volume of permeable voids
5.5.3.4.1 Bound water content
The 1-day and 28-day bound water content of pastes investigated are presented in
Figure 5.46.

228
(a) 1-day bound water content
(b) 28-day bound water content
Figure 5.46 Bound water content of pastes
As shown in Figure 5.46a, for pastes using binary blend of FA and cement, the
bound water content of pastes with SCM/c at 0.1, 0.2 and 0.3 was 6%, 24% and 40%
lower than that of control (SCM/c=0.0), respectively. This indicated the slowed early age
hydration of cement in the presence of FA, and also explained the decreasing 1-day
compressive strength of pastes as the FA content increases. The decrease in the bound
water content might be resulted from the low reactivity of FA at early ages [81, 84, 151,

229
152]. The 1-day bound water content of pastes containing MK-FA combinations as SCM
was significantly affected by the proportions of MK and FA. The general trend was that
at the same SCM/c level the increasing MK content resulted in increased 1-day bound
water content. This was also similar to the phenomenon observed in the 1-day
compressive strength test results.
As shown in Figure 5.46b, at the age of 28 day, the bound water content of pastes
increased with the increase in the SCM content. At the same level of SCM/c, the 28-day
bound water content of pastes with SCM consisting of MK-FA combination seemed to be
higher than that of pastes with SCM consisting of SFU alone at all levels of SCM/c. The
use of MK-FA combinations promoted the total cement hydration in the paste or
presented more total pozzolanic reactivity than the use of SFU alone at the age of 28
days. The effect of FA on the bound water content of paste was similar to UFA.
5.5.3.4.2 Volume of permeable voids (Vp)
The volume of permeable voids of pastes investigated is presented in Figure 5.47.
Figure 5.47 Volume of permeable voids

230
As shown in Figure 5.47, for pastes using binary blend of FA and cement, the use
of FA slightly increased the Vp, compared with control. For instance Vp of pastes with
SCM/c at 0.1, 0.2 and 0.3 was 4%, 10% and 7% higher than that of control, respectively.
For pastes containing both MK and FA as SCM, when SCM/c was fixed, Vp decreased
with the increase in the MK content. For instance, when SCM/c was 0.30, Vp of pastes
MF4, MF5 and MF6 (pastes arranged in an order of increasing MK content) was 9%,
21% and 45% lower than that of paste F3, respectively. It was also noted that Vp of pastes
containing both MK and FA as SCM was higher than that of pastes containing SFU alone
as SCM at the same level of SCM/c. It was worthy it to notice that, under the same
mixture proportions, paste using FA presented higher Vp than paste using UFA.
5.5.3.5 Discussion of compressive strength and drying shrinkage of paste
containing MK and FA
To understand the behavior of compressive strength and drying shrinkage of pastes
subjected to the changes in the proportions of MK and FA, regression analysis was
conducted to review the correlation between compressive strength and bound water
content of paste (Figure 5.48a), and the correlation between drying shrinkage and Vp of
paste (Figure 5.48b).
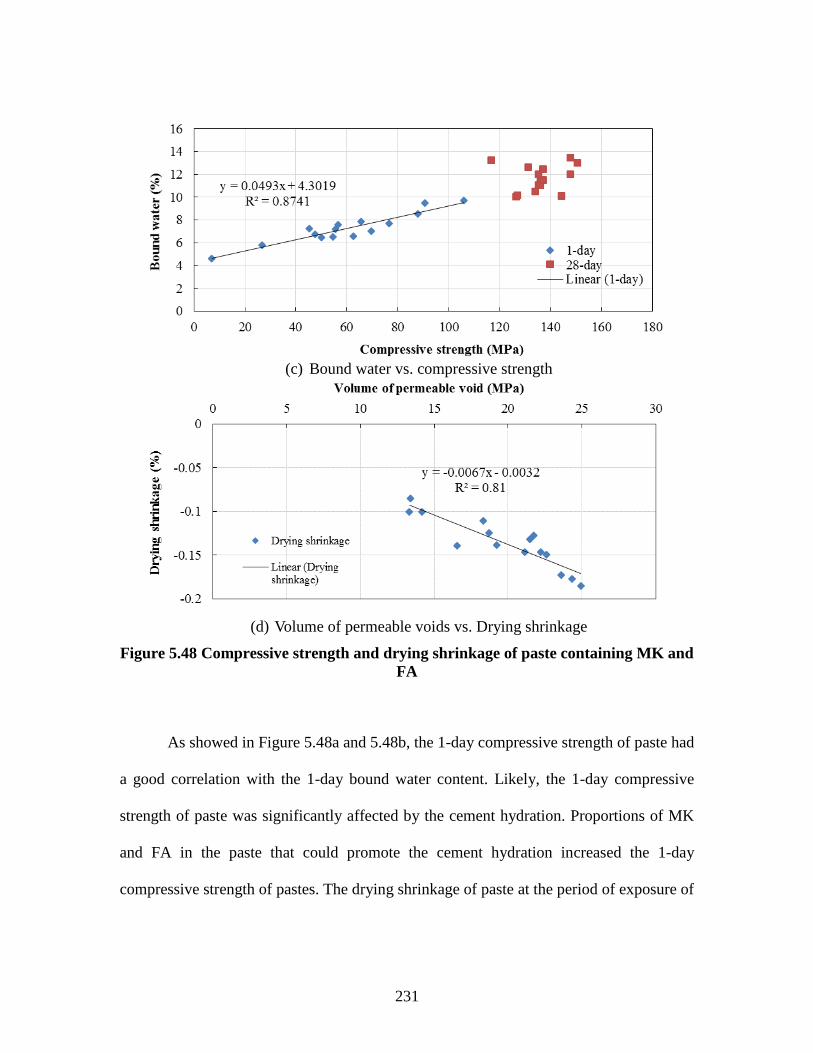
231
(c) Bound water vs. compressive strength
(d) Volume of permeable voids vs. Drying shrinkage
Figure 5.48 Compressive strength and drying shrinkage of paste containing MK and
FA
As showed in Figure 5.48a and 5.48b, the 1-day compressive strength of paste had
a good correlation with the 1-day bound water content. Likely, the 1-day compressive
strength of paste was significantly affected by the cement hydration. Proportions of MK
and FA in the paste that could promote the cement hydration increased the 1-day
compressive strength of pastes. The drying shrinkage of paste at the period of exposure of

232
25 days had a good correlation with Vp. This could be understood that the less permeable
micro structure of paste reduced the moisture loss from the paste to the external
environment, which resulted in less drying shrinkage. Proportions of MK and FA in the
paste that can reduce the volume of permeable voids decreased the drying shrinkage of
paste. However, the 28-day compressive strength of paste did not have significant
correlation with either the 28-day bound water content or the Vp. The reasons underlying
the 28-day compressive strength of paste need more research effort.
5.5.4 Discussion of developing UHPC with MK and UFA/FA
It should be noted that among all the paste mixtures using SFU, MK, UFA and
FA, paste S2 which had SCM/c of 0.2 exhibited the highest 28-day compressive strength
of 152 MPa. From the perspective of achieving superior 28-day compressive strength,
SFU is still the best choice of SCM among MK, UFA and FA. Paste S2 also had good
workability and 1-day compressive strength. However, paste S2 had 28-day drying
shrinkage of 1820 microns, which was higher than most of the paste mixtures
investigated in this study.
Based on the properties which include workability, compressive strength and
drying shrinkage of paste, the use of ternary blend of MK, FA/UFA and cement can
produce paste with some of the properties as good as or even better than paste using
binary blend of SFU and cement. The benefit of using ternary blend of MK, FA/UFA and
cement over binary blend of SFU and cement on the compressive strength is not
significant. However, the use of ternary blend of MK, FA/UFA and cement can produce
paste with significantly better workability and lower drying shrinkage than that of paste

233
using binary blend of SFU and cement. It is noted that the use of ternary blend of MK,
FA/UFA and cement is a potential method of reducing the drying shrinkage which is a
problem of paste using binary blend of SFU and cement.
The other advantages of using MK and FA/UFA in the paste also include
economic and environmental benefit. SFU was a cheap SCM when it was considered a
waste material from the silicon industry. Nowadays, the price of SFU is about 4 time that
of cement. The use of MK and FA/UFA not only reduces the cost of paste, but also
provides more options of SCM for UHPC rather than SFU.
It is noted that the UFA and FA generally behave similarly in influencing the
mixing time, workability, 1-day compressive strength and drying shrinkage of paste. The
main difference is that the use of UFA requires more mixing time to prepare fresh
mixture than the use of FA, and the use of UFA exhibits higher 28-day compressive
strength of paste than the use of FA. This is probably attributed to the fine particle size of
UFA which provide more surface area during mixing and better packed micro structure
of hardened paste than FA.
As discussed above, the 28-day compressive strength of paste using ternary blend
of MK, UFA and cement ranged from 118.1MPa to 150.1MPa, and the28-day
compressive strength of paste using ternary blend of MK, FA and cement ranged from
116.8 MPa to 150.5MPa. This range of compressive strength of paste falls into the typical
range of non-fiber reinforced phase of UHPC in many literature [9, 168-170]. It is
anticipated that, by using quality aggregate and reinforcing fibers at proper contents,
UHPC using MK-UFA combinations as SCM can be produced with good workability,
234
high early and later age compressive strength and low drying shrinkage. In the later part
of this study of developing UHPC mixtures, the use of MK-UFA combinations in
producing UHPC is explored. However, as discussed in the time of conversion from dry
mixture to fluid mixture, when MK content is high the prolonged mixing time is an issue
which needs more research effort.
5.5.5 Prediction of properties of paste using MK, UFA and SFU
5.5.5.1 Regression analysis of properties of paste containing MK, UFA and SFU
Regression analysis is conducted with software JMP® 11 to developed equations
to predict the workability, 1-day and 28-day compressive strength and drying shrinkage
at periods of exposure of 25 days of pastes.
As discussed above, the use of ternary blend of MK, UFA and cement produced
paste with higher 28-day compressive strength than the use of ternary blend of MK, FA
and cement. The pastes using the use of ternary blend of MK, UFA and cement are used
for regression analysis. For pastes containing MK-UFA combinations as SCM, the
regression equations are developed simply based on the MK content and UFA content in
the paste. MK content is expressed as “a” which is the mass ratio of MK to portland
cement. UFA content is expressed as “b” which is the mass ratio of UFA to portland
cement. The model terms included in the least squares analysis are a, a2, a3, b, b2, b3 and
a×b. The t test is carried out for the hypothesis that the estimated coefficient of each of
the model terms equals zero. Only the model terms with p-value of t test less than 0.05
are considered having significant effect in the regression model. The final regression

235
equations for predicting the drying shrinkage of paste only include the statistically
significant model terms.
For pastes containing SFU alone as SCM, the regression equations are developed
simply based on the SFU content in the paste. SFU content is expressed as “c” which is
the mass ratio of SFU to portland cement. The model terms included in the least squares
analysis are c, c2 and c3. The t test is carried out for the hypothesis that the estimated
coefficient of each of the model terms equals zero. Only the model terms with p-value of
t test less than 0.05 are considered statistically significant and included in the final
regression equations for predicting the drying shrinkage of paste.
The regression equations for predicting the drying shrinkage of paste using MK-
FA combinations as SCM and paste using SFU alone as SCM are shown in Table 5.12.
Table 5.12 Prediction of properties of pastes
Properties SCM Regression equations R2
adjusted
Workability (%) MK-UFA
WMF=296.7-511.6a-37.2b+584.4×(a-0.08)×(b-
0.13) 0.97
SFU WS=340.3-519.8c-1376.8×(c-0.2)2 0.99
1-day compressive
strength (MPa)
MK-UFA CS1MF=77.1+114.4a-217.6b 0.89
SFU CS1S=77.3-55.5c 0.80
28-day compressive
strength (MPa)
MK-UFA CS28MF=144.9-677.8×(b-0.13)2 0.44
SFU CS28S=167.2-118.2c-847.4×(c-0.2)2 0.89
25-day drying
shrinkage (%)
MK-UFA dMF25=-0.1736+0.3009a+0.9033×(b-0.13)2-
6.5584×(b-0.13)3 0.96
SFU dS25=-0.183+0.74×(c-0.2)2 0.76
Note: a=MK/cement by mass; b=UFA/cement by mass; c=SFU/cement by mass
5.5.5.2 Optimization of MK and UFA content in the paste
The optimization of MK and UFA content in the cementitious paste is based on
the responses of pastes’ properties including workability, 1-day and 28-day compressive

236
strength, 25-day drying shrinkage and SCM content. The multi-goal optimization is
conducted with desirability function developed by Derringer [171]. The desirability
function is given in equation (5.5):
D = (d1r1× d2
r2× d3r3×… ×dn
rn)1/(Σri) (5.5)
where n is the number of responses in the optimization; ri is the relative
importance of each individual functions di, which .varies depending on the importance of
the response in the optimization; di is the individual desirability function of a response,
which ranges from 0 (undesired response) to 1 (fully desired response).
The individual response function is:
0 X≤L
d(X) [(X-L)/(U-L)]w L<X<U
1 X≥U
where X is the value of a response; L is the lower limit for the response; U is the
upper limit for the response; and w is the weight for a response. The value of w is ranged
from 0.1 to 10. When w is higher than 1, the individual response function places more
emphasis to the desired response. When w is lower than 1, the individual response
function places less emphasis to the desired response. When w is equal to 1, the
individual response function places no emphasis to the desired response (linear function).
Thus, the individual desirability function can convert the value of a response into a value
between 0 and 1. The final value of D is a value between 0 and 1.
In this study, the five responses: workability, 1-day and 28-day compressive
strength, 25-day drying shrinkage and SCM content are considered equally important.
High workability, 1-day and 28-day compressive strength and SCM content are
preferable. Low 25-day drying shrinkage is consider preferable. The predictions

237
equations developed above are used to calculate the material properties of paste. The
SCM content is simply the sum of MK and FA content. The desirability is calculated by
JMP® 11, and shown in Figure 5.49.
Figure 5.49 Optimization of MK and UFA in paste by JMP® 11
UFA (%)

238
As shown in Figure 5.49, the highest desirability can be achieved is 0.562 when
the MK/c=0.136 and UFA/c=0.116. This is the optimal MK and UFA content. The
predicted responses at optimal MK and UFA content can be found in Figure 5.49.
5.5.5.3 Validation of the prediction of the properties of paste
The paste with optimal MK and UFA content was prepared to verify the
prediction equations. The results are shown in Table 5.13.
Table 5.13 Predicted properties of optimal paste
Experimental values (Ev) Predicted values (Pv) (Pv-Ev)/Ev
Flow (%) 231 222 -0.04
1-day compressive
strength (MPa) 64 68 0.06
28-day compressive
strength (MPa) 139 145 0.04
25-day drying
shrinkage (%) -0.107 -0.132 0.23
As shown in Table 5.13, the predicted flow, 1-day compressive strength and 28-
day compressive strength was 4% lower, 6% higher and 4% higher than the experimental
results, respectively. This indicated that the prediction equation could well predict the
workability and compressive strength. However, the predicted 25-day drying shrinkage
was 23% higher than the experimental result. This error was bigger than the error in
predicting workability and compressive strength, but still acceptable.

239
5.5.6 Summary of the effect of SCM on the properties of paste
For paste using binary blend of SFU and cement, the increase in the SFU content
reduced the workability of paste, and increased the mixing time. The autogenous
shrinkage of paste could be increased due to the use of SFU. The use of SFU did not have
significant effect on the setting time of paste. The highest 28-day compressive strength of
152 MPa was achieved by using SFU at a content of SCM/c=20%. The drying shrinkage
of paste increased with the increase in the SFU content up to SCM/c=10%, after which
the drying shrinkage decreased with the increase in the SFU content.
For paste using binary blend of UFA or FA and cement, the increase in the FA
content did not show significant effect on the workability or mixing time of paste. The
increase in the UFA content prolonged the setting time of paste, and increased the
autogenous shrinkage. Both UFA and FA resulted in significant effect in reducing the 1-
day compressive strength of paste. Moreover, the drying shrinkage of paste could be
increased in presence of UFA or FA.
The use of binary blend of MK and cement resulted in prolonged mixing time,
decreased workability, improved 1-day compressive strength and reduced drying
shrinkage and increased autogenous shrinkage of paste. The increase in the MK content
reduced the setting time of paste. The 28-day compressive strength paste was not
significantly affected by the MK content. The combined use of MK and UFA/FA in paste
(ternary blend of MK, UFA/FA and cement) could compensate the reduction in the 1-day
compressive strength and increase in the drying shrinkage due to the use of UFA/FA, and

240
compensate the reduction in the workability and increase in mixing time due to the use of
MK.
Paste with combined use of MK and UFA/FA at proper proportions could be
produced with higher workability, higher 28-day compressive strength and lower drying
shrinkage than paste using SFU alone as SCM, at the same level of SCM/c.
The 1-day compressive strength of pastes using ternary blend of MK, UFA/FA
and cement was significantly related to the 1-day cement hydration. Proportions of MK
and UFA/FA that could promote the 1-day cement hydration increased the 1-day
compressive strength of pastes. 28-day compressive strength of pastes using ternary blend
of MK, UFA/FA and cement was not significantly related to the 28-day bound water
content. The drying shrinkage of pastes using ternary blend of MK, UFA/FA and cement
was significantly related to the volume of permeable voids of paste. Proportions of MK
and UFA/FA that could reduce the volume of permeable voids resulted in decreased
drying shrinkage.
The workability, 1-day compressive strength, 28-day compressive strength and
25-day drying shrinkage of paste containing MK and UFA could be predicted and
optimized based on the MK content and UFA content following a multi-goal optimization
process (desirability function).
Selected paste formulations were used to develop UHPC in the later part of this
study.

241
5.6 Combined Effect of Sand and Fiber on the Properties of UHPC
This section includes the investigations on the combined effect of sand content
and SMF content on the workability, compressive strength, first-crack flexural, post-
crack flexural strength, drying shrinkage, RCP and bulk electric resistance of mortar. A
minimum sand content to prevent severe segregation of SMF is determined. Prediction
models of the material properties of SMF reinforced mortar are developed based on the
volumetric sand content and SMF content.
5.6.1 Material properties
5.6.1.1 Workability of mortar
The workability of mortars is shown in Figure 5.50. It is noted that, during
mixing, mortar M11, M21 and M31 exhibited severe segregation of SMF. Thus, their
flow values are not presented here.
Figure 5.50 Workability of SMF reinforced mortar (%)

242
As shown in Figure 5.50, the flow of mortar decreased with the increase in the
sand content at fixed SMF content. For instance, at VSMF/VT=0, the flow of mortar M01,
M02 and M03 was 7%, 25% and 43% lower than that of the control mortar M00,
respectively. This was attributed to the large surface area of the sand particles which
reduced the amount of paste lubricating the sand particles [172, 173]. The flow of mortar
also decreased with the increase in the SMF content at fixed sand content. For instance, at
s/cm=1.25, the flow of mortar M12, M22 and M32 was 11%, 18% and 44% lower than
that of mortar M02, respectively. Likely, the internal resistance and friction resulted from
the interaction of fibers were the reasons of decreased workability as the SMF content
increases [174]. Among all the mortar mixtures presented in Figure 5.50, the lowest flow
of mortar which could be consolidated under self-weight was 122% (mortar M32), and
highest flow of mortar which needed external vibration for consolidation was 75%
(mortar M23). Thus, the threshold flow of fiber reinforced mortar was anticipated to be
between 122% and 75%.
5.6.1.2 Compressive strength of mortar
The 1-day and 28-day compressive strength of mortars is shown in Figure 5.51.
Mortars M11, M21 and M31 exhibited severe segregation of SMF during mixing. Thus,
their compressive strength is not presented. Mortar M23 and M33 were consolidated with
external vibration for 30s, as their workability was not good. The rest of the portland
cement mortars were consolidated under the self-weight.

243
a. 1-day compressive strength (MPa) b. 28-day compressive strength
(MPa)
Figure 5.51 Compressive strength of SMF reinforced mortar
As shown in Figure 5.51a, the 1-day compressive strength of mortar was not
significantly affected by the sand content and SMF content. The 1-day compressive
strength of mortar ranged from 68 to 86 MPa. However, as shown in Figure 5.51b, the
28-day compressive strength of mortar slightly decreased with the increase in the sand
content at fixed SMF content, except when VSMF/VT is 0.03. For instance, at VSMF/VT=0,
the 28-day compressive strength of mortar M01, M02 and M03 was 5%, 8% and 10%
lower than that of the control mortar M00, respectively. This can be attributed to the
increased amount of weak zones and interfacial transaction zone in the mortar as the sand
increased [175]. The 28-day compressive strength of mortar slightly increased with the
increase in the SMF content at fixed sand content. For instance, at s/cm=1.25, the 28-day
compressive strength of mortar M12, M22 and M32 was 0.1%, 5% and 10% higher than
that of the control mortar M02, respectively. SMF content at 1% did not have noticeable

244
impact on the 28-day compressive strength. The restrained crack propagation in the
hardened mortar due to the use of SMF contributed to the increased compressive strength
[12]. It should be noticed that the use of sand or SMF presented relatively limited impact
on the compressive strength of mortar, compared with their significant impact on the
workability of mortar.
5.6.1.3 Flexural strength of mortar
The loading-stroke curves of four specimens containing different SMF contents at
fixed sand content (s/cm=1.25) recorded by the Universal Testing Machine during the
test are presented in Figure 5.52. The vertical axis in Figure 5.52 is the loading which
was measured by the load sensor installed on the loading head of the UTM. The
horizontal axis in Figure 5.52 is the stroke which was the displacement of the load head
of the UTM. It should be noted that such loading-stroke curve does not give information
of the stress-strain relation or loading-deflection relation of the specimen during flexural
test.

245
Figure 5.52 Loading-stroke relation of specimen under flexure moment (UTM)
As shown in Figure 5.52, the flexural behavior of SMF reinforced mortar
specimen under flection consisted of three stages: first, the load increased with the stoke
until a sudden decrease in the load happened; second, the load regained after the sudden
decrease in the load, and the load increased with the stoke until the ultimate peak load;
third, after the ultimate peak load was achieved, the load decreased with the stoke. For
mortar without SMF, the flexural behavior of specimen under flection only consisted of
one stage which was that the load increased with the stoke until ultimate peak load was
reached.
The sudden decrease in the first stage of SMF reinforced mortar specimen was the
first-crack load of the specimen which was marked by an arrow (see Figure 5.52), the
ultimate load was the post-crack ultimate load of the specimen. For mortar without SMF,
the crack load and the ultimate peak load was the same. The ultimate peak load of mortar

246
without SMF was also marked in Figure 5.52. It was observed that the first-crack load of
the specimens containing SMF from 0% to 3% was not significantly different, although
the post-crack ultimate load of the specimens containing SMF from 0% to 3% was
significantly different. Specifically for the case in Figure 5.52, For instance the ultimate
flexural strength of mortars with SMF content at 1%, 2% and 3% was 41%, 113% and
139% higher than that of mortar without SMF, respectively. Likely this was because that
the function of SMF which was restraining the propagation of crack was only effective
after the crack occurs. Another point should be noted was that as the SMF content
increased, the sudden decrease in the load when the crack load was achieved was getting
less significant. Likely as the SMF content increases more fibers were available to retrain
the load drops.
The average flexural strength at crack load and post-crack ultimate load of three
specimens of each mortar mixture containing different sand content and SMF content is
shown in Figure 5.53.
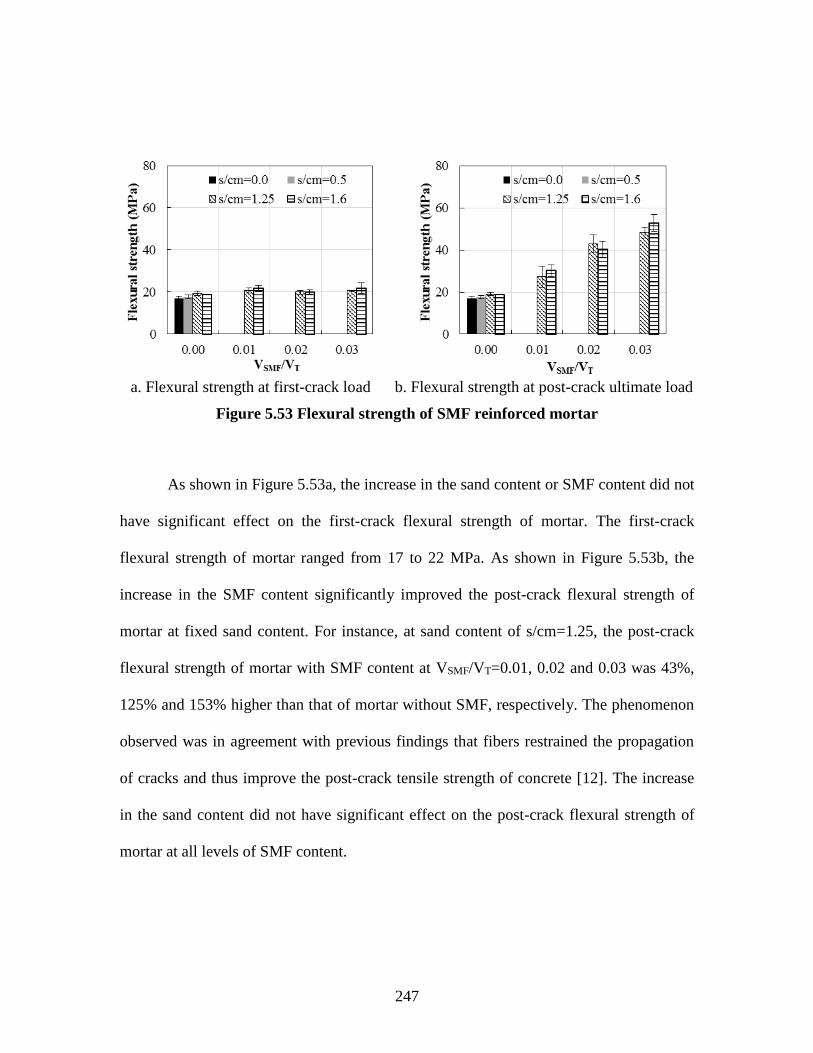
247
a. Flexural strength at first-crack load b. Flexural strength at post-crack ultimate load
Figure 5.53 Flexural strength of SMF reinforced mortar
As shown in Figure 5.53a, the increase in the sand content or SMF content did not
have significant effect on the first-crack flexural strength of mortar. The first-crack
flexural strength of mortar ranged from 17 to 22 MPa. As shown in Figure 5.53b, the
increase in the SMF content significantly improved the post-crack flexural strength of
mortar at fixed sand content. For instance, at sand content of s/cm=1.25, the post-crack
flexural strength of mortar with SMF content at VSMF/VT=0.01, 0.02 and 0.03 was 43%,
125% and 153% higher than that of mortar without SMF, respectively. The phenomenon
observed was in agreement with previous findings that fibers restrained the propagation
of cracks and thus improve the post-crack tensile strength of concrete [12]. The increase
in the sand content did not have significant effect on the post-crack flexural strength of
mortar at all levels of SMF content.

248
5.6.1.4 Drying shrinkage of mortar
The 25-day drying shrinkage of mortars is shown in Figure 5.54. Mortars M11,
M21 and M31 exhibited severe segregation of SMF during mixing. Thus, their
compressive strength is not presented.
Figure 5.54 25-day drying shrinkage
(%)
As shown in Figure 5.54, the increase in the sand content resulted in decrease in
the drying shrinkage of mortar at the periods of exposure at 25 days when the SMF
content was fixed. For instance, when the periods of exposure was 25 days and VSMF/VT
is 0.0, the drying shrinkage of mortars M01, M02 and M03 was 33%, 58% and 65%
lower than that of mortar M00, respectively. This was attributed to the reduced volume of
cementitious paste and the restrained shrinkage of cementitious paste in presence of sand
[176]. The increase in the SMF content also resulted in decrease in the drying shrinkage
of mortar at the periods of exposure at 25 days when the sand content was fixed. For
249
instance, when the periods of exposure was 25 days and s/cm was 1.25, the drying
shrinkage of mortars M12, M22 and M32 was 3%, 22% and 29% lower than that of
mortar M02, respectively. Similarly to the use of sand, the use of SMF could also reduce
the volume of cementitious paste. Another possible reason was that SMF can restrain the
shrinkage of cementitious paste.
5.6.1.5 Electrical resistivity and rapid chloride penetration of mortar
Severe segregation of SMF was observed during mixing the fresh SMF reinforce
mortar. To identify segregation of SMF that was not obvious enough to be observed,
electrical resistivity of hardened mortar was measured. It had been known that the
incorporation of reinforcing fibers would affect the RCP of hardened concrete. When
conductive fiber was used, say SMF in this study, the RCP was anticipated to have
correlation with the electrical resistivity of the hardened concrete. Thus, RCP was
conducted on the same specimens after the electrical resistivity test. The electrical
resistivity and RCP results are shown in Table 5.14.

250
Table 5.14 Electrical resistivity and rapid chloride penetration of mortar containing
SMF
Mortar ID Resistivity (ohm×m) Charge passed (Coulomb)
T M B T M B
M00 128.0 132.2 125.7 1973 1708 2362
M01 178.2 186.1 187.3 1263 1342 1544
M02 239.3 243.1 247.4 917 1021 1033
M03 262.6 272.7 280.0 914 859 873
M11 165.4 160.8 42.7 1559 1673 4940
M12 43.3 29.5 41.6 3705 4598 3383
M13 74.8 94.0 97.6 2291 1603 1658
M22 28.5 42.4 45.0 8032 4485 4351
M23 57.1 75.7 62.5 3171 2530 2403
M32 34.6 38.8 39.3 7067 5060 5496
M33 35.5 42.9 48.6 7341 5005 4257
As shown in Table 5.14, the increase in the sand content resulted in an increase in
the electrical resistivity. A calculation of electrical resistivity of four top specimens of
mortar M00, M01, M02 and M03 revealed that as the s/cm increased from 0 to 1.6, the
electrical resistivity was continuously increased by 105%. For non-fiber reinforced
mortar, the main contributor to the conductivity was the pore solution which is rich in
ions. The volume of paste decreased with an increase in the sand content, and therefore
reduction in the volume of pore solution. This was likely the main reason of the increased
electrical resistivity as the sand content increased. However, the increase in the SMF
content to 1% reduced the resistivity of mortar significantly due to the incorporation of
conductive fibers in the mortar. When the SMF content was higher than 1%, the
resistivity of mortar was not affected significantly considering the error of the test
method.

251
The philosophy of identifying segregation was that the electrical resistivity for
specimen from the bottom of the parent cylinder was significantly higher than that of
specimen from the top or middle of the parent cylinder. However, due to the system error
of the test method, such philosophy might not be valid to find out mixture with slight
segregation. As shown in Table 5.14, M11 was identified as mortar having severe
segregation of SMF because the electrical resistivity of the bottom segment was only 42.7
ohm/m and the electrical resistivity of the top or middle segment was around 160 ohm/m.
Such significant decrease in the electrical resistivity for segment at the bottom of the
cylinder was due to the possible phenomenon that SMF may have sunk to the bottom of
the cylinder during casting. Some other mortar mixtures, such as mortar M32 and M33,
exhibited increasing electrical resistivity from top to bottom, likely caused by more sand
at the bottom part of the cylinder. However, the sink of SMF also caused decrease in the
electrical resistivity. These two possible factors might both contribute to the observed
behavior of electrical resistivity of SMF reinforced mortar. Considering the system error
of the test method of electrical resistivity, this statement could not be evidently
supported.
As shown in Table 5.14, when comparing the results of specimens from the same
location of the cylinder, for instance top segments from mortars M00, M01, M02 and
M03, it was observed that the increase in the sand content resulted in a decrease in the
charge passed. This was attributed to the fact that sand particles were less permeable than
cement paste. Also, this is the phenomenon that was observed in previous part of this
chapter (see session 5.4).
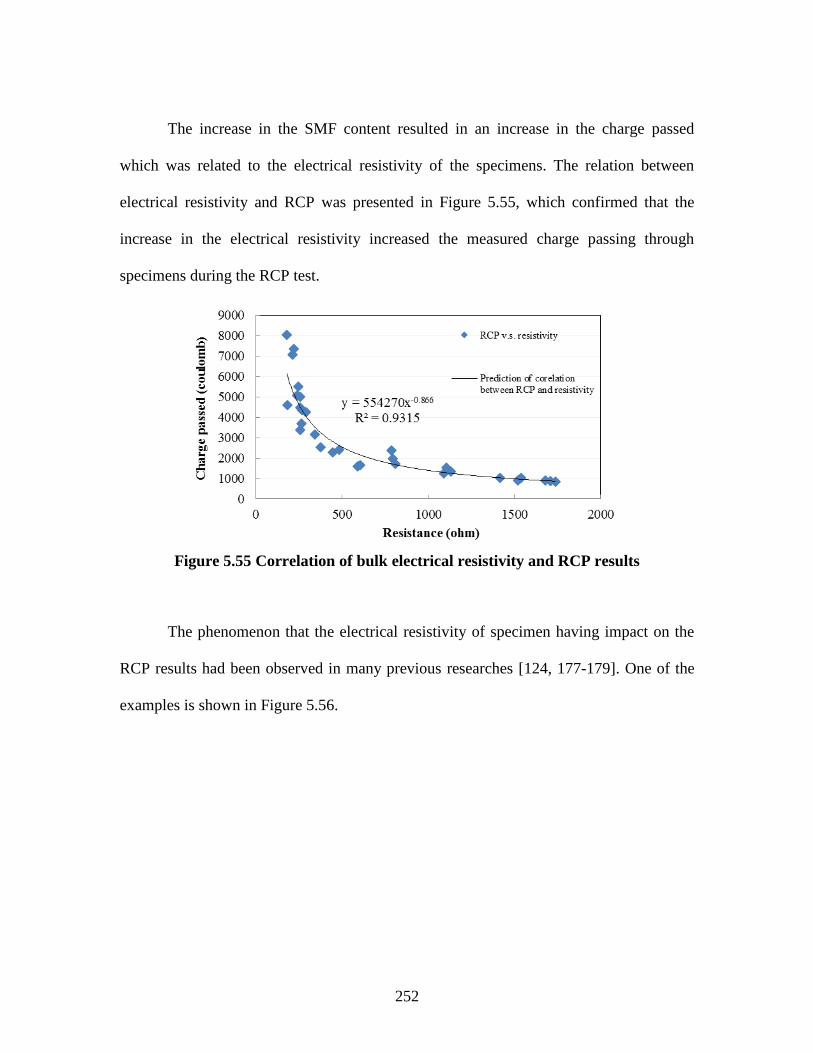
252
The increase in the SMF content resulted in an increase in the charge passed
which was related to the electrical resistivity of the specimens. The relation between
electrical resistivity and RCP was presented in Figure 5.55, which confirmed that the
increase in the electrical resistivity increased the measured charge passing through
specimens during the RCP test.
Figure 5.55 Correlation of bulk electrical resistivity and RCP results
The phenomenon that the electrical resistivity of specimen having impact on the
RCP results had been observed in many previous researches [124, 177-179]. One of the
examples is shown in Figure 5.56.

253
Figure 5.56 Correlation of electrical resistivity and RCP results [179]
The correlation between electrical resistivity and RCP value was one of the major
points on which many researchers and scientists cast criticism on the validity of using
ASTM C1202 to evaluate the chloride permeability of concrete [124, 177, 178]. One of
the assumptions to explain the increase in the measured RCP as the electrical resistivity
of the specimen decreased was derived from the Joule effect [124, 180]. The assumption
was that when electrical passed through the concrete specimen, the temperature of the
specimen increased due to the Joule effect. Such increase in the temperature increased the
mobility of ions presenting in the pore solution [124]. Thus, within 6 hours which was the
duration of ASTM C1202 method, specimens with more mobile ions gave more charge
passed through the specimens.
Specifically to the SMF reinforced mortar investigated in this study, the function
of SMF in the mortar was considered as follows: First, the incorporation of SMF reduced
the volume of paste which was more permeable for chloride in the mortar, and resulted in
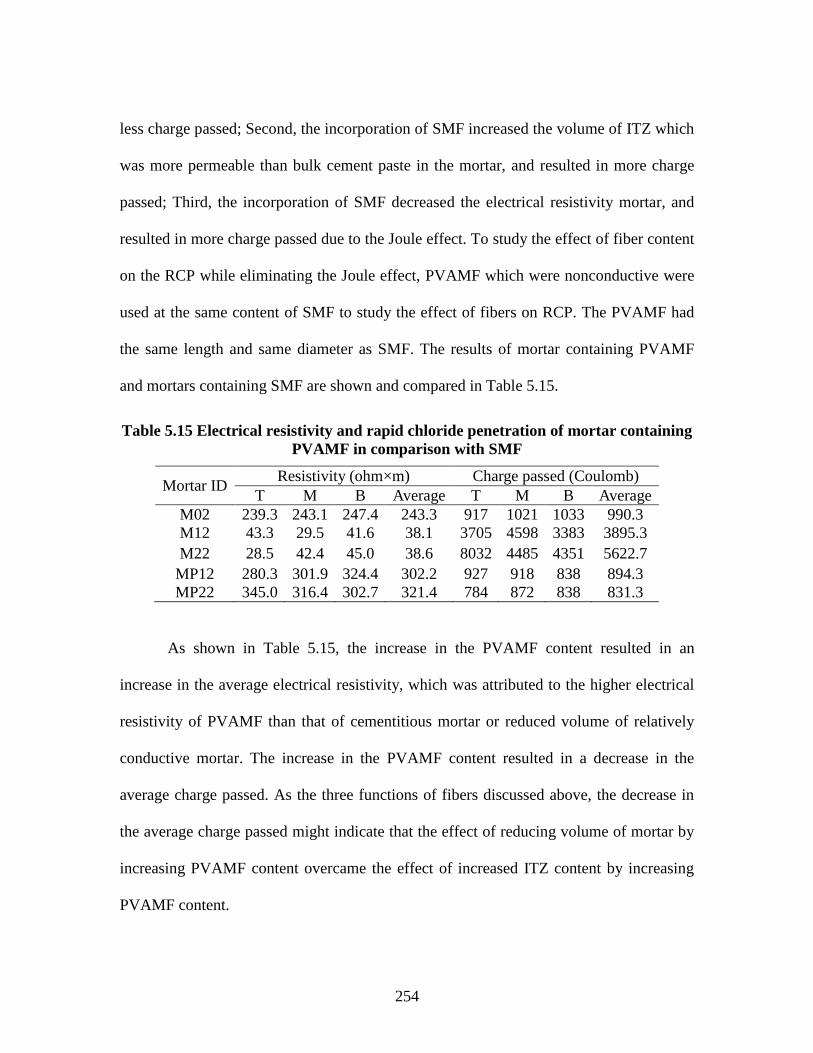
254
less charge passed; Second, the incorporation of SMF increased the volume of ITZ which
was more permeable than bulk cement paste in the mortar, and resulted in more charge
passed; Third, the incorporation of SMF decreased the electrical resistivity mortar, and
resulted in more charge passed due to the Joule effect. To study the effect of fiber content
on the RCP while eliminating the Joule effect, PVAMF which were nonconductive were
used at the same content of SMF to study the effect of fibers on RCP. The PVAMF had
the same length and same diameter as SMF. The results of mortar containing PVAMF
and mortars containing SMF are shown and compared in Table 5.15.
Table 5.15 Electrical resistivity and rapid chloride penetration of mortar containing
PVAMF in comparison with SMF
Mortar ID Resistivity (ohm×m) Charge passed (Coulomb)
T M B Average T M B Average
M02 239.3 243.1 247.4 243.3 917 1021 1033 990.3
M12 43.3 29.5 41.6 38.1 3705 4598 3383 3895.3
M22 28.5 42.4 45.0 38.6 8032 4485 4351 5622.7
MP12 280.3 301.9 324.4 302.2 927 918 838 894.3
MP22 345.0 316.4 302.7 321.4 784 872 838 831.3
As shown in Table 5.15, the increase in the PVAMF content resulted in an
increase in the average electrical resistivity, which was attributed to the higher electrical
resistivity of PVAMF than that of cementitious mortar or reduced volume of relatively
conductive mortar. The increase in the PVAMF content resulted in a decrease in the
average charge passed. As the three functions of fibers discussed above, the decrease in
the average charge passed might indicate that the effect of reducing volume of mortar by
increasing PVAMF content overcame the effect of increased ITZ content by increasing
PVAMF content.

255
ITZ refers to paste at the vicinity of aggregate particles (20 - 40 μm thick) which
has a microstructure more porous than that of paste farther away from the aggregate
particles (bulk paste) in concrete [12, 13]. To investigate the influence of ITZ induced by
sand particles and SMF on the RCP test results of high strength mortar, the
microstructure of mortar M22 is shown in Figure 5.57.
Figure 5.57 Microstructure of high strength mortar (mortar M22)
As shown in Figure 5.57, the paste fraction of high strength mortar had a dense
microstructure of C-S-H gel and large amount of un-hydrated cement. The paste at the
vicinity of a steel fiber or at the vicinity of a sand particle was not visually different from
Sand
Steel
micro fiber
Un-hydrated
cement
C-S-H gel
256
the paste farther away from the steel fiber and sand particle. This was in accordance with
some literature stating that the ITZ was not significant in concrete with low w/c, which
was supported by evidence that the porosity or hardness of ITZ was not significantly
different from the bulk paste [48-50]. Based on Figure 5.57, it was considered that the
influence of ITZ around sand and SMF on the RCP test results of high strength mortar
was not significant in this study.
The significance of the Joule effect on the RCP test was recognized by comparing
mortars using PVAMF and SMF at the same content. For instance, the charge passed
through mortar M22 was 5622.7 Coulomb which was significantly higher than that of
mortar MP22 which was 831.3 Coulomb. Thus, the measure high charge passed of mortar
containing SMF might not be solid evidence which inferring poor chloride ion resistivity
of SMF reinforced mortar. The limitation of the ASTM C1202 method could not give an
evident conclusion that SMF reinforced mortar had bad performed in resisting chloride
ion.
5.6.2 Discussion of the effect of sand and SMF on properties of mortar
Both sand content and SMF content have their individual effect on the properties
of mortar. The increase in either sand content or SMF content reduces the workability
and drying shrinkage of mortar. The impact of sand content or SMF content on the 1-day
compressive strength of mortar is not significant. The increase in sand content appears to
slightly decrease the 28-day compressive strength of mortar, while the increase in SMF
content improves the 28-day compressive strength of mortar. The increase in SMF
content significantly improves the flexural strength of mortar.

257
SMF reinforced mortar is a suspension of SMF and sand in the cement paste. The
segregation behavior of the components in the suspension is affected by the specific
gravity of cement paste, SMF and sand and the viscosity of the cement paste. If assume
the air content of paste at w/c=0.2 is zero, the specific gravity of paste at w/c=0.2 can be
calculated. Table 5.16 shows the specific gravity of SMF, sand, and calculated specific
gravity of cement paste.
Table 5.16 Specific gravity of SMF, sand, and calculated specific gravity of cement
paste.
Component of SMF reinforced mortar Specific gravity
Cement paste at w/c=0.2 2.32
Sand 2.64
SMF 7.8
In such suspension, SMF and sand tend to sink due to their difference in the
specific gravity from cement paste. SMF tends to sink more as its specific gravity is
about 3 times the specific gravity of paste. Sand SMF tends to sink less as its specific
gravity is close to that of cement paste, and its movement is limited by the viscos nature
of cement paste through shear stress. Thus, the suspending sand particles can act like
floating support to the SMF. Also a skeleton of sand particles can prevent SMF from
segregating. Alternatively, the SMF would present downward force on the sand particles.
The interaction between sand particles and SMF affects the segregation of SMF in fresh
mortar. As the electrical resistivity test result shows, enough sand content is needed to
prevent SMF from segregating. As discussed above, mortar M11 is confirmed to have
severe segregation of SMF by both the visual appearance of fresh mortar and the
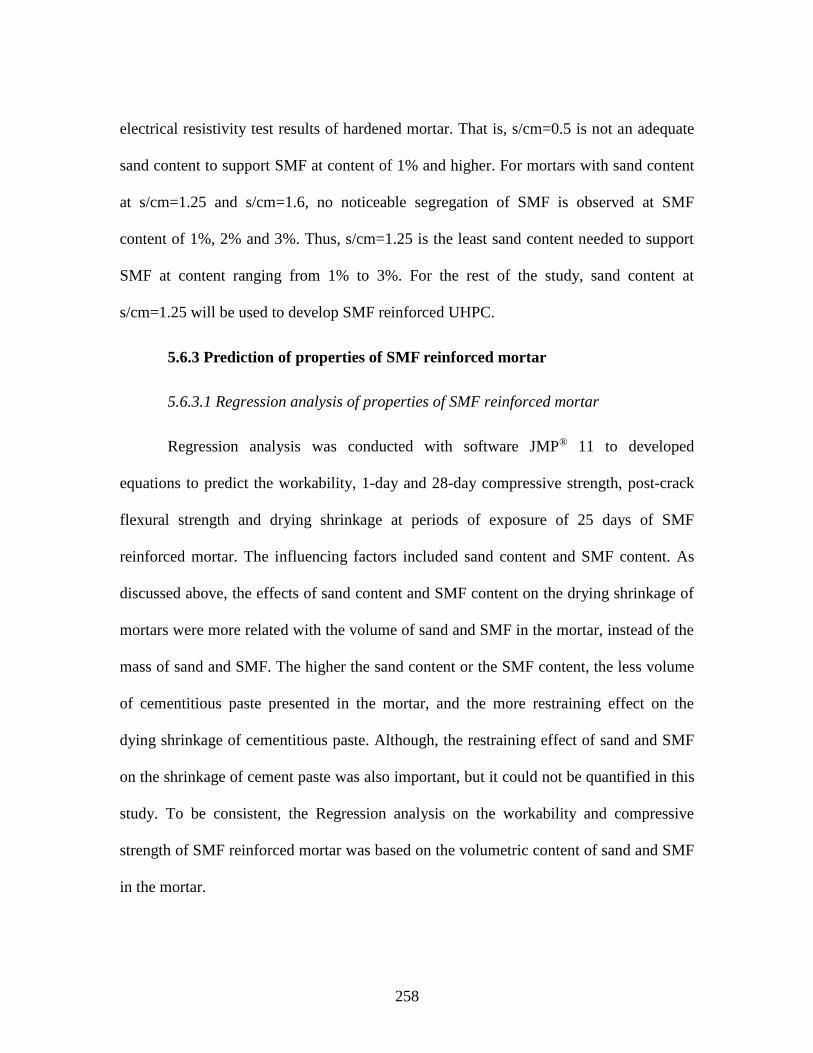
258
electrical resistivity test results of hardened mortar. That is, s/cm=0.5 is not an adequate
sand content to support SMF at content of 1% and higher. For mortars with sand content
at s/cm=1.25 and s/cm=1.6, no noticeable segregation of SMF is observed at SMF
content of 1%, 2% and 3%. Thus, s/cm=1.25 is the least sand content needed to support
SMF at content ranging from 1% to 3%. For the rest of the study, sand content at
s/cm=1.25 will be used to develop SMF reinforced UHPC.
5.6.3 Prediction of properties of SMF reinforced mortar
5.6.3.1 Regression analysis of properties of SMF reinforced mortar
Regression analysis was conducted with software JMP® 11 to developed
equations to predict the workability, 1-day and 28-day compressive strength, post-crack
flexural strength and drying shrinkage at periods of exposure of 25 days of SMF
reinforced mortar. The influencing factors included sand content and SMF content. As
discussed above, the effects of sand content and SMF content on the drying shrinkage of
mortars were more related with the volume of sand and SMF in the mortar, instead of the
mass of sand and SMF. The higher the sand content or the SMF content, the less volume
of cementitious paste presented in the mortar, and the more restraining effect on the
dying shrinkage of cementitious paste. Although, the restraining effect of sand and SMF
on the shrinkage of cement paste was also important, but it could not be quantified in this
study. To be consistent, the Regression analysis on the workability and compressive
strength of SMF reinforced mortar was based on the volumetric content of sand and SMF
in the mortar.

259
The workability, 1-day and 28-day compressive strength, post-crack flexural
strength and drying shrinkage at periods of exposure of 25 days of SMF reinforced
mortar are summarized in Table 5.17. The paste volume fraction, sand volume fraction
and SMF volume fraction in mortar are calculated and also presented in Table 5.17. The
volume fraction of HRWRA in mortar is ignored, as the value is very small.
Table 5.17 Properties of SMF reinforced mortar
Mortar
ID
Flow
(%)
Compressive
strength (MPa) Post-crack
flexural
strength (MPa)
25-day drying
shrinkage (%)
Volume fraction in the mortar
1-day 28-day Vps/VTa Vs/VT
b VSMF/VTc
M00 288 77 135 17 -0.1490 1.000 0.000 0.00
M01 269 73 128 18 -0.0993 0.731 0.269 0.00
M02 217 81 125 19 -0.0630 0.521 0.479 0.00
M03 163 77 121 19 -0.0527 0.460 0.540 0.00
M12 194 73 125 27 -0.0613 0.516 0.474 0.01
M13 156 68 121 30 -0.0490 0.455 0.535 0.01
M22 178 68 132 43 -0.0530 0.511 0.469 0.02
M23 75 86 122 40 -0.0420 0.450 0.530 0.02
M32 122 84 137 48 -0.0447 0.506 0.464 0.03
M33 13 79 142 53 -0.0410 0.446 0.524 0.03
Note: a volume ratio of cementitious paste to the total mortar; b volume ratio of sand to the
total mortar; c volume ratio of SMF to the total mortar
The regression equations are developed simply based on the volume fraction of
sand and SMF in the mortar mixture. The volume fraction of sand is expressed as “s”.
The volume fraction of SMF is expressed as “f”. The model terms included in the least
squares analysis are s, s2, s3, f, f2, f3 and s×f. The t test is carried out for the hypothesis
that the estimated coefficient of each of the model terms equals zero. Only the model
terms with p-value of t test less than 0.05 are considered having significant effect in the
regression model. The final regression equations only include the statistically significant
model terms. The regression equations are shown in Table 5.18.
260
Table 5.18 Prediction of relative changes in the drying shrinkage of mortars
Properties Regression R2 adjusted
Workability (%) Wm=672.1-999.0s-537.8×(s-0.4284)2-145872.2×(f-0.012)2-
51486.1×(s-0.4284)×(f-0.012) 0.98
1-day compressive
strength (MPa) - -
28-day compressive
strength (MPa) CS28m=130.8-24.1s+352.7f+30278.0×(f-0.012)2 0.80
Post-crack flexural
strength (MPa) FSm=18.2+1103.8f 0.98
25-day drying shrinkage
(%) dmm25=-0.1480+0.1755s+0.6085f 0.99
Note: s=volume ratio of sand to the total mortar; f= volume ratio of SMF to the total
mortar
It should be noted that no good regression equation is found to predict the 1-day
compressive strength of SMF reinforced mortar. This is because that the effect of sand
content and SMF content on the 1-day compressive strength of mortar is not significant.
5.6.3.2 Validation of the prediction of the properties of SMF reinforced mortar
A mortar with sand content of s/cm=1.4 and SMF content of 1.1% was prepared
to verify the prediction equations. The volume fraction of sand in the mortar was 0.501.
The volume fraction of SMF in the mortar was 0.011. The results are shown in Table
5.19.

261
Table 5.19 Prediction of properties of SMF reinforced portland cement mortar
Experimental values
(Ev)
Predicted values
(Pv) (Pv-Ev)/Ev
Flow (%) 163 172 0.06
28-day compressive strength
(MPa) 121 123 0.02
Flexural strength (MPa) 27 30 0.11
25-day drying shrinkage (%) -0.0480 -0.0534 0.11
As shown in Table 5.19, the predicted flow, 28-day compressive strength, flexural
strength and 25-day drying shrinkage was higher than the experimental results by 6%,
2%, 11% and 11%, respectively. The regression equations shown in Table 5.18 can give
good prediction of the properties of SMF reinforced mortar.
5.6.4 Summary of combined effect of sand and SMF on properties of mortar
When the SMF content is fixed, the increase in the sand content decreased the
workability and drying shrinkage of portland cement mortar. The influence of sand
content on the 28-day compressive strength of mortar was not significant. The chloride
permeability of mortar was decreased as the sand content increased, which was attributed
to the reduce volume of paste.
When the sand content was fixed, the increase in the SMF content decreased the
workability and drying shrinkage of portland cement mortar. The increase in the sand
content or SMF content did not result in noticeable changes in the 28-day first-crack
flexural strength of mortar. However, the post-crack flexural strength of mortar was

262
significantly increased by using SMF. The 28-day compressive strength of mortar was
slightly improved as the SMF content increases.
Certain minimum sand content was required to prevent the segregation of SMF.
In this study, s/cm=1.25 was the lowest sand content to prevent segregation of SMF at
content from 1% to 3%.
The increase in the sand content or decrease in the SMF content resulted in an
increase in the bulk electrical resistivity of mortar. This was due to the facts that sand was
less conductive than cement paste, and SMF is more conductive than cement paste. Bulk
electrical resistivity test on hardened mortar could be used to identify the severe
segregation of SMF. To a well compacted high strength mortar, the main effect of
increasing sand content or SMF content was reducing the volume of cement paste, which
was beneficial in reducing the chloride ion permeability of mortar. The cement paste at
the vicinity of sand particles and SMF was not visually different from the paste farther
away, which indicated insignificant ITZ for high strength mortar. A strong correlation
between RCP test results and the resistance of the specimens was observed. If the
chloride ion permeability of SMF reinforced mortar was evaluated with RCP method, the
significant Joule’s effect would falsely indicate increased chloride ion permeability as the
SMF content increased. The workability, 28-day compressive strength, flexural strength,
and 25-day drying shrinkage of mortar could be well predicted simply based on the sand
content by volume and SMF content by volume.

263
5.7 Development of UHPC
Selected paste formulations were used to produce UHPC simply by adding SMF
and sand. SMF content was set at 2% due to the fact that SMF content at 1% would not
cause significant improvement in the compressive strength of UHPC. The sand content
was set at s/cm=1.25 and 1.6, as sand content lower than s/cm=1.25 would result in
potential severe segregation of SMF.
In total eight SMF reinforced mortar mixtures were prepared. The relative mixture
proportions are shown in Table 5.20. The parent paste of each mixture is also listed in
Table 5.20 for reference.
Table 5.20 Relative mixture proportions of UHPC
Mixture ID Parent paste ID SFU/c MK/c FA/c s/cm SMF content
CSFU1 S2 0.2 0 0 1.25 2%
CSFU2 S2 0.2 0 0 1.6 2%
CSFU3 S3 0.3 0 0 1.25 2%
CUFA1 F2 0 0 0.2 1.25 2%
CMUF1 MUF2 0 0.05 0.15 1.25 2%
CMUF2 MUF3 0 0.1 0.1 1.25 2%
CMUF3 MUF4 0 0.05 0.25 1.25 2%
CMUF4 MUFOPT 0 0.136 0.116 1.25 2%
The material properties of the parent paste are shown in Table 5.21 for reference.

264
Table 5.21 Properties of paste used for preparing UHPC
Paste ID Flow (%) Compressive strength (MPa) 25-day drying
shrinkage (%) 1-day 28-day
S2 238 72 152 -0.182
S3 175 58 119 -0.168
F2 288 26 148 -0.179
MUF2 269 61 145 -0.156
MUF3 239 59 145 -0.149
MUF4 258 38 149 -0.157
MUFOPT 231 64 139 -0.107
5.7.1 Properties of SMF reinforced mortars
The material properties of the eight SMF reinforced mortars are shown in Table
5.22
Table 5.22 Properties of UHPC
Mixture
ID
Flow
(%)
Compressive strength 25-day
drying
shrinkage
(%)
Flexural
strength (MPa) RCP
(Coulomb)
Casting
method 1-day 28-day
First-
crack
Post-
crack Average
(MPa)
COV
(%)
Average
(MPa)
COV
(%)
CSFU1 106 74 2.3 160 1.1 -0.069 19 37 176 Sa
CSFU2 81 71 2.8 160 1.8 -0.053 21 42 106 Vb
CSFU3 81 75 2.7 156 8.8 -0.065 17 29 119 Vb
CUFA 169 60 3.8 140 2.8 -0.065 18 36 1453 Sa
CMUF1 169 65 2.0 140 2.2 -0.047 18 36 1117 Sa
CMUF2 144 66 1.0 142 1.1 -0.039 19 37 251 Sa
CMUF3 150 58 3.7 150 1.2 -0.052 20 38 949 Sa
CMUF4 138 66 5.0 141 2.8 -0.037 19 35 142 Sa a Self-Consolidating; b Vibration
As shown in Table 5.22, the workability of concrete mixture containing SFU
(from flow value of 81% to 106%) was generally lower than that of mixture containing
MK and UFA (from 138% to 169%). This trend was in accordance with the findings from

265
the paste mixtures, where the workability of paste containing SFU was generally lower
than that of paste containing MK and UFA (see Table 5.21).
All the eight concrete mixtures exhibited high 1-day compressive strength ranging
from 58 MPa to 75 MPa, and very high 28-day compressive strength ranging from 140
MPa to 160 MPa. It was noted that the 1-day compressive strength of concrete mixture
containing SFU (from 71 MPa to 75 MPa) was generally higher than that of mixture
containing MK and UFA (from 58 MPa to 66 MPa), and the 28-day compressive strength
of concrete mixture containing SFU (from 156 MPa to 160 MPa) was generally higher
than that of mixture containing MK and UFA (from 140 MPa to 150 MPa).
It was also noted that the 25-day drying shrinkage of mixture containing SFU
(from -0.053% to -0.069%) was generally higher than that of mixture containing MK and
UFA (from -0.037% to -0.065%).
The first-crack flexural strength and post-crack flexural strength of the concrete
mixtures were high, which was evident by noticing that the first-crack flexural strength
ranges from 17 MPa to 21 MPa, and the post-crack flexural strength ranges from 29 MPa
to 42 MPa. There was no clear trend of the effect of SCM on the first-crack flexural
strength and post-crack flexural strength observed in this study, except that highest SFU
content resulted in the lowest post-crack flexural strength of 29 MPa for mixture CSFU3.
Mixtures containing SFU exhibited lower Coulomb values than mixtures
containing MK and UFA, except the mixture using optimal proportion of MK and UFA.
Concrete mixture containing binary blend of UFA and cement exhibited the highest
Coulomb values of all mixtures studied. For concrete mixture containing ternary blend of

266
MK, UFA and cement, the increase in the MK content decreased the Coulomb value. The
use of SFU, MK and UFA significantly reduced the Coulomb value relative to the
reinforced portland cement mortar with SMF content of 2%, sand content of s/cm=1.25
(mortar M22 in Table 5.14),. According to the classification described in ASTM C1202,
all the mixtures, except CUFA and CMUF1, could be classified as very low permeable
mixtures. Mixtures CUFA and CMUF1 were classified as low permeable mixtures.
Among the eight concrete mixtures, CSFU1, CSFU2, CSFU3 and CMUF3
exhibited 28-day compressive strength at least 150 MPa, which fell into the category of
UHPC in accordance with the definition proposed by FHWA [4, 7]. However, one of the
shortcomings of mixtures CSFU2 and CSFU3 was that they needed external vibration
during casting. The 28-day compressive strength of mixture CMUF2 was 142 MPa which
was slightly lower than 150MPa. It was noted that mixture CMUF4 exhibited the lowest
25-day drying shrinkage among other mixtures which was -0.037%. The limit on the
drying shrinkage at the age of 28 days (25 days of exposure) of conventional concrete
had been proposed in some standards (i.e. Australian Standard AS 3600) and FHWA
research reports [181]. The limit ranged from 320 micro strains to 750 micro strains
[181]. The 25-day drying shrinkage of the UHPC mixtures presented in Table 5.22
approximately fell into this range of limit. Considering that UHPC has very different
characteristics in the tensile strength and modulus of elasticity compared to the
conventional concrete, future investigation should focus on the drying shrinkage behavior
and the drying shrinkage limit of UHPC.

267
5.7.2 Comparison between properties of UHPCs and their parent pastes
By comparing the properties of concrete mixtures with that of the parent pastes,
the role of the sand content and SMF content on the behavior of UHPC was studied. The
properties studied include workability, compressive strength and drying shrinkage. Only
mixtures with sand content of s/cm=1.25 and SMF content of 2% were studied. The ratio
of specific property of concrete mixture to that of paste was calculated and presented in
Table 5.23.
Table 5.23 Comparison of properties between UHPCs and their parent pastes
Concrete/Paste Flow Compressive strength
25-day drying shrinkage 1-day 28-day
CSFU1/S2 0.45 1.03 1.05 0.38
CSFU3/S3 0.46 1.29 1.31 0.39
CUFA/F2 0.59 2.31 0.95 0.36
CMUF1/MUF2 0.63 1.07 0.97 0.30
CMUF2/MUF3 0.60 1.12 0.98 0.26
CMUF3/MUF4 0.58 1.53 1.01 0.33
CMUF4/MUFOPT 0.60 1.03 1.01 0.35
As Table 5.23 shows, the impact of sand and SMF on the properties of
cementitious mixture were different in paste containing SFU and paste containing MK
and UFA.
From the perspective of workability, adding sand and SMF in paste resulted in
less reduction in flow for paste containing MK and UFA than for paste containing SFU.
For instance, the flow of mixture CMUF2 was 60% of the flow of its parent paste MUF3.
The flow of mixture CSFU3 was 46% of the flow of its parent paste S3. This might be
related with the gradation of the particles of the component materials of the mixture. In
268
presence of sand and SMF, mixture produced from paste containing MK and UFA had
better particles packing than mixture produced from paste containing SFU. Thus, more
water was available to lubricate the particles, and resulted in less reduction in the flow.
Another possible explanation was that in mixture with SFU significant portion of the
water could be bond at the surface of SFU grains as the SFU had high surface area. Thus,
less water was left to lubricate the particles of the component materials, and the flow was
affected accordingly. However, in mixtures with ternary blend of MK, UFA and cement,
the surface area of MK and UFA particles was lower than that of SFU. Thus, more water
was available for lubrication and hence better flow was observed.
From the perspective of compressive strength, adding sand and SMF in paste
resulted in more improvement in 28-day compressive strength for paste containing SFU
than for paste containing MK and UFA. For instance, the 28-day compressive strength of
mixture CMUF2 was 98% of the 28-day compressive strength of its parent paste MUF3.
The 28-day compressive strength of mixture CSFU3 was 131% of the 28-day
compressive strength of its parent paste S3. This is likely that the use of SFU with its
super fine particles and high pozzolanic reactivity improved the bond between sand, SMF
and paste more significantly than the binary use of MK and UFA as SCM.
From the perspective of drying shrinkage, adding sand and SMF in paste resulted
in less reduction in the 25-day drying shrinkage for paste containing SFU than for paste
containing MK and UFA.

269
5.8 Effect of Chemical Admixtures on the Properties of UHPC
This section includes the investigations on the influence of a powder form
shrinkage reducing admixture, a liquid form chemical accelerator, a liquid form
shrinkage reducing admixture and a liquid form viscosity modifying admixture on the
workability, setting time, compressive strength and drying shrinkage of mortar. The
combined use of the liquid form chemical accelerator and the liquid form shrinkage
reducing admixture to improve the properties of UHPC was studied. The role of HRWRA
was previously investigated and presented in sessions 5.1 and 5.4.
5.8.1 Influence of chemical admixtures on the properties of paste
The powder form shrinkage reducing admixture was dosed at admixture solid
content-to-cementitious materials (sc/cm) ratio at sc/cm =0.05, liquid form chemical
accelerator was dosed at sc/cm=0.02, liquid form shrinkage reducing admixture was
dosed at 2% by mass of cementitious materials and liquid form viscosity modifying
admixture was dosed at sc/cm=0.001. The water content in the liquid form admixture was
deducted from the mixing water in the mixture. The properties of pastes using different
types of chemical admixtures are presented in Figure 5.58. The properties of control paste
which only has HRWRA as chemical admixture are also presented as the dash line for
reference.

270
(a) Workability (b) 1-day compressive strength
(c) 28-day compressive strength (d) 25-day drying shrinkage
Figure 5.58 Comparison of pastes using different chemical admixtures
The use of powder form SRA resulted in decrease in the workability by 24%,
compared with the control. It also decreased the 1-day and 28-day compressive strength
by 15% and 14%, respectively. As expected, the use of powder form SRA reduced the
drying shrinkage of the paste by 35%. This was attributed to the expansive hydration
products generated during the MgO hydration.
Control Control
Control
Control

271
The use of VMA resulted in decrease in the workability by 25%, compared with
the control. This was related to the increased viscosity when VMA was used. The use of
VMA also decreased the 1-day and 28-day compressive strength by 24% and 20%,
respectively. The use of VMA showed slight effect in reducing the drying shrinkage of
the paste, specifically by 3%.
The use of accelerator resulted in decrease in the workability by 16%, compared
with the control. Accelerator also increased the 1-day compressive strength by 5%, which
was believed to be the consequence of accelerated hydration of cement. However, it
decreased the 28-day compressive strength by 11%. The use of accelerator slightly
reduced the drying shrinkage of the paste by 3%.
The use of liquid form SRA resulted in slight increase in the workability by 5%,
compared with the control. It significantly decreased the 1-day compressive strength by
91%. The compressive strength caught up at the age of 28 days, which was evident by
noticing that the use of liquid form SRA only resulted in only 2% reduction in the 28-day
compressive strength. The influence of liquid form SRA on the compressive strength of
cementitious pate was similar to what was observed in the UHPC discussed in the
preliminary study (see session 5.2). Moreover, as expected, liquid form SRA reduced the
drying shrinkage of the paste, specifically by 43%. This was attributed to the reduced
capillary stress of the pore solution.
From the consideration of workability, compressive strength and drying shrinkage
of paste, the use of powder form SRA or VMA did not exhibit beneficial effect in
improving the properties of paste, except their effect in reducing the drying shrinkage. It

272
was anticipated that the combined use of accelerator and liquid form SRA had strong
potential in improving the properties of UHPC.
A paste mixture containing both accelerator and liquid form SRA were
investigated to understand the performance of combined used of accelerator and liquid
form SRA in paste mixture. This paste mixture was proportioned as follows: w/cm=0.2,
SFU/c=0.2, HRWRA/cm=0.01, accelerator/cm=0.02 and SRA/cm=0.02. The test results
are shown in Figure 5.59. The properties of control paste which only contains HRWRA
as chemical admixture at dosage of 1% by mass of cementitious materials are presented
as the dash lines in Figure 5.59 for reference.

273
a. Time of set
b. workability c. 1-day compressive strength
d. 28-day compressive strength e. 25-day drying shrinkage
Figure 5.59 properties of paste with combined use of accelerator and liquid form
SRA
Control Control
Control
Control

274
As shown in Figure 5.59, the values of setting time, workability and 1-day
compressive strength of paste containing both accelerator and liquid SRA were in
between that of pastes with use of accelerator or liquid SRA alone. However, the 28-day
compressive strength of paste containing both accelerator and liquid SRA was similar to
that of paste with use of accelerator alone, but lower than that of paste with use of liquid
SRA alone. This indicates that liquid form SRA reduced the compressive strength of
paste at 1 day, regardless of the presence of accelerator. However, the compressive
strength of paste caught up at 28 days in both pastes with and without accelerator. The
25-day drying shrinkage of paste containing both accelerator and liquid SRA was lower
than that of paste with use of accelerator or liquid SRA alone.
The combined use of accelerator and liquid SRA could address the significantly
prolonged setting time, reduced 1-day compressive strength of paste due to the use of
liquid SRA alone, and address the reduced workability of paste due to the use of
accelerator alone. Thus, the combined use of accelerator and liquid form SRA had
potential in further improving the properties of UHPC, compared with that of UHPC
using accelerator or liquid SRA alone.
In the next session, four UHPC mixtures were prepared using liquid form SRA
and accelerator at various combinations. The base UHPC mixture was selected as CSFU1
(see Table 5.22), as it exhibited the highest drying shrinkage than others.

275
5.8.2 Properties of UHPC using liquid SRA and accelerator
The properties of the four UHPC mixtures containing SRA and accelerator as
discussed above are shown in Table 5.24. The properties of UHPC without either SRA or
accelerator (UHPC CS0A0) from the previous discussion are also presented for reference.
Table 5.24 Properties of UHPC containing both liquid form SRA and accelerator
UHPC ID * CS0A0 CS0A2 CS2A0 CS2A1 CS2A2
Workability (%) 106 103 165 138 116
1-day compressive
strength
Average (MPa) 74 81 22 30 51
COV (%) 2.3 0.8 2.2 4.7 4.1
28-day compressive
strength
Average (MPa) 160 158 154 151 146
COV (%) 1.1 4.3 2.9 3.4 8.1
25-day drying shrinkage (%) -0.069 -0.061 -0.040 -0.034 -0.028
RCP (Coulomb) 176 170 187 172 179
Flexural strength - crack (MPa) 19 18 17 18 17
Flexural strength – post-crack (MPa) 37 35 37 35 32
* UHPC ID CS2A0 indicates UHPC with liquid form SRA dosage at 2% and accelerator
dosage at 0%.
As shown in Table 5.24, compared with UHPC containing no SRA or accelerator
(UHPC CS0A0), the use of accelerator alone at dosage of 2% by mass of cementitious
materials reduced the workability by 3%, and increased the 1-day compressive strength
by 9%. The 28-day compressive strength of UHPC was not changed significantly by the
use of accelerator. The drying shrinkage of UHPC was reduced by 12%, and the charge
passed in the RCP test was reduced by 3%, by the use of accelerator.
Compared with UHPC CS0A0, the use of SRA alone at dosage of 2% by mass of
cementitious materials significantly improved the workability by 56%, and decreased the
1-day compressive strength by 70%. The 28-day compressive strength of UHPC was only
276
decreased by 4%. The drying shrinkage of UHPC which was the main reason of using
SRA reduced by 42%. This was in agreement with the findings from the preliminary
study on the influence of liquid SRA on the properties of UHPC (see session 5.2). The
charge passed in the RCP test increased by 6%. The use of either accelerator or liquid
SRA alone did not result in significant difference in the first-crack flexural strength. The
use of liquid SRA alone did not result in significant difference in the post-crack flexural
strength. However, the use of accelerator alone appeared to result in reduction in the post-
crack flexural strength slightly.
Compared with UHPC using SRA alone (UHPC CS2A0), UHPC mixtures
containing SRA and accelerator-CS2A1 and CS2A2-exhibited 16% and 30% lower
workability, respectively. The 1-day compressive strength of UHPC mixtures CS2A1 and
CS2A2 was found to be 36% and 132% higher than that of UHPC CS2A0, respectively.
This proved the effectiveness of using accelerator to compensate the significant reduction
in the 1-day compressive strength of UHPC due to the use of SRA alone. With SRA
dosage fixed at 2%, the use of accelerator at dosage of 1% and 2% resulted in slight
decrease in the 28-day compressive strength by 2% and 5%, respectively, and significant
decrease in the drying shrinkage by 15% and 30%, respectively. The charge passed in the
RCP test and the first-crack flexural strength of UHPC were not significantly affected by
the accelerator dosage. However, the increase in the accelerator dosage decreased the
post-crack flexural strength of UHPC. For instance, as the accelerator dosage increased
from 0% to 2% while the SRA dosage was fixed at 2%, the post-crack flexural strength
of UHPC was decreased by 15%. The reduction in the post-crack flexural strength as
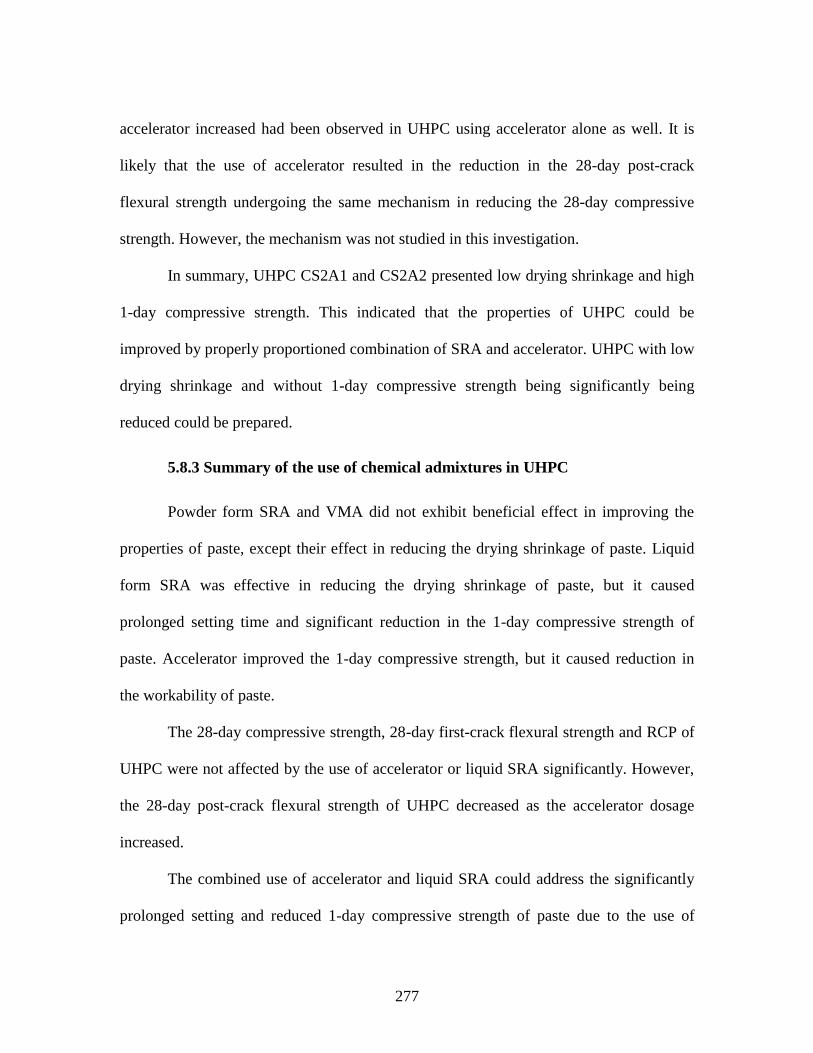
277
accelerator increased had been observed in UHPC using accelerator alone as well. It is
likely that the use of accelerator resulted in the reduction in the 28-day post-crack
flexural strength undergoing the same mechanism in reducing the 28-day compressive
strength. However, the mechanism was not studied in this investigation.
In summary, UHPC CS2A1 and CS2A2 presented low drying shrinkage and high
1-day compressive strength. This indicated that the properties of UHPC could be
improved by properly proportioned combination of SRA and accelerator. UHPC with low
drying shrinkage and without 1-day compressive strength being significantly being
reduced could be prepared.
5.8.3 Summary of the use of chemical admixtures in UHPC
Powder form SRA and VMA did not exhibit beneficial effect in improving the
properties of paste, except their effect in reducing the drying shrinkage of paste. Liquid
form SRA was effective in reducing the drying shrinkage of paste, but it caused
prolonged setting time and significant reduction in the 1-day compressive strength of
paste. Accelerator improved the 1-day compressive strength, but it caused reduction in
the workability of paste.
The 28-day compressive strength, 28-day first-crack flexural strength and RCP of
UHPC were not affected by the use of accelerator or liquid SRA significantly. However,
the 28-day post-crack flexural strength of UHPC decreased as the accelerator dosage
increased.
The combined use of accelerator and liquid SRA could address the significantly
prolonged setting and reduced 1-day compressive strength of paste due to the use of

278
liquid SRA alone, and address the reduced workability of paste due to the use of
accelerator alone.
UHPC with low drying shrinkage and without 1-day compressive strength being
significantly reduced could be prepared.

279
5.9 Bond Performance between UHPC and Precast Concrete
This section includes the investigations on the influence of substrate surface
roughness, surface moisture condition, surface cleanliness and curing condition on the
bond performance between UHPC and precast concrete under third point flexural
loading. Two test methods, sand spread test and laser profiling, were used to evaluate the
substrate surface roughness prepared by sandblasting. The influence of different substrate
surface roughening pattern on the bond performance between UHPC and precast concrete
was investigated.
The results are presented in two parts. First, the influence of surface roughness,
surface moisture condition, and surface cleanliness on the bond performance between
UHPC and precast concrete is presented and discussed. Second, the influence of
roughening pattern on the bond performance between UHPC and precast concrete is
presented and discussed. All the flexural bond tests were conducted at the age of 7 days
after casting UHPC. The compressive strength and flexural strength of UHPC were 128.5
MPa and 32.0 MPa, respectively, and the compressive strength and flexural strength of
precast concrete was 49.1 MPa and 6.7 MPa, respectively, when flexural bond tests were
conducted.
5.9.1 Influence of surface roughness
The surface roughness of the substrate precast concrete prepared by sandblasting
of different durations was evaluated by two test methods: sand spread test which gave the
percent increase in the sand spread and laser profiling which gave the value of roughness

280
index Sa. The test results are shown in Table 5.25.
Table 5.25 Surface roughness of precast concrete prepared by sandblasting
Original
surface
Specimen
ID Roughening duration (s) Sand spread (%)
Sa (μm)
Mortar Aggregate
Sawed
RS1 0 620 7.0 12.9
RS2 10 510 25.4 21.4
RS3 30 350 31.2 20.8
RS4 60 300 59.9 26.0
Molded RM1 0 610 11.3 -
RM2 10 540 33.1 -
As shown in Table 5.25, the results from the sand spread test showed that the sand
spread value decreased with the increase in the roughening duration, which indicated an
increase in the surface roughness. For sawed surface, the sand spread value of surface
roughened for 10 s, 30 s and 60 s was 18%, 44% and 52% lower than that of surface
without roughening, respectively. For molded surface, the sand spread value of surface
roughened for 10 s was 11% lower than that of surface without roughening. The results
from the laser profiling show that the value of surface roughness index Sa increased with
the increase in the roughening duration for both the mortar fraction and the coarse
aggregate fraction in sawed precast concrete, which indicated an increase in the surface
roughness on these two fractions. It was also noted that the mortar fraction was easier to
roughen than the coarse aggregate fraction. This was evident by noticing that when the
roughening duration increased from 0 s to 60 s, the Sa of the mortar fraction was
increased by 756%, while the Sa of the coarse aggregate fraction was increased by only
102%. The fact that the coarse aggregate used in this study was intrinsically stronger than
the cement mortar was considered the reason. Compared with the sand spread test, laser

281
profiling revealed the difference in the roughness of cement mortar and coarse aggregate.
For molded surface, the value of surface roughness Sa was increased by 193% as the
roughening duration increased from 0 s to 10 s.
The influence of surface roughness on the flexural bond behavior between UHPC
CSFU1 (see Table 5.20) and precast concrete is shown in Table 5.26.
Table 5.26 Influence of surface roughness on the bond behavior between UHPC and
precast concrete
Original
surface
Specimen
ID
Roughening
duration (s)
Ultimate
load (kN)
Ultimate
stress (MPa)
Cov
(%)
Failure
mode
Sawed
RS1 0 12.2 6.2 10.4 Bond
RS2 10 13.2 6.7 3.8 Precast
RS3 30 13.4 6.8 7.4 Precast
RS4 60 13.1 6.6 14.0 Precast
Molded RM1 0 8.6 4.4 11.5 Bond
RM2 10 13.3 6.7 6.9 Precast
As shown in Table 5.26, two failure modes were observed during the test: failure
in precast concrete and failure at the bond/interface (see Figure 5.60). Failure at bond
only occurred when no sandblasting was applied, regardless of sawed surface or molded
surface. The calculated stress when de-bonding happened (de-bonding stress) was lower
than the flexural strength of monolithic precast concrete. It was also noted than the de-
bonding stress based on molded face was weaker than that based on sawed face, as the
former was 29% lower than the latter. However, all the flexural bond specimens with the
surface (either sawed or molded) roughened failed in the precast concrete part. The
calculated stress when failure happened was about the same as the flexural strength of
monolithic precast concrete. It was noted that 10 s of roughening (spread value of 510%
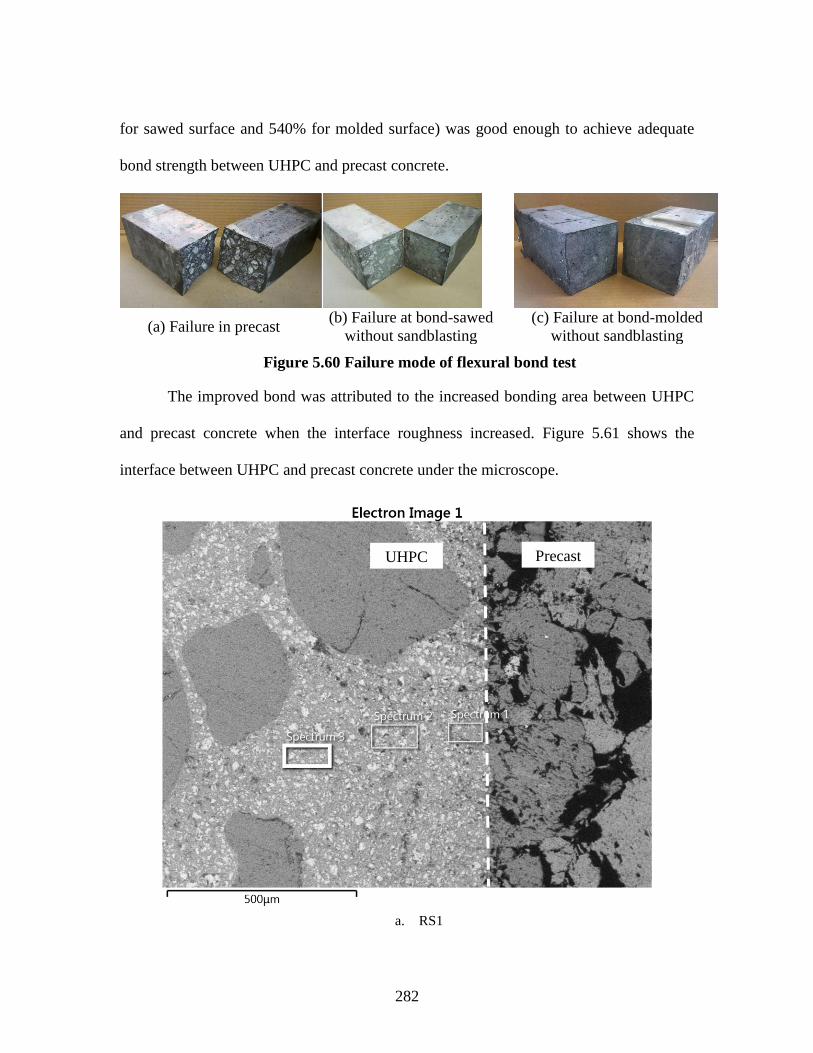
282
for sawed surface and 540% for molded surface) was good enough to achieve adequate
bond strength between UHPC and precast concrete.
(a) Failure in precast (b) Failure at bond-sawed
without sandblasting
(c) Failure at bond-molded
without sandblasting
Figure 5.60 Failure mode of flexural bond test
The improved bond was attributed to the increased bonding area between UHPC
and precast concrete when the interface roughness increased. Figure 5.61 shows the
interface between UHPC and precast concrete under the microscope.
a. RS1
UHPC Precast

283
b. RS2
c. RM1
UHPC
Precast
UHPC Precast

284
d. RM2
Figure 5.61 Microstructural of bond between UHPC and precast concrete
As shown in Figure 5.61, for sawed surface without roughening, the interface
between UHPC and precast concrete was indicated by a straight dash line under the
microscope. For molded surface without roughening, the interface between UHPC and
precast concrete was indicated by an almost straight line but with some zigzag shape
under the microscope However, after roughening effort was applied, interface between
UHPC and precast concrete was indicated by a line with significant zigzag shape for both
sawed surface and molded surface under the microscope. The increase in the bonding
area contributed to the resistance to de-bonding.
UHPC Precast

285
5.9.2 Influence of surface moisture condition, cleanliness and curing
condition
The influence of surface moisture condition and cleanliness on the flexural bond
behavior between UHPC CSFU1 (see Table 5.20) and precast concrete are shown in
Table 5.26.
Table 5.26 Influence of surface moisture condition, cleanliness and curing condition
on the bond behavior between UHPC and precast concrete
Original
surface
Specimen
ID
Roughening
duration (s)
Ultimate
load (kN)
Ultimate
stress
(MPa)
Cov
(%) Failure mode
Molded
MM1 0 13.7 6.9 4.7 Precast
MM2 10 13.8 7.0 5.3 Precast
CM2 10 11.0 5.6 36 Precast+Bond
AM1 10 13.2 6.7 3.8 Precast
As shown in Table 5.26, for specimens with UHPC cast on ambient dry precast
concrete surface, the failure occurred in the precast concrete which indicated adequate
bond between UHPC and precast concrete. The difference in the bond performance based
on the use of SSD precast concrete surface or dry precast concrete surface was not
observed in this study. It has been reported in literature that a saturated substrate concrete
surface helped to generate hydration products and created a high cohesion between
UHPC and substrate concrete, as the moisture from the substrate surface helped the
hydration of the considerable amount of un-hydrated cement in newly cast concrete
mixture with low w/cm [121]. However, when the substrate surface was ambient dry, de-
bonding failure mode would likely occur when the substrate surface was not roughened
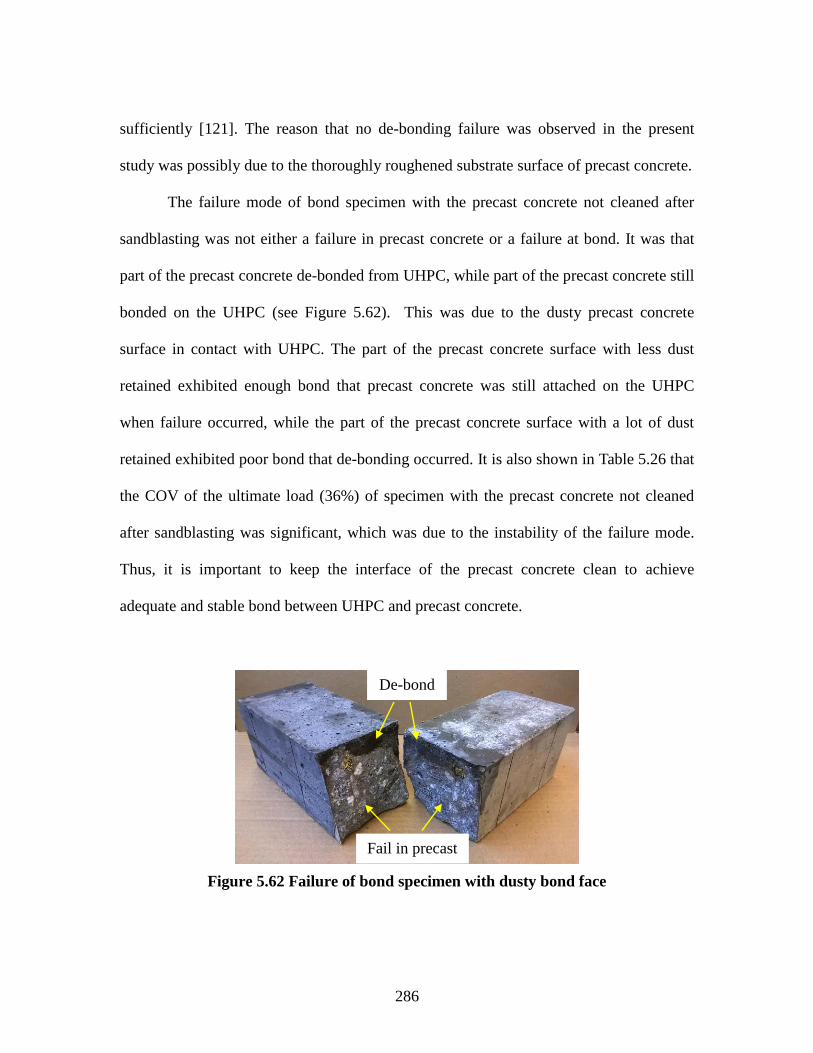
286
sufficiently [121]. The reason that no de-bonding failure was observed in the present
study was possibly due to the thoroughly roughened substrate surface of precast concrete.
The failure mode of bond specimen with the precast concrete not cleaned after
sandblasting was not either a failure in precast concrete or a failure at bond. It was that
part of the precast concrete de-bonded from UHPC, while part of the precast concrete still
bonded on the UHPC (see Figure 5.62). This was due to the dusty precast concrete
surface in contact with UHPC. The part of the precast concrete surface with less dust
retained exhibited enough bond that precast concrete was still attached on the UHPC
when failure occurred, while the part of the precast concrete surface with a lot of dust
retained exhibited poor bond that de-bonding occurred. It is also shown in Table 5.26 that
the COV of the ultimate load (36%) of specimen with the precast concrete not cleaned
after sandblasting was significant, which was due to the instability of the failure mode.
Thus, it is important to keep the interface of the precast concrete clean to achieve
adequate and stable bond between UHPC and precast concrete.
Figure 5.62 Failure of bond specimen with dusty bond face
De-bond
Fail in precast

287
As shown in Table 5.26, for the specimens cured at ambient condition (July 2015
at Clemson, daily temperature range: 71-103 oF; average RH: 61%, and eleven raining
days), the failure load and failure mode were similar to the specimen cured in the
moisture room. The effect of curing condition on the bond performance was not
significant in this study.
5.9.3 Bond performance of different UHPC mixtures
Three concrete mixture CSFU3, CUFA and CMUFA were selected to study their
bond performance on precast concrete, as these three mixtures exhibited relatively low
first-crack flexural strength (see Table 5.22). The interface was cleaned and prepared to
SSD state before casting UHPC. The test results are shown in Table 5.27.
Table 5.27 Bond performance of different UHPC mixtures
Original
surface
UHPC
ID
Roughening
duration (s)
Ultimate
load (kN)
Ultimate
stress (MPa) Cov (%) Failure mode
Molded
CSFU3 10 13.4 6.8 3.7 Precast
CUFA 10 13.7 7.0 3.1 Precast
CMUF1 10 12.9 6.5 7.7 Precast
As shown in Table 5.27, all the three concrete mixtures exhibited adequate bond
with the precast concrete, indicated by a failure in the precast concrete. It was anticipated
that all the UHPC developed in the present study (see Table 5.22) had adequate bond
strength on precast concrete, when the substrate surface was roughened for 10 s, cleaned
and prepared to SSD state before casting UHPC.
5.9.4 Influence of roughening pattern
Three surface roughening pattern-whole surface roughened, half surface

288
roughened and quarter surface roughened-are shown in Figure 5.63. This test was based
on molded face of precast concrete. For the whole surface roughened pattern, the surface
of precast concrete was roughened for 10 s. For the half surface roughened pattern, the
surface of precast concrete was roughened for 5 s. For the quarter surface roughened
pattern, the surface of precast concrete was roughened for 2.5 s. UHPC CSFU1 (see Table
5.20) was used for casting.
(a) Whole surface roughened (b) Half surface roughened (c) Quarter surface
roughened
Figure 5.63 Different surface roughening pattern
The test results are shown in Table 5.28.
Table 5.28 Influence of surface roughness on the bond behavior between UHPC and
precast concrete
Roughening
pattern
Ultimate load
(kN)
Ultimate stress
(MPa)
Cov
(%)
Failure
mode
Whole 13.3 6.7 6.9 Precast
Half 13.0 6.8 4.2 Precast
Quarter 12.8 6.5 2.8 Precast
As shown in Table 5.28, all the three surface roughening patterns resulted in a
failure in the precast concrete. This indicated that as long as the tension zone of the
bonding interface was sufficiently roughened, a good bond between UHPC and precast
Roughened
Roughened
Roughened

289
concrete could be achieved. In construction practice, partly roughening method would
reduce the cost of substrate surface preparation, compared with method roughening the
entire substrate surface.
5.9.5 Summary of the bond strength between UHPC and precast concrete
Compared with previous bond test using the slant shear test and pull-off test, third
point flexural bond test was an easy test to be used to investigate the bond behavior
between UHPC and precast concrete. It was also a reliable test method as the results were
consistent.
The increase in the sandblasting duration resulted in the increase in the roughness
of the surface which could be quantified by sand spread test and laser profiling.
For specimens with the full substrate face (originally sawed or molded)
roughened, saturated and cleaned before applying UHPC, the failure occurred in the
precast concrete at the age of 7 days after casting UHPC. The ultimate load of those
specimens was about the same as the ultimate load of monolithic precast concrete
specimen. This indicated that sandblasting was effective to achieve adequate bond
behavior between UHPC and precast concrete even with 10 seconds of roughening. A
roughening duration of 10 seconds resulted in a sand spread value of 510% for sawed
surface and a sand spread value of 540% for molded surface. The surface roughness of
surface with a roughening duration of 10 seconds was also evaluate by laser profiling.
For molded surface, the roughness index Sa was 33.1 μm, and for sawed surface, the
roughness index Sa was 25.4 μm and 21.4 μm for mortar fraction and coarse aggregate
fraction, respectively. Flexural bond specimens with no surface roughened failed at the
290
bond between UHPC and precast concrete, with a bond strength of 6.2 MPa for sawed
face and a bond strength of 4.4 MPa for molded face at the age of 7 days. The ultimate
load of those specimens was lower than that of monolithic precast concrete specimen.
This indicated that the bond strength based on an un-roughened molded face of precast
concrete was weaker than that based on an un-roughened sawed face of precast concrete.
For specimens with the whole interface roughened, ambient dried and cleaned
before casting UHPC, the failure occurred in the precast concrete at the age of 7 days.
The difference in the bond performance on SSD precast concrete surface and on dry
precast concrete surface was not observed in this study.
For specimens with whole interface roughened, ambient dried and not cleaned
before casting UHPC, the failure occurred in a manner that part of the interface de-
bonded and part of the interface still had precast concrete bonded with UHPC. The
variance of the ultimate load was large. It was recommend that the interface should be
cleaned to achieve adequate and stable bond between UHPC and precast concrete.
The effect of ambient curing condition on the bond performance was not
significant in this study, as the ambient cured specimens failed in the precast concrete.
Partly roughened interface in the tension zone was able to achieve adequate bond
between UHPC and precast concrete. This method would greatly save the economic cost
of the substrate surface preparation.

291
CHAPTER
6 CONCLUSIONS
This chapter presents the conclusions from this study. Based on the materials,
proportions and test methods used in this study, the following conclusions are drawn:
1) The preliminary study on developing UHPC indicated that:
UHPC meeting the requirements of FHWA can be produced using locally
available materials in South Carolina. Based on the limited set of materials
evaluated in this study, it was observed that a Type III portland cement meeting
ASTM C150 specification was suitable to produce UHPC with high workability,
28-day compressive strength exceeding 150 MPa, low drying shrinkage, enhanced
durability, and reasonable cost at a very low w/cm of 0.20.
Based on the comparison of eight types of HRWRA, a powder form
polycarboxylic ester based HRWRA (such as BASF Melflux® 4930F) was
appropriate to produce highly workable fresh UHPC mixture.
Natural sand with gradation meeting ASTM C33 specification could be used to
produce UHPC mixture.
The use of SFU significantly improved the 28-day compressive strength and
reduced the chloride ion permeability of UHPC. SFU should be considered as an
essential component in the UHPC formulation.
SFL was widely used in the past studies of producing UHPC at elevated
temperature curing. However, in this study applying ambient temperature curing,
the use of SFL did not show significant effects in improving the properties of

292
UHPC, except that it improved the 1-day compressive strength. Thus, SFL was
determined to be not an essential component material required for the UHPC
formulation.
Based on the comparison of the influence of SMF and PVAMF content on the
properties of UHPC, SMF were preferred than PVAMF to produce UHPC, as the
use of SMF improved the compressive strength and post-crack tensile strength of
UHPC.
Liquid SRA was effective in reducing the drying shrinkage of UHPC. However,
liquid SRA significantly reduced the 1-day compressive strength of UHPC.
UHPC exhibited adequate bond strength with precast concrete as observed in the
three bond test methods: slant shear test, pull-off test and third point flexural test.
Third point flexural test was a reliable and convenient way of investigating the
bond between UHPC and precast concrete.
2) The studies on the effect of alkali content of cement on the properties of mortar
suggested that:
The alkali content of cement was found to have an effect on the hydration process
of cement and the workability of fresh cementitious mortar. In this study, the
alkali content was simulated by adding external alkali which might imbalance
gypsum content for proper setting behavior. A threshold alkali content of 0.70%
Na2Oeq was found, below which no significant change in the workability of
mortars was observed. When the alkali content of cement was higher than 0.70%

293
Na2Oeq, the workability of mortars significantly decreased with the increase in
alkali content. The addition of FA increased the workability due to the ball-
bearing effect, especially at high alkali content of cement. This conclusion should
be considered in the content of simulated high alkali cement.
For mortars without FA, the shortest time of initial setting was observed at alkali
content of 0.70% Na2Oeq. However, the time of final setting showed a gradual
increase with an increase in the alkali content of cement. The use of FA prolonged
both the initial and final time of setting.
There was a threshold alkali content of 0.70% Na2Oeq for mortar without FA.
When the alkali content was less than 0.70% Na2Oeq, the compressive strength of
mortars was not significantly affected by the increase in the alkali content. When
the alkali content was more than 0.70% Na2Oeq, the compressive strength of
mortars significantly decreased with increasing alkali content. The effect of alkali
content on the compressive strength of mortar existed even in the presence of FA.
The lower strength of alkali-containing C-S-H gel and poor compactibility of
mortar as alkali content increased were considered to be the reasons of the
decreased compressive strength of mortar.
The increase in the alkali content increased the drying shrinkage of mortar,
regardless of presence or absence of FA.
For mortars without FA, the rapid chloride ion permeability increased as the alkali
content of cement gradually increased from 0.49% to 0.88% Na2Oeq. For mortars
with FA, the effect of alkali content on the chloride ion permeability was not

294
evident.
The increase in the alkali content resulted in an increase in the volume of
permeable voids, which contributed to the decreased compressive strength,
increased drying shrinkage and decreased resistance to chloride ion penetration of
mortar.
The ASR induced expansion in mortar specimens increased with the alkali content
of cement. The higher the alkali content of cement used in the mortar mixture, the
earlier the occurrence of a rapid increase in ASR induced expansion. FA was
effective in depressing ASR induced expansion even at high alkali content (i.e.
0.88% Na2Oeq).
The loss in the flexural strength of mortar due to ASR distress was observed as
the alkali content of cement increased, regardless of presence or absence of FA.
However, when FA was used the loss in the flexural strength was not significant.
3) The studies on the effect of sand content on the properties of mortar suggested
that:
Increasing HRWRA dosage or decreasing sand content improved the workability
of mortar. However, HRWRA exceeding saturation dosage (i.e. 1% in this study)
did not increase the workability further.
The workability of mortar became less sensitive to the changes in the sand content
when the SFU content increased, which was revealed by the index Rs/cm.
The compressive strength of self-consolidating mortar was not significantly

295
influenced by the sand content up to a maximum sand content, depending on the
dosage of SFU and HRWRA. In this study, with HRWRA at saturation dosage
(1%), the maximum sand content for self-consolidating mortar without SFU was
able to go up to s/cm=1.6, and the maximum sand content for self-consolidating
mortar with SFU content at 10% and 20% was able to go up to s/cm=1.6 and
s/cm=2, respectively.
Decrease in the chloride permeability and drying shrinkage of mortar were
observed as the sand content increased, which was attributed to the reduced
volume of paste.
4) The studies on the effect of supplementary cementitious materials including silica
fume, fly ash and meta-kaolin on the properties of paste suggested that:
The time of conversion from dry mixture to fluid mixture was found to increase
with increasing dosage level of MK or SFU in the paste formulation when MK or
SFU was used alone as SCM. The use of UFA or FA alone as SCM in paste did
not significantly affect the time of conversion.
The workability of paste, as measured by flow, decreased with the increase in the
MK content or SFU content of the paste when MK or SFU was used alone as
SCM. The use of UFA or FA alone as SCM in paste did not significantly affect the
workability of paste.
The use of SFU alone as SCM resulted in a decrease in the autogenous shrinkage
of paste. However, the use of MK alone as SCM resulted in an increase in the
296
autogenous shrinkage of paste. The use of UFA alone as SCM did not have
significant effect on the autogenous shrinkage of paste.
The 1-day compressive strength of paste slightly decreased with the increase in
the SFU content. The increase in the MK content resulted in significant increase
in the 1-day compressive strength of paste, which was attributed to the improved
early age hydration of cement in the presence of MK. The increase in the UFA or
FA content resulted in significant decrease in the 1-day compressive strength of
paste, which was attributed to the dominance of dilution effect of UFA or FA and
the relative dormancy of UFA or FA in terms of its pozzolanic reactivity at early
ages.
Among all the paste mixtures investigated, the highest 28-day compressive
strength of 152 MPa was achieved by using SFU at an optimal content of
SCM/c=0.2. The dense packing of the component materials in paste due to the
micro filler effect and pozzolanic effect of SFU were considered the reasons. The
increase in the MK content had no significant effect on the 28-day compressive
strength of paste. However, the increase in the UFA or FA content up to
SCM/c=0.2 resulted in an increase in the 28-day compressive strength of paste,
which was attributed to the later-age pozzolanic effect of UFA or FA, as more
Ca(OH)2 was produced at later ages.
The drying shrinkage of paste increased with the increase in the SFU content or
the FA content when SFU or UFA/FA was used alone as SCM. However, the
increase in the MK content significantly reduced the drying shrinkage of paste

297
when MK was used alone as SCM.
The combined use of MK and UFA/FA as SCM in paste could address the
reduction in the 1-day compressive strength and increase in the drying shrinkage
due to the use of FA alone as SCM in the paste, and also address the reduction in
the workability and increase in the mixing time due to the use of MK alone as
SCM in the paste.
Proportions of MK and UFA/FA that improved the early age cement hydration
increased the 1-day compressive strength of paste; however, the 28-day
compressive strength of paste did not follow significant correlation with the
degree of cement hydration. Moreover, proportions of MK and UFA/FA that
reduced the volume of permeable voids of hardened paste resulted in decrease in
the drying shrinkage of paste as a dense microstructure of paste reduced the loss
of moisture from within the hardened paste into the external environment.
At equivalent SCM contents, particularly high SCM content in the range of 30 to
40% by mass of cement, the combined use of MK and UFA/FA in a ternary blend
could produce paste with performance as well as or even better than the use of
SFU alone as SCM, from the consideration of workability, compressive strength
and drying shrinkage behavior of paste.
The workability, 1-day compressive strength, 28-day compressive strength and
25-day drying shrinkage of paste containing MK and UFA could be predicted and
optimized following a multi-goal optimization process (desirability functions).
The optimal MK content and UFA content were determined to be MK/c=13.6%

298
and UFA/c=11.6%, respectively, at which a balance among workability,
compressive strength, drying shrinkage and High SCM content was achieved.
5) The studies on the combined effect of sand and SMF on the properties of mortar
suggested that:
With SMF content up to VSMF/VT=0.03, a minimum sand content at s/cm=1.25
was required to prevent severe segregation of SMF.
The increase in the sand content or SMF content resulted in a decrease in the
workability of mortar.
The increase in the sand content or SMF content did not result in noticeable
changes in the 1-day compressive strength of mortar. The influence of sand
content on the 28-day compressive strength of mortar was not significant. The
increase in the SMF content caused a slight increase in the 28-day compressive
strength of mortar.
The increase in the sand content or SMF content did not result in noticeable
changes in the 28-day first-crack flexural strength of mortar. However, the
increase in the SMF content caused a slight increase in the 28-day post-crack
flexural strength of mortar. This was attributed to the fact that SMF were effective
in improving the flexural strength of mortar only after crack occurred.
The increase in the sand content or increase in the SMF content resulted in a
decrease in the drying shrinkage at the period of exposure at 25 days. The reduced

299
volume of cement paste and restrained shrinking of cement pastes by sand
particles and SMF were considered the reasons.
The increase in the sand content or decrease in the SMF content resulted in an
increase in the bulk electrical resistivity of mortar. This was due to the facts that
sand was less conductive than cement paste, and SMF is more conductive than
cement paste. Bulk electrical resistivity test on hardened mortar could be used to
identify the severe segregation of SMF.
In a well compacted high strength mortar, the main effect of increasing sand
content or SMF content was to reduce the volume of cement paste, which was
beneficial in reducing the chloride ion permeability of mortar. The cement paste at
the vicinity of sand particles and SMF was not visually different from the paste
farther away, which indicated insignificant interfacial transition zone (ITZ) for
high strength mortar. A strong correlation between RCP test results and the
resistance of the specimens was observed. If the chloride ion permeability of SMF
reinforced mortar was evaluated with RCP method, significant Joule’s effect
would falsely indicate increased chloride ion permeability as the SMF content
increased.
The workability, 28-day compressive strength, flexural strength, and 25-day
drying shrinkage of mortar could be well predicted simply based on the sand
content by volume and SMF content by volume.

300
6) The studies on the development of UHPC using different blends of SCMs
indicated that:
Several UHPC mixtures with 28-day compressive strength higher than 150 MPa
were prepared.
The workability of UHPC mixture containing SFU was generally lower than that
of mixture containing MK and UFA. The 1-day and 28-day compressive strength
and 25-day drying shrinkage of UHPC mixture containing SFU was generally
higher than that of mixture containing MK and UFA.
The first-crack flexural strength and post-crack flexural strength of the UHPC
mixtures were high. The first-crack flexural strength of the UHPC mixtures
ranged from 17 MPa to 21 MPa, and the post-crack flexural strength of the UHPC
mixtures ranged from 29 MPa to 42 MPa.
UHPC mixtures containing SFU exhibited lower charge passed that mixtures
containing MK and UFA. Likely, SFU was more effective in decreasing the
chloride permeability of the hardened mixture than MK or UFA. According to the
classification described in ASTM C1202, all the mixtures, except CUFA and
CMUF1, were classified as very low permeable mixtures. Mixtures CUFA and
CMUF1 were classified as low permeable mixtures.
The use of SMF significantly improved the 28-day compressive strength of
UHPC containing SFU, but not significant in UHPC containing MK and UFA. It
appeared that SFU improved the bond between SMF and paste better than MK or
UFA.

301
7) The studies on the effect of four types of chemical admixtures (powder
SRA, liquid VMA, liquid SRA and liquid accelerator) on the properties of UHPC and
indicated that:
Powder form SRA and VMA did not exhibit beneficial effects in improving the
properties of paste, except their effect in reducing the drying shrinkage. Liquid
form SRA was effective in reducing the drying shrinkage of paste, but it caused
prolonged setting time and significant reduction in the 1-day compressive strength.
Accelerator improved the 1-day compressive strength, but it caused a reduction in
the workability of paste.
The 28-day compressive strength, 28-day first-crack flexural strength and RCP of
UHPC were not affected by the use of accelerator or liquid SRA significantly.
However, the 28-day post-crack flexural strength of UHPC was observed to
decrease as the accelerator dosage increased
The combined use of accelerator and liquid SRA could compensate the
significantly prolonged setting, reduced 1-day compressive strength of paste due
to the use of liquid SRA, and compensate the reduced workability of paste due to
the use of accelerator.
UHPC with low drying shrinkage and without 1-day compressive strength being
significantly reduced was possible by combined use of liquid SRA and accelerator.
8) The studies on the bond performance between UHPC and precast concrete
indicated that:

302
Compared with previous bond test using the slant shear test and pull-off test, third
point flexural bond test was an easy test to be used to investigate the bond
behavior between UHPC and precast concrete. It was also a reliable test method
as the results were consistent.
The increase in the sandblasting duration resulted in an increase in the roughness
of the surface, which could be quantified by both sand spread test and laser
profiling.
Adequate bond behavior between UHPC and precast concrete was achieved with
the substrate surface roughened, saturated and cleaned before applying UHPC.
Roughening duration as low as 10 seconds on the substrate surface (originally
sawed or molded) was long enough to achieve a surface roughness for adequate
bond between UHPC and precast concrete. The flexural bond specimens with no
surface roughened failed at the bond between UHPC and precast concrete. The
bond strength based on an un-roughened molded face of precast concrete was
weaker than that based on an un-roughened sawed face of precast concrete.
The difference in the bond performance on saturated surface dry precast concrete
surface and on ambient dry precast concrete surface was not observed in this
study.
The substrate surface should be cleaned to achieve adequate and stable bond
between UHPC and precast concrete, as specimens with the substrate surface
roughened, ambient dried and not cleaned before applying UHPC failed in a
manner that involved part of the substrate surface de-bonded and part of the
303
interface still had precast concrete bonded with UHPC. The variance of the
ultimate load was large.
The effect of the ambient curing condition on the bond performance was not
significant in this study, as the ambient cured specimens failed in the precast
concrete.
Partly roughened interface in the tension zone was found to be adequate to
achieve desirable bond between UHPC and precast concrete. This method would
greatly save the economic cost of the substrate surface preparation.
In general, UHPC mixtures with desired material and structural properties could
be produced using locally available materials. The difficulties of producing UHPC were
recognized by noticing that the characteristics of raw materials and their proportions had
significant influence on the material properties of UHPC mixture. Moreover, the
characteristics of the substrate surface condition had critical influence on the bond
performance between UHPC and precast concrete which is important for UHPC’s
successful application in shear keys of precast bridges. Thus, a guidance on the raw
materials’ selection and proportioning of UHPC mixtures and a guidance on the substrate
surface preparation to guarantee the adequate bond between UHPC and precast concrete
are provided in this dissertation (Appendix A). These guidelines should be followed in
order to prepare a quality UHPC mixture and successfully apply UHPC in structural
applications.

304
APPENDICES
305
APPENDIX A: GUIDANCE ON RAW MATERIALS’ SELECTION AND
PROPORTIONING OF UHPC MIXTURES FOR APPLICATION IN SHEAR KEYS
This appendix provides guidance on materials’ selection and proportioning of
UHPC mixtures for the application in shear keys in precast bridge construction, based on
the research conducted in this study, as well as findings from literature review.
A.1 Guidance on Selecting Raw Materials for Producing UHPC
A.1.1 Cementitious materials
A.1.1.1 Portland cement
Research reported in previous literature had used Type I/II and III cement meeting
ASTM C150 specification requirements to produce UHPC [7]. A combined C2S + C3S
composition greater than 65% in cement was recommended for developing UHPC [7, 8],
and C3A content of less than 8% by mass of cement had been found to have limited
impact on the workability of fresh concrete [13]. It was recommended that Type I/II
cement performed better than Type III cement in developing UHPC from a consideration
of 28-day compressive strength [7]. However, for applications where high early age
strength of UHPC was required, such as accelerated precast bridge construction, Type III
portland cement should be used to produce UHPC.
The results in this study showed that the alkali content of cement had significant
influence on the workability, setting time, compressive strength, drying shrinkage and
ASR expansion of UHPC. To limit the detrimental influence of increasing alkali content
306
of cement on the fresh and hardened state properties of UHPC, the alkali content of the
Type III portland cement should be less than 0.7% Na2Oeq.
A.1.1.2 Supplementary cementitious materials (SCM)
Based on the research reported in previous literature and the results shown in this
study, un-densified low carbon content silica fume was the most effective SCM among
fly ash and meta-kaolin in improving the mechanical and durability of UHPC due to its
micro filler effect and high pozzolanic reactivity [7]. Un-densified low carbon content
silica fume should be used in the formulation to achieve the desired properties of UHPC.
If the un-densified low carbon content silica fume is not available, the combined
used of ultrafine class F fly ash and meta-kaolin as SCM is recommended. This is based
on the results in this study that combined use of ultrafine class F fly ash and meta-kaolin
addressed the reduction in the 1-day compressive strength and increase in the drying
shrinkage due to the use of ultrafine class F fly ash alone as SCM, and addressed the
reduction in the workability and increase in mixing time due to the use of meta-kaolin
alone as SCM. It should be noted that under the same mixture proportions the paste
fraction of UHPC using ultrafine class F fly ash had about 5% higher 28-day compressive
strength than the paste fraction of UHPC using regular particle size class F fly ash. This
is the reason that ultrafine class F fly ash is preferred than regular particle size class F fly
ash in the UHPC formulation.
A.1.2 Chemical admixtures
In this study, a poly-carboxylate ester/ether-based HRWRA such as BASF
Melflux® 4930F was found to be adequate to produce highly workable fresh UHPC

307
mixture, maintain high workability for at least two hours, and cause no false setting of
UHPC. A liquid form shrinkage reducing admixture (SRA) such as BASF Masterlife®
SRA20 was found to be adequate to reduce both the autogenous shrinkage and drying
shrinkage of UHPC. If the UHPC material is required to have high early age strength, the
liquid form SRA should be used together with a chemical accelerator, such as Chryso
Turbocast® 650A.
A.1.3 Fine aggregate
Fine aggregate replaces the volume of paste, reduces the economic cost, and
prevents the severe segregation of steel micro-fibers in fresh UHPC mixture. A natural
siliceous sand meeting ASTM C33 specification requirements is suitable to be the fine
aggregate used in UHPC materials. The gradation of the natural sand does not have
significant effect on the properties of UHPC, as long as the gradation meets the ASTM
C33 specification requirements. Chemically reactive sand is not recommended
considering the potential ASR distress in the UHPC mixture.
A.1.4 Reinforcing fibers
Reinforcing fibers should be used to improve the compressive strength and post-
crack tensile strength of UHPC. Steel micro-fibers (SMF) are preferred than Polyvinyl
Alcohol micro-fibers (PVAMF), from the considerations of workability, compressive
strength and drying shrinkage of UHPC. The SMF used in this study were straight fibers
with length of 13 mm and diameter of 0.20 mm.

308
A.2 Guidance on Mixture Proportions for Producing UHPC
A.2.1 Water-to-cementitious materials ratio
A low water-to-cementitious materials (w/cm) ratio is critical to achieve the
desired properties of UHPC. Based on the results in this study using w/cm at 0.20, 0.225
and 0.25, a w/cm by mass at maximum of 0.20 should be used to achieve the required
mechanical properties and durability of UHPC.
A.2.2 HRWRA dosage
The saturation dosage of HRWRA should be determined based on the component
materials and proportions used for developing UHPC. In this study, the saturation dosage
of HRWRA is 1% by mass of the cementitious materials. HRWRA is recommended to be
dosed at the saturation dosage in the mixture proportion, from the consideration of
achieving good workability of fresh mixture and incorporating the maximum fine
aggregate/sand content in the UHPC mixture. HRWRA dosage higher than the saturation
dosage does not achieve a further increase in the workability.
A.2.3 Supplementary cementitious materials content
Supplementary cementitious materials (SCM) content is expressed as the SCM-
to-cement (SCM/c) ratio by mass.
If un-densified low carbon content silica fume (SFU) is available, it is
recommended to be dosed at SFU/c=20% to achieve superior mechanical properties and
durability of UHPC.

309
If the un-densified low carbon content silica fume is not available, it is
recommended to use the ternary blend of meta-kaolin (MK), ultrafine class F fly ash
(UFA) and cement. Two proportions of MK and UFA are recommended as follows: first,
MK/c=5% and UFA/c=25% to achieve high 28-day compressive strength of the paste
fraction of UHPC; second, MK/c=13.6% and UFA/c=11.6% to achieve a balance among
the workability, 1-day compressive strength, 28-day compressive strength, 25-day drying
shrinkage and high SCM content of the paste fraction of UHPC.
A.2.4 Steel micro-fibers content
Steel micro-fibers (SMF) content is expressed as the volume ratio of SMF to the
total mixture.
The SMF content is recommended to be at 2% by volume of the total mixture.
Lower SMF content than 2% does not have significant effect in improving the
compressive strength of UHPC. Higher SMF content than 2% significantly decreases the
workability and increases the economic cost of UHPC.
A.2.5 Fine aggregate/sand content
Sand content is expressed as the sand-cementitious materials (s/cm) ratio by mass.
In mortar mixtures where SMF are not included, the sand content should be
maximized based on the considerations of maintaining self-consolidating consistency,
limiting the loss in compressive strength, reducing drying shrinkage and decreasing the
economic cost of mortar. Based on this study, with HRWRA dosed at saturation dosage
(1%), the maximum sand content for self-consolidating mortar without SFU was able to

310
go up to s/cm=1.6, and the maximum sand content for self-consolidating mortar with
SFU content at 10% and 20% was able to go up to s/cm=1.6 and s/cm=2, respectively.
In UHPC mixtures where SMF are included, a minimum sand content is required
to prevent the severe segregation of SMF. Based on this study, with HRWRA at
saturation dosage (1%), a minimum sand content of s/cm=1.25 was required to prevent
severe segregation of SMF dosed from 1% to 3% by volume of the total UHPC mixture.
If the sand content is used at s/cm=1.6 by mass, and the SMF content is at 2% by volume,
external vibration is required during casting fresh UHPC. Thus, sand content higher than
s/cm=1.6 is not recommended.
A.2.6 Shrinkage reducing admixtures and chemical accelerators contents
The shrinkage reducing admixture (SRA) and chemical accelerator are dosed
based on the mass of cementitious materials in UHPC.
SRA content at 2% by mass of cementitious materials is recommended to reduce
the autogenous shrinkage and drying shrinkage of UHPC efficiently. If the UHPC is
required to have high early age strength, SRA content at 2% and chemical accelerator
content at 2% by mass of cementitious materials should be used together. Mixing water
in the UHPC is recommended to be adjusted considering the water presented in the SRA
and chemical accelerator.

311
A.3 Guidance on surface preparation of the substrate precast concrete
The surface of the substrate precast concrete should be well prepared to achieve
adequate bond between UHPC and precast concrete. The preparation steps include
surface roughening, surface cleaning and surface saturating. Surface roughening is more
critical than other steps.
The substrate surface should be well roughened, cleaned and water-saturated.
Based on this study, 10 seconds of sandblasting on a 56 cm2 substrate surface was good
enough to achieve adequate bond. The surface roughness thus prepared was evaluated by
a sand spread value ranging from 510% to 540%, and by a laser profiling roughness
index Sa ranging from 21.4 μm to 33.1 μm. After sandblasting, the surface should be
cleaned. Compressed air nozzle cleaning was proved to be effective. After cleaning, the
surface should be prepared to a saturated surface dry condition before casting UHPC.
It is also recommended that partly roughened surface by sandblasting in the
tension zone is eligible to achieve adequate bond between UHPC and precast concrete.
This method greatly saves the economic cost of the substrate preparation. Based on this
study, a quarter of the depth of the section (half of the depth in tension) prepared
following the procedures described above was good enough to achieve an adequate bond
between UHPC and precast concrete.

312
APPENDIX B: EXPERIMENTAL DATA
This appendix includes the experimental data presented in chapter 5.
Table B.1 Influence of liquid form HRWRA -flow and compressive strength data for
Figures 5.1a and 5.1c
HRWRA
ID
HRWRA Flow Flow 3-day compressive strength
% inch % MPa
SP1 0.0 4.00 0 78
0.3 4.00 0
0.5 4.00 0
0.8 5.88 47
1.3 7.50 88
SP2 0.0 4.00 0 92
0.2 4.00 0
0.3 4.50 13
0.5 5.50 38
0.6 7.25 81
0.8 10.00 150
SP3 0.0 4.00 0 70
0.2 4.00 0
0.4 4.00 0
0.6 4.00 0
0.7 4.50 13
0.8 5.00 25
1.0 5.83 46
SP4 0.0 4.00 0
0.5 4.00 0
0.6 5.00 25
0.8 7.37 84
0.9 7.92 98
1.2 8.29 107
SP5 0.0 4.00 0 90
0.2 5.83 46
0.4 7.75 94
0.6 10.00 150

313
Table B.2 Comparison of liquid form HRWRAs and powder form HRWRAs - flow and
compressive strength data for Figures 5.1b and 5.1d
HRWRA ID Flow (%) 3-day compressive strength (MPa)
SP6 29 78
SP7 25 60
SP8 84 78
SP5 54 78
Table B.3 Comparison of natural siliceous sand and Ottawa sand -flow data for Figure
5.2a
Mixture
ID
Superplasticizer dosage Flow Flow
% inch %
NS natural
0.0 4.00 0
0.2 4.00 0
0.4 5.13 28
0.6 7.83 96
0.8 10.00 150
NS2
0.0 4.00 0
0.2 4.00 0
0.4 5.54 39
0.6 6.04 51
0.8 7.46 86
1.0 10.00 150
NS1
0.0 4.00 0
0.2 4.00 0
0.4 5.64 41
0.6 6.92 73
0.9 10.00 150
OS1
0.0 4.00 0
0.2 6.50 63
0.4 9.50 138
0.5 10.00 150
OS2
0.0 4.00 0
0.2 5.83 46
0.4 7.75 94
0.6 10.00 150

314
Table B.4 Comparison of natural siliceous sand and Ottawa sand –compressive strength
data for Figure 5.2b
Mixture ID 3-day compressive strength (MPa) 28-day compressive strength (MPa)
NS natural 67 82
NS 2 72 90
NS 1 61 82
OS 2 85 100
OS 1 61 89
Table B.5 Influence of gradation of natural siliceous sand -flow and compressive strength
data for Figures 5.3a and 5.3b
Mixture ID Flow (%) 28-day compressive strength (MPa)
NS Coarse 169 111
NS Natural 163 109
NS Fine 150 106
Table B.6 Influence of gradation of natural siliceous sand –drying shrinkage data for
Figure 5.3c (Unit: %)
Mixture ID Period of exposure(days)
0 1 4 11 18 25 56 87 117 147 177
NS Coarse 0 -0.0137 -0.0267 -0.0363 -0.0410 -0.0433 -0.0520 -0.0537 -0.0550 -0.0547 -0.0550
NS Natural 0 -0.0245 -0.0345 -0.0415 -0.0445 -0.0475 -0.0495 -0.0520 -0.0520 -0.0520 -0.0525
NS Fine 0 -0.0127 -0.0260 -0.0350 -0.0400 -0.0413 -0.0497 -0.0507 -0.0537 -0.0543 -0.0540
Table B.7 Influence of SFU and SFL - compressive strength data for Figure 5.4
Mixture ID 1-day compressive strength
(MPa)
28-day compressive strength
(MPa)
C-0.225 45 85
SFU-10%
(SFL1-0%) 43 99
SFU-20% 47 101
SFU-30% 43 95
SFL1-10% 44 102
SFL1-20% 53 97
SFL1-30% 61 90
SFL2-20% 51 83
SFL3-20% 43 80

315
Table B.8 Influence of SFU and SFL - TGA and LOI data for Figure 5.5
Mixture ID
Ca(OH)2 (%) Bound water (%)
1-day 28-day 1-day 28-day
SFL1-0% 1.03 2.72 6.56 9.85
SFL1-10% 1.01 2.70 6.97 9.73
SFL1-30% 1.71 2.05 7.24 9.47
Table B.9 Comparison of SMF and PVAMF - flow and compressive strength data for
Figure 5.11
Mixture ID Flow(%) Compressive strength (MPa)
1-day 7-day 28-day
Control 216.9 81 106 125
1% PVA 175.0 73 102 112
2% PVA 87.5 67 98 104
1% SMF 193.8 73 115 125
2% SMF 178.1 68 118 132
Table B.10 Comparison of SMF and PVAMF - drying shrinkage data for Figure 5.11c
(Unit: %)
Mixture ID Period of exposure(days)
0 1 4 11 18 25
Control 0.0000 -0.0260 -0.0453 -0.0553 -0.0580 -0.0630
1% PVA 0.0000 -0.0260 -0.0386 -0.0486 -0.0549 -0.0573
2% PVA 0.0000 -0.0243 -0.0370 -0.0493 -0.0563 -0.0569
1% SMF 0.0000 -0.0230 -0.0427 -0.0510 -0.0570 -0.0613
2% SMF 0.0000 -0.0270 -0.0343 -0.0440 -0.0507 -0.0530
Table B.11 Preliminary development of UHPC – compressive strength, tensile strength,
flexural strength, MOE and RCP data for Figures from 5.12 to 5.15
Mixtur
e ID
Compressive strength (MPa) Splitting tensile
strength (MPa)
Flexural
strength (MPa)
MOE
(MPa)
RCP
(Coulomb) 1-day 3-day 7-day 28-day
C 79.0 82.7 90.4 104.4 7.9 14.1 49079.8 571.7
SU2 46.0 82.1 87.5 123.5 8.9 13.9 53468.5 63.7
SU2F 109.7 124.3 127.7 158.3 19.0 32.1 52455.0 961.0
SU2S 57.5 102.2 123.6 158.7 19.2 25.5 50119.9 193.0

316
Table B.12 Preliminary development of UHPC – drying shrinkage data for Figure 5.16
(Unit: %)
Mixture ID Period of exposure(days)
0 1 4 11 18 25 56 87 117 147 177
C 0 -0.028 -0.048 -0.061 -0.068 -0.076 -0.085 -0.085 -0.086 -0.090 -0.093
SU2 0 -0.020 -0.032 -0.044 -0.045 -0.051 -0.061 -0.068 -0.073 -0.070 -0.071
SU2F 0 -0.017 -0.027 -0.032 -0.042 -0.043 -0.048 -0.062 -0.063 -0.063 -0.063
SU2S 0 -0.017 -0.026 -0.029 -0.030 -0.036 -0.045 -0.054 -0.054 -0.058 -0.056
Table B.13 Influence of alkali content- flow, setting time and compressive strength data
for Figures 5.19 and 5.20
HPCM Flow
(%)
Initial set
(min)
Final set
(min)
7-day compressive
strength (MPa)
28-day compressive
strength (MPa)
C 175.0 284 398 103 110
A1 181.3 247 430 105 110
A2 193.8 219 453 98 103
A3 100.0 262 460 79 87
A4 50.0 290 543 74 78
CF 200.0 359 460 95 100
A4F 175.0 413 525 63 72
A3a 162.5 -- -- 95 98
A4a 156.3 -- -- 79 91
Table B.14 Influence of alkali content- drying shrinkage data for Figure 5.21 (Unit: %)
HPCM Period of exposure(days)
0 1 4 11 18 25 56 87 117
C 0 -0.027 -0.047 -0.059 -0.068 -0.073 -0.075 -0.078 -0.079
A1 0 -0.028 -0.049 -0.063 -0.069 -0.077 -0.078 -0.081 -0.080
A2 0 -0.029 -0.057 -0.071 -0.077 -0.079 -0.082 -0.085 -0.086
A3 0 -0.030 -0.057 -0.072 -0.079 -0.082 -0.083 -0.087 -0.087
A4 0 -0.028 -0.056 -0.071 -0.078 -0.083 -0.085 -0.089 -0.089
CF 0 -0.031 -0.049 -0.064 -0.068 -0.069 -0.072 -0.076 -0.077
A4F 0 -0.036 -0.061 -0.079 -0.084 -0.086 -0.090 -0.092 -0.094
A3a 0 -0.036 -0.058 -0.076 -0.082 -0.083 -0.091 -0.094 -0.095
A4a 0 -0.042 -0.070 -0.092 -0.100 -0.101 -0.107 -0.109 -0.110
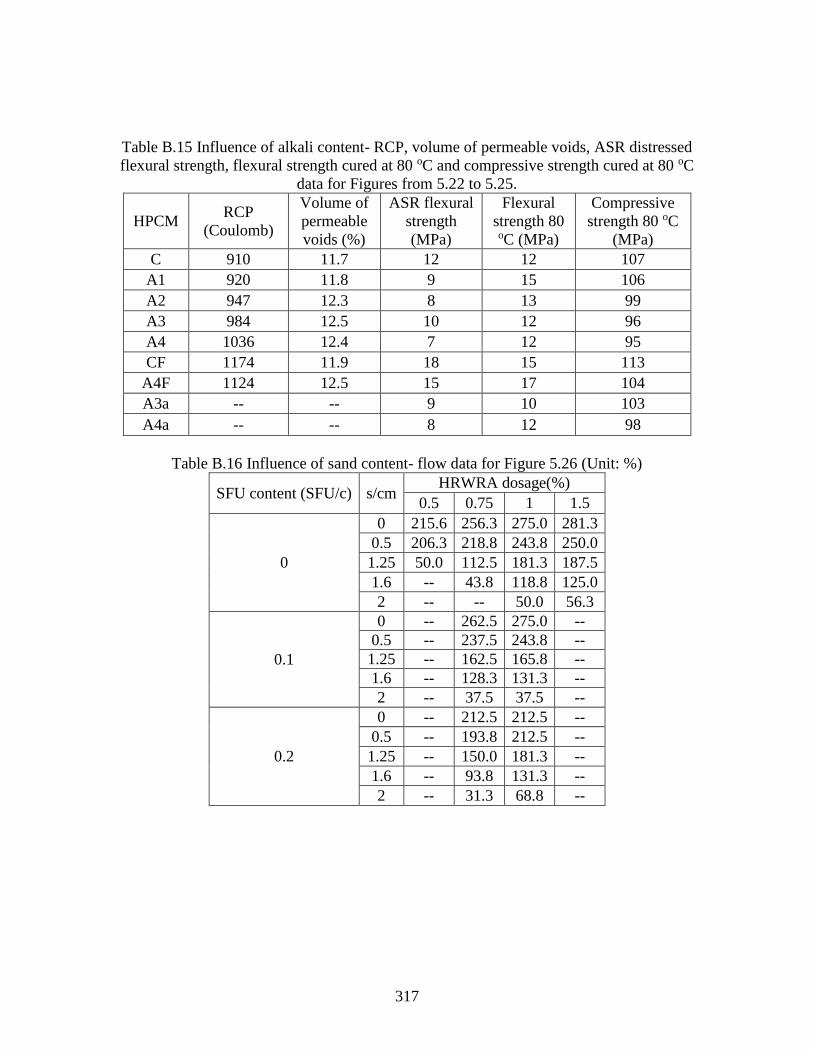
317
Table B.15 Influence of alkali content- RCP, volume of permeable voids, ASR distressed
flexural strength, flexural strength cured at 80 oC and compressive strength cured at 80 oC
data for Figures from 5.22 to 5.25.
HPCM RCP
(Coulomb)
Volume of
permeable
voids (%)
ASR flexural
strength
(MPa)
Flexural
strength 80 oC (MPa)
Compressive
strength 80 oC
(MPa)
C 910 11.7 12 12 107
A1 920 11.8 9 15 106
A2 947 12.3 8 13 99
A3 984 12.5 10 12 96
A4 1036 12.4 7 12 95
CF 1174 11.9 18 15 113
A4F 1124 12.5 15 17 104
A3a -- -- 9 10 103
A4a -- -- 8 12 98
Table B.16 Influence of sand content- flow data for Figure 5.26 (Unit: %)
SFU content (SFU/c) s/cm HRWRA dosage(%)
0.5 0.75 1 1.5
0
0 215.6 256.3 275.0 281.3
0.5 206.3 218.8 243.8 250.0
1.25 50.0 112.5 181.3 187.5
1.6 -- 43.8 118.8 125.0
2 -- -- 50.0 56.3
0.1
0 -- 262.5 275.0 --
0.5 -- 237.5 243.8 --
1.25 -- 162.5 165.8 --
1.6 -- 128.3 131.3 --
2 -- 37.5 37.5 --
0.2
0 -- 212.5 212.5 --
0.5 -- 193.8 212.5 --
1.25 -- 150.0 181.3 --
1.6 -- 93.8 131.3 --
2 -- 31.3 68.8 --

318
Table B.17 Influence of sand content - 1-day compressive strength data for Figures 5.28
and 5.29 (Unit: MPa)
SFU content (SFU/c) s/cm HRWRA dosage(%)
0.5 0.75 1 1.5
0 95 86 84 62
0.5 96 81 68 58
0 1.25 83 82 68 70
1.6 -- 84 76 67
2 -- -- 78 72
0 -- 53 63 --
0.5 -- 67 61 --
0.1 1.25 -- 64 59 --
1.6 -- 75 60 --
2 -- 68 51 --
0 -- 67 66 --
0.5 -- 62 64 --
0.2 1.25 -- 70 66 --
1.6 -- 72 64 --
2 -- 68 61 --

319
Table B.18 Influence of sand content - 28-day compressive strength data for Figures 5.28
and 5.29 (Unit: %)
SFU content (SFU/c) s/cm HRWRA dosage(%)
0.5 0.75 1 1.5
0 125 115 112 99
0.5 121 128 121 93
0 1.25 116 109 106 102
1.6 -- 111 109 110
2 -- -- 104 95
0 -- 122 115 --
0.5 -- 118 106 --
0.1 1.25 -- 116 131 --
1.6 -- 103 106 --
2 -- 105 109 --
0 -- 120 114 --
0.5 -- 114 123 --
0.2 1.25 -- 105 120 --
1.6 -- 91 112 --
2 -- 96 102 --
Table B.19 Influence of sand content - RCP and drying shrinkage data for Figures 5.30
and 5.31
s/cm Charge passed (Coulomb) Drying shrinkage (%)
0 4202 -0.1760
0.5 1551 -0.0995
1.25 985 -0.0610
1.6 833 -0.0495
2 805 -0.0435
Table B.20 Influence of sand content – drying shrinkage data for Figure 5.31 (Unit: %)
s/cm Period of exposure (days)
0 1 4 11 18 25 56 87
0 0 -0.055 -0.103 -0.143 -0.155 -0.164 -0.176 -0.175
0.5 0 -0.039 -0.065 -0.084 -0.094 -0.098 -0.099 -0.102
1.25 0 -0.023 -0.039 -0.051 -0.056 -0.059 -0.061 -0.061
1.6 0 -0.024 -0.035 -0.042 -0.045 -0.048 -0.050 -0.052
2 0 -0.018 -0.030 -0.037 -0.038 -0.041 -0.044 -0.043

320
Table B.21 Influence of SCMs – workability, compressive strength, bound water content,
volume of permeable voids and drying shrinkage data for Figures 5.32, 5.35, and Figures
from 5.37 to 5.49
Mixture
ID
1-day
compressive
strength
(MPa)
28-day
compressive
strength
(MPa)
Flow (%)
1-day
bound
water (%)
28-day
bound
water (%)
Volume of
permeable
void (%)
Drying
shrinkage
(%)
C 77 135 287.5 7.672 11.065 22.6 -0.1490
F1 56 148 303.3 7.200 11.979 23.6 -0.1730
F2 27 151 300.0 5.807 12.996 24.9 -0.1850
F3 7 117 306.3 4.612 13.217 24.3 -0.1770
M1 88 126 281.3 8.525 10.040 21.7 -0.1277
M2 91 144 246.9 9.456 10.120 18.3 -0.1107
M3 106 134 181.3 9.702 10.472 13.4 -0.0853
S1 69 140 268.8 8.113 10.248 17.3 -0.1845
S2 72 152 237.5 9.148 10.698 14.9 -0.1820
S3 58 119 175.0 9.196 11.330 16.2 -0.1680
S4 55 87 75.0 9.048 11.434 17.1 -0.1573
UF1 52 150 300.0 6.633 11.229 23.0 -0.1653
UF2 26 148 287.5 5.855 12.094 23.8 -0.1787
UF3 8 124 275.0 2.711 12.563 23.7 -0.1870
MUF1 75 133 275.0 6.389 9.373 20.3 -0.1393
MUF2 61 145 268.8 6.511 10.511 19.7 -0.1557
MUF3 59 145 239.0 6.673 10.353 16.2 -0.1490
MUF4 38 150 257.8 5.227 11.553 21.4 -0.1570
MUF5 32 136 239.0 6.425 11.949 17.2 -0.1407
MUF6 62 139 187.5 7.737 11.241 12.8 -0.1180
MUF7 30 118 234.4 6.786 12.637 18.5 -0.1423
MUF8 65 135 193.8 8.282 11.858 13.9 -0.1103
MF1 70 127 275.0 7.027 10.179 21.5 -0.1320
MF2 55 136 275.0 6.534 11.348 21.1 -0.1467
MF3 63 136 253.1 6.574 11.073 16.6 -0.1390
MF4 50 137 287.5 6.484 12.446 22.2 -0.1463
MF5 47 135 258.5 6.742 12.017 19.2 -0.1383
MF6 66 137 187.5 7.870 11.519 13.3 -0.1007
MF7 45 148 256.3 7.225 13.436 18.7 -0.1247
MF8 57 131 196.9 7.561 12.618 14.2 -0.1003

321
Table B.22 Influence of SCMs – setting time data for Figure 5.33
Mixture ID Initial set (min) Final set (min)
C 739 910
S1 825 925
S2 650 765
F1 870 1020
F2 993 1110
M2 520 725
M3 277 410
Table B.23 Influence of SCMs – autogenous shrinkage data for Figure 5.34 (Unit: %)
Mixture
ID
Reading time (hours)
0 1 3 12 24 48 168
C 0 -0.0696 -0.1007 -0.1456 -0.1571 -0.1637 -0.1820
M2 0 -0.0532 -0.0936 -0.1741 -0.1876 -0.2058 -0.2387
M3 0 -0.0396 -0.1678 -0.2167 -0.2358 -0.2595 -0.2790
S1 0 -0.0433 -0.0797 -0.1029 -0.1255 -0.1407 -0.1592
S2 0 -0.0258 -0.0369 -0.0701 -0.0860 -0.1042 -0.1298
UF1 0 -0.0354 -0.1146 -0.1611 -0.1888 -0.2049 -0.2153
UF2 0 -0.0487 -0.1238 -0.1439 -0.1655 -0.1761 -0.1897
Table B.24 Influence of SCMs – drying shrinkage development data for Figure 5.36
(Unit: %)
Mixture ID Period of exposure(days)
0 1 4 11 18 25
C 0 -0.046 -0.091 -0.130 -0.146 -0.149
S1 0 -0.05 -0.100 -0.152 -0.180 -0.185
S2 0 -0.05 -0.099 -0.150 -0.177 -0.182
F1 0 -0.06 -0.113 -0.156 -0.164 -0.165
F2 0 -0.06 -0.126 -0.174 -0.179 -0.179
M2 0 -0.06 -0.086 -0.097 -0.106 -0.111
M3 0 -0.05 -0.067 -0.074 -0.081 -0.085

322
Table B.25 Combined influence of sand content and SMF content – workability,
compressive strength, flexural strength and drying shrinkage data for Figures from 5.50
to 5.54
Mortar
ID
Flow
(%)
1-day
compressive
strength
(MPa)
28-day
compressive
strength (MPa)
First
crack
flexural
strength
(MPa)
Post crack
flexural
strength
(MPa)
25-day
Drying
shrinkage
(%)
M00 288 77 135 16.9 -- -0.1490
M01 269 73 128 17.7 -- -0.0993
M02 217 81 125 19.1 -- -0.0630
M03 163 77 121 18.8 -- -0.0527
M12 194 73 125 20.8 27.3 -0.0613
M13 156 68 121 21.7 30.3 -0.0490
M22 178 68 132 20.3 43.0 -0.0530
M23 75 86 122 19.9 40.3 -0.0420
M32 122 84 137 20.6 48.3 -0.0447
M33 13 79 142 21.8 52.8 -0.0410
Table B.26 Influence of chemical admixtures – paste data for Figures from 5.58 to 5.59
Flow (%)
1-day
compressiv
e strength
(MPa)
28-day
compressiv
e strength
(MPa)
25-day
Drying
shrinkage
(%)
Initial
set
(min)
Final
set
(min)
Control 237.5 72 152 -0.1820 650 765
Powder SRA alone 181.3 61 130 -0.1245 -- --
VMA alone 178.1 55 122 -0.1767 -- --
Accelerator alone 200.0 76 136 -0.1520 309 350
Liquid SRA alone 250.0 7 150 -0.1023 1040 1109
Liquid SRA + Accelerator 212.5 43 135 -0.0920 545 593

323
APPENDIX C: SPECIFICATION OF UHPC FOR THE SOUTH CAROLINA
DEPARTMENT OF TRANSPORTATION
This appendix presents a specification of ultra-high performance concrete
(UHPC) for the South Carolina Department of Transportation. This specification was
developed based on the research work in this dissertation. It specified the definition,
testing and curing methods and material properties’ requirements of UHPC.
SPECIFICATION FOR ULTRA-HIGH STRENGTH SHEAR KEY GROUT
SCOPE
This specification consists of the proper material selection and production of Ultra-High-
Performance Concrete/Grout (UHPC) that meets the required properties for use as a shear key
material in construction of precast bridges.
MATERIALS
Required Properties of UHPC:
Produce and use UHPC consisting of the following components that are pre-blended and bagged:
fine aggregate, cementitious material (including portland cement, silica fume and any
supplementary cementitious materials), super plasticizer and shrinkage reducing admixture. Steel
microfibers and potable water that is suitable for use in concrete shall be blended into the UHPC
at the job site. Secondary admixtures may be used, provided, prior performance of such mixtures
has already been established.
The UHPC shall have a flowable consistency in fresh state (i.e. at the time of casting) with a flow
value of no less than 125% as defined in the ASTM C1437 test method.
UHPC material shall meet the following properties at 28 days from the time of casting, unless
otherwise noted:
(a) Minimum Compressive Strength (ASTM C109)
a. 28-day (not heat-treated) > 21 ksi
b. 3 day (not heat-treated) > 12 ksi
(b) Rapid Chloride Ion Permeability (ASTM C1202) at 28 days ≤ 200

324
Coulombs
(c) Flexural Strength (ASTM C78) ≥ 3000 psi
(d) Freeze-Thaw Resistance (ASTM C666, Procedure A, 300 Cycles) RDM≥ 95%
(e) Drying Shrinkage (ASTM C596) at 90 days ≤ 600
microstrains
(f) Autogenous Shrinkage (ASTM C1698) at 48 hours ≤ 300
microstrains
(g) Alkali-Silica Reaction Potential (ASTM C1260)* Innocuous
(h) Pull-Off Bond Strength No Failure in UHPC Matrix or
at the Interface
with Precast Concrete
* ASTM C1260 test shall be conducted on fine aggregate alone used in UHPC and the result shall
be innocuous per ASTM C33 specification (i.e. average mortar bar expansion shall be less than
0.10% expansion at 14 days). Note this specification is not an evaluation of supplementary
cementing materials used in the UHPC.
Steel Microfibers:
Ensure that the steel microfiber consists of straight-wire fiber elements with an aspect ratio of 0.2
mm (0.079 inch) diameter x 13 mm (1/2 inch) length, and are made of steel having a Tensile
strength of 2160 MPa (313 ksi) and a Modulus of Elasticity of 210 GPa (30,450 ksi). Ensure that
steel microfibers are used in the UHPC at a dosage level of 265 lb/yd3 of the UHPC mixture.
This level of dosage is equivalent to 2% by volume of the UHPC mixture. Certain properties of
UHPC shall be measured by using the mortar phase of the UHPC (i.e. no steel fibers shall be
included). These tests include rapid chloride ion permeability and alkali silica reaction potential
of fine aggregate.
QUALIFICATION TESTING
Qualification testing will be waived, if the same material from the same supplier has already been
tested and accepted according to this standard. The material will need to be recertified, if there is
any change in the source or the composition of the raw materials used in the UHPC blend. If not,
the UHPC blend shall be recertified annually. The Contractor shall complete the testing of the
UHPC a minimum of 30 days before placement of the joint. The testing sequence shall include
the submission of a plan for casting and testing procedures to the RCE for review and approval
followed by casting and testing according to the approved plan.
Casting and testing of the UHPC mixtures:
Casting and testing of UHPC mixtures must follow the procedures described below. Where
curing is not specified in the standard test methods for test specimens, curing of the test
specimens shall follow the same method of curing proposed to be used in the field. At a
minimum, the curing in the field shall consist of covering the wet UHPC shear key with a curing
compound or wet-burlap within an hour after the placement and maintain a saturated moisture
325
condition in the burlap for a period of at least 3 days. The temperature of curing shall be within
10°F of the low end of the proposed temperature range for curing in the field.
Compressive Strength: A minimum of 12 cubes of 2 in. x 2 in. x 2 in. dimensions shall be cast.
3 cubes shall be tested on each testing day. Testing should be conducted at 3 days, 7 days, 14
days and 28 days after casting. The compressive strength shall be measured according to ASTM
C109 method and shall meet 12 ksi minimum at 3 days and 21 ksi minimum at 28 days. Only a
UHPC mixture satisfying these strength requirements shall be used to form the joint.
Rapid Chloride Ion Permeability (RCP): Determine the ability of the UHPC to resist ingress of
chloride ions through the matrix by measuring the rapid chloride ion permeability in accordance
with ASTM C1202 procedure. Note that the presence of steel microfibers in the UHPC causes
the RCP test values to be higher than what the UHPC matrix will allow. Therefore, it is required
that RCP test be conducted on the UHPC cementitious matrix (without the steel fibers). For this
purpose, mix and cast a portion of the UHPC without the steel fibers. Ensure that the RCP test
result from testing 28-day old UHPC specimen is no greater than 200 coulombs. For this test,
cast two 4-in. (dia) x 8-in. (long) cylinder specimens. At the age of 28 days, prepare the
specimens per ASTM C1202 and test for chloride ion permeability.
Flexural Strength: Measure the 28-day modulus of rupture (MOR) of prismatic specimens in
accordance with ASTM C78. Ensure the measured MOR is greater than 3000 psi, based on an
average of three specimens. Ensure that the prisms used in testing are 3 in. x 3 in. x 12 in.
Drying Shrinkage: Measure the drying shrinkage of UHPC mixture in accordance with ASTM
C596 test procedure. The 90-day drying shrinkage of the UHPC shall be less than 600
microstrains.
Autogenous Shrinkage: Measure the autogenous shrinkage of UHPC mixture in accordance
with ASTM C1698 test procedure. The 48-hour autogenous shrinkage shall be less than 300
microstrains.
Freeze-Thaw Resistance: Measure the freeze-thaw resistance of UHPC in accordance with
ASTM C666A. The relative dynamic modulus of elasticity at 300 cycles of freezing and thawing
shall not be less than 95%.
Alkali-Silica Reaction: Ensure that the fine aggregate used in the UHPC is not alkali silica
reactive by evaluating it in accordance with ASTM C1260.
Pull-Off Bond Strength: Determine the bond strength of the UHPC by casting a 1-inch thick
layer of UHPC on a saturated surface-dry precast concrete slab (that is representative of the
precast unit to be used in the field). The surface of the precast concrete slab on which UHPC
layer is to be applied shall be a clean surface (i.e. without any dust, debris or laitance), in a
saturated surface-dry (SSD) condition with a surface texture that is sand-blasted. Conduct the
pull-off bond strength test as per standard ASTM C1583 procedure. The pull-off bond strength of
UHPC shall be considered satisfactory, if the failure occurs within the matrix of the precast
concrete section. The pull-off bond strength shall be considered as unsatisfactory, if the failure
occurs at the interface of the UHPC-precast section or within the matrix of the UHPC itself. The
precast concrete to be used in the pull-off bond strength shall be a Class 6500 mix with a

326
minimum 28-day compressive strength of 6500 psi.
Reinforcing Bar Pull-Out Bond Strength Test: Assess the bond of UHPC with steel
reinforcement using the Special Provision for Reinforcing Bar Pull-Out Bond Strength of Ultra-
High Strength Shear Key Grout. Report the bond strength of the UHPC with reinforcing bar
based on average of three test results. All reinforcing bar pull-out tests are conducted after UHPC
achieves at least 21,000 psi in compressive strength, but no later than 28 days after casting. The
UHPC specimens shall be cured using standard curing practices. The bond strength results using
the specified steel reinforcement (diameter, coating and grade) and UHPC mixture design must
confirm that the specified embedment length is sufficient to yield the steel reinforcement prior to
slippage of the steel reinforcement or a shear cone failure at the surface of the UHPC.
Submit the results of all the tests specified to the RCE for review and acceptance, a minimum of
30 days prior to the use of UHPC in the field. All testing shall be conducted by an accredited
laboratory that meets the requirements of AASHTO R18 and is accredited by AMRL or CCRL for
all applicable tests. The testing laboratory must provide internal certifications for any tests that
AMRL or CCRL accreditation does not address.
CONSTRUCTION
Pre-Pour Meeting
Prior to the initial placement of the UHPC arrange for an on-site meeting with the UHPC
representative. The contractor’s staff, the RCE, and Inspectors shall attend the site meeting. The
SME shall be invited to attend the site meeting. The objective of the meeting will be to clearly
outline the procedures for mixing, transporting, finishing and curing of the UHPC materials.
At the time of mixing and placement of UHPC, a representative of the UHPC product company
shall be present on site along with appropriate SCDOT inspector(s). The manufacturer’s
representative must be properly trained (and certified if certifications are available) to perform all
additional tests required.
Storage:
Store all materials as required by the supplier’s specifications in order to protect the materials
against loss of physical and mechanical properties. This includes protecting raw materials from
exposure to moisture and chemical admixtures from exposure to freezing temperatures.
Form Work:
Design and fabricate forms in accordance with the approved installation drawings and the
recommendations of the manufacturer. The form work shall not be removed until either the
UHPC achieves a compressive strength of 12 ksi (based on cube strength) or until the UHPC is
cured in place for a minimum of 3 days as per the requirements of this specification.
Placement:
Follow the batching sequence as specified by the supplier. Fill the shear key so that the surface of

327
the UHPC is flush with the top surface of the precast units to within a tolerance of plus 1/16” and
minus 0. Also, no steel fibers shall be allowed to protrude from the surface of the hardened
UHPC and exposed on the deck surface. Any presence of such fibers shall be rectified by
grinding the UHPC surface, once cured, to remove protruding fibers.
Curing:
Cure the UHPC in the forms according to the Manufacturer’s recommendations to attain the
required design strength at 3 and 28 days. As a minimum, the curing in the field shall consist of
covering the UHPC shear key with a curing compound or wet-burlap within an hour after the
placement and maintaining a saturated moisture condition in the burlap for a period of at least 3
days. Non-chloride based accelerators may be added to the UHPC mix to speed strength gain, as
long as the strength requirements are met at 3 and 28 days. The UHPC shall be protected from
freezing during the first 3 days of curing.
Quality Control:
(a) Flow: Measure the flow of each batch of UHPC. The flow test will be conducted using a
flow table meeting the requirements of ASTM C230 and conducted as per procedure
specified in ASTM C1437 test method. The flow for each batch shall be greater than
125%. The flow for each batch shall be recorded in a QA/QC log. Provide a copy of the
QA/QC log to the RCE.
(b) Compressive strength: Prepare four sets of compressive strength test samples for each
batch mixed. Each set of samples shall consist of 3 cubes of 2 in. x 2 in. x 2 in.
dimensions. All sets shall be moist cured for 3 days and shall be kept sheltered in open
air after 3 days until needed to conduct testing.
Test the concrete compressive strength in accordance with ASTM C109. The
first set is to be tested at 3 days. The second set shall be tested at 28 days. The third set
will be sent to the OMR between the 3rd and 14th day, which will be tested for its 28-day
compressive strength. The fourth set shall be treated as a reserve test. The structure may
be opened to traffic, upon the UHPC achieving a minimum compressive strength of
21,000 psi. At the contractor’s option, additional set(s) of compressive strength test
specimens may be prepared and tested before 28 days to determine if the 21,000 psi limit
is achieved prior to 28 days.
MEASUREMENT AND PAYMENT:
The quantity of the UHPC used in a project for payment purposes shall be measured by the
theoretical volume of UHPC computed from the neat lines shown on the plans. Deductions are
made for the volume of embedded items, except for reinforcing steel. No adjustment is made for
deflection of formwork or precast units, production tolerances of the precast units, or other
deviations from plan dimensions. No measurement is made for test batches. The volume of the
UHPC shall be computed to the nearest 0.1 cubic yards. The payment shall be made based on the

328
quantity shown on the plans and shall be full compensation for furnishing and placing the UHPC
as specified or directed and includes costs of the mix design, sampling, and testing; furnishing,
storing, batching, mixing, and transporting concrete materials; admixtures; false work and forms
(including any formwork that remains in place); surface finishing and curing; quality control
personnel and equipment; and all other materials, labor, equipment, tools, supplies, transportation,
and incidentals necessary to fulfill the requirements of the pay item in accordance with the Plans,
the Specifications, and other terms of the Contract.
Item No. Item Pay Unit
8990512 Ultra High Strength Shear Key Grout CY
329
REFERENCES
[1] P.Y. Blais, M. Couture, Precast, prestressed pedestrian bridge - World's first reactive
powder concrete structure, Pci J, 44 (1999) 60-71.
[2] P. Buitelaar, Heavy Reinforced Ultra High Performance Concrete, International
Symposium on Ultra High Performance Concrete, Kassel University Press, Kassel,
Germany, 2004, pp. 25-35.
[3] P. Buitelaar, Ultra Thin Heavy Reinforced High Performance Concrete Overlays, 6th
International Symposium on Utilization of High Strength / High Performance
Concrete,Leipzig, Germany, 2002.
[4] H.G. Russell, B.A. Graybeal, Ultra-High Performance Concrete: A State-of-the-Art
Report for the Bridge Community, FHWA-HRT-13-060, The Federal Highway
Administration, McLean, VA, 2013.
[5] P.R. Rangaraju, H. Kizhakommudom, Z. Li, S.D. Schiff, Development of High-
Strength/High Performance Concrete/Grout Mixtures for Application in Shear Keys in
Precast Bridges, FHWA-SC-13-04a, FHWA, U.S. Department of Transportation, 2013.
[6] B.A. Graybeal, Ultra-High Performance Concrete, FHWA-HRT-13-060, The Federal
Highway Administration, McLean, VA, 2011.
[7] K. Wille, C. Boisvert-Cotulio, Development of Non-Proprietary Ultra-High
Performance Concrete for Use in the Highway Bridge Sector, FHWA-HRT-13-100,
2013.
[8] K. Wille, A.E. Naaman, G.J. Parra-Montesinos, Ultra-High Performance Concrete
with Compressive Strength Exceeding 150 MPa (22 ksi): A Simpler Way, Aci Mater J,
108 (2011) 46-54.
[9] Z. Li, H. Kizhakommudom, P.R. Rangaraju, S.D. Schiff, Development of ultra-high
performance concrete for shear-keys in precast bridges using locally available materials
in South Carolina, 2014 60th Anniversary Convention and National Bridge Conference,
Precast/Prestressed Concrete Institute, Washington D.C, 2014.
[10] R. Yu, P. Spiesz, H.J.H. Brouwers, Mix design and properties assessment of Ultra-
High Performance Fibre Reinforced Concrete (UHPFRC), Cement and Concrete
Research, 56 (2014) 29-39.
[11] B.A. Graybeal, Material property characterization of ultra-high performance
concrete, Report FHWA-HRT-06-103, FHWA, U.S. Department of Transportation,
2006.
[12] S. Mindess, J.F. Young, D. Darwin, Concrete, 2nd ed., Prentice Hall, Upper Saddle
River, NJ, 2003.
[13] E. Sakai, K. Aizawa, A. Nakamura, H. Kato, M. Daimon, Influence of
superplasticizers on the fluidity of cements with different amount of aluminate phase,
Second International Symposium on Ultra High Performance Concrete, 2008, pp. 85-92.
[14] A.C. 234, Guide for the use of silica fume in concrete, America Concrete Institute,
Farmington Hills, MI, 2006.
[15] P. Lawrence, M. Cyr, E. Ringot, Mineral admixtures in mortars - Effect of inert
materials on short-term hydration, Cement and Concrete Research, 33 (2003) 1939-1947.

330
[16] P. Richard, M. Cheyrezy, Composition of Reactive Powder Concretes, Cement and
Concrete Research, 25 (1995) 1501-1511.
[17] M. Cheyrezy, V. Maret, L. Frouin, Microstructural Analysis of Rpc (Reactive
Powder Concrete), Cement and Concrete Research, 25 (1995) 1491-1500.
[18] D.M. Roy, G.R. Gouda, High strength generation in cement pastes, Cement and
Concrete Research, 3 (1973) 807-820.
[19] H.H. Bache, A.P.C.-o. Betonlaboratoriet, Densified Cement/ultra-fine Particle-based
Materials: Presented at the Second International Conference on Superplasticizers in
Concrete, June 10 - 12, 1981, Ottawa, Ontario, Canada, Aalborg Portland1981.
[20] F. De Larrard, T. Sedran, Optimization of Ultra-High-Performance Concrete by the
Use of a Packing Model, Cement and Concrete Research, 24 (1994) 997-1009.
[21] L. Hjorth, Development and Application of High-Density Cement-Based Materials,
Philos T R Soc A, 310 (1983) 167-173.
[22] M. Yudenfreund, K.M. Hanna, J. Skalny, I. Older, S. Brunauer, Hardened Portland
cement pastes of low porosity V. Compressive strength, Cement and Concrete Research,
2 (1972) 731-743.
[23] N.M. Alford, G.W. Groves, D.D. Double, Physical-Properties of High-Strength
Cement Pastes, Cement and Concrete Research, 12 (1982) 349-358.
[24] O. Ekincioglu, M.H. Ozkul, L.J. Struble, S. Patachia, Optimization of material
characteristics of macro-defect free cement, Cement Concrete Comp, 34 (2012) 556-565.
[25] D.M. Roy, G.R. Gouda, A. Bobrowsky, Very high strength cement pastes prepared
by hot pressing and other high pressure techniques, Cement and Concrete Research, 2
(1972) 349-366.
[26] A. Bajza, On the factors influencing the strength of cement compacts, Cement and
Concrete Research, 2 (1972) 67-78.
[27] B. Graybeal, J. Tanesi, Durability of an ultrahigh-performance concrete, J Mater
Civil Eng, 19 (2007) 848-854.
[28] B.A. Graybeal, Material Property Characterization of Ultra-High Performance
Concrete, FHWA-HRT-06-103, The Federal Highway Administration, McLean, VA,
2006.
[29] M. Yudenfreund, J. Skalny, R.S. Mikhail, S. Brunauer, Hardened portland cement
pastes of low porosity II. Exploratory studies. Dimensional changes, Cement and
Concrete Research, 2 (1972) 331-348.
[30] I. Jawed, J. Skalny, Alkalies in Cement - Review .2. Effects of Alkalies on
Hydration and Performance of Portland-Cement, Cement and Concrete Research, 8
(1978) 37-52.
[31] J.N. Maycock, J.
Acta, 8 (1974) 167-176.
[32] M. Halaweh, Effect of alkalis and sulfates on Portland cement systems, Civil and
Environmental Engineering, University of South Florida, 2006.
[33] L.E. Copeland, D. Kantro, G.J. Verbeck, Chemistry of hydration of Portland cement,
Portland Cement Association, Research and Development Laboratories1960.

331
[34] S. Brunauer, J. Skalny, I. Odler, M. Yudenfreund, Hardened portland cement pastes
of low porosity: VII. Further remarks about early hydration. Composition and surface
area of tobermorite gel. Summary, Cement and Concrete Research, 3 (1973) 279-293.
[35] W. Hansen, E. Pressler, Solubility of Ca (OH) 2 and CaSO4. 2H2O in Dilute Alkali
Solutions, Industrial & Engineering Chemistry, 39 (1947) 1280-1282.
[36] G.A.C.M. Spierings, H.N. Stein, The influence of Na2O on the hydration of C3A. I.
Paste hydration, Cement and Concrete Research, 6 (1976) 265-272.
[37] S.J. Way, A. Shayan, Early Hydration of a Portland-Cement in Water and Sodium-
Hydroxide Solutions - Composition of Solutions and Nature of Solid-Phases, Cement and
Concrete Research, 19 (1989) 759-769.
[38] K. Suzuki, T. Nishikawa, H. Ikenaga, S. Ito, Effect of NaCl or NaOH on the
form -340.
[39] N. Smaoui, M.A. Bérubé, B. Fournier, B. Bissonnette, B. Durand, Effects of alkali
addition on the mechanical properties and durability of concrete, Cement and Concrete
Research, 35 (2005) 203-212.
[40] G.L. Kalousek, Tobermorite and related phases in the system CaO-SiO2-H2O, ACI
Journal Proceedings, ACI, 1955.
[41] G. Sant, A. Kumar, C. Patapy, G. Le Saout, K. Scrivener, The influence of sodium
and potassium hydroxide on volume changes in cementitious materials, Cement and
Concrete Research, 42 (2012) 1447-1455.
[42] W. McCoy, O. Eshenour, Significance of Total and Water-soluble Alkali Contents
of Portland Cement, Journal Materials, (1968).
[43] S. Multon, M. Cyr, A. Sellier, N. Leklou, L. Petit, Coupled effects of aggregate size
and alkali content on ASR expansion, Cement and Concrete Research, 38 (2008) 350-
359.
[44] P.K. Mehta, C.A. Rogers, R.D. Hooton, Reduction in Mortar and Concrete
Expansion with Reactive Aggregates Due to Alkali Leaching, Cement, Concrete and
Aggregates, 13 (1991) 42.
[45] M.H. Shehata, M.D.A. Thomas, The effect of fly ash composition on the expansion
of concrete due to alkali-silica reaction, Cement and Concrete Research, 30 (2000) 1063-
1072.
[46] A. Durekovic, Cement Pastes of Low Water to Solid Ratio - an Investigation of the
Porosity Characteristics under the Influence of a Superplasticizer and Silica Fume,
Cement and Concrete Research, 25 (1995) 365-375.
[47] P. Xie, J.J. Beaudoin, Modification of Transition Zone Microstructure - Silica Fume
Coating of Aggregate Surfaces, Cement and Concrete Research, 22 (1992) 597-604.
[48] M. Nehdi, S. Mindess, P.C. Aitcin, Rheology of high-performance concrete: Effect
of ultrafine particles, Cement Concrete Res, 28 (1998) 687-697.
[49] X. Zhang, J.H. Han, The effect of ultra-fine admixture on the rheological property of
cement paste, Cement Concrete Res, 30 (2000) 827-830.
[50] H. Vikan, H. Justnes, Rheology of cementitious paste with silica fume or limestone,
Cement Concrete Res, 37 (2007) 1512-1517.

332
[51] R.D. Hooton, Influence of Silica Fume Replacement of Cement on Physical-
Properties and Resistance to Sulfate Attack, Freezing and Thawing, and Alkali-Silica
Reactivity, Aci Mater J, 90 (1993) 143-151.
[52] B.B. Sabir, Mechanical properties and frost resistance of silica fume concrete,
Cement Concrete Comp, 19 (1997) 285-294.
[53] M.D.A. Thomas, M.H. Shehata, S.G. Shashiprakash, D.S. Hopkins, K. Cail, Use of
ternary cementitious systems containing silica fume and fly ash in concrete, Cement and
Concrete Research, 29 (1999) 1207-1214.
[54] Z. Bayasi, J. Zhou, Properties of Silica Fume Concrete and Mortar, Aci Mater J, 90
(1993) 349-356.
[55] Y.N. Chan, G.F. Peng, M. Anson, Residual strength and pore structure of high-
strength concrete and normal strength concrete after exposure to high temperatures,
Cement Concrete Comp, 21 (1999) 23-27.
[56] H.A. Toutanji, The influence of air entrainment on the properties of silica fume
concrete, Adv Cem Res, 10 (1998) 135-139.
[57] G.A. Rao, Influence of silica fume replacement of cement on expansion and drying
shrinkage, Cement and Concrete Research, 28 (1998) 1505-1509.
[58] A.A.A. Hassan, M. Lachemi, K.M.A. Hossain, Effect of meta-kaolin and silica fume
on the durability of self-consolidating concrete, Cement Concrete Comp, 34 (2012) 801-
807.
[59] Y. Li, J.L. Bao, Y.L. Guo, The relationship between autogenous shrinkage and pore
structure of cement paste with mineral admixtures, Construction and Building Materials,
24 (2010) 1855-1860.
[60] E. Tazawa, S. Miyazawa, Influence of Cement and Admixture on Autogenous
Shrinkage of Cement Paste, Cement and Concrete Research, 25 (1995) 281-287.
[61] A. Bilodeau, M. Malhotra, High-volume fly ash system: Concrete solution for
sustainable development, Aci Mater J, 97 (2000) 41-48.
[62] J. Paya, J. Monzo, M.V. Borrachero, E. PerisMora, E. GonzalezLopez, Mechanical
treatment of fly ashes .2. Particle morphologies in ground fly ashes (GFA) and
workability of GFA-cement mortars, Cement and Concrete Research, 26 (1996) 225-235.
[63] S. Nagataki, E. Sakai, T. Takeuchi, The fluidity of fly ash-cement paste with
superplasticizer, Cement and Concrete Research, 14 (1984) 631-638.
[64] R.K. Dhir, F.H. Hubbard, J.G.L. Munday, M.R. Jones, S.L. Duerden, Contribution
of PFA to concrete workability and strength development, Cement and Concrete
Research, 18 (1988) 277-289.
[65] K. Kiattikomol, C. Jaturapitakkul, S. Songpiriyakij, S. Chutubtim, A study of ground
coarse fly ashes with different finenesses from various sources as pozzolanic materials,
Cement Concrete Comp, 23 (2001) 335-343.
[66] J. Paya, J. Monzo, M.V. Borrachero, E. Peris-Mora, F. Amahjour, Mechanical
treatment of fly ashes Part IV. Strength development of ground fly ash-cement mortars
cured at different temperatures, Cement and Concrete Research, 30 (2000) 543-551.
[67] J. Paya, J. Monzo, M.V. Borrachero, E. Perismora, Mechanical Treatment of Fly
Ashes .1. Physicochemical Characterization of Ground Fly Ashes, Cement and Concrete
Research, 25 (1995) 1469-1479.
333
[68] H.K. Lee, K.M. Lee, B.G. Kim, Autogenous shrinkage of high-performance concrete
containing fly ash, Mag Concrete Res, 55 (2003) 507-515.
[69] N. Ghafoori, M. Najimi, H. Diawara, M.S. Islam, Effects of class F fly ash on sulfate
resistance of Type V Portland cement concretes under continuous and interrupted sulfate
exposures, Construction and Building Materials, 78 (2015) 85-91.
[70] P. Chindaprasirt, S. Homwuttiwong, V. Sirivivatnanon, Influence of fly ash fineness
on strength, drying shrinkage and sulfate resistance of blended cement mortar, Cement
and Concrete Research, 34 (2004) 1087-1092.
[71] M.D.A. Thomas, Field studies of fly ash concrete structures containing reactive
aggregates, Mag Concrete Res, 48 (1996) 265-279.
[72] D. S, Lopez-Flores, On the distinction in physical and chemical characteristics
between lignitic and bituminous fly ashes, Proceedings of the MRS symposium,
materials research society,Boston, MA, 1981.
[73] S. Diamond, Effects of two Danish flyashes on alkali contents of pore solutions of
cement-flyash pastes, Cement and Concrete Research, 11 (1981) 383-394.
[74] I. Canham, C.L. Page, P.J. Nixon, Aspects of the pore solution chemistry of blended
cements related to the control of alkali silica reaction, Cement and Concrete Research, 17
(1987) 839-844.
[75] O. Sengul, C. Tasdemir, M.A. Tasdemir, Mechanical properties and rapid chloride
permeability of concretes with ground fly ash, Aci Mater J, 102 (2005) 414-421.
[76] M.H. Zhang, V.M. Malhotra, Characteristics of a thermally activated alumino-
silicate pozzolanic material and its use in concrete, Cement and Concrete Research, 25
(1995) 1713-1725.
[77] J.T. Ding, Z.J. Li, Effects of meta-kaolin and silica fume on properties of concrete,
Aci Mater J, 99 (2002) 393-398.
[78] J.M. Justice, K.E. Kurtis, Influence of meta-kaolin surface area on properties of
cement-based materials, J Mater Civil Eng, 19 (2007) 762-771.
[79] J.J. Brooks, M.A.M. Johari, Effect of meta-kaolin on creep and shrinkage of
concrete, Cement Concrete Comp, 23 (2001) 495-502.
[80] B.B. Sabir, S. Wild, J. Bai, Meta-kaolin and calcined clays as pozzolans for
concrete: a review, Cement Concrete Comp, 23 (2001) 441-454.
[81] E. Guneyisi, M. Gesoglu, Properties of self-compacting mortars with binary and
ternary cementitious blends of fly ash and meta-kaolin, Mater Struct, 41 (2008) 1519-
1531.
[82] A. Tafraoui, G. Escadeillas, S. Lebaili, T. Vidal, Meta-kaolin in the formulation of
UHPC, Constr Build Mater, 23 (2009) 669-674.
[83] A.L.C. da Cunha, J.P. Goncalves, P.M. Buchler, J. Dweck, Effect of meta-kaolin
pozzolanic activity in the early stages of cement type II paste and mortar hydration, J
Therm Anal Calorim, 92 (2008) 115-119.
[84] M. Frı́as, M.I.S. de Rojas, J. Cabrera, The effect that the pozzolanic reaction of
meta-kaolin has on the heat evolution in meta-kaolin-cement mortars, Cement and
Concrete Research, 30 (2000) 209-216.
[85] J.M. Khatib, S. Wild, Pore size distribution of meta-kaolin paste, Cement and
Concrete Research, 26 (1996) 1545-1553.

334
[86] M. Frias, J. Cabrera, Pore size distribution and degree of hydration of meta-kaolin-
cement pastes, Cement and Concrete Research, 30 (2000) 561-569.
[87] J. Bai, B. Sabir, S. Wild, J. Kinuthia, Strength development in concrete
incorporating PFA and meta-kaolin, Magazine of concrete research, 52 (2000) 153-162.
[88] E. Guneyisi, M. Gesoglu, E. Ozbay, Strength and drying shrinkage properties of
self-compacting concretes incorporating multi-system blended mineral admixtures,
Constr Build Mater, 24 (2010) 1878-1887.
[89] T. Çelik, K. Marar, Effects of crushed stone dust on some properties of concrete,
Cement and Concrete Research, 26 (1996) 1121-1130.
[90] I. Soroka, N. Stern, Calcareous fillers and the compressive strength of portland
cement, Cement and Concrete Research, 6 (1976) 367-376.
[91] P. Lawrence, M. Cyr, E. Ringot, Mineral admixtures in mortars effect of type,
amount and fineness of fine constituents on compressive strength, Cement and Concrete
Research, 35 (2005) 1092-1105.
[92] E. Grabowski, J.E. Gillott, Effect of Replacement of Silica Flour with Silica Fume
on Engineering Properties of Oilwell Cements at Normal and Elevated-Temperatures and
Pressures, Cement and Concrete Research, 19 (1989) 333-344.
[93] B. Felekoğlu, H. Sarıkahya, Effect of chemical structure of polycarboxylate-based
superplasticizers on workability retention of self-compacting concrete, Construction and
Building Materials, 22 (2008) 1972-1980.
[94] S. Chandra, J. Björnström, Influence of superplasticizer type and dosage on the
slump loss of Portland cement mortars—Part II, Cement and Concrete Research, 32
(2002) 1613-1619.
[95] F. Winnefeld, S. Becker, J. Pakusch, T. Götz, Effects of the molecular architecture
of comb-shaped superplasticizers on their performance in cementitious systems, Cement
and Concrete Composites, 29 (2007) 251-262.
[96] T.M. Vickers Jr, S.A. Farrington, J.R. Bury, L.E. Brower, Influence of dispersant
structure and mixing speed on concrete slump retention, Cement and Concrete Research,
35 (2005) 1882-1890.
[97] J.-Y. Petit, K.H. Khayat, E. Wirquin, Coupled effect of time and temperature on
variations of yield value of highly flowable mortar, Cement and Concrete Research, 36
(2006) 832-841.
[98] S.P. Jiang, B.G. Kim, P.C. Aitcin, Importance of adequate soluble alkali content to
ensure cement superplasticizer compatibility, Cement and Concrete Research, 29 (1999)
71-78.
[99] A.M. SOLIMAN, EARLY-AGE SHRINKAGE OF ULTRA HIGH-
PERFORMANCE CONCRETE: MITIGATION AND COMPENSATING
MECHANISMS, The University of Western Ontario, London, Ontario, Canada, 2011.
[100] D.D. Cortes, H.K. Kim, A.M. Palomino, J.C. Santamarina, Rheological and
mechanical properties of mortars prepared with natural and manufactured sands, Cement
Concrete Res, 38 (2008) 1142-1147.
[101] N.A. Libre, R. Khoshnazar, M. Shekarchi, Relationship between fluidity and
stability of self-consolidating mortar incorporating chemical and mineral admixtures,
Constr Build Mater, 24 (2010) 1262-1271.

335
[102] A.W. Saak, H.M. Jennings, S.P. Shah, New methodology for designing self-
compacting concrete, Aci Mater J, 98 (2001) 429-439.
[103] L.D. Schwartzentruber, R. Le Roy, J. Cordin, Rheological behaviour of fresh
cement pastes formulated from a Self Compacting Concrete (SCC), Cement Concrete
Res, 36 (2006) 1203-1213.
[104] K.H. Khayat, Workability, testing, and performance of self-consolidating concrete,
Aci Mater J, 96 (1999) 346-353.
[105] M. J, O. M, D. F, S. D, T. NV., Comparative investigations on ultra-high
performance concrete with and without coarse aggregates, International symposium on
ultra high performance concrete, Kassel University Press, Kassel, Germany, 2004.
[106] V. Han, S. Ros, H. Shima, Effects of Sand Content, Superplasticizer Dosage, and
Mixing Time on Compressive Strength of Mortar, Aci Mater J, 110 (2013) 23-31.
[107] J.J. Park, S.T. Kang, K.T. Koh, S.W. Kim, Influence of the ingredients on the
compressive strength of UHPC as a fundamental study to optimize the mixing proportion,
Proceedings of the international symposium on ultra-high performance concrete,
structural materials and engineering series, (2008) 105-112.
[108] D.N. Winslow, M.D. Cohen, D.P. Bentz, K.A. Snyder, E.J. Garboczi, Percolation
and Pore Structure in Mortars and Concrete, Cement Concrete Res, 24 (1994) 25-37.
[109] K. Wille, A.E. Naaman, S. El-Tawil, G.J. Parra-Montesinos, Ultra-high
performance concrete and fiber reinforced concrete: achieving strength and ductility
without heat curing, Mater Struct, 45 (2012) 309-324.
[110] C. Magureanu, I. Sosa, C. Negrutiu, B. Heghes, Mechanical properties and
durability of ultra-high-performance concrete, Aci Mater J, 109 (2012).
[111] K. Wille, D.J. Kim, A.E. Naaman, Strain-hardening UHP-FRC with low fiber
contents, Mater Struct, 44 (2011) 583-598.
[112] P. Rossi, Ultra-high performance fibre reinforced concretes (UHPFRC): an
overview, Fifth RILEM Symposium on Fibre-Reinforced Concretes (FRC), 2000, pp.
87-100.
[113] K.C.D. Alessandro, C.L. Roberts-Wollmann, T.E. Cousins, Investigation of Ultra-
High Performance Concrete Properties and Development of Biaxial Stress States Test
Procedure for Ultra-High Performance Concrete, FHWA/VTRC 12-?, The Federal
Highway Administration, McLean, VA, 2014.
[114] D. Heinz, H. Ludwig, Heat Treatment and the Risk of DEF Delayed Ettringite
Formation in UHPC, International Symposium on Ultra High Performance Concrete,
2004, pp. 717-730.
[115] D. Heinz, L. Urbonas, T. Gerlicher, Effect of heat Treatment Method on the
properties of UHPC, Ultra-High Performance Concrete and Nanotechnology in
Construction. Proceedings of Hipermat 2012. 3rd International Symposium on UHPC and
Nanotechnology for High Performance Construction Materials, kassel university press
GmbH, 2012, pp. 283.
[116] B. Graybeal, Compression response of a rapid-strengthening ultra-high
performance concrete formulation.
[117] B. Graybeal, M. Davis, Cylinder or cube: strength testing of 80 to 200 MPa (11.6 to
29 ksi) ultra-high-performance fiber-reinforced concrete, Aci Mater J, 105 (2008).

336
[118] K. Wille, G.J. Parra-Montesinos, Effect of Beam Size, Casting Method, and
Support Conditions on Flexural Behavior of Ultra-High-Performance Fiber-Reinforced
Concrete, Aci Mater J, 109 (2012) 379-388.
[119] B. Frettlöhr, K.H. Reineck, H.W. Reinhardt, Size and Shape Effect of UHPFRC
Prisms Tested under Axial Tension and Bending, in: G. Parra-Montesinos, H. Reinhardt,
A.E. Naaman (Eds.) High Performance Fiber Reinforced Cement Composites 6, Springer
Netherlands2012, pp. 365-372.
[120] P.S. Song, S. Hwang, Mechanical properties of high-strength steel fiber-reinforced
concrete, Construction and Building Materials, 18 (2004) 669-673.
[121] M.A.C. Munoz, D.K. Harris, T.M. Ahlborn, D.C. Froster, Bond Performance
between Ultrahigh-Performance Concrete and Normal-Strength Concrete, J Mater Civil
Eng, 26 (2014).
[122] B.A. Tayeh, B.H. Abu Bakar, M.A.M. Johari, Y.L. Voo, Evaluation of Bond
Strength between Normal Concrete Substrate and Ultra High Performance Fiber Concrete
as a Repair Material, Procedia Engineer, 54 (2013) 554-563.
[123] M.A. Carbonell, D. Harris, S.V. Shann, T. Ahlborn, Bond Strength Between UHPC
and Normal Strength Concrete (NSC) in Accordance with Split Prism and Freeze-Thaw
Cycling Tests, Hipermat 2012 3rd International Symposium on UHPC and
Nanotechnology for High Performance Construction Materials, Kassel University Press,
Kassel, Germany, 2012.
[124] G.A. Julio-Betancourt, R.D. Hooton, Study of the Joule effect on rapid chloride
permeability values and evaluation of related electrical properties of concretes, Cement
Concrete Res, 34 (2004) 1007-1015.
[125] P. Francisco, F. Benboudjema, P. Rougeau, J.M. Torrenti, Ultra High Performance
Concrete for Prestressed Elements. Interest of Creep Prediction, Designing and Building
with UHPFRC, (2009) 567-574.
[126] J. Ocel, B. Graybeal, Fatigue Behavior of an Ultra-High Performance Concrete I-
Girder, Proc. Precast/Prestressed Concrete Institute National Bridge Conference, 2007.
[127] M. Suzuki, I. Maruyama, R. Sato, Properties of Expansive-Ultra High-Strength
Concrete, ACI Special Publication, 228 (2005).
[128] S. Kim, J. Park, D. YOO, Y. Yoon, Shrinkage Behavior of Ultra High Performance
Concrete at the Manufacturing Stage, Ultra-High Performance Concrete and
Nanotechnology in Construction. Proceedings of Hipermat 2012. 3rd International
Symposium on UHPC and Nanotechnology for High Performance Construction
Materials, kassel university press GmbH, 2012, pp. 317.
[129] S. Eppers, C. Müller, Autogenous Shrinkage Strain of Ultra-High-Performance
Concrete (UHPC), Proceedings of the 2nd International Symposium on UHPC, Kassel,
Germany, 2008, pp. 433-441.
[130] T. Ichinomiya, Y. Hishiki, T. Ohno, Y. Morita, K. Takada, Experimental study on
mechanical properties of ultra-high-strength concrete with low-autogenous-shrinkage,
ACI Special Publication, 228 (2005).
[131] I. Lallemant-Gamboa, S. Chanut, J.-P. Lombard, J. Chaignon, T. Thibaux,
Formulations, Characterizations and Applications of Ultra High-Performance Concrete,
ACI Special Publication, 228 (2005).
337
[132] A. Poursaee, Corrosion measurement techniques in steel reinforced concrete,
Journal of ASTM International, 8 (2011) 1-15.
[133] K.S. Chia, M.H. Zhang, Water permeability and chloride penetrability of high-
strength lightweight aggregate concrete, Cement Concrete Res, 32 (2002) 639-645.
[134] F. Koksal, F. Altun, I. Yigit, Y. Sahin, Combined effect of silica fume and steel
fiber on the mechanical properties of high strength concretes, Construction and Building
Materials, 22 (2008) 1874-1880.
[135] P. Lura, B. Pease, G.B. Mazzotta, F. Rajabipour, J. Weiss, Influence of shrinkage-
reducing admixtures on development of plastic shrinkage cracks, Aci Mater J, 104 (2007)
187-194.
[136] A.S.T.M. C1293-08b, Standard Test Method for Determination of Length Change
of Concrete Due to Alkali-Silica Reaction, ASTM International, West Conshohocken,
PA, 2008.
[137] J.S. Wall, N.G. Shrive, Factors Affecting Bond between New and Old Concrete,
Aci Mater J, 85 (1988) 117-125.
[138] A. Momayez, M.R. Ehsani, A.A. Ramezanianpour, H. Rajaie, Comparison of
methods for evaluating bond strength between concrete substrate and repair materials,
Cement Concrete Res, 35 (2005) 748-757.
[139] L. Nicoleau, A. Nonat, D. Perrey, The di- and tricalcium silicate dissolutions,
Cement and Concrete Research, 47 (2013) 14-30.
[140] H. Stein, Influence of some additives on the hydration reactions of portland cement
I. Non‐ionic organic additives, Journal of Applied Chemistry, 11 (1961) 474-482.
[141] I. Odler, R. Wonnemann, Effect of Alkalis on Portland-Cement Hydration .2.
Alkalis Present in Form of Sulfates, Cement and Concrete Research, 13 (1983) 771-777.
[142] A. Kumar, G. Sant, C. Patapy, C. Gianocca, K.L. Scrivener, The influence of
sodium and potassium hydroxide on alite hydration: Experiments and simulations,
Cement and Concrete Research, 42 (2012) 1513-1523.
[143] P.W. Brown, C.L. Harner, E.J. Prosen, The Effect of Inorganic Salts on Tricalcium
Silicate Hydration, Cement and Concrete Research, 16 (1986) 17-22.
[144] D. Ménétrier, I. Jawed, J. Skalny, Effect of gypsum on C3S hydration, Cement and
Concrete Research, 10 (1980) 697-701.
[145] F. Beltzung, F.H. Wittmann, Role of disjoining pressure in cement based materials,
Cement and Concrete Research, 35 (2005) 2364-2370.
[146] M. Maslehuddin, O.S.B. Al-Amoudi, M. Shameem, M.K. Rehman, M. Ibrahim,
Usage of cement kiln dust in cement products – Research review and preliminary
investigations, Construction and Building Materials, 22 (2008) 2369-2375.
[147] J. Duchesne, M.A. Bérubé, The effectiveness of supplementary cementing
materials in suppressing expansion due to ASR: Another look at the reaction mechanisms
part 2: Pore solution chemistry, Cement and Concrete Research, 24 (1994) 221-230.
[148] M. Kawamura, K. Takemoto, Correlation between pore solution composition and
alkali silica expansion in mortars containing various fly ashes and blastfurnace slags,
International Journal of Cement Composites and Lightweight Concrete, 10 (1988) 215-
223.

338
[149] M.H. Shehata, M.D.A. Thomas, R.F. Bleszynski, The effects of fly ash
composition on the chemistry of pore solution in hydrated cement pastes, Cement and
Concrete Research, 29 (1999) 1915-1920.
[150] J. Punkki, J. Golaszewski, O.E. Gjorv, Workability loss of high-strength concrete,
Aci Mater J, 93 (1996) 427-431.
[151] W. Fajun, M.W. Grutzeck, D.M. Roy, The retarding effects of fly ash upon the
hydration of cement pastes: The first 24 hours, Cement and Concrete Research, 15 (1985)
174-184.
[152] J.J. Brooks, M.A.M. Johari, M. Mazloom, Effect of admixtures on the setting times
of high-strength concrete, Cement Concrete Comp, 22 (2000) 293-301.
[153] J.J. Brooks, M.A. Megat Johari, Effect of meta-kaolin on creep and shrinkage of
concrete, Cement and Concrete Composites, 23 (2001) 495-502.
[154] P.J.P. Gleize, M. Cyr, G. Escadeillas, Effects of meta-kaolin on autogenous
shrinkage of cement pastes, Cement Concrete Comp, 29 (2007) 80-87.
[155] J. Kinuthia, S. Wild, B. Sabir, J. Bai, Self-compensating autogenous shrinkage in
Portland cement—meta-kaolin—fly ash pastes, Advances in cement research, 12 (2000)
35-43.
[156] S. Wild, J. Khatib, L. Roose, Chemical shrinkage and autogenous shrinkage of
Portland cement—meta-kaolin pastes, Advances in cement research, 10 (1998) 109-119.
[157] E.-i. Tazawa, S. Miyazawa, Influence of cement and admixture on autogenous
shrinkage of cement paste, Cement and Concrete Research, 25 (1995) 281-287.
[158] M. Mazloom, A.A. Ramezanianpour, J.J. Brooks, Effect of silica fume on
mechanical properties of high-strength concrete, Cement and Concrete Composites, 26
(2004) 347-357.
[159] S.W. Yoo, S.J. Kwon, S.H. Jung, Analysis technique for autogenous shrinkage in
high performance concrete with mineral and chemical admixtures, Constr Build Mater,
34 (2012) 1-10.
[160] P. Tertnkhajornkit, T. Nawa, M. Nakai, T. Saito, Effect of fly ash on autogenous
shrinkage, Cement and Concrete Research, 35 (2005) 473-482.
[161] D.W. Mokarem, R.E. Weyers, D.S. Lane, Development of a shrinkage performance
specifications and prediction model analysis for supplemental cementitious material
concrete mixtures, Cement and Concrete Research, 35 (2005) 918-925.
[162] E. Guneyisi, M. Gesoglu, S. Karaoglu, K. Mermerdas, Strength, permeability and
shrinkage cracking of silica fume and meta-kaolin concretes, Constr Build Mater, 34
(2012) 120-130.
[163] E. Guneyisi, M. Gesoglu, K. Mermerdas, Improving strength, drying shrinkage,
and pore structure of concrete using meta-kaolin, Mater Struct, 41 (2008) 937-949.
[164] J. LUO, D. LU, T. XU, Z. XU, Effect of Meta-kaolin on Drying Shrinkage
Behaviour of Portland Cement Pastes and its Mechanism, Journal of The Chinese
Ceramic Society, 39 (2011) 1687-1693.
[165] K. Mermerdas, E. Guneyisi, M. Gesoglu, T. Ozturan, Experimental evaluation and
modeling of drying shrinkage behavior of meta-kaolin and calcined kaolin blended
concretes, Constr Build Mater, 43 (2013) 337-347.
339
[166] R. Ott, M. Longnecker, An introduction to statistical methods and data analysis, 6th
ed., Cengage Learning2008.
[167] W.A. Al-Khaja, Strength and time-dependent deformations of silica fume concrete
for use in Bahrain, Constr Build Mater, 8 (1994) 169-172.
[168] A.M.T. Hassan, S.W. Jones, G.H. Mahmud, Experimental test methods to
determine the uniaxial tensile and compressive behaviour of ultra high performance fibre
reinforced concrete (UHPFRC), Constr Build Mater, 37 (2012) 874-882.
[169] C. Magureanu, I. Sosa, C. Negrutiu, B. Heghes, Mechanical Properties and
Durability of Ultra-High-Performance Concrete, Aci Mater J, 109 (2012) 177-183.
[170] M. Orgass, Y. Klug, Fibre reinforced ultra-high strength concretes, Proceedings of
the 1st International Symposium on Ultra High Performance Concrete, Kassel, Germany,
2004, pp. 637-647.
[171] D. Vojnovic, M. Moneghini, F. Rubessa, A. Zanchetta, Simultaneaus optimization
of several response variables in a granulation process, Drug development and industrial
pharmacy, 19 (1993) 1479-1496.
[172] L.G. Li, A.K.H. Kwan, Mortar design based on water film thickness, Constr Build
Mater, 25 (2011) 2381-2390.
[173] B.V.V. Reddy, A. Gupta, Influence of sand grading on the characteristics of
mortars and soil-cement block masonry, Constr Build Mater, 22 (2008) 1614-1623.
[174] A. Emdadi, I. Mehdipour, N.A. Libre, M. Shekarchi, Optimized workability and
mechanical properties of FRCM by using fiber factor approach: theoretical and
experimental study, Mater Struct, 48 (2015) 1149-1161.
[175] K.L. Scrivener, E.M. Gariner, Microstructural Gradients in Cement Paste around
Aggregate Particles, Material Research Symposium, 1988, pp. 77-85.
[176] S. Mindess, J.F. Young, D. Darwin, Concrete, 2003.
[177] C. Shi, J.A. Stegemann, R.J. Caldwell, Effect of supplementary cementing
materials on the specific conductivity of pore solution and its implications on the rapid
chloride permeability test (AASHTO T277 and ASTM C1202) results, Aci Mater J, 95
(1998) 389-394.
[178] R. Feldman, L.R. Prudencio Jr, G. Chan, Rapid chloride permeability test on
blended cement and other concretes: correlations between charge, initial current and
conductivity, Construction and Building Materials, 13 (1999) 149-154.
[179] A.A. Ramezanianpour, A. Pilvar, M. Mandikhani, F. Moodi, Practical evaluation of
relationship between concrete resistivity, water penetration, rapid chloride penetration
and compressive strength, Construction and Building Materials, 25 (2011) 2472-2479.
[180] Z. Liu, J.J. Beaudoin, An assessment of the relative permeability of cement systems
using AC impedance techniques, Cement Concrete Res, 29 (1999) 1085-1090.
[181] J.H. Ideker, T. Fu, T. Deboodt, Development of Shrinkage Limits and Testing
Protocols for ODOT HighPerformance Concrete, FHWA-OR-RD-14-09, The Federal
Highway Administration, McLean, VA, 2013.