property watch q4’15. theexpectationamongstallpropertyagents for2016isthatanewphasewillemergeinthe...
TRANSCRIPT

Property Watch
AIB is supporting new homes developmentAIB, through the Land & Development team in the Property Lending Unit and through their networkof New Business Centres, is currently supporting the development of in excess of 1,400 residential units.
Special ReportIDA Ireland on the property industry’s role in securing Foreign Direct Investment (FDI).
Housing commencements reachedjust over 8,000 in 2015, but upfrom a low base
+19%
Inside this Issue:
Highest level of take-upin Dublin office marketsince 2007
c.250,000m2
Another record year forproperty investment
€3.5bn
From Property Industry Ireland, the most influential property organisation in Ireland
Q4’15

Mario Cuomo, the Democratic governor of New York inthe 1980s and 1990s famously said that the politiciancampaigns in poetry and governs in prose.
This second edition of Property Watch is published ata moment in Irish political life when the poetry of themanifesto is being negotiated into the hard text of aprogramme for government.
The tone and content of that programme for government –if a consensus between the parties to govern can bemade – will shape the economy and the property sectorwhich it serves for the next five years.
If the incoming government needs some guidancewhere it should focus its attention on building sustainableeconomic growth, a look at the data in this report wouldbe a great starting point.
There is no doubt that activity is increasing in the Irishproperty sector. Whether the measure is residentialsales, commercial property investment or house-building, the indicators look more positive than theyhave done in the past.
Nonetheless, there is much still to be done if the Irishproperty sector is to play its part in delivering realeconomic growth, attracting further investment intoIreland and ensuring an increased supply of high quality,affordable housing.
This report is part of PII’s commitment to provide theindustry and wider community with evidence-basedresearch underpinned by the highest standards oftransparency to help everyone make better, moreinformed decisions.
As always, feedback is important, so please do let meknow if you have ideas for improvements for future editions.
Dr Peter StaffordDirector, Property Industry Ireland
2
IntroductionNo matter whichparties form the nextgovernment, propertyshould be top oftheir agenda

3
There was strong activity in the Dublin office market in2015 as take-up reached its highest level since 2007.As a result, rents in Dublin came under pressure, with allagents reporting double-digit growth in prime rents overthe year. Similarly take-up in the Dublin industrial marketreached its highest level since 2006, spurred on bystrong demand from multinationals and pharmaceuticals,as well as a growing online retail sector. The recentrecord levels of take-up experienced in both the officeand industrial sectors reflected the economic recoveryand the growing employment base, with over 44,000additional jobs created last year, 52 per cent of whichwere in the Dublin region.
However, with the jobs recovery less prevalent outsideDublin, the performance of the core commercial urbanmarkets outside Dublin was less favourable. That said,demand was strong for good quality Grade A officespace, with a shortage of same now emerging inGalway, Limerick and Cork. In the retail sector, therebound in consumer sentiment and retail spending isboosting demand from both overseas and internationalretailers for well-located stores across the country.
As transactions absorb the available office space inDublin and rents continue on an upward trend, thereturn of cranes to the Dublin skyline signalled aresumption of office construction activity in the Capitalduring 2015. This is a welcome development and willhelp to sustain the economic recovery, although muchof the supply in the pipeline may not come on-streamuntil 2017 or later. However, the extent of developmentin the pipeline has led to some agents raising concernsabout oversupply in the medium-term. There is alsoevidence of some prime movers embarking on industrialdevelopment activity in Dublin for the first time since2007, although the quantum is limited and the expectationis that industrial rents and capital values will risefurther this year.
The continued shortage of housing supply, particularlyin Dublin, is having adverse repercussions for thoselooking to rent accommodation, with Dublin rentscontinuing to rise strongly. The trend in house prices isperversely the opposite as Dublin house prices declinedmodestly in the latter months of 2015. However outsideof Dublin, residential property price inflation last yearwas almost double the corresponding rate in theprevious year. Whether these trends continue, willlargely depend on the outcome of the forthcomingreview of the Central Bank’s macroprudential rules overthe summer. The key challenge for the next governmentis without question the lack of supply right across thesocial, rented and owner occupied housing sectors.Until such time as the supply side issue is addressed,accommodation pressures for those entering the jobsmarket could well undermine the economic recovery.
It seems the ongoing appetite for Irish property fromdomestic and foreign investors continues to surpriseas 2015 delivered another strong year in terms ofinvestment activity, both with respect to loan and assetsales. The total investment in Irish property assets(excluding loan sales) reached approximately €3.5 billionin 2015. The expectation amongst all property agentsfor 2016 is that a new phase will emerge in theinvestment market, characterised by a slowdown indeleveraging activity, and an increase in secondarytrading of those assets purchased over the last numberof years, as those investors look to generate incomefrom their existing assets but also considerdevelopment and refurbishment opportunities.
Annette Hughes,Director, DKM Economic Consultants
PropertyOverviewThe recovery in thecommercial propertymarket gatheredmomentum in 2015

2011On 2 July, the Irish Times announced that major playersin property and construction were intending to launch alobby group having “set aside their own narrow interestsin a bid to aid a recovery in the property sector, which,in turn, would boost economic recovery.”
PII’s first report showed that construction output inIreland related to about 5.9 per cent of GDP in the firstquarter of 2011. The European average was 11.2 percent. Bridging that gap would need huge publicinvestment but such an investment would have animmediate economic dividend in job creation.
Among the objectives outlined in PII’s first policydocument was support for the Government’s recentjobs initiative and for green economy projects,including energy efficiency retrofitting.
A funding group was established by PII to find alternativefunding mechanisms for projects and to try to sourceworking capital, first-time buyer mortgages andinvestor finance packages.
The new organisation committed itself to provide“constructive input” to ensure Nama’s “long-termpositive impact on economic recovery”, and plannedto provide a policy input to the review on upward-onlycommercial rental leases.
This group very quickly worked with other stakeholdersto promote legislation to create Real EstateInvestment Trusts.
2012In April, PII warned of a dearth of commercial officespace in growth areas. While investment in Ireland byGoogle, Bank of New York Mellon, Citigroup, Facebook,Eli Lilly, PayPal and MasterCard was good news for Ire-land, a shortage of high quality office space was alooming problem for economic growth.
A 2012 report by PII said that “development must besustainable and is only a means to an end: the provisionof sustainable employment for those who live and workin what is built.”
On 2 July, PII launched its Planning a Better Futurereport. Amongst its 67 recommendations for reform,it recommended that local authorities with planningpowers should be cut from 88 to 34, with all boroughand town councils abolished, The report said a“redefined planning system…should put aside pastmistakes and put in place a robust, professionallycompetent and publicly supported planning process”that would contribute positively to the regenerationof Ireland’s economy.
It wanted the National Spatial Strategy (NSS) to berevisited, with “an immediate re-evaluation of thenumber of identified gateways and hubs”, saying thatthe 2002 strategy “has failed to meet its initial objectives[and] remains largely aspirational”. While recognisingthere would be “difficult political barriers” to be overcomein revising the NSS, the report sought a “justified andquantified prioritisation” of the nine gateways and ninehubs designated for development 10 years ago.
LatestNewsThe last fiveyears fromPII's perspective
4
On reaching PII’s fifth birthday, it is a goodopportunity to review PII’s policy agenda since2011 and discuss many of the issues whichhave brought industry and government together.

5
2014The 2014 PII Conference focused on Making CitiesWork. Guest speakers included Sir Edward Lister, thedeputy mayor of London for planning and infrastructure.The conference covered themes such as investingin sustainable cities, urban geography andspatial development.
The pre-budget submission focused on the need toaccelerate an existing programme of selling surplusState property by €250m to fund up to 5,500 newsocial houses and aid the Government in its pledgeto end homelessness by 2016.
PII said that cutting the windfall tax on property that isrezoned from agricultural use to residential to thestandard 33 per cent rate, from its current 80 per centlevel, would help speed up the supply of suitable land. Italso called for a time-limited reduction on the VAT rateon the construction of residential property to 9 per cent,from 13.5 per cent.
2013In mid-2013, PII warned that a “potentially seriousproblem of undersupply” was emerging in areas ofthe property market and the position was not likely tochange until new development is started. It warnedthat the State and policy-makers were still lookingbackwards about the oversupply of property in someareas, but this focus on over-supply of some propertymeant it was easy to miss the looming crisis in thelack of new product on the market.
Late in 2013, Property Industry Ireland published itsNational Property Strategy which urged the Governmentto encourage professional long-term investment intothe private rented sector and extend into next year theseven-year capital gains tax exemption for such purchases.
2015In February, chairman of the PII Market Supply andDemand Committee Mark FitzGerald wrote an opinionpiece in the Irish Times in which he said: “In the sameway that we can’t have democracy without politicians,we can’t have development without developers.” Hewarned that the new Central Bank mortgage rules werelikely to suppress development in the centre of Dublinand “ultimately the policy is likely to encouragedevelopment in Kildare, Meath and Wicklow.”
In early 2015, PII made a detailed submission to theCentral Bank of Ireland warning of the impact of theproposed lending rules on the supply of new homesand the potential to cause a significant increase inrents. The PII Submission recommended the graduatedintroduction of lending rules which could be responsiveto changes in the market, have different rules fordifferent types of mortgage-holder and recognise thepotential second-round impact of the policy on therented sector and the delivery of new urban homes.
On the same day that the Housing Agency warned thatonly half the required number of homes would be builtin 2015, PII published its budget submission. PIIsought “targeted tax measures”and It argued that theGovernment should change housing standards rules toencourage investment in purpose-built student hallsof residences.
According to the submission: “This should includemaking student housing a separate property type inplanning and design regulations to encouragedevelopment of halls of residences in brownfield orunder-developed urban areas.”
The planning process should be accelerated, with localauthorities required to rule on planning applications forhousing developments and social housing projectswithin six weeks of receipt of the application.
The Irish economy experienced spectacular growth in2015. The combination of favourable exchange rates,weak oil prices and low interest rates benefited Irelandmore than any other EU country. While final yearfigures for 2015 are yet to be released, given thestrong performance of government tax receipts andemployment in the latter part of the year, Ibec expectsthat GDP growth for 2015 should be 7.1%. This wouldbe the highest growth rate experienced by Ireland in 15years, making it the fastest growing economy in the EUfor two years running. Growth in previous years washeavily concentrated in certain sectors and regions, but2015 was a turning point with notable improvementsmade throughout the economy.
Given the weak euro, exports grew significantly in 2015but the primary reason why growth in 2015 exceededinitial expectations was the strong recovery in domesticdemand. Investment is estimated to have grown by27.2% while consumer spending is expected to be upby 3.7% in 2015. This strong growth in consumptionreflects improvements in wages and employment.Disposable income in the first nine months of the yearwas up 9% over the same period in 2014.This wasreflected in higher consumer activity, but not all of thisadditional income was spent as savings grew at afaster rate over the period.
This strong growth was also accompanied by a stellarperformance in the public finances. Tax receipts for2015 were €3.3 billion ahead of target, reflecting thebuoyancy in both the domestic and export sectors ofthe economy. Much of this additional revenue was dueto an overshoot in corporate tax receipts but thiscombined with strong economic growth has meantthat government has reduced the budget deficit andexceeded initial fiscal targets.
This upswing in the economy has also been reflectedin employment figures, as 2015 saw the creation ofroughly 50,000 jobs. This has caused the unemploymentrate to fall from double digits at the beginning of the
year to less than 9%. While this job growth is now beingseen across all regions (barring the West), the pace ofthis recovery differs greatly amongst them. Employmentin Dublin is currently growing by 5% annually comparedto 2% in the rest of the country. This will increase pressureon housing and infrastructure in Dublin in the short termand exacerbate regional inequality long-term.
While it would be difficult to beat last year’s exceptionalperformance again in 2016, growth this year is stillexpected to be strong. The weak euro and low oil pricesare temporary but they are showing little sign of abatingin 2016. The continued improvements in the labourmarket should also have a positive impact on incomesand consumer spending. Early indicators for Januaryalready suggest that last year’s momentum is likely tocontinue with the unemployment rate as low as 8.6%and tax returns up 7.3%.
That said, there are some serious downside risks towhich the economy is exposed. While the Irish economyhas benefited from favourable movements which areoutside of our control, other economies haven’t beenas lucky. The global economy is showing signs of aslowdown and this is particularly evident in emergingmarket economies. Therefore, these transitory gains toIreland should be viewed with caution. Losses to ouroverall competitiveness elsewhere in the economy willleave Ireland very exposed once these temporaryfactors recede. One such weakness in Ireland is the lowlevel of investment, which is currently at its lowest levelin recorded history. While private investment has beenstrong, public investment fell by 57% in the past sevenyears. This underinvestment in education, transport andother areas of the economy are now at risk of derailinggrowth in the economy. Without investment, worldclass education facilities, improved transport and agreater supply of affordable housing, this spectaculargrowth might disappear as quickly as it came.
EconomicOutlook2015 was an excellentyear for the Irisheconomy but cautionis needed
6

Agriculture 107
2013
Labour Market and Sectoral Employment (000s annual averages)
2014 2015(E)
Industry 343
Services 1,430
Total 1,879
Employment growth (%) +2.4
Unemployed 282
Unemployment rate (%) 13.0
Labour Force 2,163
109
348
1,453
1,911
+1.8
243
11.3
2,157
111
377
1,473
1,962
+2.8
201
9.3
2,166
2016(F)
112
400
1,506
2,018
+2.6
174
8.0
2,192
7
Source: CSO, Ibec Forecasts. E = Estimate. F = Forecast.
Consumer spending 2.0
2014
Irish GNP and Components Annual YoY% Change
2015(E) 2016(F)
Government spending 4.6
Investment 14.3
Exports 12.1
Imports 14.7
GDP (Volume) 5.2
GNP (Volume) 6.9
GDP (Value) 5.3
3.7
1.4
27.2
13.7
15.9
7.1
5.9
11.7
4.4
3.1
13.1
9.1
11.5
4.3
4.4
7.2Source: CSO, Ibec Forecasts. E = Estimate. F = Forecast.

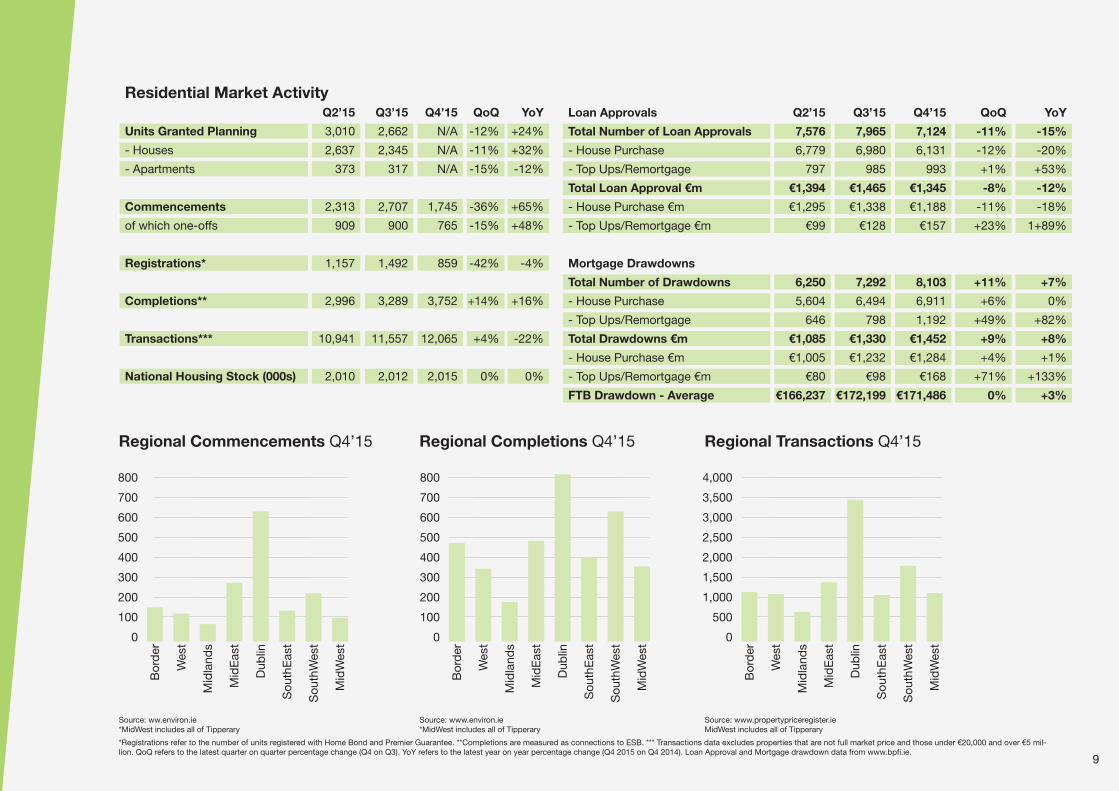
The residential property market in Ireland remained in achallenged position in the second half of 2015. Supplycontinued to be constrained with commencementsdropping off to less than 1,800 units in Q4’15 from over2,700 in the previous quarter. This is a concerning trendas commencements had gained meaningful momentumin both Q2 and Q3’15. Despite the drop-off in Q4’15,and the latent lack of supply to the market in recentyears, total commencements for the second half of2015 were more than double the total for the sameperiod in 2014 and were up, in annual terms, byalmost 19 per cent in the full year.
The number of residential units granted planningpermission also fell on a quarterly basis by 12 per centin Q3’15 (latest available), indicating a weak pipeline forresidential development. Within the total, the numberof houses granted planning was down by almost 300units QoQ, albeit the number rose by 32 per cent YoY.Cumulatively the total units (houses and apartments)granted planning recorded a YoY increase of 24 percent, although from a low base. That said, just less than11,000 units had planning permission in the year toQ3’15, of which less than 1,500 were for apartments.
Completions (i.e. electricity connections) increased at arobust quarterly rate of 14 per cent in Q4’15, generatinga total of 12,666 in the year, an annual increase ofalmost 15 per cent. Although growing, completionsremain significantly below what is being commenced –just over 8,000 in 2015 - implying the number of unitsconstructed will need to increase substantially over thenext two years to meet the excess demand for housingthat currently exists.
Property transactions in the final quarter of 2015recorded mixed results, increasing at a quarterly rateof 4 per cent but declining YoY by 22 per cent. Over12,000 transactions occurred across the country inQ4’15 and this represented the third consecutivequarterly increase since market activity contracted
sharply in Q1’15. Around 45,000 (per DKM methodology)residential property transactions occurred in 2015, anincrease of almost 7 per cent on the 2014 outturn.Activity accelerated significantly across all counties inthe year, illustrating how the recovery in the residentialmarket is spreading out from Dublin and the otherurban centres.
As the Central Bank rules became fully bedded downin the last quarter of 2015, it is interesting that thenumbers of mortgage drawdowns increased by 6.4 percent when mortgages involving a house transaction onlyare included, compared with almost 16 per cent in theprevious quarter. The corresponding value increase was4.2 per cent, down from 22.6 per cent the previousquarter. Surprisingly loans to first-time buyers (FTBs)were up by 4 per cent in Q4’15 but declined in YoYterms by 5.4 per cent. However, the average FTB loanat almost €171,500 was up by 2.6 per cent YoY.
The prevalence of cash buyers remained a feature ofthe market in Q4’15, when the number of mortgagedrawdowns (8,103) is compared with total residentialtransactions (12,065) in the quarter. The overall proportionof cash buyers in 2015 was around 46 per cent.
On a regional basis, Dublin dominated residentialconstruction with over one-third of all commencementsarising in the Capital in Q4’15. Commencements wereweakest in the Midwest (Limerick, Clare and Tipperary)and Midlands (Laois, Longford, Offaly and Westmeath)with fewer than 100 commencement notices in eachregion. The greatest proportion of completions arosein Dublin at 22 per cent, but this was more closelyfollowed by the Southwest (17%) and Mideast (13%).
As 2016 gets underway and a new government is put inplace, the housing challenges across the social, privaterented and owner occupied sectors are likely to remainvery much to the fore for the foreseeable future.
ResidentialMarketActivityJust over 8,000units commencedin 2015
8
Bor
der
Wes
t
Mid
land
s
Mid
Eas
t
Dub
lin
Sou
thE
ast
Sou
thW
est
Mid
Wes
t
800
700
600
500
400
300
200
100
0
Bor
der
Wes
t
Mid
land
s
Mid
Eas
t
Dub
lin
Sou
thE
ast
Sou
thW
est
Mid
Wes
t
800
700
600
500
400
300
200
100
0
Bor
der
Wes
t
Mid
land
s
Mid
Eas
t
Dub
lin
Sou
thE
ast
Sou
thW
est
Mid
Wes
t
4,000
3,500
3,000
2,500
2,000
1,500
1,000
500
0
Regional Commencements Q4’15 Regional Completions Q4’15 Regional Transactions Q4’15
3,010 2,662 N/AUnits Granted Planning
Residential Market Activity
-12%
2,637 2,345 N/A- Houses -11%
373 317 N/A- Apartments -15%
2,313 2,707 1,745Commencements -36%
909 900 765of which one-offs -15%
1,157 1,492 859Registrations* -42%
2,996 3,289 3,752Completions** +14%
10,941 11,557 12,065Transactions*** +4%
+24%
Q2’15 Q3’15 Q4’15 QoQ YoY
+32%
-12%
+65%
+48%
-4%
+16%
-22%
2,010 2,012 2,015National Housing Stock (000s) 0% 0%
Loan Approvals Q2’15 Q3’15 QoQ YoY
7,576 7,965 -11%Total Number of Loan Approvals -15%
6,779 6,980 -12%- House Purchase -20%
797 985 +1%- Top Ups/Remortgage +53%
€1,394 €1,465 -8%Total Loan Approval €m -12%
€1,295 €1,338 -11%- House Purchase €m -18%
€99 €128 +23%- Top Ups/Remortgage €m 1+89%
6,250 7,292 +11%Total Number of Drawdowns +7%
5,604 6,494 +6%- House Purchase 0%
Mortgage Drawdowns
646 798 +49%- Top Ups/Remortgage +82%
€1,085 €1,330 +9%Total Drawdowns €m +8%
€1,005 €1,232 +4%- House Purchase €m +1%
€80 €98 +71%- Top Ups/Remortgage €m +133%
€166,237 €172,199
Q4’15
7,124
6,131
993
€1,345
€1,188
€157
8,103
6,911
1,192
€1,452
€1,284
€168
€171,486 0%FTB Drawdown - Average +3%
9
Source: ww.environ.ie*MidWest includes all of Tipperary
*Registrations refer to the number of units registered with Home Bond and Premier Guarantee. **Completions are measured as connections to ESB. *** Transactions data excludes properties that are not full market price and those under €20,000 and over €5 mil-lion. QoQ refers to the latest quarter on quarter percentage change (Q4 on Q3). YoY refers to the latest year on year percentage change (Q4 2015 on Q4 2014). Loan Approval and Mortgage drawdown data from www.bpfi.ie.
Source: www.environ.ie*MidWest includes all of Tipperary
Source: www.propertypriceregister.ieMidWest includes all of Tipperary

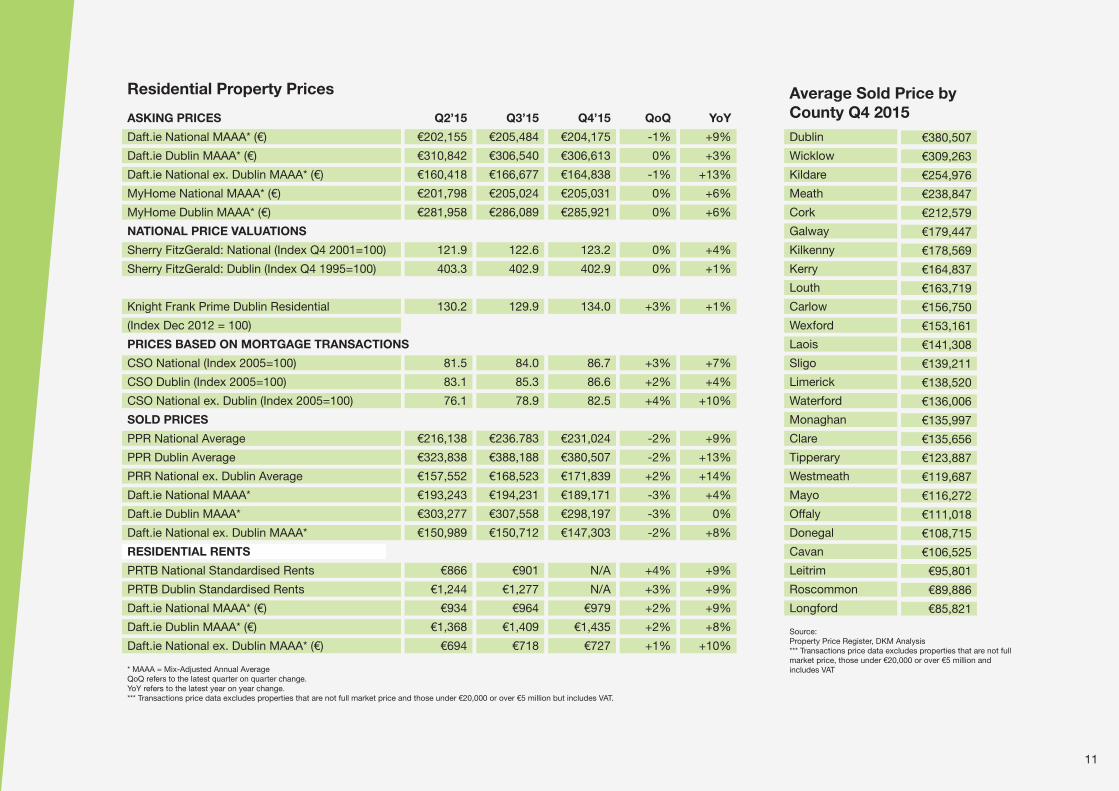
Reversal of trend in property pricegrowth as the rest of Irelandovertakes DublinThe two-speed recovery in Irish residential propertyprices has seen a clear distinction develop betweenDublin and the rest of the country over the past numberof years, up to and including Q4’15. Dublin recorded thestrongest rates of price growth in previous years, as therecovery took hold first in the Capital, before extendingto other regions around the country. However, this trendhas reversed to a remarkable degree in recent quartersas price growth in the rest of Ireland has significantlyexceeded that recorded in Dublin. This is consideredto be a consequence of a delayed recovery outsidethe Capital, combined with the effects of the CentralBank’s lending rules.
This trend is illustrated in the range of house priceindicators included in the table opposite, where houseprice inflation has recently been strongest in the rest ofIreland. In terms of asking prices, Daft.ie reported thatproperty prices outside Dublin in Q4’15 were 13.1 percent ahead of the same period in 2014. This contrastsstrikingly with Dublin where house prices had risen byonly 2.7 per cent over the year. The CSO’s residentialprice index, based on mortgage transactions, reflecteda similar scenario with prices outside Dublin rising by10.2 per cent YoY in Q4’15, far in excess of the 3.5 percent growth recorded in the Capital. Finally, Daft.ie’sdata on the average sold prices across the countryprovides further evidence of this trend with the mix-adjusted annual average (MAAA) house price growth inDublin falling by 0.4 per cent YoY in Q4’15, considerablylower than the robust growth rate of 7.6 per centrecorded for average sold prices across the restof the country.
On a quarterly basis, it became evident in Q4’15 thatgrowth in residential property prices was generallyslowing across Ireland. The MyHome National andDublin MAAA asking prices were flat in the quarter;similar trends are evident from Sherry FitzGerald’sNational and Dublin price valuation indices. Daft.iereported a slight decline in asking prices QoQ on anational basis, with sold prices also falling acrossthe country by 2.6 per cent in the quarter.
The Knight Frank Prime Dublin Residential Index, whichmonitors the top 5 per cent of the residentialmarket by market value, comprising the very high endof the Dublin residential property market, reportedmodest growth of around 1 per cent in YoY terms.
The two speed recovery in residential prices which hastaken hold across the country has had a significanteffect on the rental market, particularly when consideredagainst the persistent lack of new housing supply.Potential first-time buyers are now required to build uplarger deposits while mortgages are capped at 3.5 timesannual income, meaning that a substantial proportion ofthe Capital’s first-time buyers now find themselveshaving to rely on the rental market for longer periodsof time. This effect has been most severe in thesupply- restricted Dublin region where MAAAresidential rents in Dublin reached €1,435 in Q4’15,according to Daft.ie, an increase of 8.2 per cent YoY.Residential rents outside the Capital are considerablymore affordable but also increased at a significant rateof 9.8 per cent YoY in Q4’15 to reach an average of€727. The PRTB’s standardised rents portray a similarpicture for Q3’15, with rents in Dublin 8.7 per centhigher than in the same quarter in 2014. Rents acrossIreland also rose by in excess of 8.5 per cent YoYindicating how pressurised the rental market hasbecome in recent times.
ResidentialPropertyPricesLittle or no changein asking priceswhile sold priceswere mostly lowerin Q4
10
€202,155 €205,484 €204,175
€310,842 €306,540 €306,613Daft.ie Dublin MAAA* (€)
Daft.ie National MAAA* (€)
€160,418 €166,677 €164,838Daft.ie National ex. Dublin MAAA* (€)
€201,798 €205,024 €205,031MyHome National MAAA* (€)
121.9 122.6 123.2Sherry FitzGerald: National (Index Q4 2001=100)
403.3 402.9 402.9Sherry FitzGerald: Dublin (Index Q4 1995=100)
PRICES BASED ON MORTGAGE TRANSACTIONS
81.5 84.0 86.7CSO National (Index 2005=100)
76.1 78.9 82.5CSO National ex. Dublin (Index 2005=100)
SOLD PRICES
€216,138 €236.783 €231,024PPR National Average
€157,552 €168,523 €171,839PRR National ex. Dublin Average
€193,243 €194,231 €189,171Daft.ie National MAAA*
€303,277 €307,558 €298,197Daft.ie Dublin MAAA*
€150,989 €150,712 €147,303Daft.ie National ex. Dublin MAAA*
€866 €901 N/APRTB National Standardised Rents
€1,244 €1,277 N/APRTB Dublin Standardised Rents
€934 €964 €979Daft.ie National MAAA* (€)
€1,368 €1,409 €1,435
-1%
0%
-1%
0%
0%
0%
+3%
+4%
-2%
+2%
-3%
-3%
-2%
+4%
+3%
+2%
+2%
+9%
+3%
+13%
+6%
€281,958 €286,089 €285,921MyHome Dublin MAAA* (€) 0% +6%
NATIONAL PRICE VALUATIONS
+4%
+1%
130.2 129.9 134.0Knight Frank Prime Dublin Residential
(Index Dec 2012 = 100)
+3% +1%
+7%
83.1 85.3 86.6CSO Dublin (Index 2005=100) +2% +4%
+10%
+9%
€323,838 €388,188 €380,507PPR Dublin Average -2% +13%
+14%
+4%
0%
+8%
RESIDENTIAL RENTS
+9%
+9%
+9%
+8%
Q2’15 Q3’15 Q4’15ASKING PRICES
Dublin €380,507
€309,263
€254,976
€238,847
€212,579
€179,447
€178,569
€164,837
€163,719
€156,750
€153,161
€141,308
€139,211
€138,520
€136,006
€135,997
€135,656
€123,887
€119,687
€116,272
€111,018
€108,715
€106,525
€95,801
€89,886
€85,821
Wicklow
Kildare
Meath
Cork
Galway
Kilkenny
Kerry
Louth
Carlow
Wexford
Laois
Sligo
Limerick
Waterford
Monaghan
Clare
Tipperary
Westmeath
Mayo
Offaly
Donegal
Cavan
Leitrim
Roscommon
Longford
Average Sold Price byCounty Q4 2015
Residential Property Prices
QoQ YoY
Daft.ie Dublin MAAA* (€)
€694 €718 €727 +1% +10%Daft.ie National ex. Dublin MAAA* (€)
* MAAA = Mix-Adjusted Annual AverageQoQ refers to the latest quarter on quarter change.YoY refers to the latest year on year change.*** Transactions price data excludes properties that are not full market price and those under €20,000 or over €5 million but includes VAT.
Source:Property Price Register, DKM Analysis*** Transactions price data excludes properties that are not fullmarket price, those under €20,000 or over €5 million andincludes VAT
11

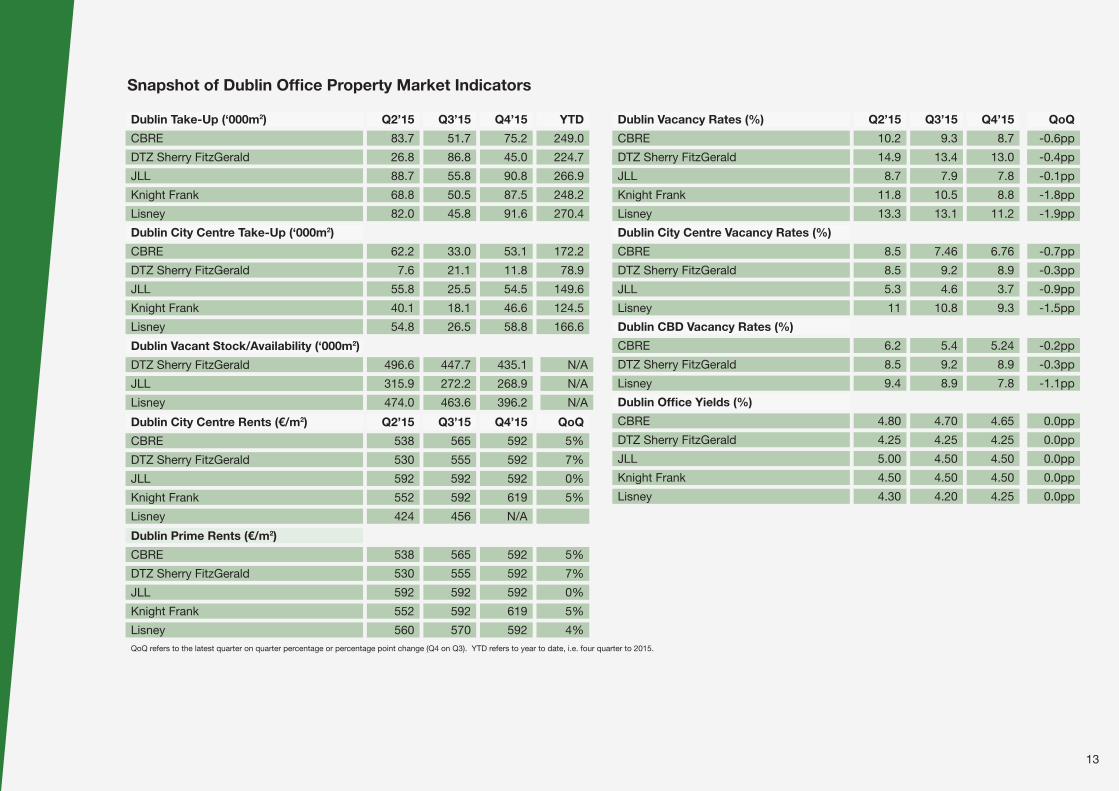
All of the property agents’ commentaries on the outturnfor 2015 report the strong uplift in the volume of officemarket activity last year. In a market comprising a stockof around 3.34m2 at the end of 2015 (DTZ SF), the totaltake-up came in at an average of around 252,000m2.This figure is based on estimates from five propertyagents, which range from 224,700m2 (DTZ SF) to270,400m2 (Lisney). While each agent reports somewhatdifferent historical figures for each year, there is ageneral consensus that the 2015 take-up level was thehighest annual level since 2007. A number of agentscompare the 2015 outturn with trends historically,notably the five year average annual take-up in Dublin of266,630m2 (JLL), the ten year average annual take-up of177,000m2 (CBRE) and the long-run annual average of145,850m2 (DTZ SF) over the last nineteen years.
In terms of Q4’15, all five agents with the exceptionof DTZ Sherry FitzGerald, reported higher take-upcompared with the previous quarter. The increase wasalmost 100 per cent, according to Lisney. There werefive large transactions in Q4 in excess of 5,000m2. TheIT sector dominated the market, accounting for the twolargest transactions in the quarter. The first was to thetechnology company, Workday, which has agreed tolease around half of the space in the Kings Building atthe rear of the Four Courts. The company is reported tohave negotiated a rent of €269 per m2 (€25 per sq ft) for8,815m2 under a 10-year lease. The second was to Twit-ter, which is to move into the 10,405m2 CumberlandHouse later this year, following a €27 million refurbishmentby Hibernia REIT, who acquired the building in March2015. Twitter is reported to be taking a 20 year leaseon the majority of the building, with tenant-only breakoptions after 12 and 15 years, and to be paying rentof €538 per m2 (€50 per sq. ft).
Take-up in Dublin city centre totalled 138,360m2 onaverage across five agents, ranging from 78,900m2
(DTZ Sherry FitzGerald) to 172,200m2 (CBRE),corresponding to 55 per cent of the total averagetake-up take up across Dublin last year. Ongoing supplyconstraints in Dublin city centre are reported to haveshifted occupier demand to the secondary and suburbanmarkets, with the south suburbs being the mostsought after location.
Three agents reported a decline in the overall Dublinoffice market vacancy rate again in Q4 to between 8and 9 per cent (CBRE, JLL, KF), while two agentsreported a year-end vacancy figure between 11 (Lisney)and 13 per cent (DTZ SF).
While the lack of supply is particularly acute in theSouth Docks Area, a number of agents have raisedconcerns about oversupply in the Dublin office market.Estimates vary of the volume of office space underconstruction at the end of 2015, ranging from209,950m2 (DTZ SF) to 270,000m2 (in 23 officeschemes, CBRE) to close to 280,000m2 (JLL). Excludingthe Space which has been pre-let, suggests there are inthe region of 170,000m2 left to meet demand overthe coming years.
In the city centre, Lisney have reported that there are 12office schemes or extensions to existing buildings underconstruction, comprising a total of 103,500m2 of newaccommodation. Excluding pre-lets, Lisney suggestthere are 43,700m2 available in the city centre, which issubstantially short of the quantum of take-up in 2015,implying any immediate concerns about oversupplyare not justified.
Thus, while oversupply is not considered to be animmediate concern, there is significant development inthe pipeline, with another 40 schemes planned for thecity centre alone, totalling in excess of 560,000m2,albeit not all of these will proceed to construction,according to Lisney.
A number of agents suggest that 2016 is more likely tobe a year characterised by a reduction in good qualityspace in the city centre, resulting in little choice fortenants and further rent increases, with tenants forcedto look to the suburbs for space. This is expected togenerate faster growth in rents in the suburbs comparedwith the city centre, a trend which may alreadybe happening.
CommercialOfficeMarketOversupply not animmediate concern
12
13
Dublin Take-Up (‘000m2) Q2’15 Q3’15 Q4’15 YTD
Q2’15 Q3’15 Q4’15 QoQ
CBRE 83.7 51.7 75.2 249.0
DTZ Sherry FitzGerald 26.8 86.8 45.0 224.7
JLL 88.7 55.8 90.8 266.9
Knight Frank 68.8 50.5 87.5 248.2
Lisney 82.0 45.8 91.6 270.4
Dublin City Centre Take-Up (‘000m2)
CBRE 62.2 33.0 53.1 172.2
DTZ Sherry FitzGerald 7.6 21.1 11.8 78.9
JLL 55.8 25.5 54.5 149.6
Knight Frank 40.1 18.1 46.6 124.5
Lisney 54.8 26.5 58.8 166.6
Dublin City Centre Rents (€/m2)
CBRE 538 565 592 5%
DTZ Sherry FitzGerald 530 555 592 7%
JLL 592 592 592 0%
Knight Frank 552 592 619 5%
Lisney 424 456 N/A
Dublin Prime Rents (€/m2)
CBRE 538 565 592 5%
DTZ Sherry FitzGerald 530 555 592 7%
JLL 592 592 592 0%
Knight Frank 552 592 619 5%
LisneyQoQ refers to the latest quarter on quarter percentage or percentage point change (Q4 on Q3). YTD refers to year to date, i.e. four quarter to 2015.
560 570 592 4%
Dublin Vacant Stock/Availability (‘000m2)
DTZ Sherry FitzGerald 496.6 447.7 435.1 N/A
Q2’15 Q3’15 Q4’15 QoQ
JLL 315.9 272.2 268.9 N/A
Lisney 474.0 463.6 396.2 N/A
Dublin Vacancy Rates (%)
CBRE 10.2 9.3 8.7 -0.6pp
Sherry Fitzgerald 14.1 -0.9pp -0.9pp -0.9pp
JLL 10.2 -0.9pp -0.9pp -0.9pp
Lisney 13.3 13.1 11.2 -1.9pp
Dublin City Centre Vacancy Rates (%)
CBRE 8.5 7.46 6.76 -0.7pp
DTZ Sherry FitzGerald 8.5 9.2 8.9 -0.3pp
JLL 5.3 4.6 3.7 -0.9pp
Lisney 11 10.8 9.3 -1.5pp
Dublin CBD Vacancy Rates (%)
CBRE 6.2 5.4 5.24 -0.2pp
DTZ Sherry FitzGerald 8.5 9.2 8.9 -0.3pp
Lisney 9.4 8.9 7.8 -1.1pp
Dublin Office Yields (%)
CBRE 4.80 4.70 4.65 0.0pp
DTZ Sherry FitzGerald 4.25 4.25 4.25 0.0pp
JLL 5.00 4.50 4.50 0.0pp
Knight Frank 4.50 4.50 4.50 0.0pp
Lisney 4.30 4.20 4.25 0.0pp
JLL 8.7 7.9 7.8 -0.1pp
Knight Frank 11.8 10.5 8.8 -1.8pp
DTZ Sherry FitzGerald 14.9 13.4 13.0 -0.4pp
Snapshot of Dublin Office Property Market Indicators

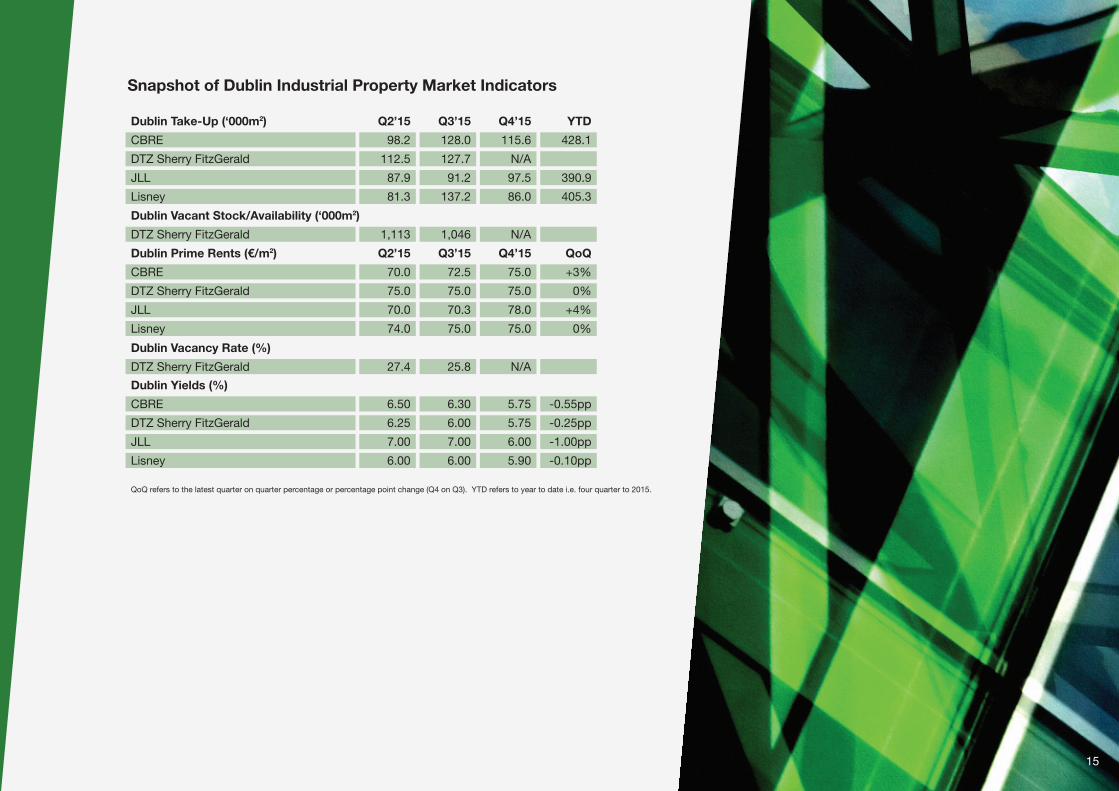
The strong demand for industrialspace in Dublin continuesThe last quarter of 2015 saw a remarkable level oftake-up in Dublin varying from 86,000m2 (Lisney) to115,579m2 (CBRE). This brought the total take-up in2015 to between 391,000m2 (JLL) and 428,100m2
(CBRE). This implies an average take-up last year ofaround 408,000m2 which is only the fourth time in 21years that industrial take-up has reached 400,000m2 inDublin (Lisney). Using JLL’s figures, the total take-up in2015 exceeded the previous 2014 peak of 271,405m2
by 44 per cent.
Within the year there were 12 very large transactionsexceeding 7,000m2 (Lisney) which represented approximatelyone third of the total activity, indicating that the highindustrial take-up in Dublin in 2015 was highly influencedby a few very large transactions. Multinational corporationshave had a particularly large effect on industrial take-upin Dublin (Lisney). Activity during Q4’15 was focusedaround Dublin South West which accounted for 49 percent of total take-up in Dublin (JLL).
However throughout 2015 the supply of modern industrialspace in prime locations has decreased rapidly.Additionally the limited number of construction projectscurrently in progress forced industrial prime rentsupward to between €75 (CBRE) to €78 (JLL) per m2 inQ4’15. Rents are expected to continue to increase into2016 and beyond as growing demand exceeds supply(CBRE). The available supply decreased throughout2015 to below 950,000m2, the lowest level since 2009,resulting in the Dublin vacancy rate fallingto an estimated 15 per cent (Lisney).
2016 looks set to be another strong year with companieslinked to online retailing distribution, pharmaceuticalsand data centres (JLL) expected to drive demand.Overall the industrial sector is recovering fast. Thecontinued supply quality issue and lack of newconstruction will drive up industrial rents and decreasethe vacancy rate, but this should also encourageinvestors and contractors to start building again.
All indicators point to abusy year for retailersThere are several positive trends emerging in keyindicators which will drive a greater level of activity in theretail property sector. An upward trend in the KBC/ESRIConsumer Sentiment Index during 2015 was encouraging,while there was also an 11.4 per cent YoY increase indomestic demand in Q3 2015. Total employment was upby 56,100 in the year to Q3 2015, and the growth in retailsales volumes accelerated to 8.3 per cent in 2015.
Reports suggest that the retail property market isexperiencing increased demand from both domestic andoverseas retailers, with that demand spreading outbeyond prime city areas. The very significant ProjectJewel retail portfolio transaction in the latter half of 2015may result in others looking to the Irish market for retailinvestment opportunities. Indeed DTZ Sherry FitzGeraldsuggest that retail accounted for 27 per cent of theoverall property investment turnover in 2015 with around€1 billion of retail property changing hands.
Overall retail rents rose by 10.4 per cent in 2015 (Lisney).However, serious challenges remain outside of Dublin,most notably in the Connacht/Ulster region, where primerents declined by almost 36 per cent in 2015, accordingto the Society of Chartered Surveyors (SCSI PropertyReview & Outlook 2016). That said, CBRE expects thehighest growth in rental value during 2016 to take placeoutside of the core Dublin market.
A key challenge in 2016 will be finding retail premises forretailers interested in high street locations or in soughtafter schemes, many of which are reported to be closeto or at full occupancy.
The volume of new retail development activity is substantiallybehind what is going on in the office market. However,construction is expected to get underway at the FrascatiShopping Centre redevelopment in Blackrock in 2016and the planning application for the retail-led town centrein Cherrywood will be submitted this year, with constructionexpected to commence towards the year-end. A numberof retail refurbishment schemes are also expected tocommence this year.
CommercialPropertyMarketMultinationals a keydriver of industrialdemand while UKand internationalbrands look to keyretail locations
14
Snapshot of Dublin Industrial Property Market Indicators
Dublin Take-Up (‘000m2)
98.2 128.0 115.6CBRE
87.9 91.2 97.5JLL
81.3 137.2 86.0Lisney
70.0 72.5 75.0CBRE
75.0 75.0 75.0DTZ Sherry FitzGerald
70.0 70.3 78.0JLL
74.0 75.0 75.0Lisney
1,113 1,046 N/ADTZ Sherry FitzGerald
Dublin Vacancy Rate (%)
27.4 25.8 N/ADTZ Sherry FitzGerald
Dublin Yields (%)
6.50 6.30 5.75CBRE
6.25 6.00 5.75
Q2’15 Q3’15 Q4’15 YTD
Q2’15 Q3’15 Q4’15 QoQ
428.1
112.5 127.7 N/ADTZ Sherry FitzGerald
390.9
405.3
Dublin Prime Rents (€/m2)
+3%
0%
+4%
0%
Dublin Vacant Stock/Availability (‘000m2)
-0.55pp
-0.25ppDTZ Sherry FitzGerald
7.00 7.00 6.00 -1.00ppJLL
6.00 6.00 5.90 -0.10ppLisney
QoQ refers to the latest quarter on quarter percentage or percentage point change (Q4 on Q3). YTD refers to year to date i.e. four quarter to 2015.
15

Information on the regional property market in the mainurban areas - Cork, Galway and Limerick - is based ondata provided by DTZ Sherry FitzGerald. There isfurther information available from Lisney on the Corkproperty market.
At the outset it is noted that the stock of officeaccommodation across the three markets was 1.175million m2 at the end of 2015, which corresponded to 35per cent of the total stock in the Dublin market. Cork hadthe largest stock of office accommodation (549,000m2)followed by Limerick (324,350m2) and Galway(301,750m2) at the end of 2015, accordingto DTZ Sherry FitzGerald.
With recovery in the economy and the jobs marketbeginning to spread out to other urban areas, signs ofa pick-up in activity in the regional property marketsshould be emerging. However a review of the totaltake-up of office accommodation shows all threemarkets recorded a decline in Q4 compared with Q3,with take-up levels substantially higher in the first half of2015 in Cork and Galway. Over the full year, the totaltake-up was highest in Limerick (29,300m2) and lowest inGalway (17,100m2). In contrast Lisney reported a higherlevel of take-up in Cork in Q4’15 compared with theprevious quarter, which they partly attributed to anactive multinational sector, culminating in a totaltake-up of 19,310 m2 for 2015 as a whole.
DTZ Sherry FitzGerald reported the second highest levelof take-up on record in Limerick and significantly abovethe long-run average. The exceptional take-up in Q3’15reflected the occupation by Analog of around 13,050m2
in Raheen, County Limerick.
A total of almost 166,000m2 of space was availableacross the three counties at the end of 2015. Theavailable stock situation was exceptionally tight inGalway at the year-end. The proportionate split of totalaccommodation available in 2015 between the citycentre and the suburbs was 48/52 in Galway, 40/60in Cork and 45/26 in Limerick, with the balanceof 29 per cent in the Shannon Free Zone. Around 83per cent of the available space in Cork was Grade Aaccommodation, of which almost two-thirds was inthe suburbs.
The disparity in terms of vacancy rates is significantwith Limerick’s vacancy rate over four times thecorresponding rate in Galway. Vacancy rates at the endof 2015 were marginally higher in Cork (15.6%), marginallylower in Galway (4.5%) and unchanged in Limerick(18.5%) compared with the previous quarter.
Prime rental levels ended the year unchanged in Corkand Limerick at €250 per m2 and €172 per m2
respectively, although rents closer to €280 per m2 wereachieved in Cork city centre. DTZ Sherry FitzGerald areprojecting rent increases across the board in 2016, withrents per m2 expected to rise to €200, €245 and €285 inLimerick, Galway and Cork respectively.
In terms of construction activity, a total of 33,750m2
were under construction across the three counties atthe end of 2015. The largest quantum was in Corkwhere the main development consists of the 15,793m2
new office scheme at One Albert Quay in the city, whichis set to be fully-let on completion over the comingweeks. Its tenants include PWC, Investec Bank, Arup,the internet security firm Malwarebytes and ArdmoreShipping Corporation. The recent commencement of themixed-use development of 11,782m2 at the CapitolCinema site on the Grand Parade in the city, which isexpected to include around 3,100m2 of Grade A officespace, is expected to be completed in February 2017.
Shortage of industrial buildings in themost sought after locations in CorkThere is limited Q4’15 information available on theindustrial market outside of Dublin apart from researchon the Cork market by Lisney. The latter reported totaltake-up in 2015 of 37,070m2 which was supported by astrong export sector. There was an available industrialbuilding stock of 217,000m2 at the end of the year andwith no new construction underway, this figure can beexpected to fall over the coming quarters. The vacancyrate was 17.4 per cent at the end of 2015, down from18.2 per cent one year earlier. Industrial rents werereasonably stable, according to Lisney, at in the regionof €43 - €48 per m2.
CommercialRegionalMarketMixed signsof recovery
16

OFFICES INDUSTRIALRegional Market Indicators
Q2’15 Q3’15 YTD
Q2’15 Q3’15 QoQ Q2’15 Q3’15 QoQ
Q2’15 Q3’15 YTDTAKE-UP (m2)
5,990 3,570 19,310 9,940 11,000 37,070Cork*
5,750 5,300 22,100 13,250 45,000Cork
3,800 2,700 17,100 7,650 24,750Galway
2,750 16,900 29,300 11,700 55,800Limerick
VACANCY RATE (%)
CORK
15.8 15.4 +0.2ppCork Overall
19.2 16.1 +0.1ppCork City Centre
13.7 15.0 +0.2ppCork Suburbs
GALWAY
7.4 4.6 -0.1ppGalway Overall
9.2 4.9 +0.6ppGalway City Centre
6.3 4.4 -0.5ppGalway Suburbs
LIMERICK
20.8 18.5 0.0ppLimerick Overall
21.9 18.8 -2.0ppLimerick City Centre
16.9 13.7 +0.8ppLimerick Suburbs
24.4 26.7 +3.0ppLimerick Shannon Free Zone*Source is Lisney. All other data is from DTZ Sherry FitzGerald.
QoQ refers to the latest quarter on quarter percentage of percentage point change (Q4 on Q3). YTD refers to year to date i.e. four quarter to 2015.
VACANT STOCK/AVAILABILITY (m2)
93,700 97,000 233,000 220,160Cork*
86,850 84,650 169,700 156,050Cork
22,450 13,900 42,700 43,600Galway
75,750 71,200 209,000 176,950Limerick
PRIME RENTS (€/m2)
245 250 0% 50.0 50.0Cork
215 215 +2% 43.0 43.0Galway
150 172
Q4’15
Q3’15
4,880
1,550
2,250
5,700
15.6
16.2
15.2
4.5
5.5
3.9
18.5
16.8
14.5
29.7
95,000
85,550
13,600
66,800
250
220
172 0% 38.0 38.0
Q4’15
Q4’15
5,750
N/A
N/A
N/A
217,000
N/A
N/A
N/A
N/A
N/A
N/ALimerick
17

It seems the ongoing appetite from domestic and foreigninvestors for Irish property continues to surprise as 2015delivered another strong year in terms of investmentactivity, both with respect to loan and asset sales.
Estimates for the total investment in Irish propertyassets (excluding loan sales) achieved in 2015 rangefrom €3.4 billion (JLL) to €3.5 billion (CBRE) to €3.7billion (DTZ SF and Lisney). Although lower than theall-time record level achieved in 2014 (c. €4.5bn),this figure is remarkable given the size of the Irisheconomy. CBRE suggest that one-third of the totalspend in 2015 was from Irish investors, implying thebalancing figure demonstrates the level of confidenceinternational investors have in the Irish economy andits future prospects.
An exceptional Q4’15 performance, with in the region of€1.2 billion (JLL) to €1.4 billion (DTZ SF) of transactionsrecorded, contributed to this remarkable outturn. Aninteresting analysis on the geographical split of thevolumes traded in Q4’15 by JLL showed that 53 percent were in Dublin compared with 94 per cent in theprevious quarter. It remains to be seen whether this shiftin investment to outside of Dublin continues in 2016.
NAMA has made a significant contribution to the volumeof asset and loan sales, as it continued its deleveragingactivity during 2015. It has sold in the region of €27.2billion of assets and loans since its inception, with closeto €19 billion in 2014 and €8.5 billion achieved in 2015.The largest single transaction involving NAMA in 2015would have been the Project Jewel loan portfolio soldfor almost €1.85 billion (nominal value excludingdiscount), comprising loans relating to the DundrumTown Centre, the Ilac shopping centre (50% share), thePavilions shopping centre (50% share) and a 5.3 acredevelopment site in Dublin city. The portfolio wasacquired by the UK listed property companyHammerson and Allianz Real Estate of Germany.
NAMA is reported to have a further €11.1 billion ofassets to sell in Ireland and sees the challenges in doingso as comprising competition from secondary trading ofassets by private equity funds and from other Europeanmarkets, notably the recovering economies of Spainand Italy, as well as economic and timing risks. It iscurrently preparing to bring in the region of €6.5 billion(outstanding debt balances) of real estate to the marketover the coming months comprising two loan portfolios,Project Emerald and Ruby.
Green Property and Green Reit is selling a significantretail asset, in the form of the Blanchardstown TownCentre, which is expected to generate in excess of €1billion. Green Reit is also disposing of the assets in theGlas Portfolio, which consists of over 69,677m2 ofcommercial space across 58 commercial units. Four ofthe six properties are in Dublin: the Arena Centre inTallaght, which has 63 apartments and a 119 bedroomhotel, the Ormond Office Building in Dublin City Centre,Classon House in Dublin 14 and Parnell Car Park inDublin 1. The portfolio also includes the Globe RetailPark in Naas and the Parkway Retail Park in Limerick.
The expectation amongst all property agents for 2016 isthat a new phase will emerge in the investment market,characterised by a slowdown in deleveraging activity,and an increase in secondary trading of those assetspurchased over the last number of years, as thoseinvestors look to generate income from their existingassets but also consider development and refurbishmentopportunities. Overall investment turnover is expectedto continue to fall to a more sustainable and normallevel, estimated by Lisney to be of the order of€2 billion per annum.
InvestmentMarket2015 records the secondhighest turnover ofcommercial realestate investment
18

19

In January 2016, IDA Ireland announced the highestlevel of employment across its client companies in its67 year history. Overseas companies now employ over187,000 people across Ireland. All sectors and regionshave benefited with 53 per cent of all jobs createdlocated outside of Dublin.
These results represent the first year of IDA’s strategy:Winning Foreign Direct Investment 2015-2019 whichsets ambitious objectives: - 80,000 new jobs, 900investments, and €3bn in R&D investments and a strongfocus on winning Regional investments. The Propertyand Construction sectors have a critical role to play insupporting the delivery of these challenging targets.
Property and infrastructure availability is a clear differentiatorin the decision making process on where companieslocate their investments. Investments of note in 2015included Apple and Facebook and their respectiveplans to build data centres in Athenry and Clonee,Regeneron’s expansion of its Limerick campus,Pramerica's expansion in Letterkenny. West Pharmaalso commenced site works in Waterford while ABECInc. announced plans to expand its global operationsin Fermoy.
Many of the projects won in 2015 were capital intensive,and provided strong additional benefits beyond the jobsthemselves. More than one-in-five private sector jobs inthe economy (direct and indirect employment) are as aresult of FDI investments, while overseas companiescontinue to be significant exporters from Ireland. IDAclient companies also accounted for approximately65% of all corporate tax receipts in 2014.
In the construction sector, FDI activity has generatedapproximately 10,000 jobs and this positive trend islikely to continue into 2016.
For its part, IDA with the support of the Irish Governmenthas commenced the rollout of its 5 year €150 millionproperty investment programme to deliver flexibleand cost competitive site and building solutions indesignated regional locations. In 2015, IDA oversaw thedelivery of new office and manufacturing facilities in itsBusiness Parks in Athlone, Waterford, Letterkenny andGalway and plans for 2016 include delivering building
solutions into Castlebar, Sligo, Tralee and Galway. IDAremains committed to leveraging partnership opportunitieswith developers and investors to deliver pre-permittedbuildings on IDA Business Parks in designatedregional locations.
Flexible and cost competitive building solutions remaincrucial. Every investment is hard won against everincreasing competition from a growing range ofsophisticated and innovative global business locations.We must not be complacent in this regard.
From an international perspective Dublin represents ourstrongest hand as an international investment location.It is home to the largest portfolio of FDI companies inIreland with some of Europe’s most vibrant businessclusters i.e. Financial Services and Technology sectors.It is imperative that Dublin enhances its reputation andremains attractive and the Dublin Office Market for FDIremains critical in that regard.
The availability of talent remains the biggest driver forIDA client companies in their international investmentlocation decisions, and the supply of quality andaffordable residential accommodation is thus a keycompetitiveness factor. More private sector residentialdevelopment will be required to meet the demand of FDIcompanies’ employees in some regional locations andin Dublin City. IDA welcomes the recent announcementby NAMA to fund the delivery of 20,000 residential unitsby the end of 2020.
The ongoing supply of flexible and cost competitiveoffice solutions, spearheaded by the estimated c. 3million sq.ft. of new office supply for Greater Dublin by2018, is very welcome. Supply remains tight currently inparts of the CBD where an ongoing, sustainable supplyis important. There is however a strong property offeringavailable and strong value to be had depending on thelocation in Dublin.
It is positive to see the required proactivity by all keystakeholders on this agenda at the present time. Theonus, in my view, is on us all to ensure that we maintainand develop attractive locations for our people to liveand work, and we need a sustainable functioningconstruction sector to support this.
SpecialReportThe property industry’srole in securing ForeignDirect Investment (FDI)
20
This special report was authored by Mary Buckley,Executive Director, IDA Ireland.

21

It is now well accepted that currently the level of housebuilding in Ireland is falling well short of the numbersneeded to house both our existing households and tomeet the demands of new household formation.
In 2014 the number of housing units completed nation-wide only amounted to 11,016* and in 2015 the numberof units completed nationally was 12,666*. Whencontrasted to the numbers of homes that are likely to beneeded each year, it is no surprise that those wishing tobuy a home are finding the supply of new and secondhand stock to be very limited indeed.
Research by Sherry Fitzgerald shows that in July 2015there was only 1.7% of the second hand private housingstock on the market nationwide. This is considerablylower than would be expected in a normallyfunctioning market.
AIB, through the Land & Development team in theProperty Lending Unit (PLU) and through our networkof New Business Centres is currently supporting thedevelopment in excess of 1,400 residential units andwe are actively engaged in discussions with thesponsors of over 800 further homes.
The Property Lending Unit is designed by the Bank tobe a centre of excellence and a number of property andconstruction specialists have been recruited to supportthe residential development lending activity of both thePLU and the Business Banking teams. These specialistsinclude both Chartered Surveyors and Engineers whowork closely with our lenders and our customers.
AIB adopts a proactive approach to such developmentopportunities and we see the relationship betweenthe bank and the customer as one very much of apartnership to ensure the best outcome for both parties.Early engagement by our lending teams with ourcustomers ensures that projects can be run efficientlyand smoothly and the focus is on progressingdevelopments efficiently to completion.
Projects the bank is currently supporting are varied andinclude developments in the Greater Dublin Area such
as Hansfield, Rathgar, Kinsealy, Churchtown andSwords and in Limerick city, Killaloe Co Clare and inCork city. These developments range from smaller infillschemes to larger multi-phase developments involvinghundreds of homes.
AIB is delighted to be working with Capital Homes in thedelivery of Landen Park, Oldtown, Naas Co Kildare. Thisis a development of 110, 4 bed detached and semi-detached houses which are constructed to achieve Arated energy efficiency standards and range in sizefrom 1,530 sq ft up to 2,050 sq ft.
Michelle Mullaney, Operations Director with CapitalHomes said of this development and their relationshipwith AIB, “ In creating our vision for Landen Parkwe have brought together a highly skilled team ofprofessionals all of whom have long-run experiencein residential development. AIB provided initial part-funding for Landen Park through the New BusinessTeam-East headed by Ray Lynch. Ray and his teamwere supportive of the project from the outset andproactively engaged with us to build a positiveworking relationship”.
Landen Park is now well underway with over 40homes now completed.
AIB is committed to working with capable parties todeliver homes throughout all parts of the country wheredemand is evident for the stock and the developmentscan be shown to be economically viable.
The bank has structured itself to accommodate thedelivery of this funding in keeping with our brandvalues of keeping it simple and making it easy forour customers to engage with the right people andteams in the bank.
As part of the bank’s full service provision, AIB isparticularly active in the provision of mortgages tohome buyers. As the mortgage market continues torecover, with a 26% growth in 2015, AIB remains thelargest provider, growing by 32% and providingmortgages to nearly 10,000 customers in 2015.
22
AIB’sSpecialistPropertyLendingUnitSupportingResidentialDevelopment
Paul C McNamara FSCSI FRICSHead of Property Strategy &MI Property Lending UnitAIB Wholesale and Institutional Banking
*Department of the Environment,Community and Local Government www.environ.ie
Allied Irish Banks, p.l.c. is regulatedby the Central Bank of Ireland.

23
24
MethodologiesCBRE Ireland work off standard definitions across EMEA to ensure consistency and facilitate comparison. Our definition of vacant stock is all stock that is beingmarketed to let at the end of each quarter. Vacancy rate in turn is all available stock expressed as a percentage of overall stock at the end of each quarter. Grade Avacancy rate refers to all Grade A stock expressed as a % of overall stock at the quarter-end. Take-up refers to all leasing activity in the office sector whereas ourdefinition of take-up also encompasses sales in the industrial sector. We analyse Dublin offices by collating stats by the following postcodes/districts; Dublin 1/3/7,Dublin 2/4, Dublin 6/8, IFSC, North Suburbs, South Suburbs and West Suburbs. Our definition of city centre includes the postcodes of Dublin 1/3/7, Dublin 2/4,Dublin 6/8 and the IFSC while our definition of CBD is Dublin 2/4 only. Prime rent refers to the prime headline rent being quoted in the market at a particular point intime while prime yield refers to a net equivalent yield for a prime property let to a strong covenant on an FRI lease with 10 years unexpired and subject to openmarket reviews (upwards and downwards). Contact: [email protected]
DTZ office take up records occupation of a building by a tenant. In a bid to avoid double counting and to accurately track net absorption rates, signed and reservedspace is excluded. Lease re-gears are also omitted. Industrial take up comprises letting and sales activity. Both office and industrial take up exclude investmenttransactions. The vacancy rate for the Dublin office market is calculated excluding Georgian accommodation. The vacancy rate for the Limerick office market iscalculated excluding Georgian accommodation. The vacancy rate for the Cork industrial market excludes the South East and Ringaskiddy. The Central BusinessDistrict incorporates the prime area of Dublin city and extends to the IFSC and the North & South Docklands and prime fringes such as Ballsbridge.Contact: [email protected]
In the Dublin office sector, the City Centre region is taken as – in the east, all areas from the Merrion Gates to East Wall Road; in the north, along the canal ring; inthe west, to Kilmainham; and in the south, along the canal to Ballsbridge and then all areas east of here to the Merrion Gates. For the purposes of this report, we havetaken the CBD to include the traditional core in Dublin 2 plus the docklands; those parts of Dublin 1 and Dublin 7 that are along the quays; and the parts of Dublin 4and Dublin 8 that are adjacent to Dublin 2. Contact: [email protected]
The information is based on JLL primary data which is collected and analysed on a quarterly basis. Data is evidence-based and uses information from actual markettransactions during the quarter. Office stock comprises all Dublin stock constructed post-1960 and therefore does not include Georgian properties. Office demand isrecorded by using gross take-up levels for all deals (lettings and sales). This includes expansions, relocations, and new occupiers. JLL industrial take-up records theletting and sales activity by occupiers of space that has been released onto the market. It does not include land sales, investment transactions or lease re-gears.Prime rents represent the highest achieved rents for the best-quality (Grade A) properties in the core locations that were recorded for that quarter.The yields reported are based on evidence from transactions and reflect the prime yields for each sector. Contact: [email protected]
The Sherry FitzGerald Barometer of second-hand house prices is an analysis based on a repeat valuation method. This index has been in place since 1996 for Dublinand 1999 for the national market. It analyses trends in the second hand market only, based on an analysis of a basket of properties in all of our locations nationwide.Each basket of properties was chosen based on a weighted profile of properties in each location. The basket extends to over 1,500 properties. The price of a sampleof properties that sold in a particular period is re-valued each quarter and these valuations are used to construct a house price index for existing houses. Repeatvaluation of a fixed sample of properties ensures that the mix does not change between time periods and it also provides live up to date market analysis, without anylag which an analysis of mortgage drawdowns is subject to. It also facilitates an analysis of both the active and inactive elements of the market thereby giving a fullerpicture of market deflation. Contact: [email protected]
The statistics are based on properties advertised on Daft.ie for a given period. The regressions used are hedonic price regressions, accounting for all available andmeasurable attributes of properties, with a Cooks Distance filter for outliers. Indices are based on standard methods, holding the mix of characteristics constant,with the annual average of 2012 used as the base. Average sample sizes are 89,000 (sales listings) and 5,800 (sales transactions) and 10,000 (rental listings). For moreon the methodology, please see www.daft.ie/research. Contact: [email protected]
The data are based on actual asking prices of properties advertised on MyHome.ie with comparisons by quarter over the last eight years. Our main indices have beenconstructed with a widely-used regression technique which adjusts for change in the mixture of properties for sale in each quarter. Our method is designed to reflectprice change independent of this variation in mix. Contact: [email protected]
The prime residential market is defined as the top 5% of the residential market by market value. The index is constructed by a repeat valuation process which is un-dertaken on a quarterly basis from a basket currently containing thirty properties. Office take-up is defined as when contracts have been signed. The city centre en-compasses all of Dublin 1 and Dublin 2, from Barrow Street in the east of Dublin 4 to Ballsbridge to the south and west along to Grand Parade in Dublin 6 and southto include Cuff Street in Dublin 8.Prime office rents are theoretical headline rent for prime office space let long-term to a grade A tenant and based on comparable let-ting evidence for that quarter allowing for normal incentives. The prime office investment yield is a theoretical value for which a prime office building let long-term to aGrade A tenant would sell for based on comparable investment activity for that quarter.

25

Property Industry Ireland (PII)84/86 Lower Baggot Street, Dublin 2, Ireland.Tel: +353 (0)1 605 1500Email: [email protected]
AIB Group HeadquartersBankcentre, Ballsbridge, Dublin 4, Ireland.Tel: +353 (0)1 660 0311
DKM Economic ConsultantsOffice 6 Grand Canal Wharf, South Dock Road,Ringsend, Dublin 4, Ireland.Tel. +353 (0)1 667 0372
DKM have compiled the data presented on the residentialand commercial property market from a range of sources,including the Department of the Environment, Heritageand Local Government (DEHLG), the Central StatisticsOffice (CSO), the Banking and Payments Federation ofIreland (BPFI), Daft, MyHome, the Private ResidentialTenancies Board (PRTB), and the property agents listedon the previous page. DKM would like to acknowledgethe cooperation of the agents in producingthis publication. Contact: [email protected]