propane market outlook final v3 market... · 2009 propane market outlook assessment of key market...
TRANSCRIPT

2009 Propane Market OutlookAssessment of Key Market Trends, Threats, and Opportunities Facing the Propane Industry Through 2020
P r e s e n T e d B y :

Prepared for the Propane Education and Research Council by ICF International, Inc. 9300 Lee Highway Fairfax, Virginia 22031 Tel (703) 218-2758 www.icfi.com Principal Authors
Mr. Michael Sloan [email protected] Mr. Richard Meyer [email protected]

Table of Contents Section I: Introduction ..................................................................... 1
1.1 Key Issues Addressed in the Propane Market Outlook.........................................2 1.2 General Market Context ........................................................................................2 1.3 Propane Market Outlook Structure........................................................................4
Section II: Critical Energy Market Trends ...................................... 5
2.1 World Petroleum Markets......................................................................................5 2.1.1 Crude Oil Markets..........................................................................................6 2.1.2 Projected Oil Prices.......................................................................................9 2.1.3 Petroleum Product Markets .........................................................................10 2.1.4 Interrelationship of distillate prices and crude oil prices. .............................11
2.2 Propane Supply, Demand, and Price ..................................................................12 2.2.1 International Demand for Propane ..............................................................13 2.2.2 Propane Supply Balance.............................................................................14
2.3 U.S. Electricity Sector..........................................................................................15 2.3.1 Regional and Local Electricity Price Differences .........................................16 2.3.2 Sources of Electricity ...................................................................................18 2.3.3 Expected Electricity Price Trends................................................................19
2.4 Prices of Propane and Competitive Fuels ...........................................................20 Section III: Key Trends Influencing Propane Markets................. 22
3.1 Energy and Environmental Policy and Regulations ............................................22 3.1.1 Building and Equipment Efficiency Standards.............................................22 3.1.2 Energy Efficiency Tax Credits .....................................................................24 3.1.3 Alternative Motor Fuel Vehicle Tax Credits .................................................24 3.1.4 Other Government and Private Sector Policies and Initiatives Promoting Energy Efficiency......................................................................................................25
3.2 Greenhouse Gas Emission Regulation ...............................................................27 3.3 Changes in Competitive Fuel Technologies........................................................28
3.3.1 Conventional Electric Heat Pumps ..............................................................28 3.3.2 Geothermal Heat Pumps.............................................................................29
3.4 Competing Fuel Providers...................................................................................31 3.4.1 Electric Utilities ............................................................................................31 3.4.2 Natural Gas Utilities.....................................................................................32
Section IV: Key Propane Markets ................................................. 33
4.1 Propane Use in the Residential Sector ...............................................................33 4.1.1 Existing Residential Propane Customer Base and Housing Stock..............34 4.1.2 National Housing Market Trends.................................................................38 4.1.3 Manufactured Housing Market Trends ........................................................40 4.1.4 Competition with Electricity..........................................................................41 4.1.5 Residential New Construction Trends .........................................................43 4.1.6 Residential Appliance Efficiency and Use-per-Customer Trends................50
4.2 Propane Use by On-Road Vehicles ....................................................................52

4.2.1 Current On-Road Propane Vehicle Fleet.....................................................52 4.2.2 Factors Likely to Influence Future Propane Vehicle Penetration.................53 4.2.3 New Propane Vehicles and Technologies...................................................55 4.2.4 Competitive Technologies for Other Fuels ..................................................57 4.2.5 Key Issues for Propane On-Road Fueled Vehicles .....................................58
4.3 Market for Propane Fired Standby Generators ...................................................59 4.3.1 Overview of Current Market.........................................................................60 4.3.2 Market Outlook ............................................................................................62 4.3.3 Future Propane Opportunities .....................................................................63 4.3.4 Key Issues for Propane Backup Generation ...............................................63
4.4 Other Propane Engine Applications ....................................................................63 4.4.1 Propane Lawn Mowers................................................................................64 4.4.2 Propane Irrigation Pumps............................................................................64
Section V: Propane Demand Outlook........................................... 66
5.1 Near Term (2009 – 2012) Odorized Propane Demand Outlook..........................68 5.1.1 Regional Demand Outlook ..........................................................................68 5.1.2 Impact of Prices on Propane Demand.........................................................69 5.1.3 Impact of Weather Uncertainty on Propane Demand..................................69
5.2 Long Term Market Outlook..................................................................................71 5.2.1 Long Term Energy Price Trends .................................................................72
5.3 Residential Sector Outlook..................................................................................72 5.3.1 Long Term Residential Market Outlook .......................................................73
5.4 Commercial Sector Outlook ................................................................................74 5.4.2 Long Term Commercial Market Outlook......................................................76
5.5 Internal Combustion Sector Outlook ...................................................................76 5.5.1 On-Road Internal Combustion Engines.......................................................76 5.5.2 Propane Forklifts .........................................................................................79 5.5.3 Non-Road Engines. .....................................................................................79 5.5.4 Long Term Internal Combustion Engine Market Outlook ............................80
5.6 Reseller / Cylinder Sector Outlook ......................................................................82 5.7 Industrial and Agricultural Sector Outlook ...........................................................83
5.7.1 Long Term Industrial and Agricultural Market Outlook ................................84 Section VI: Key Propane Industry Challenges............................. 85
6.1 Understanding and Taking Advantage of Regional Market Segmentation..........85 6.2 Maintaining Current Markets ...............................................................................86 6.3 Taking Advantage of Propane vs. Distillate Price Disparity ................................87 6.4 Taking Advantage of “Green” Opportunities........................................................88 6.5 Participating in the National Energy and Environmental Policy and Regulatory Process........................................................................................................................89

List of Figures Figure 1: Near-Term Odorized Propane................................................................................................... 1 Figure 2: Historical Petroleum Spot Prices and NYMEX Futures Prices............................................. 6 Figure 3: Average Residential Electricity Price ..................................................................................... 17 Figure 4: Electricity Fuel Mix .................................................................................................................... 18 Figure 5: Impact of 50 Percent Fossil Fuel Price Increase on Electricity Price ................................ 19 Figure 6: U.S. DOE Residential Electricity Price Forecast .................................................................. 20 Figure 7: Near Term Residential Energy Price Forecast ..................................................................... 21 Figure 8: Geothermal Heat Pump Shipments from U.S. EIA .............................................................. 30 Figure 9: GHP Shipments by Region from U.S. EIA (2006)................................................................ 31 Figure 10: Location of Propane Heated Households ........................................................................... 34 Figure 11: Total U.S. Households Using Propane for Major End-Uses ............................................ 35 Figure 12: Site-Built Households Using Propane for Major End-Uses .............................................. 36 Figure 13: Manufactured Households Using Propane for Major End-Uses ...................................... 36 Figure 14: Propane Conversion Opportunities with Existing Propane Customers .......................... 37 Figure 15: Regional Propane Conversion Opportunities ..................................................................... 38 Figure 16: National Housing Starts from the U.S. Census Bureau .................................................... 39 Figure 17: Forecasts of New Home Construction Starts ..................................................................... 39 Figure 18: Propane Manufactured Housing Stock Forecast ............................................................... 40 Figure 19: Regional Placements of Propane Manufactured Housing................................................ 41 Figure 20: Electricity and Propane Price Trends .................................................................................. 42 Figure 21: Electricity versus Propane on a dollars per BTU Equivalent Price.................................. 42 Figure 22: Propane Home Heating Market Share of New Home Construction Starts .................... 44 Figure 23: Propane Market Share of New Home Construction Starts ............................................... 44 Figure 24: Propane Heating Market Share by Sales Price of Home.................................................. 45 Figure 25: Urban versus Rural Propane Market Share of New Home Construction ....................... 46 Figure 26: Propane Market Share by Type of Construction ................................................................ 48 Figure 27: Propane Market Share by Design of Home ........................................................................ 49 Figure 28: Impact of Prices and Efficiency Trends on Propane Use-per-Customer........................ 51 Figure 29: ICF Estimate of Propane On-Road Vehicles (1998 – 2008) ............................................ 53 Figure 30: Composition of Clean Cities Alternative Fueled Vehicle Fleets....................................... 54 Figure 31: Generator Sales by Size ........................................................................................................ 60 Figure 32: Generator Sales by Fuel ........................................................................................................ 61 Figure 33: Odorized Propane Demand Forecast .................................................................................. 68 Figure 34: Total Odorized Demand by Region...................................................................................... 69 Figure 35: Impact of Price and GDP on Propane Demand Forecast................................................. 70 Figure 36: Impact of Weather on Propane Demand Forecast ............................................................ 70 Figure 37: Long-Term Odorized Propane Consumption...................................................................... 71 Figure 38: Residential Propane Market Forecast ................................................................................. 73 Figure 39: Commercial Sector Propane Consumption by Region...................................................... 75 Figure 40: Propane Market Share of Commercial Floor Space Heating ........................................... 75 Figure 41: Internal Combustion Sector Propane Demand Forecast .................................................. 77 Figure 42: Propane On-Road Vehicles Market ..................................................................................... 78 Figure 43: On-Road Internal Combustion Engine Propane Consumption ........................................ 78 Figure 44: Propane On-Road Vehicles Forecast .................................................................................. 79 Figure 45: Propane Forklift Forecast ...................................................................................................... 80 Figure 46: Non-Road Internal Combustion Engine Forecast .............................................................. 81 Figure 47: Propane Demand in the Cylinder Refill Market .................................................................. 83 Figure 48: Agricultural and Industrial Propane Demand Forecast ..................................................... 84


1
Section I: Introduction
Energy markets are changing at an unprecedented pace. These changes have had dramatic impacts on propane markets, which have been transformed by the combined effects of volatile energy prices, evolving environmental and energy policies, advancements in propane and competitive technologies, and improvements in energy efficiency. Current economic conditions also have a profound impact on the propane industry. The collapse of the new housing market, together with declining use per customer from continually increasing energy efficiency, is expected to reduce residential propane sales in the short term. At the same time, the economic recession is projected to reduce demand in the industrial and commercial sectors.
Figure 1: Near-Term Odorized Propane
Demand Forecast
-
2,000
4,000
6,000
8,000
10,000
12,000
1998 1999 2000 2001 2002 2003 2004 2005 2006 2007 2008 2009 2010 2011 2012
Mill
ion
Gal
lons
Residential CommercialResellers Industrial Agriculture Internal Combustion
Looking forward, ICF projects slow growth in demand in the mid-term (2010 – 2012) due to the expected rebound in the economy and the turnaround in the national housing market. Slow growth will continue in the longer term (2013–2020) as aggressive growth in certain markets more than offsets continuing efficiency trends and declines in other markets. However, achieving even the projected moderate increase in propane sales depends on concerted action by the propane industry both to take advantage
Propane Market Outlook at a Glance
• Total propane sales are projected to decline through 2009, then begin slow annual growth from 2010 to 2012 due to a rebound in the economy and introduction of new propane applications.
• Propane has become a premium fuel in the
largest and most expensive new homes that are not on the natural gas main.
• Propane marketing strategies must be tailored
to specific regional opportunities and challenges.
• Fuel oil conversions in the Northeast may
offer the highest growth potential in the residential and commercial sectors.
• Targeting existing propane customers to
maximize household propane applications may be the easiest way to offset continuing declines in fuel use per customer.
• Propane is expected to become more
competitive with diesel and distillate fuel prices.
• Markets for internal combustion engines offer
long-term potential for large growth in propane sales, especially as clean propane applications such as commercial lawn mowers, irrigation pumps, and propane vehicles become more widely available.
• Greenhouse gas emission regulations may
substantially increase electricity prices. Changes in the cost relationship to propane should not be expected before 2016.
• Energy tax credits and subsidies may help
propane applications while simultaneously promoting technologies such as geothermal heat pumps, which challenge propane’s market position.
• Taking advantage of the opportunities and
minimizing the challenges that lie ahead will require concerted action by the industry as a whole, including investments in new technologies and participation in the national energy conversation.

2
of market opportunities and to mitigate the impact of potential market threats. To that end, the Propane Market Outlook commissioned by the Propane Education & Research Council (PERC) provides a comprehensive look at current energy market trends influencing U.S. propane markets, identifies key market opportunities and threats facing the industry in the next few years, and offers a road map to help the industry to navigate through the period ahead. The Propane Market Outlook is a product of the PERC Market Metrics Initiative (MMI), which has provided data and market insights on propane markets since 2004.
1.1 Key Issues Addressed in the Propane Market Outlook The Propane Market Outlook presents an overview of the key issues facing the propane industry related to propane demand. It provides detailed analysis and market forecasts for the period from 2009 through 2012, and a longer-term assessment of market conditions through 2020. Specific points addressed include:
A summary of general world and U.S. energy markets, including petroleum market outlook, propane supply trends, and other energy issues.
An overview of U.S. electricity trends. Electricity is the principal competitor to
odorized propane in U.S. markets. The electricity sector overview includes regional trends in electricity prices and changes in electricity markets and technologies that might provide opportunities to propane or that might threaten propane market share.
A review of key issues likely to influence propane competitiveness in the future,
including: o Propane competitiveness with electricity technologies in different markets. o Likely impact of emerging propane technologies on propane markets. o Potential impacts of alternative government policy shifts on issues such
as climate change and emissions.
A discussion of key challenges and opportunities facing the propane industry.
1.2 General Market Context Propane and energy markets are evolving, rapidly in some cases. Successful planning will be required to position the industry to minimize the threats and to take full advantage of the opportunities. The following trends, which include both threats and opportunities, will have a significant long-term impact on the health of the overall propane industry and on individual companies.
• Propane prices have been increasing relative to electricity, reducing propane operating cost advantages relative to electricity in many applications and markets. While wholesale propane prices have fallen back to 2004 levels in the last year, the long term upward trend has implications in many, if not most, of the markets that propane serves.

3
• For the past several years, distillate fuel oil prices have been increasing faster
than propane prices. While distillate prices have fallen further than propane prices in the last year, structural changes in the international distillate fuel oil market are expected to result in long term increases in fuel oil prices relative to propane. This shift will provide opportunities for propane in two key markets:
o Residential homes currently using fuel oil for heating. o Diesel engine markets in on-road and off-road vehicles, agricultural
markets including irrigation pumps, and backup power generation and distributed generation markets.
• In the residential sector, propane has been steadily shifting from a fuel primarily
installed in lower cost housing into a premium fuel frequently installed in the largest and most expensive new homes that are not on the gas main. This market is fundamentally different in terms of marketing, customer service requirements, and sales potential than the traditional propane market in lower priced homes.
• The slowdown in the overall new residential construction market reduced
potential growth in residential heating customers by more than 50 percent in 2008 and more than 70 percent in 2009 relative to 2005, and is not expected to rebound substantially prior to 2011.
• Overall manufactured housing market placements are expected to be below
replacement levels, and the propane market share is expected to be below its share of retired units, leading to a long term decline in this propane market. We do not envision a significant rebound in manufactured housing in the foreseeable future.
• Modular housing remains a strong market for propane. The propane share of this
market is continuing to increase, and the overall size of the market has been more stable than the site-built housing market.
• A number of technology trends are changing the residential market: Tankless
water heaters are becoming an increasingly important propane load. Electric heat pumps are becoming more reliable, more efficient, and more comfortable, eroding existing propane advantages. Geothermal heat pumps are becoming more widely accepted and installed, eroding propane heating market share in some northern markets where propane has had significant market share. Backup power generation, combined heat and power, and dehumidifier technologies, as well as the trend toward outdoor living provide additional propane market opportunities to offset other losses.
• In the commercial sector, propane price increases and improvements in
electricity technologies are likely slowing growth in new commercial propane applications, while new propane technologies are simultaneously providing additional opportunities in this sector.
• The existing stock of on-road propane vehicles continues to decline as
retirements more than offset new vehicles. However, the propane school bus

4
market is growing rapidly, and a new generation of propane fueled vehicles is entering the market and is expected to have significant potential to grow market share.
• New state and federal energy policies reflect a growing public awareness and
concern for environmental and green issues. Legislation to mitigate climate change and promote energy efficiency creates new threats and opportunities for the propane industry. Engaging and educating policy makers and stakeholders of propane’s potential as a more environmental, less carbon intensive fuel can provide new markets for expansion.
The remainder of this report will provide a comprehensive and consistent evaluation of these key market issues in sufficient detail to help industry executives plan for the future.
1.3 Propane Market Outlook Structure This report consists of six principal sections. Section II provides a look at the structure of the international crude oil and petroleum product markets, and the U.S. electricity market. Changes in these two key energy market sectors are resulting in changes in the price of propane and competing fuels, fundamentally influencing future propane markets. Section III examines several general market trends that will directly influence propane markets, changes in energy efficiency and environmental regulations, potential impacts of global climate change legislation, expected changes in competitive technologies, including geothermal heat pumps, and a short assessment of likely behavior of competitors to propane, including electric and natural gas utilities. Section IV provides a detailed look at recent trends in two key propane end-use sectors, the residential and the propane-fired internal combustion engine sectors. This section includes a look at changes in propane use per customer in the residential sector, propane market share in new residential construction, as well as potential for propane-fired internal combustion engine applications, including both on-road vehicles, and off-road vehicle applications. Section V presents a long term forecast of propane demand, along with an assessment of market changes in each end-use sector. Section VI, the final section of this document, includes an assessment of key challenges facing the propane industry. The Propane Market Outlook also includes two additional stand alone documents. The first is an executive summary that highlights the key issues identified in this document. The second is an appendix that looks at regional differences in the demand outlook for each of the nine census divisions.

5
Section II: Critical Energy Market Trends
The U.S. propane industry is facing several fundamental changes in energy markets over the next few years. These changes include responses to global warming and energy security, as well as the evolution of energy technologies and increased energy efficiencies. However, the major issue is the change and volatility in energy prices of propane and competing fuels. In addition to the substantial increases and decreases in prices of propane and other competing fuel during the last five years, the fundamental relationships between prices of different fuels is changing. Propane prices have been increasing much more rapidly than electricity prices, but propane is now typically less expensive than fuel oil. To understand why the energy price relationships that impact the propane industry are changing, and to prepare for these changes, it is important to understand the basic structural issues that will influence the price of propane and other competing fuels. This section of the Propane Market Outlook reviews the fundamental issues associated with two key energy sectors influencing U.S. propane markets. Specific market trends addressed include:
Crude oil and petroleum product market outlook, including international fuel oil and propane supply and demand trends, and
U.S. electricity sector and electricity prices
2.1 World Petroleum Markets
During the past four years, there has been a fundamental shift in the relative prices of different hydrocarbon fuels in the U.S. (Figure 2 on page 6). Currently, propane spot prices at Mt. Belvieu are about 20 percent below the cost of the West Texas Intermediate marker crude oil price, while New York Harbor fuel oil spot prices remain slightly above the price of crude oil. This represents a major shift away from historic norms for both fuels, and results in a change in relative fuel prices that has a significant impact on propane markets. The key question for the propane industry is whether this shift is sustainable, or if fuel prices will revert to traditional relationships.

6
Figure 2: Historical Petroleum Spot Prices and NYMEX Futures Prices May 2009
$-
$5
$10
$15
$20
$25
$30
Jan-00Jan-01
Jan-02Jan-03
Jan-04Jan-05
Jan-06Jan-07
Jan-08Jan-09
Jan-10
$/M
MB
tu
NY Harbor Heating Oil SpotWTI CrudeMt. Belvieu PropaneHenry Hub Natural Gas
The petroleum market is an international market with prices for crude oil set in the global arena. The United States, despite being the largest consumer of petroleum products and the third largest producer, is a price taker1 in terms of crude oil. Petroleum products tend to have their prices set in regional or national markets, although these prices generally remain closely linked to the global crude oil and refining markets.
2.1.1 Crude Oil Markets The recent volatility in fuel prices has led to an intensified focus on crude oil markets by both the American public and policy makers. New energy hearings in Congress, rules to prevent price gouging, and concern over price speculation have been amongst the responses. Economies can adapt to high prices if the increase is relatively slow and steady, but volatility is much more difficult to handle. In the face of high volatility, investments may be postponed, abandoned, scaled back, or undertaken with a much higher risk premium. Investments in unconventional petroleum and in alternative fuels may also be affected by the same concern over risk. There is a great deal of uncertainty over the future of crude oil prices and the direction of energy markets. While the fundamentals of supply and demand largely dictate the longer term price of crude oil, in the shorter term, prices are also influenced by market intangibles such as geopolitical events, speculation, currency exchange rates, and the relationship of commodities markets to the general financial markets. The margins between energy demanded versus energy supplied have shrunk in recent years, thereby increasing the significance of market intangibles on price volatility. Over the past few years world demand for crude oil outpaced supply, creating tighter margins between what is produced versus what is consumed. Demand for oil increased in both the developed and developing world. This trend has been interrupted by the current economic slowdown, and falling demand has lead to a collapse in prices worldwide.
1 A price taker is an economic entity that is too small to influence price and accepts the given market price.

7
However, when the world economy rebounds, and developing countries work to expand their economies, global oil demand will continue to rise, likely leading to a return of higher prices. Changes in World Oil Market Fundamentals In the last several years there have been a number of important changes in the structure of the world oil markets. The first fundamental change in oil markets has been the emerging demand and market power of the major developing nations. Prior to the current economic downturn, China and India were expanding rapidly, accelerating growth in worldwide demand for crude oil and other commodities. The economies of smaller nations such as Brazil, Vietnam, and those in the Middle East were also expanding aggressively, and many African countries were growing at around 5 percent a year. The rapid growth and industrialization resulted in aggressive demand for energy intensive commodities such as cement, steel, petrochemicals, and other major industrial products. This was matched by increased demand for manufactured goods and foods. As national and individual incomes increased, diets changed to include more protein, which is typically more energy intensive than the traditional grain based diets. In addition, as these countries became wealthier, new demand for consumer goods emerged, particularly for automobiles. As a result, demand for petroleum products in these economies grew much faster than the economy as a whole. The impact of the rapid growth in petroleum demand on prices was amplified by other changes in petroleum markets. As countries become wealthier, externalities – particularly environmental externalities – have increased in importance. A mounting number of regions have moved to reduce sulfur in gasoline and diesel, fuel improvements whose costs are passed along to the consumer. In addition, growing demand and industrialization have driven up the price of all commodities – steel, for example – that are fundamental capital inputs of the petroleum industry. As capital costs rise, so do energy prices. The recent economic slowdown has temporarily slowed these changes. However, the long term drivers remain in place, and the expected rebound in world economic growth is likely to result in a return to these long term trends. Crude oil supply has also continued to increase with demand. However, although considerable oil is still being found (for example, recent finds in offshore Brazil), it is usually found in extreme environments that demand cutting edge technology and at enormous costs. (The Brazilian find is under 3,000 feet of water and 1,000 feet of salt.) Costs are steadily rising, driven in part by the steep rise in commodity prices and by the dearth of qualified human capital (the graying of the industry). These trends all tend to reduce supply availability and increase costs, and will not be easy to reverse. There has also been a substantial shift in the types of crude oil demanded relative to the types of crude oil available. The growth in demand for transportation fuels like gasoline, diesel, and jet fuel, combined with the increasing emphasis on reducing the sulfur content of petroleum products, has shifted the demand for crude oil toward light sweet

8
crude2, particularly those light sweet crude oils that can be easily refined with middle distillate3 products representing a high percentage of the total output. However, the overall global crude oil production slate has been shifting steadily towards heavier, sour crude oils, creating a disconnect between available crude oils (heavy, sour) and demand for crude oils (light sweet crude), widening the price differential between the sweet crude and the heavy crude oils.4 The second fundamental change in market structure is the emergence of the National Oil Companies (NOCs). Estimates are that anywhere from 75 up to 90 percent of the world’s reserves of crude oil and natural gas are in the hands of the NOCs. This has led to a decline in the importance of the International Oil Companies in crude oil supply as most of the countries with National Oil Companies limit the role of the IOC’s. In theory, it should not matter whether the NOCs or the IOCs are the producers. In practice it does. Some of the NOCs are easily the equal of the IOCs in efficiency and in technological knowledge. Others, however, are bloated, inefficient, and use outdated technology. In addition, in some countries the oil revenue is treated as the “public purse” to fund social programs leaving very little of the constant investment needed to maintain oil production rates. The rapid decline of Mexico’s Cantrell field is an example. The third fundamental change in market structure is a significant decline in the level of petroleum inventories (or stocks) and in the amount of spare production capacity world wide. Crude oil and petroleum products held in storage or in transit by pipelines, refiners, terminals and all other participants along the value chain provide a cushion to the industry, not only to meet seasonal swings in demand, but also to meet demand after unexpected events such as accidents, hurricanes, etc. However, stocks are generally much lower than in the past. This is a reflection of changes in shipping and storage, the emergence of management software and real-time data. Petroleum stocks do not lend themselves to “just in time” processes, but the new technologies do allow the industry to approach this. Spare production capacity is somewhat more complicated. Back in the 1990s OPEC determined that the optimal spare capacity level to maintain market equilibrium was about 4 percent of global demand. At that time spare capacity could be found in a number of countries, not just the Middle East OPEC countries. However, when oil prices have been high or increasing, the non-OPEC producers have been producing at the maximum. Many of the OPEC producers have also been producing beyond their quotas. Spare capacity is now only found in Saudi Arabia and to some extent in Kuwait. As an example, in the first Gulf War Saudi Arabia ramped up production from just over 5 million 2 The United States has made investments to upgrade refineries so that they can process heavy, sour, cheaper crude oil, is the exception. U.S. refineries are now the most complex in the world. 3 Middle distillates refer to the no. 1 and no. 2 fuel oils, hydrocarbons that include diesel, heating oil, jet fuel, and kerosene. These are output products from the distillation of crude oil that boil off after gasoline during fractionation. 4 The two main marker crude oils are WTI and Brent, both light sweet crude oils. The price differentials between heavy crude oils and these marker crudes have been increasing, and in many cases producers of heavy oil have been unable to find a market for their production. For example, satellite photos showed that in September 2008, 20 to 30 crude oil tankers were anchored off Iran storing Iranian heavy sour crude oil that they have been unable to sell.

9
barrels per day to 10 million barrels per day in the space of three months. At present, Saudi spare capacity is estimated at 1.5 to 2 million barrels per day. In a tight market, the lack of spare capacity means that small events can have large impacts. Market Intangibles To a much greater extent than other energy sources, crude oil prices are impacted in the short and medium term by market intangibles like geopolitical actions, the dollar exchange rate, and speculation. Examples of recent geopolitical events include the Russian invasion of Georgia, the political instability in the Niger delta, and potential instability in Iran.
Georgia is the nexus of shipments of crude oil from the Central Asia republics to the European Union (EU). This supply route was developed by the EU in an attempt to diversify supply sources and to reduce reliance on Russia. The invasion of Georgia by the Russians, even though it appears to have been resolved, calls into question the security of the central Asian crude flows into the EU. There are other routes, but they do not have enough capacity and their transportation costs are higher, therefore raising delivery costs to the EU and making these alternatives less desirable.
In Nigeria, the instability in the Niger delta has meant that a fairly large amount
of Nigerian crude oil is, at any time, out of commission. Nigerian crude oil is light and sweet, and has a large distillate cut. Hence, Nigerian crude is a premium crude oil, and constraints on production in Nigeria contribute to the upward pressure on the light sweet markers of Brent and WTI.
Iran provides significant oil production, and also can potentially limit access to
other Gulf oil production shipped via the Straits of Hormuz. Finally, the disturbance in the financial markets and the dollar exchange rate also play a large role in oil markets. Crude oil is denominated in U.S. dollars on the world market. However, the Middle Eastern OPEC countries mostly import their goods and services from the EU and from Asia. In other words, they are selling in dollars and buying in euros and yen. As the dollar has fallen, these countries have seen the value of their revenue fall, resulting in upward pressure on oil prices. Recently, there has been substantial controversy over what role speculators play in oil price trends: whether they exacerbated the price run up and collapse, or whether they caused the price run up and collapse. Whatever the actual effect, the turmoil in the financial markets saw enormous volumes of investment money move into crude oil and other commodity markets during the first half of 2008 when prices were increasing rapidly. In the second half of 2008, much of this money flowed out of the crude oil and commodity markets as prices were falling.
2.1.2 Projected Oil Prices There is a great deal of uncertainty in future oil prices. Most forecasters are projecting an increase in price from current (May 2009) levels when economic growth picks up. ICF is
10
projecting the long term U.S. refiner acquisition price of crude oil to return to around $70 per barrel, although significant volatility around this price level is anticipated. The uncertainty in world oil prices represents one of the greatest areas of uncertainty in the Propane Market Outlook. If oil prices return to more than $100 per barrel by 2012, ICF projects that odorized propane demand will be more than 10 percent lower than if oil prices remain below $60 per barrel.
2.1.3 Petroleum Product Markets While the crude oil market tends to be a fully integrated international market, the petroleum product markets tend to be more regional or national. There are often barriers to entry on petroleum products based on customs controls. Some countries explicitly set the petroleum product prices in the market, subsidizing the price of transportation and cooking fuels if needed. Other countries are relatively self-sufficient in products, but are not significant exporters, so the prices diverge from international prices. In the case of the United States, petroleum product imports have remained relatively stable at around 10 percent of total requirements. However, The U.S. imports gasoline from Europe, and exports distillate fuel oil to Europe, and U.S. product prices are heavily influenced by international market prices. There are distinct regional markets in the United States. In the East Coast region, marginal petroleum product imports generally come from imports. The West Coast region is relatively self contained and often has product quality specifications that are different from the rest of the country. The Gulf Coast region is self sufficient and exports to other regions of the U.S., as well as to foreign markets. The Midwest Region imports petroleum products from the Gulf. Although each regional market is to some extent distinct, they all influence each other and, to a certain degree, they influence and are influenced by external markets. This latter point is particularly true of the East Coast, which is part of the larger Atlantic Basin market. Petroleum Product Fundamentals The portion of the petroleum value chain that is of particular importance to propane producers and distributors is the middle distillate market. This section of the market consists of:
Distillate fuel oil used for heating and cooling in residential, commercial, and some industrial facilities;
Distillate fuel oil used for some electrical generation, particularly peaking plants;
Diesel fuel oil used for on-road transportation and off-road use such as farm
equipment and construction equipment, and marine and locomotive use; and
Jet fuel. In the U.S., the majority of the demand for middle distillates is in the transportation sector, where jet fuel and diesel fuel make up about 60 percent of the total mid-distillate demand. Within the United States, diesel is used as a transportation fuel largely for freight. Demand for middle distillate products has been increasing in recent years. In

11
2008, diesel demand is down slightly due to economic and energy price conditions, but this is expected to reverse when the economy rebounds. The international picture of demand is somewhat different. In most other developed and developing countries, transportation fuel taxes are structured to promote the use of diesel fuel over gasoline due to the increased efficiency inherent in diesel engines. The EU has had a policy of active “dieselization” for the past few years, and sales of diesel power vehicles now surpass those of gasoline powered vehicles. As a result, diesel demand has increased more rapidly than that of gasoline. In addition to the tax incentives to use more diesel fuel, many countries have put in place regulatory incentives to use cleaner diesel fuel. The United States, Canada, Japan and the EU all have established programs that have reduced the sulfur content of on-road diesel to 0.0015 percent (15 ppm) sulfur or lower. Both the EU and the United States are moving to require that all off-road diesel, locomotive, and marine diesel start moving towards the same standards in 2010 so that by 2012 all diesels will be at 15ppm sulfur content. In addition, many developing countries are moving towards low sulfur or ultra low sulfur diesel largely based on the EU standards. Both India and China have programs in place, and sub-Saharan Africa is in the process of moving in the same direction. These regulations create new production costs for diesel which are passed onto consumers. Some U.S. states are also moving to more stringent standards for distillate fuel. New York State recently enacted into law standards requiring that all distillate fuel oil used for residential space heating and hot water heating not exceed the 500ppm level by the end of 2008, and that all residual fuel oil used for the same purposes be at the 15ppm level by the end of 2010. These regulations, again, lead to higher diesel fuel costs. As a result of these fundamental market shifts, demand for low sulfur middle distillate fuels is expected to continue to grow significantly faster than the overall rate of growth for petroleum products.
2.1.4 Interrelationship of distillate prices and crude oil prices. The national and international increase in diesel demand has resulted in a fundamental change in the price relationship between the middle distillates and crude oil. While diesel fuel prices fell substantially relative to crude oil during the first few months of the current economic slowdown, prices for middle distillates generally have been increasing relative to the price of crude oil. Refineries produce a multitude of products, but the main products are usually gasoline and middle distillates like diesel, fuel oil, and kerosene. The types of products and the amounts in which they are produced are dependent on the sophistication of the refinery. The more sophisticated refineries have significant flexibility in the products that can be produced, and plant managers can choose to maximize gasoline production or middle distillates production. In the United States, gasoline is optimized for most of the year, whereas middle distillates are optimized for the winter heating season. However, even in the most sophisticated refineries, it is easier to increase gasoline production than to increase middle distillate production.
12
Typically, a refiner’s least expensive option to increase production of middle distillates is to process light sweet crude oils that have a naturally larger proportion of the middle distillates. These preferred sources include the crude oils that set the world marker price for oil, including Brent and West Texas Intermediate (WTI). Many refiners are increasing purchases of crude oil from these preferred sources, placing further upward pressure on prices5. Refinery production of middle distillates can also be increased by investing in additional refinery equipment and processes; however the process is very expensive relative to the amount of incremental middle distillates produced. Even with additional investment, the ability to reduce the sulfur content of the products is limited, resulting in upward pressure on prices when sulfur content is reduced. As a result, the cost of crude oil inputs purchased by refineries to produce a high percentage of middle distillate products has increased substantially. In addition, the relative shortage of low sulfur middle distillates has pushed the prices of these products significantly above the price of light crude oil, and even further above the price of the heavier crude oils and higher sulfur fuels. These changes in price relationships are likely to be permanent. Upcoming changes in markets and emissions regulations – in particular new changes in marine fuel specifications – are likely to further increase the price differential between crude oil and middle distillates. In an attempt to control pollution at sea, the International Maritime Organization (IMO) has moved to modify the sulfur specifications of marine fuels. Modern shipping uses a form of residual fuel oil known as bunker fuel, which has an average sulfur content of around 3.5 percent. Marine diesel is used mostly in port and in certain areas of the world where there are local restrictions (off California, the Baltic Sea and the North Sea). The IMO has just adopted recommendations that call for the sulfur content of bunkers to be reduced to 0.005 percent by 2020. Unless there is a technological advance and the desulfurization of residual fuels becomes significantly less expensive, the only option facing shippers will be to shift to diesel fuel. This will create strong upwards pressures on both diesel fuel prices and marker crude oil prices.
2.2 Propane Supply, Demand, and Price The price of propane does not respond in the same manner as the price of the middle distillate fuels. As shown earlier in Figure 2 on page 6, the relationship between U.S. propane prices, crude oil, and distillate fuel oil prices has changed in the last several years, with Mt. Belvieu propane spot prices falling below U.S. West Texas Intermediate crude oil prices. With the exception of the 2008/09 winter, distillate prices have increased relative to WTI crude oil prices, and propane has had a price advantage relative to both diesel fuel and distillate fuel oil in many U.S. markets and regions. After the economy starts to rebound, this relationship is expected to continue, with the differential between propane prices and middle distillate prices potentially increasing as
5 Bonnie Light crude oil from Nigeria is one of the light sweet crude oils with a high proportion of mid-distillates preferred by refineries. The political instability in the Nigerian Delta reduces the availability of this crude source and puts further upward price pressure on the premium crude oils.

13
growth in worldwide propane supply appears likely to be more robust than growth in worldwide propane demand.
2.2.1 International Demand for Propane
Globally, propane is used in much the same way as it is in the United States. There are, however, some differences in emphasis in different regions of the world. In the Middle East, China and India there is a major focus on petrochemicals, while in much of the developing world there is a focus on replacing wood and dung as a cooking fuel with LPG6 fired stoves.
Petrochemical Demand: The global petrochemical industry recently emerged from an extended period (1998-2003) of very poor earnings due in large part to substantial over building. The downturn resulted in increased industry consolidation as weaker, less efficient firms were either bought out or went out of business, leading to a general restructuring of the industry. Post 2004 demand for petrochemicals turned strongly upwards, driven by the growing demand from the developing world. Demand in the developed world has grown slightly, but at lower rates since it is a mature market. China, India, Brazil, Vietnam and other emerging markets have all seen the growth of a strong and well-to-do middle class with a pent up demand for consumer goods. Growth rates as high as 10 percent per year have been cited for the Middle East and China.
Global petrochemical demand is dominated by the polyolefins. While polyethylene is the largest aggregate category at roughly 38 percent, polypropylene, a derivative of propylene, is the largest single category at 24 percent. Over 60 percent of propylene is used to produce polypropylene. Polypropylene is used in automobiles, carpet backing, carpet face yarns, snack food packaging, pressure sensitive tape backing, and labels. Recent demand for polypropylene has been soft but, in the long term, demand is expected to grow globally at about 5.8 percent a year.
Much of the propylene, and indirectly the polypropylene, in the market is derived from propane and butane.
LPG for Cooking: Fuel for cooking in rural areas in the developing world is usually biomass, particularly wood, or animal dung. Over the last decade there has been growing concern over the environmental impacts of a non sustainable use of wood as well as the health impacts from particulates. There are growing efforts to encourage rural populations, and to some extent urban, to switch to stoves powered by LPG. LPG powered stoves have achieved widespread penetration in Brazil and are being introduced in many African countries such as Senegal. In countries with no or minimal energy infrastructure, LPG tanks are relatively easy and inexpensive to transport. This is potentially a large and growing market.
6 In the U.S., the terms “LPG” and “Propane” are often used interchangeably. Internationally, LPG is typically a mix of propane and butane, with a small percentage of other petroleum gases.

14
Transportation Fuels: The pressure on governments to require low sulfur or ultra low sulfur diesel fuel is spreading around the world outside of North America and the European Union. Both India and China have promulgated low sulfur regulations, and all of the sub-Saharan African countries are moving towards these targets. In general, outside of the United States the tax codes favor the more efficient diesel engine over the gasoline internal combustion engine and there is currently a world wide shortage of diesel, which we expect to continue for the foreseeable future. In addition, the move to globally restrict sulfur in marine bunkers will push shipping increasingly into marine diesel by 2020. The technical difficulties and costs of meeting all these requirements should provide potential opportunities for expanding propane demand in the transportation sector.
Overall, international propane demand is expected to increase steadily over time7.
2.2.2 Propane Supply Balance
While there is a significant international market for propane, most of the propane consumed in the U.S. is produced in North America. Domestic production accounts for about 85 percent of total U.S. demand, with propane imports accounting for the remaining 15 percent. Roughly 50 percent of the imports come from Canada, with the remainder imported by tanker from a variety of international sources. Hence, more than 90 percent of U.S. propane supply is produced in North America. However, while domestic prices of propane are influenced by regional conditions, the underlying fundamentals of domestic propane price are driven by the international market.
About 50 percent of the total propane produced in the U.S. is produced by crude oil refineries alongside the production of gasoline and distillate fuel oil. The remainder is produced as a co-product of natural gas and oil production, and is separated from the natural gas stream at gas processing plants, along with ethane, butane, and other LPG products.
The amount of propane produced by refineries depends on a variety of factors including total crude oil throughput, the type of crude oil processed by the refinery, and the types of processes employed at the refinery to convert crude oil into lighter products. The light sweet crude oils preferred by the less sophisticated refineries for conversion into middle distillates tend to have a relatively high percentage yield of LPGs. In addition, the processes used to convert heavy oil and high sulfur oil into usable middle distillate processes also tend to create a high percentage of LPGs. As a result, the changing crude oil slate and demand slates will tend to increase the production of LPGs over time relative to crude oil inputs.
Most of the remaining propane comes from natural gas processing plants. Gas processing plants separate the natural gas liquids – ethane, propane, and butane – from natural gas. U.S. propane production from natural gas is expected to increase over time as domestic natural gas production increases. Most of the growth in natural gas production will be “wet gas” (gas with a high percentage of liquids) from the deep gulf and shale gas regions. This will be offset somewhat by the decline in production from the shallow Gulf of Mexico producing regions; however, the overall mix of wet gas to dry gas 7 Propane demand is not expected to continue growth until the current worldwide recession ends.

15
is expected to increase over time, resulting in potential growth in LPG production beyond the rate of increase in natural gas production.
Gas plant operators have the ability to optimize profits by varying the amount of liquids removed from the "raw" natural gas stream. In the past, when natural gas prices occasionally exceeded crude oil prices, less of the ethane in the natural gas stream was removed, reducing the supply of ethane and increasing demand for propane as a petrochemical feedstock. However, in today’s market the price of natural gas is much lower than the price of crude oil (Figure 2 on page 6). As a result, propane produced from natural gas tends to have a higher value than the natural gas, and propane production from this source is being maximized. Hence, in today’s market, the price of propane is largely determined by the price of crude oil, and propane prices will increase and decrease with international crude oil prices. However, the relationship between propane rice and crude oil price will be set by the overall balance of propane supply and demand. Worldwide, propane supply is expected to expand rapidly as developing countries develop refinery capacity to meet domestic transportation fuel requirements, and natural gas production increases to meet local demand and demand for Liquefied Natural Gas (LNG) exports. Overall, at least in the near to medium-term through 2015, the growth in propane supply is expected to exceed growth in propane demand. The incremental propane supply will compete on price with ethane, butane and other petroleum feedstocks to balance this market, suggesting that propane price relative to crude oil will remain relatively soft over this time period. The outlook in the longer term is somewhat less certain. However, changes in sulfur emissions regulations appear likely to result in continuing price pressure on crude oil prices relative to propane prices.
2.3 U.S. Electricity Sector In most of the residential and commercial sectors, competition with electricity represents the biggest challenge to growth in propane sales. In the last ten years, propane prices have increased substantially relative to electricity prices in most geographic markets. However, electricity prices have also increased, with dramatic increases in certain markets. As a result, electricity provides both opportunities and threats to propane. On a dollars per BTU basis, propane is generally less expensive than residential electricity. However, when end-use efficiency is considered, the operating cost of heating a residence with propane can be higher than heating with an electric heat pump in many regions. Even so, high electricity price states, including the New England and Mid-Atlantic states, continue to provide important regional opportunities for propane. In most states, electricity prices are expected to grow slowly from current levels, and the changes in electricity prices are unlikely to shift the current relationship between electricity and propane prices. A few states such as Pennsylvania will see significant increases in electricity prices due to continued market deregulation. In these states, electricity prices may increase by enough to change the current price relationship between propane and electricity. However, the areas where electricity prices can be
16
expected to increase sufficiently to change the competitive position with propane are expected to be very limited, at least within the next few years. In the longer term, greenhouse gas emissions regulations, which are considered highly likely to be implemented, have the potential to substantially increase electricity prices, and may have an impact on the competitive cost relationship between propane and electricity (See Section 3.3 for more discussion).
2.3.1 Regional and Local Electricity Price Differences
Electricity prices vary widely by region depending on market structure, fuel mix and cost of fuel, and capacity constraints. For example, electricity prices in New England can be twice as high as electricity prices in lower cost states. Figure 3 on page 17 shows average residential electricity prices by state for 2007.
It is important to realize that average state electricity price is not necessarily the relevant price for comparing the competitive costs of electricity and propane.
In many states, electricity rates are structured to promote incremental sales of electricity by providing lower rates per Kwh for larger users of electricity. This is generally referred to as a declining block rate structure, where the electricity prices at the margin are well below the average electricity price, and winter prices are well below summer prices. In these states, the price of electricity used for heating a home would also be less than the average price of electricity.
Incentives for whole house electricity use, including electric heating, are also common in many states. In these areas, the price of electricity used for heating a home would be less, sometimes significantly, than the average price of electricity.
In states with shortages of electricity, or particularly high costs, a rate structure with increasing block rate structures are fairly common. In these states, the price of electricity increases as the amount of electricity consumed increases. Hence, small electricity users have lower rates than large users. In these states, incremental electricity prices are well above the average price, and can be as high as three times the average residential rate. These rate structures differ by size of customer and are different for every local electricity service provider. In these states, the price of electricity used for heating a home would be greater than the average price of electricity.
In addition, in each state, the average price typically reflects the average of prices for several different companies and municipalities in the state. There is often significant variation in rates for different companies within an individual state.
The text box on page 17 provides several specific examples of the differences in electricity prices within a specific state.

17
Figure 3: Average Residential Electricity Price
Examples of Local Differences in Electricity Prices
In Nebraska, average 2007 residential electricity rates ranged from a low of 4.98 cents per Kwh in the Village of Hildreth to 12.96 cents per Kwh in Decatur.
In Michigan, Detroit Edison provides a discounted rate to homes heated with electricity. The discount amounts to 2.3 cents per Kwh, or about 20 percent of the average residential electricity price.
Average prices in Iowa were 9.34 cents per Kwh in 2007, however large residential users on the Intergy system paid only 2.5 cents per Kwh for incremental electricity during the winter. In California, the average residential electricity price was 14.37 cents per Kwh in 2007. However, Southern California Edison rates for incremental Kwh sales ranged from 10.5 cents per KWH for a small residential customer to 32 cents per Kwh for the last Kwh of electricity sold to a very large residential electricity user.

18
2.3.2 Sources of Electricity The significant regional differences in electricity prices are driven primarily by differences in the sources of electricity in the different areas. U.S. electric companies use a diverse mix of fuels to generate electricity, but coal is still king. As shown in Figure 4, coal is used to generate almost half of the electricity generated in the U.S. Nuclear power provides almost 20 percent of total electricity generated. Hydro provides another 7.1 percent, and natural gas provides almost 20 percent. Regions with significant coal or hydro power generation capacity tend to have much lower electricity rates than other regions, and regions with rapidly growing electricity demand requiring construction of new generating capacity tend to have significantly higher electricity prices.
Figure 4: Electricity Fuel Mix
Source: U.S. Department of Energy, Energy Information Administration, Power Plant Report (EIA-906), Combined Heat and Power Plant Report (EIA-920), Electric Power Monthly, and Electric Power Annual 2007.
The difference in the cost of generating electricity from coal and natural gas is illustrated in Figure 5. As shown in this figure, the difference in capital and operating costs for these two sources of power has a significant impact on how changes in energy prices impact the cost of electricity.
Coal generation is much more capital intensive than natural gas generation. The fuel cost of coal is a relatively small percentage of the total cost of generating electricity from coal. As a result, the impact of increasing coal cost on electricity prices is relatively minor. A 50 percent increase in coal costs translates into an increase in electricity costs of about $0.01/Kwh.

19
Natural gas generating capacity is much less expensive to build than coal generating capacity; however the fuel costs are much higher. Hence, an increase in natural gas prices is expected to have a greater impact on electricity prices than an increase in coal prices. In the regions of the country where electricity prices are set by the cost of generating power from natural gas, the impact of increasing natural gas price on electricity prices is more likely to be significant. A 50 percent increase in natural gas cost translates to $0.03/Kwh electricity price change.
Figure 5: Impact of 50 Percent Fossil Fuel Price Increase on Electricity Price
2.3.3 Expected Electricity Price Trends The U.S. Department of Energy (DOE) Energy Information Administration (EIA) is projecting national average residential electricity prices to increase by 5 percent from 2008 to 2009, followed by an increase of 2.4 percent from 2009 into 2010. EIA forecasts mid-term electricity prices (nominal) to increase at roughly the rate of inflation after 2010. Unfortunately, much of the change in the electricity price forecast results from expected changes in natural gas prices. Natural gas prices typically respond in the same direction as crude oil prices. Since propane prices are highly related to both crude oil and natural gas prices, any unanticipated increases in electricity prices are also likely to be reflected in an increase in propane prices.
Cost of Electricity from Coal Cost of Electricity from Gas
Impact of 50 percent Fuel Price Increase on Electricity Price
$0.00
$0.02
$0.04
$0.06
$0.08
$0.10
$0.12
$0.14
$0.16
$0.18
2007 Coal Price 150% of 2007 CoalPrice
2007 Natural GasPrice
150% of 2007Natural Gas Price
Typi
cal E
lect
ricity
Pric
e Fo
r New
Gen
erat
ing
Cap
acity
($/K
wh)
DistributionTransmissionNew Capacity CostFuel Cost

20
Figure 6: U.S. DOE Residential Electricity Price Forecast
Source: Annual Energy Outlook, EIA
0.00
2.00
4.00
6.00
8.00
10.00
12.00
14.00
2007 2008 2009 2010 2011 2012 2013 2014 2015
Cen
ts p
er k
Wh
AEO 2007AEO 2008
AEO 2009
There is substantial uncertainty related to the potential impact of climate change legislation on electricity prices. The 2009 Waxman/Markey bill voted on in the U.S. House of Representatives would establish a cap and trade system for CO2 emissions that could increase the cost of coal-based electricity by between two and five cents per Kwh starting in 2012. However, this bill is unlikely to be enacted without significant changes to protect electricity consumers from higher prices, at least during the first few years of the legislation, and we do not anticipate a significant impact on electricity prices from climate change legislation prior to 2016.
2.4 Prices of Propane and Competitive Fuels The competitive balance between propane and rival fuels is largely dependent on the shifting price dynamics between crude oil prices and the various petroleum products, including propane, as well as the changes in electricity markets. As discussed, changes in both sectors are impacting U.S. propane markets. To help illustrate the impact of these changes, the most recent EIA short term residential energy price forecast is shown in Figure 7. This May 2009 forecast shows the decline in high crude oil prices from their peak in July to about $50bbl in April 2009. The forecast is based on crude oil projected to $60/bbl in December 2010, resulting in an aggressive increase in propane distillate fuel oil prices in the second half of 2008 and the first quarter of 2009. Natural gas and electricity prices are projected to grow more slowly. During the historical period shown on this chart, residential electricity prices have substantially exceeded the price of all other fuels when measured on a dollar per delivered Btu basis. Also, for a short period in 2008, the average price of propane to residential customers fell below the price of fuel oil. However, the traditional relationship

21
between propane and distillate fuels has returned– fuel oil is again lower on a dollar per BTU basis than propane. The forecast indicates that the average price of both propane and fuel oil has fallen with respect to electricity and natural gas, and that these levels are likely to sustain for some time. The forecast also suggests that residential propane and fuel oil prices are likely to converge towards the end of 2010, as pressure on distillate supplies pushes the fuel oil prices up faster than propane. Our longer term outlook projects that the average price of fuel oil used for residential heating to exceed the average price of propane used for the same purpose. See section 2.1.4 for more discussion on the long-term interrelationship between propane and distillate fuels.
Figure 7: Near Term Residential Energy Price Forecast Monthly Residential Energy Prices
Source: EIA - June 2009
0
5
10
15
20
25
30
35
40
Jan-0
7
Apr-07
Jul-0
7
Oct-07
Jan-0
8
Apr-08
Jul-0
8
Oct-08
Jan-0
9
Apr-09
Jul-0
9
Oct-09
Jan-1
0
Apr-10
Jul-1
0
Oct-10
$/M
MB
tu
PropaneNo. 2 DistillateElectricityNatural Gas Forecast

22
Section III: Key Trends Influencing Propane Markets
There are a number of key issues likely to influence future propane markets. The likely change in the price of propane relative to other fuels is discussed at length in Section II. Other key issues include the effect of existing and new energy and environmental policy regulations, the possibility of climate change legislation, changes in competitive technologies, and the effect of competitive fuel providers such as natural gas and electric utilities. While not an exhaustive list, these topics include many of the important issues the propane industry is facing today and will be facing in the future.
3.1 Energy and Environmental Policy and Regulations The debate over climate change, energy efficiency and environmental concerns continues to influence energy policy and energy markets in the U.S. A number of these energy and environmental policies and regulations have significant impacts on the propane industry:
Equipment efficiency standards and building codes influence the amount of propane sales to both new and existing propane customers, and are also promoting technological improvements in competing technologies (e.g., heat pumps).
Tax credits are available for investments in energy efficiency. These tax credits
reduce the effective cost of some propane applications, but also reduce the cost of some competing technologies.
Tax credits have been established to promote qualified alternative fueled
vehicles, including propane.
Emissions regulations increase the attractiveness of cleaner fuels and technologies.
These policies and regulations can make certain propane applications more attractive in the market place, but also generally reduce propane sales per application relative to existing equipment. The regulations can also tilt the playing field in favor of electricity or other fuels in certain applications. A few of the key energy and environmental policies and regulations currently in effect are discussed below.
3.1.1 Building and Equipment Efficiency Standards There are a number of efficiency standards that affect the production of propane equipment8. These rules and standards, mandated by Congress and established by the Department of Energy, apply to a number of gas heating applications. 8 Information sources in this section include the Energy Efficiency Standards group at Lawrence Berkeley Laboratories (http://ees.ead.lbl.gov/), which lists the current standards and denotes the history of the rulemaking procedures for different applications; and the Federal Register (http://www.gpoaccess.gov/fr/), for the Department of Energy amended energy conservation standards for furnaces and boilers (November 19, 2007).

23
For furnaces and boilers, the first federally mandated efficiency levels were established in 1987 as a result of the National Appliance Energy Conservation Act (ECPA). The minimum efficiency standards were 78 percent Annual Fuel Utilization Efficiency (AFUE) for most furnaces, 75 percent AFUE for gas steam boilers, and 75 percent AFUE for mobile home furnaces. A new rule mandating standard levels for residential furnaces and boilers went into effect in January 2008. These standards will apply to products manufactured or imported into the United States on or after November 19, 2015. These standards are:
Non-weatherized gas furnaces - 80 AFUE Weatherized gas furnaces - 81 AFUE
Mobile home gas furnaces - 80 AFUE
Gas boilers - 82 AFUE
The Department of Energy has also established standards for other residential heating equipment, including water and pool heaters. The Department of Energy has published a final rule and a subsequent amendment to update the application standards for central air conditioners and heat pumps. With regard to heat pumps, the new rule calls for a minimum efficiency standard of 13 SEER (seasonal energy efficiency ratio) and 7.7 HSPF (heating seasonal performance factor), representing a 30 percent improvement in cooling efficiency and a 13 percent improvement in heating efficiency relative to the previous standard. For air conditioners and heat pumps built after January 23, 2006, the minimum efficiency ratios and heating seasonal performance factors include:
Split system and single package heat pumps – 13 SEER / 7.7 HSPF Through-the-wall air conditioners and heat pumps – 10.9 SEER / 7.0 HSPF
Small duct, high velocity systems – 13 SEER / 7.7 HSPF
Space constrained products-heat pumps – 12 SEER / 7.4 HSPF
The Department of Energy is undergoing steps to amend these energy conservation standards, as mandated by the Energy Independence and Security Act of 2007. The final rule is scheduled to be published in 2011. The Department of Energy is currently developing a new rules for residential water heaters and cooking equipment. Since this is an ongoing process, involvement of the propane industry is essential towards informing the process of the needs and requirements of propane industry, as well as the impacts – financial and otherwise – the industry will incur resulting from new federal standards.

24
The tightening of the energy efficiency standards and building codes has a significant impact both on the economics and volume of energy used in these applications. Every time an older (pre-1992) propane furnace is replaced, propane sales to that customer for space heating can be expected to decline by between 25 percent and 35 percent due to the improvement in furnace efficiency. More stringent building codes have also reduced energy consumption in new and renovated housing. Residential energy consumption in homes has improved between 25 to 35 percent (energy required per square foot) relative to homes built prior to 1978.
3.1.2 Energy Efficiency Tax Credits The American Recovery and Reinvestment Act of 2009 established a 30 percent tax credit for investments toward improving residential energy efficiency.9 The tax credit, now effective through 2010, applies to the purchase and installation of residential energy efficiency improvements, including high efficiency residential appliances. The tax credit is available to purchasers of qualified propane appliances, including propane water heaters with an energy factor of at least 0.82 percent, propane boilers with an annual fuel efficiency rate of not less than 90 percent and propane furnaces with an annual fuel utilization efficiency rate of not less than 95 percent. The tax credit also applies to heat pumps with a SEER rating of not less than 15, an EER rating of not less than 12.5 and an HSPF rating of 8.5. The credit is capped at $1,500 per household. These tax credits apply to equipment installed between January 1, 2009 and December 31, 2010. The same legislation also established a 30 percent tax credit for property expenditures for homeowners that install geothermal heat pumps and solar systems in their homes. The credit is unlimited and is available through 2016. This legislation is likely to increase the geothermal heat pump threat to the propane market. The tax credit for geothermal heat pumps substantially reduces the first cost advantage of a propane furnace relative to a geothermal heat pump and is likely to result in increased market penetration of this technology. The result of this new legislation is a more competitive landscape for propane. As the national dialogue further debates energy issues, we expect these tax credits to be extended further, and new tax credits and subsidies to be added. While some of these credits will help propane applications, credits and subsidies that favor other technologies over propane are likely to present new competitive challenges to the residential and commercial propane market share.
3.1.3 Alternative Motor Fuel Vehicle Tax Credits The Qualified Alternative Motor Fuel Vehicle (QAMFV) tax credit provides financial incentives for both owners of propane powered vehicles and propane fuel providers. Authorized under the Energy Policy Act of 2005 and updated by the 2009 American Recovery and Reinvestment Tax Act, this tax credit applies to original equipment installation and prior use vehicles with aftermarket installation that are powered by natural gas, liquefied natural gas, liquefied petroleum gas (LPG), hydrogen, and ethanol (E85) blends.
9 Additional information on the available tax credits can be found at the U.S. Department of Energy EnergyStar website at http://www.energystar.gov/index.cfm?c=products.pr_tax_credits#c3

25
Non-hydrogen alternative fuel providers are eligible for a tax credit of up to 50 percent with a maximum of $50,000 of the cost of any qualified alternative fuel vehicle refueling property, available through December 31, 2010.
Consumers are eligible for a tax credit ranging from up to $4,000 for LPG fueled
vehicles weighing less than 8,500 pounds, to $32,000 for vehicles over 26,000 pounds, available through December 31, 2010. A number of vehicles currently on the market qualify for tax credits based upon their weight and class. Below is a partial list of Qualified Fuel Vehicles listed eligible for credits by the IRS10.
o Ford Roush F-150 – $2,500 o Tymco LPG Street Sweeper – $32,000 o Cummins Westport LPG Light Duty Trucks – $5,000 o Cummins Westport Medium Duty Trucks – $12,500 o Cummins Westport LPG Heavy Duty Trucks – $20,000 o GM Chevrolet Clean Fuel USA LPI Systems – $8,892 - $9,412 o Baytech LPG Engine – $8,000 - $32,000 o Bluebird LPG Schoolbus – $9,760
There is a $0.50 motor fuels excise tax credit per gasoline gallon equivalent for
LPG, CNG, and LNG fuel purchases, available through December 31, 2009. The biodiesel tax credit was raised from $0.50 to $1.00 as part of the Emergency Economic Stabilization Act of 2008.
3.1.4 Other Government and Private Sector Policies and Initiatives Promoting Energy Efficiency
Environmental laws are expanding in scope, bolstered by state and regional initiatives promoting efficient use of carbon-free or reduced-carbon fuels. Movements enabling these laws’ passage stem from a deepening public commitment to reduce energy usage, promote clean environmental technologies, and induce environmentally responsible behavior. Through municipal, state, and federal regulations, environmental groups, and public interest lobbies, emerging changes in energy markets are affecting the choices consumers make (and can make), and the relative ability for different players to compete in these markets. Programs designed to reduce energy consumption and improve efficiency often have mixed impacts on the propane industry. When profit margins depend on total gallons sold, programs that reduce consumption have a financial impact on the industry. This problem is compounded when competing fuels actually benefit from the same set of rules and regulations that are unfavorable to propane. For example, programs designed to promote efficient use of electricity often provide incentives for electric applications, reducing propane’s share in these markets. Electric rate structures that promote greater electricity use (declining block rates; the more energy used, the less incremental price paid) also reduce incremental electricity prices and make it more difficult for propane to compete. However, propane is a relatively clean fuel that can benefit from policies and regulations that promote clean efficient fuels.
10 http://www.irs.gov/businesses/article/0,,id=175456,00.html

26
A number of energy efficiency and environmental initiatives exist that change the fundamental market dynamics of propane. The list of programs and initiatives below is not meant to be all-compassing, but rather provide examples of potential threats – and opportunities – in the marketplace for propane:
Clean Cities – A government-industry partnership administered through the U.S. Department of Energy Efficiency and Renewable Energy program designed to reduce petroleum consumption through promotion of advanced fuels and vehicles, fuel economy, and hybrid vehicles. This program promotes propane and propane-fueled vehicles as an alternative to gasoline, listing refueling locations, current infrastructure development, types of propane vehicles available, and an alternative fuel price report.
Leadership in Energy and Environmental Design (LEED) – A voluntary green
building and development rating system designed by the U.S. Green Building Council to promote sustainability and energy efficiency practices. New building designs and renovations can be certified under the LEED rating system that addresses sustainable sites, water efficiency, energy and atmosphere, materials and resources, indoor environmental quality, and innovation and design processes.
National Green Building Program, NAHB – A voluntary program from the
National Association of Home Builders, it enables members to implement green building standards to improve water and resource conservation, recycling of materials, energy efficiency, and indoor air quality. A certification program accredits homebuilders at different levels based on their Model Green Home Building Guidelines.
Global Warming Solutions Act (AB32) – California climate legislation to require
the reporting and verification of statewide greenhouse gas emissions. Programs implemented are likely to have a detrimental effect on propane and other fossil fuel markets.
Western Climate Initiative – Program involving seven western states and four
Canadian provinces designed to identify, evaluate, and implement a regulatory regime to reduce greenhouse gases. This will likely take the form of a cap-and-trade system.
Regional Greenhouse Gas Initiative – Similar to the Western Climate Initiative,
the RGGI establishes a cap-and-trade program in the Northeastern and Mid-Atlantic states.
Environmental Protection Agency Climate Choice Program – A partnership
program designed to recognize and accelerate market adoption of emerging technologies that have potential to reduce greenhouse gas emissions.
For more discussion on the implications of potential greenhouse gas regulations and policies, see Section 3.2.

27
3.2 Greenhouse Gas Emission Regulation The likelihood that greenhouse gas emission regulation will be implemented in the next few years has grown significantly. President Obama supports climate change legislation to create a cap-and-trade program to reduce carbon dioxide and other greenhouse gas emissions. The U.S. Congress has shown willingness to press on the issue. The Senate brought the Lieberman-Warner Climate Security Act of 2008 (S. 3036 [110th]) to a vote in June 2008, and although it did not pass, the issue is likely to find support in Congress during the next administration. The climate legislation currently proposed includes new regulations and monitoring rules for industries and companies that produce or emit carbon dioxide, methane, and other greenhouse gases. Businesses and consumers will certainly incur some new costs, but estimates vary as to their magnitude. The legislation’s regulatory mechanism is a cap-and-trade program, which would create a market of tradable emissions credits to determine a price for emitting CO2. Alternate policy options include financial disincentives such as a carbon tax, though where this levy would be implemented and its total cost has yet to be determined. Other policies focus on providing incentives to develop technological solutions, such as the utilization of renewable energy sources using wind, solar, and biomass sources of energy; and the development of carbon sequestration technologies to capture carbon released from the combustion of fossil fuels. As it stands, federal regulation of greenhouse gas has not yet been implemented, but where the federal government has not acted, some states have stepped in with their own programs to regulate carbon emissions. In 2006, California passed the Global Warming Solutions Act (AB32), setting a timetable for monitoring and reporting greenhouse gas emissions and bringing the state’s emissions into compliance with the Kyoto Protocol guidelines.11 There is also the Regional Greenhouse Gas Initiative that has established a cap-and-trade program in the northeastern and mid-Atlantic states. Ten states are participating in this program to reduce CO2 emissions from the power sector 10 percent by 2018. The Western Climate Initiative is a similar program created to identify, evaluate, and implement ways to reduce greenhouse gases for a number of western U.S. states and Canadian provinces. In addition, the United States is currently taking part in negotiations on an international agreement to reduce greenhouse gases in lieu of the Kyoto Protocol, which is set to expire in 2012. The U.S. has not ratified Kyoto and therefore not bound to its emission reduction commitments. But it is possible that the United States will be a signatory and participant in the post-Kyoto agreement, obligating the country to international carbon emissions standards. Greenhouse gas regulation will have a substantial impact on the propane industry. The magnitude of this impact is currently unclear, but there will be new opportunities and challenges. Currently, neither the costs nor the compliance measures that will be imposed on the industry are known. The EPA rulemaking establishing a carbon registry is currently in the public comment period, but is likely to require reporting of CO2 emissions by any company emitting more than 25,000 tons of CO2 per year. This is the equivalent of slightly more than four million gallons of propane per year.
11 Under these guidelines, California will have to reduce greenhouse gas emissions to 1990 levels by 2020,

28
The current cap-and-trade program under consideration by Congress regulates CO2 combustion emissions from Natural Gas Liquids at the refinery and natural gas plant and point of import starting in 2012. As currently structured, ICF estimates that the legislation could result in an increase in propane prices of between $0.20 and $0.50 per gallon. However, the process is extremely fluid, and may change dramatically before a final bill is passed. The industry also stands poised to benefit from new opportunities stemming from the climate change legislation. Propane combustion is environmentally friendly compared to gasoline and diesel fuels. Propane end-use applications are likely to benefit relative to other fossil fuels due to the lower carbon content in propane compared to other fuels. PERC conducted a comparative analysis and released a report in 2007 detailing the reductions in emissions when using propane applications versus other fuels.12 As an example, a propane furnace used for residential space heating releases less than one third of the total greenhouse gases of an electric furnace, attributable to the coal and other carbon-intensive fuels used for the electricity supplied to the furnace. According to the PERC report, propane also shows an advantage in other end-use categories, such as forklifts and medium duty engines. Under a cap-and-trade system, fuels and technologies exhibiting fewer carbon emissions will benefit through reduced costs, and may also provide opportunities to profit through the sales of carbon credits. However, greenhouse gas regulations also represent a risk to propane in many of its traditional applications. Depending on how the final rules and regulations are drafted, greenhouse gas (GHG) regulations may lead to an aggressive push into energy efficiency that could cut into propane market share in the residential and commercial sectors. If the regulations promote energy efficiency without penalizing additional sales of electricity, electric utilities are likely to use energy efficiency programs to aggressively promote switching from propane and other fuels to electricity, particularly for heating applications based on heat pumps and geothermal heat pumps. Greenhouse gas regulations are also likely to include new programs and incentives designed to improve overall energy efficiency in new and existing applications, including more stringent building codes and appliance efficiency standards. Propane use per customer is already declining due to improvements in efficiency, and these types of regulations are likely to accelerate the trend. As a result, propane use per application can be expected to continue to decline throughout the analysis period.
3.3 Changes in Competitive Fuel Technologies
3.3.1 Conventional Electric Heat Pumps Electric heat pumps work by transferring heat extracted from air, water, or ground based sources using a condensing and compressing process similar to a refrigerator. Standard air-based electric heat pumps are relatively inexpensive and have significant end-use
12 More information can be found in the 2007 report Propane Reduces Greenhouse Gas Emissions: A Comparative Analysis published on the PERC website.

29
efficiency advantages over combustion-based heat. Air-source heat pumps have efficiencies that range from 175-250 percent during normal operation. As a source of heat, heat pumps have several disadvantages relative to combustion furnaces:
The heat pump’s energy efficiency advantages dissipate under colder weather conditions. Most air-based electric heat pumps start losing efficiency when temperatures drop below 20 to 30 degrees Fahrenheit.
The heat gain associated with a heat pump is much less than the heat gain
associated with a combustion furnace. Traditional heat pumps return air at about 10 – 20 degrees warmer than the current inside air temperature, while a combustion furnace returns air about 30 – 35 degrees warmer than current air temperature. The warmer air of the combustion furnace is generally considered to be more comfortable.
Older heat pumps have had a relatively short equipment life with expected
replacement at around 15 years of age. However, improvements in heat pump technology are reducing these traditional shortcomings:
New generation heat pumps are much more efficient than the older units, with improved low temperature operating characteristics.
The heat gain on new heat pumps has been increased, improving comfort of
homes using heat pumps.
Equipment reliability and lifetime has been improved. We expect heat pump technology to continue to improve over time, providing a continuing threat to the propane heating market.
3.3.2 Geothermal Heat Pumps Geothermal heat pumps (GHPs) represent another competitive threat to the propane residential heating market. Similar to air-source heat pumps, GHP utilizes an electric pump to exchange heat through coiled loops buried in the ground, where temperatures are relatively stable throughout the year. This allows the GHPs to maintain high operating efficiency regardless of the outside temperature. The U.S. Department of Energy reports that standard operating efficiencies for geothermal range between 300-600 percent, compared to 175-250 percent from air-source pumps13. GHPs are inexpensive to operate compared to a traditional electric heat pump, and are cost competitive relative to both propane and natural gas furnaces. However, very high first costs for geothermal installation constrain market adoption of this technology. GHPs require a large capital investment for the underground installation of the coils. The Department of Energy (DOE) EERE estimates that the installed cost of a small three ton
13 http://www.eere.energy.gov/consumer/your_home/space_heating_cooling/index.cfm/mytopic=12640
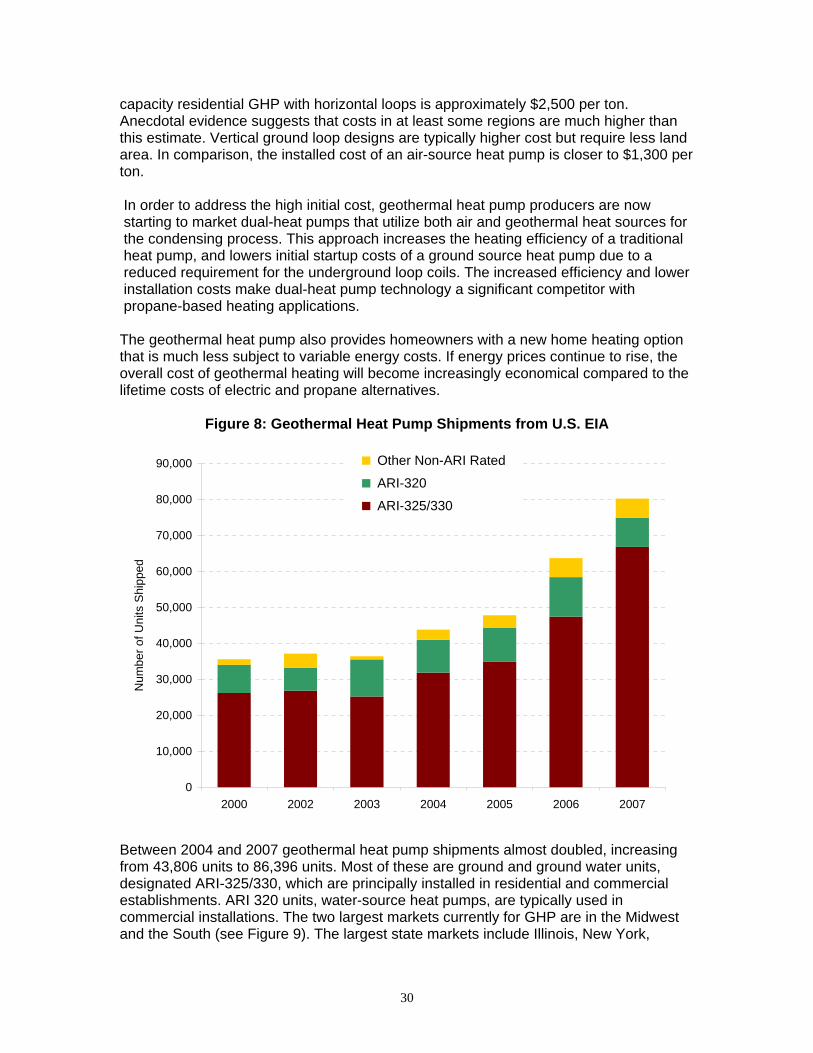
30
capacity residential GHP with horizontal loops is approximately $2,500 per ton. Anecdotal evidence suggests that costs in at least some regions are much higher than this estimate. Vertical ground loop designs are typically higher cost but require less land area. In comparison, the installed cost of an air-source heat pump is closer to $1,300 per ton. In order to address the high initial cost, geothermal heat pump producers are now starting to market dual-heat pumps that utilize both air and geothermal heat sources for the condensing process. This approach increases the heating efficiency of a traditional heat pump, and lowers initial startup costs of a ground source heat pump due to a reduced requirement for the underground loop coils. The increased efficiency and lower installation costs make dual-heat pump technology a significant competitor with propane-based heating applications. The geothermal heat pump also provides homeowners with a new home heating option that is much less subject to variable energy costs. If energy prices continue to rise, the overall cost of geothermal heating will become increasingly economical compared to the lifetime costs of electric and propane alternatives.
Figure 8: Geothermal Heat Pump Shipments from U.S. EIA
0
10,000
20,000
30,000
40,000
50,000
60,000
70,000
80,000
90,000
2000 2002 2003 2004 2005 2006 2007
Num
ber o
f Uni
ts S
hipp
ed
Other Non-ARI Rated
ARI-320
ARI-325/330
Between 2004 and 2007 geothermal heat pump shipments almost doubled, increasing from 43,806 units to 86,396 units. Most of these are ground and ground water units, designated ARI-325/330, which are principally installed in residential and commercial establishments. ARI 320 units, water-source heat pumps, are typically used in commercial installations. The two largest markets currently for GHP are in the Midwest and the South (see Figure 9). The largest state markets include Illinois, New York,

31
Pennsylvania, and Ohio, which together account for about 25 percent of total capacity shipments.
Figure 9: GHP Shipments by Region from U.S. EIA (2006)
Total Rated Capacity Tons
Exported12%
Midwest35%
Northeast12%
South29%
West12%
Exported Midwest Northeast South West
`
The Emergency Economic Stabilization Act of 2008 signed into public law by President Bush on October 3, 2008 provided up to a 30 percent tax credit for property expenditures for homeowners who install geothermal heat pumps in their homes before December 31, 2016. Limits to the credit amount were removed by the American Recovery and Reinvestment Act of 2009 (Stimulus Bill), meaning 30 percent of any installation, no matter the cost, is subject to a tax credit. The GHP tax credit reduces the first cost advantage of a propane furnace relative to a geothermal heat pump by roughly 20 to 30 percent, and is likely to result in increased market penetration of this technology. As the national dialogue further debates energy issues, credits and subsidies that favor other technologies over propane present new competitive challenges to propane’s residential and commercial market share.
3.4 Competing Fuel Providers
3.4.1 Electric Utilities Electric utilities in regions with abundant power generation capacity, particularly the Midwest and Southeast, have been and are likely to continue to be aggressive in

32
promoting residential whole house electricity use. This includes rebates and promotions for geothermal heat pumps, particularly in the Midwest, as well as rate incentives to install electric heating. Even the smaller electric utilities have significantly more financial and market power than the majority of propane retailers. The increasing national policy focus on energy issues, including energy security, energy efficiency and global climate change, is likely to result in an increase in the promotion of high efficiency electric appliances. As a result, the propane industry can expect to see a significant expansion in the number of utility sponsored programs that provide incentives for high efficiency conventional and geothermal heat pumps.14
3.4.2 Natural Gas Utilities
Delivered natural gas is typically much less expensive than propane for residential and commercial customers. When natural gas is available, consumers typically choose natural gas rather than propane due to this fuel cost issue. As a result, potential national and local energy policies that promote natural gas system expansion are likely to limit growth in residential and commercial propane customers. While there are no current policies designed explicitly to promote natural gas system expansion, the status of natural gas as a clean fuel sourced primarily in North America, combined with recent improvements in domestic natural gas supply, could lead to these types of policies. The natural gas industry is currently promoting natural gas as part of the solution to energy security and climate change concerns, and is likely to request policy and regulatory changes that promote expansion of the natural gas distribution system.
14 This behavior will vary widely by region and electric utility. Utilities in constrained markets typically are less aggressive in marketing to new customers than utilities in unconstrained markets.

33
Section IV: Key Propane Markets
There are a few propane market sectors worth particular emphasis due to special opportunities and threats the industry is likely to face going forward. This section reviews these key propane markets by assessing key issues and trends. The following sectors are covered in detail:
Residential Sector On-Road Vehicle Sector
Other “Diesel Competitive” Markets
4.1 Propane Use in the Residential Sector Propane usage in the residential sector is the largest market for odorized propane in the United States. Propane usage in the residential sector can be classified by three end-use housing types: site-built, manufactured (factory-built) and seasonal. Within each of these housing categories there are three primary applications for which propane is utilized: space heating (primary and supplementary), water heating, and cooking. (For this analysis, propane applications such as clothes drying and pool heating are categorized as “other” with the cooking category.) Significant growth in the national propane market in recent years has been driven by the expanding residential sector, where propane has maintained a consistent market share during the housing market boom. But the severe downturn in the new construction market has negatively affected propane’s residential growth potential.
Housing Type End-Use Application
Site-built Space Heating Manufactured Water Heating Seasonal Cooking/Other
In the near term, residential propane customer growth is expected to slow due to the downturn in the new housing construction market, collapse of the manufactured housing market, and higher propane prices. While growth has slowed, it is not stagnant. The total number of site-built homes using propane is projected to continue increasing slowly, although much of the growth will be offset by the loss of existing propane customers in the declining manufactured housing market. A significant share of the growth in propane demand to meet new customer requirements will be offset by declines in propane sales resulting from improvements in energy efficiency by existing propane customers. High energy prices combined with new national energy policies will likely accelerate the existing declining sales per customer trend. Even without the high energy price environment, propane use-per-customer would still be decreasing due to efficiency improvements in replacement equipment and the installation of new, more efficient building shells. This is compounded by new improvements in competitive heating technologies, such as electric heat pumps,

34
geothermal heat pumps, and wood/pellet stoves, which serve to further impede propane growth. But propane remains a competitive and viable alternative to many electricity-based applications. In the northeast, the market share of propane space heating homes continues to grow rapidly as homes switch from heating oil to propane, and propane prices remain competitive with electricity. ICF projects that water heating and cooking market share in most geographical areas will grow more quickly than space heating, partially offsetting some of the larger declines in the space heating applications. New technologies, including tankless water heaters, also provide market opportunities where propane is more efficient than its electric counterparts and has lower overall operating costs.
4.1.1 Existing Residential Propane Customer Base and Housing Stock
The residential propane customer base is widely distributed. Propane heating market share, shown by county in Figure 10, is highest throughout the Midwest, with limited market share in the Northeast, where fuel oil predominates, and in the Pacific Northwest, where low electricity prices have inhibited propane market penetration.
Figure 10: Location of Propane Heated Households
According to data from the American Housing Survey (AHS) (Figure 11), the total United States households using propane has been relatively stable since 2001 for all of the major residential propane end-use applications (heating, water heating, cooking).15 Data published for 2007 suggest that the total number of propane households declined slightly between 2005 and 2007, after growing slowly between 2001 and 2005. 15 Regional data is included in Appendix A.

35
Figure 11: Total U.S. Households Using Propane for Major End-Uses
0
1,000
2,000
3,000
4,000
5,000
6,000
7,000
1999 2001 2003 2005 2007
Thou
sand
Hou
seho
lds
Primary Space Heating Water Heating Cooking Fuel
The data on total propane households hides offsetting market trends in two distinct residential markets. In the site-built housing market (shown in Figure 12), the total number of propane customers has been growing since before 1997, with a modest decline in the number of propane heated households between 2005 and 2007. In this housing market subset, the number of propane water heating and cooking customers has also continued to increase over time. Between 2001 and 2007, the number of propane heating customers increased by almost 6 percent. Meanwhile the number of water heating customers increased by more than 9 percent, and cooking customers increased by more than 8 percent.
Growth in the site-built housing market has been offset by a substantial and continuing decline in the number of manufactured housing units using propane. Since peaking in 1999, the number of manufactured homes using propane has been declining for all propane applications, with an 18 percent decline in propane heating customers, a 22 percent decline in propane water heating customers, and a 20 percent decline in propane cooking customers. Further trends in the manufactured housing sector are discussed in section 4.1.3.

36
Figure 12: Site-Built Households Using Propane for Major End-Uses
-
1,000
2,000
3,000
4,000
5,000
6,000
1997 1999 2001 2003 2005 2007
Thou
sand
Hou
seho
lds
Primary Space Heating Water Heating Cooking Fuel
Figure 13: Manufactured Households Using Propane for Major End-Uses
-
200
400
600
800
1,000
1,200
1,400
1,600
1997 1999 2001 2003 2005 2007
Thou
sand
Hou
seho
lds
Primary Space Heating Water Heating Cooking Fuel
The mix of propane applications in existing customer households is quite diverse. In the Northeast, most propane customers use propane for cooking and water heating, but not for space heating. In other regions, space heating dominates, and many customers are not using propane for water heating or cooking. The diversity of propane applications provides a significant opportunity to expand sales of propane to existing propane

37
customers by increasing the number of propane applications used by the customer. Figures 14 and 15 provide an estimate of the number of existing propane customers that could add heating, water heating or cooking loads. There are more than 2.5 million propane customers in site built housing that could convert to propane heat, including more than one million propane customers in the Northeast that are likely heating with fuel oil. There are also almost four million existing propane customers that do not heat water with propane, and almost four million existing propane customers that do not cook with propane.
Figure 14: Propane Conversion Opportunities with Existing Propane Customers
Propane HouseholdsSource: American Housing Survey 2007
Existing Propane Housing Market(thousands) Total U.S. Site‐Built ManufacturedHomes Using Propane 9,720 8,050 1,670
Primary Space Heating 6,095 4,966 1,129 Cooking 5,041 3,848 1,193 Water Heating 4,133 3,678 455 Clothes Dryer 1,351 1,203 148
Conversion OpportunitiesPrimary Space Heating 3,625 3,084 541 Cooking 4,679 4,202 477 Water Heating 5,587 4,372 1,215 Clothes Dryer 8,369 6,847 1,522
Average Propane Appliance Replacements Per YearPrimary Space Heating (20 year lifespan) 181 154 27 Cooking (10 year lifespan) 468 420 48 Water Heating (20 year lifespan) 466 364 101 Clothes Dryer (12 year lifespan) 697 571 127

38
Figure 15: Regional Propane Conversion Opportunities
Propane HouseholdsSource: American Housing Survey 2007
Existing Propane Housing Market(thousands) Northeast Midwest South WestHomes Using Propane 2,109 2,558 3,912 1,142
Primary Space Heating 808 2,146 2,277 864 Cooking 1,503 1,120 1,840 578 Water Heating 841 1,265 1,236 792 Clothes Dryer 472 403 250 228
Conversion OpportunitiesPrimary Space Heating 1,301 412 1,635 278 Cooking 606 1,438 2,072 564 Water Heating 1,268 1,293 2,676 350 Clothes Dryer 1,637 2,155 3,662 914
Average Propane Appliance Replacements Per YearPrimary Space Heating (20 year lifespan) 65 21 82 14 Cooking (10 year lifespan) 61 144 207 56 Water Heating (12 year lifespan) 106 108 223 29 Clothes Dryer (12 year lifespan) 136 180 305 76
4.1.2 National Housing Market Trends Growth in the propane market over the last several years has been driven by propane’s relatively steady market share in the residential new home construction market. Beginning in 2000, new residential construction grew over 5 percent per year through 2005, providing new opportunities for growth in propane heating furnaces and boilers, water heaters, cooking and clothes drying appliances. The collapse of the housing market has changed the new construction market significantly, severely limiting opportunities for expansion in the residential sector. In terms of the overall housing market, housing permit authorizations in 2006 were down 14.6 percent compared to their peak in 2005. This decline steepened as the depth of the crisis grew. By 2008, authorizations had declined 52 percent from 2005 levels. Figure 16 shows the run-up in new housing construction authorizations over the past decade, followed by their subsequent collapse. The near-term outlook for the residential new construction market remains weak. Current economic forecasts are suggesting that the recent downturn is likely to continue into 2010. A sample of economic forecasts (Figure 17) comprised of predictions from housing and mortgage associations, along with the Federal Reserve, suggest that the market may have reached its lowest point in the first half of 2009, but the rebound will be slow, and spread over several years.

39
Figure 16: National Housing Starts from the U.S. Census Bureau16
0
500
1,000
1,500
2,000
2,500
2000 2001 2002 2003 2004 2005 2006 2007 2008
Thou
sand
s of
Uni
ts
Figure 17: Forecasts of New Home Construction Starts
0.4
0.6
0.8
1.0
1.2
1.4
1.6
2007Q1
2007Q2
2007Q3
2007Q4
2008Q1
2008Q2
2008Q3
2008Q4
2009Q1
2009Q2
2009Q3
2009Q4
2010Q1
2010Q2
2010Q3
2010Q4
Ann
ualiz
ed H
ousi
ng S
tart
s (M
illio
ns)
Federal Reserve
Mortgage Bankers Assoc.
Fannie Mae
Freddie Mac
National Assoc. of Realtors
16 The U.S. Census Bureau conducts a survey of new home construction permits and a canvass of areas that do not require permits in order to provide statistics on the construction of new privately-owned residential structures. A number of new home characteristics are reported and measured, including price and location of the home, size of the lot, number of bedrooms, bathrooms, type of construction, and the type of primary home heating system.

40
Propane construction starts have collapsed as well, though at a slower rate than the overall new construction market. This is the result of propane’s expanding market share in recent years (see discussion on propane market share in Section 3.1.2). The number of single-unit housing starts with propane as the primary heating system in 2005 was about 98,000. This dropped 34 percent to about 64,000 in 2007. Data for 2008 has not been released, however propane housing starts likely declined to about 37,000 households in 2008.
4.1.3 Manufactured Housing Market Trends Manufactured housing represents 15 percent of all residential propane heating market households, but this market is rapidly disappearing. In every region, manufactured housing placements using propane for primary space heating have been declining. This is attributable to a number of key factors:
• The number of annual manufactured housing placements is currently at historical lows, having dropped from 370,000 in 1998 to 77,000 in 2008. This, in turn, has effected propane placements, which have declined from 118,000 in 1998 to an estimated 10,000 in 2007, a drop of over 90 percent.
Figure 18: Propane Manufactured Housing Stock Forecast
-100,000
-80,000
-60,000
-40,000
-20,000
0
20,0002006 2007 2008 2009 2010 2011 2012
Num
ber o
f Uni
ts
PlacementsRetirements
• New propane placements have been unable to keep pace with retirements of old
units, which tend to have a higher share of propane. Newer placements tend to have a higher share of electricity-based heating and cooking applications compared to propane, adding to the continued decline of propane manufactured

41
housing market. ICF projects this trend to continue through 2012, dropping at nearly 4 percent per year over 2008-2012.
• Regional placements of propane manufactured homes (Figure 19) show that no
region has been immune to the recent declines in the manufactured housing market. And while new propane homes are continuously entering the market, albeit at a lower levels than previous years, the rapid retirement of older units continues to shrink propane’s share of the market.
Figure 19: Regional Placements of Propane Manufactured Housing
-
20,000
40,000
60,000
80,000
100,000
120,000
1998
1999
2000
2001
2002
2003
2004
2005
2006
2007
2008
2009
2010
2011
2012
Num
ber o
f Ann
ual P
lace
men
ts
New England Middle Atlantic East North CentralWest North Central South Atlantic East South CentralWest South Central Mountain Pacific
• Electricity has been capturing market share from propane in new manufactured housing placements at ever increasing rates in the past few years. Propane’s market share has suffered largely because of the first cost issues associated with propane technologies compared to electric, as well as the rise in propane prices with respect to electricity, which nationally has risen less quickly compared to propane. In terms of first cost, electric heat pumps have significantly less installation and startup costs than propane furnaces.
4.1.4 Competition with Electricity There are a number of factors influencing the shifts in propane market share. However, in the residential and commercial sectors, price based competition with electricity represents probably the biggest challenge. Propane prices have risen much faster than electricity prices over the last eight years.
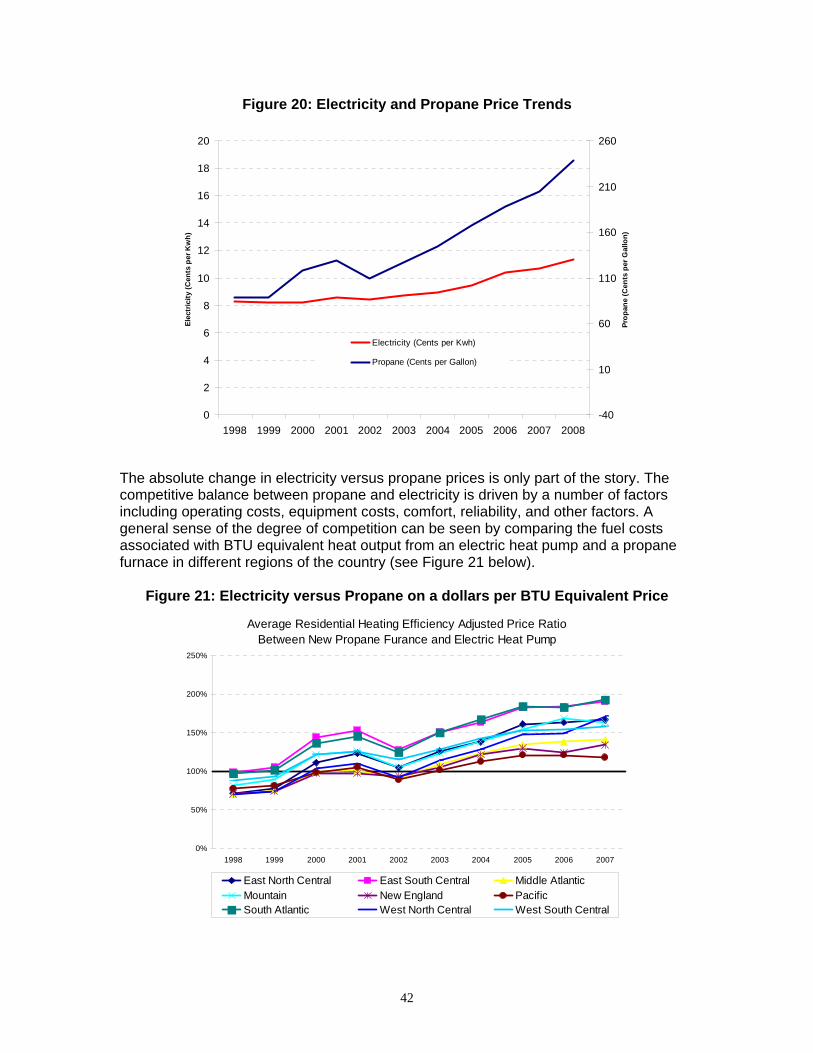
42
Figure 20: Electricity and Propane Price Trends
0
2
4
6
8
10
12
14
16
18
20
1998 1999 2000 2001 2002 2003 2004 2005 2006 2007 2008
Elec
tric
ity (C
ents
per
Kw
h)
-40
10
60
110
160
210
260
Prop
ane
(Cen
ts p
er G
allo
n)
Electricity (Cents per Kwh)
Propane (Cents per Gallon)
The absolute change in electricity versus propane prices is only part of the story. The competitive balance between propane and electricity is driven by a number of factors including operating costs, equipment costs, comfort, reliability, and other factors. A general sense of the degree of competition can be seen by comparing the fuel costs associated with BTU equivalent heat output from an electric heat pump and a propane furnace in different regions of the country (see Figure 21 below).
Figure 21: Electricity versus Propane on a dollars per BTU Equivalent Price
Average Residential Heating Efficiency Adjusted Price Ratio Between New Propane Furance and Electric Heat Pump
0%
50%
100%
150%
200%
250%
1998 1999 2000 2001 2002 2003 2004 2005 2006 2007
East North Central East South Central Middle AtlanticMountain New England PacificSouth Atlantic West North Central West South Central

43
On a regional average basis, an electric heat pump costs less to operate than a comparable propane furnace in every region of the country. Of course different states and different electric utilities have very different price structures in every region, so this isn’t the full story. The comparison of current and projected electricity prices to propane prices indicates that propane will not have an operating cost advantage relative to electric heat pumps in most states, even in the states experiencing significant jumps in electricity prices. The comparison of prices is more favorable for water heaters. However, even for water heaters, electricity now has an operating cost advantage over propane in many cities. The propane tankless water heater performs better, with operating costs that should be lower than an electric tank water heater in the majority of cities, although it is still not a clear cut winner.
4.1.5 Residential New Construction Trends Each year, data published by the U.S. Census Bureau on new home construction provides an assessment of the propane market in new one-family residential home construction. Statistics from both a survey of new home construction permits and a canvass of areas that do not require permits provide an annual snapshot of the changing characteristics of privately-owned residential structures. Site-built, panelized or precut, and modular homes are assessed in the survey, but excluded are manufactured homes constructed under HUD building code guidelines, which do not require a permit for placement. Forty-two new home characteristics are reported and measured, including price and location of the home, size of the lot, number of bedrooms, bathrooms, type of construction, and the type of primary home heating system. This data presents an annual snapshot of the new construction propane market share, a key leading indicator of the propane home heating market. ICF has conducted an analysis of the most recently published 2007 data. For each year in the reported results, only permits or records of homes started in that year are included in the analysis. The data is reported on a regional basis, subdivided by Census regions and divisions. The new construction start data indicates that the propane market share in the new residential construction heating market has been increasing, even amidst the downturn in the overall residential real-estate market. Propane market share of new home construction is up for the second consecutive year, rising to 6.5 percent in 2007, the highest since 2000.

44
Figure 22: Propane Home Heating Market Share of New Home Construction Starts
-
20,000
40,000
60,000
80,000
100,000
120,000
2000 2001 2002 2003 2004 2005 2006 2007
Prop
ane
Sing
le-U
nit H
ousi
ng S
tarts
0.00%
1.00%
2.00%
3.00%
4.00%
5.00%
6.00%
7.00%
Prop
ane
Mar
ket S
hare
Propane Single-Unit Housing StartsPropane Market Share
Nationally, propane market retains a relatively small share of home heating fuels compared to natural gas and electricity. Figure 23 shows the national breakdown of market shares for construction starts in 2007.
Figure 23: Propane Market Share of New Home Construction Starts
Electricity, 36.26%
Natural Gas, 54.76%
Heating Oil, 1.32% No Heat /
Other, 1.17%Propane, 6.49%
Electricity Natural Gas Propane Heating Oil No Heat / Other
A regional breakdown of the national figures shows some significant differences in market share trends. For example, propane market share is increasing in the New England, East North Central, South Atlantic, and Mountain regions. In particular, the New England region has continued to grow significantly over the past seven years,

45
largely due to propane’s ability to capture the dwindling distillate fuel oil market. Propane market share in new residential construction in New England is currently 23 percent, up from only 6 percent in 2000. The residential propane market continues to do well in the East North Central Region as well as in the Midwest. Propane market share of new construction starts in this region is 15 percent, up from an 11 percent share in 2005 and from 9 percent in 2002. Growth in this region is due to the loss of natural gas market share to electricity and propane in areas where new home constructions are off the natural gas grid. More detailed descriptions of the regional propane markets can be found in Appendix A. Propane Market Share by Cost of Home An analysis of the new construction data looking at home heating fuel by the total cost of the residence indicates that propane has been expanding market share in the most expensive homes, and losing market share in the least expensive homes (Figure 24). Propane is becoming a premium fuel in the largest and most expensive new homes that are not on the natural gas main. Propane share in the high-end housing market has increased significantly more quickly than any other price class. In the top 20 percent most expensive homes, propane market share steadily increased since 2000, up from 2.6 percent to 7.4 percent in both 2006 and 2007. An upward trend exists in the next most expensive category (the 60-80 percentiles) as well, where propane market share is up from 2.1 percent in 2000 to 5.9 percent in 2007. These upward trends disappear in the less expensive housing market, where propane market share has either remained stable or declined over this time period.
Figure 24: Propane Heating Market Share by Sales Price of Home
0.0%
2.0%
4.0%
6.0%
8.0%
10.0%
12.0%
14.0%
LeastExpensive
20% of Homes
20-40% 40-60% 60-80% MostExpensive
20% of Homes
No Sales Price(Built forOw ner)
Prop
ane
Mar
kets
hare
for P
rimar
y Sp
ace
Hea
ting)
2000 2001 2002 2003 2004 2005 2006 2007

46
Owners of custom and upscale homes that are built off the natural gas main still want the convenience of gas for cooking, heating, and other uses. When higher prices are less of a consideration – a situation more frequently experienced by customers living in upscale homes who are likely to have larger levels of disposable income – the value of propane heat becomes more apparent and can outweigh energy price as the most important consideration. Therefore, for the high-end residential housing market, propane can be considered a premium fuel, one that gives comfort and reliability not provided by competing fuels. The trend toward underground tanks also increases the attractiveness of propane in this market. Differences in Urban versus Rural New Construction Markets Propane market share of new home construction continues to remain higher in rural areas than urban. This is due largely to the lack of accessibility to the natural gas main in these areas. This is illuminated by the Survey of Construction, which monitors whether a new construction project is authorized inside a Metropolitan Statistical Area. Figure 25: Urban versus Rural Propane Market Share of New Home Construction
Number of Single-Unit Propane Households by Metropolitan Statistical Area
-
20,000
40,000
60,000
80,000
100,000
120,000
2000 2001 2002 2003 2004 2005 2006 2007
Prop
ane
Hou
seho
ld U
nits
Inside MSA Outside MSA

47
Propane Market Share Inside and Outside Metropolitian Statistical Region
0%
2%
4%
6%
8%
10%
12%
14%
16%
18%
2000 2001 2002 2003 2004 2005 2006 2007Outside MSA Total Inside MSA Total Grand Total
Metropolitan Statistical Areas, or MSAs, are geographical entities of metropolitan areas defined by the U.S. Office of Management and Budget. These urban zones contain an area of 50,000 or more population and include any counties within or adjacent to the core urban area. MSAs, therefore, are a proxy measurement for “city” versus “rural.” While the total number of households inside MSAs far exceeds those outside, propane market share of these rural households have tended to be much higher. In non-MSA zones, propane market share has averaged 15 percent from 2000 to 2007, up in 2007 to 16.4 percent, while market share inside of the MSA zones has averaged 4.2 percent over the same period. However, despite the higher propane market share outside of the MSAs, a significant majority of propane homes are built inside of the Metropolitan Statistical Areas. Differences by Type of Construction Propane market share behavior varies by type of construction also. Using the Survey of Construction data combined with placement data published separately17 by the U.S. Census Bureau, a comparative analysis shows propane performing well in the modular housing markets compared to either site-built or manufactured (factory-built) housing. The modular and manufactured housing markets show considerably more volatility compared to site-built housing.
17 We do not have similar data on manufactured housing market share; therefore the propane share of manufactured housing is estimated based on changes in housing stock data from the U.S. Census Bureau.

48
Figure 26: Propane Market Share by Type of Construction
Single-Unit Propane Construction Starts by Construction Method
0
20,000
40,000
60,000
80,000
100,000
120,000
140,000
2000 2001 2002 2003 2004 2005 2006 2007
Num
ber o
f Con
stru
ctio
n St
arts
Manufactured HousingModularSite-Built
Propane Market Share by Type of Construction
0%
5%
10%
15%
20%
25%
30%
2000 2001 2002 2003 2004 2005 2006 2007
Prop
ane
Mar
ket S
hare
ModularManufactured HousingSite-Built
Modular housing represents a potentially important market opportunity for the propane industry. Propane market share of home heating fuel in new modular housing is consistently higher than both manufactured and site-built housing18, although the total
18 Manufactured homes are built under the federal HUD code. Site-built and modular housing requires construction permits, although modular homes are factory built and installed on-site.

49
size of the modular market is only a fraction of site-built housing. Figure 26 shows the total number of new home starts by construction method – site-built, manufactured, and modular housing – as well as the propane market share of home heating fuel for new construction in each of these housing types. As seen in the first chart, propane modular housing starts have grown or stayed consistent in proportion to the other housing types since 2000, whereas propane manufactured housing placements are down considerably. ICF estimates that the manufactured housing placements that are completed have a smaller market share of propane than in previous years, indicating a shrinking propane market in both size and share moving forward. Modular housing is recovering some of this lost ground. The size of the modular housing market remains small compared to the site-built housing market, but unlike the shrinking manufactured housing market, modular home installations have stayed consistent and even grown over the last several years. Propane retains a significant market share, between 20 and 25 percent of new modular home construction since 2000, making modular homes a key area of focus in the residential sector. Differences by Design of Home Propane market behavior varies significantly by the design of the housing construction. The majority of new propane construction is in detached housing. However, propane market share in attached housing such as townhouses and other multi-unit residences has been a source of recent growth for propane, accounting for almost 10 percent of new propane heated constructions.
Figure 27: Propane Market Share by Design of Home
New Single-Unit Propane Construction Starts by Design of Home
0
20,000
40,000
60,000
80,000
100,000
120,000
2000 2001 2002 2003 2004 2005 2006 2007
Detached Attached

50
Propane Market Share of New Construction Starts by Design of Home
0%
1%
2%
3%
4%
5%
6%
7%
8%
2000 2001 2002 2003 2004 2005 2006 2007
Detached Attached Total
4.1.6 Residential Appliance Efficiency and Use-per-Customer Trends In the residential sector, propane sales per customer have been declining for several years.19 While there are a variety of different factors influencing this trend, three major issues are responsible for most of the change. First, appliances and buildings are becoming more energy efficient in response to changes in building codes and appliance energy standards. Second, the mix of propane appliances used by the average customer has been changing, with heating customers increasing as a percentage of total customers in New England, while declining in most other regions. Finally, in response to propane price increases, customers are significantly reducing their usage through conservation, the purchase of more efficient appliances, and improved building shell energy efficiency. This trend has been partially offset by the increasing concentration of propane heating customers in colder states, growth in the average size of household, increases in the number of propane applications per household, and the declining market for manufactured homes, which tend to be smaller than site-built homes. The changes in use per customer have a significant impact on propane industry profitability and planning. Use-per-customer estimates are used by many or most propane retailers to determine seasonal buying strategies and desired inventory levels. Total sales volumes, which are also substantially influenced by use-per-customer, are used to measure company growth and financial health. Projections of total sales volumes are also used for long term company planning and investment decisions. PERC 19 These trends are not unique to the propane industry. A recent study conducted by the natural gas industry estimated a decline in winter use per customer of 13.8 percent between 2000 and 2006 for a sample of 46 distribution companies.

51
and propane industry members rely on estimates of propane end-use distribution, sales loads, customer responses to propane and other energy price changes, propane market share in the renovation market, and other issues when planning for the future. The recent changes in propane prices have substantially increased the uncertainty in estimating propane demand throughout the industry. During 2008, some companies reported declines in propane sales of 8 percent or more, attributed to customer conservation. Other companies have reported relatively stable volumes. The differences between companies are the result of differences in markets serviced, differences in weather in their service territories, and differences in customer growth patterns. We anticipate the impact of the aggressive price driven conservation to decline in the near term due to the drop in residential propane prices in the second half of 2008 and 2009.
Between 2000 and 2007 weather normalized propane use per customer dropped by about 12.8 percent. Use per customer is expected to decline by an additional 3 percent in 2008 through 2009, but then remain relatively stable as customers respond to somewhat lower propane prices by increasing use.
Higher efficiency technologies reduce per customer demand by about 0.6
percent per year, and improvements in building shell efficiency reduce per customer demand by about 0.5 percent per year. These trends may increase with changes in government policy concerning energy efficiency.
Figure 28: Impact of Prices and Efficiency Trends on Propane Use-per-Customer
Weather Normalized Propane Primary Space Heating Consumption per Household
0
100
200
300
400
500
600
700
800
900
2000 2001 2002 2003 2004 2005 2006 2007 2008 2009 2010 2011 2012
Gal
lons
per
Hou
seho
ld
Site-Built Housing Base CaseManufactured Housing Base CaseSite-Built Housing No Price or Efficiency ImpactManufactured Housing No Price or Efficiency Impact

52
4.2 Propane Use by On-Road Vehicles The on-road sector includes all vehicles that operate on U.S. highways, including cars, light trucks, heavy-duty trucks, and buses. The refueling infrastructure for on-road propane vehicles is reasonably well developed and LPG used in internal combustion engines results in lower emissions, rendering it a cleaner burning fuel. In addition to being less expensive than diesel fuel, propane remains a favorable fuel due to state and federal policies for alternative fuel vehicles that provide tax credits for new equipment and fuel purchases. Despite these advantages, the number of registered LPG vehicles has been declining. The Energy Policy Act of 1992 (EPACT 1992) created favorable conditions for the LPG vehicle market and many new propane vehicles were added to vehicle fleets in the 1990’s. However, in the last few years many fleets have been shifting away from LPG fuel as other alternatives have become available, especially biofuel (ethanol and biodiesel) and hybrid electrical vehicles. In addition, new EPA and CARB emissions regulations implemented in 2000 and 2004 have made it more difficult to certify new alternative fueled vehicles and conversion kits, limiting the number of new LPG vehicles available. During this period, almost no OEM propane fueled vehicles were available in the market, and very few emissions compliant conversion kits were available. As existing vehicles from the 1990’s were retired, the number of propane vehicles dropped substantially during this period. For example, in Texas, the reported number of propane vehicles dropped by 44.6 percent between 2000 and 2006, from about 22,000 to 12,000 units.20 However, the current energy price and environmental regulatory outlook, combined with increasing availability of new propane fired vehicles, provide an environment with significant potential for propane market growth.
4.2.1 Current On-Road Propane Vehicle Fleet There are no comprehensive assessments of the number of propane fueled vehicles in the on-road vehicle fleet. ICF has estimated the number of propane vehicles based on the most recent comprehensive assessment from 1995, accounting for expected vehicle retirements and announced new vehicle sales and vehicle conversions. Figure 29 shows ICF’s estimate of total propane vehicles on the road. This estimate is well below estimates from other sources,21 but is consistent with reported data from individual states and programs.22
20 Non-exempt vehicle data from the Texas Comptroller of Accounts. 21 The US EIA estimates 164,846 propane fueled on-road vehicles in 2006. The EIA estimate is based on SAIC estimates from 1995, accounting for new vehicle additions and retirements in each year. ICF believes that the EIA estimate does not accurately account for vehicle retirements, or the percentage of dual fuel vehicles using gasoline instead of propane. 22 Texas reports a total of 12,114 LPG vehicles in 2006, compared to the EIA estimate of 66,242 LPG vehicles for Texas.

53
Figure 29: ICF Estimate of Propane On-Road Vehicles (1998 – 2008)
-
20,000
40,000
60,000
80,000
100,000
120,000
140,000
1998 1999 2000 2001 2002 2003 2004 2005 2006 2007 2008
Num
ber o
f Veh
icle
s
The Clean Cities coalition, which represents a substantial subset of total activities for alternative fuel vehicles, reported 408,138 alternatively fueled vehicles in 2006, or about 64 percent of the total alternative fueled vehicles reported by the EIA. The allocation of these vehicles by fuel type is shown in Figure 30. According to this data, LPG represented about 6 percent of total vehicles reported by the coalition, or about 25,000 units. This data does not represent the total number of vehicles available, but nonetheless is a reasonable indicator of vehicle distribution in large fleets.
4.2.2 Factors Likely to Influence Future Propane Vehicle Penetration
EPA and CARB Motor Vehicle Emissions Regulations
The EPA and California Air Resources Board (CARB) have implemented extremely stringent emissions regulations for virtually every vehicle class. The light duty standards are already phased in. The latest on-road heavy duty regulations will take effect for Model Year 2010 vehicles.
LPG fueling offers a relatively less complicated path to comply with the emissions regulations without the need for expensive after-treatment such as particulate filters. Also, the sealed nature of the fueling system offers an advantage in evaporative emissions compliance. LPG vehicles are also eligible for advanced technology credit generation under California’s emissions program, a subset of regulations called the Zero Emissions Vehicle (ZEV) program.

54
Figure 30: Composition of Clean Cities Alternative Fueled Vehicle Fleets
While propane fueling has been put on a level playing field with gasoline and diesel competition, the certification and testing burden has increased to the point where small volume providers, such as aftermarket conversion companies, have been virtually forced out of the market place.
Greenhouse Gas Emissions Policies
While LPG is a non-renewable fuel, it is a cleaner alternative to gasoline and diesel. Further, studies have shown that the GHG emissions impact for propane is lower for many applications, including on-road vehicles, when full life cycle analysis is taken into consideration. There are numerous initiatives under development focused on the GHG emissions policy. The programs that reached implementation status are largely concentrated in California. Policies that are relevant for the LPG industry include:
CA Global Warming Solutions Act (AB32) CA Low Carbon Fuels Standard CA State Alternative Fuels Plan (AB1007) CA Alternative and Renewable Fuels and Vehicle Technology Program (AB118)
Propane Vehicle Tax Credits
State and federal tax incentives are available for LPG vehicles and fuel marketers. The most important set of incentives was established by the federal EPACT 2005 legislation. Currently the following federal alternative fuel tax credits are available for the LPG industry:
Tax incentives for the purchase of alternative fuel vehicles, including LPG-
powered. Both OEM and aftermarket conversions qualify for this credit. The credit amount depends on the vehicle weight/class and emissions certification. For example, the NOx emissions performance qualifies the system for additional

55
tax credit for fleets as much as 80 percent of incremental cost (50 percent base credit plus 30 percent for incremental cost of lowest emission vehicle available, which LPG technology providers such as CleanFuel USA have demonstrated). However, the provisions expire on January 1, 2011.
LPG vehicle refueling infrastructure credits provide a tax credit of 30 percent of
the cost of a fueling station not to accede $30,000 per station. The provision expires on January 1, 2010.
50c/gal federal fuel tax credit for LPG sold for use in motor vehicles (GGE). The
credit is available for fuel retailers but expires on October 1, 2009.
The tax credits provide a significant incentive to develop and market new propane vehicle models. The major issue with the tax incentives is long-term availability. Since the credits are scheduled to expire in 2009-2011 timeframe, extensions to the tax credits need to be in place to provide assurances to the market necessary to justify long-term investments in new vehicle development.
In addition to the tax credits, the EPACT 2005 has also established requirements for certain fleets to purchase alternative fuel vehicles. The President’s 2007 Executive Order 13423 has also established requirements for federal fleets. See Section 3.1.3 for more details on propane vehicle tax credits.
4.2.3 New Propane Vehicles and Technologies There are a number of new LPG engine platforms and vehicles currently under development or entering the market. Many of these have been partially funded by PERC. 8.1L LPI System The 8.1L LPI system (based on GM’s Vortec) is certified by both the EPA and CARB. CleanFuel USA markets the engine with LPG pumps and injection system for medium-duty trucks, including school buses and delivery vehicles. The company argues that LPG offers economical advantage to fleets since fuel cost is substantially less, especially compared to diesel. Other advantages include lower PM, NOx and CO2 emissions. Also, eligible fleet owners can take advantage of the $0.50 per gallon federal tax credit.
The company was aiming to produce about 400 new engine units in 2008, 90 percent of which are bobtail trucks. The aftermarket conversion of existing engines is also available. The volume in Model Year (MY) 2009 could reach 1,000 units.
The marketer claims that the LPI approach overcomes the old issues with LPG engines, such as reliability and performance. The new system can achieve performance equivalent to the competing diesels. Opponents argue that propane fuel cost, when converted to gasoline equivalent, has only marginal advantage compared to other fuels. Also, LPG fueling involves potentially greater safety risks than even gasoline. As a result, the refueling issues involve extra costs.

56
Blue Bird bus manufacturer has adopted the 8.1L LPI engine for school bus duty. The company has plans to sell 2,200 LPG powered buses by 2010, growing from about 130 units in MY 2007. Sales are expected to grow rapidly to as many as 12,000 units by 2012 as EPA’s 2010 heavy-duty emission standards are phased in. The expected high diesel engine compliance costs associated with these standards are expected to make the LPG alternative economically more attractive. By 2013, Blue Bird estimates that there will be 14,200 LPG school buses in operation. The current fleet is only about 2,000 LPG units. 5.4L LPG V8 and Roush Ford F150 CleanFuel USA, Roush Performance Engineering and Ford have developed the 5.4L V8 LPI engine platform with support from PERC that has been launched on the Ford F150 pickup conversions. The partnership initially projected production of 259 units in MY 2007, 570 in 2008 and 1,110 in 2009, with annual production of about 1,500 to 2,000 units per year thereafter. The rollout has been slower than expected due to permitting and certification issues, however, the ultimate market projections appear reasonable.
Roush will handle the new vehicle upfits and distribution. The service will be performed at the Roush supported Ford dealer network. Potential future plans also involve the heavier F250 and F350 conversions.
Cummins B5.9L and 8.9L LPG engines The Cummins B5.9 LPG is available for the bus and other specialty medium-duty chassis platforms. The Cummins Westport 8.9L LPG is currently under development for the 2010 emissions-compliant heavy duty platforms. The engine will fit well with heavier transit, school and shuttle bus applications, as well as various city utility applications such as refuse collection and delivery vehicles.
LPG Engines and Hybrids While the LPG fueling and hybrid-electrical technologies are compatible just as any other fuel system, the LPG does have additional issues in terms of cost and packaging. Cylindrical shapes of LPG tanks might compete with the large battery placement within the vehicle. Also, the crash energy and weight distribution might be additional challenges. Nevertheless, there are concrete examples in other countries where these issues have been overcome. The LPG sealed fueling system does offer advantage in evaporative emissions control, which is a major challenge in the hybrid system design where systems have to operate without the IC engine support (during idling or EV launch). A good example of a successful technology solution is the Hyundai announcement that one of their first hybrid versions of a light vehicle will be the Elantra sedan scheduled for MY2009 in the Korean market (Elantra in Korea is called Avante). The vehicle will be powered by LPG because the fuel is priced very competitively in Korea, as well as China, Australia and some European countries such as Italy. The gasoline version of this vehicle, to be developed later, is likely to be sold in the U.S. market.
Other advanced technologies that appear to be relevant for the LPG industry include the fuel use in diesel engine cycle or, so called, Homogenous Charge Compression Ignition (HCCI) family of engine technologies. While gasoline combustion in the HCCI cycle is

57
the main focus of most developers, the conceptual LPG implementation has been mentioned in the literature.
4.2.4 Competitive Technologies for Other Fuels Biodiesel Vehicles The Energy Policy Act of 2005 created new incentives for alternative fuels, including diesel blends with 20 percent biodiesel. Currently biodiesel remains more expensive than traditional diesel. While biodiesel and Liquid Propane Injection engines do not compete in the same engine market, both alternative fuels are poised for significant growth in a policy environment and marketplace that favors cleaner, more environmentally-friendly fuels. Biodiesel retains a very small (less than one percent as of 2007) but growing market share of the diesel fuel market. Biodiesel technology is compatible with petroleum diesel, requiring only a minor technology conversion. As a result, switching from petroleum diesel to biodiesel is easier than switching from diesel to propane. In addition, the refueling infrastructure for biodiesel is already in place. Every major OEM approves the biodiesel blends up to B5:
The Chrysler factory fills its diesels with B5 (the Jeep Liberty, the new Jeep Grand Cherokee and Dodge Ram).
Chrysler has approved B20 use in the Dodge Ram. GM offers a Special Equipment Option on the 6.6L Duramax for B20 capability.
The option is available in limited production to fleets on the GMC Savanna, Chevy Express Commercial Van, Chevy Silverado Heavy Duty, and GM Sierra 1-Ton.
B20 has been implemented in heavy-duty engines school buses in school districts in New Jersey, Olympia Illinois; Clark Count, Nevada; and Arlington, Virginia.
Green environmental policies incentivize alternative fuels like ethanol, biodiesel, compressed natural gas, and propane with tax credits and subsidies for fuel cost and technology upgrades. As markets for engine fuels become more open and competitive for the propane industry, the industry will have to face the inherent challenges of competing with the biodiesel fuel industry’s established marketplace and refueling infrastructure. Diesel emissions are becoming cleaner as well, removing a traditional disadvantage. Better-refined ultra-low-sulfur diesel fuels blended with biodiesel compete with propane more directly in terms of environmental benefits and fuel cleanliness. CRT particulate filters and catalytic converters are significantly reducing the amount of particulate matter, soot, and other emissions from diesel exhaust, circumventing in part propane’s characteristics as a cleaner, “greener” fuel. Federal legislation such as the Energy Policy Act of 2005 provides incentives for biofuels and qualified alternative motor vehicle fuels like propane. Some states are implementing their own renewable fuels standards and biofuels mandates as well23:
23 http://www.npradc.org/issues/fuels/ethanol_mandate.cfm
58
Massachusetts requires renewable biomass in diesel and home heating oil
beginning in July 2010. Pennsylvania requires as much as 1 billion gallons of biofuels in state’s fuel
supply. Minnesota increased Biodiesel mandate from 2 to 5 percent of volume. Oregon requires 2 percent Biodiesel once state production reaches 15 million
gallons per year. New Mexico requires 5 percent Biodiesel for state agencies by 2010 and for all
diesel motor vehicles by 2012. California has developed a Low Carbon Fuel Standard for transportation fuels.
The heavy duty diesels will require similar engine and after-treatment upgrades for the ultra-low sulfur diesel emission standard implementation. The costs for compliance will be very substantial and this offers an opportunity for LPG marketers. Diesel light duty vehicles are also re-entering the U.S. market with the first Europe-based designs. Mercedes, Jeep, and VW are selling new generation diesels in Model Year 2008 and 2009. The major issue with new diesels is that engines and after-treatment require state-of-the-art technologies in order to meet emission standards, especially in California. As a result, the cost premium for new diesels is substantial. Electrified Power Trains The light-duty (and to a certain extent, medium-duty truck) market is experiencing a major technology shift toward electrified power trains. Many hybrid electrical vehicles are already available, and by 2010 virtually every OEM will have hybrids models in the U.S. The next iteration of the electrified power train technology will include so called “Plug-In” hybrid electric vehicles, with the first mass market models available in 2010. Low volume conversion models are already being sold. As early as 2011, the automotive OEMs will start marketing new generation dedicated electrical vehicles in the U.S.
Flex Fuel Vehicles Another major movement in the U.S. light duty sector is Flex Fuel Vehicle (FFV) marketing, particularly ethanol E85 FFV. The major U.S. manufactures have sold millions of these vehicles and many fleets take advantage of the FFV availability to satisfy the alternative fuel purchase mandates.
4.2.5 Key Issues for Propane On-Road Fueled Vehicles There are a number of key issues that are likely to impact the market growth of propane on-road vehicles. These include:
Propane/Distillate Price Relationship: Over the last few years, diesel fuel prices generally have been increasing relative to propane prices. This trend is expected to continue for the foreseeable future, and propane is likely to have an energy cost advantage relative to diesel fuel in many markets for the foreseeable future. If this does not occur, propane opportunities will become much more limited.

59
• Regulatory Focus on Other Technologies and Fuels: Currently the automobile industry and state and local regulators are focusing attention on a variety of other non-propane technologies, including electric vehicles, ethanol, and biofuels. The lack of regulatory recognition and promotion of propane vehicles is constraining propane’s attractiveness as an alternative fuel. Successful intervention in regulatory and policy decisions could substantially increase potential propane markets.
• Limited Number of Propane Fueled OEM Vehicles Available: Currently, there is a
very limited slate of new propane fueled vehicles available to the market.
Vehicle Conversion Technology Availability and Cost: In the past, most propane vehicles in the U.S. have been developed as gasoline vehicles and converted to propane use with relatively low cost propane conversion kits. However, changes in vehicle technology, vehicle emissions regulations and vehicle certification requirements have substantially reduced the availability and increased the costs of available conversion kits.
The availability of propane fueled OEM vehicles and reasonably priced vehicle conversion kits is likely to be critical if propane is expected to capture a significant share of the alternative fueled vehicle market. However, availability of propane vehicles from both sources is likely to remain limited without propane industry support. This support may need to include financial resources for research and development as well as emissions certification. Additional efforts should focus on reducing the emission regulatory burden for small low volume manufacturers and converters, in particular, streamlining the OBD regulations. LPG fuel specification consensus must be developed, current state and federal incentives extended, and additional state/federal incentives established. In addition, OEMs must be approached concerning the converted vehicle warranties.
4.3 Market for Propane Fired Standby Generators Sales of small standby generators (<50 kW) have been growing in recent years, with suppliers making advances in products and increasing marketing efforts targeted at a variety of customers and applications. While the market dipped from 2006 to 2007 and probably declined in 2008 as well due to the downturn in residential housing starts, the market for these units is expected to hold its ground and potentially increase over the next four years. Demand from the telecom industry and other commercial markets remains strong. The availability of user-friendly equipment, improved reliability, reasonable cost, and distribution from big box chains makes small standby units easily accessible to both the residential and small commercial markets. Major power outages, such as were experienced on the East Coast in recent summers, along with natural disasters and terrorist threats, raise anxiety and push people to buy generators. From September 2006 – September 2007, the U.S. DOE reported that more than 11 million people were affected by weather-related or rolling blackout power outages. The CDC relates that power outages result in risks such as illness from food-borne bacteria, risk of fire from candle use, and risk of heat stroke or hypothermia in extreme temperatures. Anxiety related to these issues is currently low – at the lowest level since prior to Katrina – but is still a key factor. Purchase of standby gen-sets tends to spike after an ‘anxiety-driven’ event and then drop off as people calm.

60
4.3.1 Overview of Current Market The figures below show sales of small standby units for 2006 and 2007. The market can be segmented into portable and stationary gen-sets. Stationary units are entirely natural gas and propane fueled below 5 kW; diesel units begin to be used in sizes larger than 5 kW, but natural gas and propane make up 85 percent of the stationary units between 5 and 18 kW, and 20 percent of the units between 18 and 50 kW. Portables (up to 50 kW) The consumer side of portable units has been almost entirely gasoline powered and is expected to remain so – the technology is well established, easy to use and transport, and fuel choice is familiar and readily available despite increased costs. Also, the shift to 3600 rpm gen-sets has resulted in lower cost, light weight units, with a modest increase in engine noise that has been partially offset by reduction in overall noise levels. Honda and Briggs & Stratton are the leaders in gasoline portables, both through rentals and retail outlets. In contrast, the commercial side for portables leans toward diesel – for safety, fuel stability, and compatibility with other equipment. The downside of diesel is increasingly strict regulatory standards. These gen-sets are 1800 rpm units and are frequently mounted on wheels.
Figure 31: Generator Sales by Size
0
100,000
200,000
300,000
400,000
500,000
600,000
700,000
800,000
2006 2007 2006 2007
Portable Stationary
Uni
ts
<5 kw
5 - 18 kW
18 - 50 kW

61
Figure 32: Generator Sales by Fuel
0
50,000
100,000
150,000
200,000
250,000
300,000
350,000
400,000
2006 2007 2006 2007 2006 2007
Diesel Gasoline Gas
Uni
ts
<5 kw
5 - 18 kW
18 - 50 kW
600,000
800,000
700,000
800,000
Stationary (up to 50 kW) Stationary sets have enjoyed success in the residential sector as standby power for new upscale homes. In this market, the $6,000-$9,000 price tag for a 20 kW generator sufficient to back-up an entire household is not viewed as an impediment to purchase. There has also been growing demand in residential retrofit markets, especially in areas where electric supply is irregular. Natural gas and propane are the fuels of choice in residential applications. Some local utilities have gotten into the market, providing standby units as a service for a small monthly addition to the utility bill. In commercial applications, electric power reliability concerns are inevitably raised when power is interrupted; demand for stationary gen-sets rises after such incidents and falls again as fears calm. Office parks, particularly those that serve data centers and information technology companies, find standby power to be an important amenity in attracting clients for occupancy. There has been a shift from diesel to natural gas as the fuel of choice in commercial applications, particularly where existing utilities make it relatively easy to connect with natural gas supply. As in the residential market, some local utilities make standby units available and assume responsibility for servicing and maintaining the unit for a monthly fee.

62
4.3.2 Market Outlook
Construction – both residential and commercial – is the big driver in the under 50 kW market. In the residential and commercial arenas, the rental market has grown as technological improvements have enabled gen-sets that can be rented without being damaged by the casual/inexperienced user. However, the decline in the housing industry hits the generator market two-fold: less construction equals less need for standby power and less home equity means fewer remodeling projects. Commercial construction is also slowing, although not as sharply as the residential market, with office park vacancies on the rise and businesses deciding to delay installing standby power systems.
U.S. Gen-Set Future Production Source: Power Systems Research
Anticipated Future
Production: < 5 kW
Percent Increase
Over 2007
Anticipated Future
Production: 5 - 18 kW
Percent Increase
Over 2007
Anticipated Future
Production: 18-50 kW
Percent Increase
Over 2007
2008 841,035 19% 2008
202,047 8% 2008 49,773 0.3%
2009 840,625 19% 2009
201,539 8% 2009 49,613 0.1%
2010 848,910 21% 2010
203,109 9% 2010 49,982 0.8%
2011 866,077 23% 2011
206,780 11% 2011 50,844 1.0%
Infrastructure maintenance is an area of potential growth for portable units, as the need to maintain bridges and highways continues. In fact, in a soft economy, government stimulus projects may drive this need. Fiber networks and telecom providers represent a strong market for stationary gen-sets, as competitiveness pushes providers to upgrade from battery back-ups to standby generators. Propane vs. Natural Gas-fired Generation Available data does not distinguish between propane and natural gas fired backup generation. In applications on the natural gas distribution system, most customers are expected to use natural gas-fired units, with applications off the natural gas distribution system using propane. Homes with propane service represent about 12 percent of all homes with gas (propane + natural gas) service. However, the natural gas distribution system tends to be available in more densely developed areas, which typically have better developed – and more reliable – electric distribution systems, and where more homes rely on municipal water and sewage systems rather than wells and septic systems. As a result, we expect that in the residential market, backup power generation units will be more desirable in the areas served by propane than in areas served by natural gas. As a result, we forecast that between 12 and 18 percent of the total residential market for gas backup generators are

63
likely to be propane generators. This suggests new propane standby generator sales will be between 11,500 and 17,500 units per year.
4.3.3 Future Propane Opportunities Emergency standby generators are seen as a necessity for certain applications, and diesel engines typically have been considered to be the only technology that meets the response requirements. As a result, regulators have made accommodations for the emissions within very limited operating constraints, though these do get more stringent as technology advances. Non-emergency standby generators or load response units are often subject to more stringent limits and operating constraints. While limits for emergency generators will get more stringent, they will always be able to run for true emergency use. However, emissions by off-road and stationary internal combustion engines are currently receiving significant scrutiny as potential sources of reduced emissions, and any new regulations are expected to make diesel fuel less attractive, providing a potential market opportunity for propane fired generators and other engine applications. Propane use in these markets will be impacted by the structure and timing of various clean energy and greenhouse gas initiatives under consideration at the national, regional and state levels. There has been some movement by electric utilities (typically combination electric and natural gas utilities) to provide gas-fired backup power generation as an optional part of their electrical service. These programs include both natural gas and propane options. These programs suggest that there are potential opportunities for cooperative ventures between propane providers and local power providers to provide this type of service in areas without access to the natural gas distribution system.
4.3.4 Key Issues for Propane Backup Generation There are significant opportunities for propane fired backup generation. However, the amount of propane consumed per unit is relatively low, and margins per gallon of propane sales may not support the servicing costs for many customers in this market under the traditional propane business structure. To be profitable to the propane industry, this equipment either needs to be an incremental application with existing propane customers, or the business model needs to cover the full incremental cost of servicing the customer, either through up-front cost recovery, or through leasing/servicing charges that cover costs plus reasonable profits.
4.4 Other Propane Engine Applications
There is a wide variety of propane engine applications and technologies that have the potential to add to propane sales, and a description of all of the potential applications is beyond the scope of this report. However, there are a couple of additional opportunities that are worth highlighting. Commercial propane lawn mowers represent a relatively new and emerging opportunity for propane, while propane irrigation pumps represent an older propane market that has been declining, but that could make a comeback with the new higher efficiency propane engines currently available.

64
4.4.1 Propane Lawn Mowers
Although very few propane lawn mowers are currently in the field, the mower market represents a potentially significant propane opportunity that has not yet been tapped. The technology is currently available, and several smaller manufacturers have been marketing propane equipment. Major manufacturers, including Husqvarna are bringing propane fired equipment to market. The propane equipment currently in the market or under development is significantly cleaner than competing gasoline-fired equipment; however, its first cost is still significantly higher than competitive equipment.
The propane mower market is effectively divided into the commercial lawn services market and the institutional/government market:
The commercial lawn services market is generally cost conscious, hence will purchase the propane vehicles if the overall costs are lower than other options, unless regulations prohibit traditional gasoline fueled equipment. A limited number of commercial lawn services with “green” marketing campaigns are likely to purchase propane-fired equipment for marketing purposes.
Some commercial property owners, particularly golf courses, are likely to find propane mowers to be an extremely attractive approach to addressing local environmental issues.
The Government/Institutional market (parks, universities, hospitals, etc.) are more likely to make equipment choices based on environmental issues. However, at least in the near term, the institutional/government market appears likely to be cash constrained.
Usage patterns for commercial mowers suggest that a potential target of 200 to 300 million gallons of propane per year for this market is possible if propane mowers can overcome first cost issues and achieve significant market penetration.
4.4.2 Propane Irrigation Pumps
The propane irrigation pump market has been declining for at least the last decade. According to U.S. Department of Agricultural surveys, the number of propane irrigation pumps declined from 23,964 in 1998 to 17,792 in 2003.24 This decline has resulted in a decline in estimated propane sales from about 42 million gallons in 1998 to 31 million gallons in 2003. During this period, propane was losing market share to both electric and diesel powered pumps.
Since 2003, we believe that the shift has continued, although with electric pumps displacing both propane and diesel pumps. This trend is being driven in part by energy efficiency grants by the U.S. Department of Agriculture. However, improvements in propane engine efficiency, and the change in the price relationship between propane and diesel fuel provides an opportunity for propane to retake a larger share of this
24 2002 Census of Agriculture Farm and Ranch Irrigation Survey (2003): Table 20. Energy Expenses for On-Farm Pumping of Irrigation Water fjd1: 2003 and 1998

65
market. We estimate propane consumption per pump for existing pumps averages around 1,750 gallons per year of primarily off-season load. Estimates of potential propane use in the new generation of larger propane pumps are as high as 6,000 to 8,000 gallons per year. The existing diesel and gasoline irrigation pump market provides a reasonable 200 million gallon target market for propane replacement pumps, with an additional 500 million gallons of potential load currently met with electric pumps. Propane should be highly competitive with the entire diesel and gasoline pump market, and will be competitive in limited areas in the electricity market.

66
Section V: Propane Demand Outlook
After peaking in 2003, total sales of odorized propane fell by more than 10 percent through 2006. Although propane demand increased somewhat in 2007 and 2008 due to colder weather, propane demand is expected to decline substantially in 2009. The collapse of the new housing market, together with declining use per customer from continually increasing energy efficiency, is expected to reduce residential propane sales. At the same time the economic recession, combined with price driven demand destruction, is projected to reduce demand in the commercial and industrial sectors. Looking forward, the outlook is more optimistic, with propane sales projected to growth – albeit slowly – through 2020. Slow growth in the mid-term (2010 – 2012) will result from an expected rebound in the economy, a turnaround in the national housing market, and growth in targeted market segments. Slow growth will continue in the longer term (2013 – 2020) as aggressive growth in certain markets more than offsets declines in other markets. The text box below provides a summary of ICF’s forecast methodology. More detail on ICF’s forecast is presented by economic sector in sections 5.1 through 5.7 below.
ICF Propane Demand Forecast Methodology and Economic Assumptions
ICF has developed a database and forecast model of propane consumption using a decomposition analysis of available propane consumption data, identifying and quantifying key factors responsible for changes in the propane market starting from both the top down (for example, national level propane production totals), and the bottom up (the number of propane powered forklifts, propane residential furnaces, etc.). Six end-use sectors of odorized propane consumption are analyzed: residential, commercial, agricultural, industrial, portable cylinder, and internal combustion engine. In addition, the residential and commercial-demand results are projected by month. Key factors driving year-to-year consumption include propane prices and local weather conditions, both of which are expected to have significant short-term impacts on demand. Other factors have longer-term impact, such as economic activity, population and demographics, competition with alternative fuel sources, appliance stocks, technology switching, and the influence of general efficiency trends. ICF’s propane demand forecast uses three price sets for the forecast analysis. For the historical time period from 1998 to April 2009, the model incorporates propane spot prices and delivery prices by end-use sector for propane and competitive fuels based on data published by the Energy Information Association. For the period May 2009 through July 2010 the base case forecast utilizes a price projection based on the New York Mercantile Exchange (NYMEX) futures strip prices from May 2009. The remainder of the forecast period from July 2010 through December 2012 is based on the light sweet crude oil NYMEX futures strip (May 2009, which tracked oil rising to $72 per barrel by December 2012). The price projection is not a forecast. Rather, it represents the market sentiment as represented through NYMEX futures strip.

67
The propane demand projections given in the forecast are quite sensitive to propane prices. Given the recent volatility of energy prices, these propane price projections create significant uncertainty in the forecast. More discussion on propane demand uncertainty due to price is found in section 5.1.2. Two sets of weather data are used in the model analysis, one for the historical time period and one for the forecast period. During the historical modeling timeframe from 1998 through April 2009 the model uses actual heating degree day weather data published by the National Oceanic and Atmospheric Administration. For the forecast period from May 2009 through the end of 2012, the model utilizes a seven-year average of 1998-2004 heating degree days data. As is the case with prices, short-term propane demand is quite sensitive on local weather variations. A discussion on propane demand in hot weather and cold weather environments can be found in section 5.1.3. The macroeconomic assumptions used in the model correspond to the second quarter 2009 economic forecast published by the Federal Reserve. Real GDP growth is 1.3 percent in 2008, followed by a decline in 2009 of -2.0 percent. We assume a return to modest growth of 2.2 percent in 2010, 2.5 percent in 2011, and 3.0 percent in 2012.
Figure 33: Base Case Propane Price Forecast
Mt. Belvieu Historical and Projected Spot Price Scenario (Cents/Gallon)
0
20
40
60
80
100
120
140
160
180
200
Jan-
05
Apr
-05
Jul-0
5
Oct
-05
Jan-
06
Apr
-06
Jul-0
6
Oct
-06
Jan-
07
Apr
-07
Jul-0
7
Oct
-07
Jan-
08
Apr
-08
Jul-0
8
Oct
-08
Jan-
09
Apr
-09
Jul-0
9
Oct
-09
Jan-
10
Apr
-10
Jul-1
0
Oct
-10
Jan-
11
Apr
-11
Jul-1
1
Oct
-11
Jan-
12
Apr
-12
Jul-1
2
Oct
-12
Projected PricesHistorical Prices NYMEX

68
5.1 Near Term (2009 – 2012) Odorized Propane Demand Outlook Propane demand in 2009 is expected to decrease by about 3 percent due to the long-term effects of higher prices, continued declines in use-per-customer, the collapse of the housing market, and the decline in economic activity. This drop in demand is moderated by the projected decline in end-use propane prices consistent with the decline in wholesale propane prices. The overall decline is also partially offset by growth in the internal combustion engine market as new vehicles are introduced to the market. There remains significant uncertainty in ICF’s outlook for the industrial and agricultural sectors, but major reductions in industrial output in 2009 are expected to result in a drop in industrial propane demand in 2009.
Figure 34: Odorized Propane Demand Forecast
-
2,000
4,000
6,000
8,000
10,000
12,000
1998 1999 2000 2001 2002 2003 2004 2005 2006 2007 2008 2009 2010 2011 2012
Mill
ion
Gal
lons
Residential CommercialResellers Industrial Agriculture Internal Combustion
Starting in 2010, ICF expects to see modest growth in demand in all sectors due to the anticipated rebound in general economic conditions and the improved health of the residential new construction market. We are forecasting slightly over 3 percent growth in total U.S. demand in 2010. However, the strength of the rebound will depend on the rate of the economic recovery. The propane forecast may be somewhat optimistic considering the volatility in energy prices and uncertainty in economic outlook. Changes upwards or downwards in propane price and economic output will significantly change the short-term outlook in demand.
5.1.1 Regional Demand Outlook ICF projects propane demand for each of the nine U.S. Census divisions. Figure 35 shows the near-term odorized propane demand forecast by region. We are projecting

69
total odorized propane demand to fall in every region during 2009, and show subsequent growth thereafter. The trends in each region are discussed in detail in Appendix A.
Figure 35: Total Odorized Demand by Region
0
2,000
4,000
6,000
8,000
10,000
12,000
1998 1999 2000 2001 2002 2003 2004 2005 2006 2007 2008 2009 2010 2011 2012
Mill
ion
Gal
lons
New England Middle Atlantic East North CentralWest North Central South Atlantic East South CentralWest South Central Mountain Pacific
5.1.2 Impact of Prices on Propane Demand Higher propane prices have had a major impact on propane demand, and are likely to have a lasting impact going into the future. Figure 36 illustrates the impact of different prices and economic output levels on projected propane demand. As indicated in this chart, propane demand will increase steadily over the forecast period if energy prices remain at a low level and economic output is stagnant ($40/barrel oil through 2012 and GDP -3.0 percent in 2009 followed by economic growth at 1.5 percent per year). If the economic recovery is robust, and energy prices return to relatively high levels (this assumes $100 per barrel through 2012, with GDP growth at 1.0 percent in 2009 and 3.0 percent per year thereafter), demand would be expected to remain flat through the end of the forecast. The difference in propane demand between the low price / low GDP scenario and the high price / high GDP scenario is about 7 percent in 2012. The Base Case forecast of demand is 3.8 percent below the low energy price scenario, and 3.0 percent above the high price scenario.
5.1.3 Impact of Weather Uncertainty on Propane Demand In the short term, weather creates more uncertainty in propane demand than price. The Base Case forecast is based on average weather over the seven year period from 1998 through 2004. This was a very warm period, and may represent a warmer “normal” weather period than many companies use for planning purposes. Figure 37 illustrates

70
Figure 36: Impact of Price and GDP on Propane Demand Forecast
4,000
5,000
6,000
7,000
8,000
9,000
10,000
11,000
12,000
13,000
2005 2006 2007 2008 2009 2010 2011 2012
Mill
ion
Gal
lons
Low Price/GDPBase CaseHigh Price/GDP
Figure 37: Impact of Weather on Propane Demand Forecast
6,000
6,500
7,000
7,500
8,000
8,500
9,000
9,500
10,000
10,500
11,000
1998
1999
2000
2001
2002
2003
2004
2005
2006
2007
2008
2009
2010
2011
2012
Mill
ion
Gal
lons
Cold Weather
Base Case
Warm Weather

71
the range in demand uncertainty relative to the Base Case due to potential differences in weather. In any given year, colder than normal weather can be expected to increase propane demand by as much as 2 percent relative to the Base Case, while warmer than normal weather can reduce demand as much as 3 percent relative to the Base Case.
5.2 Long Term Market Outlook We are projecting economic growth of 2.75 percent per year after 2012, based on long-term forecasts released by the Philadelphia Federal Reserve. This level of growth, combined with the availability of new propane applications and technology, and the promotion of propane as a green fuel should be sufficient to generate the slow but steady long term growth in demand shown in Figure 38. Aggressive growth in certain markets is expected to roughly offset declining use per customer and declining customer bases in other markets.
Figure 38: Long-Term Odorized Propane Consumption
-
2,000
4,000
6,000
8,000
10,000
12,000
2000
2001
2002
2003
2004
2005
2006
2007
2008
2009
2010
2011
2012
2013
2014
2015
2016
2017
2018
2019
2020
Mill
ion
Gal
lons
Residential CommercialResellers Industrial Agriculture Internal Combustion
However, as in all long term forecasts, there is significant uncertainty associated with this outlook.
If oil prices remain higher than anticipated (above $100 per barrel), we expect energy conservation to result in extended declines in use per customer. High oil prices are also likely to erode residential and commercial propane market share as electricity continues to displace some propane uses. However, high oil prices are also likely to stimulate growth in propane demand for on-road vehicles and

72
other internal combustion engine applications where propane competes with gasoline and diesel fuel, leading to a flat overall long term outlook for propane.
Propane currently provides an attractive option to diesel fuel in many markets
due to cleaner burning technology and lower fuel costs, but first cost issues and vehicle availability issues continue to constrain growth in these markets. Environmental policy shifts favoring propane could result in major growth in propane vehicles and other internal combustion applications.
Environmental and energy security policies implemented in the next few years
could make propane substantially more competitive in certain markets, but may also stimulate aggressive competition, primarily from electric power providers. This competition could substantially erode key propane markets.
5.2.1 Long Term Energy Price Trends There is a great deal of uncertainty over future crude oil prices. Between 2012 and 2020, we expect the fundamentals of oil supply and demand to result in an average oil price of around $85 to $95 per barrel. However, this price projection is subject to significant uncertainty in exchange rates, domestic and international politics, and economic growth. Hence we expect to see significant volatility around this long term average. As discussed earlier, The U.S. Department of Energy’s Energy Information Administration (EIA) is projecting long term electricity prices to increase at about the rate of inflation from 2012 through 2015. After 2016, climate change policy is likely to result in an increase in electricity prices as regulations impose limits on carbon emissions. Between 2012 and 2020 the anticipated emissions limits are likely to be met with increased use of natural gas powered generation, as well as renewable resources such as solar and wind. These sources of electricity will result in higher electricity prices during the forecast period, but major increases in electricity prices associated with requirements for carbon sequestration and aggressive growth in nuclear and renewable power are unlikely to reach the market until after 2020. Before 2020, the electricity price forecast is heavily influenced by the natural gas price outlook. Since natural gas prices tend to move in conjunction with oil prices, and propane prices are influenced by both oil and natural gas prices, any unanticipated increases in electricity prices are likely to be reflected in an increase in propane prices.
5.3 Residential Sector Outlook In the near term, the potential for overall growth in propane demand in the residential market is very limited. ICF is projecting a decline in residential demand from 2008 to 2009 of about 4 percent due to a combination of price induced conservation, general energy efficiency trends, and slightly warmer weather. The decline is amplified by the continued effects of the downturn in the new residential construction market. Between 2010 and 2012, ICF projects a modest rebound in residential consumption. This projection is based on the assumptions that 1) propane prices return to a $72 dollar a barrel of oil equivalent level by the end of the forecast period (based on the NYMEX futures strip on May 5, 2009) and 2) the housing market experiences a rebound, pushing

73
the number of propane housing completions upwards again. This second assumption is based in part on an aggregation of quarterly housing start projections provided by major housing and builder associations and the Federal Reserve (see the following section for more discussion). Between 2012 and 2020, we expect a continuation of the housing market rebound. However, we do not expect housing starts to return to peak 2005/2006 levels during this period. In our short term forecast, we are projecting housing starts to rebound from fewer than 600,000 starts per year in 2009 to 1.1 million housing starts per year by 2012. We expect this to grow to about 1.5 million housing starts per year by 2020. Propane remains a competitive and viable alternative to electricity based applications, and ICF expects continued growth in the residential water heating and cooking sectors. Propane heating is expected to face stiff competition from electricity in the warmer regions of the country, leading to market declines in some regions. The exception is in the Northeast, where we expect propane’s market share of residential space heating to continue to grow as fuel oil loses market share in both new and existing homes.
Figure 39: Residential Propane Market Forecast
0
1,000
2,000
3,000
4,000
5,000
6,000
1998 1999 2000 2001 2002 2003 2004 2005 2006 2007 2008 2009 2010 2011 2012
Mill
ion
Gal
lons
Primary Space Heating Supplementary Space HeatingWater Heating Cooking/Other ApplicationsManufactured Housing Seasonal Housing
5.3.1 Long Term Residential Market Outlook In the longer-term, the residential market is expected to range from flat to slow growth, depending on propane prices. Propane will continue to maintain a significant share of the new construction market, particularly in upscale homes. However, propane sales to the existing customer base are expected to decline due to retirements of propane heated

74
mobile homes, declines in use per customer due to improvements in efficiency, and displacement of propane heating by new generation electric heat pumps. One of the key threats to the long-term residential propane market will be promotion of efficient heat pumps, including geothermal heat pumps, by electric utilities in response to climate change and domestic energy security concerns and legislation. Electric utilities in many parts of the country are likely to use this shift in national policy to aggressively promote and fund fuel conversion campaigns. Propane will have an opportunity to grow market share in some regions by converting fuel oil homes to propane. In the long term, propane is expected to have a price advantage relative to fuel oil, and this could increase substantially depending on fuel quality regulations discussed earlier. This market is highly concentrated in the Northeastern U.S., where the New England states, New York, New Jersey, and Pennsylvania account for about 80 percent of total residential fuel oil consumption.
5.4 Commercial Sector Outlook The commercial sector accounts for roughly 19 percent of the overall odorized propane market. Commercial data sources indicate rapid growth in commercial propane consumption from 1998 to 2003, followed by stable or declining demand volumes since that time.25 ICF is projecting a growth in commercial floor space heated by propane, but at a rate lower than during the 1998 to 2003 period. However, increases in propane demand from future commercial customer growth is likely to be offset by price induced conservation and fuel switching from propane to electricity by existing customers.
The near-term forecast for propane demand shows declines in the commercial sector in 2009 due to higher propane prices and the economic slowdown, followed by growth linked to a rebounding economy in 2010 through 2012. For the total U.S., ICF is projecting demand to increase by roughly 2 percent per year over the forecast 2010 to 2012 period.
The commercial sector is a very diverse market, with a much wider range of customer types and end-uses than other sectors. The market also differs widely by region in a manner similar to the residential sector. Understanding the regional differences in fuel use and the variety of commercial propane market segments—for example, schools, fast food restaurants, and houses of worship—can lead to new opportunities.
One of the key application- and region-specific opportunities in the commercial sector will be conversion of fuel oil customers in the Northeast. Fuel oil currently dominates the region’s commercial heating market. However, many potential propane heating customers already use propane for cooking and other purposes, presenting the propane industry with near-term conversion opportunities among existing propane customers. In addition, the market share for fuel oil in new commercial construction has already declined substantially because of permitting issues with fuel oil storage tanks, leading to additional market opportunities for propane.
25 The 2003 Commercial Building Energy Consumption Survey (CBECS) released by EIA represents the most recent detailed data available on commercial sector energy consumption. The 2007 CBECS is currently underway.

75
Figure 40: Commercial Sector Propane Consumption by Region
0
500
1,000
1,500
2,000
2,500
1998 1999 2000 2001 2002 2003 2004 2005 2006 2007 2008 2009 2010 2011 2012
Mill
ion
Gal
lons
New England Middle Atlantic East North CentralWest North Central South Atlantic East South CentralWest South Central Mountain Pacific
Figure 41: Propane Market Share of Commercial Floor Space Heating
0%
5%
10%
15%
20%
25%
30%
35%
2003 2004 2005 2006 2007 2008 2009 2010 2011 2012
Perc
enta
ge o
f Tot
al F
loor
spac
e
New England Middle Atlantic East North CentralWest North Central South Atlantic East South CentralWest South Central Mountain Pacific

76
5.4.2 Long Term Commercial Market Outlook In the longer term, the commercial sector is likely to see stable or slowly declining propane demand. Economic growth will drive growth in energy service demand in this sector, however relatively higher fuel prices will promote increased energy efficiency as well as a loss of market share to electricity. Changes in both propane and electric heating technologies are changing the competitive landscape in the commercial space heating market. Currently, most electric space heat in the commercial sector is provided by electric resistance furnaces, making propane an economic alternative to electricity. However, Improvements in high efficiency commercial-grade electric heat pumps threaten this market. The threats to propane due to lower operating costs for electric systems are compounded by the simultaneous rise in propane fuel prices. There exists potential for propane growth in this sector, though. Propane-fired engine-driven heat pumps perform better in colder climates, where electric heat pumps lose their high efficiency. Targeting areas with colder climate or unreliable electricity supplies presents the commercial propane market the greatest area to expand. Commercial propane water heaters show some competitive advantages as well. The low capacity of an electric water heater can often outweigh the initial cost concerns of a more expensive propane water heater when operating costs are similar.
5.5 Internal Combustion Sector Outlook The internal combustion engine market offers long-term potential for large growth in propane sales. In the short term, a steep decline in propane use in the forklift market — caused by the recession — could be partially offset by modest growth in demand for on-road vehicles, commercial mowers, and stationary engines. The combination of lower propane prices and economic recovery should lead to modest demand growth of about two percent per year in 2010 through 2012. After 2012, growth in new applications has the potential to significantly expand propane sales.
5.5.1 On-Road Internal Combustion Engines Propane provides a viable alternative to gasoline and diesel fuel in the on-road vehicle market. The refueling infrastructure for on-road propane vehicles is well developed and LPG has significant environmental advantages relative to both gasoline and diesel fuel. In addition, propane remains a favorable fuel due to state and federal policies for alternative fuel vehicles, which provide tax credits for purchasers of propane vehicles. However, propane sales in this sector have been declining for several years, as existing propane vehicles have been retired, and only a limited number of new vehicles have been available to the market.
The recent introduction of a new generation of propane-powered vehicles is expected to contribute to a near-term increase in propane sales. In addition, the expected change in the long-term relationship between propane and distillate fuel prices will position propane as a potential lower cost alternative to diesel. However, the propane industry will need to overcome significant market hurdles to maximize sales in this sector. While a number of advances have been made in the last few years, near- and long-term

77
market growth are constrained by the current regulatory, policy, and promotional focus on engine fuels other than propane and the limited number of new propane vehicles and vehicle conversion kits available to the market.
Figure 42: Internal Combustion Sector Propane Demand Forecast
0
100
200
300
400
500
600
700
800
900
1998
1999
2000
2001
2002
2003
2004
2005
2006
2007
2008
2009
2010
2011
2012
Milli
on G
allo
ns
Forklift On-Road Vehicles Non-Road Vehicles
To accelerate penetration of propane into the on-road vehicle market, the industry needs to help increase the number of vehicles available and to encourage extension of tax credits on equipment capital and fuel costs currently scheduled to expire by 2011. Additional efforts should focus on reducing the regulatory burden for small, low-volume manufacturers and converters, strengthening warranties on converted vehicles, and ensuring recognition of propane’s environmental benefits in the national environmental policy debate.

78
Figure 43: Propane On-Road Vehicles Market
-
10,000
20,000
30,000
40,000
50,000
60,000
70,000
80,000
90,000
100,000
2003 2004 2005 2006 2007 2008 2009 2010 2011 2012
Tota
l Veh
icle
s
0
2,000
4,000
6,000
8,000
10,000
12,000
14,000
New
Veh
icle
s pe
r Yea
r
Total Vehicle StockNew Vehicles
Figure 44: On-Road Internal Combustion Engine Propane Consumption
0
20
40
60
80
100
120
140
160
180
200
1998 1999 2000 2001 2002 2003 2004 2005 2006 2007 2008 2009 2010 2011 2012
Milli
on G
allo
ns

79
Figure 45: Propane On-Road Vehicles Forecast
-
2,000
4,000
6,000
8,000
10,000
12,000
14,000
2003 2004 2005 2006 2007 2008 2009 2010 2011 2012
Num
ber o
f Veh
icle
s by
Typ
e
HDV's (Bluebird Buses and others)LDV's (Roush F150 and others)Secondary Market Conversions
5.5.2 Propane Forklifts ICF anticipates growth in forklift propane demand to increase at roughly the rate of GDP, following a trend since 2002 of rapid growth in the overall forklift market. However, forklift demand and usage are sensitive to economic conditions. The current economic slowdown is expected to reduce overall forklift sales in 2008 and 2009, and also reduce utilization of existing forklifts, resulting in a temporary decline in propane demand in this sector. The propane market share of forklifts is expected to increase slightly during the forecast period. When combined with the expanding overall forklift market, ICF projects a steady rise in propane forklift sales and expanding propane consumption starting in 2010.
5.5.3 Non-Road Engines The non-road engine market provides large growth opportunities for the propane industry, although cost and regulatory issues must be resolved to reach this market’s full potential. The non-road internal combustion sector includes non-heating propane technologies used in the commercial, construction, mining, industrial, and recreational sectors. Types of propane-powered equipment covered in this sector include bore and drill rigs, rubber tire loaders, industrial terminal tractors and aerial lifts, commercial lawnmowers, chippers and stump grinders, and generator sets. Forecasts for the non-road fleet are derived using population estimates from the EPA NONROAD model.

80
Figure 46: Propane Forklift Forecast
-
10,000
20,000
30,000
40,000
50,000
60,000
70,000
1998
1999
2000
2001
2002
2003
2004
2005
2006
2007
2008
2009
2010
2011
2012
Ann
ual L
PG
For
klift
Sal
es
380,000
400,000
420,000
440,000
460,000
480,000
500,000
LPG
For
klift
Fle
et P
opul
atio
n
Annual Forklift SalesTotal Forklift Population
Cost disparities between diesel and propane fuels present the propane industry with opportunities to capture share of the existing diesel technology market. Propane also offers environmental and emissions benefits relative to diesel fuel. The competitive environmental benefits of propane technology diminish as new ultra-low sulfur diesel (ULSD) is mandated into production. By June 2010, the ULSD fuel standard of 15 ppm sulfur will apply to non-road diesel fuel production. However, meeting these standards is expected to increase the first cost of the diesel technologies, making propane more competitive on cost.
ICF expects propane consumption by non-road internal combustion engines to continue increasing through the forecast period. Overall, this sector is assumed to grow at a rate slightly faster than that of GDP, offset in part by higher fuel prices. ICF estimates the 2008 consumption of propane in this sector to be about 232 million gallons, and will increase by about 2 percent per year through 2012.
5.5.4 Long Term Internal Combustion Engine Market Outlook In the long term, we expect the major propane growth market to be in internal combustion engines. The combination of lower operating costs and environmental advantages of propane relative to other petroleum fuels should ensure steady growth opportunities in these markets. Overall, we expect propane consumed in internal combustion engines to increase from roughly 8 percent of the odorized propane market in 2007 to almost 14 percent of the market by 2020. The key internal combustion engine market segments are summarized below:

81
Figure 47: Non-Road Internal Combustion Engine Forecast
0
50
100
150
200
250
300
1998
1999
2000
2001
2002
2003
2004
2005
2006
2007
2008
2009
2010
2011
2012
Mill
ion
Gal
lons
On-Road Vehicle Markets In the longer term, the propane industry can expect significant growth in propane demand in the on-road vehicle sector. We expect propane to maintain a significant operating cost advantage relative to both gasoline and fuel oil. We are projecting steady growth in propane demand in this sector, with demand growth of 10 to 15 percent per year between 2012 and 2020. However, this is coming from a fairly small base, and total propane demand is expected to reach only about 5 percent of the total odorized propane market by 2020. Growth in this market is likely to be limited by the availability of propane vehicle models and propane conversion kits. This is a market where availability of additional propane vehicles at competitive costs could result in substantially greater demand growth. Key competitive threats include efforts by other industries to promote other alternative fueled vehicle sources, principally compressed natural gas and electric vehicles. The natural gas and electric power industries have significantly more financial and regulatory muscle than the propane industry, and are aggressively promoting vehicles using these fuels in both the consumer market and regulatory/policy arenas. Forklift Market Propane forklifts currently have a dominant position in the midsized forklift market. We expect propane to maintain this market share. As a result, we anticipate propane demand in this market sector to continue to increase with the overall forklift market in response to general economic growth.

82
The primary competition in this market is likely to come from electric and electric hybrid forklifts. However, significant breakthroughs in battery technology are likely to be necessary for these options to become more competitive. Propane-Powered Commercial Lawn Mowers The commercial propane mower market has the potential to generate significant growth in propane demand, possibly rivaling propane forklifts as the largest market for propane engines. The total commercial mower market includes sales of more the 230,000 units per year. A typical commercial mower would consume around 750 – 900 gallons of propane per year. As a result, a five percent market share in this market would increase propane sales by about 10 million gallons per year. Propane mowers burn cleaner and result in fewer emissions over competing gasoline-fired equipment, but propane mowers currently on the market cost considerably more to buy than competitive equipment, and their operating cost advantage is uncertain. Agricultural Propane Engines Agricultural applications for propane engines26 include irrigation and pumping engines, backup generators, and farm vehicles. These applications, particularly the irrigation pumps, represent high-volume, high load factor propane load. This market includes potentially significant opportunities for propane due to current and expected future price differentials between propane and diesel fuel, improvements in propane engine technologies, and environmental regulations that favor propane over diesel fuel. However, there are also substantial threats to existing propane applications in these markets. The propane irrigation pump market (both absolute numbers and market share) declined substantially between 1998 and 2003, primarily due to replacements with electric pumps and diesel pumps. The current trend appears to be replacement of both diesel and propane pumps with electric pumps. This trend is being driven in part by Department of Agriculture energy efficiency grants for electric pumps. However, the new generation of more efficient propane pumps is proving competitive, and could represent a significant propane growth market if effectively promoted.
5.6 Reseller / Cylinder Sector Outlook ICF is projecting the overall propane cylinder refill market to increase steadily after a slowdown in 2008 and 2009. From 2010 onwards, propane demand is projected to increase at a rate of about two percent per year. The largest market in this category is propane cylinders used in portable grills. Using data from the Hearth, Patio, and Barbeque Association that shows an increasing rate of gas grill shipments, ICF projects a continued increase in 20-lb cylinder demand for barbeques, rising at about 2 percent per year over the forecast period. Mosquito control is another market that continues to show rapid growth, and ICF expects further
26 Forecasts of propane used by internal combustion engines in the agricultural sector are included in the forecast of internal combustion engine propane demand, rather than agricultural propane demand.

83
penetration of propane powered mosquito control units into the pest control market, indicating a rise in 20-lb cylinder sales for this application as well.
Figure 48: Propane Demand in the Cylinder Refill Market
0
100
200
300
400
500
600
700
800
1998 1999 2000 2001 2002 2003 2004 2005 2006 2007 2008 2009 2010 2011 2012
Milli
on G
allo
ns
BBQ RV Cylinder Market Mosquito Control Propane Usage Other Propane End-Uses
5.7 Industrial and Agricultural Sector Outlook The U.S. industrial sector includes manufacturing, agriculture, mining, and construction establishments. Odorized propane27 is used for welding, as fuel for furnaces, boilers, direct heating, and as a farm energy source for crop drying, irrigation pumps, and other heating processes.28 The industrial sector has seen a steady decline in odorized propane demand since 2003. In 2009, declines in industrial demand are expected due to the economic slowdown and a drop in industrial production. From 2010 to 2012, we expect a small return to growth in the industrial sector, with demand modestly rising at less than 1 percent per year. The agricultural sector is highly unpredictable due to its sensitivity to both price and weather factors. Propane demand in this sector is extremely sensitive to price and is likely to suffer from price induced conservation and fuel switching going forward in a high
27 Propane is also used as a raw chemical feedstock. These gallons are non-odorized and therefore outside the scope of PERC. 28 Many industrial and agricultural energy analyses include fuel use for off-road vehicles and other internal combustion engine use. Only the non-internal combustion propane use is included in this section’s estimates. Forklifts and other off-road internal combustion engines are accounted for in the internal combustion engine sector.

84
price environment. As propane prices have increased, farmers looking for ways to reduce costs have been replacing existing propane grain dryers with more efficient versions, or switching to biofuel grain dryers.
Figure 49: Agricultural and Industrial Propane Demand Forecast
0
500
1,000
1,500
2,000
2,500
1998
1999
2000
2001
2002
2003
2004
2005
2006
2007
2008
2009
2010
2011
2012
Mill
lion
Gal
lons
Industrial
Agricultural
However, grain prices have also been near all time highs, resulting in significant growth in agricultural acreage planted in grains. Propane is used extensively for grain drying, and overall demand for grain drying is expected to increase with the increase in acreage. If grain prices remain relatively high, we expect to see continued growth in demand for propane in this market.
Overall, ICF is projecting slow growth in propane demand in the agricultural sector, well below the rate of increase of forecasted agricultural output.
5.7.1 Long Term Industrial and Agricultural Market Outlook We expect long term propane demand in the industrial and agricultural markets to be relatively flat or declining slowly. These markets remain very price sensitive, and higher propane prices are likely to stimulate enough improvements in efficiency and loss of market share to offset economic growth. While we do see opportunities for new technologies in these markets, development of these technologies will be necessary to offset the loss of existing propane load.

85
Section VI: Key Propane Industry Challenges
Throughout this Propane Market Outlook, we have focused on identifying key competitive threats and opportunities likely to be faced by the propane industry in the next few years. Successfully minimizing the threats to the industry, while taking advantage of the opportunities available, is likely to require concerted and coordinated industry action. The key industry market challenges, as we see them, are summarized below:
6.1 Understanding and Taking Advantage of Regional Market Segmentation
The propane market is becoming increasingly regional, with each region facing unique challenges and opportunities. Even within specific geographic regions, differences in weather patterns, customer lifestyles, electricity prices, and the level of competition from other technologies and other fuel providers vary widely by location. As a result, the market threats and opportunities facing the propane industry differ by region and location. Many of the regional differences are focused in the residential and commercial sectors, although differences in state regulations and electricity prices also affect propane demand in other sectors. Regional markets bring regional opportunities. These include specific technologies applicable to a particular region or state, as well as broader market segments that can be targeted in a given area. Some examples include:
Fuel Oil Conversions: Currently, 80 percent of the total number of U.S. homes heated by fuel oil are located in the Northeastern U.S. This region includes the New England states, New York, New Jersey, and Pennsylvania, totaling almost seven million homes heated with fuel oil. Given the expected future fuel price differential between fuel oil and propane, and the high cost of electricity, combined with a high heating load in this region, there is a very large opportunity to convert these customers to propane.
However, the conversion market outside of the Northeast is likely to be very limited. Not only is the size of the potential market much smaller, but the electricity option is likely to be more competitive relative to propane due to lower electricity prices and smaller heating loads.
Desiccant Dehumidification: The new desiccant dehumidification equipment is likely to be commercially viable only in the warm temperatures and high humidity of the Southeast region.
Irrigation Pumps: The new generation of more efficient propane irrigation pumps
is likely to be very competitive with diesel irrigation pumps in the agricultural sector. This market is focused primarily in the Midwest and Western regions.

86
Outdoor Living: While investment in outdoor living space is a national trend, the major markets are focused in the warmer regions of the country where the outdoor living space can be used effectively for a greater portion of the year.
In addition, differences in state environmental regulations and energy policies create different opportunities in different states:
Environmental regulations in California and other non-attainment areas provide opportunities for clean burning propane equipment.
State government policy differences, such as the Texas market for propane school buses, can also provide significant opportunities.
The market threats facing the propane industry also differ by region:
Electric heat pumps are more efficient in regions where winter temperatures typically do not fall below freezing on a regular basis. Air conditioning tends to be important in these regions as well, resulting in additional advantages to heat pumps in the warmer, southern regions of the country.
Electricity prices differ widely by region and location. Local electricity prices are a critical element that needs to be considered when promoting propane use.
The availability of natural gas and the willingness of natural gas utilities to expand the gas distribution system vary by region and location.
As a result, a one-size-fits-all national approach to propane marketing will not be as effective as an approach that can be tailored to the specific conditions in different regions and locations.
6.2 Maintaining Current Markets The biggest challenge facing the propane industry in the next ten years may be maintaining current market share in the residential and commercial sectors, which combined account for about 70 percent of total odorized propane demand. There are a variety of growth opportunities in these sectors, including increasing market share for existing applications, successful commercialization of new technologies such as residential tankless water heaters and dehumidifiers, as well as propane-fired commercial heat pumps. However, the threats to these markets remain formidable:
The manufactured housing sector is in serious decline. The propane sales to this sector of the market can be expected to continue falling.
Propane use per customer has fallen substantially and is expected to continue to decline due to improvements in efficiency and the impacts of higher propane prices.
Electric heat pump technology is becoming more efficient and economical. This technology is likely to continue to erode propane heating market share in many regions.
Propane prices have increased substantially relative to electricity in most regions, and this price relationship is projected to continue.

87
Given relatively high propane prices compared to electricity prices and the expected improvements in electric heating technology, maintaining existing propane customers will become even more difficult over time. However, failure to effectively focus on maintaining these markets could lead to a very rapid loss of market share and propane sales in both the residential and commercial sectors. Recent data from the U.S. Census Department suggests that loss of existing market share can occur very quickly. The 2007 American Housing Survey (AHS) data indicates that propane heated homes in the South region declined by 13 percent between 2001 and 2007, and total existing U.S. homes heated with fuel oil declined by 11 percent between 2001 and 2007. According to the AHS data, the total number of existing propane heating customers declined even though the propane market share in new residential construction was increasing over the same period. (See section 4.1 for additional discussion on this issue.) Preserving this customer base will require an aggressive and coordinated effort by the propane industry. The major propane applications in these sectors have significant non-cost advantages to competing fuels and technologies that add value for the customers. The propane industry needs to emphasize this value proposition to capture high opportunity markets in order to offset the inevitable losses in markets that are driven entirely by cost rather than value.
6.3 Taking Advantage of Propane vs. Distillate Price Disparity
Over the next ten years, propane is expected to have a significant economic fuel price advantage in many applications where propane technologies compete with distillate fuel oil technologies. These markets include the home heating market in New England and the Mid-Atlantic, as well as the full range of on and off-road diesel engine markets. The propane price advantage relative to diesel fuel and distillate fuel oil has decreased somewhat due to the economic downturn. However, ICF expects this cost advantage to return when the economy starts to rebound, and in the longer term, this cost advantage is expected to increase. (See Section 2 for a detailed discussion of this energy market.)
There are two major challenges to taking advantage of this market opportunity. First, it is not clear that the operating cost advantage is widely recognized by market participants. Unless the propane industry can make a compelling case for long term consumer savings, residential customers currently heating with fuel oil are unlikely to invest in new, more efficient propane furnaces. Making this case will also require facilitating the conversion, potentially with up-front financing arrangements, as well as other steps to simplify the conversion process.
In the internal combustion engine market, consumers may not be familiar with the new, more efficient generation of propane engines in off-road applications, and may have had only limited exposure to propane on-road vehicles. Changing this situation will require a major promotional and educational campaign.
Second, the number of propane applications, particularly for the on- and off-road vehicle markets, is very limited. However, the cost of developing and introducing new propane vehicles is very large. The necessary capital for new vehicle development is unlikely to come from the motor vehicle industry until the manufacturers believe that the market will support a high volume of new vehicle sales. As a result, bringing many of the new

88
propane vehicle technologies to market is likely to require financial support from the propane industry.
Sales of propane fueled on-road vehicles are also expected to be relatively limited until the incremental purchase costs (including consideration of tax credits) is roughly on par with the cost of a gasoline or diesel powered vehicle. However, the cost differential between propane and gasoline or diesel-powered vehicles can be expected to decline only if the number of vehicles sold reaches sufficient levels to generate economies of scale. Consequently, this market may require significant long-term financial support by the propane industry before it can become self-sustaining.
6.4 Taking Advantage of “Green” Opportunities
The increasingly important term green reflects a growing cultural, philosophical, and economic movement that exists amidst increased public awareness and concern for environmental issues. Issues like climate change, rising commodity and energy prices, water safety, and human health have created new emphases on sustainable principles and best practices. Changes in habits and beliefs of individuals, combined with grassroots pressure on businesses from environmental groups, have pushed and persuaded an increasing number of corporations to become greener and adopt sustainability principles and practices.
To be green, in this sense, reflects an industry’s willingness to engage on environmental issues and public health. Being green encompasses a number of activities and principles, including green building design, implementing energy efficient business practices, emphasizing the importance of human health and well-being, and participating in the mitigation of climate change (reducing one’s carbon footprint, for example).
Green principles are not only reflected in marketing strategies, product design, and public relations approaches, but have also resulted in improved safety and productivity in the workplace, cut costs in energy and materials, and added to a general sense of employee well-being in many industries. Because of this, the changes towards a market that places value on green principles should not be seen as a threat, but rather as an opportunity. The propane industry, both as individual businesses and as a collective industry group, will need to be mindful of green attitudes and concerns, and must adapt to a changing public perception of issues like climate change, energy consumption and efficiency.
There is a significant opportunity for the propane industry to market propane as a green fuel. Propane, like natural gas, has a lower carbon content than petroleum based products like fuel oils, kerosene, and gasoline. Propane also has much lower emissions of sulfurs and particulates. These qualities help propane compete in the agricultural, forklift, and non-road engine markets. And in contrast to methane (natural gas), propane is not a climate change precursor, meaning that propane may have significant advantages over natural gas in some applications.
The ability to market propane as an environmentally friendly fuel is expected to provide significant advantages in the alternative fuel vehicle sector. These attributes are also becoming increasingly important advantages for off-grid electricity generation. Selling

89
points of reduced sulfur, nitrogen oxide, and carbon emissions can be bolstered by efficient use in co-generation of heat and electricity. (For example, solid oxide fuel cells are a new but important technology that can use propane in a green, efficient manner, generating both heat and electricity simultaneously.)
The green qualities of propane can serve as a wedge into new and changing markets. It is important that propane be recognized for its green qualities so that new policies formed and regulations established will be shaped to reflect the environmental benefits of propane.
6.5 Participating in the National Energy and Environmental Policy and Regulatory Process
Propane is a cleaner-burning, lower-carbon fossil fuel than other petroleum-based products such as fuel oils, kerosene, and gasoline. In contrast to natural gas, propane has a near-zero direct global warming potential, making it a preferred fuel over natural gas in many applications. PERC and its members are developing technologies and products that build on propane’s emissions and supply benefits in applications such as distributed generation, agriculture, and transportation. However many of the potential market opportunities for propane are driven or impacted by specific regulatory and policy initiatives. For example:
Propane use in distributed generation and certain agriculture applications faces numerous institutional and regulatory issues, such as electric grid interconnection requirements and evolving stationary source emissions standards, clean energy initiatives, and greenhouse gas initiatives.
Propane use in transportation applications, such as fleet vehicles and forklifts, faces similar issues including mobile emissions standards, potential low carbon fuel standards, and certification requirements. Propane use in all these areas will be impacted by the structure and timing of various clean energy and greenhouse gas initiatives under consideration at the national, regional and state levels.
Currently, the benefits of propane are not widely acknowledged by decision makers or considered in the current national energy and environmental policy debate. The challenge this creates for the industry is that federal and state energy and environmental policy decisions, along with the resulting regulations on energy use, are going to play a significant role in either promoting or inhibiting use of propane in a variety of markets. If the benefits of propane are recognized and considered in energy and environmental policy discussions, propane is likely to benefit from the ongoing energy policy debates. However, if these benefits are not communicated properly and recognized, propane is likely to be regulated in the same manner as gasoline and distillate fuel oil, which could considerably constrain propane opportunities in some geographic regions and some applications. As a result, the propane industry – through the appropriate national and state trade associations and companies – needs to be actively involved in the federal and state energy and environmental policy and regulatory process. The industry’s companies and appropriate trade associations must engage policy makers in regulatory discussions of specific priority market development targets, such as alternative transportation fuels and

90
distributed generation, to ensure that propane is adequately considered when new energy policies are drafted. This makes it essential for the propane industry to understand the relevant issues and policy options, know the critical stakeholders and their positions, and be seen as an important stakeholder and resource by the organizations and agencies drafting new policies and regulations. The following point must be conveyed to and considered by policymakers and stakeholders of upcoming policies and regulations:
Propane is a reliable domestic source of energy that offers a number of advantages over many other fuels, including low emissions, ease of use, and a reputation for reliability and safety. As a result, propane needs to be recognized as a beneficial and environmentally friendly fuel when developing new energy and environmental policies and regulations.

Propane Education & Research Council1140 Connecticut Avenue, NW Suite 1075Telephone: (202) 452-8975Fax: (202) 452-9054
www.propanecouncil.orgwww.usepropane.comwww.buildwithpropane.comwww.propanesafety.com
DISCLAIMER
This report was prepared by ICF International for the Propane education & research Council (PerC). The report presents the views of ICF International. The report includes forward-looking statements and projections. ICF has made every reasonable effort to ensure that the information and assumptions on which these statements and projections are based are current, reasonable, and complete. However, a variety of factors could cause actual market results to differ materially from the projections, anticipated results, or other expectations expressed in this document.