promoting working women in japan - brookings institution · pdf filepromoting working women in...
TRANSCRIPT
Promoting Working Women in Japan
~The Central Core of the Growth Strategy ~
Ministry of Economy, Trade and Industry
Economic and Social Policy Office Riwa Sakamoto
<Today’s Agenda> 1. “Promoting Working Women” for Japan’s Economic Growth 2.The Issues and Government Programs
2
1. “Promoting Working Women” for Japan’s Economic Growth
3
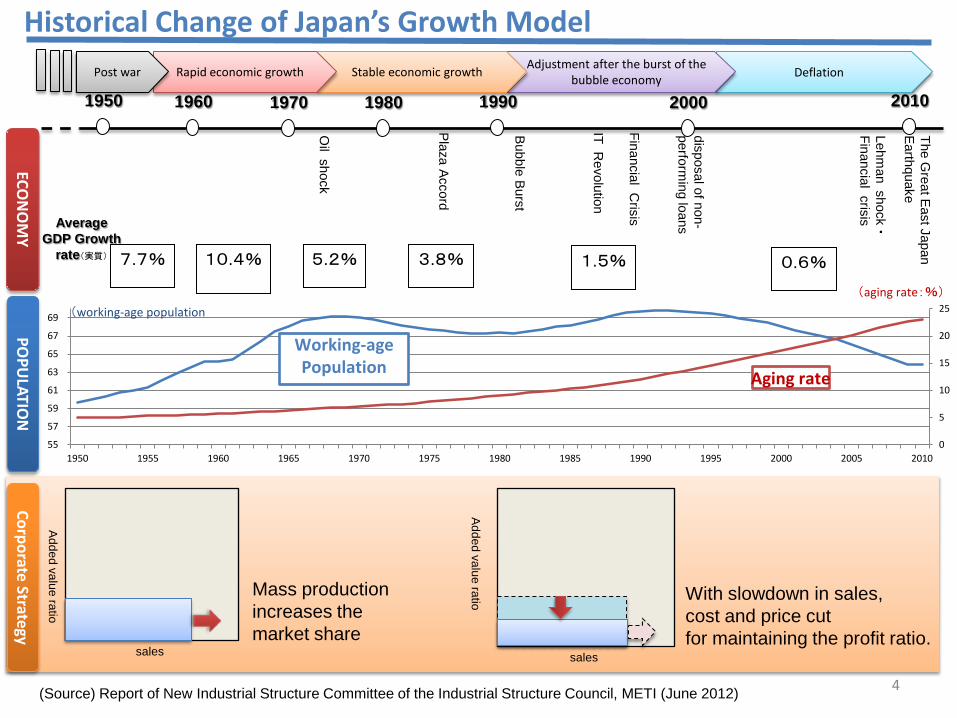
Historical Change of Japan’s Growth Model Deflation Adjustment after the burst of the
bubble economy
POPU
LATION
Corporate Strategy
1950 2010 1980 1990 2000 1960 1970
Oil shock
Bubble Burst
Lehman shock
・ Financial crisis
The Great East Japan
Earthquake
Stable economic growth Rapid economic growth Post war
Plaza Accord
sales
Added value ratio
Mass production increases the market share
7.7% 10.4%
5.2% 3.8% 1.5% 0.6%
sales
With slowdown in sales, cost and price cut for maintaining the profit ratio.
ECON
OM
Y
Financial Crisis Average
GDP Growth rate(実質)
disposal of non-perform
ing loans
Added value ratio
IT Revolution
0
5
10
15
20
25
55
57
59
61
63
65
67
69
1950 1955 1960 1965 1970 1975 1980 1985 1990 1995 2000 2005 2010
(working-age population(aging rate:%)
Aging rate
Working-age Population
4 (Source) Report of New Industrial Structure Committee of the Industrial Structure Council, METI (June 2012)
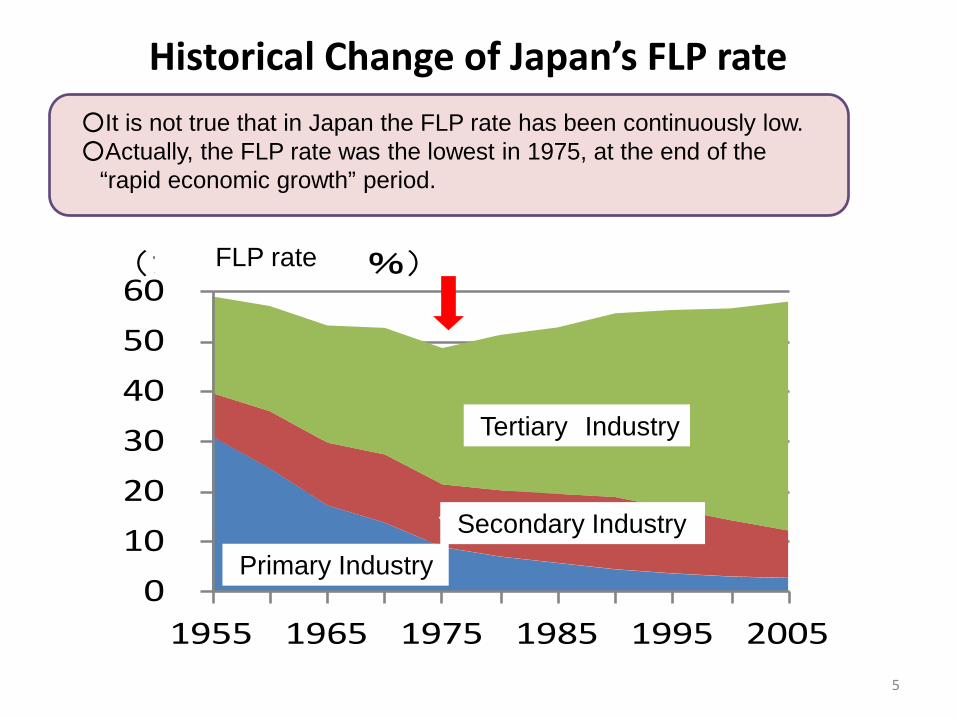
Historical Change of Japan’s FLP rate ○It is not true that in Japan the FLP rate has been continuously low. ○Actually, the FLP rate was the lowest in 1975, at the end of the
“rapid economic growth” period.
5
0 10 20 30 40 50 60
1955 1965 1975 1985 1995 2005
(女性就業率:%)
第3次産業
第2次産業第1次産業
FLP rate
Tertiary Industry
Secondary Industry Primary Industry
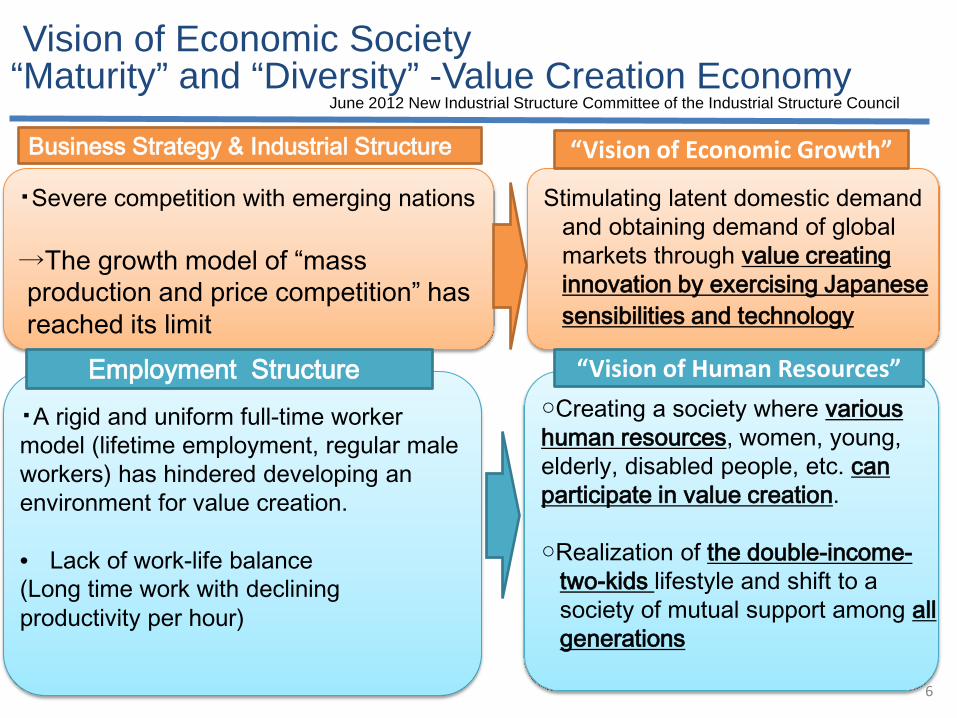
Vision of Economic Society “Maturity” and “Diversity” -Value Creation Economy June 2012 New Industrial Structure Committee of the Industrial Structure Council
“Vision of Human Resources”
“Vision of Economic Growth”
○Creating a society where various human resources, women, young, elderly, disabled people, etc. can participate in value creation. ○Realization of the double-income-
two-kids lifestyle and shift to a society of mutual support among all generations
Stimulating latent domestic demand and obtaining demand of global markets through value creating innovation by exercising Japanese sensibilities and technology
・Severe competition with emerging nations →The growth model of “mass production and price competition” has reached its limit
Business Strategy & Industrial Structure
・A rigid and uniform full-time worker model (lifetime employment, regular male workers) has hindered developing an environment for value creation. • Lack of work-life balance (Long time work with declining productivity per hour)
Employment Structure
6
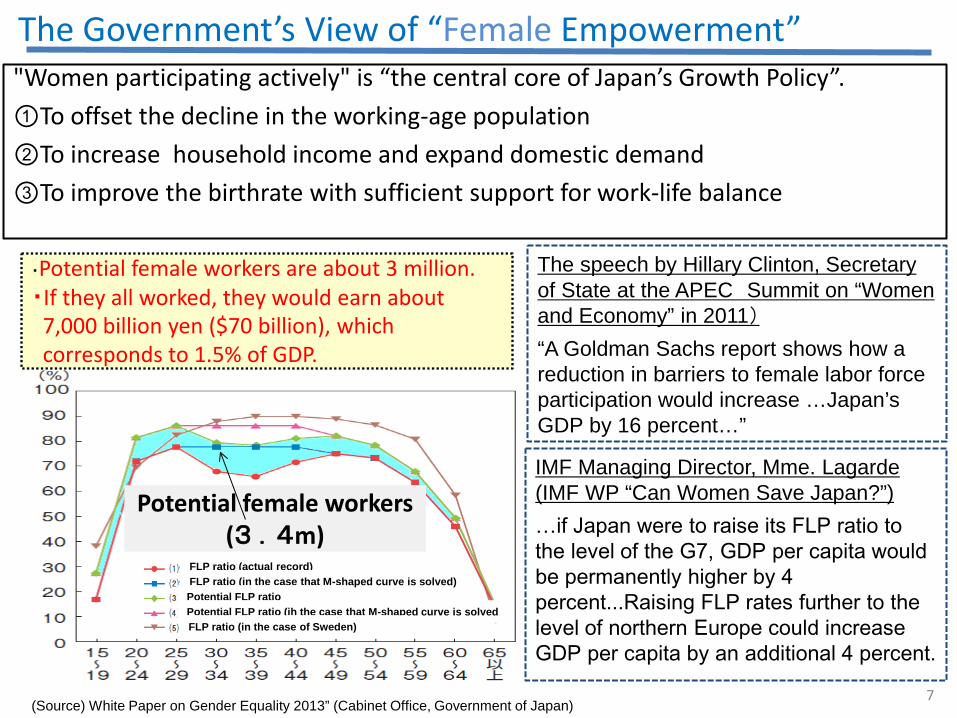
(出所)平成23年版男女共同参画白書
Potential female workers (3 .4m)
The Government’s View of “Female Empowerment” "Women participating actively" is “the central core of Japan’s Growth Policy”. ①To offset the decline in the working-age population ②To increase household income and expand domestic demand ③To improve the birthrate with sufficient support for work-life balance
・Potential female workers are about 3 million. ・If they all worked, they would earn about
7,000 billion yen ($70 billion), which corresponds to 1.5% of GDP.
IMF Managing Director, Mme. Lagarde (IMF WP “Can Women Save Japan?”) …if Japan were to raise its FLP ratio to the level of the G7, GDP per capita would be permanently higher by 4 percent...Raising FLP rates further to the level of northern Europe could increase GDP per capita by an additional 4 percent.
The speech by Hillary Clinton, Secretary of State at the APEC Summit on “Women and Economy” in 2011) “A Goldman Sachs report shows how a reduction in barriers to female labor force participation would increase …Japan’s GDP by 16 percent…”
7 (Source) White Paper on Gender Equality 2013” (Cabinet Office, Government of Japan)
FLP ratio (actual record) FLP ratio (in the case that M-shaped curve is solved) Potential FLP ratio Potential FLP ratio (ih the case that M-shaped curve is solved FLP ratio (in the case of Sweden)

2. The Issues and Government Programs
8
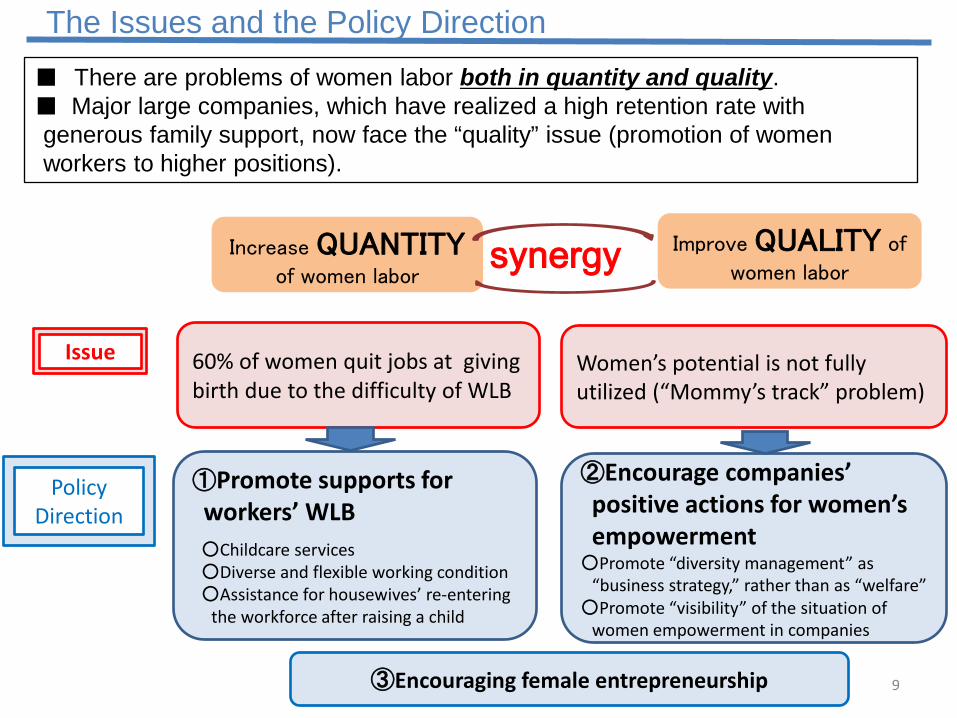
Increase QUANTITY
of women labor synergy
■ There are problems of women labor both in quantity and quality. ■ Major large companies, which have realized a high retention rate with generous family support, now face the “quality” issue (promotion of women workers to higher positions).
Improve QUALITY of
women labor
60% of women quit jobs at giving birth due to the difficulty of WLB
Women’s potential is not fully utilized (“Mommy’s track” problem)
①Promote supports for workers’ WLB
○Childcare services ○Diverse and flexible working condition ○Assistance for housewives’ re-entering
the workforce after raising a child
②Encourage companies’ positive actions for women’s empowerment
○Promote “diversity management” as “business strategy,” rather than as “welfare”
○Promote “visibility” of the situation of women empowerment in companies
③Encouraging female entrepreneurship
Issue
Policy Direction
The Issues and the Policy Direction
9
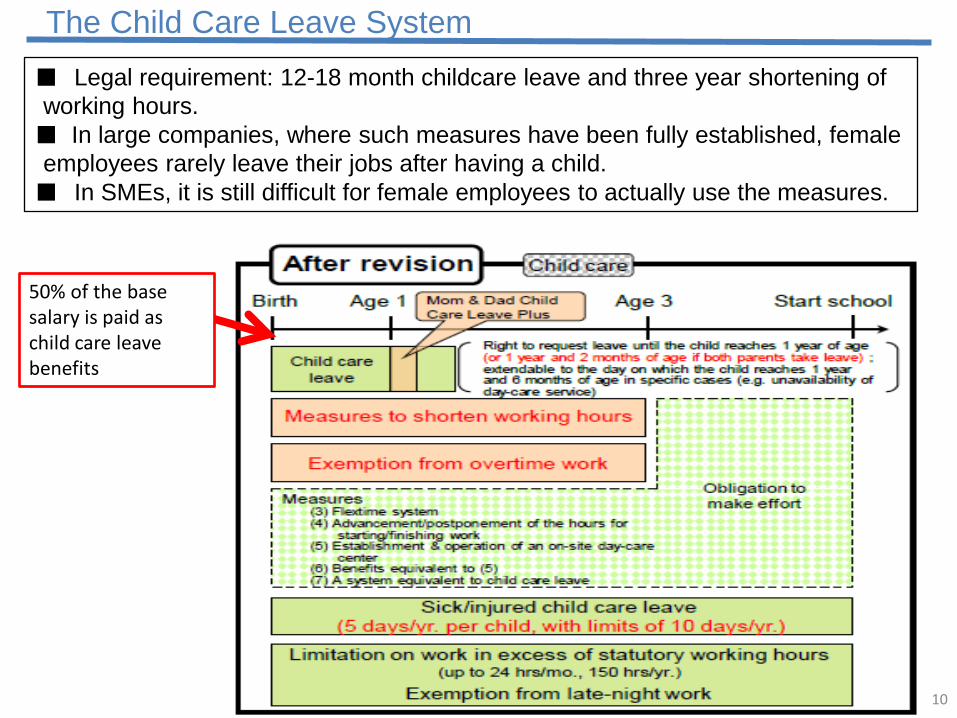
■ Legal requirement: 12-18 month childcare leave and three year shortening of working hours. ■ In large companies, where such measures have been fully established, female employees rarely leave their jobs after having a child. ■ In SMEs, it is still difficult for female employees to actually use the measures.
The Child Care Leave System
10
50% of the base salary is paid as child care leave benefits
Public, 45% social welfare
corporations , 49%
NPO 0.3%
Business corporations 1.2%
(Source) Ministry of Health, Labour and Welfare
The Problem of Childcare Waiting Lists
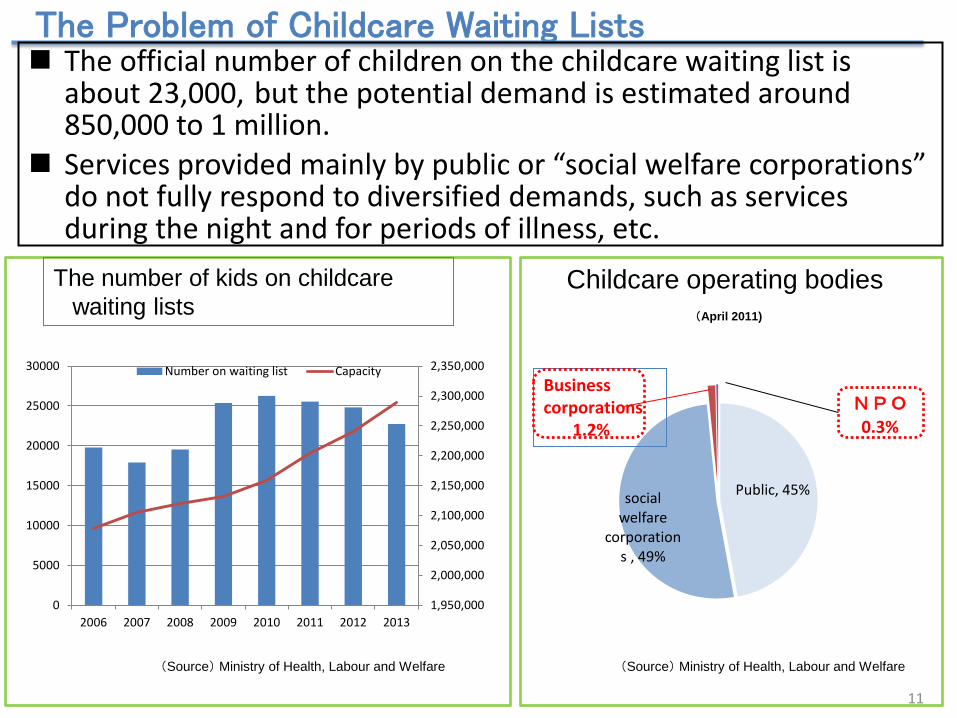
Childcare operating bodies (April 2011)
The official number of children on the childcare waiting list is about 23,000, but the potential demand is estimated around 850,000 to 1 million.
Services provided mainly by public or “social welfare corporations” do not fully respond to diversified demands, such as services during the night and for periods of illness, etc.
The number of kids on childcare waiting lists
(Source) Ministry of Health, Labour and Welfare
1,950,000
2,000,000
2,050,000
2,100,000
2,150,000
2,200,000
2,250,000
2,300,000
2,350,000
0
5000
10000
15000
20000
25000
30000
2006 2007 2008 2009 2010 2011 2012 2013
Number on waiting list Capacity
11
“Accelerating the Zero Childcare Waiting List Project”
12
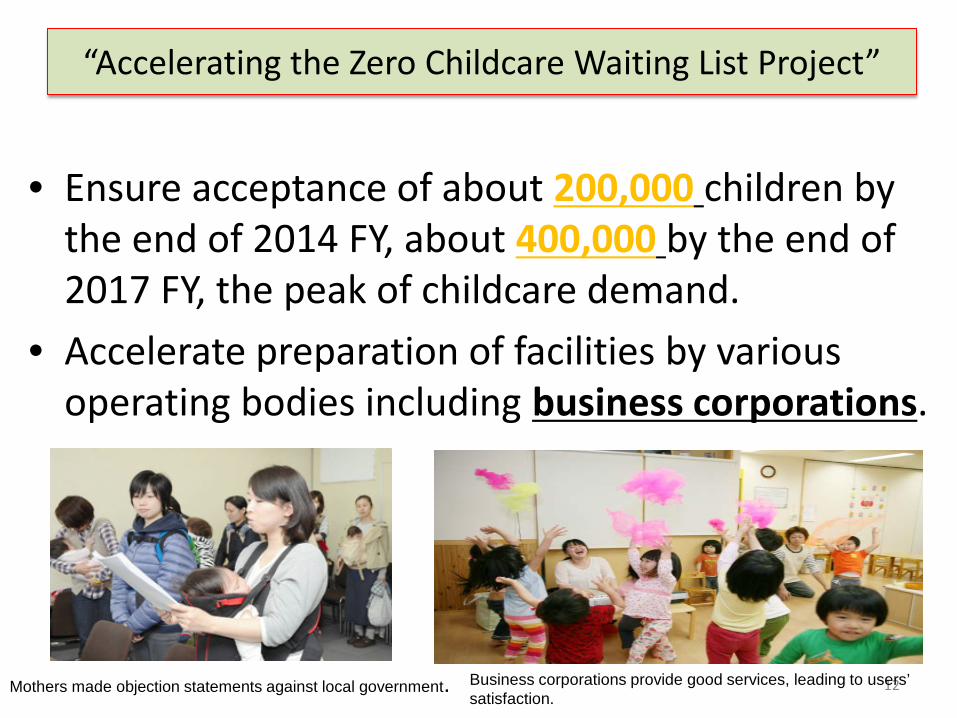
• Ensure acceptance of about 200,000 children by
the end of 2014 FY, about 400,000 by the end of 2017 FY, the peak of childcare demand.
• Accelerate preparation of facilities by various operating bodies including business corporations.
Mothers made objection statements against local government. Business corporations provide good services, leading to users’ satisfaction.
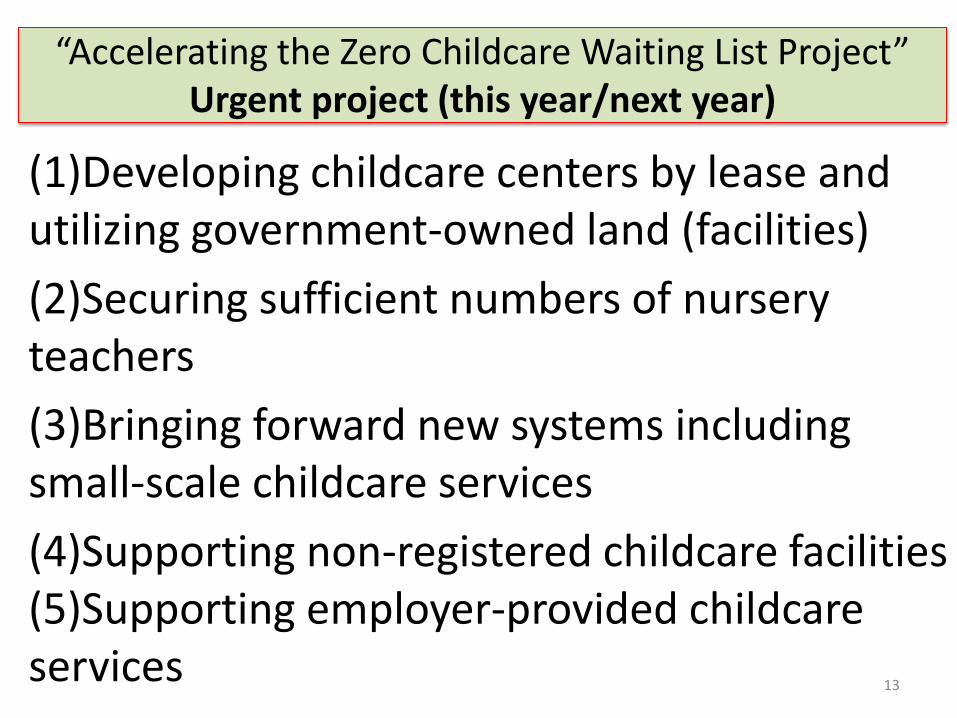
“Accelerating the Zero Childcare Waiting List Project” Urgent project (this year/next year)
13
(1)Developing childcare centers by lease and utilizing government-owned land (facilities) (2)Securing sufficient numbers of nursery teachers (3)Bringing forward new systems including small-scale childcare services (4)Supporting non-registered childcare facilities (5)Supporting employer-provided childcare services
0
5
10
15
20
25
30
35
40
45
Saud
i Ara
bia
UAE
Japa
nSo
uth
Kore
aO
man
Kuw
ait
Indi
aBr
azil
Sing
apor
eM
alay
siaCh
ina
Turk
eyCa
nada
Aust
ralia
U.S
.U
nite
d Ki
ngdo
mG
erm
any
Finl
and
Fran
ceSw
eden
Nor
way
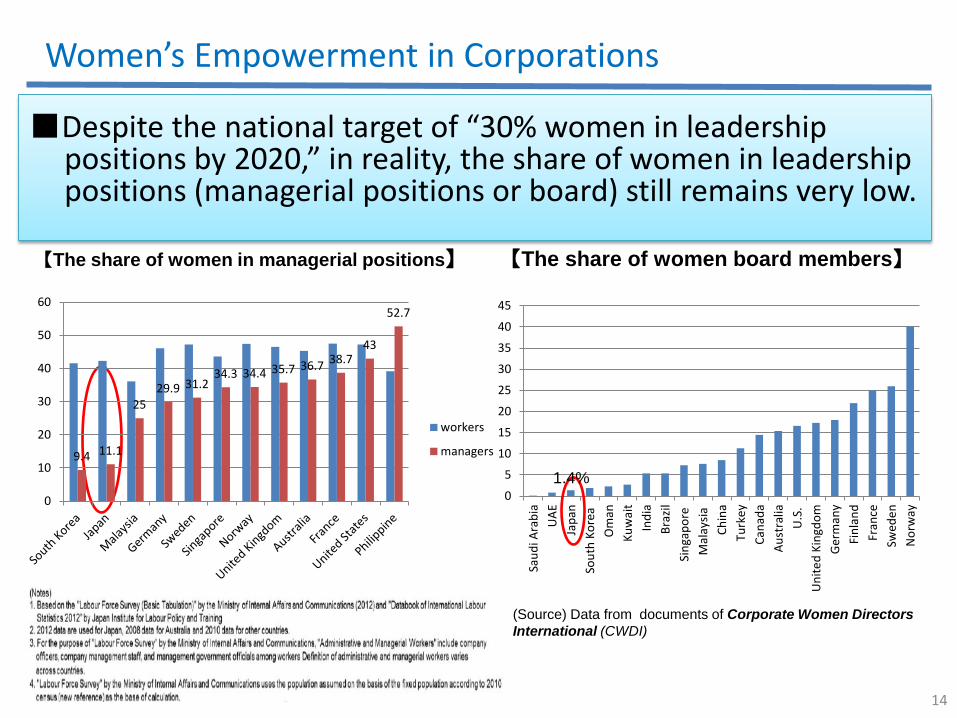
■Despite the national target of “30% women in leadership positions by 2020,” in reality, the share of women in leadership positions (managerial positions or board) still remains very low.
Women’s Empowerment in Corporations
14
【The share of women in managerial positions】
(Source) Data from documents of Corporate Women Directors International (CWDI)
【The share of women board members】
9.4 11.1
25 29.9 31.2
34.3 34.4 35.7 36.7 38.7 43
52.7
0
10
20
30
40
50
60
workers
managers
1.4%
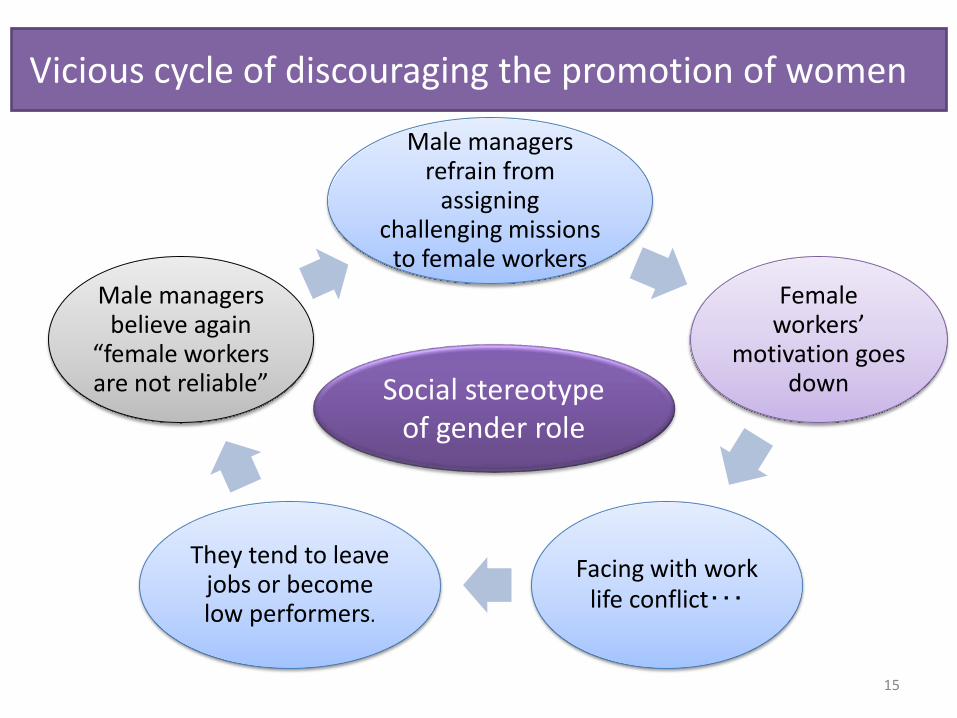
Vicious cycle of discouraging the promotion of women
Male managers refrain from
assigning challenging missions
to female workers Female
workers’ motivation goes
down
Facing with work life conflict・・・
They tend to leave jobs or become low performers.
Male managers believe again
“female workers are not reliable”
15
Social stereotype of gender role
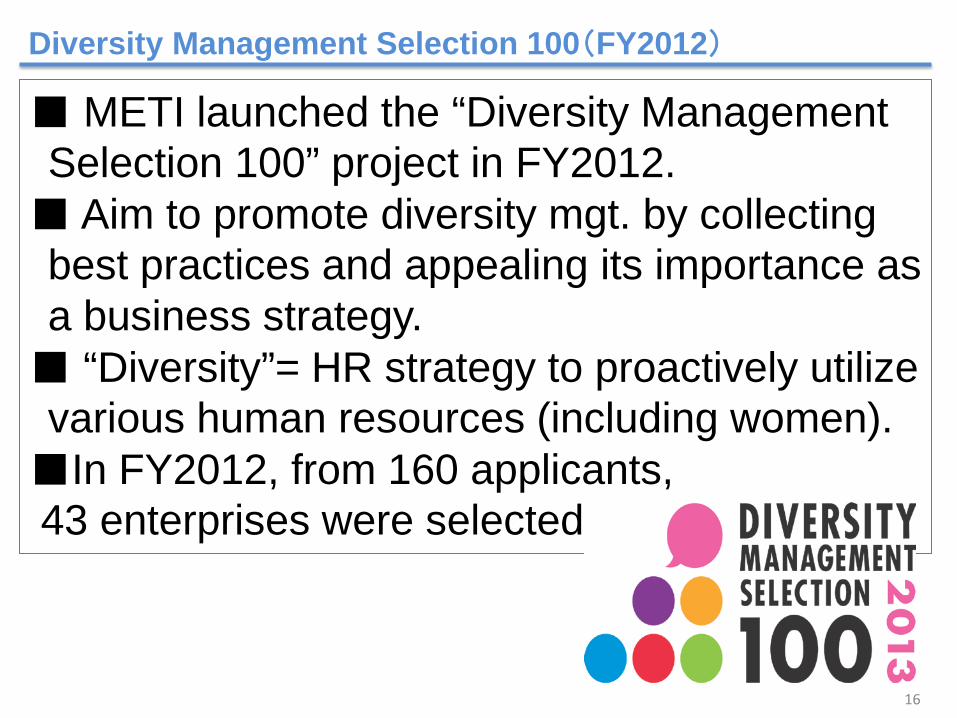
■ METI launched the “Diversity Management Selection 100” project in FY2012. ■ Aim to promote diversity mgt. by collecting best practices and appealing its importance as a business strategy. ■ “Diversity”= HR strategy to proactively utilize various human resources (including women). ■In FY2012, from 160 applicants, 43 enterprises were selected.
Diversity Management Selection 100(FY2012)
16
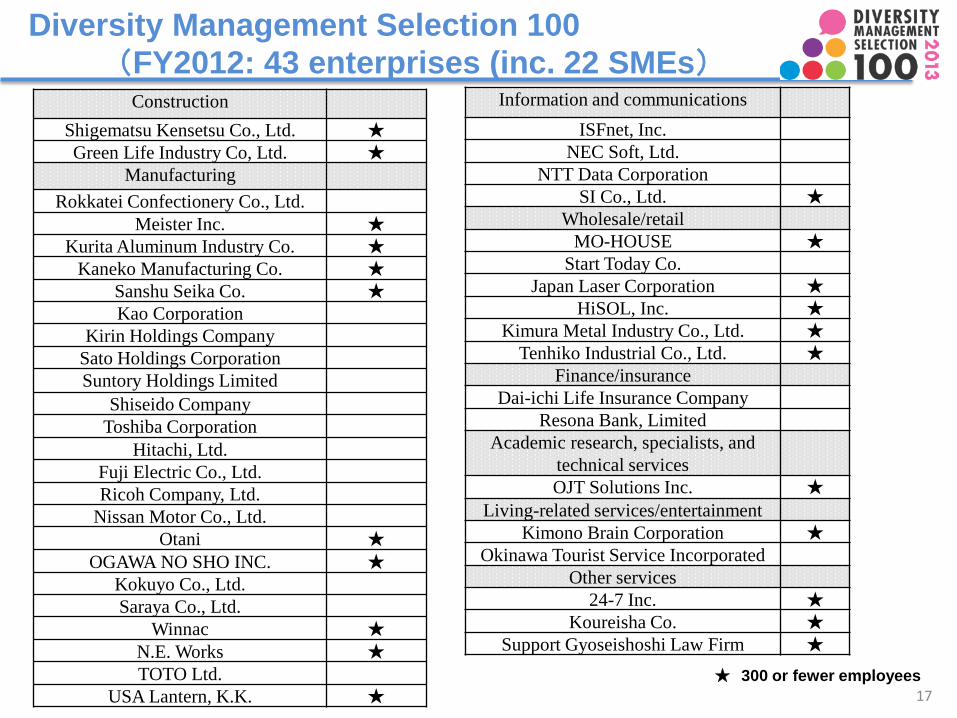
Diversity Management Selection 100 (FY2012: 43 enterprises (inc. 22 SMEs)
Construction
Shigematsu Kensetsu Co., Ltd. ★ Green Life Industry Co, Ltd. ★
Manufacturing Rokkatei Confectionery Co., Ltd.
Meister Inc. ★ Kurita Aluminum Industry Co. ★
Kaneko Manufacturing Co. ★ Sanshu Seika Co. ★ Kao Corporation
Kirin Holdings Company Sato Holdings Corporation Suntory Holdings Limited
Shiseido Company Toshiba Corporation
Hitachi, Ltd. Fuji Electric Co., Ltd. Ricoh Company, Ltd.
Nissan Motor Co., Ltd. Otani ★
OGAWA NO SHO INC. ★ Kokuyo Co., Ltd. Saraya Co., Ltd.
Winnac ★ N.E. Works ★ TOTO Ltd.
USA Lantern, K.K. ★
Information and communications ISFnet, Inc.
NEC Soft, Ltd. NTT Data Corporation
SI Co., Ltd. ★ Wholesale/retail
MO-HOUSE ★ Start Today Co.
Japan Laser Corporation ★ HiSOL, Inc. ★
Kimura Metal Industry Co., Ltd. ★ Tenhiko Industrial Co., Ltd. ★
Finance/insurance Dai-ichi Life Insurance Company
Resona Bank, Limited Academic research, specialists, and
technical services
OJT Solutions Inc. ★ Living-related services/entertainment
Kimono Brain Corporation ★ Okinawa Tourist Service Incorporated
Other services 24-7 Inc. ★
Koureisha Co. ★ Support Gyoseishoshi Law Firm ★
★ 300 or fewer employees 17
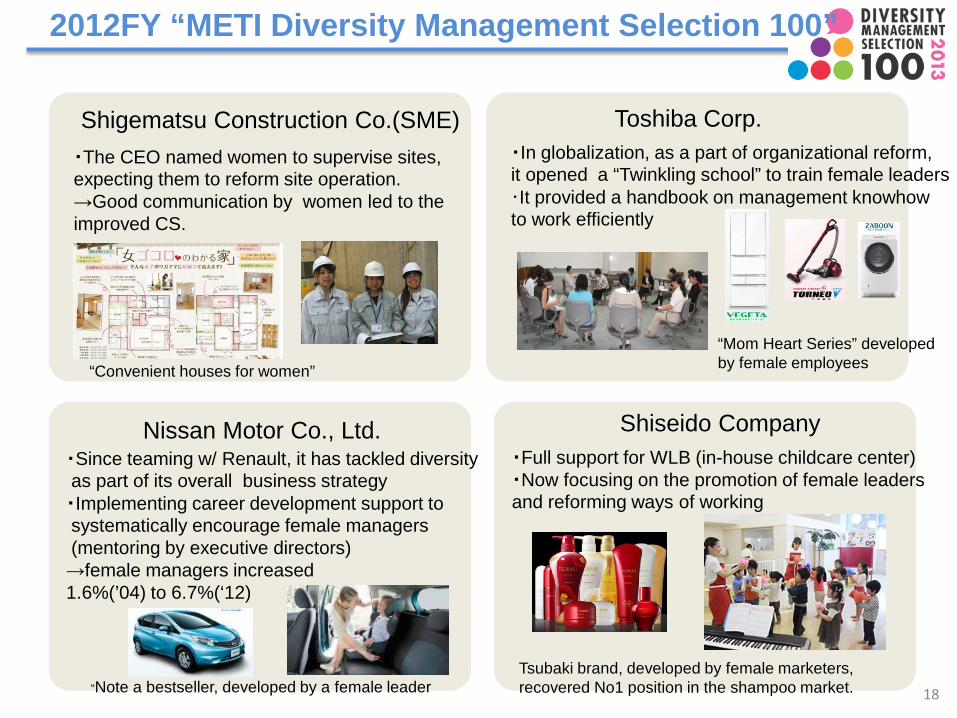
2012FY “METI Diversity Management Selection 100”
Shigematsu Construction Co.(SME) ・The CEO named women to supervise sites, expecting them to reform site operation. →Good communication by women led to the improved CS.
Toshiba Corp. ・In globalization, as a part of organizational reform, it opened a “Twinkling school” to train female leaders ・It provided a handbook on management knowhow to work efficiently
“Mom Heart Series” developed by female employees
Nissan Motor Co., Ltd. ・Since teaming w/ Renault, it has tackled diversity as part of its overall business strategy ・Implementing career development support to systematically encourage female managers (mentoring by executive directors) →female managers increased 1.6%(’04) to 6.7%(‘12)
“Note a bestseller, developed by a female leader
Shiseido Company ・Full support for WLB (in-house childcare center) ・Now focusing on the promotion of female leaders and reforming ways of working
“Convenient houses for women”
Tsubaki brand, developed by female marketers, recovered No1 position in the shampoo market. 18
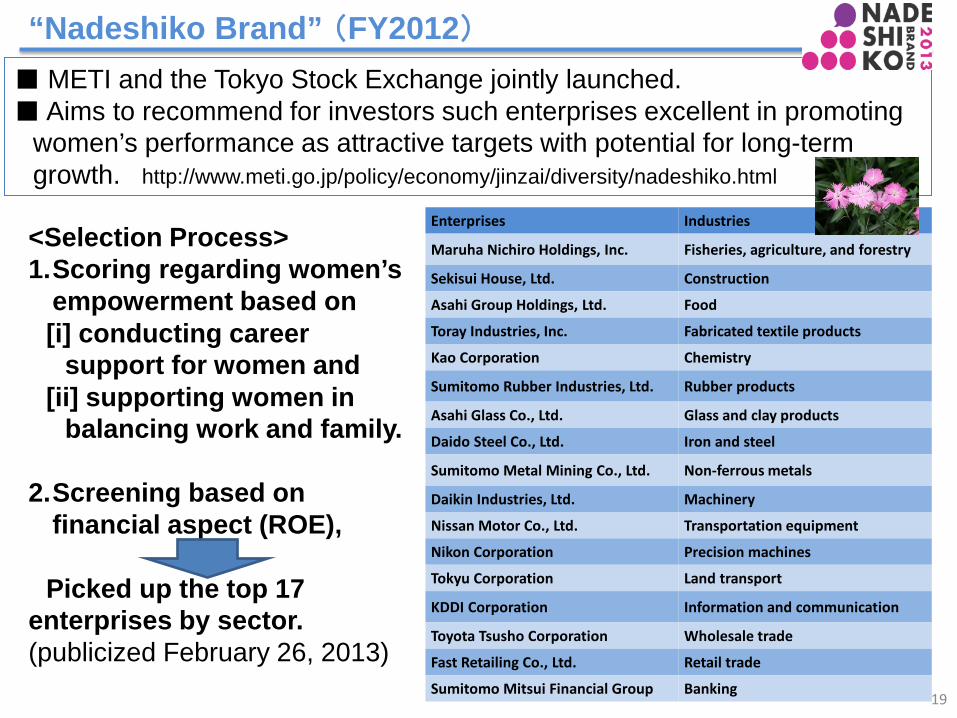
<Selection Process> 1.Scoring regarding women’s
empowerment based on [i] conducting career support for women and [ii] supporting women in balancing work and family. 2.Screening based on
financial aspect (ROE), Picked up the top 17 enterprises by sector. (publicized February 26, 2013)
■ METI and the Tokyo Stock Exchange jointly launched. ■ Aims to recommend for investors such enterprises excellent in promoting
women’s performance as attractive targets with potential for long-term growth. http://www.meti.go.jp/policy/economy/jinzai/diversity/nadeshiko.html
“Nadeshiko Brand” (FY2012)
Enterprises Industries
Maruha Nichiro Holdings, Inc. Fisheries, agriculture, and forestry
Sekisui House, Ltd. Construction
Asahi Group Holdings, Ltd. Food
Toray Industries, Inc. Fabricated textile products
Kao Corporation Chemistry
Sumitomo Rubber Industries, Ltd. Rubber products
Asahi Glass Co., Ltd. Glass and clay products
Daido Steel Co., Ltd. Iron and steel
Sumitomo Metal Mining Co., Ltd. Non-ferrous metals
Daikin Industries, Ltd. Machinery
Nissan Motor Co., Ltd. Transportation equipment
Nikon Corporation Precision machines
Tokyu Corporation Land transport
KDDI Corporation Information and communication
Toyota Tsusho Corporation Wholesale trade
Fast Retailing Co., Ltd. Retail trade
Sumitomo Mitsui Financial Group Banking 19
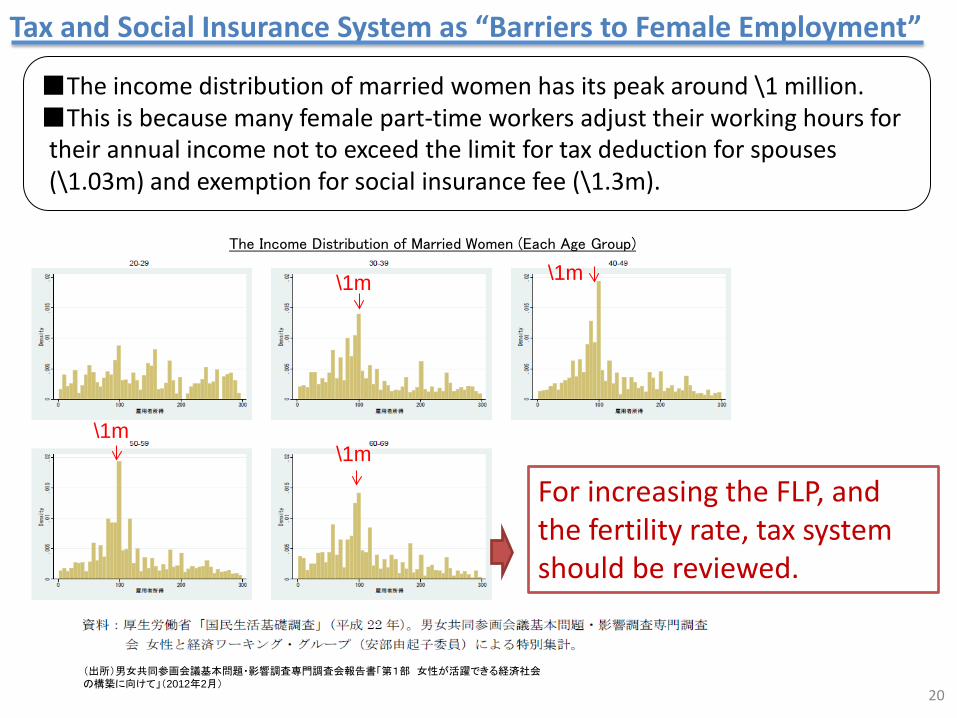
■The income distribution of married women has its peak around \1 million. ■This is because many female part-time workers adjust their working hours for their annual income not to exceed the limit for tax deduction for spouses (\1.03m) and exemption for social insurance fee (\1.3m).
20
The Income Distribution of Married Women (Each Age Group)
Tax and Social Insurance System as “Barriers to Female Employment”
(出所)男女共同参画会議基本問題・影響調査専門調査会報告書「第1部 女性が活躍できる経済社会 の構築に向けて」(2012年2月)
For increasing the FLP, and the fertility rate, tax system should be reviewed.
\1m \1m
\1m \1m
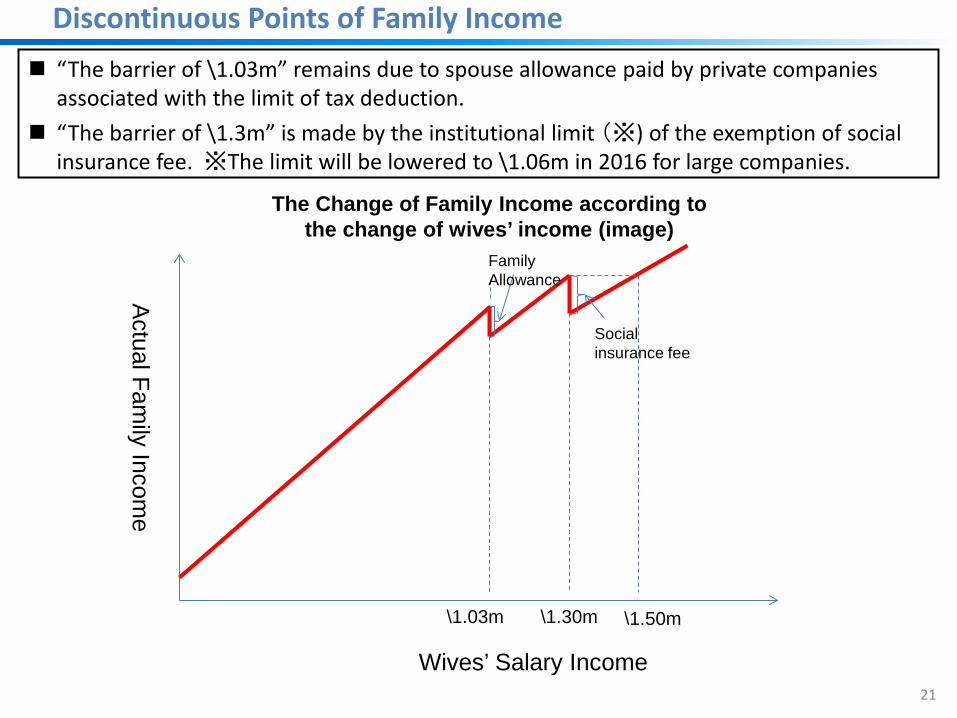
Discontinuous Points of Family Income “The barrier of \1.03m” remains due to spouse allowance paid by private companies
associated with the limit of tax deduction. “The barrier of \1.3m” is made by the institutional limit (※) of the exemption of social
insurance fee. ※The limit will be lowered to \1.06m in 2016 for large companies.
21
The Change of Family Income according to the change of wives’ income (image)
Actual Fam
ily Income
Wives’ Salary Income
\1.03m \1.30m \1.50m
Family Allowance
Social insurance fee
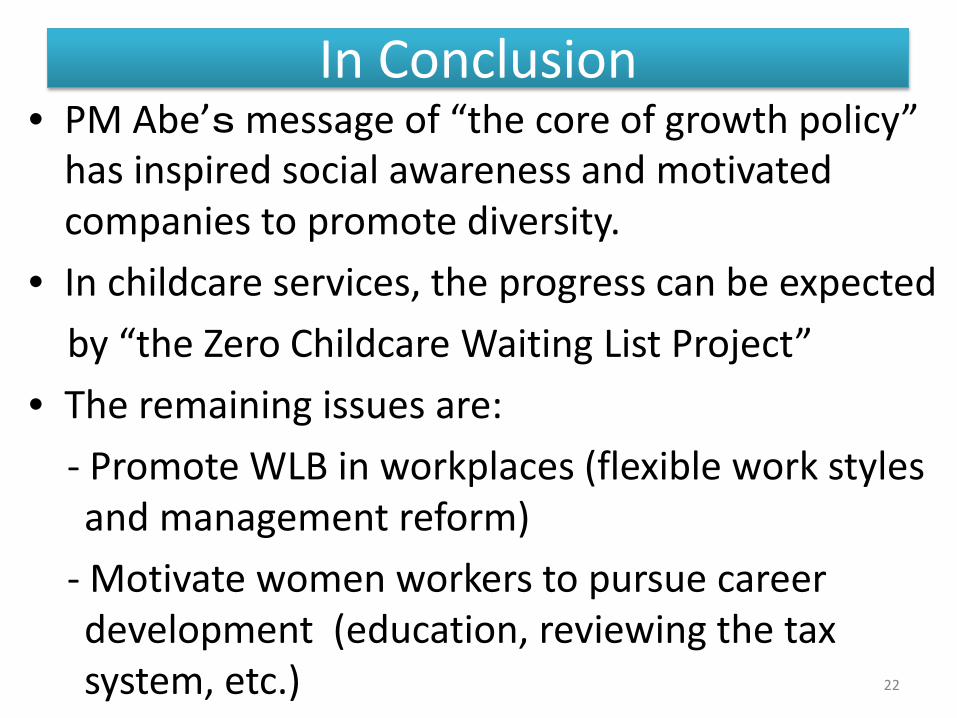
In Conclusion • PM Abe’s message of “the core of growth policy”
has inspired social awareness and motivated companies to promote diversity.
• In childcare services, the progress can be expected by “the Zero Childcare Waiting List Project” • The remaining issues are: - Promote WLB in workplaces (flexible work styles
and management reform) - Motivate women workers to pursue career
development (education, reviewing the tax system, etc.) 22
Reference Data (Current Conditions in Japan)
23
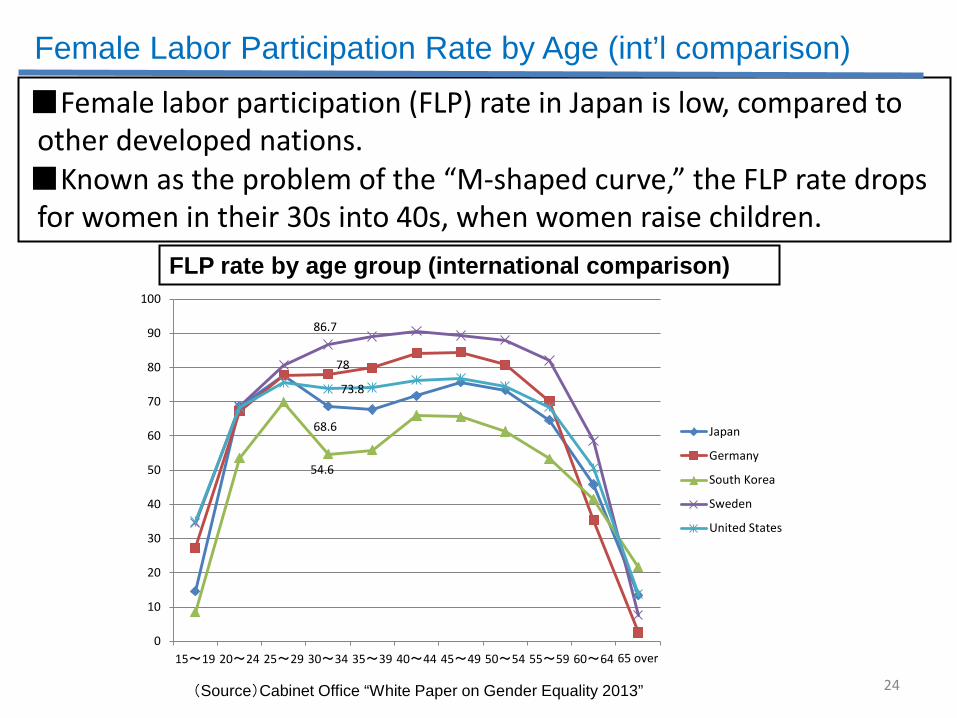
■Female labor participation (FLP) rate in Japan is low, compared to other developed nations. ■Known as the problem of the “M-shaped curve,” the FLP rate drops for women in their 30s into 40s, when women raise children.
(Source)Cabinet Office “White Paper on Gender Equality 2013”
Female Labor Participation Rate by Age (int’l comparison)
FLP rate by age group (international comparison)
24
68.6
78
54.6
86.7
73.8
0
10
20
30
40
50
60
70
80
90
100
15~19 20~24 25~29 30~34 35~39 40~44 45~49 50~54 55~59 60~64 65 over
Japan
Germany
South Korea
Sweden
United States
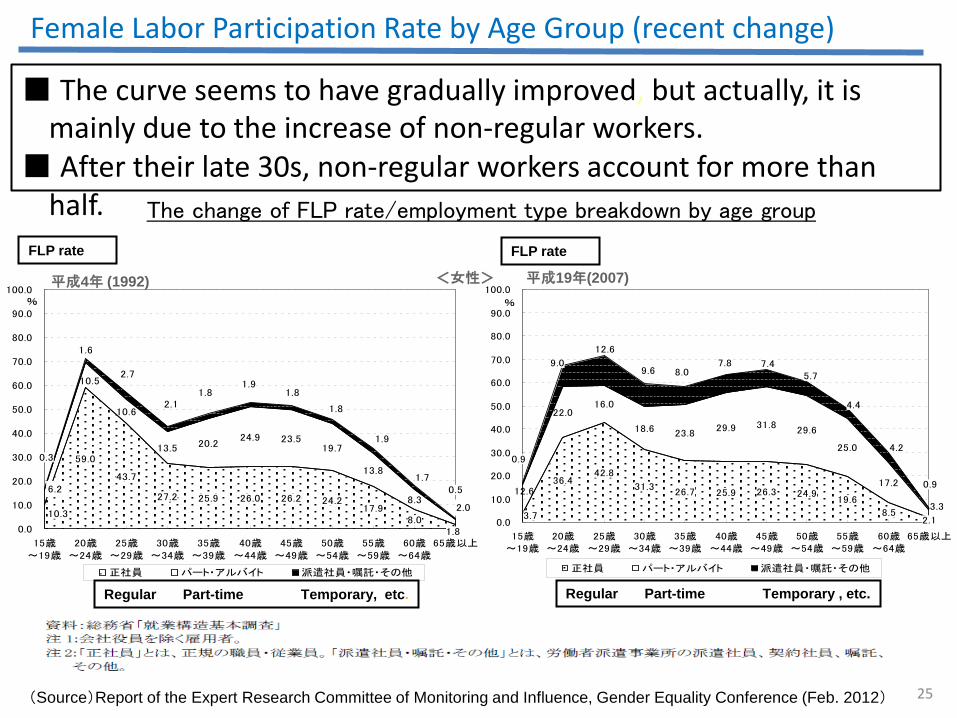
■ The curve seems to have gradually improved, but actually, it is mainly due to the increase of non-regular workers.
■ After their late 30s, non-regular workers account for more than half. The change of FLP rate/employment type breakdown by age group
(Source)Report of the Expert Research Committee of Monitoring and Influence, Gender Equality Conference (Feb. 2012)
59.0
43.7
27.2 25.9 26.0 26.2 24.217.9
8.0
10.6
13.5 20.224.9 23.5
19.7
13.8
8.3
10.3
1.8
10.5
6.2
2.0
0.51.7
1.9
1.8
1.81.9
1.82.1
2.7
1.6
0.3
0.0
10.0
20.0
30.0
40.0
50.0
60.0
70.0
80.0
90.0
100.0
15歳~19歳
20歳~24歳
25歳~29歳
30歳~34歳
35歳~39歳
40歳~44歳
45歳~49歳
50歳~54歳
55歳~59歳
60歳~64歳
65歳以上
正社員 パート・アルバイト 派遣社員・嘱託・その他
%
36.442.8
31.326.7 25.9 26.3 24.9
19.6
8.52.1
22.016.0
18.6 23.829.9 31.8
29.6
25.0
17.2
3.7
12.6
3.3
0.9
4.2
4.4
5.77.47.8
8.09.6
12.6
9.0
0.9
0.0
10.0
20.0
30.0
40.0
50.0
60.0
70.0
80.0
90.0
100.0
15歳~19歳
20歳~24歳
25歳~29歳
30歳~34歳
35歳~39歳
40歳~44歳
45歳~49歳
50歳~54歳
55歳~59歳
60歳~64歳
65歳以上
正社員 パート・アルバイト 派遣社員・嘱託・その他
%
<女性> 平成19年(2007) 平成4年 (1992)
Female Labor Participation Rate by Age Group (recent change)
Regular Part-time Temporary , etc.
25
Regular Part-time Temporary, etc.
FLP rate FLP rate
26
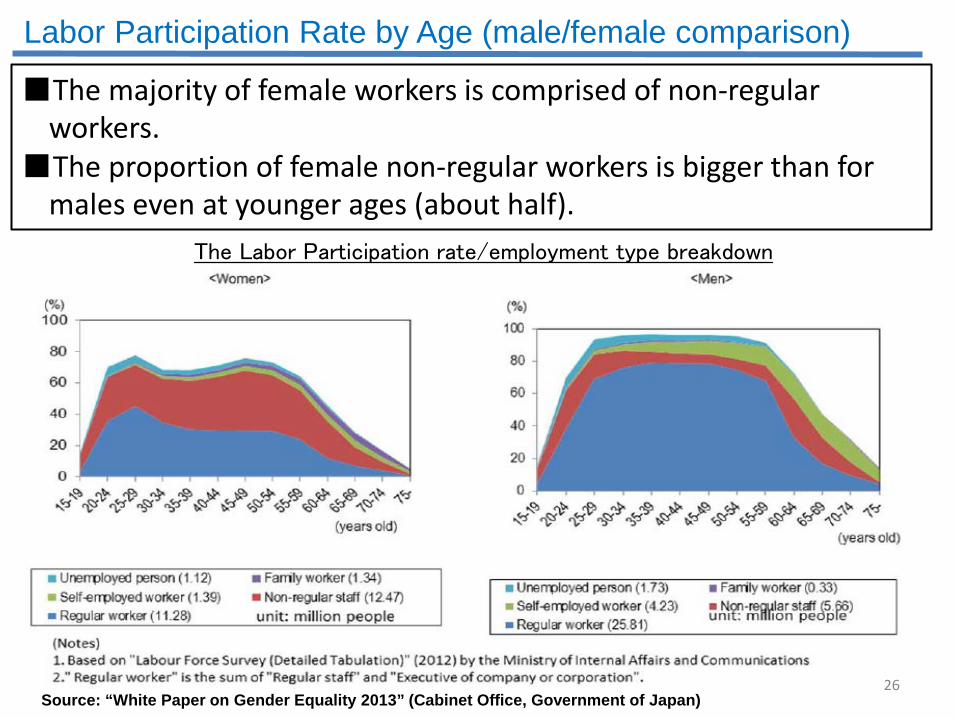
■The majority of female workers is comprised of non-regular workers.
■The proportion of female non-regular workers is bigger than for males even at younger ages (about half).
Labor Participation Rate by Age (male/female comparison)
Source: “White Paper on Gender Equality 2013” (Cabinet Office, Government of Japan)
The Labor Participation rate/employment type breakdown
26
27
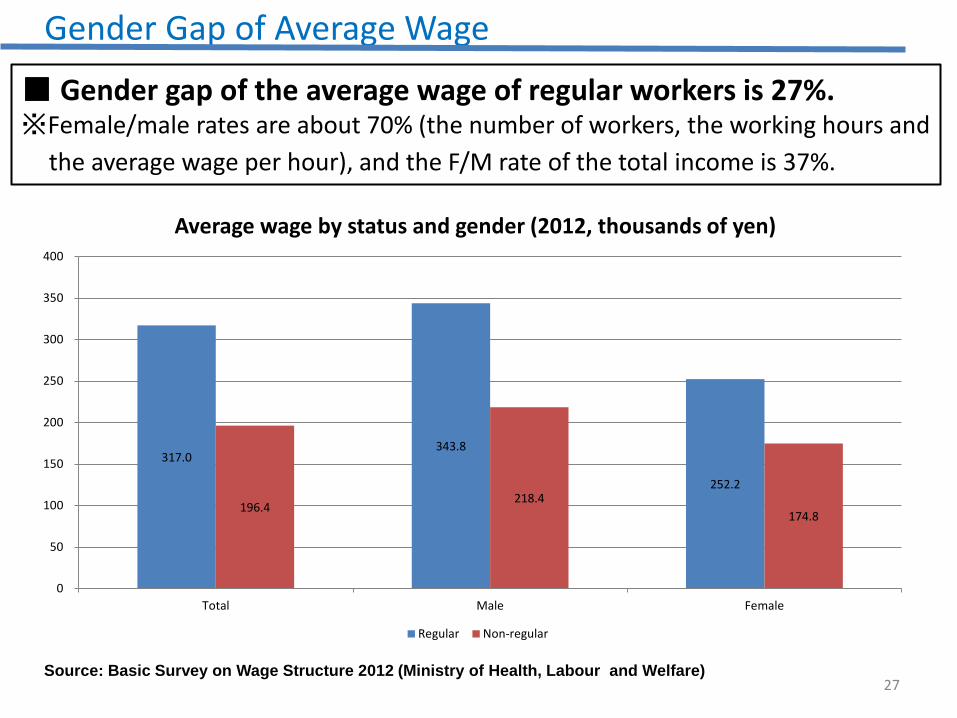
■ Gender gap of the average wage of regular workers is 27%. ※Female/male rates are about 70% (the number of workers, the working hours and
the average wage per hour), and the F/M rate of the total income is 37%.
Gender Gap of Average Wage
317.0 343.8
252.2
196.4 218.4
174.8
0
50
100
150
200
250
300
350
400
Total Male Female
Average wage by status and gender (2012, thousands of yen)
Regular Non-regular
Source: Basic Survey on Wage Structure 2012 (Ministry of Health, Labour and Welfare)
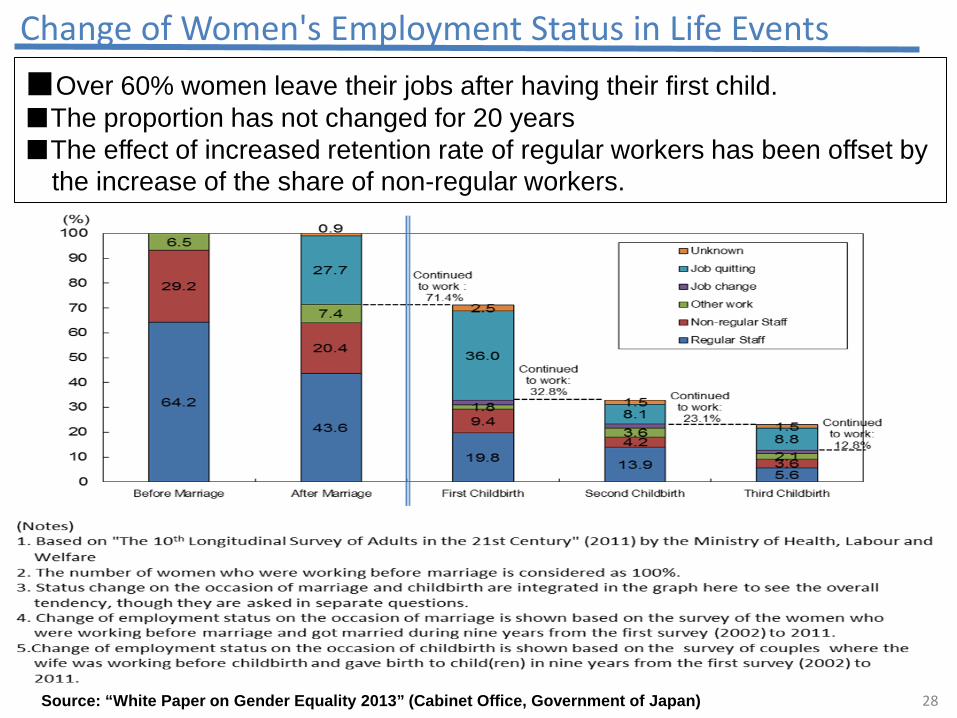
■Over 60% women leave their jobs after having their first child. ■The proportion has not changed for 20 years ■The effect of increased retention rate of regular workers has been offset by
the increase of the share of non-regular workers.
Change of Women's Employment Status in Life Events
28 Source: “White Paper on Gender Equality 2013” (Cabinet Office, Government of Japan)
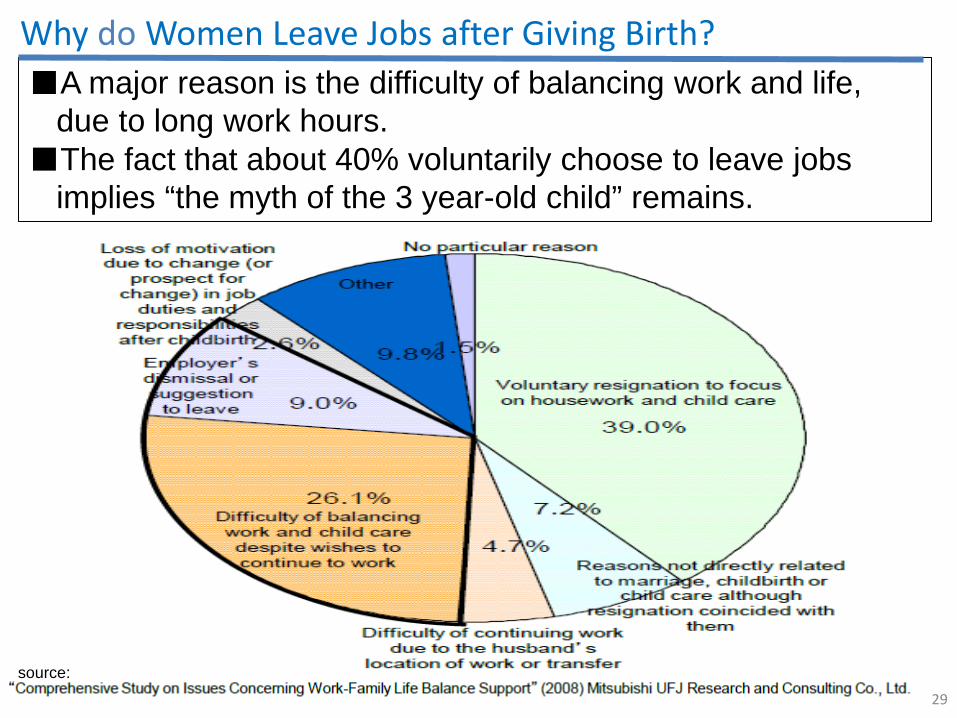
Why do Women Leave Jobs after Giving Birth? ■A major reason is the difficulty of balancing work and life,
due to long work hours. ■The fact that about 40% voluntarily choose to leave jobs
implies “the myth of the 3 year-old child” remains.
29 29
source:
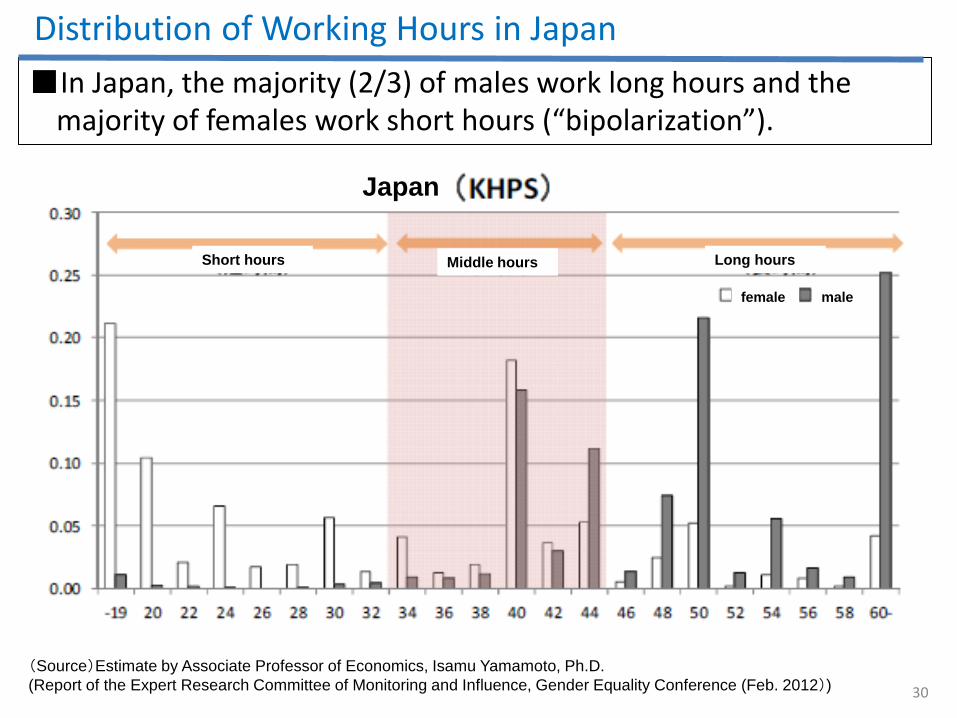
■In Japan, the majority (2/3) of males work long hours and the
majority of females work short hours (“bipolarization”).
30
Distribution of Working Hours in Japan
(Source)Estimate by Associate Professor of Economics, Isamu Yamamoto, Ph.D. (Report of the Expert Research Committee of Monitoring and Influence, Gender Equality Conference (Feb. 2012))
Japan
Short hours Middle hours Long hours
female male
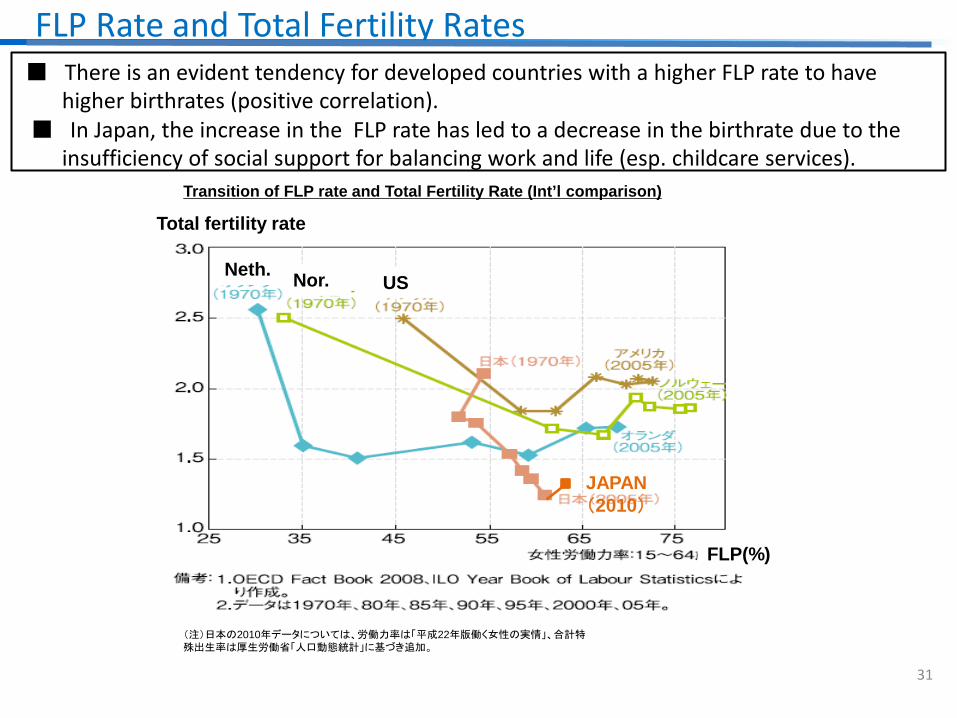
FLP Rate and Total Fertility Rates ■ There is an evident tendency for developed countries with a higher FLP rate to have
higher birthrates (positive correlation). ■ In Japan, the increase in the FLP rate has led to a decrease in the birthrate due to the
insufficiency of social support for balancing work and life (esp. childcare services).
(注)日本の2010年データについては、労働力率は「平成22年版働く女性の実情」、合計特殊出生率は厚生労働省「人口動態統計」に基づき追加。
31
Transition of FLP rate and Total Fertility Rate (Int’l comparison)
JAPAN(2010)
Neth. Nor. US
Total fertility rate
FLP(%)
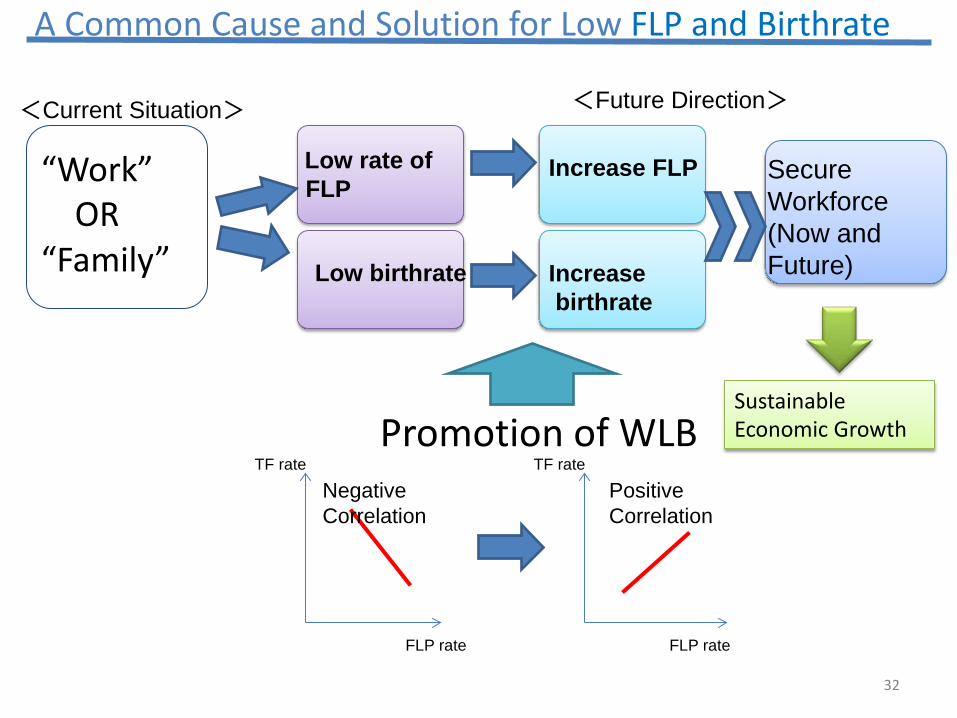
A Common Cause and Solution for Low FLP and Birthrate
Increase FLP Low rate of FLP
“Work” OR “Family”
Promotion of WLB
Low birthrate Increase
birthrate
Negative Correlation
Positive Correlation
<Current Situation> <Future Direction>
Secure Workforce (Now and Future)
TF rate
FLP rate
TF rate
FLP rate
Sustainable Economic Growth
32
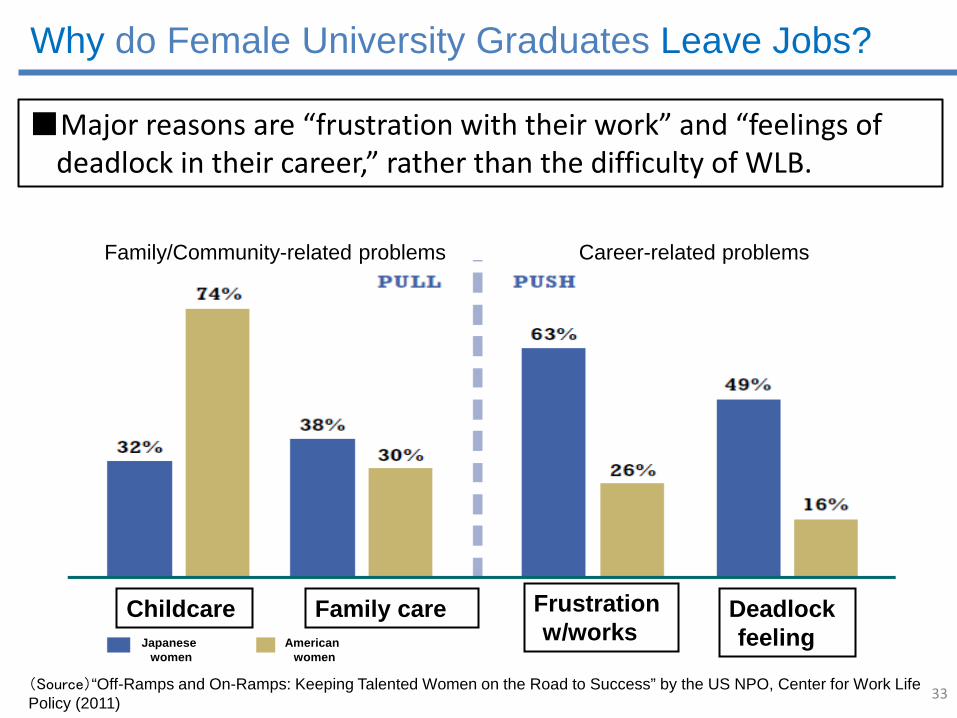
■Major reasons are “frustration with their work” and “feelings of deadlock in their career,” rather than the difficulty of WLB.
(Source)“Off-Ramps and On-Ramps: Keeping Talented Women on the Road to Success” by the US NPO, Center for Work Life Policy (2011)
Why do Female University Graduates Leave Jobs?
Family/Community-related problems Career-related problems
Childcare Family care Frustration w/works
Deadlock feeling
33
Japanese women
American women
-150
-100
-50
0
50
100
150
200 Female Male
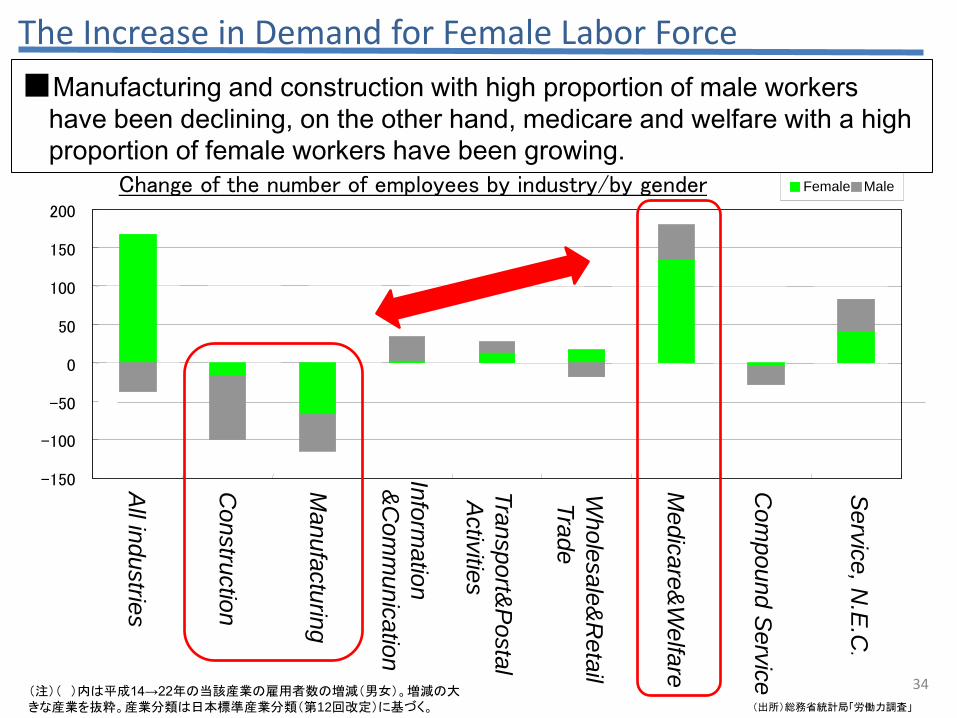
■Manufacturing and construction with high proportion of male workers have been declining, on the other hand, medicare and welfare with a high proportion of female workers have been growing.
(出所)総務省統計局「労働力調査」 (注)( )内は平成14→22年の当該産業の雇用者数の増減(男女)。増減の大きな産業を抜粋。産業分類は日本標準産業分類(第12回改定)に基づく。
Change of the number of employees by industry/by gender
The Increase in Demand for Female Labor Force
All industries
Construction
Manufacturing
Information
&C
omm
unication
Transport&P
ostal A
ctivities
Wholesale&
Retail
Trade
Medicare&
Welfare
Com
pound Service
Service, N
.E.C
.
34
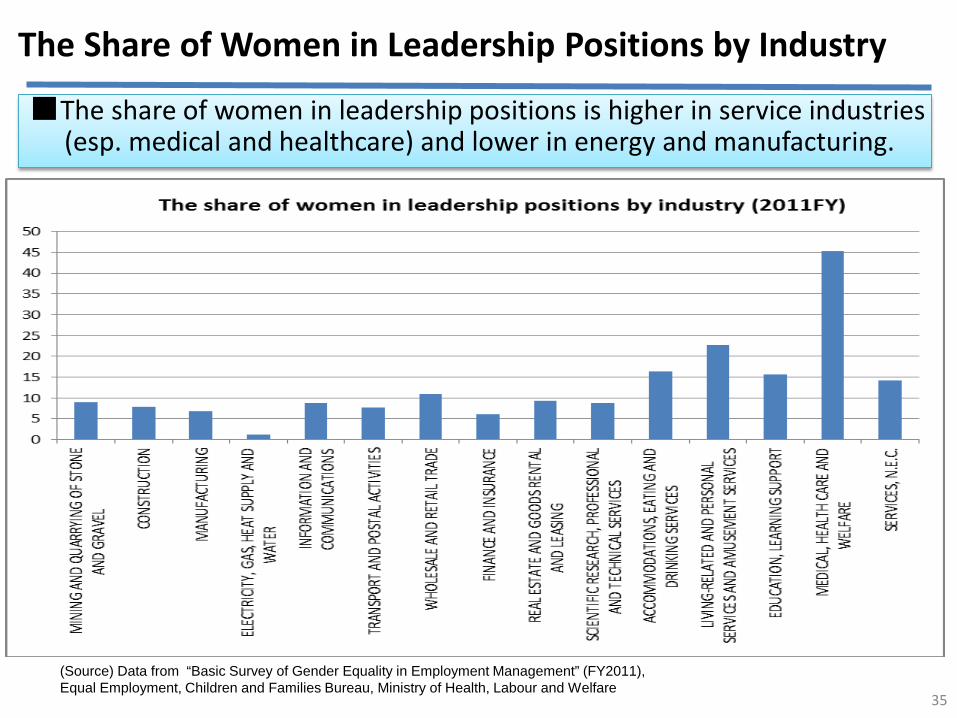
■The share of women in leadership positions is higher in service industries (esp. medical and healthcare) and lower in energy and manufacturing.
The Share of Women in Leadership Positions by Industry
35
(Source) Data from “Basic Survey of Gender Equality in Employment Management” (FY2011), Equal Employment, Children and Families Bureau, Ministry of Health, Labour and Welfare