promoting platform takeoff and self-fulfilling
TRANSCRIPT
1
Promoting Platform Takeoff and Self-Fulfilling Expectations:
Field Experimental Evidence
Kevin J. Boudreau*
Abstract. Many entrepreneurs and investors are attracted to platform businesses and the possibility of
harnessing powerful network effects. But, network effects can be the very reason why platform businesses
fail to takeoff, if users avoid platforms that do not already have a large installed base. The theoretical
literature on platforms and network effects predicts that the initial growth and takeoff of a platform crucially
depends on the market’s expectations of the future installed base. This paper tests this claim, reporting on
a field experiment in which invitations to join a newly launched platform were sent to 16,349 individuals
and included randomized statements regarding the future expected installed base (along with disclosures of
the current installed base). I find evidence consistent with subjective expectations playing a crucial role in
shaping early adoption and platform takeoff. Statements regarding expectations of the future installed base
more significantly affected adoption than did disclosures of the current installed base. Statements of larger
numbers of expected users caused more adoption than did smaller numbers. Statements of a smaller
installed base of users (whether current or expected) led to lower demand than did stating nothing at all.
The effect of stating subjective expectations by the platform became insignificant once the current installed
base grew larger. The response of adoption to expected numbers of users reveals patterns consistent with
the long-theorized chicken-and-egg problem and self-fulfilling expectations. The findings have significant
implications for the effective promotion, marketing, and “evangelism” of new platform ventures.
Keywords: Platforms, network effects, expectations, marketing, entrepreneurship, chicken-and-egg,
coordination games, online distributed work.
* Northeastern University DMSB & NBER: 417 Interdisciplinary Science & Engineering Complex 805 Columbus Ave, Boston, MA 02120, tel: 617-373-3241, fax: 617-373-3241 (e-mail: [email protected]). I wish to especially thank crucial personnel of supporting organizations and advisors, including Paras Babbar, James Bean, Maria Costa De Sousa, Hugh Courtney, Mavez Dabas, Nicole Danuwidjaja, Rick Davis, Sylvain Demortier, Anthony Donaldson, Eric Doroski, Raj Echambadi, Koreen Geisler-Wagner, Austen Keene, Afan Khan, Atif Khan, Abhinav Kharbanda, Dyan Khor, Raghavi Kirouchenaradjou, Satish Kumar Anbalagan, Sreerag Sreenath Mandakathil, Patrick McGrath, Tucker Marion, Patrick McGrath, Marc Meyer, Robert Hughes, Michael Orr, Olga Ozhereleva, Kaushik Padmanabhan, Edwige Poinssot, Fernando Suarez, Prathamesh Tajane, Nikin Tharan, Emery Trahan, Maureen Underhill, Robert Whelan, and Katie Wilhoit. For especially useful comments in conversations on this topic, I thank Dónal Crilly and Andrei Hagiu. This research also benefitted from joint data collection, collaboration, and thinking on related topics with Nilam Kaushik. I would also like to acknowledge generous financial support from the Kauffman Foundation (grant G00005624) and Northeastern DMSB. This research was determined to be IRB exempt (NUIRB180419). All errors are my own.

2
1. Introduction
Society now relies on online platforms as essential infrastructure for many economic, social, scientific,
health, education, and cultural activities (Evans and Gawer 2016, Parker et al. 2016, Ting et al. 2020).1
Continued innovation and service expansion in this area will require ongoing successful launches of new
platform ventures (Furman et al. 2019). Unfortunately, most platform ventures fail to take off (Noe and
Parker 2005, Evans and Schmalensee 2010). Theory suggests that this is because potential users are
reluctant to adopt platforms that do not already have a large installed base and network effects: the well-
known chicken-and-egg problem.2 The theory suggests that influencing consumers’ expectations of future
platform growth can help overcome this problem. Consumers who believe that a platform will eventually
take off will join the platform and thereby catalyze network effects (e.g., Katz and Shapiro 1985). Shapiro
and Varian (1999) write, “Managing consumer expectations is crucial in network markets. Your goal is to
convince customers... you will emerge as the victor. Such expectations can easily become a self-fulfilling
prophecy when network effects are strong.” Besen and Farrell (1994) specify that “expectations about the
ultimate size of a network are crucial.” This study tests this theory.
The idea that expectations can be self-fulfilling has become standard in the theoretical literature on
platforms (Hossain and Morgan 2009). When deciding whether to adopt a platform with network effects, a
consumer’s best decision is to do what others do.3 The theory implies a large-scale coordination problem
(e.g., Schelling 1960), whereby adopters should attempt to collectively adopt one platform, or another (if
1 The growing importance of platforms as a modern approach to organization is reflected in research attention from a growing number and variety of researchers and disciplines (e.g., Ghazawneh & Henfridsson, 2013; Iansiti & Lakhani, 2017; Suarez and Kirtley, 2012; Nambisan et al., 2017; Rietveld & Schilling, 2020; Rysman, 2009; Sundararajan, 2017; West, 2003). 2 See: Caillaud and Jullien (2003), Fath and Sarvary (2003), Hagiu and Eisenmann (2007), Ochs and Park (2010), Stummer et al. (2018). 3 Consider a market with two potential adopters, A and B. In this example, adoption costs are $1, and benefits are $2 if everyone adopts or $0 otherwise. There are two possible equilibria: “nobody adopts” and “everyone adopts.”
Consumer B Consumer A Not Adopt Adopt
Adopt (−1,0) (1,1) Not Adopt (0,0) (0,−1)

3
there are competitors), or none.4 If adopters cannot explicitly coordinate or communicate, this multiplicity
of possible equilibria creates fundamental uncertainty and ambiguity about which market outcome will
emerge. Accordingly, adopters cannot “look forward and reason back” as in usual rational expectations
(Hossain and Morgan, 2013) and expectations are subjective. Therefore, conventional means of influencing
rational expectations—e.g., economic signaling and pre-commitments—should not work as usual.
Absent rational expectations, theorists instead appeal to “focality” as the concept determining the
eventual market outcome. A focal equilibrium (or “focal point”) is the choice to which most people default
and which individuals expect others will choose (Schelling 1960, Mehta 1994). Therefore, focality and
expectations are closely intertwined. The platforms literature is silent on how focal expectations are formed
or influenced. Instead, theory has proceeded by presuming consumers follow some focal rule. Most models
in the literature assume, for example, that consumers choose the economically efficient outcome (e.g.,
Farrell and Klemperer 2007).5 In contrast, discussions of chicken-and-egg problems often implicitly
presume that consumers tend towards non-adoption as a default. More recent advances have begun to
consider alternative focal rules' competitive implications, such as adopting according to past market share
(Suleymanova and Wey 2012, Hagiu and Spulber 2013, Hagiu and Halaburda 2014, Halaburda and
Yehezkel 2019, Halaburda et al. 2020).
The empirical research does not yet study expectations in early platform growth. Instead, most
empirical models specify adoption as a function of the current or lagged installed base within a static
framework.6 Several exceptional studies estimate models with perfectly-forward-looking consumers (Dubé
et al. 2007, Rysman et al. 2011, Ryan and Tucker 2012). These approaches should be better suited to
4 Market coordination problems are either explicit or implied throughout literature on platforms, standards, and network effects (Augereau et al., 2006; Fang et al., 2020; Farrell & Klemperer, 2007; Farrell & Saloner, 1988; Hagiu & Spulber, 2013; Simcoe, 2012) 5 Related literatures examines whether markets get locked-in to inferior platforms (e.g., David 1985, Hossain and Morgan 2009, Hossain et al. 2011, Liebowitz and Margolis 2014) and when do markets tip (Cantillon & Yin, 2007; Ellison & Fudenberg, 2003; Hossain & Morgan, 2013). 6 E.g., Ackerberg & Gowrisankaran, 2006; Boudreau & Jeppesen, 2015; Chu & Manchanda, 2016; Corts & Lederman, 2009; Gupta et al., 1999; Nair et al., 2004; Saloner & Shepard, 1992; Shankar & Bayus, 2003; Tucker & Zhang, 2011; Wilbur, 2008

4
studying mature markets when eventual outcomes are clear. Thus, the theorized role of expectations in
coordinating earliest moments of adoption remains untested. This is the focus of this study.
2. Research Design
This study builds on a stream of field experiments studying platform adoption (e.g., Sun et al. 2019, Bapna
and Umyarov 2015). I most closely build on Tucker and Zhang's (2010) field experimental framework for
studying whether network effects exist on a large, mature Chinese B2B platform (Appendix A). Here I
study whether exposing 16,349 individuals to experimentally assigned statements regarding future installed
base (while controlling for the current installed base) affects adoption decisions in the context of an early
platform launch campaign.
2.1. Context
The product development platform in this study was created to serve students and alumni of a large US
university. This large R1 research-oriented university has approximately 20,000 undergraduate and 10,000
graduate students and has nationally ranked engineering, computer science, and business programs. The
Princeton Review indicates that 25th and 75th percentile SAT scores of admitted students are 690 and 790.
The platform mimics today’s in-person hackathons’ essential features, where people meet,
exchange ideas, and design prototypes. Distinct from usual hackathons, however, the platform was launched
to achieve grander scale and wider access to greater numbers of participants than a typical hackathon. The
platform now numbers over 5,500 participants. On the platform, individuals collaborate to design IoT-
related products (“applications”). IoT refers to systems that connect machines, infrastructure, and consumer
products and the intelligence created by those elements' data collection and networking. Collaborators can
develop their own ideas or respond to challenges issued by the platform or companies. Users were not
charged to participate on the platform but may have experienced non-pecuniary costs in the process of
learning about the platform and signing up. Further, in this context, signing up also implied the opportunity
cost of participating in a three-week part-time development project.

5
The experiment centered on the initial campaign to attract a critical mass of users within the first
60 business days following launch. Ensuring many users joined the platform was vital because the platform
depends on interactions among users and forming teams to work on new projects. Platform developers also
believed that adopters might respond to the number of companies on the platform.
2.2. Experimental Protocol and Treatments
2.2.1. Observable Potential Market
This experiment focused on a key risk set of potential adopters. This group included 16,349 students and
past graduates of the university with backgrounds in engineering, computer science (including data science
and information systems), and sciences (including natural sciences and mathematics). Table 1 summarizes
the characteristics of this group. In identifying potential adopters before the launch of the platform, both
adoption and non-adoption could be observed and recorded.7
<Table 1>
2.2.2. Invitations to Join the Platform
Each participant received an email invitation to join the platform (Appendix B) over the 60 business days.
Those who did not initially open the invitation were sent a reminder seven days later. The emails included
a brief description of the platform and invited the recipient to click-through to learn more and consider
joining.
2.2.3. Platform Sign-Up
Clicking-through from the email to the platform provided a description of the Internet of Things and of the
development activity that would take place on the platform. The description stated, too, that participating
on the platform could foster interactions, support learning of new skills, and lead to cash prizes. The
platform also presented a prominent “join and participate” button and could sign-in to become a member
7 The platform embedded other experiments and A/B tests during its launch in a way that was entirely orthogonal to and had no effect on this analysis.

6
using their LinkedIn credentials. LinkedIn API-accessible information and photographs then auto-
populated their platform member profiles.
2.3. Treatments and Random Assignment
The experimental treatments consisted of varying messages within the invitation to join (see Appendix B):
1. Expectation message: “We expect <#> users and <#> companies to join this year.”
2. Installed base disclosure: “To date, <#> users and <#> companies have joined.”
3. Total potential market scale statement: “The university community comprises 20,000 students,
200,000 alumni, and 2,000 staff and professors. There are also 4,000 affiliated companies.”
4. Early adoption emphasis statement: “This is an invitation for early adopters.”
Most central to the research question is statement (1) regarding the expected installed base.
Statement (2) discloses the current installed base and provides a useful control and a basis for comparing
the magnitude of effects with statement (1). Statements (3) and (4) provide further means of interpreting
the effect of statement (1), as discussed in Section 3.3.
2.3.1. Messages of Expected Installed Base
To ensure that statements were neither arbitrary nor misleading, stated expectations corresponded to the
platform developers' own forecasted scenarios. In relation to users, these scenarios included: 2,500 (low),
10,000 (medium), and 25,000 (high) users. For companies, these scenarios included: 10 (low), 25 (medium),
40 (high), and 100 (very high) companies.8 Different scenarios were combined in different treatments to
generate independent variation in numbers of expected users and expected companies (see Figure 2, panel
III). Platform developers decided on possible combinations to avoid nonsensical combinations (e.g.,
combinations of very lowest with highest scenarios, expectations lower than current levels) and to limit the
complexity of implementing the treatments.
8 The additional scenario for companies reflected greater uncertainty regarding the number of companies and potentially important differences in the operating model to support these different numbers. Nonetheless, the ratio between the lowest and highest scenarios was 10X for both users and companies.

7
2.3.2. Disclosures of Current Installed Base
To avoid deception, disclosures of the current installed base were based on the true current number of users
across the 60-day campaign. To acquire a nonarbitrary number of companies in the current installed base,
users were asked whether their companies would likely sponsor a challenge.
To then generate independent variation in numbers of users and companies, these values were each
intermittently and alternately updated from day to day (rather than tracking real-time values) to ensure
multiple numbers of users for each number of companies and vice versa.
2.3.3. Random Assignment Procedure
Platform developers randomly assigned individuals to treatments based on the following principles.
Individuals in the study group were first randomly assigned to receiving invitations across the campaign's
60 days. Each day, individuals were randomly assigned to receive a statement of expectations of the future
installed base (statement 1) or not, and disclosure of the current installed base (statement 2). Those receiving
statements of expectations were then randomly assigned to receive a particular combination of scenarios
for particular numbers. Everyone was randomly assigned to receive statements (3) or (4), both, or neither.
Panel III of Figure 2 summarized all possible combinations.
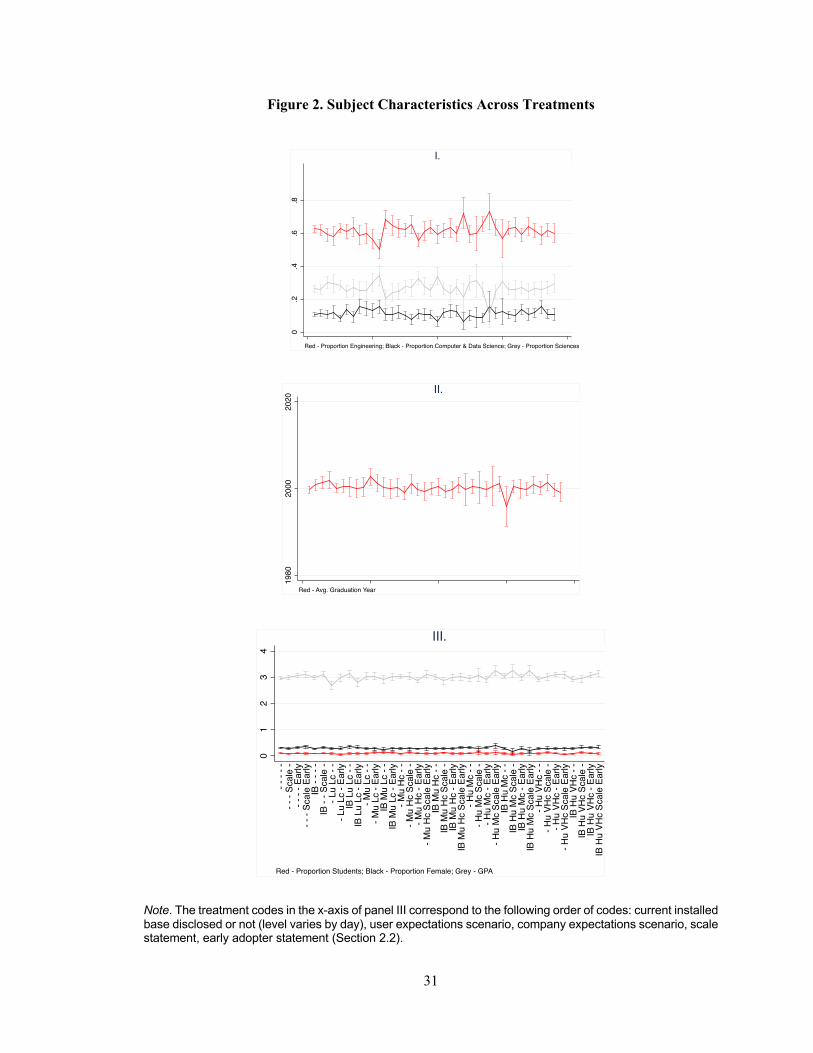
2.4. Randomization Checks
Randomization should ex-ante lead to equal treatment groups. Figures 1 and 2 explicitly check for balance
ex-post. Figure 1 describes the observable characteristics of individuals assigned across the 60 days. Figure
2 describes the observable characteristics of individuals assigned across all treatment combinations.
Characteristics are statistically identical in each case.
<Figure 1 >
<Figure 2>

8
3. Results
3.1. How does Stating Expectations of Installed Base Affect Adoption?
A probit model of the following form is estimated to relate the decision to adopt or participate on the
platform and the experimental treatments:9
𝑝𝑟𝑜𝑏{𝑃𝐴𝑅𝑇𝐼𝐶𝐼𝑃𝐴𝑇𝐼𝑂𝑁! = 1}
= Φ(𝛽" ∙ 𝑋! + 𝛽#𝐸𝑥𝑝𝑒𝑐𝑡𝑎𝑡𝑖𝑜𝑛𝑠𝑆𝑡𝑎𝑡𝑒𝑑! + 𝛽$𝐼𝑛𝑠𝑡𝑎𝑙𝑙𝑒𝑑𝐵𝑎𝑠𝑒𝐷𝑖𝑠𝑐𝑙𝑜𝑠𝑒𝑑!
+𝛽%𝐸𝑥𝑝𝑒𝑐𝑡𝑒𝑑𝑁𝑢𝑚𝑈𝑠𝑒𝑟𝑠! + 𝛽&𝐸𝑥𝑝𝑒𝑐𝑡𝑒𝑑𝑁𝑢𝑚𝐶𝑜𝑚𝑝𝑎𝑛𝑖𝑒𝑠!
+𝛽'𝐶𝑢𝑟𝑟𝑒𝑛𝑡𝑁𝑢𝑚𝑈𝑠𝑒𝑟𝑠! + 𝛽(𝐶𝑢𝑟𝑟𝑒𝑛𝑡𝑁𝑢𝑚𝐶𝑜𝑚𝑝𝑎𝑛𝑖𝑒𝑠!)
The function Φ is the cumulative standard normal distribution function. Individuals are indexed by
i. The 𝛽 terms are the coefficients to be estimated. X is a vector of individuals’ characteristics and controls.
The remaining variables relate to the treatments (Table 1). The model is estimated by maximum likelihood.
Model (1) of Table 2 reports estimates with just the ExpectationsStated indicator and a constant
included in the model. The average effect of stating expectations on the probability of participation is
statistically significant and negative. The effect translates to approximately a 1% drop in participation
relative to a 5% average participation rate, or one-fifth impact. Model (2) adds time controls (quadratic time
trend and day-of-week dummies), field of study (sciences omitted), gender, and graduation year. Adding
these controls has no impact on the estimated effect of stating expectations.
Model (3) replaces ExpectationsStated with the InstalledBaseDisclosed indicator, and model (4)
does the same while including all controls. The coefficient estimated on InstalledBaseDisclosed is
statistically zero. Including ExpectationsStated and InstalledBaseDisclosed at once, as in models (5) and
(6), leads to the same coefficient estimates as when estimating them separately. Therefore, these results
confirm that statements about expectations had a causal effect on participation.
9 All reported probit models generate similar patterns if estimated as linear probability models.

9
<Table 2>
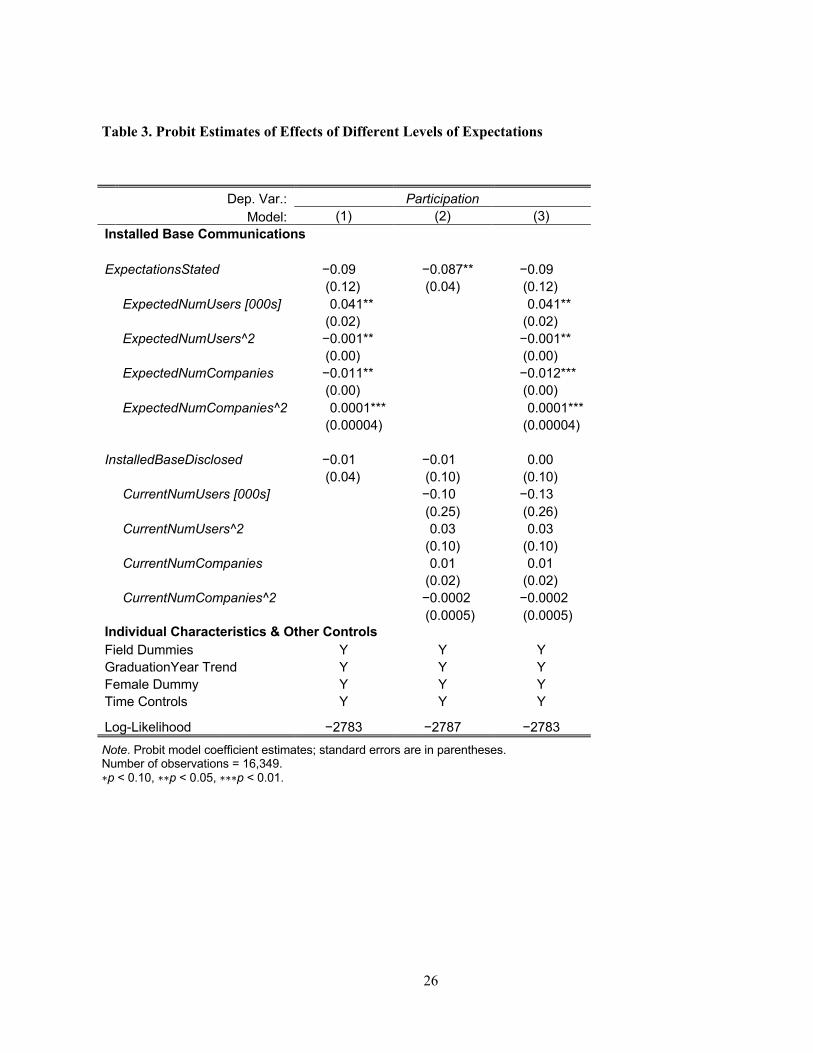
3.2. How Does Stating Different Levels of Expectations Affect Adoption?
This section evaluates whether stating different scenarios for future installed base affected platform
participation. Model (1) of Table 3 includes ExpectationsStated and adds first and second-order polynomial
terms for numbers of expected users and expected companies stated. Coefficient estimates indicate a
positive concave relationship between participation and ExpectedNumUsers, and a negative convex
relationship between the participation and ExpectedNumCompanies. Estimates are insensitive to the
inclusion of model controls or not, or inclusion of the current installed base, as in model (3). Consistent
with Table 3 results, coefficients on the current installed base are insignificant, as in models (2) and (3).
Table 4 presents the relationship re-estimated with the different expectations scenarios specified as
dummies in a linear probability model to reveal effect magnitudes explicitly. Controlling for the current
installed base measures or not, as in models (1) and (2), finds similar results.10 The negative convex
relationship with ExpectedCompanies is driven by higher adoption in the lowest scenario (10 companies
expected). The positive concave relationship with ExpectedNumUsers, also reported graphically in Figure
3, shows that stating the lowest scenario (2,500 users) leads to statistically lower participation than making
no statement at all. Point estimates increase with higher scenarios, but with large confidence intervals.
<Table 3>
<Table 4>
<Figure 3>
10 Controls are not included in this most flexible specification, as they lead to large standard errors.

10
3.3. Validation of Interpretation
The significant effects of statements of expectations might be capturing a response to a statement of large
scale per se. To check this possibility, all prior models were re-estimated with a variable capturing an
objective indication of market scale. This is an indicator switched on for statement (3): “The university
community comprises 20,000 students, 200,000 alumni, and 2,000 staff and professors. There are also 4,000
affiliated companies.” I find that being randomly assigned to receive this statement has statistically zero
effect on participation rates and does not alter prior results. Therefore, the analysis of expectations does not
appear to be capturing scale of the potential market, but rather expectations of what those in the potential
market might choose to do.
Similarly, an indicator variable associated with the statement, “This is an invitation for early
adopters,” was found to be insignificant. This is consistent with subjects receiving these invitations already
being well aware of the early stage of adoption without further prompting.
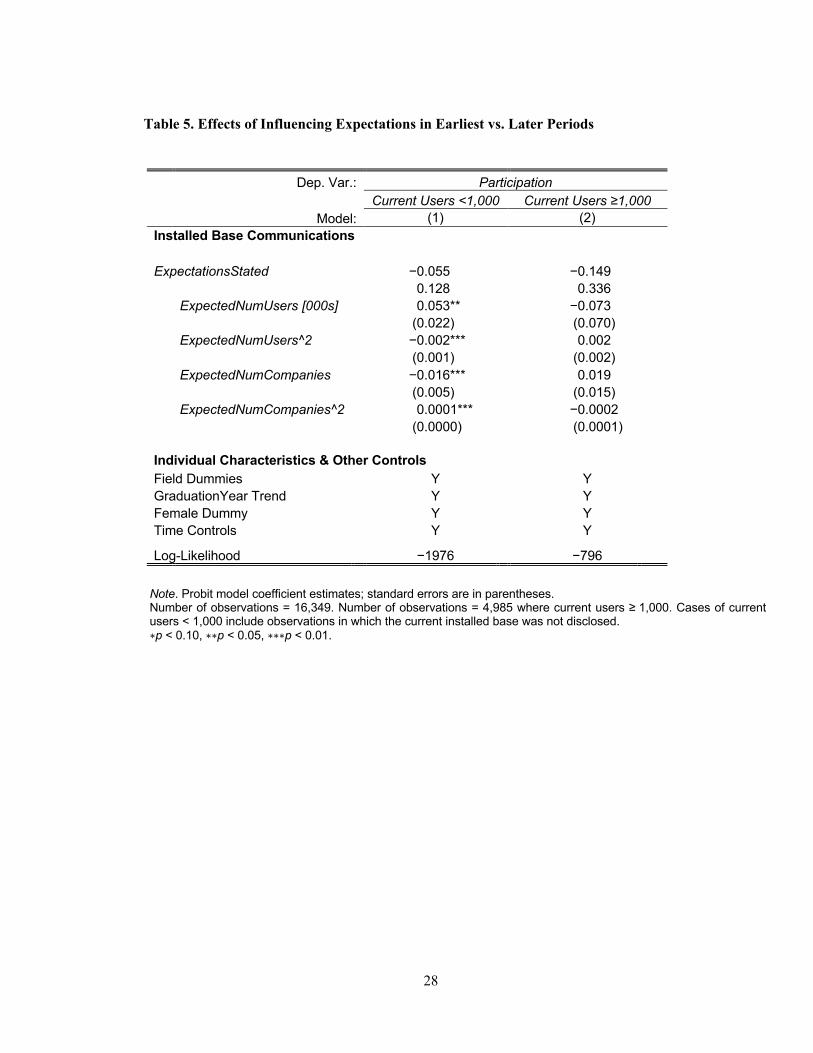
3.4. Is the Market More Susceptible to Focal Cues in Early Periods?
The theory suggests that subjective expectations are most important in early market coordination. To assess
this possibility, I compare estimates when the stated installed base exceeds 1,000 users or not.
The breakpoint of 1,000 users first requires justification given that earlier models did not detect a
relationship with NumCurrentUsers. To more closely scrutinize this relationship, I re-estimate the
relationship with each level of NumCurrentUsers as a dummy in a linear framework, reported in Figure 4.
Individual coefficients are mostly insignificant. Nonetheless, statistical facts appear in the results.
For example, participation is lower with the lowest levels of disclosed installed base than when stating
nothing at all (analogous to earlier results, related to stating user expectations).
Most relevant to the breakpoint choice, each point estimate of coefficients for 1,000 users or greater
has a higher value than the point estimate for not stating the installed base at all. If these values after 1,000
users were in fact the same as those when not stating the installed base, the likelihood of observing this
pattern would be (½)^21—or virtually zero.

11
<Figure 4>
Models (1) and (2) of Table 5, therefore, compare model estimates for those cases in which the
disclosed installed base exceeded 1,000 versus not. Consistent with the theory, expectations terms become
insignificant, where the stated installed base exceeded 1,000 users.
<Table 5>
3.5. Does Stating Expectations Affect Heterogeneity of Responses?
Here I investigate whether statements of the expected future or disclosed current installed base affected
variance in outcomes. I re-estimate the probit model, allowing for model variance to vary as 𝜎!$ =
{exp(𝛾" + 𝛾#𝐸𝑥𝑝𝑒𝑐𝑡𝑎𝑡𝑖𝑜𝑛𝑠𝑆𝑡𝑎𝑡𝑒𝑑! + 𝛾$𝐼𝑛𝑠𝑡𝑎𝑙𝑙𝑒𝑑𝐵𝑎𝑠𝑒𝐷𝑖𝑠𝑐𝑙𝑜𝑠𝑒𝑑!)}$, where 𝛾 terms are parameters.
The variance parameters, along with main model, are estimated simultaneously using maximum likelihood.
Mean model estimates are unaffected by this alternative specification. Table 6 reports the variance
model estimates. As in model (1), stating the current true installed base lowers variance, all else being equal.
Stating subjective expectations increases variance. Similar results are found when allowing mean model
terms to interact with an indicator for greater than 1,000 users, as in model (2), or when estimating each
variance coefficient in separate models.
<Table 6>
4. Discussion of Results
This section discusses the findings reported in the preceding section.
4.1. Subjective Expectations are Crucial in Earliest Periods of Takeoff
The results include an array of patterns that are each consistent with the theory’s predicted role of
subjective expectations in the earliest periods of platform launch. Exposing individuals to statements of

12
expectations of the future installed base shifted adoption rates by one-fifth relative to average levels
(Section 3.1). The effect of expectations was more significant than disclosing the actual installed base size
during early takeoff (Sections 3.1 and 3.2). The large causal effects of statements of expectations ceased to
be significant once the disclosed installed base grew past 1,000 users (Section 3.4).
The statements of expectations to which adopters responded were themselves highly subjective and
uncertain (varying between low and high scenarios by a factor of 10X) (Section 2.3.1). Nonetheless,
adoption rates varied systematically according to the scenario to which individuals were exposed (Section
3.2).
Also consistent with subjective heterogeneous responses to these statements, exposing individuals
to statements of expectations led to increased variance in the estimation model (Section 3.5). (By contrast,
disclosures of the true current installed base reduced variance, consistent with converging expectations.)
4.2. Self-Fulfilling Expectations and the Chicken-and-Egg Problem
The shifts in adoption rates with expected future users' statements are also consistent with the long-
theorized chicken-and-egg problem (see Section 1). Stating low expectations for future users caused lower
adoption than stating nothing at all. Stating low current users caused lower adoption than stating nothing at
all (Section 3.2 and Figure 4). It appears it is better for the platform to allow uncertainty to linger rather
than to alleviate uncertainty in a way that confirms a platform has or expects few users. Also consistent
with self-fulfilling expectations, stating either optimistic expectations of the number of users or stating high
numbers of current users results in higher adoption than does stating lower numbers (Section 3.2).
When stating high user expectations, rates of adoption do not rise to a level of becoming statistically
different from those when stating no expectations at all within the observed variation here. It remains a
question whether stating still higher expectations or perhaps otherwise making more persuasive statement
could have led adoption to become statistically higher. When stating high numbers of existing users,
adoption rates statistically exceeded those when not stating anything.
Thus, these results lend support to longtime untested claims of focal expectations shaping platform
takeoff (e.g., Farrell and Saloner 1985, Katz and Shapiro 1985, Farrell and Klemperer 2007, Hagiu and

13
Halaburda 2011, Suleymanova and Wey 2012, Zhu and Iansiti 2012, Halaburda and Yehezkel 2018,
Halaburda et al. 2020).
These results, summarized in this subsection and the earlier subsection 4.1 reflect tests of general
theory regarding platform adoption in a context of multiple equilibria and a market coordination problem.
Therefore, these results should generalize to relatively typical platform conditions, i.e.: where user benefits
come mostly from network effects (rather than stand-alone benefits), where adoption is costly, and potential
adopters are not able to explicitly coordinate their adoption decisions.
4.3. Negative Cross-Side Interactions in a Collaborative Contest Platform
The analysis also found negative cross-side interactions between user adoption and expected
numbers of companies (Section 3.2). This result adds to prior findings of negative network effects (e.g.,
Church and Gandal 1992, Economides 1996, Augereau et al. 2006, Tucker and Zhang 2010), and is notable
for being consistent with the platform’s institutional design, supporting collaborative challenges.
A negative cross-platform network effect in this context is consistent with the addition of more
companies effectively splitting-up users across multiple challenges, with the effect of reducing users’ ability
to find and collaborate with others. This result is also consistent with users possibly preferring that the
platform emphasize users’ learning, development, and community networking (Section 2), rather than
emphasizing problem-solving for companies.
4.4. The Ability of a Platform to Influence Expectations
While this study’s primary thrust was to test the role and nature of expectations in shaping platform takeoff,
the research design approach was to influence expectations. That expectations could be influenced—at all—
much less by the platform, is a novel and consequential finding. Particularly, we find that simple, subjective,
uncommitted, and costless (“cheap talk”) statements broadcasted by the platform could influence market
expectations in early platform takeoff. The generalizability of this result and the ability and means for other
platforms to similarly influence expectations depends on the underlying mechanisms. Here, I speculate on
three plausible explanations.

14
Statements Serve as Coordinating Devices? A first possibility, closest to the theory, is that the
platform’s statements served as focal cues and coordinating devices (Schelling, 1962; Mehta, 1994; Sitzia
and Zheng, 2019). For example, adopters could have made adoption decisions under the expectation that
some fraction of others would act in accordance with the broadcasted statements. This interpretation
presumes that (i) the statements were deemed highly focal by adopters, and (ii) adopters engaged in higher-
order reasoning to assess and respond to others’ expected behavior.
This explanation of the salience of platform’s statements leading to some measure of coordinated
decisions is closest to the theory (Section 1). It is akin too to findings from coordination games in the lab,
in which labels and language to describe alternative actions have been shown to significantly increase the
likelihood of coordination (e.g., Mehta et al. 1994a, Bacharach and Bernasconi 1997, Parravano and
Poulsen 2015). In this light, the current results might be likened to prior characterizations of platforms as a
leader with a coordinating role within their “ecosystems” (Boudreau, 2017; Boudreau and Hagiu, 2009;
Gawer and Cusumano, 2002).
Statements Serve as Information? An alternative explanation is that users perceived the platform’s
statements as genuinely informative, at least to some degree, and users respond accordingly. This
interpretation requires that (i) the platform indeed had private information on future adoption (despite the
fundamental uncertainty of market coordination) and (ii) potential users had some basis to believe the
platform’s statements were credible (otherwise users might expect a platform will always make optimistic
statements).11
In this context, perhaps users believed the platform’s central network position between alumni and
students led adopters to think the platform was able to carry out meaningful market research.12 (This was
11 The long tradition of research on cheap talk and coordination games (e.g., Crawford and Sobel 1982, Farrell and Rabin 1996) shows that a player in a coordination game can send a no-cost, uncommitted, and unverifiable message to induce others to coordinate on a particular choice—so long as players’ interests are somewhat aligned. However, in this context, the platform is not a player in the game, but effectively a third-party observer of market coordination. 12 Strictly speaking, the communication of adopters’ intent to a platform with market research involves a similar problem of sending a credible message regarding uncommitted future choices.

15
not true in this case, and the true high degree of uncertainty of platform developers was reflected in the
wide-ranging scenarios described in Section 2.3.) In this context, users could also anticipate that the
platform would disclose information truthfully. The platform both had a valuable reputation to uphold and,
as a university, would act in the interest of students and alumni. Indeed, strenuous efforts were made to
avoid deception (Section 2).
Statements Serve as Persuasion? A third explanation is that boundedly rational adopters responded
to plausible statements at face value. They were persuadable and indeed persuaded, despite the absence of
a fully rational basis for accepting the statements as truly informative. This interpretation might be
especially relevant in early market coordination with (i) an ambiguous and uncertain decision environment,
and in which (ii) potential adopters are perhaps boundedly rational and susceptible to persuasion.13
In this context, for example, the credulity of adopters could have been influenced by plausible
statements coming from a sociologically legitimate authority—a university-sponsored platform. Outside of
this context, this interpretation implies there could be considerable scope for talented and charismatic
communicators and storytellers to deploy rhetoric and moral suasion to generate optimistic beliefs within
an ambiguous decision environment.
5. Conclusion
Central to platform adoption theories is the idea that market expectations can play a role in
determining whether a new platform venture takes off or not. This paper implemented a first systematic
empirical investigation of the causal role of expectations in the launch of platform ventures. We investigated
this question using a field experiment embedded in the launch campaign of a platform for a collaborative
hackathon, during which the platform grew to several thousand users.
The study’s results of Section 3 and summarized in Section 4 confirm a series of patterns that are
consistent with subjective expectations playing a crucial role in the earliest platform growth and takeoff.
13 Large literatures on persuasion point to a range of behavioral, cognitive, economic, and socio-psychological mechanisms that far exceed the scope of this study.

16
Also consistent with theory, the patterns are consistent with the existence of a chicken-and-egg problem in
early adoption and that expectations can be self-fulfilling. Optimistic expectations of the future installed
base of users might help overcome this problem and negative expectations will deter adoption. In this
particular instance, the platform’s stating nothing regarding the future installed base of users was more
helpful to stimulating growth than stating low expectations
Perhaps most important of all, I found—in this context—that simple, subjective, uncommitted, and
costless (“cheap talk”) statements broadcasted by the platform could influence market expectations in early
platform takeoff. In Section 4, I speculated on the mechanisms underlying this finding, suggesting that
platform’s statements could work as a coordinating device, as information, or as persuasion. Better
understanding these mechanisms and the extent to which other platforms might influence expectations—
and how—remains an area of much needed future research.
The findings here imply important implications for managers, investors, entrepreneurs, and
marketers. Platform growth and takeoff involves more than just acquiring adopters one-at-a-time; to
succeed in takeoff, a platform must coordinate multiple adopters to join the platform, at once, under most
typical circumstances. Influencing the market’s focal expectations of the future installed base’s size is a
means of getting this done. Consistent with the findings, leading platforms often use media and events to
socialize optimistic commonly-shared narratives of the future (see, for example, Lucas-Conwell 2006,
Kawasaki 2015) and pessimistic narratives about competitors (Pfaffenberger 2000, Raymond 2001, Egyedi
and Hommels 2019). This emphasis on nuanced issues of shaping beliefs and expectations (Section 4.4)
may explain why 2,330 chief marketers on Linkedin now describe themselves as “chief evangelists.”

17
References
Ackerberg, D. A., & Gowrisankaran, G. (2006). Quantifying equilibrium network externalities in the ACH
banking industry. The RAND Journal of Economics, 37(3), 738–761.
Augereau, A., Greenstein, S., & Rysman, M. (2006). Coordination versus differentiation in a standards war:
56k modems. The RAND Journal of Economics, 37(4), 887–909.
Bacharach, M., & Bernasconi, M. (1997). The variable frame theory of focal points: An experimental study.
Games and Economic Behavior, 19(1), 1–45.
Besen, S. M., & Farrell, J. (1994). Choosing how to compete: Strategies and tactics in standardization.
Journal of Economic Perspectives, 8(2), 117–131.
Boudreau, K. J. (2012). Let a thousand flowers bloom? An early look at large numbers of software app
developers and patterns of innovation. Organization Science, 23(5), 1409–1427.
Boudreau, K. J. (2017). Platform Boundary Choices & Governance: Opening-Up While Still Coordinating
and Orchestrating. Entrepreneurship, Innovation and Platforms. AGJ Furman, BS Silverman, S.
Stern. Emerald Publishing Limited, 37, 227–297.
Boudreau, K. J., & Hagiu, A. (2009). Platform rules: Multi-sided platforms as regulators. In Platforms,
Markets and Innovation. pp.163-191 Edward Elgar Publishing, 2009..
Boudreau, K. J., & Jeppesen, L. B. (2015). Unpaid crowd complementors: The platform network effect
mirage. Strategic Management Journal, 36(12), 1761–1777.
Cantillon, E., & Yin, P.-L. (2007). How and when do markets tip? Lessons from the Battle of the Bund.
mimeo.
Chu, J., & Manchanda, P. (2016). Quantifying cross and direct network effects in online consumer-to-
consumer platforms. Marketing Science, 35(6), 870–893.
Church, J., & Gandal, N. (1992). Network effects, software provision, and standardization. The Journal of
Industrial Economics, 85–103.
Corts, K. S., & Lederman, M. (2009). Software exclusivity and the scope of indirect network effects in the
US home video game market. International Journal of Industrial Organization, 27(2), 121–136.

18
Crawford, V. P., & Sobel, J. (1982). Strategic information transmission. Econometrica: Journal of the
Econometric Society, 1431–1451.
David, P. A. (1985). Clio and the Economics of QWERTY. The American Economic Review, 75(2), 332–
337.
Dubé, J.-P., Hitsch, G., & Chintagunta, P. (2007). Dynamic standards competition and tipping: The case of
32/64 Bit Video Game Consoles. Manuscript, Chicago GSB.
Economides, N. (1996). Network externalities, complementarities, and invitations to enter. European
Journal of Political Economy, 12(2), 211–233.
Egyedi, T. M., & Hommels, A. (2019). Predatory Strategies in Standards Wars: On Creating Fear,
Uncertainty, and Doubt. In Corporate Standardization Management and Innovation (pp. 234–255).
IGI Global.
Ellison, G., & Fudenberg, D. (2003). Knife-edge or plateau: When do market models tip? The Quarterly
Journal of Economics, 118(4), 1249–1278.
Evans, D. S. (2009). How catalysts ignite: The economics of platform-based start-ups. Platforms, Markets
and Innovation, 416.
Evans, D. S. (2016). Multisided platforms, dynamic competition, and the assessment of market power for
internet-based firms. University of Chicago Coase-Sandor Institute for Law & Economics Research
Paper, 753.
Evans, D. S., & Schmalensee, R. (2010). Failure to launch: Critical mass in platform businesses. Review of
Network Economics, 9(4).
Evans, P. C., & Gawer, A. (2016). The rise of the platform enterprise: A global survey.
Fang, T. P., Wu, A., & Clough, D. R. (2020). Platform diffusion at temporary gatherings: Social
coordination and ecosystem emergence. Strategic Management Journal.
Farrell, J., & Klemperer, P. (2007). Coordination and lock-in: Competition with switching costs and
network effects. Handbook of Industrial Organization, 3, 1967–2072.
Farrell, J., & Rabin, M. (1996). Cheap talk. Journal of Economic Perspectives, 10(3), 103–118.

19
Farrell, J., & Saloner, G. (1985). Standardization, compatibility, and innovation. The RAND Journal of
Economics, 70–83.
Farrell, J., & Saloner, G. (1988). Coordination through committees and markets. The RAND Journal of
Economics, 235–252.
Fath, G., & Sarvary, M. (2003). Adoption dynamics in buyer-side exchanges. Quantitative Marketing and
Economics, 1(3), 305–335.
Furman, J., Coyle, D., Fletcher, A., McAules, D., & Marsden, P. (2019). Unlocking digital competition:
Report of the digital competition expert panel. Report Prepared for the Government of the United
Kingdom, March.
Gawer, A., & Cusumano, M. A. (2002). Platform leadership: How Intel, Microsoft, and Cisco drive
industry innovation (Vol. 5). Harvard Business School Press Boston, MA.
Ghazawneh, A., & Henfridsson, O. (2013). Balancing platform control and external contribution in third-
party development: The boundary resources model. Information Systems Journal, 23(2), 173–192.
Gupta, S., Jain, D. C., & Sawhney, M. S. (1999). Modeling the evolution of markets with indirect network
externalities: An application to digital television. Marketing Science, 18(3), 396–416.
Hagiu, A., & Eisenmann, T. (2007). A staged solution to the catch-22.
Hagiu, A., & Halaburda, H. (2011). Expectations, network effects and platform pricing. Harvard Business
School.
Hagiu, A., & Spulber, D. (2013). First-party content and coordination in two-sided markets. Management
Science, 59(4), 933–949.
Halaburda, H., Jullien, B., & Yehezkel, Y. (2020). Dynamic competition with network externalities: How
history matters. The RAND Journal of Economics, 51(1), 3–31.
Halaburda, H., & Yehezkel, Y. (2018). How beliefs affect platform competition. Journal of Economics and
Management Strategy.
Hellwig, C. (2000). Public Information, Private Information and the Multiplicity of Equilibria in Co-
ordination Games. LSE Financial Markets Group.

20
Hossain, T., Minor, D., & Morgan, J. (2011). Competing matchmakers: An experimental analysis.
Management Science, 57(11), 1913–1925.
Hossain, T., & Morgan, J. (2009). The quest for QWERTY. American Economic Review, 99(2), 435–40.
Hossain, T., & Morgan, J. (2013). When do markets tip? A cognitive hierarchy approach. Marketing
Science, 32(3), 431–453.
Iansiti, M., & Lakhani, K. R. (2017). Managing our hub economy.
Katz, M. L., & Shapiro, C. (1985). Network externalities, competition, and compatibility. The American
Economic Review, 75(3), 424–440.
Katz, M. L., & Shapiro, C. (1994). Systems competition and network effects. Journal of Economic
Perspectives, 8(2), 93–115.
Kawasaki, G. (1992). Selling the dream. HarperBusiness.
Kawasaki, G. (2004). The art of the start: The time-tested, battle-hardened guide for anyone starting
anything. Penguin.
Kawasaki, G. (2012). Enchantment: The art of changing hearts, minds and actions. Penguin UK.
Kawasaki, G. (2015). The art of evangelism. Harvard Business Review, 93(5), 108–111.
Liebowitz, S., & Margolis, S. E. (2014). Path dependence and lock-in. Edward Elgar Publishing.
Lucas-Conwell, F. (2006). Technology evangelists: A leadership survey. Prepared for the SDForum
Conference on “Technology Leadership and Evangelism in the Participation Age, 4.
Maher, J. H. (2015). Software evangelism and the rhetoric of morality: Coding justice in a digital
democracy. Routledge.
Mehta, J., Starmer, C., & Sugden, R. (1994). Focal points in pure coordination games: An experimental
investigation. Theory and Decision, 36(2), 163–185.
Nair, H., Chintagunta, P., & Dubé, J.-P. (2004). Empirical analysis of indirect network effects in the market
for personal digital assistants. Quantitative Marketing and Economics, 2(1), 23–58.
Nambisan, S., Lyytinen, K., Majchrzak, A., & Song, M. (2017). Digital Innovation Management:
Reinventing innovation management research in a digital world. Mis Quarterly, 41(1).

21
Noe, T., & Parker, G. (2005). Winner take all: Competition, strategy, and the structure of returns in the
internet economy. Journal of Economics & Management Strategy, 14(1), 141–164.
Ochs, J., & Park, I.-U. (2010). Overcoming the coordination problem: Dynamic formation of networks?
Journal of Economic Theory, 145, 689–720.
Parker, G. G., Van Alstyne, M. W., & Choudary, S. P. (2016). Platform Revolution: How Networked
Markets Are Transforming the Economy? and How to Make Them Work for You. WW Norton &
Company.
Parravano, M., & Poulsen, O. (2015). Stake size and the power of focal points in coordination games:
Experimental evidence. Games and Economic Behavior, 94, 191–199.
https://doi.org/10.1016/j.geb.2015.05.001
Pfaffenberger, B. (2000). The rhetoric of dread: Fear, uncertainty, and doubt (FUD) in information
technology marketing. Knowledge, Technology & Policy, 13(3), 78–92.
Raymond, E. S. (2001). Why Microsoft smears-and fears-open source. IEEE Spectrum, 38(8), 14–15.
Rietveld, J., & Schilling, M. A. (2020). Platform Competition: A Systematic and Interdisciplinary Review
of the Literature. Journal of Management, Forthcoming.
Ryan, S. P., & Tucker, C. (2012). Heterogeneity and the dynamics of technology adoption. Quantitative
Marketing and Economics, 10(1), 63–109.
Rysman, M. (2009). The economics of two-sided markets. Journal of Economic Perspectives, 23(3), 125–
43.
Rysman, M., Gowrisankaran, G., & Park, M. (2011). Measuring Network Effects in a Dynamic
Environment. Boston University-Department of Economics.
Saloner, G., & Shepard, A. (1992). Adoption of technologies with network effects: An empirical
examination of the adoption of automated teller machines. National Bureau of Economic Research.
Schelling, T. C. (1960). The strategy of conflict. Harvard university press.
Shankar, V., & Bayus, B. L. (2003). Network effects and competition: An empirical analysis of the home
video game industry. Strategic Management Journal, 24(4), 375–384.

22
Shapiro, C., & Varian, H. R. (1999). The art of standards wars. California Management Review, 41(2), 8–
32.
Simcoe, T. (2012). Standard setting committees: Consensus governance for shared technology platforms.
American Economic Review, 102(1), 305–36.
Stummer, C., Kundisch, D., & Decker, R. (2018). Platform launch strategies. Business & Information
Systems Engineering, 60(2), 167–173.
Suarez, F. F., & Kirtley, J. (2012). Dethroning an established platform. MIT Sloan Management Review,
53(4), 35-41.
Suleymanova, I., & Wey, C. (2012). On the role of consumer expectations in markets with network effects.
Journal of Economics, 105(2), 101–127.
Sundararajan, A. (2017). The sharing economy: The end of employment and the rise of crowd-based
capitalism. Mit Press.
Ting, D. S. W., Carin, L., Dzau, V., & Wong, T. Y. (2020). Digital technology and COVID-19. Nature
Medicine, 26(4), 459–461.
Tucker, C., & Zhang, J. (2010). Growing two-sided networks by advertising the user base: A field
experiment. Marketing Science, 29(5), 805–814.
Tucker, C., & Zhang, J. (2011). How does popularity information affect choices? A field experiment.
Management Science, 57(5), 828–842.
West, J. (2003). How open is open enough?: Melding proprietary and open source platform strategies.
Research Policy, 32(7), 1259–1285.
Weyl, E. G. (2010). A price theory of multi-sided platforms. American Economic Review, 100(4), 1642–
72.
Wilbur, K. C. (2008). A two-sided, empirical model of television advertising and viewing markets.
Marketing Science, 27(3), 356–378.
Wu, A., Clough, D., & Kaletsky, S. (2019). Nascent Platform Strategy: Overcoming the Chicken-or-Egg
Dilemma. Harvard Business School Working Paper.

23
Xu, L. (2020). New tech infrastructure will help economies recover after COVID-19. World Economic
Forum.
Zhu, F., & Iansiti, M. (2012). Entry into platform-based markets. Strategic Management Journal, 33(1),
88–106.

24
Table 1. Summary Statistics
Variable Mean Std. Dev. Description
Participation 0.05 0.21 Indicator variable switched to one where the individual chooses to join the platform
ExpectationsStated 0.68 0.47 Indicator variable switched to one for individuals receiving an invitation that included some message of expectations
ExpectedNumUsers 11,304 10,414 The number of users contained in the statement of expectations, for invitations containing expectations
ExpectedNumCompanies 34.43 37.39 The number of companies contained in the statement of expectations, for those invitations containing invitations
InstalledBaseDisclosed 0.44 0.50 Indicator variable switched to one for individuals receiving an invitation that included a disclosure of current installed base
CurrentNumUsers 674 981 The number of users on the platform contained in the disclosure of current installed base
CurrentNumCompanies 8.08 13.12 The number of companies on the platform contained in the disclosure of current installed base
Engineering 0.62 0.49 Undergraduate degree in engineering ComputerScience 0.11 0.31 Undergraduate degree in computer science Sciences 0.27 0.44 Undergraduate degree in sciences GraduationYear 2000 18 Year of graduation Student 0.10 0.29 Not yet graduated college
GraduationYear 0.33 0.47 Indicator switched on if field is computer science, engineering, or sciences
Female 0.29 0.46 Gender indicator switched to one for female Note. Number of observations = 16,349.

25
Table 2. Probit Estimates of Effects of Stating Expectations
Dep. Var.: Participation Model: (1) (2) (3) (4) (5) (6) Installed Base Communications
ExpectationsStated −0.089** −0.090** −0.088** −0.087**
(0.04) (0.04) (0.04) (0.04) InstalledBaseDisclosed −0.02 −0.03 −0.01 −0.01
(0.03) (0.04) (0.04) (0.04) Individual Characteristics
ComputerScience 0.336*** 0.334*** 0.336***
(0.06) (0.06) (0.06) Engineering 0.193*** 0.194*** 0.193***
(0.05) (0.05) (0.05) GraduationYear 0.023*** 0.023*** 0.023***
(0.00) (0.00) (0.00) Female −(0.02) −(0.02) −(0.02)
(0.04) (0.04) (0.04) Other Controls
Day −0.01 −0.01 −0.01
(0.01) (0.01) (0.01) Day^2 0.00 0.00 0.00
(0.00) (0.00) (0.00) Tuesday −0.02 −0.02 −0.02
(0.06) (0.06) (0.06) Wednesday 0.06 0.06 0.06
(0.05) (0.05) (0.05) Thursday −0.102* −0.102* −0.102*
(0.06) (0.06) (0.06) Friday −0.09 −0.09 −0.09
(0.06) (0.06) (0.06) Month = Sept 0.11 0.12 0.11
(0.08) (0.08) (0.08) Month = Oct 0.05 0.06 0.05
(0.14) (0.14) (0.14) Constant −1.634*** −1.683*** −1.630*** (0.03) (0.02) (0.03) Log-Likelihood −3007 −2787 −3010 −2790 −3007 −2787
Note. Probit model coefficient estimates; standard errors are in parentheses. Number of observations = 16,349. ∗p < 0.10, ∗∗p < 0.05, ∗∗∗p < 0.01.
26
Table 3. Probit Estimates of Effects of Different Levels of Expectations
Dep. Var.: Participation Model: (1) (2) (3) Installed Base Communications
ExpectationsStated −0.09 −0.087** −0.09 (0.12) (0.04) (0.12) ExpectedNumUsers [000s] 0.041** 0.041** (0.02) (0.02) ExpectedNumUsers^2 −0.001** −0.001** (0.00) (0.00) ExpectedNumCompanies −0.011** −0.012*** (0.00) (0.00) ExpectedNumCompanies^2 0.0001*** 0.0001*** (0.00004) (0.00004) InstalledBaseDisclosed −0.01 −0.01 0.00 (0.04) (0.10) (0.10) CurrentNumUsers [000s] −0.10 −0.13 (0.25) (0.26) CurrentNumUsers^2 0.03 0.03 (0.10) (0.10) CurrentNumCompanies 0.01 0.01 (0.02) (0.02) CurrentNumCompanies^2 −0.0002 −0.0002 (0.0005) (0.0005) Individual Characteristics & Other Controls Field Dummies Y Y Y GraduationYear Trend Y Y Y Female Dummy Y Y Y Time Controls Y Y Y Log-Likelihood −2783 −2787 −2783
Note. Probit model coefficient estimates; standard errors are in parentheses. Number of observations = 16,349. ∗p < 0.10, ∗∗p < 0.05, ∗∗∗p < 0.01.

27
Table 4. OLS Dummy Estimates of Effects of Levels of Expectations
Dep. Var.: Participation Model: (1) (2) Expected Installed Base = not stated 0.051*** 0.051*** (0.003) (0.003) ExpectedNumUsers = 2,500 0.022** 0.022** (0.010) (0.010) ExpectedNumUsers = 10,000 0.038*** 0.039*** (0.003) (0.004) ExpectedNumUsers = 25,000 0.043*** 0.040*** (0.004) (0.005) ExpectedNumCompanies = 10 0.021*** 0.021*** (0.007) (0.007) ExpectedNumCompanies = 25 -0.003 -0.003 (0.006) (0.006) ExpectedNumCompanies = 100 Excluded Excluded Quadratic Installed Base Terms Y Adjusted-R^2 0.046 0.046 Note. OLS model coefficient estimates; standard errors are in parentheses. Number of observations = 16,349. Model (2) estimates are used in Figure 3. ∗p < 0.10, ∗∗p < 0.05, ∗∗∗p < 0.01.
28
Table 5. Effects of Influencing Expectations in Earliest vs. Later Periods
Dep. Var.: Participation Current Users <1,000 Current Users ≥1,000 Model: (1) (2)
Installed Base Communications
ExpectationsStated −0.055 −0.149 0.128 0.336 ExpectedNumUsers [000s] 0.053** −0.073 (0.022) (0.070) ExpectedNumUsers^2 −0.002*** 0.002 (0.001) (0.002) ExpectedNumCompanies −0.016*** 0.019 (0.005) (0.015) ExpectedNumCompanies^2 0.0001*** −0.0002 (0.0000) (0.0001)
Individual Characteristics & Other Controls Field Dummies Y Y GraduationYear Trend Y Y Female Dummy Y Y Time Controls Y Y
Log-Likelihood −1976 −796
Note. Probit model coefficient estimates; standard errors are in parentheses. Number of observations = 16,349. Number of observations = 4,985 where current users ≥ 1,000. Cases of current users < 1,000 include observations in which the current installed base was not disclosed. ∗p < 0.10, ∗∗p < 0.05, ∗∗∗p < 0.01.

29
Table 6. Parametric Variance Estimates
Dep. Var.: Participation Model: (1) (2) Parameterized Variance Model ExpectationsStated 0.215* 0.255** (0.110) (0.126) InstalledBaseDisclosed −0.187* −0.251** (0.098) (0.122) Conditional Mean Probit Model Quadratic ExpectationsStated Y Y × I{Current Users <1,000} Y Quadratic InstalledBaseDisclosed Y Y × I{Current Users <1,000} Y Field Dummies Y Y GraduationYear Trend Y Y Female Dummy Y Y Time Controls Y Y Log-Likelihood −2,780 −2,775
Note. Probit model coefficient estimates; standard errors are in parentheses. Number of observations = 16,349. Number of observations = 4,985 where current users ≥ 1,000. Cases of current users < 1,000 include observations in which the current installed base was not disclosed. ∗p < 0.10, ∗∗p < 0.05, ∗∗∗p < 0.01.

30
Figure 1. Subject Characteristics Across Days of the Campaign
0.2
.4.6
.8
Red - Proportion Engineering; Black - Proportion Computer & Data Science; Grey - Proportion Sciences
I.
1980
2000
2020
Red - Avg. Graduation Year
II.
01
23
4
0 20 40 60Randomly Assigned Day to Receive Invitation
Red - Proportion Students; Black - Proportion Female; Grey - GPA
III.
31
Figure 2. Subject Characteristics Across Treatments
Note. The treatment codes in the x-axis of panel III correspond to the following order of codes: current installed base disclosed or not (level varies by day), user expectations scenario, company expectations scenario, scale statement, early adopter statement (Section 2.2).
0.2
.4.6
.8
Red - Proportion Engineering; Black - Proportion Computer & Data Science; Grey - Proportion Sciences
I.
1980
2000
2020
Red - Avg. Graduation Year
II.
01
23
4
- - -
- -- -
- Sc
ale
-- -
- - E
arly
- - -
Scal
e Ea
rlyIB
- - -
-IB
- - S
cale
-- L
u Lc
- -
- Lu
Lc -
Early
IB L
u Lc
- -
IB L
u Lc
- Ea
rly- M
u Lc
- -
- Mu
Lc -
Early
IB M
u Lc
- -
IB M
u Lc
- Ea
rly- M
u H
c - -
- Mu
Hc
Scal
e -
- Mu
Hc
- Ear
ly- M
u H
c Sc
ale
Early
IB M
u H
c - -
IB M
u H
c Sc
ale
-IB
Mu
Hc
- Ear
lyIB
Mu
Hc
Scal
e Ea
rly- H
u M
c - -
- Hu
Mc
Scal
e -
- Hu
Mc
- Ear
ly- H
u M
c Sc
ale
Early
IB H
u M
c - -
IB H
u M
c Sc
ale
-IB
Hu
Mc
- Ear
lyIB
Hu
Mc
Scal
e Ea
rly- H
u VH
c - -
- Hu
VHc
Scal
e -
- Hu
VHc
- Ear
ly- H
u VH
c Sc
ale
Early
IB H
u VH
c - -
IB H
u VH
c Sc
ale
-IB
Hu
VHc
- Ear
lyIB
Hu
VHc
Scal
e Ea
rly
Red - Proportion Students; Black - Proportion Female; Grey - GPA
III.

Figure 3. Effect of Messaging Expected Installed Base
Note. Estimates presented here are based on model (3) in Table 3, re-estimated with individual dummies for levels of the installed base of users, as a linear probability model to facilitate interpretation. The 95% confidence interval is based on robust standard error estimates.
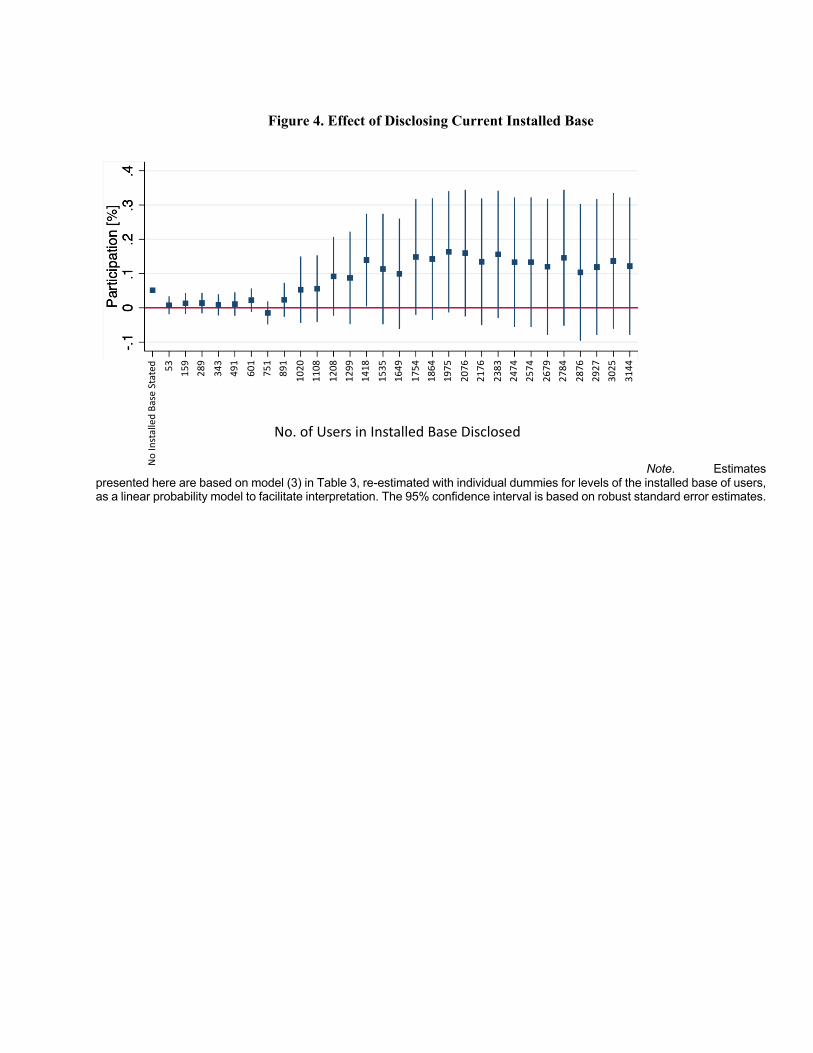
Figure 4. Effect of Disclosing Current Installed Base
Note. Estimates presented here are based on model (3) in Table 3, re-estimated with individual dummies for levels of the installed base of users, as a linear probability model to facilitate interpretation. The 95% confidence interval is based on robust standard error estimates.
No. of Users in Installed Base Disclosed
No In
stal
led
Base
Sta
ted 53 159
289
343
491
601
751
891
1020
1108
1208
1299
1418
1535
1649
1754
1864
1975
2076
2176
2383
2474
2574
2679
2784
2876
2927
3025
3144

APPENDIX A: Building on Tucker & Zhang (2010) Framework
Tucker and Zhang (2010) The Current Study
Research Question
• Effect of disclosing the current installed base on platform adoption in a mature platform
• Effect of stating expectations of future installed base during initial takeoff (Controlling for disclosing the current installed base)
Research Context
• Large, Chinese B2B intermediary platform, connecting B2B buyers and sellers (240,000 clicks per day); focus is on one city
• Focus on sellers’ decisions
• Study 3,314 instances of sellers who initiate new listings (observe whether they complete the listing, after starting)
• Zero charge to make a listing (costs include the non-pecuniary hassle and effort to list)
• Newly launched collaborative hackathon platform connecting users with companies; begins with zero users, grows to several thousand
• Focus on users’ decisions
• Study a risk set of 16,349 potential users (observe whether they join or not)
• Zero charge for participating (costs include non-pecuniary hassle and effort to list, plus 3-week participation)
Experimental Protocol
• Immediately after inbound seller chooses a product category to submit listing, platform discloses the current installed base
• Randomize whether current installed base is disclosed (no. sellers, no. buyers, both, or neither)
• Generate random number of sellers or buyers from 1–200
• Observe outcome of whether listers complete listing or not
• Platform invites targeted individuals to join; message includes expected future installed base (and disclosure of current installed base)
• Randomize whether expectations of future installed base are stated
• Randomize whether current installed base is disclosed
• Generate numbers of expected and/or current users and companies according to procedure described in Section 2
• Observe outcome of whether potential users join (or not)
Data • 3,314 instances of inbound listings over roughly 2 months
• IP address, time stamp, good category, treatment, listing completed or not
• 16,349 invited individuals over roughly 2 months
• Individual identifier, characteristics, time stamp, treatment, joined platform or not
Model Prob{Lister Completes the Listing} = f(Current Installed Base | Time, Listing Category, Number of Previous Listings)
Prob{New User Joins} = f(Expected Future Installed Base | Current
Installed Base, Time, Individual Characteristics)

APPENDIX B: Invitation to the Platform
Hi <NAME>,
We are reaching out to invite you to the university’s new Internet of Things (IoT) Open Innovation platform linking our students, alumni, staff, faculty, and affiliated companies.
This is a two-sided collaborative platform to ideate and innovate “smart” IoT products and services using hardware, software, networking, data, and algorithms.
On one side of the platform, companies seek solutions to their IoT innovation challenges. On the other side, you will work within a team to solve companies’ IoT innovation problems for cash and other benefits.
<Note: Treatments include subsets of the following points:>
• We expect <#> users and <#> companies to join this year.
• To date, <#> users and <#> companies have joined.
• This is an invitation to early adopters.
• The university community comprises 20,000 students, 200,000 alumni, and 2,000 staff and professors. There are also 4,000 affiliated companies.
Affiliated companies, including your employer, can request to launch new challenges, harnessing the network’s diverse knowledge of industry and consumer use cases, technical skills (e.g., hardware, software, data, algorithms, network, cloud, and user interface), design thinking, and commercial planning capabilities. Interested in joining this platform? Click here to learn more and sign up.
(This invitation is not transferable and should not be forwarded.)