promoting growth in all regions - oecd.org · promoting growth in all regions broader based growth...
TRANSCRIPT
Promoting Growth in All Regions
Enrique Garcilazo
Regional Development Policy Division
Directorate for Public Governance and Territorial Development OECD
27th March 2012, Newcastle

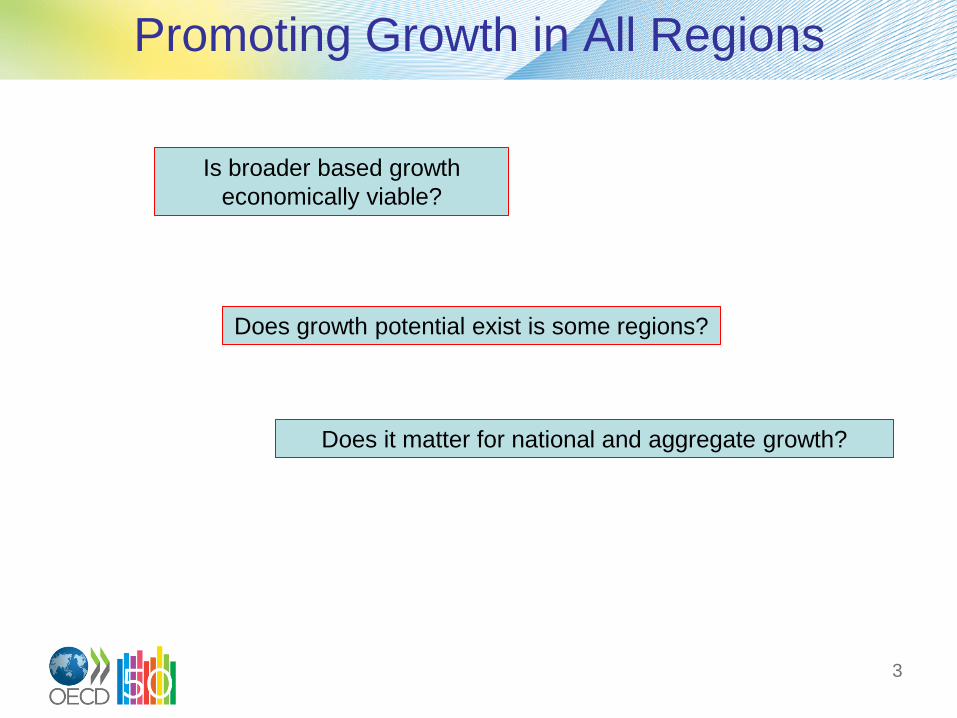
Promoting Growth in All Regions
Broader based growth
Good for Equity: access to services and to economic
opportunities
Good for Public Finances:
chronically underperforming
regions can impose substantial
costs on public finances
Reduce Vulnerability to shocks: greater
diversity of activity and thus lower risk
2
Promoting Growth in All Regions
3
Is broader based growth
economically viable?
Does growth potential exist is some regions?
Does it matter for national and aggregate growth?

• Trends in regional growth
• Regions and aggregate performance
• Factors of regional growth
• Case studies
• General findings
Outline
4

There is no single/unique path to growth…
Opportunities for growth exist in all types of regions.
5

Convergence forces in rural regions
6

Convergence forces in intermediate regions
7
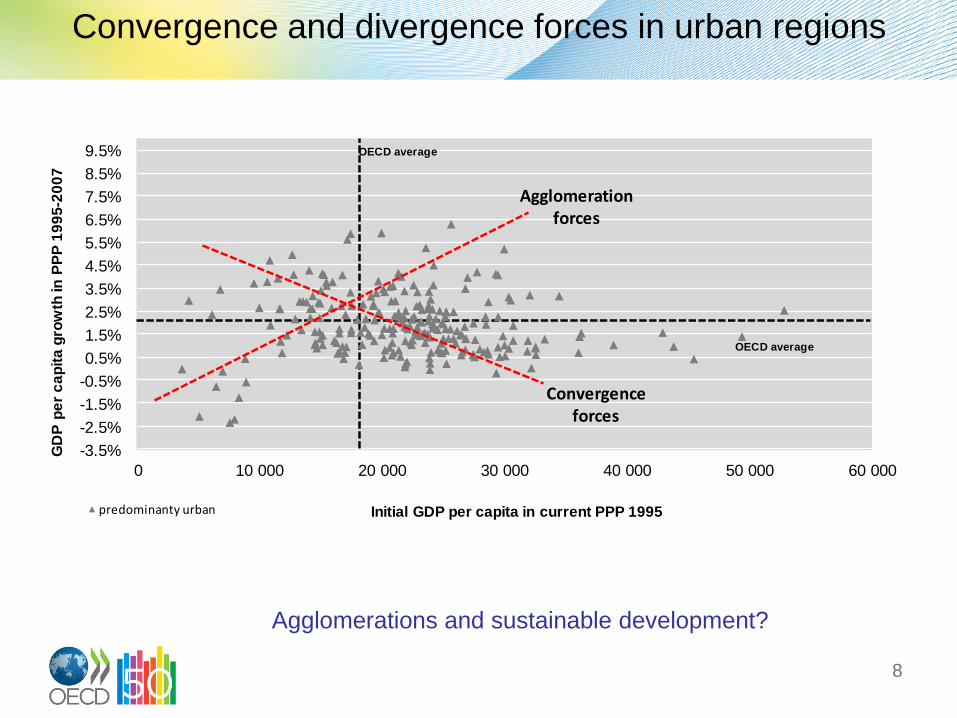
Convergence and divergence forces in urban regions
Agglomerations and sustainable development?
-3.5%
-2.5%
-1.5%
-0.5%
0.5%
1.5%
2.5%
3.5%
4.5%
5.5%
6.5%
7.5%
8.5%
9.5%
0 10 000 20 000 30 000 40 000 50 000 60 000
GD
P p
er
ca
pit
a g
row
th in
PP
P 1
99
5-2
00
7
Initial GDP per capita in current PPP 1995 predominanty urban
OECD average
OECD average
Agglomerationforces
Convergence forces
8

The most dynamic OECD regions over 1995-2007..
9 140
150
160
170
180
190
200
210
220
1995 1996 1997 1998 1999 2000 2001 2002 2003 2004 2005 2006
pop and GDP growth pop density and GDP growth pop and GDPpc growth
average rank
(1== highest)
population
pop density

Links between regional and aggregate
Where growth actually occurs is also critical:
Contributions to growth
Implications for national policy makers
Contribution to growth over the a given period (n, n+t):
Initial size of a given territory GDP share (n)
Its growth rate between (n, n+t)
10

Contributions to aggregate growth depend on few hub regions…
…the fat tail is equally important -- if not more -- to
aggregate growth… 11

Contributions to aggregate growth by
less developed regions
Overall, they contributed
to 44% of aggregate
OECD growth in 1995-
2007.
In ten OECD countries lagging
regions contributed more to
national growth than leading
regions. In the United Kingdom,
their contribution was 57%.
Bottom line: support for lagging regions
need not be merely a “social” policy. They
contribute a large share of national growth. 12
LCUP CUP LCUP &CUP advanced
Austra l ia 0% 29% 29% 71%
Austria 3% 50% 53% 47%
Belgium 19% 61% 80% 20%
Canada 2% 23% 26% 74%
Czech Republ ic 0% 62% 62% 38%
Denmark 0% 49% 49% 51%
Finland 0% 35% 35% 65%
France 1% 68% 68% 32%
Germany 14% 13% 27% 73%
Greece 0% -16% -16% 116%
Hungary 14% 20% 34% 66%
Ireland 0% 19% 19% 81%
Ita ly 20% 6% 26% 74%
Japan 1% 26% 27% 73%
Korea 0% 23% 23% 77%
Mexico 24% 20% 44% 56%
Netherlands 0% 49% 49% 51%
Norway 0% 61% 61% 39%
Poland 0% 44% 44% 56%
Portugal 0% 54% 54% 46%
Slovak Republ ic 0% 67% 67% 33%
Spain 17% 32% 48% 52%
Sweden 0% 58% 58% 42%
Turkey 36% 11% 47% 53%
United Kingdom 0% 57% 57% 43%
United States 1% 50% 51% 49%
average unweighted 6% 37% 43% 57%
average weighted 5% 38% 43% 56%

Stylized facts – growth
Growth Patterns are very Heterogeneous
Possibilities for growth exist in all types of regions
Convergence and agglomeration forces at play
Concentration and Growth
Concentration not a sufficient nor necessary condition
Benefits of concentration not linear nor infinite
Diseconomies of scale and congestion costs can hinder
growth in agglomerations
What are the main factors of growth at the regional level?
13

Econometric models Unit of analysis: OECD TL2 Regions, 1995-2007
Cross-Sectional Model
Error Correction Model
Panel and Pooled Model
1 2 3 4
5 6 7 8 9
10 11 12
1ln ln ln Pr_ _ ln _ _
ln ln _ ln _ ln _
ln _ ln( _ ) ln
t Tt t t t
t
t t t t t
t t t
GPDGDP Inf Ed att Ti Ed att
T GDP
ER Pat GDExp B GDExp G Spec Ag
Spec Man Market Dist Accesibility
,
1 , 1 2 , 1 3 , 1 4 , 1
1
5 6 , 1 7 1 8 , 1 9 , 1
10 , 1 11 ,
ln ln ln Pr_ _ ln _ _,
1 ln ln _ , ln _ ln _
ln _ ln( _
i t
i t i t i t i t
t
t i t t i t i t
i t i t
GPDGDP Inf Ed att Ti Ed att
GDPi
ER Pat GDExp Bi GDExp G Spec Ag
Spec Man Market Dist
1 12 , 1 ,) ln )i t j j t t i i tAccesibility CD TD u e
.ln)()(ln)(ln)(ln
ln)()(ln1
)(ln1
)(ln1
)1(ln)(ln
3210 t
j
j
tjK
j
j
tjK
Xbdtntgathatsaa
gtXzdtntga
ath
a
bts
a
atyty
14

How regions grow: model results
First key finding: The most important growth drivers are
endogenous to the region.
Human capital and innovation positively influence regional growth.
Infrastructure influences growth only when human capital and innovation
are present. By itself it does not impact growth.
Agglomeration influences growth but is not necessary or sufficient.
Distance to markets has a positive impact to growth. Regions in periphery
growing faster. Possible measurement bias? (i) No travel time and
transportation networks and (ii) size of regions.
Accessibility influences growth, conditional on innovation, infrastructure,
human capital and agglomeration.
Second key finding: the relative weight of different factors depends,
inter alia, on the level of development of the region.
These findings, in turn, have implications for governance.
15

Regional performance varies with development…
initial level
GDP pc 1995
75% national av.
LCUP CUP advanced
growth rate
GDP pc 1995-2007
growing below
average
regions regions regions
growing above
average
1
2
3
4
5 6

Analysis
Compare indicators relevant for regional growth b/w
“growing” and “underperforming” group
•Population density
•GDP density
•Employment rate
•Unemployment rate
•Youth unemployment rate
•Patent applications
•Patent intensity
•Business R&D to GDP
•Government R&D to GDP
•Higher education R&D to GDP
•Primary attainment rate
•Tertiary attainment rate
•Connectivity in global network
•Productivity
•Infrastructure
Economic mass/thickness of market
economies of agglomeration
Labour utilisation
Innovation related indicators
Human capital
Geography/NEG

Performance of all “growing” regions associated …
Productivity
Human capital
Density
Productivity Productivity (GDP per employee) 31,612 29,728 55,832 50,728 72,551 59,824
Infrastucture Motorway density 0.15 0.13 0.26 0.18 0.19 0.24
Primary educational attainment (% of LF) 42% 46% 26% 22% 25% 29%
Teritiary attainment (% of LF) 21% 19% 26% 25% 31% 26%
PISA score mathematics 443 405 476 487 484 478
PISA score reading 459 436 482 485 490 465
Employment rate 57% 55% 71% 68% 71% 66%
Unemployment rate 9% 8% 5% 7% 5% 6%
Long-term unemployment rate 4% 5% 2% 2% 2% 2%
Youth unemployment rate 21% 22% 13% 16% 12% 15%
Participation rate 62% 60% 73% 72% 74% 69%
ln (patent application) 1.7 1.8 4.4 4.1 5.0 4.0
Patent applications per million 20 16 91 74 158 82
ln (patent application copatents) 1.1 1.6 4.0 3.6 4.6 3.6
Co-invention within region 124 90 673 536 2932 1256
Co-inventions within ctry 105 71 294 261 759 466
Co-inventions foreign 16 53 126 112 314 206
R&D expenditure total (as % of GDP) 1.06% 1.03% 1.50% 1.41% 2.21% 1.51%
BERD % GDP 0.35% 0.42% 0.90% 0.86% 1.35% 1.00%
GERD % GDP 0.33% 0.22% 0.23% 0.20% 0.42% 0.16%
High and medium HTM % empl. 3.3% 4.8% 5.2% 6.1% 5.3% 6.4%
KIS (as % of total employment) 22.5% 28.2% 33.3% 32.8% 36.7% 32.2%
Population density 17.51 18.38 19.40 18.63 29.47 23.41
GDP density 1.10 0.99 4.29 3.38 29.14 24.19
Degree of openness 14 15 40 40 65 44
Clustering coefficient 0.034 0.038 0.089 0.093 0.123 0.084
Centrality 0.001 0.001 0.002 0.002 0.007 0.005
Growth factor Indicator
Agglomeration and
connectivity
Innovation
Labour market
Human capital
Regions with large
catching up potential
Regions with catching
up potentialAdvanced regions
Growing
above av.Growing
below av.
Growing
above av.Growing
below av.
Growing
above av.Growing
below av.

Performance of regions with low levels of development…
…infrastructure and innovation related activities (co-invention within
regions and with other regions within countries) are critical, in
addition to human capital .
Productivity Productivity (GDP per employee) 31,612 29,728 55,832 50,728 72,551 59,824
Infrastucture Motorway density 0.15 0.13 0.26 0.18 0.19 0.24
Primary educational attainment (% of LF) 42% 46% 26% 22% 25% 29%
Teritiary attainment (% of LF) 21% 19% 26% 25% 31% 26%
PISA score mathematics 443 405 476 487 484 478
PISA score reading 459 436 482 485 490 465
Employment rate 57% 55% 71% 68% 71% 66%
Unemployment rate 9% 8% 5% 7% 5% 6%
Long-term unemployment rate 4% 5% 2% 2% 2% 2%
Youth unemployment rate 21% 22% 13% 16% 12% 15%
Participation rate 62% 60% 73% 72% 74% 69%
ln (patent application) 1.7 1.8 4.4 4.1 5.0 4.0
Patent applications per million 20 16 91 74 158 82
ln (patent application copatents) 1.1 1.6 4.0 3.6 4.6 3.6
Co-invention within region 124 90 673 536 2932 1256
Co-inventions within ctry 105 71 294 261 759 466
Co-inventions foreign 16 53 126 112 314 206
R&D expenditure total (as % of GDP) 1.06% 1.03% 1.50% 1.41% 2.21% 1.51%
BERD % GDP 0.35% 0.42% 0.90% 0.86% 1.35% 1.00%
GERD % GDP 0.33% 0.22% 0.23% 0.20% 0.42% 0.16%
High and medium HTM % empl. 3.3% 4.8% 5.2% 6.1% 5.3% 6.4%
KIS (as % of total employment) 22.5% 28.2% 33.3% 32.8% 36.7% 32.2%
Population density 17.51 18.38 19.40 18.63 29.47 23.41
GDP density 1.10 0.99 4.29 3.38 29.14 24.19
Degree of openness 14 15 40 40 65 44
Clustering coefficient 0.034 0.038 0.089 0.093 0.123 0.084
Centrality 0.001 0.001 0.002 0.002 0.007 0.005
Growth factor Indicator
Agglomeration and
connectivity
Innovation
Labour market
Human capital
Regions with large
catching up potential
Regions with catching
up potentialAdvanced regions
Growing
above av.Growing
below av.
Growing
above av.Growing
below av.
Growing
above av.Growing
below av.

As regions move into higher levels of development…
…human capital but in addition to adequate infrastructure, efficient
labour markets and innovative activity are critical to enhance their
performance .
Productivity Productivity (GDP per employee) 31,612 29,728 55,832 50,728 72,551 59,824
Infrastucture Motorway density 0.15 0.13 0.26 0.18 0.19 0.24
Primary educational attainment (% of LF) 42% 46% 26% 22% 25% 29%
Teritiary attainment (% of LF) 21% 19% 26% 25% 31% 26%
PISA score mathematics 443 405 476 487 484 478
PISA score reading 459 436 482 485 490 465
Employment rate 57% 55% 71% 68% 71% 66%
Unemployment rate 9% 8% 5% 7% 5% 6%
Long-term unemployment rate 4% 5% 2% 2% 2% 2%
Youth unemployment rate 21% 22% 13% 16% 12% 15%
Participation rate 62% 60% 73% 72% 74% 69%
ln (patent application) 1.7 1.8 4.4 4.1 5.0 4.0
Patent applications per million 20 16 91 74 158 82
ln (patent application copatents) 1.1 1.6 4.0 3.6 4.6 3.6
Co-invention within region 124 90 673 536 2932 1256
Co-inventions within ctry 105 71 294 261 759 466
Co-inventions foreign 16 53 126 112 314 206
R&D expenditure total (as % of GDP) 1.06% 1.03% 1.50% 1.41% 2.21% 1.51%
BERD % GDP 0.35% 0.42% 0.90% 0.86% 1.35% 1.00%
GERD % GDP 0.33% 0.22% 0.23% 0.20% 0.42% 0.16%
High and medium HTM % empl. 3.3% 4.8% 5.2% 6.1% 5.3% 6.4%
KIS (as % of total employment) 22.5% 28.2% 33.3% 32.8% 36.7% 32.2%
Population density 17.51 18.38 19.40 18.63 29.47 23.41
GDP density 1.10 0.99 4.29 3.38 29.14 24.19
Degree of openness 14 15 40 40 65 44
Clustering coefficient 0.034 0.038 0.089 0.093 0.123 0.084
Centrality 0.001 0.001 0.002 0.002 0.007 0.005
Growth factor Indicator
Agglomeration and
connectivity
Innovation
Labour market
Human capital
Regions with large
catching up potential
Regions with catching
up potentialAdvanced regions
Growing
above av.Growing
below av.
Growing
above av.Growing
below av.
Growing
above av.Growing
below av.

As regions approach the production possibility frontier…
…in addition to human capital dynamism is mainly associated with
innovation-related activities and their connectivity within the global
network of regions and agglomeration forces.
Productivity Productivity (GDP per employee) 31,612 29,728 55,832 50,728 72,551 59,824
Infrastucture Motorway density 0.15 0.13 0.26 0.18 0.19 0.24
Primary educational attainment (% of LF) 42% 46% 26% 22% 25% 29%
Teritiary attainment (% of LF) 21% 19% 26% 25% 31% 26%
PISA score mathematics 443 405 476 487 484 478
PISA score reading 459 436 482 485 490 465
Employment rate 57% 55% 71% 68% 71% 66%
Unemployment rate 9% 8% 5% 7% 5% 6%
Long-term unemployment rate 4% 5% 2% 2% 2% 2%
Youth unemployment rate 21% 22% 13% 16% 12% 15%
Participation rate 62% 60% 73% 72% 74% 69%
ln (patent application) 1.7 1.8 4.4 4.1 5.0 4.0
Patent applications per million 20 16 91 74 158 82
ln (patent application copatents) 1.1 1.6 4.0 3.6 4.6 3.6
Co-invention within region 124 90 673 536 2932 1256
Co-inventions within ctry 105 71 294 261 759 466
Co-inventions foreign 16 53 126 112 314 206
R&D expenditure total (as % of GDP) 1.06% 1.03% 1.50% 1.41% 2.21% 1.51%
BERD % GDP 0.35% 0.42% 0.90% 0.86% 1.35% 1.00%
GERD % GDP 0.33% 0.22% 0.23% 0.20% 0.42% 0.16%
High and medium HTM % empl. 3.3% 4.8% 5.2% 6.1% 5.3% 6.4%
KIS (as % of total employment) 22.5% 28.2% 33.3% 32.8% 36.7% 32.2%
Population density 17.51 18.38 19.40 18.63 29.47 23.41
GDP density 1.10 0.99 4.29 3.38 29.14 24.19
Degree of openness 14 15 40 40 65 44
Clustering coefficient 0.034 0.038 0.089 0.093 0.123 0.084
Centrality 0.001 0.001 0.002 0.002 0.007 0.005
Growth factor Indicator
Agglomeration and
connectivity
Innovation
Labour market
Human capital
Regions with large
catching up potential
Regions with catching
up potentialAdvanced regions
Growing
above av.Growing
below av.
Growing
above av.Growing
below av.
Growing
above av.Growing
below av.

Main Policy Messages
Not as clear as it seems (or as policy-makers
might like!):
The foregoing omits important interaction effects.
Many policy interventions can have unintended
effects if undertaken in isolation.
However, if this implies a constraint in terms of
policy coherence, it also points to opportunities
arising from policy complementarities.
In short: no simple messages or solutions.
22

Persistence of inequality
Infrastructure
provision
Leaking by linking
The policy headache: isolated sectoral action may
have unintended outcomes.
Problem: lack
of connectivity
23
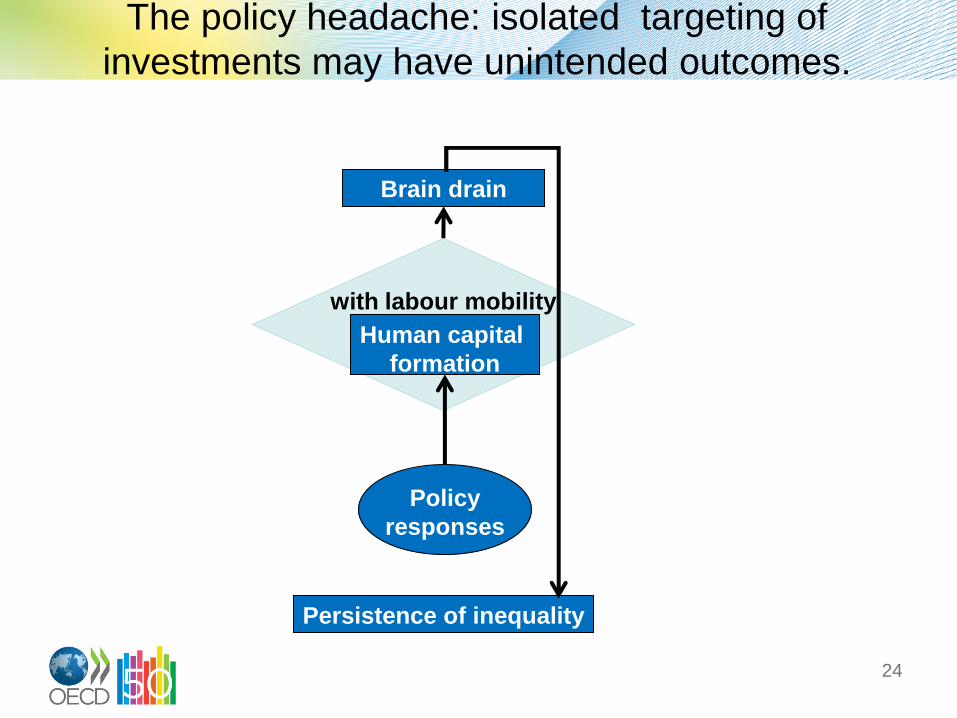
with labour mobility
Persistence of inequality
Policy
responses
Human capital
formation
Brain drain
The policy headache: isolated targeting of
investments may have unintended outcomes.
24

Infrastructure
provision
Policy
responses
Human capital
formation
Business
environment
Innovation
Regional growth
and convergence
Towards a Multidimensional Response
At the regional scale
Many countries are reforming in this direction,
but implementation is still difficult.
25
-Horizontal evidence?
-Policies ?
-Institutions ?

The need for a differentiated approach
• Place based polices in the new regional paradigm are
best suited for this task
Integrated approach – diagnosis is critical
No one size-fits all answer -- context matters
A match between bottom and top down information
and initiative is critical
Policy making presents risks of gaps
Multilevel governance will be key for a successful
implementation
26

Paradigm shift in regional policies
Traditional Regional Policies New Paradigm
Objectives
Balancing economic
performances by temporary
compensating for disparities
Tapping under-utilised regional
potential for competitiveness
Strategies Sectoral approach Integrated development
projects
Tools Subsidies and state aid Soft and hard infrastructures
Actors Central government Different levels of government
Unit of
analysis Administrative regions Functional regions
Redistributing from leading to
lagging regions
Building competitive regions to
bring together actors and
targeting key local assets
27

Case Studies Methodology
28
Sample of 23 case study regions
Questionnaire (21 questions)
Field study
Drafting of case study
Case study number Region Category
1 Aquitaine CUP and growing above av.
2 Asturias CUP and growing above av.
3 Brandenburg LCUP and growing above av.
4 Central Transdanubia CUP and growing above av.
5 Durango CUP and growing above av.
6 Jalisco CUP and growing above av.
7 Marche CUP and growing above av.
8 Midi-Pyrénées CUP and growing above av.
9 Sachsen-Anhalt LCUP and growing above av.
10 San Luis Potosi LCUP and growing above av.
11 Wielkopolskie CUP and growing above av.
12 Zuid-Nederland CUP and growing above av.
13 Chiapas LCUP and growing below av.
14 Estado de Mexico CUP and growing below av.
15 Lubelskie CUP and growing below av.
16 Nord-Pas-de-Calais CUP and growing below av.
17
North East (CR Tyne and
Wear) CUP and growing below av.
18 North West (CR Manchester) CUP and growing below av.
19 Podlaskie CUP and growing below av.
20 Sicilia LCUP and growing below av.
21 Vychodne Slovensko CUP and growing below av.
22
Yorkshire and Humberside
(CR Leeds) CUP and growing below av.
23 Zacatecas LCUP and growing below av.
Dynamic regions
Less dynamic regions

Structure of Case Studies
29
• Ex-ante: is the region dynamic yes or no
• Questionnaire and key objectives of case study
1. Snapshot of the region and historical context: Population, density, area, cities, monocentric, rurality, terrain
Historical context
Institutional and policy
2. Economic assessment GDP pc, population, GDP
Productivity
Labour markets
Infrastructure
Human capital
Structure of growth factors
3. Key factors for growth
4. Main bottlenecks for growth and development
5. Statistical annex

Growth Factors + Bottlenecks = 185 Thematic Areas (18)
30
themes factors and bottlenecks Region
Agriculture activity remains an important economic activity Zacatecas
Inability to restructure an existing low productive agriculture sector Lubelskie
The modernisation of agriculture has been moderate Zacatecas
Limited investment resources available to enterprises Wielkopolskie
Lack of public funding is a challenge to strengthen the knowledge infrastructure Zuid Nederland
Weak access to credit and venture financing Marche
Attractive business environment Wielkopolskie
Strong presence of industry and industrial related activities Sachsen-Anhalt
Strong involvement of the private sector in manufacturing tradition Marche
Strong involvement of the business sector combined good work ethic culture Central Trandanubia
Limited local business capacities San Luis Potosi
Favourable regulatory environment and policies supporting private sector activities San Luis Potosi
Strong presence of the private sector driving the diversification of the economy Yorkshire and Humberside (Leeds)
Important concentration of clusters and poles of competitiveness Nord Pas de Calais
Presence of a significant number of larger firms driving the manufacturing cluster Estado de Mexico
Insufficient involvement of the private sector in R&D Asturias
Red tape and regulatory burden Central Trandanubia
Insufficient integration of value chains in mining and wood sectors to produce higher value added goods Durango
Low competitiveness in the private sector and lack of dynamism driving brain-drain of young, productive talent Sicily
Low involvement of the private sector leading to excessive reliance on public sector activities North East (Tyne and Wear)
Low industrial activities focusing mainly on low-value added activities. Zacatecas
Challenges brought by population declines and an excessive elderly population Asturias
Population decline has been a long-term reality in Brandenburg. Brandenburg
Population declines in the region bring important challenges Sachsen-Anhalt
Demographic trends bring challenges to public investments and represent a loss of human capital potential Durango
Ageing population bring important challenges to the region Sicily
Demographics effects -- high population growth in the region. Estado de Mexico
Demographic effect in the region with high levels of outmigration Zacatecas
Fragmentation in labour markets reduces its growth potential and brings important challenges to governance Midi Pyrinees
Lack of internal cohesion due to strong internal fragmentation. Podlaskie
Mismatch in skills between demand and supply North West (Manchester)
A fragmented labour market area due to poor connectivity within the functional city region North West (Manchester)
Improving internal connectivity critical for polycentric settlement Yorkshire and Humberside (Leeds)
Low critical mass due to fragmented internal markets and weak internal connections North East (Tyne and Wear)
Economic activities in Chiapas are highly fragmented with low links impeding spillover and scale-effects Chiapas
Low participation of females into the workforce Zacatecas
Differentiated base for economic development. Wielkopolskie
Internal demand for goods and services by small firms Lubelskie
A relative diversified economic structure Yorkshire and Humberside (Leeds)
Diversification of traditional sectors North East (Tyne and Wear)
Growth of the service sector during on ongoing period of restructuring Nord Pas de Calais
Small proportion of large scale companies in the region Brandenburg
Insufficient size and death of industrial enterprises. Aquitaine
Low diversification and reliance on agriculture and natural resource brings vulnerable to external fluctuations Durango
The region lacks market awareness despite the economy having size and scale Yorkshire and Humberside (Leeds)
7. environmental constraintsExclusion of large parts of the region from economic activities (environmental constrains). Podlaskie
1. agriculture
2. availabity of financing
3. business environment
public sector activity and
industry
4. demographic factors
5. density cohesion
internal fragmentation
labour market mismatch
6. diversified differenciated
and market awareness
economy

31
Largest recipient of FDI in eastern Germany brining an important influx of funds Sachsen-Anhalt
Strong influx of FDI to the region and strong presence of foreign investors Central Trandanubia
FDI investment in the region have been quite significant Estado de Mexico
Favourable geographic location to EU markets and central location in the country Wielkopolskie
Favourable geographic location and proximity to core European markets Sachsen-Anhalt
A favourable geographic position Central Trandanubia
The region has taken advantage of good geographic location San Luis Potosi
Proximity to the Eastern border Lubelskie
Central geographic location with proximity to London Yorkshire and Humberside (Leeds)
Proximity to the main production consumer hub in Mexico Estado de Mexico
Unfavourable geographic location on the periphery of the EU border Podlaskie
Unfavourable geographic location -- to a large extent the impermeable EU external border Lubelskie
Geographic location peripheral to Western markets, separated by mountainous terrain to capital region Vychodne Slovenkso
Privileged geographic location close to Brussels, Paris and London still have not fully translated into economic gainsNord Pas de Calais
The region's geographic terrain, not prone to productivity gains hampers development efforts Chiapas
Reduction of low skilled workers improved stock of technical students and more response to the demands of marketAsturias
Adequate and continued supply of skilled workers in the region and better matching the market needs Brandenburg
The tertiary education brings a very high research potential to the region Midi Pyrinees
Abundant labour force with human capital technical skills in the surging sectors San Luis Potosi
Ability to transform its economy to higher value-added goods through human capital gains Jalisco
Gains in human capital improving adult skills and vocational training adding to the region's capacity Durango
Adequate higher educational facilities have brought an important human capital potential to the region Podlaskie
Adequate levels of human capital in higher education Lubelskie
Higher education institutions supply a diversified pool of highly skilled workers North West (Manchester)
Critical mass in human capital due to a notable concentration of higher education institutions Yorkshire and Humberside (Leeds)
Strong higher educational programmes and institutions North East (Tyne and Wear)
Higher education institutions attracting students and improving supply of high skilled workers Nord Pas de Calais
Low flexibility of the education system which is not adjusted to real needs, Wielkopolskie
Availability of talent is lacking to the growing demands of the region Zuid Nederland
Brain drain in high-skilled workers represents a loss of human capital potential Sachsen-Anhalt
High proportion of low-skilled workers and weak links between educational and business sector Central Trandanubia
Gaps between human capital supplied and the needs of the region. Jalisco
Brain drain due to insufficient industrial production Vychodne Slovenkso
Labour market capacity and skills in selected areas would add to the regions economic capacity Yorkshire and Humberside (Leeds)
Loss of human capital potential for future generations with high dropout rates and low secondary attainments Nord Pas de Calais
There is an important lack of human capital and loss of human capital potential Chiapas
Deficit in high-skilled labour measured by the proportion of the labour force with tertiary educational attainments Estado de Mexico
Inadequacy of educational level and low availability of jobs-skill in the region Zacatecas
Infrastructure improvements connecting a relatively closed region to external markets Asturias
Adequate infrastructure facilities providing good external connections to the east and west Wielkopolskie
Adequate infrastructure investments improved attracting and connectivity to European and international markets Brandenburg
Important improvements in infrastructure have lifted attracting attracting logistic companies to the reigon Sachsen-Anhalt
Fairly advanced infrastructure network have strengthen connections to Budapest and to European markets Central Trandanubia
Adequate infrastructure have helped consolidation of an important logistics hub around the metropolitan zone of SLP San Luis Potosi
Adequate transport infrastructure capitalising on the region's privileged geographic position Jalisco
The presence of road and rail infrastructure and adequate geographic location Durango
Important improvements in the transport infrastructure networks Sicily
Capital deepening brought by investments in physical capital in the city centre North West (Manchester)
Infrastructure gains modernising the port, railways and airport have benefited the region over the past decades Chiapas
Uneven development of transportation infrastructure with accessibility lacking in some parts of the region Wielkopolskie
Gaps in ICT infrastructure limits the capacity of disseminating innovation around industrial clusters Marche
Connectivity gaps between the metropolitan area San Luis Potosi and the ports of Tampico Altimira San Luis Potosi
Inadequate logistics infrastructure could give greater impetus to the region Durango
Inadequate infrastructure in the region lacking an airport and adequate road and rail infrastructure Podlaskie
Limited transport network lacking motorways ring roads and the railways and local roads are inefficient Lubelskie
Inadequate infrastructure with low motorway density limited connection between cities and with external marketsVychodne Slovenkso
Inadequate infrastructure still represents an important bottleneck for development Chiapas
8. FDI
9. geography
10. human capital
11. infrastucture
connectivity

32
Strong open innovation value chains with a strong involvement of the private sector Zuid Nederland
Entrepreneurial tradition in the region Marche
Ability to turnaround traditional sectors through innovation-intensive initiatives Marche
Strong research capacity in the regions mainly centred in Gironde Aquitaine
Innovation intensity driven by steady growth of the aerospace cluster and active innovation-driven policy Midi Pyrinees
Small-scale examples of innovative policy Sicily
Low appliance of the research and scientific potential, and relatively low funding of R&D, especially in enterprisesWielkopolskie
The application of technologies in the region's natural amenities has brought important gains Chiapas
A low entrepreneurial spirit Asturias
Slow pace of further modernisation of regional economy Wielkopolskie
Bottlenecks in further unleashing innovation potential and creating more economic value of existing innovations Zuid Nederland
Low level of overall R&D investment especially by the business sector Brandenburg
Low innovation capacity due to lack of headquarters and obstacles to enhance links between university and businessSachsen-Anhalt
Low innovation due to few connections between large firms and SME's and weak links between HED and businessCentral Trandanubia
Insufficient integration of the region's regional innovation system Aquitaine
Low entrepreneurial culture along with sentiments against manufacturing Aquitaine
The decline of low tech-activities (textiles, leather, wood processing) in a number of rural areas Midi Pyrinees
A lack of regional entrepreneurial culture especially in traditional sectors and smaller firms Jalisco
Persistent weakness of R&D investments and low involvement of the private sector in R&D activities Nord Pas de Calais
Limited entrepreneurial culture and low private initiative Nord Pas de Calais
Mobilising key actors by reaching agreements in a region with a strong legacy of conflict Asturias
Institutional arrangements supporting economic development Wielkopolskie
A successful turnaround driven by mobilising key actors and stakeholders in the region Zuid Nederland
The common voice and strong position Zuid Nederland
Active role by key local public and private actors focusing on innovation and workforce development/retention Marche
Mobilising stakeholders in the regions through enhanced dialogue and interactions among key stakeholders Jalisco
Institutional arrangements supporting economic development Podlaskie
Coherence and continuity in governance North West (Manchester)
Important gaps in of multi-level governance Podlaskie
Lack of political vision to change traditional, entrenched interests vested in the status quo in the region Sicily
Institutional capacity building should be improved in terms of organisational efficiency and use of human capital Sicily
Inability to define and apply performance-based indicators Sicily
An excess of programmes too thinly spread North West (Manchester)
Lack of effective mobilisation of all key stakeholders in the region Yorkshire and Humberside (Leeds)
Inability to fully mobilise key actors in the region and accelerate a shift towards growth potential North East (Tyne and Wear)
Lack continuity in governance and in policy design brought by institutional stability North East (Tyne and Wear)
Internationalisation of regional economy Wielkopolskie
High international exposition Midi Pyrinees
Adequate brand name of Guadalajara Jalisco
Mobilising the region's natural environment and resources changing image from typically rural to relatively attractivePodlaskie
Improvements of the Sicily brand Sicily
Low wage cost attracting foreign investments Vychodne Slovenkso
The region's brand name has brought positive gains Chiapas
International appeal and brand name of the region Zuid Nederland
Vulnerability to global competition especially in traditional sectors with low levels of innovation Marche
Enhanced competition by Asian importers in wood and wood-related activities in the internal markets Durango
Favourable social determinants for economic development Wielkopolskie
The flows of remittances, from migrants living outside of the region Zacatecas
Balancing traditional culture, social policies with development efforts. Chiapas
14. interationalisation
international competition
brandname attractivenes
15. other
12. innovation includes
entrepreneurial
13. institutions
governance leadership
capacity continuity
mobilisation

33
Transitioning from being less reliance on external subsidies and more on growth potential Asturias
Continuity in policy programs and goals resulting in a shift from exogenous based programs to internal ones Zuid Nederland
Mentality and policy shift from a focused on subsidies to towards growth potential Brandenburg
Gradual change of mentality making region less dependent on external interventions and more on internal ones Sachsen-Anhalt
The regeneration of the city-centre of Bordeaux through urban and spatial planning Aquitaine
Linkages between firms and universities have been improved in recent years San Luis Potosi
Urban development in the metropolitan area of Guadalajara has been an important driver in the region Jalisco
Cross-regional linkages with its neighbouring region of Coahuila Durango
Adjusting of economic activities to the region's assets and its environmental constraints. Podlaskie
Enhancing links with Belarus and Lithuania brought benefits to the region's proximity to eastern borders Podlaskie
Good border cooperation Vychodne Slovenkso
The regeneration in the City Region has brought important economic benefits North East (Tyne and Wear)
Urban dynamism mainly in the capital city of Lille Nord Pas de Calais
Inefficiency of selected policies supporting development undertakings Wielkopolskie
Further enhance cross-border cooperation with regions in Germany and Belgium Zuid Nederland
Spatial planning and in particular urban planning remains underdeveloped Midi Pyrinees
A culture of low cooperation due to initiatives lacking yield low inter-firm co-operation San Luis Potosi
Problem of urban development with an efficient urban system lacking San Luis Potosi
Lack of effective territorial coordination due to high sectorialisation of national policies and lack of leadership Jalisco
Inadequate integration of the region into spatial and functional structures at supra-regional and national level Podlaskie
Increased commuting and congestion costs represent important bottlenecks to the Guadalajara metropolitan areaJalisco
Insufficient links between educational institutions and local and regional business activities Podlaskie
Inefficiency of selected policies supporting development undertakings Podlaskie
Inadequate integration of the region into spatial and functional structures at the supra-regional and national level Lubelskie
Difficulty in creating a paradigm shift toward growth potential Sicily
Unfavourable policy environment Vychodne Slovenkso
Slow reaction by the region to external shocks and slow implementation of structural transformation Estado de Mexico
The presence of natural resources and improvements in infrastructure and proximity to northern markets Durango
The establishment of the nation's largest dairy clusters in the north of Mexico Durango
Natural tourism has been an important driver of the region's value-added Chiapas
The presence of mineral and mineral activities Zacatecas
Tourism development has been an important driver in the region Aquitaine
Tourism development Vychodne Slovenkso
16. policies -- shift
mentality, silos
fragmentation, adjusting
policies to assets,
linkages, cross border,
urban and spatial
17. presence of natural
assets and amenities
18. Tourism
34
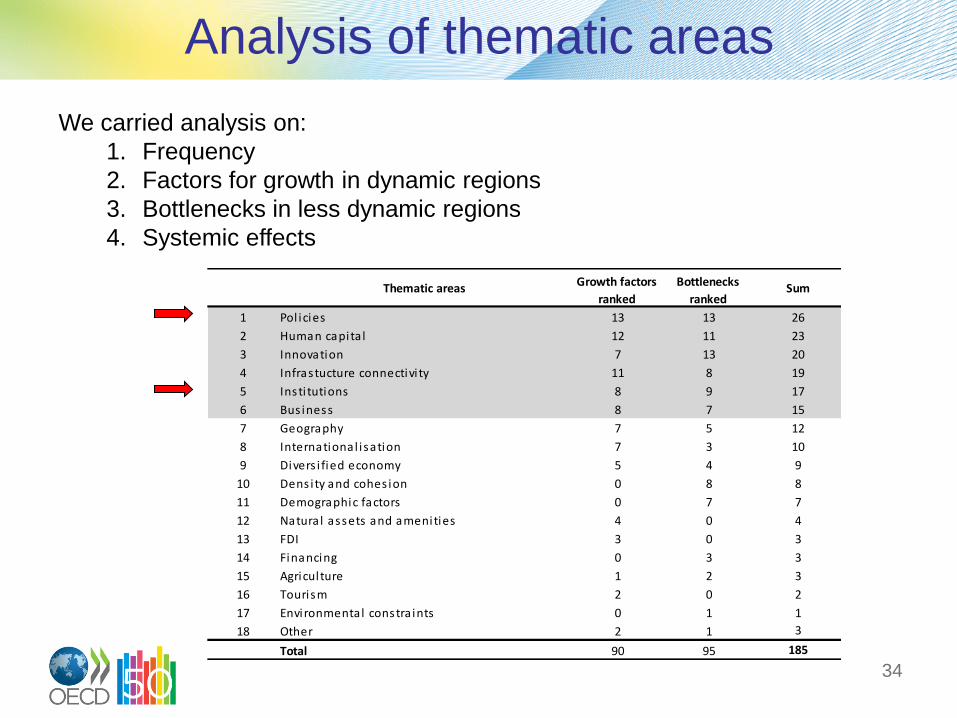
Analysis of thematic areas
We carried analysis on:
1. Frequency
2. Factors for growth in dynamic regions
3. Bottlenecks in less dynamic regions
4. Systemic effects
1 Pol icies 13 13 26
2 Human capita l 12 11 23
3 Innovation 7 13 20
4 Infrastucture connectivi ty 11 8 19
5 Insti tutions 8 9 17
6 Bus iness 8 7 15
7 Geography 7 5 12
8 International isation 7 3 10
9 Divers i fied economy 5 4 9
10 Dens ity and cohes ion 0 8 8
11 Demographic factors 0 7 7
12 Natura l assets and amenities 4 0 4
13 FDI 3 0 3
14 Financing 0 3 3
15 Agriculture 1 2 3
16 Tourism 2 0 2
17 Environmental constra ints 0 1 1
18 Other 2 1 3
Total 90 95 185
Thematic areasBottlenecks
rankedSum
Growth factors
ranked

Factors for Growth Among Regions Growing Above Average
“Growing” Regions
35
Factors for growth in regions growing above average Frequency %
Policies (shift mentality, silos, fragmentation, adjusting policies to assets, linkages, cross border, urban spatial) 8 15%
Infrastucture connectivity 8 15%
Institutions (governance, leadership capacity, continuity, mobilisation) 6 12%
Human capital 6 12%
Innovation, includes entrepreneurial 5 10%
Business environment, public sector activity and industry 5 10%
Geography 4 8%
Internationalisation: international competition and brandname attractiveness 3 6%
Presence of natural assets and amenities 2 4%
FDI 2 4%
Economy (diversified, differentiated and market aware) 1 2%
Other 1 2%
Tourism 1 2%
Density (cohesion, internal fragmentation, labour market mismatch) 0 0%
Demographic factors 0 0%
Agriculture 0 0%
Environmental constraints 0 0%
Availabity of financing 0 0%
Total 52 100%

Growth Factors in Dynamic Regions
• Policies
– Adopting the new paradigm for regional policy
– Polices that improving linkages among firms and universities, and cross-border
– Policies targeting urban regeneration
36
Asturias, Brandenburg, Sachsen-Anhalt and Zuid Nederland – have benefitted from a
shift in mentality and policies away from propping them up through subsidies and
towards growing them based on nurturing their existing potential.
San Luis Potosi improved linkages between firms and universities while Durango
benefited from cross-regional linkages with a neighbouring region Coahuila one of the
most dynamic regions in the entire country, bringing important growth to its core sectors.
Urban development/regeneration and spatial planning have been important
drivers in Aquitaine and Jalisco

Growth Factors in Dynamic Regions
• Infrastructure and connectivity:
– Infrastructure investments which improve internal transport infrastructure
– Connect relatively closed and isolated regions to external markets:
– Ensures transport infrastructure capitalises on privileged geographic positions.
37
Modernising transportation networks in Brandenburg, Sachsen-Anhalt and Central
Transdanubia has improved internal transport and external connectivity
Infrastructure improvements have connected relatively remote regions to external
markets in Asturias and to EU markets in Wielkopolskie
Transport infrastructure capitalised on the privileged geographic positions of
Jalisco, Durango and Central Transdanubia and investments in infrastructure helped
consolidate an important logistics hub in San Luis Potosi.

Growth Factors in Dynamic Regions
• Institutions (governance, leadership, capacity, continuity and mobilisation)
– Negotiation and dialogue
– Institutional arrangements supporting economic development,
– Enhancing regional actors a common voice and strong position,
– Active role
38
Negotiation and dialogue were important for mobilising key actors in Asturias and
Jalisco and Zuid Nederland
Building local institutional capacity and guiding the regional development processes
was important in Wielkopolskie.
A common voice and strong position is an asset for communicating with the central
government and can be created by close links between the private, public and
education sectors (e.g. Zuid Nederland).
Active role by key local public and private actors focusing on innovation and
workforce development/retention in March

Growth Factors in Dynamic Regions
• Innovation can be successfully promoted by
– Strong open innovation supply chains,
– Encouraging entrepreneurial activities
– Innovation clusters
.
39
Zuid Nederland benefitted from strong open innovation value chains and a strong
involvement of the private sector.
The region’s entrepreneurial tradition was a growth factor in Marche, combined with
its ability to turn around traditional sectors through innovation-intensive initiatives
Aquitaine has benefitted from the strong research capacity amongst its great
diversity of labs involved in advanced and leading edge technologies, as well as the
presence of higher educational institutions.
Innovation intensity driven by steady growth of the aerospace cluster and active
innovation policy has helped to stimulate growth in the Midi Pyrénées

Growth Factors in Dynamic Regions
• Human capital
– Strengthening tertiary education and technical skills,
– Matching human capital to market needs
– Offering vocational training
40
Adequate and continued supply of skilled workers was a critical element for development
in Brandenburg; in Asturias a key for success has been reducing the share of low skilled
workers by training programmes targeting for young kids in schools and ensuring they
continue with education, technical students and vocational training programmes
The San Luis Potosi region enjoys an abundant labour force with sufficient technical skills in
the surging sectors, Durango benefited from building the capacity of human capital and
vocational training.
Tertiary education improvements brought a very high research potential to the Midi-
Pyrénées region.
Asturias improved communication between the private sector and education centres
allowing human capital to gradually respond more to the demands of the market.
Establishing a number of higher education and research institutions with close links to the
main clusters in the region allowed Jalisco to transform its economy to one based on higher
value-added goods.

Growth Factors in Dynamic Regions
• Finally, business and industry are also of key importance,
– Presence of a business- friendly environment,
– Presence and involvement by the business sector in the development strategy
41
A strong presence by industry and related activities was a factor in Sachsen-Anhalt,
A favourable regulatory environment and policies supporting private sector activities were
beneficial in San Luis Potosi and Wielkopolskie.
Strong involvement of the private sector in manufacturing helped grow Marche.
Strong involvement by the business sector, combined with a strong work ethic, have been
important in Central Transdanubia.

Bottlenecks in Regions Growing Below Average
“Underperforming Regions”
42
bottlenecks in regions growing below average frequency in %
Institutions (governance, leadership capacity, continuity, mobilisation) 8 15%
Policies (shift mentality, silos, fragmentation, adjusting policies to assets, linkages, cross border, urban spatial) 7 13%
Density (cohesion, internal fragmentation, labour market mismatch) 7 13%
Human capital 6 12%
Geography 5 10%
Infrastucture connectivity 4 8%
Business environment, public sector activity and industry 3 6%
Demographic factors 3 6%
Innovation, includes entrepreneurial 2 4%
Agriculture 2 4%
Economy (diversified, differentiated and market aware) 1 2%
Other 1 2%
Environmental constraints 1 2%
Internationalisation: international competition and brandname attractiveness 0 0%
Presence of natural assets and amenities 0 0%
FDI 0 0%
Tourism 0 0%
Availabity of financing 0 0%
total 50 100%

Bottlenecks in Less Dynamic Regions
• The most common institutional bottlenecks include
– Poor mobilisation of stakeholders,
– Lack of continuity and coherence in policy implementation by institution, instability
– Lack of a common and strategic vision low capacity and gaps in multilevel
governance
43
Poor continuity in governance and in policy design, caused by institutional instability, has
also affected the North East Tyne and Wear.
Poor mobilisation of all key stakeholders towards pro-growth policies is a problem in
Yorkshire and Humberside, Leeds and the North East Tyne and Wear.
Sicilia suffers from a lack of political vision to change traditional, entrenched interests
vested in the status quo, weak institutional capacity, organisational efficiency and use of
human capital and an inability to define and apply performance-based indicators.
Too many programmes that are too thinly spread affect North West Manchester.
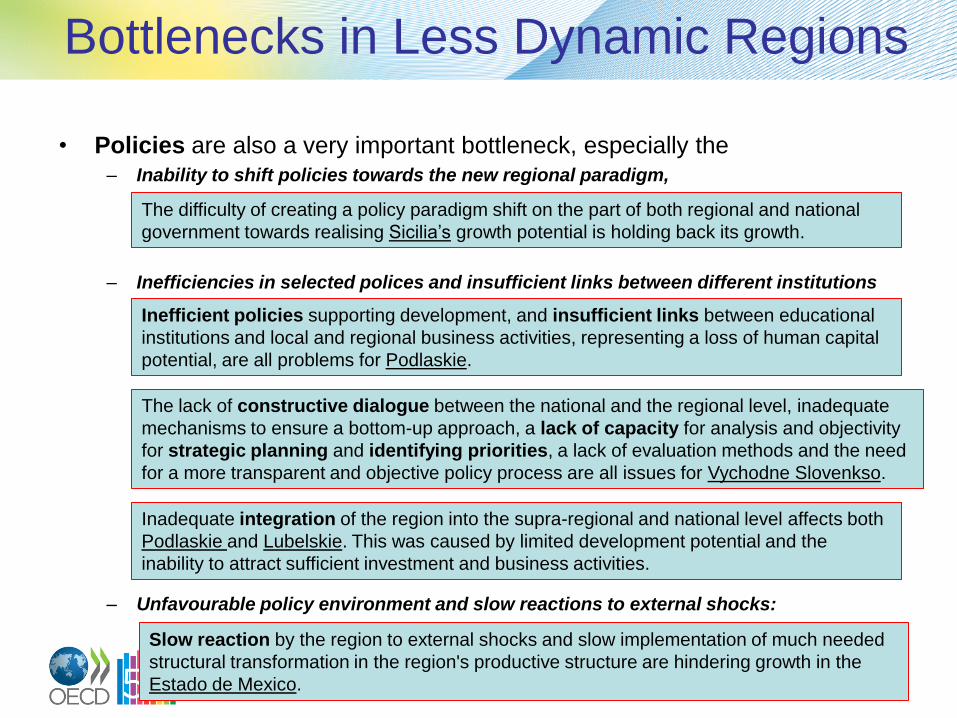
Bottlenecks in Less Dynamic Regions
• Policies are also a very important bottleneck, especially the – Inability to shift policies towards the new regional paradigm,
– Inefficiencies in selected polices and insufficient links between different institutions
– Unfavourable policy environment and slow reactions to external shocks:
44
The difficulty of creating a policy paradigm shift on the part of both regional and national
government towards realising Sicilia’s growth potential is holding back its growth.
Slow reaction by the region to external shocks and slow implementation of much needed
structural transformation in the region's productive structure are hindering growth in the
Estado de Mexico.
The lack of constructive dialogue between the national and the regional level, inadequate
mechanisms to ensure a bottom-up approach, a lack of capacity for analysis and objectivity
for strategic planning and identifying priorities, a lack of evaluation methods and the need
for a more transparent and objective policy process are all issues for Vychodne Slovenkso.
Inefficient policies supporting development, and insufficient links between educational
institutions and local and regional business activities, representing a loss of human capital
potential, are all problems for Podlaskie.
Inadequate integration of the region into the supra-regional and national level affects both
Podlaskie and Lubelskie. This was caused by limited development potential and the
inability to attract sufficient investment and business activities.

Bottlenecks in Less Dynamic Regions
• Internal fragmentation and labour market mismatch
– Low participation of women in the workforce,
– Mismatch of skills between demand and supply,
– Fragmented labour market
– Insufficient critical mass to generate agglomeration and spillover effects
45
There is low participation of women in the workforce in Zacatecas.
North West/Manchester has a mismatch in skills between demand and supply.
A fragmented labour market due to poor connectivity within the functional city region is a
stumbling block for North West/Manchester and Yorkshire and Humberside/Leeds.
Insufficient critical mass to generate agglomeration and spillover effects due to
fragmented internal markets and insufficient strong internal connections affect North
East/Tyne and Wear, Chiapas and Podlaskie.

Complementarities and Synergies
• Simultaneous improvement in policies, infrastructure and human capital,
suggesting strong synergies and avoidance of brain-drain effects.
• Simultaneous improvement in infrastructure, the business environment and
geographic factors , thus avoiding leaking-by-linking effects.
• Simultaneous improvement in institutions and in innovation related activities.
46

Commonly-Linked Bottlenecks
• Inadequate policies and lack of infrastructure and connectivity.
• Inadequate institutions and labour market fragmentation
47

Conclusion
• Polices to foster growth in less developed regions makes good
economic sense
– Benefits national performance, strengthens resilience and equity
• Mix of top down and bottom up approach is needed
– Importance of strengthening bottom up element
– Different regions have different needs – exploratory bottom up learning process
• Integrated approach is critical
– Avoids unintended consequences of sectoral approach
– Institutional factors and policies are key with endogenous elements
• Factors for growth vary by type of regions
– Infrastructure gains are critical for regions with a catching up potential
– Innovation is key for advanced regions
48
